Electronic copy available at: http://ssrn.com/abstract=1215962 social ties and earnings management Byoung-Hyoun Hwang and Seoyoung Kim * February 6, 2012 Abstract We detect a significant presence of social ties between the CEO and audit committee mem- bers and our results suggest that these informal ties play a material role in audit-committee oversight. In particular, we find a substantially stronger, positive relation between abnormal (i.e., discretionary) accruals and the extent of an audit committee’s connection to the CEO when we consider social ties in addition to the conventional ties. Moreover, we find that an audit committee’s social affiliation is associated with an increased discontinuity in the earnings distribution surrounding earnings targets. Together, our findings suggest that informal ties play a material role in facilitating creative accounting practices. JEL Classification: M4, G3 Keywords: Audit Committee, Social Ties, Earnings Management * Krannert School of Management, Purdue University, 403 West State Street, West Lafayette, IN, 47907, bh- [email protected] and [email protected]. We thank Jan Barton, David Denis, Lauren Cohen, Steven J. Kachelmeier, George Nagel, Grace Pownall, and the brown-bag and seminar participants at Emory University, Indiana University, Purdue University, Santa Clara University, and University of Florida for very helpful comments. All errors are own own.
Transcript
Electronic copy available at: http://ssrn.com/abstract=1215962
social ties and earnings management
Byoung-Hyoun Hwang and Seoyoung Kim∗
February 6, 2012
Abstract
We detect a significant presence of social ties between the CEO and audit committee mem-bers and our results suggest that these informal ties play a material role in audit-committeeoversight. In particular, we find a substantially stronger, positive relation between abnormal(i.e., discretionary) accruals and the extent of an audit committee’s connection to the CEOwhen we consider social ties in addition to the conventional ties. Moreover, we find that anaudit committee’s social affiliation is associated with an increased discontinuity in the earningsdistribution surrounding earnings targets. Together, our findings suggest that informal ties playa material role in facilitating creative accounting practices.
JEL Classification: M4, G3Keywords: Audit Committee, Social Ties, Earnings Management
∗Krannert School of Management, Purdue University, 403 West State Street, West Lafayette, IN, 47907, [email protected] and [email protected]. We thank Jan Barton, David Denis, Lauren Cohen, Steven J. Kachelmeier,George Nagel, Grace Pownall, and the brown-bag and seminar participants at Emory University, Indiana University,Purdue University, Santa Clara University, and University of Florida for very helpful comments. All errors are ownown.
Electronic copy available at: http://ssrn.com/abstract=1215962
1 Introduction
Audit committees play a crucial role in overseeing the integrity of a firm’s financial statements(Levitt (2000)). At the heart of its execution is whether the committee is composed of directorswho are independent-minded with respect to the CEO. The 1999 amendments to the NYSE andNASDAQ listing standards specify that audit committees be composed entirely of independent di-rectors, and the Sarbanes-Oxley Act of 2002 solidifies this mandate.1 Moreover, empirical evidencesupports the regulatory changes’ underlying assertion that independent directors enhance the fi-nancial reporting system (e.g., Carcello and Neal (2000); Klein (2002); Carcello and Neal (2003);Krishnan (2005)). However, the question remains as to what constitutes an independent-mindeddirector.
The Investor Responsibility Research Center (IRRC) classifies board members as independent ifthey have neither financial nor familial ties to the firm/CEO, and current listing standards specifysimilar restrictions for what constitutes (or disallows) director independence. Absent from theseguidelines, however, are social ties (i.e., the non-familial, informal ties), which play a significantrole in setting the normative expectations governing group dynamics (Mills and Clark (1982); Uzzi(1996)). Our purpose is to examine the role of social ties in audit committees’ execution of oversightresponsibilities and in the practice of earnings management, in particular.
Using hand-collected data, we focus on a sample of 954 firm-years consisting of publicly tradedFortune 100 firms from 1996 to 2005, and drawing from the economics and sociology literatures,we employ mutual alma mater, military service, regional origin, academic discipline, and industry(as well as third-party connections based on these ties) as indications of an informal tie between adirector and the CEO. Whether it is conscious or not, these shared characteristics and experiencesease communication and facilitate mutual understanding, thereby fostering personal connections(Marsden (1987); McPherson et al. (2001); Reed (2003); Crosse et al. (2004); Friedman (2005)).The popular press has broached this issue, saying that shared characteristics and experiences withthe CEO have the potential to sway a director’s judgment (New York Times, 2005).
We observe a significant presence of these shared qualities between audit-committee membersand the CEO. On average, each committee member has roughly 0.6 social ties to the CEO comparedto 0.1 conventional ties, and our results suggest that these informal ties play a material role infacilitating creative accounting practices. We find a substantially stronger, positive relation betweenabnormal (i.e., discretionary) accruals and the extent of an audit committee’s connection to the CEOwhen we consider social ties in addition to the conventional ties. Moreover, we find that an auditcommittee’s social affiliation is associated with an increased discontinuity in the earnings distributionsurrounding earnings targets, lending support to the earnings-management interpretation of thegreater abnormal accruals attributed to social ties.
We also examine instances with specific upward or downward managing incentives, such as1The 1999 amendments allowed each firm some discretion in ultimately determining the independence of a potential
committee member. Sarbanes Oxley dampened this loophole by granting the SEC (and not the firm’s board) thediscretion to overrule independence criteria on a case-by-case basis. See Klein (2003) for details.
1
when the CEO sells a large quantity of shares or when a new CEO enters office, and we find thatsocial ties between the audit committee and CEO contribute to even more positive (or even morenegative) abnormal accruals in these cases. Moreover, when extending our analysis to earningsrestatements, we observe that firms with socially affiliated audit committees are less likely to self-prompt a correction (i.e., less likely to turn themselves in).
Our final analysis considers some of the economic byproducts of regulation. The Sarbanes-Oxley Act of 2002 imposed stricter independence criteria on audit committees, resulting in a generaldecrease in audit committees’ conventional affiliation to the CEO. However, of the firms whose auditcommittees lost conventionally affiliated members, 24% appointed socially affiliated replacements,raising questions about the increasing significance of these informal connections as an alternateunregulated method by which CEOs capture the financial reporting process. Consistent with thissupposition, we observe that while firms generally manage earnings less in the post Sarbanes-Oxleyperiod (Cohen et al. (2008a)), these particular firms do not.
Overall, the evidence we present is consistent with the idea that mutual qualities foster relation-ship building and that social ties affect the audit committee’s execution of oversight responsibilities.As such, our paper pertains to the discussion surrounding the economic consequences of regulation(e.g., Cohen et al. (2008a); Li et al. (2008)) as well as to the vast academic literature studying thelink between corporate governance and accounting (e.g., Carcello and Neal (2000); Klein (2002);Carcello and Neal (2003)). This paper also adds to the growing literature exploring the economicimplications of social ties between executives and directors (e.g., Hwang and Kim (2009); Schmidt(2009)), and to studies exploring the effects of social ties on interpersonal actions, including: Cohenet al. (2008b, 2010) who provide evidence that mutual-fund managers and sell-side equity analystsenjoy an informational advantage via their social-network connections with executives and directors;Kuhnen (2009), who finds that mutual fund directors and managers hire each other preferentiallybased on the intensity of their past network connections; and Butler and Gurun (2011), who findthat executives enjoy higher compensation when their firms are traded by portfolio managers towhom they (the firm’s executives) are socially connected. We contribute to this literature by pro-viding evidence on how social ties affect the financial reporting process and how they may be usedto circumvent explicit independence requirements.
This paper is organized as follows. In Section 2, we discuss the significance and measurement ofsocial ties. In Section 3, we describe our data sources, variables, and summary statistics. In Section4, we examine the role of social ties in the level of earnings management. In Section 5, we conclude.
2 Motivation, Identification, and Hypotheses
2.1 Social Ties and Earnings Management
Amid self-serving managers and conflicting financial incentives, audit committees are charged withoverseeing the integrity of the financial-reporting process. Given the crucial role they play, a largebody of work has examined factors affecting an audit committee’s ability to effectively perform its
2
duties. In particular, studies have focused on the premise that independent directors are better-suited for this role, providing empirical support for the assertion that affiliated audit committeesreduce the quality of the financial reporting system.
For instance, firms experiencing financial distress are less likely to receive a going-concern report(Carcello and Neal (2000)) when audit-committee members are financially affiliated with the firm,and likewise, auditors who issue going-concern reports are afforded less protection from dismissal(Carcello and Neal (2003)). Studies also suggest that earnings-management activity is greater(Klein (2002)) and internal control problems are worse (Krishnan (2005)) when audit committees arefinancially affiliated. Although these studies provide support for the desirability of an independentaudit committee, the question remains as to how to capture the broad notion of independent-mindedness, since many factors likely affect a committee member’s objectivity in overseeing thefinancial-reporting process.
Traditionally, a director’s independent-mindedness, or lack thereof, has been defined by thepresence of financial or familial ties between the director and CEO. However, a growing body of workhas argued the importance of social ties to the normative expectations guiding interpersonal actions.Specifically, social ties foster favorable interpretations of one another (Uzzi (1996)) and effect a shiftfrom dispassionate reciprocation to mutual caring and trust (Mills and Clark (1982); Silver (1990)).For example, Uzzi (1996) observes that when buyers and manufacturers share social ties, buyers aremore likely to accept fabric mistakes rather than refuse the material at the manufacturer’s cost; Uzzi(1999) finds that social ties between middle market firms and their lenders affect “both who getscredit and what that credit costs”; Ingram and Roberts (2000) find that there is greater collaboration,greater information exchange, and less “aggressive competitive behavior” among competing hotelmanagers who share social ties; and Westphal et al. (2006) provide evidence that managementform social ties with managers of other firms “in order to manage uncertainty arising from resourcedependence”.
Extending this framework to corporate-board functions, studies have begun to explore howsocial-ties affect director-CEO dyamics.2 Ex ante, it is unclear whether social ties should facilitateor impede monitoring effectiveness. On one hand, greater access to information could allow directorsto better monitor the financial-reporting process, and studies have provided both theoretical andempirical support for the idea that social ties between directors and CEOs lead to greater informationsharing. For instance, Westphal (1999) provides evidence that social ties between directors andCEOs increases the number of interactions and discussions concerning strategic issues, Adams andFerreira (2007) present a model in which friendlier boards are more effective in advisory functions,and Schmidt (2009) provides evidence that social ties between directors and CEOs contribute tobetter acquisition decisions when advisory needs are high.
On the other hand, although socially-affiliated directors enjoy greater access to information,their personal attachment may cause them to use this information only to help the CEO but not to
2In contrast to the studies exploring the implications of social ties between CEOs and their directors, there arealso studies examining how a firm is affected by the extent of its executives’ network connections with others outsideof the firm in question (e.g., Engelberg et al. (2009); Ishii and Xuan (2010)).
3
hurt him (which may be exactly why they enjoy greater access to information in the first place). Forinstance, Westphal (1999) finds that social ties between directors and CEOs negatively associatewith the board’s willingness to monitor and discipline the CEO. Other studies providing evidencethat social ties contribute to a decline in monitoring effectiveness include: Schmidt (2009), who findsthat socially affiliated directors are associated with poorer acquisition decisions when monitoringneeds are high; Hwang and Kim (2009), who provide evidence that socially affiliated directorslead to higher levels of total compensation, lower pay-performance sensitivity, and lower turnover-performance sensitivity for CEOs; and Fracassi and Tate (2011), who argue that firms with moreCEO-director ties engage in more value-destroying acquisitions.
Together, we project that it is not only the conventional (i.e., financial and familial) ties but alsothe social ties that affect an audit committee’s ability to remain at arm’s length, thereby providingthe CEO more latitude in managing earnings.
2.2 Measurement/Identification of Social Ties
In this study, we operationalize social ties through shared qualities and experiences.3 Directorsand audit committee members naturally interact and establish contact with the CEO. However,we anticipate the level of interaction and the resulting relationship strength with the CEO to beparticularly strong for directors and audit committee members who share background similaritieswith the CEO. Actors enjoy comfort and mutual understanding with similar others, making com-munication both more likely and more effective (e.g, Rogers and Bhowmik (1970); Marsden (1987);Kalmijn and Flap (2001); McPherson et al. (2001)). Put bluntly, if five random people are placed ina group, those with more similar backgrounds will develop stronger ties (with each other) than thosethat do not share similar backgrounds/experiences. The homophily principle has been detected inmany different settings and has been found to apply to similarities in even very broad categories,supporting its generality as a description of human nature (Wexley and Nemeroff (1973); Rand andWexley (1975); Porac et al. (1989, 1999); Westphal and Milton (2000); Reed (2003)).
We follow Hwang and Kim (2009) in employing the following specific measures:Alma Mater. University alumni enjoy enhanced interaction via shared traditions and in-jokes,
and the college sports events, alumni networks, donations, and newsletters solidify their sense ofgroup belonging. In our classification scheme, we require that the director and CEO be no morethan three years apart in age, since an overlapping period of attendance starkly increases similaritiesin experiences.
Military Service. Connections forged between veterans are facilitated through unique sharedexperiences and a pronounced sense of group identity. Military service is marked by an environment
3An alternative approach is to directly survey CEOs and directors about their relationships. In comparison, ourapproach has the advantage of allowing for the conscious as well as the subconscious personal connections betweendirectors and their CEOs; it also accounts for the higher regard that actors have for similar others, which goeshand in hand with the increased kinship with those sharing similar characteristics. Moreover, mutual qualities andexperiences, such as alma mater and past military experience, have the appealing feature of being systematicallyavailable and relatively easy to identify.
4
“that depends on a highly structured, organized force” and there is “a demand not paralleled in anyother work environment”, contributing to a steadfast bond among veterans (Crosse et al. (2004);Friedman (2005)).
Academic Discipline and Industry. Mutual industry and academic discipline provide furtherbasis for social contact. There is considerable evidence that industry characteristics influence or-ganizational culture (Chatman and Jehn (1994); Gordon (1991)), thereby providing a basis foridentifying with others from the same industry (Porac et al. (1989, 1999); Westphal and Milton(2000)). Likewise, academic discipline denotes similar outlooks and experiences that provide a nat-ural categorization along which to relate to others (Hambrick and Mason (1984); Tsui et al. (1992)).To determine mutual industry and discipline, we partition industries of primary employment usingthe Fama and French (1997) 49-industry classification, and we partition academic majors into 26categories using the US News Rankings report.4
Regional Origin. Empirically, there is a regional clustering of dialect, beliefs, culture, andlifestyle that typify regions within the US (Marsden et al. (1982); Clack (2003)) and contribute toan affinity for others from the same locale. For example, the regional homogeneity in the socialchoices of college students exceeds what is expected if social circles are formed randomly withrespect to regional origin (Reed (2003)). We define regional origin as the US region (or non-UScountry) of birth, because unlike the more abstract concept of home, birthplace is clearly definedand systematically available. Moreover, from 1995 to 2000, only 4.6% of nationals changed theirregion of residency (U.S. Census Bureau, 2003), indicating that birthplace is strongly associatedwith this vaguer notion of home. In accordance with the theoretical and empirical groundworkon regional identity and homophily, we focus on broader regional categories, and we cluster USstates and territories into the following regions: South, Northeast, Midwest, Mountain, Pacific, andTerritories. Nonetheless, in additional analyses, we explore the implications of using finer regionalclassifications.
Third Party. A mutual third-party connection enhances a bond by strengthening shared norma-tive expectations (Granovetter (2005)) and facilitating further contact. In determining third-partyconnections, we follow Hwang and Kim (2009) and allow a director and CEO to be connected viaa third party to whom each shares at least two, direct ties (i.e., friend of a friend). For example,suppose that the CEO is a military veteran born in the Midwest, and director A is a 55-year-old,Berkeley-educated, electrical-engineering major born in the South. Although director A is not (di-rectly) connected to the CEO, if there is a third-party director B who is 57 years old, graduatedfrom UC Berkeley (where he studied electrical engineering), served in the military, and was born inthe Midwest, then director A shares a third-party tie with the CEO.
4The 26 categories are: Business, Law, Medicine, Engineering, Education, Biological Sciences, Chemistry, Com-puter Science, Earth Sciences, Mathematics, Physics, Library & Information Studies, Criminology, Economics, En-glish, History, Political Science, Psychology, Sociology, Health, Public Affairs, Fine Arts, Theology*, Agriculture*,Foreign Languages*, Journalism*. Areas denoted by * are not part of the US News Rankings and were added byHwang and Kim (2009).
5
3 Data Description
In this section, we describe our data sources, we define and discuss our regression variables, and wepresent summary statistics.
3.1 Sources
Our sample consists of the publicly traded Fortune 100 firms as declared in 1996 and 2005,5 andspans the period from 1996 to 2005. To be included in our analysis, firms must have data to com-pute our earnings management measure, which we introduce in Section 3.2.1. This requirementyields 1,049 firm-year observations. We obtain data on our sample firms’ CEOs and directors/auditcommittee members from the Compustat Executive Compensation database and the RiskMetrics(ISS) Directors database, respectively. Although the RiskMetrics Directors database begins in 1996,information on audit-committee memberships is not available until 1998. Thus, we collect audit-committee memberships from annual proxy statements for the years 1996 and 1997. Imposing theadditional requirement that the firm be covered by the Compustat Executive Compensation andRiskMetrics Directors databases decreases the sample to 956 firm-year observations. We obtainfinancial-statement, stock-price, analyst-forecast and antitakeover-provision data from the Compus-tat, CRSP, IBES, and RiskMetrics Governance databases, respectively. The antitakeover-provisiondata requirement brings our final sample to 954 firm-years (covering 122 firms, 225 CEOs and 1896directors, of which 974 serve as audit-committee members at some point during our sample period).
We hand-collect data on each CEO’s and director’s alma mater, academic discipline, militaryservice, and regional origin from the Marquis Who’s Who database. To determine each director’sindustry of employment, we first exploit the ‘Primary Employment’ field provided by the RiskMetrics(ISS) Directors database. For the remaining director-years with a blank ‘Primary Employment’ field,we collect this information from the Marquis Who’s Who and NNDB databases. Next, we matcheach of these firms to an SIC code (we create a separate category for retired directors), and we use theFama and French (1997) 49-industry classification to define industry ties. For publicly-traded firms,we obtain the corresponding SIC code through CRSP, and for the remaining firms, we determineSIC codes using a combination of the Manta, Websters Online, Goliath, Alacra Store, AmericanHospital Directory, Law Firm Directory, Martindale-Hubbell, and HG.org databases. Furthermore,we collect CEO-award information from the Business Week archives, and we collect information onfamily-run firms from a combination of Family Business, proxy disclosures, the Compustat ExecutiveCompensation database, the RiskMetrics (ISS) Directors database, and the Blockholders database.
5Our results are robust in the subsample of Fortune 100 firms as declared in 1996 as well as in the subsample ofFortune 100 firms as declared in 2005.
6
3.2 Regression Variables
3.2.1 Earnings Management
To test for earnings management, we begin by examining firms’ discretionary accruals, which weestimate using a cross-sectional variant of the Jones (1991) model (other studies following thisapproach include Xie (2001); Klein (2002); Kothari et al. (2005); Yu (2008)). We begin with totalaccruals, calculated as the difference between net income and net cash flow,6 and we truncate atthe 99th percentile of absolute total accruals to remove outliers which have the leverage to re-fit our discretionary accruals model below. Under accrual accounting, earnings naturally deviatefrom actual cash flows even in absence of any active earnings management attempts (e.g., revenue isrecorded when it is earned as opposed to when cash is received). Thus, to remove accrual componentsthat are not subject to accounting discretion (i.e., non-discretionary accruals), we form industry-year clusters of all COMPUSTAT firms using two-digit SIC codes. Then, for each industry-yearcluster (j, t) with at least eight firms, we estimate the following firm-level regression for all firms iin industry j in year t :7
ACCRi,j,t
TAi,j,t−1= α0,j,t + α1,j,t
(1
TAi,j,t−1
)+ βj,t
(∆REVi,j,t
TAi,j,t−1
)+γj,t
(PPEi,j,t
TAi,j,t−1
)+ εi,j,t
, (1)
in which ACCR represents total accruals (i.e., net income minus net cash flow), TA representstotal assets, ∆REV is the change in net sales, and PPE is gross property, plant and equipment.Using the coefficient estimates from equation (1) and adjusting changes in revenues by changes inaccounts receivables to account for the discretion allowed in realizing sales on credit (e.g., Dechowet al. (1995)), we calculate the non-discretionary accrual component:
NACi,j,t = α̂0,j,t + α̂1,j,t
(1
TAi,j,t−1
)+ β̂j,t
(∆REVi,j,t−∆ARi,j,t
TAi,j,t−1
)+γ̂j,t
(PPEi,j,t
TAi,j,t−1
) . (2)
Our estimator, then, for the abnormal (i.e., discretionary) accrual component is the differencebetween total accruals and non-discretionary accruals:
AACi,j,t =ACCRi,j,t
TAi,j,t−1−NACi,j,t. (3)
In our main analyses, we use the absolute value of abnormal accruals, because we are interested inthe extent of earnings-management activity itself, without regard to the direction in which earnings
6Specifically, we calculate total accruals as the difference between net income (before extraordinary items anddiscontinued operations) and net cash flow from operating activities, which we obtain from the Statement of CashFlows. We follow Hribar and Collins (2002) in calculating total accruals as the difference between earnings andnet cash flow to avoid increased noise and potential biases that could arise when backing out accruals indirectlythrough the balance-sheet approach, which uses changes in working capital accounts to imply the accrual componentof earnings.
7We follow Kothari et al. (2005) in including a constant in regression Eq. (1) to further mitigate heteroskedasticityissues.
7
are managed. That is, we are interested in realizations of positive abnormal accruals as well asnegative abnormal accruals, which may reflect the eventual unwinding of prior upward managingactivity or the active downward managing attempts to mask future poor performance. Moreover,our sample consists of a panel spanning a ten-year period, and earnings cannot be consistentlymanaged in a single direction. Other studies using unsigned discretionary accruals include Warfieldet al. (1995); Klein (2002); Bergstresser and Philippon (2006); Yu (2008). In additional analyses,we examine signed abnormal accruals surrounding several specific events (e.g., years in which theCEO sells a large quantity of shares) which provide clearer incentives and predictions with regardto either upward or downward managing attempts.
Our use of discretionary-accruals models to measure earnings-management activity is motivatedby a significant body of work providing evidence that they are helpful in capturing creative ac-counting practices (Dechow et al. (1995); Bartov et al. (2000)). At the same time, the literature(also) notes that discretionary-accruals estimates must be interpreted with extreme care. Later inSection 4.5.5, we discuss potential shortcomings surrounding discretionary-accruals as an indicatorof earnings management and our attempts to address these shortcomings. In complementary testsof earnings management, we also examine the likelihood of narrowly meeting as opposed to narrowlymissing earnings thresholds (Burgstahler and Dichev (1997); Healy and Wahlen (1999); Degeorgeet al. (1999); Yu (2008)).8
3.2.2 Audit-Committee Affiliation Index
To measure the extent of an audit committee’s partiality to the CEO, we calculate an affiliationindex, taking the total number of ties between all audit-committee members and the CEO, scaledby the total number of audit-committee members. Thus, the index captures the average number ofties (between the CEO and each committee member) contributing to a director’s sympathy for theCEO. For instance, if there are three committee members, each sharing one, two, and three ties,respectively, with the CEO, then the resulting affiliation index is (1+2+3) / 3 = 2. If there arethree committee members, each sharing one, zero, and zero ties, respectively, with the CEO, thenthe resulting affiliation index is (1+0+0) / 3 = 0.33.
We are interested in an index rather than each tie individually because it allows us a slidingscale to measure the extent of a director’s affiliation to the CEO, which is presumably greater themore similarities the two parties share (Marsden (1987); McPherson et al. (2001)). That is, havinga common regional origin and alma mater provides a stronger basis for connection than having onlya common regional origin. Later, we explore the fraction of committee members sharing at least nsocial ties with the CEO as an alternative measure of an audit committee’s social affiliation.
In constructing our index, we assume that all ties contribute equally to a director’s partiality to8One disadvantage to this approach is that it does not allow for firm-specific variation in the extent of earnings-
management activity. Nonetheless, this method does not require estimating discretionary accruals, and has the addedadvantage of being able to detect not only earnings management by creative accounting practices, but also earningsmanagement by real decisions (e.g., foregone maintenance or research and development) that may not be reflected inestimated abnormal accruals (Healy and Wahlen (1999)).
8
the CEO. Although a more sophisticated measure might reflect the relative importance of differentties, our equal-weighted measure has the advantage of being simple, transparent, and independentof subjective judgment.9
The audit committee’s affiliation is computed with respect to the CEO who is in office for themajority of that fiscal year. We observe similar results when we altogether omit the years of and/orimmediately surrounding CEO turnovers (i.e., when we omit the very last year of the predecessor’sand the very first year of the successor’s terms), as well as when we calcuate the affiliation indexbased on directors’ social connections to the CEO who is in office as of the end of the fiscal year.10
In our analyses, we compare two different indices: a conventional index, which considers only theconventional ties (as specified by the IRRC), and a conventional-and-social index, which considersboth conventional and social ties.
Conventional Index. The conventional index considers only the conventional ties (with a maxi-mum of eight ties per director), accruing points whenever a committee member is a current employee,a former employee, an employee of a recipient of charitable contributions, a customer of or supplierto the firm (or an employee thereof), a provider of professional services to the firm (or an employeethereof), a relative of an executive officer, part of an interlocking directorate (i.e., an executive atfirm X is a director at firm Y at the same time that an executive of firm Y is a director at firm X),or affiliated in some other manner.11
Social Index. The social index, an analogue of the conventional index, considers only the socialties (with a maximum of six ties per director), accruing points whenever a committee member andthe CEO both served in the military, graduated from the same university, were born in the same U.S.region (or the same non-U.S. country), have the same academic discipline, have the same industryof primary employment, or directly share a conventional tie or at least two of the aforementioned,possible ties with a common third party (this common third party is not limited to members of theaudit committee, and can be any member of the board).
Conventional-and-Social Index. The conventional-and-social index considers both conventionaland social ties (with a maximum of 14 ties per director).
3.2.3 Other Regression Variables
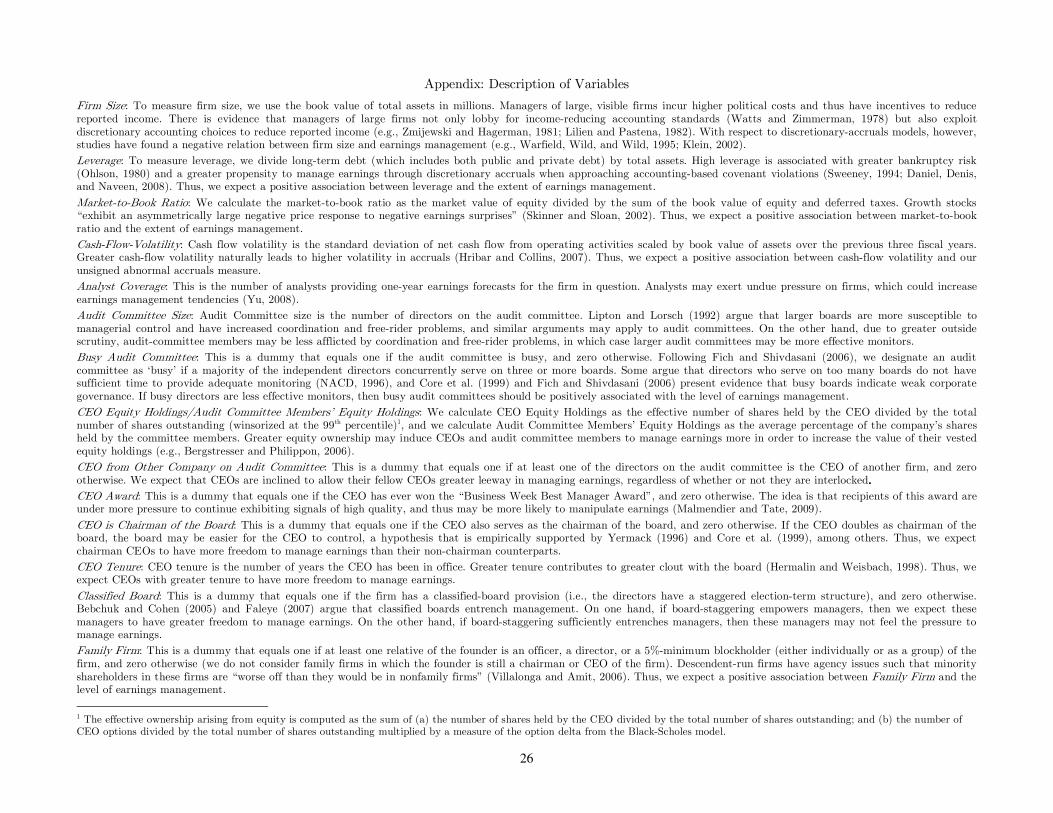
Motivated by prior research, we include the following control variables to account for various eco-nomic and governance factors that enhance (or temper) earnings-management tendencies: ln(TotalAssets), Long-Term Debt, ln(MB), Cash Flow Volatility, Analyst Coverage, ln(Audit CommitteeSize), Busy Audit Committee, Audit Committee Members’ Equity Holdings, CEO from Other Com-pany on Audit Committee, CEO Equity Holdings, CEO Award, CEO=Chairman, CEO Tenure,
9In untabulated analyses, we assess whether the direct ties and the indirect (i.e., third-party) connections con-tribute equally to a director’s ability to remain objective. We observe that our main findings become moderatelystronger when we omit third-party ties from our affiliation index, suggesting that, within our setting, third-party tiesintroduce more noise than meaningful variation.
10Results are available upon request.11The scope of this final catchall is limited to (voluntary) proxy disclosures.
9
Classified Board, and Family Firm. As in Klein (2002), we use lagged values of the market-to-bookratio, and we use contemporaneous values of the remaining economic determinants. Likewise, weuse contemporaneous values of all governance variables and indicators of the CEO’s value or power,since a CEO’s margin of freedom and his incentives to manage earnings are determined by theconcurrent governance structure and perceptions of the CEO’s value. We also include a time trend,Timet, as well as a post-SOX dummy, PostSOXt, to account for the upward trend in the use ofdiscretionary accruals prior to the enactment of Sarbanes-Oxley, and decline thereafter (Cohen et al.(2008a)). Please refer to the Appendix for a description of each variable and its predicted relationwith our earnings management measures.
3.3 CEO, Firm, and Audit-Committee Characteristics
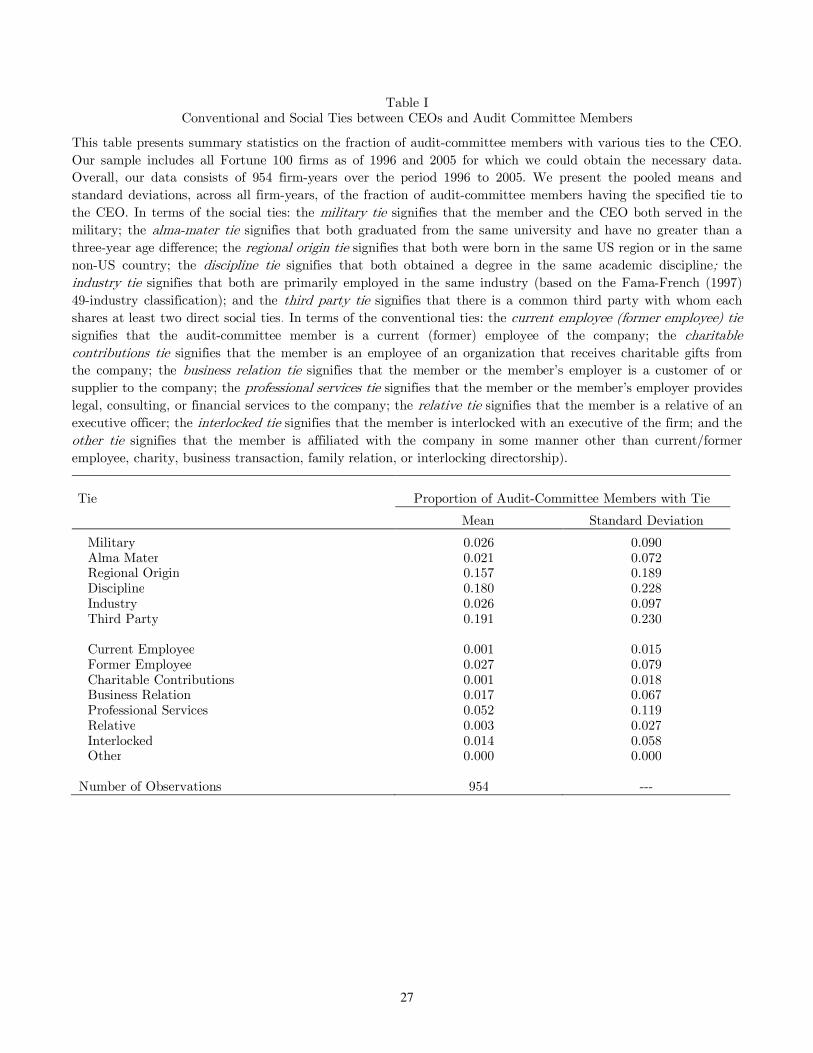
In Table I, we present summary statistics on the various conventional and social ties between audit-committee members and the CEO. In terms of our social-ties measures, 2.6% of committee membersshare a military tie with the CEO, 2.1% share a university tie, 15.7% share a regional-origin tie,18.0% share a discipline tie, 2.6% share an industry tie, and 19.1% share a third-party tie. In termsof our conventional measures, 0.1% of the committee members are current employees, 2.7% areformer employees, 0.1% are employees of an organization receiving charitable contributions, 1.7%are customers of or suppliers to the firm (or employees thereof), 5.2% are providers of professionalservices to the firm (or employees thereof), 0.3% are relatives of an executive officer, 1.4% areinvolved in an interlocking directorate, and none share some other form of (voluntarily disclosed)tie with the CEO.
In Table II, we present summary statistics of various audit-committee, board, CEO, and firmcharacteristics. Social ties to the CEO are much more prevalent among audit-committee membersthan conventional ties, with an average Social Index of 0.601 as opposed to an average ConventionalIndex of 0.115. That is, on average, each committee member has roughly 0.6 social ties and 0.1conventional ties to the CEO. Moreover, we observe a strong presence of social ties in a considerableportion of the audit committees in our sample; 25.3% have a Social Index greater than 1.0, and2.4% have a Social Index greater than 2.0 (untabulated).
4 Empirical Results
4.1 Abnormal Accruals
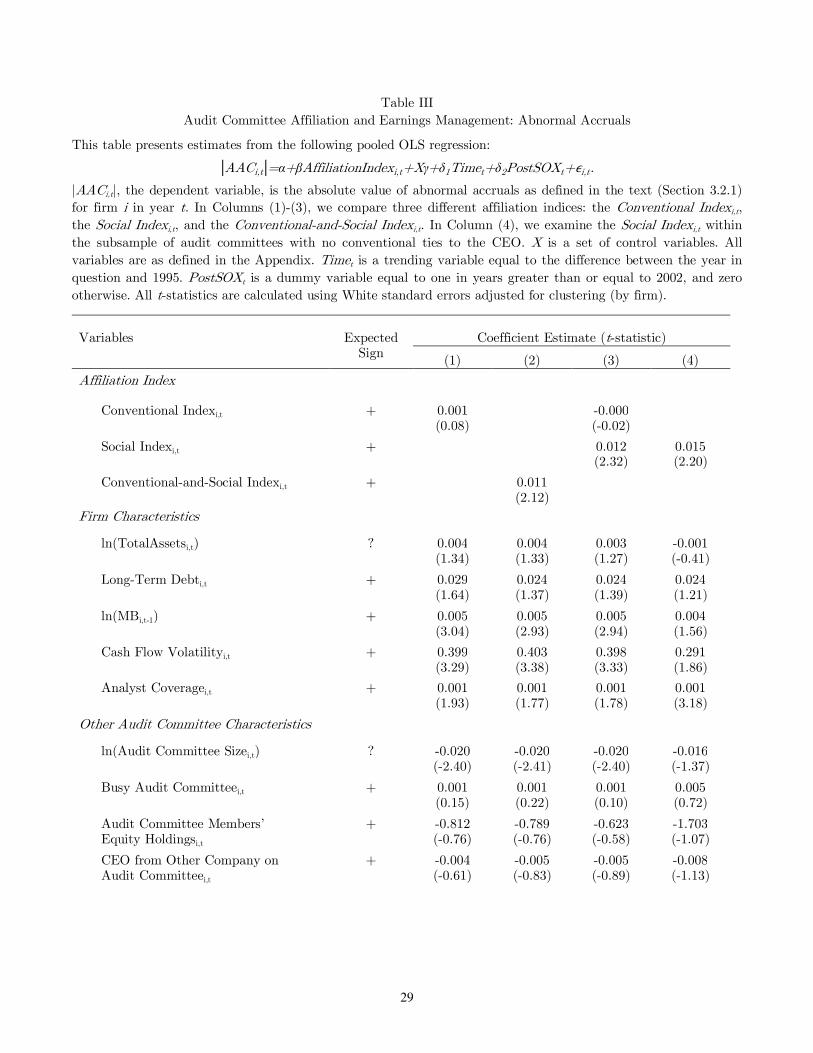
Our main hypothesis, stated in the null form, is that if the absolute value of abnormal accrualscontain zero information about creative accounting practices or if common backgrounds (between theaudit committee and the CEO) neither temper nor facilitate earnings-management tendencies, thenwe expect to observe no association between absolute abnormal accruals and common backgrounds.To test this hypothesis, we estimate the following pooled OLS regression:
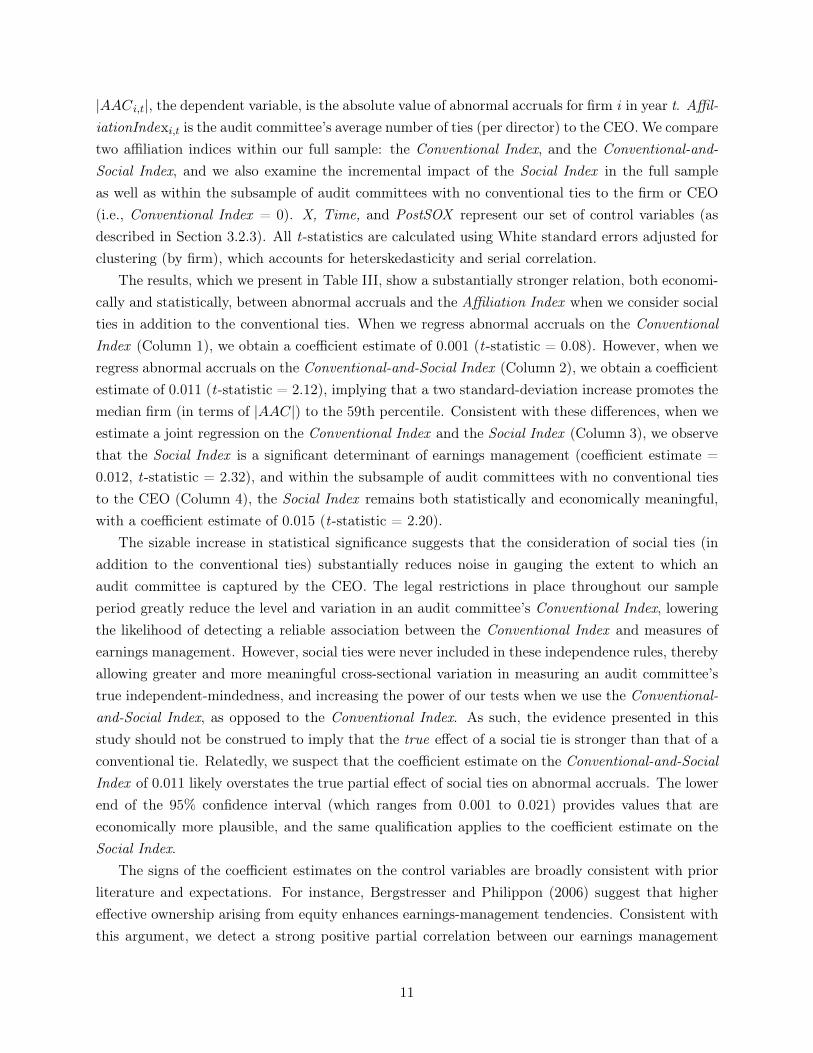
|AACi,t|, the dependent variable, is the absolute value of abnormal accruals for firm i in year t. Affil-iationIndexi,t is the audit committee’s average number of ties (per director) to the CEO. We comparetwo affiliation indices within our full sample: the Conventional Index, and the Conventional-and-Social Index, and we also examine the incremental impact of the Social Index in the full sampleas well as within the subsample of audit committees with no conventional ties to the firm or CEO(i.e., Conventional Index = 0). X, Time, and PostSOX represent our set of control variables (asdescribed in Section 3.2.3). All t-statistics are calculated using White standard errors adjusted forclustering (by firm), which accounts for heterskedasticity and serial correlation.
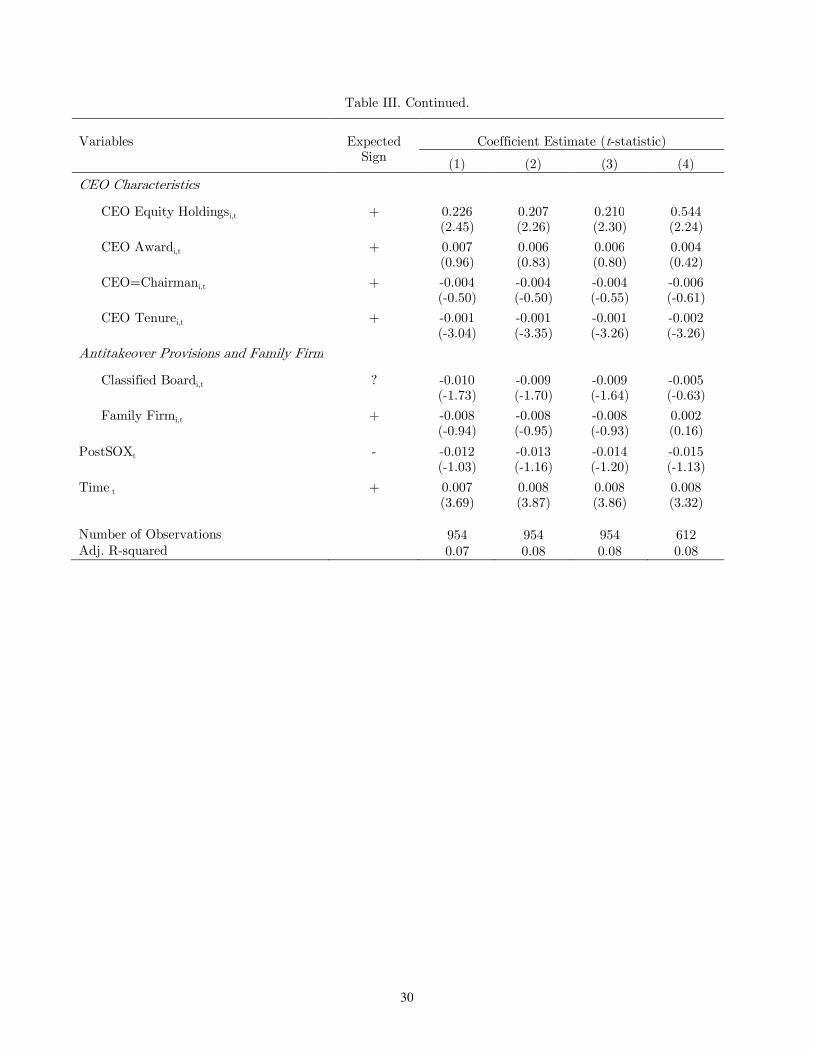
The results, which we present in Table III, show a substantially stronger relation, both economi-cally and statistically, between abnormal accruals and the Affiliation Index when we consider socialties in addition to the conventional ties. When we regress abnormal accruals on the ConventionalIndex (Column 1), we obtain a coefficient estimate of 0.001 (t-statistic = 0.08). However, when weregress abnormal accruals on the Conventional-and-Social Index (Column 2), we obtain a coefficientestimate of 0.011 (t-statistic = 2.12), implying that a two standard-deviation increase promotes themedian firm (in terms of |AAC|) to the 59th percentile. Consistent with these differences, when weestimate a joint regression on the Conventional Index and the Social Index (Column 3), we observethat the Social Index is a significant determinant of earnings management (coefficient estimate =0.012, t-statistic = 2.32), and within the subsample of audit committees with no conventional tiesto the CEO (Column 4), the Social Index remains both statistically and economically meaningful,with a coefficient estimate of 0.015 (t-statistic = 2.20).
The sizable increase in statistical significance suggests that the consideration of social ties (inaddition to the conventional ties) substantially reduces noise in gauging the extent to which anaudit committee is captured by the CEO. The legal restrictions in place throughout our sampleperiod greatly reduce the level and variation in an audit committee’s Conventional Index, loweringthe likelihood of detecting a reliable association between the Conventional Index and measures ofearnings management. However, social ties were never included in these independence rules, therebyallowing greater and more meaningful cross-sectional variation in measuring an audit committee’strue independent-mindedness, and increasing the power of our tests when we use the Conventional-and-Social Index, as opposed to the Conventional Index. As such, the evidence presented in thisstudy should not be construed to imply that the true effect of a social tie is stronger than that of aconventional tie. Relatedly, we suspect that the coefficient estimate on the Conventional-and-SocialIndex of 0.011 likely overstates the true partial effect of social ties on abnormal accruals. The lowerend of the 95% confidence interval (which ranges from 0.001 to 0.021) provides values that areeconomically more plausible, and the same qualification applies to the coefficient estimate on theSocial Index.
The signs of the coefficient estimates on the control variables are broadly consistent with priorliterature and expectations. For instance, Bergstresser and Philippon (2006) suggest that highereffective ownership arising from equity enhances earnings-management tendencies. Consistent withthis argument, we detect a strong positive partial correlation between our earnings management
11
measure and the CEO equity ownership variable. Similarly, Skinner and Sloan (2002) documentthat growth stocks experience stronger price responses to negative earnings surprises, pointing togreater incentives for growth firms to manage earnings. Bartov et al. (1999) provide evidence thatthe earnings-response coefficient increases with analyst coverage, suggesting that firms with highanalyst coverage are under greater pressure to perform and, as such, more likely to manage earnings.Consistent with these conjectures, we observe strong positive associations between our measures ofearnings management and market-to-book ratio and analyst coverage.12
4.2 Propensity to Meet or Beat Earnings Targets
The positive association we find between social ties and abnormal accruals is consistent with thehypothesis that social ties facilitate earnings management. Nonetheless, an alternative explana-tion could be that socially affiliated audit committee members are more likely to trust the CEOand, hence, allow him to make greater use of accruals in a way that (better) reflects the true eco-nomic condition of the firm. We now attempt to distinguish this interpretation from the earningsmanagement interpretation.
Following Burgstahler and Dichev (1997); Healy and Wahlen (1999); Degeorge et al. (1999); Yu(2008), among others, we examine the distribution of reported earnings around earnings targets. Adisproportionately large fraction of reported earnings either exactly meet or narrowly beat earningstargets, suggesting a propensity to manage earnings to avoid missing targets. Here, we test whethera firm’s propensity to exactly meet or narrowly beat earnings targets increases in the extent of theaudit committee’s social affiliation. If social ties do not facilitate earnings management, then weshould not observe an increased structural break in the distribution of reported earnings aroundearnings targets (which we measure using quarterly earnings consensus forecasts) when we consideran audit committee’s social affiliation in addition to its conventional affiliation to the CEO.
Thus, our hypothesis, stated in the null form, is that if narrowly meeting/beating analysts’forecasts is not indicative of earnings management or if common backgrounds (between the auditcommittee and the CEO) do not temper/facilitate earnings management, then we expect to observeno association between common backgrounds and the likelihood of narrowly meeting/beating an-alysts’ forecasts. To control for other determinants of narrowly meeting (versus narrowly missing)earnings targets, we estimate the following binary response model using the logistic function:
Di,t = α+ βAffiliationIndexi,t +Xγ + φ1Timet + φ2PostSOXt + εi,t. (5)12Rather than control for the individual determinants of the earnings response coefficient (ERC), such as market-to-
book ratio and analyst coverage, we could attempt to estimate a firm’s ERC and include the ERC estimate itself as aright-hand variable. One advantage of including the individual determinants is that it allows us to assess which of theindividual determinants of the ERC associate with abnormal accruals in a manner that is consistent (or inconsistent)with earnings management incentives. A second advantage is that the individual determinants more accuratelycapture a firm’s ERC than an ERC estimate based on the firm’s own past time-series (much like how firm size is amore precise estimator of a firm’s true beta than its own past sample beta (Fama and French (1992))). Consistentwith this conjecture, we observe that the ERCs estimated from rolling 5-year time-series regressions are erraticallydistributed. And while our measure of earnings management is positively correlated with the ERC estimates, theassociation is not statistically significant.
12
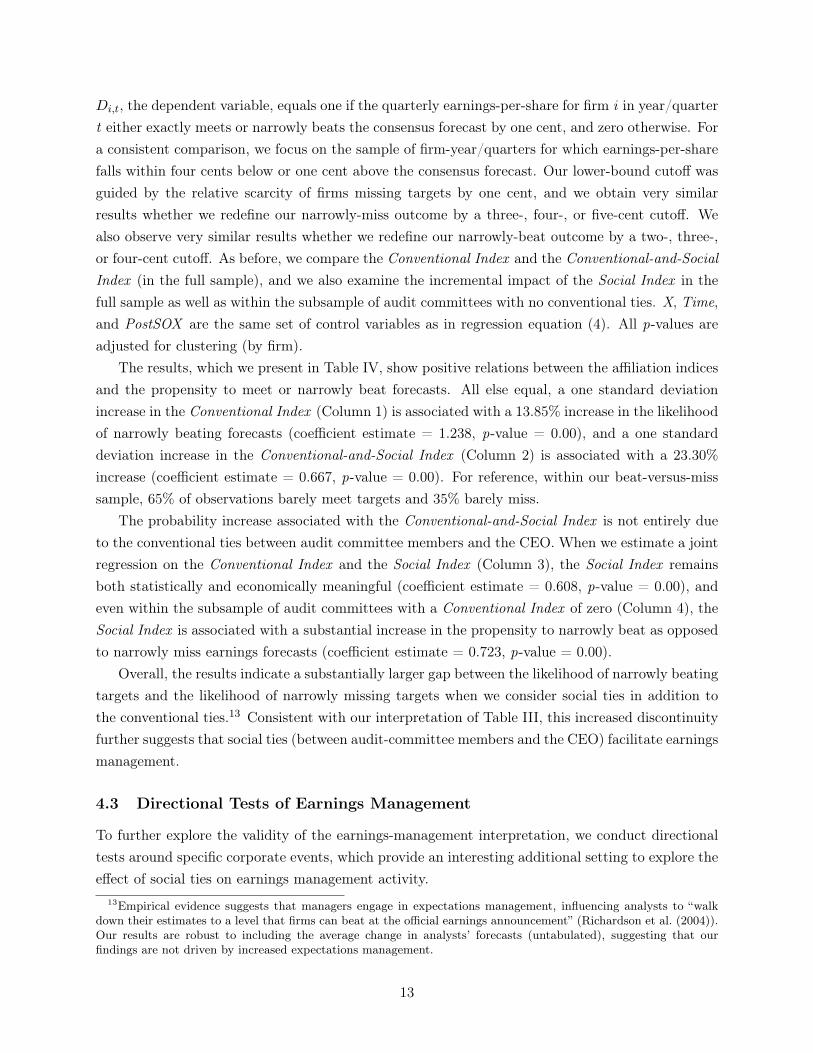
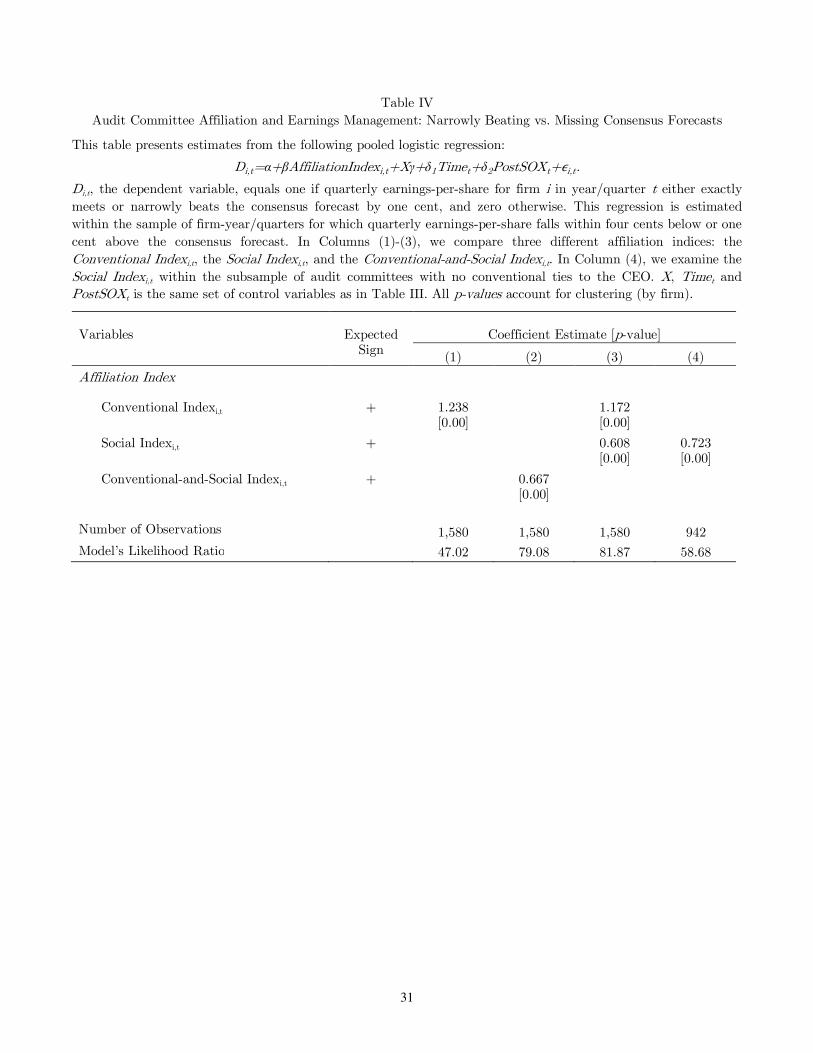
Di,t, the dependent variable, equals one if the quarterly earnings-per-share for firm i in year/quartert either exactly meets or narrowly beats the consensus forecast by one cent, and zero otherwise. Fora consistent comparison, we focus on the sample of firm-year/quarters for which earnings-per-sharefalls within four cents below or one cent above the consensus forecast. Our lower-bound cutoff wasguided by the relative scarcity of firms missing targets by one cent, and we obtain very similarresults whether we redefine our narrowly-miss outcome by a three-, four-, or five-cent cutoff. Wealso observe very similar results whether we redefine our narrowly-beat outcome by a two-, three-,or four-cent cutoff. As before, we compare the Conventional Index and the Conventional-and-SocialIndex (in the full sample), and we also examine the incremental impact of the Social Index in thefull sample as well as within the subsample of audit committees with no conventional ties. X, Time,and PostSOX are the same set of control variables as in regression equation (4). All p-values areadjusted for clustering (by firm).
The results, which we present in Table IV, show positive relations between the affiliation indicesand the propensity to meet or narrowly beat forecasts. All else equal, a one standard deviationincrease in the Conventional Index (Column 1) is associated with a 13.85% increase in the likelihoodof narrowly beating forecasts (coefficient estimate = 1.238, p-value = 0.00), and a one standarddeviation increase in the Conventional-and-Social Index (Column 2) is associated with a 23.30%increase (coefficient estimate = 0.667, p-value = 0.00). For reference, within our beat-versus-misssample, 65% of observations barely meet targets and 35% barely miss.
The probability increase associated with the Conventional-and-Social Index is not entirely dueto the conventional ties between audit committee members and the CEO. When we estimate a jointregression on the Conventional Index and the Social Index (Column 3), the Social Index remainsboth statistically and economically meaningful (coefficient estimate = 0.608, p-value = 0.00), andeven within the subsample of audit committees with a Conventional Index of zero (Column 4), theSocial Index is associated with a substantial increase in the propensity to narrowly beat as opposedto narrowly miss earnings forecasts (coefficient estimate = 0.723, p-value = 0.00).
Overall, the results indicate a substantially larger gap between the likelihood of narrowly beatingtargets and the likelihood of narrowly missing targets when we consider social ties in addition tothe conventional ties.13 Consistent with our interpretation of Table III, this increased discontinuityfurther suggests that social ties (between audit-committee members and the CEO) facilitate earningsmanagement.
4.3 Directional Tests of Earnings Management
To further explore the validity of the earnings-management interpretation, we conduct directionaltests around specific corporate events, which provide an interesting additional setting to explore theeffect of social ties on earnings management activity.
13Empirical evidence suggests that managers engage in expectations management, influencing analysts to “walkdown their estimates to a level that firms can beat at the official earnings announcement” (Richardson et al. (2004)).Our results are robust to including the average change in analysts’ forecasts (untabulated), suggesting that ourfindings are not driven by increased expectations management.
13
We condition our tests on four events: (1) when the CEO sells a large quantity of shares, (2) whenthe firm raises external capital, (3) when the firm has had a negative earnings streak, and (4) whena new CEO enters office. CEOs selling large quantities of shares have upward-managing incentives,as do CEOs raising large amounts of external capital and CEOs following a negative earningsstreak. On the other hand, newly appointed CEOs have “big-bath incentives,” since initial earningsdisappointments can be attributed to the departing CEO. If social ties do not facilitate earningsmanagement, then we should not observe greater upward (or greater downward) management ofearnings in these scenarios when we compare the high Social Index subsample to the low SocialIndex subsample.
To test this hypothesis, we plot the average (signed) discretionary accruals of sample firms whoare above versus below the median in terms of their audit committees’ Social Index (i.e., high versuslow Social Index firms), and to ensure that social ties per se matter, we continue to focus on firmswhose audit committees have no conventional ties to the CEO. With regard to CEO trades, weexamine firm-years in which the CEO sells more than $1 million in shares through open-markettrades, and with regard to raising external capital, we examine firm-years in which the firm raisesmore than 5% of total assets in external capital. Regarding negative earnings streaks, we examinefirm-years which follow two consecutive years of negative earnings. With respect to incoming CEOs,we examine new appointments occurring three to nine months prior to the fiscal-year end in whichthe outgoing CEO is no longer involved in the management of the firm (i.e., as an employee orboard member).14 The first filter serves to distinguish new appointments who not only have theincentive but also the opportunity to declare large losses (CEOs who arrive early in the fiscal yearcan still be blamed for poor performance, and those who arrive too late may no longer have ampleopportunity); the second filter further weeds out CEOs who lack incentives or opportunity, sinceit may be difficult to blame poor performance on a predecessor who remains active in the firm’smanagement.
The results, plotted in Figure I, show an accrual differential in the high versus low SocialIndex subsamples for each of our scenarios. We observe that when CEOs sell large quantitiesof shares (Panel A), raise large amounts of external capital (Panel B), or follow a negative earningsstreak (Panel C), average abnormal accruals are positive in general, reflecting the income-increasingincentives in these scenarios. However, consistent with the notion that social ties facilitate earningsmanagement, abnormal accruals are even more positive in the high Social Index subsample thanin the low Social Index subsample. Similarly, when a new CEO enters office, we observe that newCEOs have negative abnormal accruals in both the low and high Social Index subsamples, butaverage abnormal accruals are even more negative in the high Social Index subsample (Panel D).The accrual differential between the low and high Social Index subsamples is statistically significantat the 5% level in the ‘Insider Trades’ scenario (N = 397) as well as in the ‘External Capital Raised’scenario (N = 240), and is statistically significant at the 10% level in the ‘New CEO Arrivals’
14We observe very similar results whether we alter the appointment window for incoming CEOs or the minimumsales requirement for CEO trades.
14
scenario (N = 7); the accrual differential is not statistically significant at any conventional level inthe ‘Negative Earnings Streak’ scenario (N = 16).
4.4 Earnings Restatements
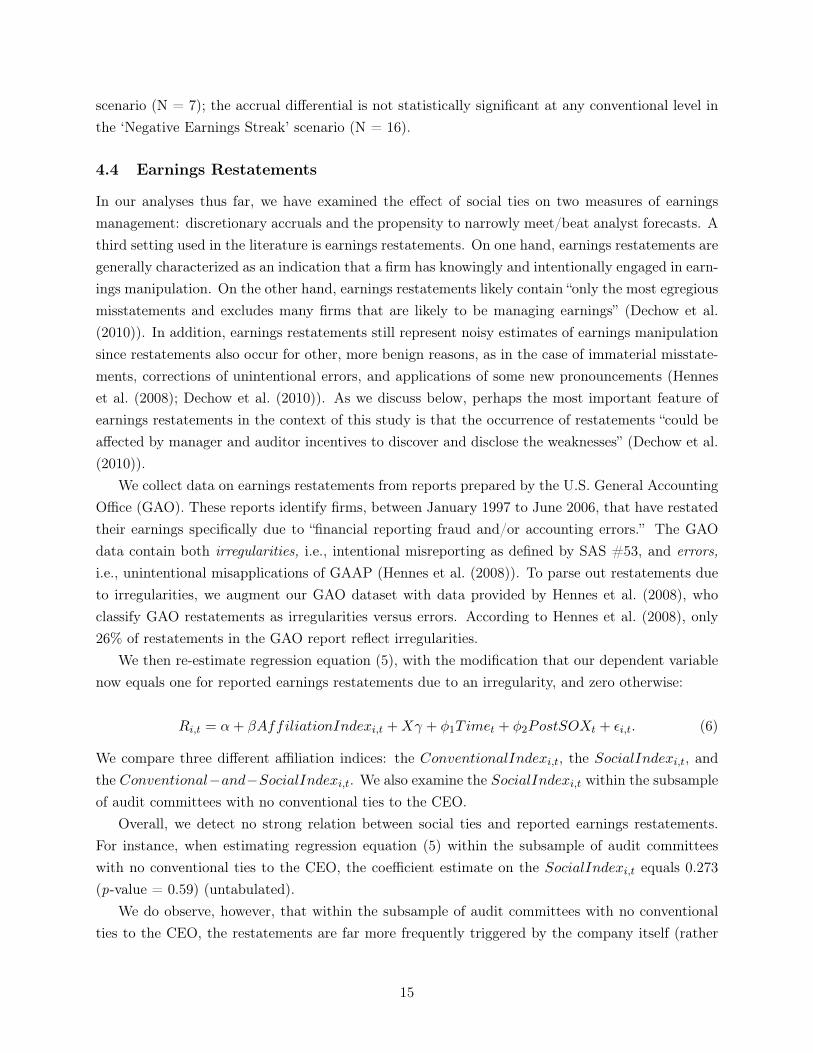
In our analyses thus far, we have examined the effect of social ties on two measures of earningsmanagement: discretionary accruals and the propensity to narrowly meet/beat analyst forecasts. Athird setting used in the literature is earnings restatements. On one hand, earnings restatements aregenerally characterized as an indication that a firm has knowingly and intentionally engaged in earn-ings manipulation. On the other hand, earnings restatements likely contain “only the most egregiousmisstatements and excludes many firms that are likely to be managing earnings” (Dechow et al.(2010)). In addition, earnings restatements still represent noisy estimates of earnings manipulationsince restatements also occur for other, more benign reasons, as in the case of immaterial misstate-ments, corrections of unintentional errors, and applications of some new pronouncements (Henneset al. (2008); Dechow et al. (2010)). As we discuss below, perhaps the most important feature ofearnings restatements in the context of this study is that the occurrence of restatements “could beaffected by manager and auditor incentives to discover and disclose the weaknesses” (Dechow et al.(2010)).
We collect data on earnings restatements from reports prepared by the U.S. General AccountingOffice (GAO). These reports identify firms, between January 1997 to June 2006, that have restatedtheir earnings specifically due to “financial reporting fraud and/or accounting errors.” The GAOdata contain both irregularities, i.e., intentional misreporting as defined by SAS #53, and errors,i.e., unintentional misapplications of GAAP (Hennes et al. (2008)). To parse out restatements dueto irregularities, we augment our GAO dataset with data provided by Hennes et al. (2008), whoclassify GAO restatements as irregularities versus errors. According to Hennes et al. (2008), only26% of restatements in the GAO report reflect irregularities.
We then re-estimate regression equation (5), with the modification that our dependent variablenow equals one for reported earnings restatements due to an irregularity, and zero otherwise:
We compare three different affiliation indices: the ConventionalIndexi,t, the SocialIndexi,t, andthe Conventional−and−SocialIndexi,t. We also examine the SocialIndexi,t within the subsampleof audit committees with no conventional ties to the CEO.
Overall, we detect no strong relation between social ties and reported earnings restatements.For instance, when estimating regression equation (5) within the subsample of audit committeeswith no conventional ties to the CEO, the coefficient estimate on the SocialIndexi,t equals 0.273(p-value = 0.59) (untabulated).
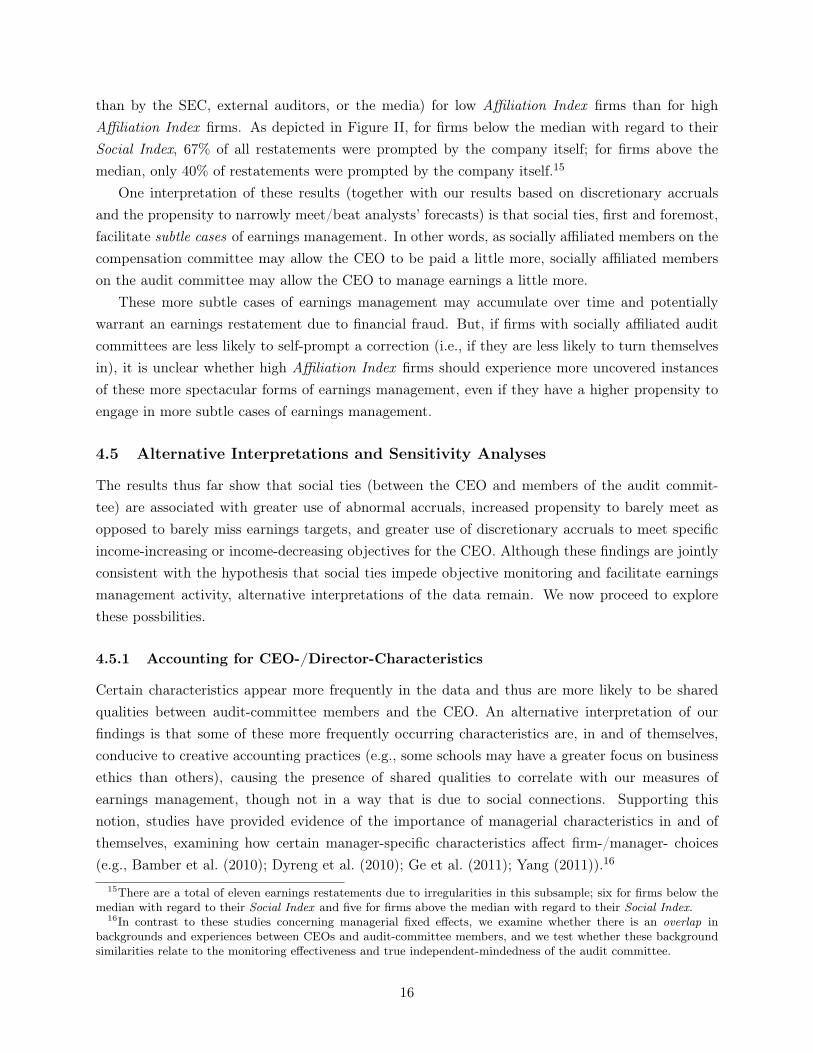
We do observe, however, that within the subsample of audit committees with no conventionalties to the CEO, the restatements are far more frequently triggered by the company itself (rather
15
than by the SEC, external auditors, or the media) for low Affiliation Index firms than for highAffiliation Index firms. As depicted in Figure II, for firms below the median with regard to theirSocial Index, 67% of all restatements were prompted by the company itself; for firms above themedian, only 40% of restatements were prompted by the company itself.15
One interpretation of these results (together with our results based on discretionary accrualsand the propensity to narrowly meet/beat analysts’ forecasts) is that social ties, first and foremost,facilitate subtle cases of earnings management. In other words, as socially affiliated members on thecompensation committee may allow the CEO to be paid a little more, socially affiliated memberson the audit committee may allow the CEO to manage earnings a little more.
These more subtle cases of earnings management may accumulate over time and potentiallywarrant an earnings restatement due to financial fraud. But, if firms with socially affiliated auditcommittees are less likely to self-prompt a correction (i.e., if they are less likely to turn themselvesin), it is unclear whether high Affiliation Index firms should experience more uncovered instancesof these more spectacular forms of earnings management, even if they have a higher propensity toengage in more subtle cases of earnings management.
4.5 Alternative Interpretations and Sensitivity Analyses
The results thus far show that social ties (between the CEO and members of the audit commit-tee) are associated with greater use of abnormal accruals, increased propensity to barely meet asopposed to barely miss earnings targets, and greater use of discretionary accruals to meet specificincome-increasing or income-decreasing objectives for the CEO. Although these findings are jointlyconsistent with the hypothesis that social ties impede objective monitoring and facilitate earningsmanagement activity, alternative interpretations of the data remain. We now proceed to explorethese possbilities.
4.5.1 Accounting for CEO-/Director-Characteristics
Certain characteristics appear more frequently in the data and thus are more likely to be sharedqualities between audit-committee members and the CEO. An alternative interpretation of ourfindings is that some of these more frequently occurring characteristics are, in and of themselves,conducive to creative accounting practices (e.g., some schools may have a greater focus on businessethics than others), causing the presence of shared qualities to correlate with our measures ofearnings management, though not in a way that is due to social connections. Supporting thisnotion, studies have provided evidence of the importance of managerial characteristics in and ofthemselves, examining how certain manager-specific characteristics affect firm-/manager- choices(e.g., Bamber et al. (2010); Dyreng et al. (2010); Ge et al. (2011); Yang (2011)).16
15There are a total of eleven earnings restatements due to irregularities in this subsample; six for firms below themedian with regard to their Social Index and five for firms above the median with regard to their Social Index.
16In contrast to these studies concerning managerial fixed effects, we examine whether there is an overlap inbackgrounds and experiences between CEOs and audit-committee members, and we test whether these backgroundsimilarities relate to the monitoring effectiveness and true independent-mindedness of the audit committee.
16
To explore this alternative, we includeAlma-Mater, Academic-Discipline, Industry, and Regional-Origin fixed effects. With the inclusion of these indicator variables in the accruals-based regressions,the coefficient estimate on the Conventional Index becomes 0.022 (t-statistic = 1.28), and the co-efficient estimate on the Conventional-and-Social Index becomes 0.014 (t-statistic = 2.36); bothof which are similar to the original coefficient estimates reported in columns (1) and (2) of TableIII. Similarly, when we control for these fixed effects in the meet-or-beat regressions, the coefficientestimate on the Conventional Index becomes 1.768 (p-value = 0.00), and the coefficient estimate onthe Conventional-and-Social Index becomes 0.649 (p-value = 0.00). Together, these findings do notsupport the idea that these characteristics themselves are driving the relation we observe; rather,it is the presence of overlaps in backgrounds and experiences between CEOs and audit committeemembers, which generates the associations detected in this study.
4.5.2 Fraction of Audit-Committee Members with Affiliation to CEO
In additional analyses, we explore an alternative affiliation measure, whereby we redefine our variableof interest as the fraction of audit-committee members who are affiliated to the CEO (i.e., wecategorize each director in dichotomous terms: affiliated or not). Following Hwang and Kim (2009),we deem a director socially affiliated if he/she shares at least two social ties with the CEO, andconventionally affiliated if he/she shares at least one conventional tie with the CEO.
We observe very similar results using this affiliation fraction in place of the affiliation index. Inthe accruals-based regressions (equation 4), we observe a coefficient estimate of 0.005 (t-statistic =0.27) on the fraction of members who are conventionally affiliated, whereas we observe a coefficientestimate of 0.027 (t-statistic = 2.20) on the fraction of members who are conventionally or sociallyaffiliated. Within the subsample of firms with conventionally independent audit committees, weobserve a coefficient estimate of 0.035 (t-statistic = 1.78) on the fraction of members who aresocially affiliated (untabulated).
In the meet-or-beat regressions (equation 5), the coefficient estimate on the fraction of conven-tionally affiliated committee members equals 1.465 (p-value = 0.00); the coefficient estimate on thefraction of conventionally-or-socially affiliated committee members equals 1.674 (p-value = 0.00);and within the subsample of firms with conventionally independent audit committees, the coeffi-cient estimate on the fraction of socially affiliated committee members equals 2.019 (p-value = 0.00)(untabulated).
We use an affiliation index in our main analysis since, in capturing the average number of tiesper director (to the CEO), it allows us a finer (and perhaps more objective) metric to define theextent of a director’s affiliation, which is presumably greater the more similarities he shares with theCEO (Marsden (1987); McPherson et al. (2001)).17 Put differently, the fraction-affiliated measurerequires a subjective cutoff point to categorize directors as affiliated or not. Moreover, the fraction-affiliated measure does not differentiate between directors that fall on the same side of the cutoff
17Other studies using an equal-weighted index to aggregate information include Gompers et al. (2003); Bebchuket al. (2009), who create an index to capture the extent of managerial entrenchment.
17
point (i.e., if the cutoff point were two ties, then a director with two ties would be treated the sameas a director with four ties), which is counter to the empirical and theoretical work suggesting thatthe extent of a director’s affiliation with the CEO increases with the shared similarities.
Focusing on the subsample of firms with conventionally independent audit committees, we ex-plore this idea by re-estimating our regressions on the fraction of members with exactly one socialtie in addition to the fraction of members with two or more social ties. With regard to the accruals-based regression, we observe coefficient estimates of 0.031 (t-statistic = 1.99) and 0.043 (t-statistic= 2.15), respectively. With regard to the meet-or-beat regression, we observe coefficient estimates of0.479 (p-value = 0.20) and 2.132 (p-value = 0.00), respectively (untabulated). Consistent with ourconjecture, these results suggest that the audit-committee members sharing just a single social tiewith the CEO have incremental explanatory power, though they are economically (and statistically)less important than the audit-committee members sharing two or more social ties with the CEO.
4.5.3 Discretionary Accruals
Many of our results are based on discretionary-accruals estimates as a measure of earnings man-agement. While the use of discretionary accruals is motivated by a significant body of work, theliterature also points to shortcomings surrounding discretionary accruals as an indicator of earningsmanagement.
In particular, discretionary-accrual models only imperfectly remove accrual components that donot necessarily reflect creative accounting practices. For instance, firms with high cash-flow volatil-ity naturally have a greater level of accruals (Hribar and Nichols (2007)), as do highly profitablefirms (Dechow et al. (1995)). As a result, such firms may exhibit higher levels of “abnormal accruals”for reasons that are unrelated to earnings manipulation. At the same time, these firms may haveeconomically plausible motivations for bringing in socially affiliated directors, causing our AffiliationIndex and |AAC | measures to be spuriously correlated. For instance, high cash-flow volatility firmsmay have greater advisory needs and, as such, a greater need for socially-affiliated directors; simi-larly, high profitability firms may benefit from better advice provided by socially-affiliated directors.Because these simultaneous relations may be determined nonlinearly, they are not fully acountedfor by including the corresponding firm characteristic as a right-hand side variable in the regressionequation.
Following prior studies, we attempt to address this concern by employing a matching specificationbased on some firm characteristic that could cause our left- and right-hand side variable to bespuriously correlated. Specifically, we match each of our sample firms with a control firm in thesame two-digit SIC code, having the closest value along the firm characteristic in question (i.e.,total assets, cash-flow volatility, earnings volatility, or ROA). We then subtract the discretionaryaccruals of the control firm from the discretionary accruals of the sample firm in an attempt toremove accrual components that are not indicative of earnings-management activity.
Re-estimating regression equation (4) with these new matched discretionary-accruals estimatesproduces similar results as before. For instance, when re-estimating our regression within the
18
subsample of audit committees with no conventional ties to the CEO, we observe a coefficientestimate on the Social Affiliation Index of 0.010 (t-statistic = 1.43) when we match by total assets,0.025 (t-statistic = 2.76) when we match by cash-flow volatility, 0.037 (t-statistic = 2.07) when wematch by earnings volatility, and 0.028 (t-statistic = 2.41) when we match by ROA (untabulated)
The tenor of our results remains when we employ a propensity-score matching design. Specifi-cally, we calculate a social-ties propensity score for each observation by estimating a binary-responsemodel of whether there is a socially affiliated director on the audit committee. Except for the Affili-ation Index, the set of independent variables is the same as in regression equation (4). Based on thissocial-ties propensity score, we then match each firm-year observation from the subset of sociallyaffiliated audit committees with another observation from the subset of socially independent auditcommittees. Consistent with the idea that social ties facilitate earnings-management tendencies,we observe a substantial difference in |AAC| between the socially-affiliated observations and theirsocially-independent matches (difference = 0.016, t-statistic = 2.82) (untabulated).18
4.6 Sarbanes Oxley
Our final investigation explores how the role of social ties in audit committees may have changedsurrounding the enactment of the Sarbanes-Oxley Act of 2002 (SOX). The passage of SOX marksa period of increased regulatory scrutiny, charging audit committees with greater responsibility intheir financial oversight duties and requiring chief executives to certify the integrity of their financialstatements. Furthermore, SOX solidified the audit-committee independence requirements imposedby the 1999 amendments to NYSE and NASDAQ listing standards, which were lax compared tocurrent standards.
At its core, SOX was intended to limit the use of creative accounting practices. In accordancewith its design, Cohen et al. (2008a) observe that firms generally decrease their (accrual-based)earnings-management activity following the enactment of SOX. However, amidst the heightenedscrutiny, social ties were not included in the independence criteria, pointing to the possibility thatsocial ties provide an alternate opportunity for CEOs to continue capturing the audit committee.
Consistent with this premise, we observe a high incidence of firms replacing their financiallyand familially affiliated audit-committee members with socially affiliated members during the post-SOX period. Although the enactment of SOX effected an overall decrease in audit committees’conventional affiliation to the CEO, 24% of the firms whose audit committees lost conventionallyaffiliated members appointed socially affiliated replacements.
To explore whether these socially affiliated replacements simply coincide with the passage ofSOX or whether these firms are opportunistically forming superficially compliant audit committees,we use a difference-in-difference approach to compare the pre- and post-SOX abnormal accrualsof audit committees that replace their conventionally affiliated members (with socially affiliatedmembers) versus the pre- and post-SOX abnormal accruals of those that do not. By examiningdifferences in differences, we subtract out not only the unobservable firm-specific factors that may
18The corresponding average propensity scores are 0.455 and 0.454, respectively.
19
affect abnormal accruals, but also the other general changes accompanying this regulatory shock.If the socially affiliated replacements are not a calculated response to tighter regulatory constraintson audit-committee composition, then we should not observe a significant coefficient estimate onthe interaction term capturing this difference-in-difference in accrual-based earnings management.
Focusing on the subsample of firms that lose at least one conventionally affiliated audit-committeemember in the post-SOX period, we estimate a pooled OLS regression of abnormal accruals on aPostSOX indicator, an Affiliation Shift indicator, an Affiliation Shift * PostSOX interaction term,and the same set of controls, X, as in regression equation (4):
PostSOX is an indicator variable that equals one in years greater than or equal to 2002, and zerootherwise.19 Affiliation Shift is an indicator variable that equals one for firms in which a post-SOXdecrease in the number of conventionally affiliated members is accompanied by an increase in thenumber of socially affiliated members, and zero otherwise. As before, all t-statistics are calculatedusing White standard errors adjusted for clustering by firm.
The results, presented in Table V, show a significantly positive coefficient estimate of 0.052(t-statistic = 2.17) on the Affiliation Shift * PostSOX interaction term, suggesting a substantialdifference in how shifters versus non-shifters respond to the regulatory changes enacted by SOX.These observations indicate that, although firms generally decrease their earnings-management ac-tivity following the enactment of Sarbanes Oxley, our affiliation shifters do not.
Our difference-in-difference specification is not free of omitted-variable concerns, since affiliationshifting is a discretionary choice made by firms, and SOX may have affected the unobserved factorin question differently for affiliation shifters than for non-shifters. Further examining this poten-tially important, yet overlooked economic byproduct of recent regulation to draw more detailedconclusions should prove to be interesting avenues for future research.
5 Conclusion
In this paper, we provide evidence that social ties (in addition to financial and familial ties) are animportant channel through which CEOs capture the financial reporting process. We also providesuggestive evidence on an economic byproduct of recent regulatory changes requiring that all audit-committee members have neither financial nor familial ties to the CEO: the heightened regulation isaccompanied by a replacement of conventionally affiliated audit-committee members with sociallyaffiliated ones. Moreover, while firms generally manage earnings less in the aftermath of SOX, theseaffiliation shifters do not, pointing to the importance of social ties as an alternate source of continueddependence amidst heightened scrutiny of audit committees’ financial and familial affiliations withthe CEO.
19We obtain similar results when we redefine the post-SOX cutoff using the year 2003.
20
Our analysis has potential policy implications. Recent regulations require that audit committeesbe composed entirely of independent directors, whereby independence is defined exclusively in termsof financial or familial ties to the CEO or the firm. The evidence presented in this study suggeststhat while these requirements might increase the monitoring effectiveness of the board, they areunlikely to ensure full independent-mindedness.
Our findings also caution from interpreting any inconsistent linkage between nominal indepen-dence and firm outcome variables as an indication that independence matters little in the currentclimate. The legal restrictions in place greatly reduce the level and variation in a board’s/auditcommittee’s nominal independence, which should render our inability to detect a reliable associa-tion between conventional independence and firm outcome unsurprising. In this study, we provideevidence that as more stringent definitions of independence are applied (that are not included in thecurrent independence rules), a clearer relation emerges. As such, our findings suggest that while thesource of dependence may have shifted, many directors remain beholden to the CEO and that thetopic of independence should continue to be an interesting avenue for future thought and potentialreform.
21
References
Adams, R. and Ferreira, D. (2007). A theory of friendly boards. Journal of Finance, 62(1):217–250.
Bamber, L. S., Jiang, J. X., and Wang, I. Y. (2010). What is my style? the influence of top managerson voluntary corporate financial disclosure. The Accounting Review, 85(4):1131–1162.
Bartov, E., Gul, F. A., and Tsui, J. S. (2000). Discretionary-accruals models and audit qualifications.Journal of Accounting and Economics, 30(3):421–452.
Bartov, E., Lynn, S., and Ronen, J. (1999). Return-earnings regressions: A mismeasured earningsexpectations perspective.
Bebchuk, L., Cohen, A., and Ferrell, A. (2009). What matters in corporate governance? Review ofFinancial Studies, 22(2):783.
Bergstresser, D. and Philippon, T. (2006). Ceo incentives and earnings management. Journal ofFinancial Economics, 80(3):511–529.
Burgstahler, D. and Dichev, I. (1997). Earnings management to avoid earnings decreases and losses.Journal of Accounting and Economics, 24(1):99–126.
Butler, A. W. and Gurun, U. G. (2011). Educational networks, mutual fund voting patterns, andceo compensation. Review of Financial Studies, forthcoming.
Carcello, J. V. and Neal, T. L. (2000). Audit committee composition and auditor reporting. TheAccounting Review, 75(4):453–467.
Carcello, J. V. and Neal, T. L. (2003). Audit committee characteristics and auditor dismissalsfollowing" new" going-concern reports. The Accounting Review, 78(1):95–117.
Chatman, J. and Jehn, K. (1994). Assessing the relationship between industry characteristicsand organizational culture: how different can you be? The Academy of Management Journal,37(3):522–553.
Clack, G., editor (2003). Portrait of the USA. US Department of State.
Cohen, D., Dey, A., and Lys, T. (2008a). Real and accrual-based earnings management in thepre-and post-sarbanes-oxley periods. The Accounting Review, 83(3):757–787.
Cohen, L., Frazzini, A., and Malloy, C. (2008b). The small world of investing: Board connectionsand mutual fund returns. Journal of Political Economy, 116(5):951–979.
Cohen, L., Frazzini, A., and Malloy, C. (2010). Sell-side school ties. Journal of Finance, 65(4):1409–1437.
Crosse, C., Hocking, B., and Australia, S. (2004). Social rehabilitation: what are the issues. InDVA National Rehabilitation Conference, at Canberra, Australia.
Dechow, P., Ge, W., and Schrand, C. (2010). Understanding earnings quality: A review of the prox-ies, their determinants and their consequences. Journal of Accounting and Economics, 50(2):344–401.
22
Dechow, P., Sloan, R. G., and Sweeney, A. (1995). Detecting earnings management. The AccountingReview, 70(2):193–225.
Degeorge, F., Patel, J., and Zeckhauser, R. (1999). Earnings management to exceed thresholds.Journal of Business, 72(1):1–33.
Dyreng, S. D., Hanlon, M., and Maydew, E. L. (2010). The effects of executives on corporate taxavoidance. The Accounting Review, 85(4):1163–1189.
Engelberg, J., Gao, P., and Parsons, C. (2009). The value of a rolodex: Ceo pay and personalnetworks.
Fama, E. and French, K. (1997). Industry costs of equity. Journal of Financial Economics,43(2):153–193.
Fama, E. F. and French, K. R. (1992). The cross-section of expected stock returns. Journal ofFinance, 47(2):427–465.
Fracassi, C. and Tate, G. (2011). External networking and internal firm governance. Journal ofFinance, forthcoming.
Friedman, M. (2005). Veterans’ mental health in the wake of war. New England Journal of Medicine,352(13):1287–1290.
Ge, W., Matsumoto, D., and Zhang, J. L. (2011). Do cfos have style? an empirical investiga-tion of the effect of individual cfos on accounting practices. Contemporary Accounting Research,28(4):1141–1179.
Gompers, P., Ishii, J., and Metrick, A. (2003). Corporate governance and equity prices. QuarterlyJournal of Economics, 118(1):107–156.
Gordon, G. (1991). Industry determinants of organizational culture. The Academy of ManagementReview, 16(2):396–415.
Granovetter, M. (2005). The impact of social structure on economic outcomes. Journal of EconomicPerspectives, 19(1):33–50.
Hambrick, D. and Mason, P. (1984). Upper echelons: The organization as a reflection of its topmanagers. The Academy of Management Review, 9(2):193–206.
Healy, P. and Wahlen, J. (1999). A review of the earnings management literature and its implicationsfor standard setting. Accounting Horizons, 13(4):365–384.
Hennes, K. M., Leone, A. J., and Miller, B. P. (2008). The importance of distinguishing errorsfrom irregularities in restatement research: The case of restatements and ceo/cfo turnover. TheAccounting Review, 83(6):1487–1519.
Hribar, P. and Collins, D. (2002). Errors in estimating accruals: Implications for empirical research.Journal of Accounting Research, 40(1):105–134.
Hribar, P. and Nichols, C. D. (2007). The use of unsigned earnings quality measures in tests ofearnings management. Journal of Accounting Research, 45(5):1017–1053.
23
Hwang, B. and Kim, S. (2009). It pays to have friends. Journal of Financial Economics, 93(1):138–158.
Ingram, P. and Roberts, P. (2000). Friendships among competitors in the sydney hotel industry.The American Journal of Sociology, 106(2):387–423.
Ishii, J. and Xuan, Y. (2010). Acquirer-target social ties and merger outcomes.
Jones, J. (1991). Earnings management during import relief investigations. Journal of AccountingResearch, 29(2):193–228.
Kalmijn, M. and Flap, H. (2001). Assortative meeting and mating: Unintended consequences oforganized settings for partner choices. Social Forces, 79(4):1289–1312.
Klein, A. (2002). Audit committee, board of director characteristics, and earnings management.Journal of Accounting and Economics, 33(3):375–400.
Klein, A. (2003). Likely effects of stock exchange governance proposals and sarbanes-oxley oncorporate boards and financial reporting. Accounting Horizons, 17(4):343–356.
Kothari, S., Leone, A., and Wasley, C. (2005). Performance matched discretionary accrual measures.Journal of Accounting and Economics, 39(1):163–197.
Krishnan, J. (2005). Audit committee quality and internal control: An empirical analysis. TheAccounting Review, 80(2):649–675.
Kuhnen, C. (2009). Business networks, corporate governance, and contracting in the mutual fundindustry. Journal of Finance, 64(5):2185–2220.
Levitt, A. (2000). Remarks before the conference on the rise and effectiveness of new corporategovernance standards. Speech by SEC Chairman at Federal Reserve Bank of New York, USSecurities and Exchange Commission.
Li, H., Pincus, M., and Rego, S. (2008). Market reaction to events surrounding the sarbanes-oxleyact of 2002 and earnings management. Journal of Law and Economics, 51(1):111–134.
Marsden, P. (1987). Core discussion networks of americans. American Sociological Review,52(1):122–131.
Marsden, P., Reed, J., Kennedy, M., and Stinson, K. (1982). American regional cultures anddifferences in leisure time activities. Social Forces, 60(4):1023–1049.
McPherson, M., Smith-Lovin, L., and Cook, J. (2001). Birds of a feather: Homophily in socialnetworks. Annual Review of Sociology, 27:415–444.
Mills, J. and Clark, M. (1982). Exchange and communal relationships. Review of Personality andSocial Psychology, 3:121–144.
Porac, J., Thomas, H., and Baden-Fuller, C. (1989). Competitive groups as cognitive communities:The case of scottish knitwear manufacturers. Journal of Management Studies, 26(4):397–416.
Porac, J., Wade, J., and Pollock, T. (1999). Industry categories and the politics of the comparablefirm in ceo compensation. Administrative Science Quarterly, 44(1):112–144.
24
Rand, T. and Wexley, K. (1975). Demonstration of the effect, similar to me, in simulated employ-ment interviews. Psychological Reports, 36(2):535–544.
Reed, J. (2003). Do southerners prefer one another’s company? Southern Cultures, 9:84–90.
Richardson, S., Teoh, S., and Wysocki, P. (2004). The walk-down to beatable analyst forecasts:The role of equity issuance and insider trading incentives. Contemporary Accounting Research,21(4):885–924.
Rogers, E. M. and Bhowmik, D. K. (1970). Homophily-heterophily: Relational concepts for com-munication research. Public Opinion Quarterly, 34(4):523 – 538.
Schmidt, B. (2009). Costs and benefits of friendly boards during mergers and acquisitions.
Silver, A. (1990). Friendship in commercial society: Eighteenth-century social theory and modernsociology. The American Journal of Sociology, 95(6):1474–1504.
Skinner, D. and Sloan, R. (2002). Earnings surprises, growth expectations, and stock returns ordon’t let an earnings torpedo sink your portfolio. Review of Accounting Studies, 7(2):289–312.
Tsui, A., Egan, T., and O’Reilly, C. (1992). Being different: Relational demography and organiza-tional attachment. Administrative Science Quarterly, 37(4):549–579.
Uzzi, B. (1996). The sources and consequences of embeddedness for the economic performance oforganizations: The network effect. American Sociological Review, 61(4):674–698.
Uzzi, B. (1999). Embeddedness in the making of financial capital: How social relations and networksbenefit firms seeking financing. American Sociological Review, 64(4):481–505.
Warfield, T., Wild, J., and Wild, K. (1995). Managerial ownership, accounting choices, and infor-mativeness of earnings. Journal of Accounting and Economics, 20(1):61–91.
Westphal, J., Boivie, S., and Ming Chng, D. (2006). The strategic impetus for social network ties:Reconstituting broken ceo friendship ties. Strategic Management Journal, 27(5):425–445.
Westphal, J. and Milton, L. (2000). How experience and network ties affect the influence of demo-graphic minorities on corporate boards. Administrative Science Quarterly, 45(2):366–398.
Westphal, J. D. (1999). Collaboration in the boardroom: Behavioral and performance consequencesof ceo-board social ties. Academy of Management Journal, 42(1):7–24.
Wexley, K. and Nemeroff, W. (1973). The effects of racial prejudice, race of applicant, and bio-graphical similarity on interviewer evaluations of job applicants. In Proceedings of the AnnualConvention of the American Psychological Association. American Psychological Association.
Xie, H. (2001). The mispricing of abnormal accruals. The Accounting Review, 76(3):357–373.
Yang, H. I. (2011). Capital market consequences of managers’ voluntary disclosure styles. Journalof Accounting and Economics, forthcoming.
Yu, F. (2008). Analyst coverage and earnings management. Journal of Financial Economics,88(2):245–271.
25
26
Appendix: Description of Variables
Firm Size: To measure firm size, we use the book value of total assets in millions. Managers of large, visible firms incur higher political costs and thus have incentives to reduce reported income. There is evidence that managers of large firms not only lobby for income-reducing accounting standards (Watts and Zimmerman, 1978) but also exploit discretionary accounting choices to reduce reported income (e.g., Zmijewski and Hagerman, 1981; Lilien and Pastena, 1982). With respect to discretionary-accruals models, however, studies have found a negative relation between firm size and earnings management (e.g., Warfield, Wild, and Wild, 1995; Klein, 2002).
Leverage: To measure leverage, we divide long-term debt (which includes both public and private debt) by total assets. High leverage is associated with greater bankruptcy risk (Ohlson, 1980) and a greater propensity to manage earnings through discretionary accruals when approaching accounting-based covenant violations (Sweeney, 1994; Daniel, Denis, and Naveen, 2008). Thus, we expect a positive association between leverage and the extent of earnings management.
Market-to-Book Ratio: We calculate the market-to-book ratio as the market value of equity divided by the sum of the book value of equity and deferred taxes. Growth stocks “exhibit an asymmetrically large negative price response to negative earnings surprises” (Skinner and Sloan, 2002). Thus, we expect a positive association between market-to-book ratio and the extent of earnings management.
Cash-Flow-Volatility: Cash flow volatility is the standard deviation of net cash flow from operating activities scaled by book value of assets over the previous three fiscal years. Greater cash-flow volatility naturally leads to higher volatility in accruals (Hribar and Collins, 2007). Thus, we expect a positive association between cash-flow volatility and our unsigned abnormal accruals measure.
Analyst Coverage: This is the number of analysts providing one-year earnings forecasts for the firm in question. Analysts may exert undue pressure on firms, which could increase earnings management tendencies (Yu, 2008).
Audit Committee Size: Audit Committee size is the number of directors on the audit committee. Lipton and Lorsch (1992) argue that larger boards are more susceptible to managerial control and have increased coordination and free-rider problems, and similar arguments may apply to audit committees. On the other hand, due to greater outside scrutiny, audit-committee members may be less afflicted by coordination and free-rider problems, in which case larger audit committees may be more effective monitors.
Busy Audit Committee: This is a dummy that equals one if the audit committee is busy, and zero otherwise. Following Fich and Shivdasani (2006), we designate an audit committee as ‘busy’ if a majority of the independent directors concurrently serve on three or more boards. Some argue that directors who serve on too many boards do not have sufficient time to provide adequate monitoring (NACD, 1996), and Core et al. (1999) and Fich and Shivdasani (2006) present evidence that busy boards indicate weak corporate governance. If busy directors are less effective monitors, then busy audit committees should be positively associated with the level of earnings management.
CEO Equity Holdings/Audit Committee Members’ Equity Holdings: We calculate CEO Equity Holdings as the effective number of shares held by the CEO divided by the total number of shares outstanding (winsorized at the 99th percentile)1, and we calculate Audit Committee Members’ Equity Holdings as the average percentage of the company’s shares held by the committee members. Greater equity ownership may induce CEOs and audit committee members to manage earnings more in order to increase the value of their vested equity holdings (e.g., Bergstresser and Philippon, 2006).
CEO from Other Company on Audit Committee: This is a dummy that equals one if at least one of the directors on the audit committee is the CEO of another firm, and zero otherwise. We expect that CEOs are inclined to allow their fellow CEOs greater leeway in managing earnings, regardless of whether or not they are interlocked....
CEO Award: This is a dummy that equals one if the CEO has ever won the “Business Week Best Manager Award”, and zero otherwise. The idea is that recipients of this award are under more pressure to continue exhibiting signals of high quality, and thus may be more likely to manipulate earnings (Malmendier and Tate, 2009).
CEO is Chairman of the Board: This is a dummy that equals one if the CEO also serves as the chairman of the board, and zero otherwise. If the CEO doubles as chairman of the board, the board may be easier for the CEO to control, a hypothesis that is empirically supported by Yermack (1996) and Core et al. (1999), among others. Thus, we expect chairman CEOs to have more freedom to manage earnings than their non-chairman counterparts.
CEO Tenure: CEO tenure is the number of years the CEO has been in office. Greater tenure contributes to greater clout with the board (Hermalin and Weisbach, 1998). Thus, we expect CEOs with greater tenure to have more freedom to manage earnings.
Classified Board: This is a dummy that equals one if the firm has a classified-board provision (i.e., the directors have a staggered election-term structure), and zero otherwise. Bebchuk and Cohen (2005) and Faleye (2007) argue that classified boards entrench management. On one hand, if board-staggering empowers managers, then we expect these managers to have greater freedom to manage earnings. On the other hand, if board-staggering sufficiently entrenches managers, then these managers may not feel the pressure to manage earnings.
Family Firm: This is a dummy that equals one if at least one relative of the founder is an officer, a director, or a 5%-minimum blockholder (either individually or as a group) of the firm, and zero otherwise (we do not consider family firms in which the founder is still a chairman or CEO of the firm). Descendent-run firms have agency issues such that minority shareholders in these firms are “worse off than they would be in nonfamily firms” (Villalonga and Amit, 2006). Thus, we expect a positive association between Family Firm and the level of earnings management.
1 The effective ownership arising from equity is computed as the sum of (a) the number of shares held by the CEO divided by the total number of shares outstanding; and (b) the number of CEO options divided by the total number of shares outstanding multiplied by a measure of the option delta from the Black-Scholes model.
27
Table I Conventional and Social Ties between CEOs and Audit Committee Members
This table presents summary statistics on the fraction of audit-committee members with various ties to the CEO.
Our sample includes all Fortune 100 firms as of 1996 and 2005 for which we could obtain the necessary data.
Overall, our data consists of 954 firm-years over the period 1996 to 2005. We present the pooled means and
standard deviations, across all firm-years, of the fraction of audit-committee members having the specified tie to
the CEO. In terms of the social ties: the military tie signifies that the member and the CEO both served in the
military; the alma-mater tie signifies that both graduated from the same university and have no greater than a
three-year age difference; the regional origin tie signifies that both were born in the same US region or in the same
non-US country; the discipline tie signifies that both obtained a degree in the same academic discipline; the
industry tie signifies that both are primarily employed in the same industry (based on the Fama-French (1997)
49-industry classification); and the third party tie signifies that there is a common third party with whom each
shares at least two direct social ties. In terms of the conventional ties: the current employee (former employee) tie
signifies that the audit-committee member is a current (former) employee of the company; the charitable contributions tie signifies that the member is an employee of an organization that receives charitable gifts from
the company; the business relation tie signifies that the member or the member’s employer is a customer of or
supplier to the company; the professional services tie signifies that the member or the member’s employer provides
legal, consulting, or financial services to the company; the relative tie signifies that the member is a relative of an
executive officer; the interlocked tie signifies that the member is interlocked with an executive of the firm; and the
other tie signifies that the member is affiliated with the company in some manner other than current/former
employee, charity, business transaction, family relation, or interlocking directorship).
Tie
Proportion of Audit-Committee Members with Tie
Mean Standard Deviation
Military 0.026 0.090 Alma Mater 0.021 0.072 Regional Origin 0.157 0.189 Discipline 0.180 0.228 Industry 0.026 0.097 Third Party 0.191 0.230 Current Employee 0.001 0.015 Former Employee 0.027 0.079 Charitable Contributions 0.001 0.018 Business Relation 0.017 0.067 Professional Services 0.052 0.119 Relative 0.003 0.027 Interlocked 0.014 0.058 Other
0.000
0.000
Number of Observations 954 ---
28
Table II
Audit Committee, CEO, and Firm Characteristics
This table presents summary statistics of various audit-committee, CEO, and firm characteristics. Conventional Index is the audit committee’s average number of conventional ties (per committee member) to the CEO. Social Index is the average number of social ties to the CEO. Conventional—and-Social Index is the average number of
conventional and social ties to the CEO. An audit-committee member has a conventional tie to the CEO if he is a
current or former employee, a recipient of charitable funds, a customer of or a supplier to the firm, a provider of
professional services, a relative of an executive officer, interlocked with an executive of the firm, or if he shares
any other affiliations with the company. An audit-committee member has a social tie to the CEO if they both
served in the military, graduated from the same university, were born in the same US region or in the same non-
US country, share a degree in the same academic discipline, are primarily employed in the same industry (based
on the Fama-French (1997) 49-industry classification); or share a common third-party tie with whom each shares
at least two direct social ties. All other audit committee, CEO, and firm characteristics are as defined in the
Appendix.
Variables
Mean Standard Deviation
Panel A: Audit-Committee Affiliation Index
Conventional Index 0.115 0.183 Social Index 0.601 0.536 Conventional—and-Social Index 0.716 0.575 Panel B: Other Audit-Committee Characteristics
Audit Committee Size 4.639 1.412 Busy Audit Committee 0.406 0.491 Audit Committee Members’ Equity Holdings (%) 0.038 0.198 CEO from Other Company on Audit Committee 0.533 0.499
Panel C: CEO and Other Governance/Anti-Takeover Characteristics
CEO Equity Holdings (%) 0.779 2.911 CEO Award 0.178 0.383 CEO = Chairman 0.812 0.391 CEO Tenure 5.784 6.707 Classified Board 0.538 0.499 Family Firm 0.083 0.276
Di,t, the dependent variable, equals one if quarterly earnings-per-share for firm i in year/quarter t either exactly
meets or narrowly beats the consensus forecast by one cent, and zero otherwise. This regression is estimated
within the sample of firm-year/quarters for which quarterly earnings-per-share falls within four cents below or one
cent above the consensus forecast. In Columns (1)-(3), we compare three different affiliation indices: the
Conventional Indexi,t, the Social Indexi,t, and the Conventional-and-Social Indexi,t. In Column (4), we examine the
Social Indexi,t within the subsample of audit committees with no conventional ties to the CEO. X, Timet and
PostSOXt is the same set of control variables as in Table III. All p-values account for clustering (by firm).
Variables
Expected
Sign
Coefficient Estimate [p-value]
(1) (2) (3) (4)
Affiliation Index
Conventional Indexi,t + 1.238 [0.00]
1.172 [0.00]
Social Indexi,t
+ 0.608
[0.00] 0.723 [0.00]
Conventional-and-Social Indexi,t + 0.667 [0.00]
Number of Observations
1,580 1,580 1,580 942
Model’s Likelihood Ratio
47.02 79.08 81.87 58.68
32
Table V
Social Ties and Sarbanes Oxley
This table presents estimates from the following pooled OLS regression:
�AACi,t�=α+β1AffiliationShifti,t*PostSOXt+β2
AffiliationShifti,t+β3PostSOXt+δTimet+Xγ+�i,t.
|AACi,t|, the dependent variable, is the absolute value of abnormal accruals as defined in the text (Section 3.2.1)
for firm i in year t. AffiliationShifti,t is a dummy that equals one if a post-SOX (≥ 2002) loss of a conventionally
tied audit committee member is accompanied by a replacement with an audit committee member with social ties
to the CEO, and zero otherwise. PostSOXt is a dummy variable equal to one in years greater than or equal to
2002, and zero otherwise. The remaining independent variables are the same as in Tables III and IV. All t-statistics are calculated using White standard errors adjusted for clustering (by firm).
Variables
Expected Sign
Coefficient Estimate (t-
statistic)
AffiliationShifti,t * PostSOXt
+ 0.052 (2.17)
AffiliationShifti,t
? -0.005 (-0.39)
PostSOXt
-
-0.031 (-1.50)
Number of Observations 229 Adj. R-squared 0.25
33
Figure I.
Situations Involving Upward Versus Downward Managing Incentives
This figure plots the average abnormal accruals (as defined in Section 3.2.1) within the subsample of audit
committees with no conventional ties to the CEO. Panel A reports statistics for firm-years in which the CEO sells
more than $1 million in shares through open market trades (N = 397). Panel B reports statistics for firm-years in
which the firm raises more than 5% of total assets in external capital (N = 240). Panel C reports statistics for
firm-years that follow two consecutive years of negative earnings (N = 16). Panel D reports statistics for firm-
years in which a new CEO arrives 3 to 9 months prior to fiscal year end and the predecessor does not remain
active in the management of the firm (either as an employee or a board member) subsequent to his departure as
CEO (N = 7). We report signed average abnormal accruals for two subsamples: Low Social Index and High Social Index, denoting firms that are below or above the median, respectively, in terms of their Social Index.
0.00
0.02
0.04
0.06
0.08
0.10
Panel A: Insider Trades
0.00
0.02
0.04
0.06
0.08
0.10
Panel B: External Capital Raised
0.00
0.02
0.04
0.06
0.08
0.10
Panel C: Negative Earnings Streak
-0.10
-0.08
-0.06
-0.04
-0.02
0.00
Panel D: New CEO Arrivals
High Social Index Low Social Index
34
Figure II.
Social Ties and Earnings Restatements
This figure plots the fraction of earnings restatements that
were triggered by the firm itself within the subsample of
audit committees with no conventional ties to the CEO (N
= 11). We report the fraction for two subsamples: Low Social Index and High Social Index, denoting firms that are
below or above the median, respectively, in terms of their