403
Sociedad Química y Minera de Chile S.A. Annual Report 2017

Sociedad Química y Minera de Chile S.A.
Annual Report 2017

2
1) INDEX
2) IDENTIFICATION OF THE ENTITY .............................................................................................................. 3
2) A) IDENTIFICATION OF THE ENTITY: BASIC IDENTIFICATION .................................................................................... 3 2) B) IDENTIFICATION OF THE ENTITY: LEGAL CONSTITUTION ..................................................................................... 3 2) C) IDENTIFICATION OF THE ENTITY: CONTACT INFORMATION.................................................................................. 3 3) DESCRIPTION OF BUSINESS ENVIRONMENT ........................................................................................... 4 3) A) DESCRIPTION OF BUSINESS ENVIRONMENT: HISTORICAL INFORMATION ............................................................. 4 3) B) DESCRIPTION OF BUSINESS ENVIRONMENT: INDUSTRIAL SECTOR ....................................................................... 6 3) C) DESCRIPTION OF BUSINESS ENVIRONMENT: ACTIVITIES AND BUSINESSES .......................................................... 9 3) D) DESCRIPTION OF BUSINESS ENVIRONMENT: PROPERTY AND FACILITIES ........................................................... 36 3) E) DESCRIPTION OF BUSINESS ENVIRONMENT: RISK FACTORS .............................................................................. 55 3) F) DESCRIPTION OF BUSINESS ENVIRONMENT: CAPITAL EXPENDITURE ................................................................. 73
4) OWNERSHIP AND SHARES ........................................................................................................................... 75
4) A) OWNERSHIP AND SHARES: OWNERSHIP ............................................................................................................. 75 4) B) OWNERSHIP STRUCTURE AND SHARES: SHARES AND THEIR CHARACTERISTICS AND RIGHTS81
5) SOCIAL RESPONSIBILITY AND SUSTAINABLE DEVELOPMENT ...................................................... 84
5) A) SOCIAL RESPONSIBILITY AND SUSTAINABLE DEVELOPMENT: DIVERSITY WITHIN THE BOARD
OF DIRECTORS AS OF DECEMBER 31, 2017 ............................................................................................................ 84 5) B) SOCIAL RESPONSIBILITY AND SUSTAINABLE DEVELOPMENT: DIVERSITY WITHIN EXECUTIVE
MANAGEMENT AS OF DECEMBER 31, 2017 ............................................................................................................ 84 5) C) SOCIAL RESPONSIBILITY AND SUSTAINABLE DEVELOPMENT: DIVERSITY WITHIN THE
ORGANIZATION ..................................................................................................................................................... 85 5) D) SOCIAL RESPONSIBILITY AND SUSTAINABLE DEVELOPMENT: SALARY GAP BY GENDER ...... 86
6) MANAGEMENT AND PERSONNEL .............................................................................................................. 88
6) A) MANAGEMENT AND PERSONNEL: ORGANIZATIONAL CHART ......................................................... 88 6) B) MANAGEMENT AND PERSONNEL: INFORMATION ABOUT THE BOARD OF DIRECTORS ............. 88 6) C) MANAGEMENT AND PERSONNEL: INFORMATION ABOUT THE DIRECTORS’ COMMITTEE ....... 92 6) D) MANAGEMENT AND PERSONNEL: MAIN EXECUTIVES ....................................................................... 95 6) E) MANAGEMENT AND PERSONNEL: NUMBER OF EMPLOYEES ............................................................ 96 6) F) MANAGEMENT AND PERSONNEL: SHARE OWNERSHIP OF EXECUTIVE OFFICERS AND BOARD
MEMBERS………………………………………………………………………………………………………… 97
7) INFORMATION ABOUT SUBSIDIARIES AND ASSOCIATES ................................................................. 98
7) A) INFORMATION ABOUT SUBSIDIARIES AND ASSOCIATES: SUBSIDIARIES AND ASSOCIATES ... 98 7) B) INFORMATION ABOUT OTHER INVESTEES .......................................................................................... 122
8) INFORMATION ABOUT RELEVANT OR ESSENTIAL FACTS ............................................................. 126
9) SUMMARY OF COMMENTS AND PROPOSALS BY SHAREHOLDERS AND THE DIRECTORS’
COMMITTEE ....................................................................................................................................................... 131
10) FINANCIAL REPORTS ................................................................................................................................ 132
10) A) FINANCIAL REPORTS OF THE REPORTING ENTITY .......................................................................... 132 10) B) SUMMARY FINANCIAL STATEMENTS ................................................................................................. 367
11) RESPONSIBILITY STATEMENT ......................................................................................................... 403

2) IDENTIFICATION OF THE ENTITY
3
2) IDENTIFICATION OF THE ENTITY
2) A) IDENTIFICATION OF THE ENTITY: BASIC IDENTIFICATION
Company Name: Sociedad Química y Minera de Chile S.A.
Abbreviated Company Name: SQM
Legal Address: El Trovador 4285, Las Condes, Santiago, Chile
Chilean Taxpayer ID: 93.007.000-9
Type of Entity: Open stock corporation
2) B) IDENTIFICATION OF THE ENTITY: LEGAL CONSTITUTION
SQM was organized under the laws of the Republic of Chile. The Company was constituted by public
deed issued on June 17, 1968 by Mr. Sergio Rodríguez Garcés, Notary Public of Santiago. Its existence
was approved by Decree No. 1,164 of June 22, 1968, of the Ministry of Finance, and it was registered on
June 29, 1968, in the Business Registry of Santiago, on page 4,537 No. 1,992.
2) C) IDENTIFICATION OF THE ENTITY: CONTACT INFORMATION
Corporate Headquarters:
Address: El Trovador 4285, Las Condes, Santiago, Chile
Telephone: +56 2 24252000
Fax: +56 2 24252268
Website: www.sqm.com
To contact our investor relations team:
Gerardo Illanes
Vice President of Finance and Investor Relations
Telephone: +56 2 24252485
Kelly O’Brien
Head of Investor Relations
Telephone: +56 2 24252074
Irina Axenova
Investor Relations
Telephone: +56 2 24252280

3) DESCRIPTION OF BUSINESS ENVIRONMENT
4
3) DESCRIPTION OF BUSINESS ENVIRONMENT
3) A) DESCRIPTION OF BUSINESS ENVIRONMENT: HISTORICAL INFORMATION
Commercial exploitation of the caliche ore deposits in northern Chile began in the 1830s, when sodium
nitrate was extracted from the ore for use in the manufacturing of explosives and fertilizers. By the end
of the nineteenth century, nitrate production had become the leading industry in Chile, and the country
was the world’s leading supplier of nitrates. The accelerated commercial development of synthetic nitrates
in the 1920s and the global economic depression in the 1930s caused a serious contraction of the Chilean
nitrate business, which did not recover significantly until shortly before the Second World War. After the
war, the widespread commercial production of synthetic nitrates resulted in a further contraction of the
natural nitrate industry in Chile, which continued to operate at depressed levels into the 1960s.
We were formed in 1968 through a joint venture between Compañía Salitrera Anglo Lautaro S.A. (“Anglo
Lautaro”) and the Production Development Corporation (Corporación de Fomento de la Producción or
“Corfo”), a Chilean government entity. Three years after our formation, in 1971, Anglo Lautaro sold all
of its shares to Corfo, and we were wholly owned by the Chilean Government until 1983. In 1983, Corfo
began a process of privatization by selling our shares to the public and subsequently listing such shares
on the Santiago Stock Exchange. By 1988, all of our shares were publicly owned. Our Series B ADSs
have traded on the NYSE under the ticker symbol “SQM” since 1993. We accessed international capital
markets again for the issuance of additional ADSs in 1995 and 1999. On December 21, 2006, two groups
of shareholders, the “Pampa Group” (which includes the company Sociedad de Inversiones Pampa
Calichera S.A. and its related companies, Inversiones Global Mining Chile Limitada and Potasios de Chile
S.A.) and Kowa Group (which includes the companies Kowa Company Ltd., Inversiones La Esperanza
(Chile) Limitada, Kochi S.A and La Esperanza Delaware Corporation) signed a joint agreement and
became the controlling group of SQM.
Since our inception, we have produced nitrates and iodine, which are obtained from the caliche ore
deposits in northern Chile. In 1985, we began to use heap leaching processes to extract nitrates and iodine,
and in 1986 we started to produce potassium nitrate at our Coya Sur facility. Between 1994 and 1999, we
invested approximately US$300 million in the development of the Salar de Atacama project in northern
Chile, which enabled us to produce potassium chloride, lithium carbonate, potassium sulfate and boric
acid.
From 2000 through 2004, we principally consolidated the investments carried out in the preceding five
years. We focused on reducing costs and improving efficiencies throughout the organization. In addition,
in 2001, we signed a commercial distribution agreement with the Norwegian company Yara International
ASA, in order to take advantage of cost synergies in the Specialty Plant Nutrition business line.
Starting in 2005, we began strengthening our leadership position in our core businesses through a
combination of capital expenditures and advantageous acquisitions and divestitures. Our acquisitions have
included the Kemira Emirates Fertiliser Company (“Kefco”) in Dubai in 2005 and the iodine business of
Royal DSM N.V. (“DSM”) in 2006. We also entered into a number of joint ventures, including a joint
venture with Migao Corporation (“Migao”), signed in 2008, for the production of potassium nitrate, and
SQM VITAS, our joint venture with the French Roullier Group. Pursuant to the latter joint venture, in
2010, we launched a new line of soluble phosphate products, and in 2012 we built new plants for the
production of water-soluble fertilizers in Brazil (Candeias), Peru and South Africa (Durban). We have
also sold: (i) Fertilizantes Olmeca, our former Mexican subsidiary, in 2006, (ii) our stake in Impronta
S.R.L., our former Italian subsidiary, in 2007 and (iii) our former butyllithium plant located in Houston,
Texas, in 2008. These sales allowed us to concentrate our efforts on our core products.
The capital expenditure program has allowed us to add new products to our product lines and increase the
production capacity of our existing products. In 2005, we started production of lithium hydroxide at a

3) DESCRIPTION OF BUSINESS ENVIRONMENT
5
plant in the Salar del Carmen, near the city of Antofagasta in the north of Chile. In 2007, we completed
the construction of a new prilling and granulating plant. In 2011, we completed expansions of our lithium
carbonate capacity, achieving 48,000 metric tons of capacity per year. Since 2010, we have continued to
expand our production capacity of potassium products in our operations in the Salar de Atacama. In 2011,
we completed the construction of a new potassium nitrate facility in Coya Sur, increasing our overall
production capacity of potassium nitrate by 300,000 metric tons per year. In 2013, we completed
expansions in the production capacity of our iodine plants in Nueva Victoria. Our capital expenditure
program also includes exploration for metallic minerals. Our exploration efforts have led to discoveries
that in some cases may result in sales of the discovery and the generation of royalty income in the future.
Within this context, in 2013 we sold our royalty rights to the Antucoya mining project to Antofagasta
Minerals. In 2013 we also opened a trading office in Thailand.
In 2014, we invested in the development of new extraction sectors and production increases in both nitrates
and iodine at Nueva Victoria, reaching an approximate production capacity (including the Iris facility) of
8,500 metric tons per year of iodine at the facility. We also issued a bond in the international capital
markets for US$250 million, primarily to refinance existing indebtedness.
In 2015, we focused on increasing the efficiency of our operations. Within this context, we announced a
plan to restructure our iodine and nitrate operations. In an effort to take advantage of our highly efficient
production facilities at our Nueva Victoria site, we decided to suspend the mining and nitrate operations
and reduce iodine production at our Pedro de Valdivia site. During the year, we increased our iodine
production capacity at Nueva Victoria to approximately 9,000 metric tons per year.
In 2016, we entered into a 50/50 joint venture with Lithium Americas to develop the Caucharí-Olaroz
lithium project in the Jujuy province of Argentina. The project’s production capacity is targeted at 50,000
tons per year of lithium carbonate equivalent. Under the current project timeline, we expect to commission
plant production by 2019. We also made a capital contribution of US$20 million to Elemental Minerals
Limited (currently Kore Potash Limited), an Australian based company whose main assets are various
potassium deposits in the Republic of Congo. We invested approximately US$20 million in exchange for
18% of the company, and a right of first refusal for approximately 20% of the total potash production of
Kore Potash Limited. The State General Reserve Fund of Oman also contributed US$20 million.
In 2017, we continued to expand our operations outside Chile and, together with our subsidiary SQM
Australia Pty, acquired 50% of the assets of the Mount Holland lithium project in Western Australia,
Australia. We entered into a 50/50 joint venture with Kidman Resources Limited to develop mining
operations and construct concentration and refining plants to produce 40,000 metric tons per year of
lithium carbonate and lithium hydroxide, starting in 2021. Kidman Resources Limited will retain the
exclusive right to exploit gold within the project area. According to the agreement, SQM Australia Pty
committed to pay a price of US$35 million, of which US$10 million was paid by the end of 2017, leaving
the balance of US$25 million to be paid in 2018, subject to compliance with conditions established in the
agreement.

3) DESCRIPTION OF BUSINESS ENVIRONMENT
6
3) B) DESCRIPTION OF BUSINESS ENVIRONMENT: INDUSTRIAL SECTOR
i) PRODUCTS AND SERVICES
SQM is an integrated producer and seller of specialty plant nutrients, iodine, lithium, potassium fertilizers,
and industrial chemicals. Our products are based on the development of high quality natural resources that
make us a cost leader, supported by an international trading network specialized in sales in over 110
countries. SQM’s development strategy aims to maintain and enhance our global leadership in all of our
business lines.
For further information, see section 3) C) Description of Business Environment: Activities and Businesses.
ii) COMPETITION AND MARKET SHARE
See section 3) C) Description of Business Environment: Activities and Businesses.
iii) LEGAL FRAMEWORK
Government Regulations
Regulations in Chile Generally
We are subject to the full range of government regulations and supervision generally applicable to
companies engaged in business in Chile, including labor laws, social security laws, public health laws,
consumer protection laws, tax laws, environmental laws, free competition laws, securities laws and anti-
trust laws. These include regulations to ensure sanitary and safety conditions in manufacturing plants.
We conduct our mining operations pursuant to judicial exploration concessions and exploitation
concessions granted pursuant to applicable Chilean law. Exploitation concessions essentially grant a
perpetual right (with the exception of the Salar de Atacama rights, which have been leased to us until
2030) to conduct mining operations in the areas covered by such concessions, provided that annual
concession fees are paid. Exploration concessions permit us to explore for mineral resources on the land
covered thereby for a specified period of time, and to subsequently request a corresponding exploitation
concession.
Under Law No. 16,319 that created the Chilean Nuclear Energy Commission (Comisión Chilena de
Energía Nuclear or “CCHEN”), we have an obligation to the CCHEN regarding the exploitation and sale
of lithium from the Salar de Atacama, which prohibits the use of lithium for nuclear fusion. In addition,
CCHEN has imposed annual quotas that limit the total tonnage of lithium authorized to be sold.
We also hold water use rights granted by the respective administrative authorities and which enable us to
have a supply of water from rivers or wells near our production facilities sufficient to meet our current
operating requirements. See section 3) E) Description of Business Environment: Risk Factors. The Water
Code and related regulations are subject to changes, which could have a material adverse impact on our
business, financial condition and results of operations.
We operate port facilities at Tocopilla, Chile for the shipment of products and the delivery of raw materials
in conformity with maritime concessions, which have been granted by the respective administrative
authority. These concessions are normally renewable on application, provided that such facilities are used
as authorized and annual concession fees are paid.

3) DESCRIPTION OF BUSINESS ENVIRONMENT
7
The Chilean government may again decide to levy additional taxes on mining companies or other
corporations in Chile, and such taxes could have a material adverse impact on our business, financial
condition and results of operations.
There are currently no material legal or administrative proceedings pending against us except as discussed
in Note 19.1 to our Consolidated Financial Statements and below under “Safety, Health and Environmental
Regulations in Chile,” and we believe we are in compliance in all material respects with all applicable
statutory and administrative regulations with respect to our business.
Safety, Health and Environmental Regulations in Chile
Our operations in Chile are subject to both national and local regulations related to safety, health and
environmental protection. In Chile, the main regulations on these matters that are applicable to us are the
Mine Health and Safety Act of 1989 (Reglamento de Seguridad Minera or the “Mine Health and Safety
Act”), the Health Code (Código Sanitario), the Health and Basic Conditions Act of 1999 (Reglamento
sobre Condiciones Sanitarias y Ambientales Básicas en los Lugares de Trabajo or the “Health and Basic
Conditions Act”), the Subcontracting Law and the Environmental Law of 1994, amended in 2010 (Ley
sobre Bases Generales del Medio Ambiente or the “Environmental Law”).
Health and safety at work are fundamental aspects in the management of mining operations, which is why
we have made constant efforts to maintain good health and safety conditions for the people working at our
mining sites and facilities. In addition to the role played by us in this important matter, the Chilean
government has a regulatory role, enacting and enforcing regulations in order to protect and ensure the
health and safety of workers. The Chilean government, acting through the Ministry of Health and the
Sernageomin, performs health and safety inspections at the mining sites and oversees mining projects,
among other tasks, and it has exclusive powers to enforce standards related to environmental conditions
and the health and safety of the people performing activities related to mining.
The Mine Health and Safety Act protects workers and nearby communities against health and safety
hazards, and it provides for enforcement of the law where compliance has not been achieved. Our Internal
Mining Standards (Reglamentos Internos Mineros) establish our obligation to maintain a workplace where
safety and health risks are managed appropriately. We must comply with the general provisions of the
Health and Basic Conditions Act, our own internal standards and the provisions of the Mine Health and
Safety Act. In the event of non-compliance, the Ministry of Health and particularly the Sernageomin are
entitled to use their enforcement powers to ensure compliance with the law.
In November 2011, the Ministry of Mining enacted Law No. 20,551 that Regulates the Closure of Mining
Sites and Facilities (Ley que Regula el Cierre de Faenas e Instalaciones Mineras). This statute entered in
force in November 2012 and required all mining sites to present or update their closure plans as of
November 2014. SQM has fulfilled this requirement for all of its mining sites and facilities. The main
requirements of the law are related to disclosures to the Sernageomin regarding decommissioning plans
for each mining site and its facilities, along with the estimated cost to implement such plans. There is a
requirement to provide a form of financial assurance to the Sernageomin to ensure compliance with the
decommissioning plans. The mining site closure plans are approved by the Sernageomin, and the
corresponding financial assurances are subject to approval by the SVS. In both cases, SQM has respective
approvals and keeps up to date the respective assurances according to the useful life of each mining site.
We continuously monitor the impact of our operations on the environment and on the health of our
employees and other persons who may be affected by such operations. We have made modifications to
our facilities in an effort to eliminate any adverse impacts. Also, over time, new environmental standards
and regulations have been enacted, which have required minor adjustments or modifications of our
operations for full compliance. We anticipate that additional laws and regulations will be enacted over
time with respect to environmental matters. While we believe we will continue to be in compliance with

3) DESCRIPTION OF BUSINESS ENVIRONMENT
8
all applicable environmental regulations of which we are now aware, there can be no assurance that future
legislative or regulatory developments will not impose new restrictions on our operations. We are
committed to both complying with all applicable environmental regulations and to continuously improving
our environmental performance through our Environmental Management System (“EMS”), voluntary
evaluations, such as Ecovadis, and international certifications, such as the Responsible Conduct
certification from the Chilean Industrial Chemicals Association, which applies to our operations at Nueva
Victoria, and the Protect&Sustain certification from the International Fertilizer Association, which applies
to our operations at Coya Sur, the Salar de Atacama, Tocopilla, Antofagasta and Santiago.
We have submitted and will continue to submit several environmental impact assessment studies related
to our projects to the governmental authorities. We require the authorization of these submissions in order
to maintain and to increase our production capacity.
International Regulations
We employ our best efforts to ensure compliance with the complex regulatory environments in which it
operates.
The European Parliament approved a new regulatory proposal for fertilizers, which will be discussed
among the European Commission, the European Parliament and the Council of Member States of the
European Union during 2018, before the final approval of the regulations. Following this, there will be a
transition period for its implementation. The new European regulation proposes to reduce the maximum
content limit of perchlorates in inorganic fertilizer with macronutrients, such as the potassium nitrate sold
by us, to 0.005%. The fertilizers that we sell contain less than 0.005% of perchlorate. However, the Food
Chain Security unit of the General Health and Consumer Affairs Council initiated the revision of the
perchlorate limits in food that are currently in force and effect from July 2015, following the European
Food Safety Authority’s (“EFSA”) evaluation of human exposure to perchlorate in food and in drinkable
water. The definition of the new limits of perchlorates in food is being delayed and is expected to be
established by the end of 2018.
With respect to the regulation on explosives in Europe, the revision process was initiated by the European
Committee. We will continue to monitor the development of changes to the regulation through our
participation in the Potassium Nitrate Association as part of the public-private committee created by the
European Committee.
In January 2017, the modification of the Toxic Substances Control Act (“US-TSCA”) Chemical Substance
Import Certification Process Revisions by the Department of Homeland Security of the United States
became effective. This modification is related to the certification process of the compliance with US-
TSCA for the chemical substances imported into the United States. According to the modification, SQM
North America Corp. has to certify that each shipment of the chemical products imported to the United
States, complies with the regulations. To achieve that, all export documents for the products from SQM´s
headquarters to its subsidiaries in the United States were modified and the US-TSCA compliance
declarations were requested from external providers.
In August 2017, United States Environmental Protection Agency (“US-EPA”) published a TSCA
Inventory Notification (Active-Inactive) Requirements regulation under the US-TSCA which established
that SQM North America Corp. must provide information with respect to all chemical substances imported
to the United States during 2006-2016. We conducted a survey of all products imported to the United
States from our headquarters, affiliates and other suppliers during this period to prepare the information
per chemical substance to inform the US-EPA. This disclosure has to be made once but the information
will be kept on record for 5 years.

3) DESCRIPTION OF BUSINESS ENVIRONMENT
9
On November 22, 2016, Normative Instruction No. 45 became effective in Brazil, which defines
specification requirements, guarantees, product registration requirements, authorizations, packaging
requirements, labeling of fertilizer products, and tolerance of mineral fertilizers, among others; and the
changes defined for all exports from 2017. Normative Instruction No. 45 also defines changes to the
information presented for the new registration of products and for the renewal of existing registries, and
for the labels and certificates of already registered products, when applicable.
In May 2017, Resolution 0068 of the Ecuadorian Agribusiness Assurance Agency (AGROCALIDAD)
became effective in Ecuador. The resolution establishes the general regulations for the registration and
control of fertilizers. According to this regulation, SQM Ecuador S.A. must update all of its fertilizer
records within 2 years from the date of issue of each certificate on the record.
3) C) DESCRIPTION OF BUSINESS ENVIRONMENT: ACTIVITIES AND BUSINESSES
The Company
We believe that we are the world’s largest producer of potassium nitrate and iodine. We also produce
specialty plant nutrients, iodine derivatives, lithium and its derivatives, potassium chloride, potassium
sulfate and certain industrial chemicals (including industrial nitrates and solar salts). Our products are sold
in over 110 countries through our worldwide distribution network, with 93% of our sales in 2017 derived
from countries outside Chile.
Our products are mainly derived from mineral deposits found in northern Chile. We mine and process
caliche ore and brine deposits. The caliche ore in northern Chile contains the only known nitrate and iodine
deposits in the world and is the world’s largest commercially exploited source of natural nitrates. The
brine deposits of the Salar de Atacama, a salt-encrusted depression in the Atacama Desert in northern
Chile, contain high concentrations of lithium and potassium as well as significant concentrations of sulfate
and boron.
From our caliche ore deposits, we produce a wide range of nitrate-based products used for specialty plant
nutrients and industrial applications, as well as iodine and iodine derivatives. At the Salar de Atacama, we
extract brines rich in potassium, lithium, sulfate and boron in order to produce potassium chloride,
potassium sulfate, lithium solutions and bischofite (magnesium chloride). We produce lithium carbonate
and lithium hydroxide at our plant near the city of Antofagasta, Chile, from the solutions brought from the
Salar de Atacama.
Our products are divided into six categories: specialty plant nutrients; iodine and its derivatives; lithium
and its derivatives; potassium chloride and potassium sulfate; industrial chemicals and other commodity
fertilizers. Specialty plant nutrients are premium fertilizers that enable farmers to improve yields and the
quality of certain crops. Iodine and its derivatives are mainly used in the X-ray contrast media and biocides
industries and in the production of polarizing film, which is an important component in LCD screens.
Lithium and its derivatives are mainly used in batteries, greases and frits for production of ceramics.
Potassium chloride is a commodity fertilizer that is produced and sold by us worldwide. Potassium sulfate
is a specialty fertilizer used primarily in crops such as vegetables, fruits and industrial crops. Industrial
chemicals have a wide range of applications in certain chemical processes such as the manufacturing of
glass, explosives and ceramics, and, more recently, industrial nitrates are being used in concentrated solar
power plants as a means for energy storage. In addition, we complement our portfolio of plant nutrients
through the buying and selling of other commodity fertilizers for use mainly in Chile.
For the year ended December 31, 2017, we had revenues of US$2,157.3 million, gross profit of US$762.5
million and profit attributable to controlling interests of US$427.7 million. Our worldwide market
capitalization as of December 31, 2017 was approximately US$15.4 billion.

3) DESCRIPTION OF BUSINESS ENVIRONMENT
10
Specialty Plant Nutrition: We produce four main types of specialty plant nutrients: potassium nitrate,
sodium nitrate, sodium potassium nitrate and specialty blends. Furthermore, we sell other specialty
fertilizers including trading of third party products. All of these specialty plant nutrients are used in either
solid or liquid form mainly on high value crops such as vegetables, fruits and flowers. They are widely
used in crops that employ modern agricultural techniques such as hydroponics, greenhousing, fertigation
(where fertilizer is dissolved in water prior to irrigation) and foliar application. According to the type of
use or application, our products are primarily marketed under the following brands: Ultrasol™
(fertigation), Qrop™ (open field application), Speedfol™ (foliar application) and Allganic™ (organic
farming). Specialty plant nutrients have certain advantages over commodity fertilizers, such as rapid and
effective absorption (without requiring nitrification), superior water solubility, increased soil pH (which
reduces soil acidity) and low chloride content. One of the most important products in this business line is
potassium nitrate, which is available in crystalline and prill form, allowing for multiple application
methods. Crystalline potassium nitrate products are ideal for application by fertigation and foliar sprays,
and potassium nitrate prills are suitable for soil applications.
The new needs of more sophisticated customers demand that the industry provide integrated solutions
rather than individual products. Our products, including customized specialty blends that meet specific
needs along with the agronomic service provided, allow to create plant nutrition solutions that add value
to crops through higher yields and better quality production. Because our products are derived from
natural nitrate compounds or natural potassium brines, they have certain advantages over synthetically
produced fertilizers, including the presence of certain beneficial trace elements, which makes them more
attractive to customers who prefer products of natural origin. As a result, specialty plant nutrients are sold
at a premium price compared to commodity fertilizers.
Iodine and its Derivatives: We believe that we are the world’s leading producer of iodine and iodine
derivatives, which are used in a wide range of medical, pharmaceutical, agricultural and industrial
applications, including x-ray contrast media, polarizing films for LCD/LED, antiseptics, biocides and
disinfectants, in the synthesis of pharmaceuticals, electronics, pigments and dye components. We market
iodine using the brand QIodine™.
Lithium and its Derivatives: We are a leading producer of lithium carbonate, which is used in a variety of
applications, including electrochemical materials for batteries, frits for the ceramic and enamel industries,
heat-resistant glass (ceramic glass), air conditioning chemicals, continuous casting powder for steel
extrusion, primary aluminum smelting process, pharmaceuticals and lithium derivatives. We are also a
leading supplier of lithium hydroxide, which is primarily used as an input for the lubricating greases
industry and for certain cathodes for batteries. We market lithium using the following brands:
QLithiumCarbonate™, QLithiumHydroxide™ and QLubelith™.
Potassium: We produce potassium chloride and potassium sulfate from brines extracted from the Salar de
Atacama. Potassium chloride is a commodity fertilizer used to fertilize a variety of crops including corn,
rice, sugar, soybean and wheat. Potassium sulfate is a specialty fertilizer used mainly in crops such as
vegetables, fruits and industrial crops. We market potassium chloride using the brand Qrop™ MOP.
Industrial Chemicals: We produce three industrial chemicals: sodium nitrate, potassium nitrate and
potassium chloride. Sodium nitrate is used primarily in the production of glass, explosives, charcoal
briquettes and metal treatment. Potassium nitrate is used in the manufacturing of specialty glass, and it is
also an important raw material for the production of frits for the ceramics and enamel industries. Solar
salts, a combination of potassium nitrate and sodium nitrate, are used as a thermal storage medium in
concentrated solar power plants. Potassium chloride is used as an additive in oil drilling as well as in
carrageenan production. We market our industrial chemicals using the following brands:
QSodiumNitrate™, QPotassiumNitrate™, QPotassiumChloride™.
3) DESCRIPTION OF BUSINESS ENVIRONMENT
11
Other Products and Services: We also sell other fertilizers and blends, some of which we do not produce.
We are the only company that produces and distributes the three main potassium sources: potassium
nitrate, potassium sulfate and potassium chloride.
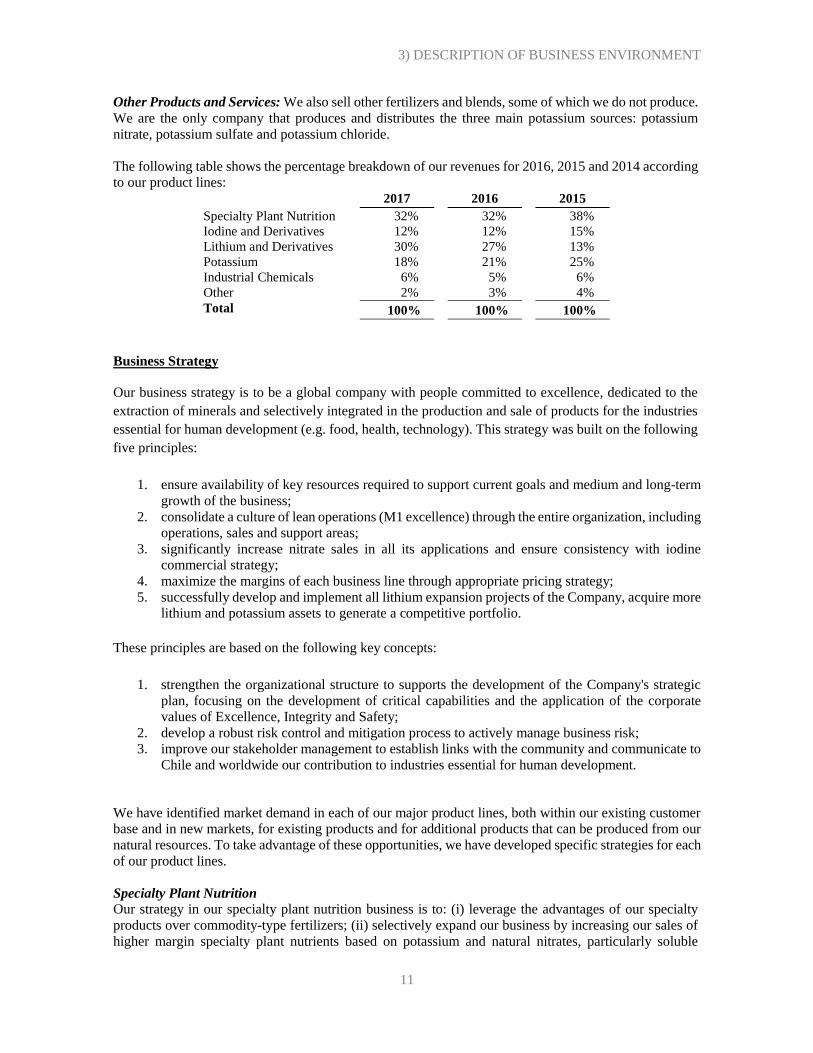
The following table shows the percentage breakdown of our revenues for 2016, 2015 and 2014 according
to our product lines: 2017 2016 2015
Specialty Plant Nutrition 32% 32% 38%
Iodine and Derivatives 12% 12% 15%
Lithium and Derivatives 30% 27% 13%
Potassium 18% 21% 25%
Industrial Chemicals 6% 5% 6%
Other 2% 3% 4%
Total 100% 100% 100%
Business Strategy
Our business strategy is to be a global company with people committed to excellence, dedicated to the
extraction of minerals and selectively integrated in the production and sale of products for the industries
essential for human development (e.g. food, health, technology). This strategy was built on the following
five principles:
1. ensure availability of key resources required to support current goals and medium and long-term
growth of the business;
2. consolidate a culture of lean operations (M1 excellence) through the entire organization, including
operations, sales and support areas;
3. significantly increase nitrate sales in all its applications and ensure consistency with iodine
commercial strategy;
4. maximize the margins of each business line through appropriate pricing strategy;
5. successfully develop and implement all lithium expansion projects of the Company, acquire more
lithium and potassium assets to generate a competitive portfolio.
These principles are based on the following key concepts:
1. strengthen the organizational structure to supports the development of the Company's strategic
plan, focusing on the development of critical capabilities and the application of the corporate
values of Excellence, Integrity and Safety;
2. develop a robust risk control and mitigation process to actively manage business risk;
3. improve our stakeholder management to establish links with the community and communicate to
Chile and worldwide our contribution to industries essential for human development.
We have identified market demand in each of our major product lines, both within our existing customer
base and in new markets, for existing products and for additional products that can be produced from our
natural resources. To take advantage of these opportunities, we have developed specific strategies for each
of our product lines.
Specialty Plant Nutrition Our strategy in our specialty plant nutrition business is to: (i) leverage the advantages of our specialty
products over commodity-type fertilizers; (ii) selectively expand our business by increasing our sales of
higher margin specialty plant nutrients based on potassium and natural nitrates, particularly soluble

3) DESCRIPTION OF BUSINESS ENVIRONMENT
12
potassium nitrate and NPK blends; (iii) pursue investment opportunities in complementary businesses to
enhance our product portfolio, increase production, reduce costs, and add value to the marketing of our
products; (iv) develop new specialty nutrient blends produced in our mixing plants that are strategically
located in or near our principal markets in order to meet specific customer needs; (v) focus primarily on
the markets where we can sell our plant nutrients in soluble and foliar applications in order to establish a
leadership position; (vi) further develop our global distribution and marketing system directly and through
strategic alliances with other producers and global or local distributors; (vii) reduce our production costs
through improved processes and higher labor productivity so as to compete more effectively and (viii)
supply a product with consistent quality according to the specific requirements of our customers.
Iodine and its Derivatives Our strategy in our iodine business is to: (i) reach and maintain our market share of approximately one
third of the iodine market in order to optimize the use of our available production capacity; (ii) encourage
demand growth and promote new iodine uses; (iii) participate in iodine recycling projects through the
Ajay-SQM Group (“ASG”); (iv) reduce our production costs through improved processes and higher
productivity in order to compete more effectively and (v) supply a product with consistent quality
according to the requirements of our customers.
Lithium and its Derivatives
Our strategy in our lithium business is to: (i) strategically allocate our sales of lithium carbonate and
lithium hydroxide; (ii) encourage demand growth and promote new lithium uses; (iii) selectively pursue
opportunities in the lithium derivatives business by creating new lithium compounds; (iv) reduce our
production costs through improved processes and higher productivity in order to compete more
effectively; (v) supply a product with consistent quality according to the requirements of our customers
and (vi) diversify our operations geographically and jurisdictionally.
Potassium
Our strategy in our potassium business is to: (i) offer a portfolio of potassium products, including
potassium sulfate, potassium chloride and other fertilizers, to our traditional markets; (ii) have flexibility
to offer crystalized (standard) or granular (compacted) form products according to market requirements;
(iii) focus on markets where we have logistical advantages and synergies with our specialty plant nutrition
business and (iv) supply a product with consistent quality according to the specific requirements of our
customers.
Industrial Chemicals
Our strategy in our industrial chemical business is to: (i) maintain our leadership position in the industrial
nitrates market as well as increase our supply of potassium chloride in markets where we have natural
advantages; (ii) encourage demand growth in different applications; (iii) become a long-term, reliable
supplier for the thermal storage industry, maintaining close relationships with R&D programs; (iv) reduce
our production costs through improved processes and higher productivity in order to compete more
effectively and (v) supply a product with consistent quality according to the requirements of our customers.
New Business Ventures
We always evaluate opportunities to expand in our current core businesses or within new businesses in
which we believe we may have sustainable competitive advantages, both within and outside Chile, and we
expect to continue to do so in the future.
We are continuously exploring the possibility of acquiring controlling stakes or other interests in
companies that have mining properties in our core business areas and are in early stages of development.
Consistent with our business strategy, we will continue to evaluate acquisitions, joint ventures and
alliances in our core businesses and, depending on all facts and circumstances, may seek to acquire
controlling stakes or other interests related to our core businesses both inside and outside of Chile,
including other emerging markets.

3) DESCRIPTION OF BUSINESS ENVIRONMENT
13
In addition, we are actively conducting exploration for metallic minerals in the mining properties we own.
If such minerals are found, we may decide to exploit, sell or enter into an association to extract these
resources. Our exploration efforts are focused on the layer of bedrock that lies beneath the caliche ore that
we use as the primary raw material in the production of iodine and nitrates. This bedrock has significant
potential for metallic mineralization, particularly copper and gold. A significant portion of our mining
properties are located in the Antofagasta Region of Chile, where many large copper producers operate.
We have an in-house geological exploration team that explores the area directly, drilling targets and
assessing new prospects. In 2017, the team identified 13 new targets and confirmed mineralization in four
of the targets, using its own truck-mounted drill rigs. The number of perforated meters reached 28,000
meters, and were made with three machines of which two were internal and the other external. We also
have a metal business development team that works to engage partners interested in investing in metal
exploration within our mining properties. As of December 31, 2017, we had ten option agreements in place
with seven companies, including small junior mining companies, private equity firms and large mining
companies.
Main Business Lines
Specialty Plant Nutrition
We believe that we are the world’s largest producer of potassium nitrate. We estimate that our sales
accounted for approximately 54% of global potassium nitrate sales for all applications by volume in
2017, an increase from 44% in 2016. During 2017, the potassium nitrate market increased by
approximately 4%. These estimates do not include potassium nitrate produced and sold locally in China,
only Chinese net imports and exports.
In addition to potassium nitrate, we produce the following specialty plant nutrients: sodium nitrate,
sodium potassium nitrate and specialty blends (containing various combinations of nitrogen, phosphate
and potassium and generally known as “NPK blends”).
Our specialty plant nutrients have specific characteristics that increase productivity and enhance quality
when used on certain crops and soils. Our specialty plant nutrients have significant advantages for
certain applications over commodity fertilizers based on nitrogen and potassium, such as urea and
potassium chloride.
Our specialty plant nutrients advantages are:
fully water soluble, allowing their more efficient use in hydroponics, fertigation, foliar
applications and other advanced agricultural techniques;
improve the water use efficiency of crops and help conserve water;
chloride-free, which prevents chloride toxicity in certain crops associated with high levels of
chlorine in plant nutrients;
provide nitrogen in nitric form, thereby allowing crops to absorb nutrients faster than they absorb
urea or ammonium-based fertilizers;
do not release hydrogen after application, thereby avoiding increased soil acidity;
possess trace elements, which promote disease resistance in plants and
more attractive to customers who prefer products of natural origin.
In 2017, our specialty plant nutrients revenues increased to US$697.3 million, representing 32% of our
total revenues for that year and a 11.8% increase from US$623.9 million in specialty plant nutrients revenues in 2016. Prices decreased approximately 2.7% in 2017.

3) DESCRIPTION OF BUSINESS ENVIRONMENT
14
Specialty Plant Nutrition: Market
The target market for our specialty plant nutrients includes producers of high-value crops such as
vegetables, fruits, industrial crops, flowers, cotton and others. Furthermore, we sell specialty plant
nutrients to producers of chloride-sensitive crops. Since 1990, the international market for specialty plant
nutrients has grown at a faster rate than the international market for commodity-type fertilizers. This is
mostly due to: (i) the application of new agricultural technologies such as fertigation and hydroponics, and
the increasing use of greenhouses; (ii) the increase in the cost of land and the scarcity of water, which has
forced farmers to improve their yields and reduce water use; and (iii) the increase in demand for higher
quality crops, such as fruits and vegetables.
Over the last ten years, the compound annual growth rate for vegetable production per capita was 3%
while the compound annual growth rate for the world population was closer to 1%.
Worldwide scarcity of water and arable land drives the development of new agricultural techniques to
maximize the use of these resources. Irrigation has grown at an average annual rate of 1% during the last
20 years (a pace similar to population growth). However, microirrigation has grown at 10% per year over
the same period. Microirrigation systems, which include drip irrigation and micro-sprinklers, are the most
efficient forms of technical irrigation. These applications require fully water-soluble plant nutrients. Our
nitrate-based specialty plant nutrients are fully soluble in water and provide nitrogen in nitric form, which
helps crops absorb these nutrients faster than they absorb urea- or ammonium-based fertilizers, facilitating
a more efficient application of nutrients to the plant and thereby increasing the crop’s yield and improving
its quality.
The ratio of microirrigation to total irrigated hectares in Asia is approximately 3%, the lowest ratio of any
region in the world. This represents a high potential for microirrigation, which is reflected in the high
growth rates in Asia in recent years.
Potassium nitrate in China is an important market, although currently its demand is largely fulfilled by
domestic producers. Demand totals approximately 400,000 to 420,000 metric tons, of which
approximately 130,000 is related to the tobacco industry and approximately 120,000 is related to the
horticulture business. Of the total, between 20,000 and 30,000 metric tons are imports.
Specialty Plant Nutrition: Our Products
Potassium nitrate, sodium potassium nitrate and specialty blends are higher margin products derived from,
or consisting of, sodium nitrate, and they are all produced in crystallized or prilled form. Specialty blends
are produced using our own specialty plant nutrients and other components at blending plants operated by
us or our affiliates and related companies in Chile, the United States, Mexico, the United Arab Emirates,
South Africa, Turkey, China, India, Thailand, Brazil, Spain, the Netherlands and Peru.
The following table shows our sales volumes of and revenues from specialty plant nutrients for 2017, 2016
and 2015: 2017 2016 2015
Sales volumes (Th. MT)
Sodium nitrate 26.7 24.4 26.0
Potassium nitrate and sodium potassium
nitrate
601.4 475.8 493.6
Specialty blends(1) 209.0 213.5 203.9
Other specialty plant nutrients(2) 129.1 127.2 108.4
Revenues (in US$ millions)
697.3
623.9
652.3

3) DESCRIPTION OF BUSINESS ENVIRONMENT
15
(1) Includes Yara’s products sold pursuant to our commercial agreement.
(2) Includes trading of other specialty fertilizers.
Depending on the systems used to apply specialty nutrients, fertilizers can be classified as specialty field
fertilizers or water-soluble fertilizers.
Specialty field fertilizers are applied directly to the soil, manually or in a mechanized fashion. Their high
solubility levels, lack of chlorine and absence of acidic reactions make them particularly advantageous for
tobacco, potatoes, coffee, cotton and a wide range of fruits and vegetables.
Water-soluble fertilizers are specialty nutrients that are delivered to the crops using modern irrigation
systems. As these systems feature refined technology, the products used in them must be highly soluble,
rich in nutrients, free of impurities and insoluble substances, and with a low salinity index. The leading
nutrient in this segment is potassium nitrate, whose optimal balance of nitric nitrogen and chlorine-free
potassium (the two macronutrients most needed by plants) make it an indispensable source of nutrition for
crops that use modern irrigation systems.
Potassium nitrate is widely known to be a vital component in foliar feeding applications, where usage is
recommended in order to stave off nutritional deficiencies before the first symptoms appear, correct any
deficiencies that arise and prevent physiological stress. This nutrient also helps promote a suitable balance
between fruit production and/or growth, and plant development, particularly in crops with physiological
disorders.
Foliar feeding with potassium nitrate can have beneficial effects:
when soil chemistry limits nutrient solubility and availability (pH, organic matter, type and
percentage of clay);
when nutrient absorption through the roots is limited as a result of conditions that hamper
root growth (temperature, moisture, oxygen and loss of soil structure);
when the plant’s local internal demand may surpass real internal nutrient redistribution
capacity, leaving the demand unsatisfied;
when nutrient mobility is limited, when plants flower before the leaf growth phase, imposing
limiting factors on xylem nutrient transport and
to achieve rapid recovery from leaf stress caused by climatic conditions, soil conditions and
irrigation management.
Another benefit of our potassium nitrate is that, according to a 2014 study by the consulting firm Arthur
D. Little Benelux, our production process generates up to 40% less greenhouse gases when compared to
that of the other major potassium nitrate producers in the world.
In addition to these products, SQM has consolidated a product portfolio of over 200 specialty fertilizer
blends, including top brands such as UltrasolTM, for fertigation; QropTM, for application to the soil;
SpeedfolTM, for foliar feeding and AllganicTM, for organic crops.
QropTMKS was added to our portfolio of specialty field fertilizers in 2015. This product was developed
by our research and development team and is an improvement to existing products. It is more physically
stable and is not required to be transported as hazardous cargo, which means it can be sold in other
markets.
During 2017 we worked on the restructuring of the Qrop products portfolio: chlorine-free line for direct
application to the soil with a variety of specialized formulas and unique mixtures, which make these
products highly accurate and quickly available for the plant.

3) DESCRIPTION OF BUSINESS ENVIRONMENT
16
Specialty Plant Nutrition: Marketing and Customers
In 2017, we sold our specialty plant nutrients in approximately 99 countries and to more than 700
customers. One customer represented more than 10% of our specialty plant nutrition revenues during 2017,
representing approximately 25% of our total specialty plant nutrition revenues, and our ten largest
customers accounted in the aggregate for approximately 50% of revenues during that period. No supplier
accounted for more than 10% of the costs of sales for this business line.
The table below shows the geographical breakdown of our revenues:
Revenues Breakdown 2017 2016 2015
North America 33% 33% 33%
Europe 25% 18% 22%
Central and South America 10% 11% 28%
Asia and Others 31% 37% 16%
We sell our specialty plant nutrition products outside Chile mainly through our own worldwide network
of representative offices and through our distribution affiliates.
We maintain stocks of our specialty plant nutrients in the main markets of the Americas, Asia, Europe,
the Middle East and Africa in order to facilitate prompt deliveries to customers. In addition, we sell
specialty plant nutrients directly to some of our large customers. Sales are made pursuant to spot purchase
orders and short-term contracts.
As part of our marketing strategy, we provide technical and agronomical assistance and support to our
clients. We have specific knowledge resulting from extensive research and numerous studies conducted
by our agronomical teams in close contact with producers throughout the world. The solid agronomical
knowledge is key for the development of specific formulas and hydroponic and fertirrigation nutritional
plans, which allows us to provide expert advice for producing crops that meet high quality standards for
the most efficient markets and in the most environmentally challenging conditions.
By working closely with our customers, we are able to identify their needs for new products and a possible
existence of higher-value-added markets. Our specialty plant nutrients are used on a wide variety of crops,
particularly value-added crops, where the use of our products enables our customers to increase yields and
achieve a premium price for their own products.
Our customers are located in both the northern and southern hemispheres. Consequently, we do not believe
there are any seasonal or cyclical factors that can materially affect the sales of our specialty plant nutrients.
Specialty Plant Nutrition: Joint Ventures and Agreements
Consistent with our business strategy, we regularly evaluate opportunities to expand in our current core
businesses, including our specialty plant nutrition business, or within new businesses in which we believe
we may have sustainable competitive advantages. We evaluate potential acquisitions, joint ventures and
alliances with companies both within and outside of Chile, including in other emerging markets.
In May 2008, we signed a joint venture agreement with Migao Corporation (“Migao”) for the production
and distribution of specialty plant nutrients in China. Through the joint venture, we constructed a
potassium nitrate plant with a production capacity of 40,000 metric tons per year. The plant began operating in January 2011, and has allowed us to increase our presence in China, which is one of the most
important and fastest growing markets for the fertilizer industry.

3) DESCRIPTION OF BUSINESS ENVIRONMENT
17
In May 2009, our subsidiary Soquimich European Holdings entered into an agreement with Coromandel
Fertilizers Ltd. to create a joint venture for the production and distribution of water soluble fertilizers in
India. The agreement established a 50⁄50 contribution to the joint venture. As part of the agreement, a new
15,000 metric ton facility was constructed in the city of Kakinada to produce water soluble NPK grade
fertilizers. This new facility began operating in January 2012.
In December 2009, we signed an agreement with the French Roullier Group to form the joint venture SQM
Vitas. This agreement joins two of the largest companies in the businesses of specialty plant nutrition,
specialty animal nutrition and professional hygiene. Peru, Brazil and South Africa are the main focus
markets of this joint venture, and Dubai is the main productive unit. As part of the agreement, our
phosphate plant located in Dubai became part of this joint venture.
Between 2010 and 2012, we continued to expand our production capacity of potassium products in our
operations in the Salar de Atacama. In 2011, we completed the construction of a new potassium nitrate
facility in Coya Sur, increasing our overall production capacity of potassium nitrate by 300,000 metric
tons.
In 2012, SQM Vitas started the construction of new plants in Brazil (Candeias), Peru and South Africa
(Durban) for the production of water soluble fertilizers containing different relative amounts of nitrogen,
phosphorus and potassium, and at times, smaller amounts of other chemicals. The Candeias Industrial
Complex plant in Brazil began operating in March 2012 and has a production capacity of 25,000 metric
tons per year.
In 2013, the operations of SQM Vitas in Spain began with a water soluble NPK fertilizer plant that has a
production capacity of 15,000 metric tons per year.
During 2013, the marketing activities of our joint venture with Migao integrated in SQM (Beijing). This
change aims to enhance the efficiency of distribution channels for fertilizer products by consolidating
marketing into a unified brand and management team, thus reducing costs. In addition, our strategy in this
segment is to increase production of water soluble fertilizers and extend our technologies and their
applications in order to increase popularity and expand the use of these products.
In 2015, the asset transfer agreement, that was signed in December 2014 between Plantacote BV and
Plantacote NV, entered into effect. As a result of this agreement, the business and Plantacote® brand were
transferred to the new company Plantacote NV, but with no changes to the business or the Controlled
Release Fertilizer project. SQM continues to hold a 50% ownership stake in the company.
In 2015, SQM Vitas South Africa was acquired by Roulliers. As a result, Roullier manages the operations,
and the production facilities are owned by SQM.
In 2016, we began operating soluble specialty plant nutrient production facilities through our joint ventures
in Peru and the Netherlands, and a third facility in Mexico. In addition, a new logistics terminal was opened
in the port of Terneuzen in the Netherlands.
In 2017, two new offices started their operations in Imbituba and Sao Paulo, Brazil.
Specialty Plant Nutrition: Fertilizer Sales in Chile
We market specialty plant nutrients in Chile through our subsidiary Soquimich Comercial S.A. (“SQMC”).
SQMC is currently one of the main players in the Chilean market, offering a wide range of products
developed specifically for crops grown in the country. As specialty plant nutrients have differentiating
qualities with respect to traditional fertilizers, they play a key role in this market.

3) DESCRIPTION OF BUSINESS ENVIRONMENT
18
SQMC sells local products as well as products imported from different countries around the world.
All contracts and agreements between SQMC and its foreign suppliers of fertilizers generally contain
standard and customary commercial terms and conditions. SQMC has been able to obtain adequate
supplies of these products with good pricing conditions.
SQMC’s fertilizer sales represented approximately 24% of total fertilizer sales in Chile during 2017. No
customer accounted for more than 10% of SQMC’s revenues in 2017. SQMC’s consolidated revenues
were approximately US$133 million and US$150 million in 2017 and 2016, respectively.
Specialty Plant Nutrition: Competition
The principal means of competition in the sale of potassium nitrate are product quality, customer service,
location, logistics, agronomic expertise and price.
We believe that we are the world’s largest producer of sodium nitrate and potassium nitrate for agricultural
use. Our sodium nitrate products compete indirectly with specialty and commodity-type substitutes, which
may be used by some customers instead of sodium nitrate depending on the type of soil and crop to which
the product will be applied. Such substitute products include calcium nitrate, ammonium nitrate and
calcium ammonium nitrate.
In the potassium nitrate market our largest competitor is Haifa Chemicals Ltd. (“Haifa”), in Israel, which
is a subsidiary of Trans Resources International Inc. We estimate that sales of potassium nitrate by Haifa
accounted for approximately 18% of total world sales during 2017 (excluding sales by Chinese producers
to the domestic Chinese market). Haifa Chemicals had production issues during 2017 and is currently
operating at its 50% capacity (one plant). Our sales accounted for approximately 54% of global potassium
nitrate sales by volume for the period.
ACF, another Chilean producer, mainly oriented to iodine production, has produced potassium nitrate
from caliche ore and potassium chloride since 2005. Kemapco, a Jordanian producer owned by Arab
Potash, produces potassium nitrate in a plant located close to the Port of Aqaba, Jordan. In addition, there
are several potassium nitrate producers in China, the largest of which are Yuantong and Migao. Most of
the Chinese production is consumed by the Chinese domestic market.
In Chile, our products mainly compete with imported fertilizer blends that use calcium ammonium nitrate
or potassium magnesium sulfate. Our specialty plant nutrients also compete indirectly with lower-priced
synthetic commodity-type fertilizers such as ammonia and urea, which are produced by many producers
in a highly price-competitive market. Our products compete on the basis of advantages that make them
more suitable for certain applications as described above.

3) DESCRIPTION OF BUSINESS ENVIRONMENT
19
Iodine and its Derivatives
We believe that we are the world’s largest producer of iodine. In 2017, our revenues from iodine and
iodine derivatives amounted to US$252.1 million, representing 12% of our total revenues in that year. We
estimate that our sales accounted for approximately 35% of world iodine sales by volume in 2017.
Iodine: Market
Iodine and iodine derivatives are used in a wide range of medical, agricultural and industrial applications
as well as in human and animal nutrition products. Iodine and iodine derivatives are used as raw materials
or catalysts in the formulation of products such as X-ray contrast media, biocides, antiseptics and
disinfectants, pharmaceutical intermediates, polarizing films for LCD and LED screens, chemicals,
organic compounds and pigments. Iodine is also added in the form of potassium iodate or potassium iodide
to edible salt to prevent iodine deficiency disorders.
X-ray contrast media is the leading application of iodine, accounting for approximately 23% of demand.
Iodine’s high atomic number and density make it ideally suited for this application, as its presence in the
body can help to increase contrast between tissues, organs, and blood vessels with similar X-ray densities.
Other applications include pharmaceuticals, which we believe account for 13% of demand; LCD and LED
screens, 12%; iodophors and povidone-iodine, 9%; animal nutrition, 8%; fluoride derivatives, 7%;
biocides, 5%; nylon, 4%; human nutrition, 3% and other applications, 16%.
During 2017, iodine demand grew at a higher rate than seen in 2016. Although more traditional uses grew
at the same rate as during the previous year, new applications in the specialty plastics and carbon energy
plants emission control industries resulted in market demand. We estimate that the global market size in
2017 was approximately 35,300 metric tons, with approximately 59% of supply coming from Chilean
producers, including us.
Iodine: Our Products
We produce iodine in our Nueva Victoria plant, near Iquique, and our Pedro de Valdivia plant, close to
María Elena. We have a total effective production capacity of approximately 11,000 metric tons per year
of iodine, including the Iris plant, which is located close to the Nueva Victoria plant.
Through ASG, we produce organic and inorganic iodine derivatives. ASG was established in the mid-
1990s and has production plants in the United States, Chile and France. ASG is the world’s leading
inorganic and organic iodine derivatives producer.
Consistent with our business strategy, we are constantly working on the development of new applications
for our iodine-based products, pursuing a continuing expansion of our businesses and maintaining our
market leadership.
We manufacture our iodine and iodine derivatives in accordance with international quality standards and
have qualified our iodine facilities and production processes under the ISO-9001:2008 program, providing
third party certification of the quality management system and international quality control standards that
we have implemented.
The following table shows our total sales volumes and revenues from iodine and iodine derivatives for
2017, 2016 and 2015:
2017 2016 2015
Sales volumes (Th. MT)
Iodine and derivatives 12.7 10.2 9.3
Revenues (in US$ millions) 252.1 231.1 262.6

3) DESCRIPTION OF BUSINESS ENVIRONMENT
20
Our revenues increased to US$252.1 million in 2017 from US$231.1 million in 2016. This increase was
primarily attributable to the increase in iodine sales volume during 2017. Average iodine prices were more
than 12% lower in 2017 than in 2016. Our sales volumes increased 24% in 2017, outpacing global iodine
demand growth.
Iodine: Marketing and Customers
In 2017, we sold our iodine products in approximately 52 countries to approximately 287 customers, and
most of our sales were exports. Three customers each accounted for more than 10% of our iodine revenues
in 2017. These three customers accounted for approximately 43% of revenues, and our ten largest
customers accounted in the aggregate for approximately 77% of revenues. No supplier accounted for more
than 10% of the cost of sales of this business line.
The following table shows the geographical breakdown of our revenues:
Sales Breakdown 2017 2016 2015
North America 25% 25% 29%
Europe 31% 36% 34%
Central and South America 0% 0% 4%
Asia and Others 43% 38% 33%
We sell iodine through our own worldwide network of representative offices and through our sales, support
and distribution affiliates. We maintain inventories of iodine at our facilities throughout the world to
facilitate prompt delivery to customers. Iodine sales are made pursuant to spot purchase orders or within
the framework of supply agreements. Supply agreements generally specify annual minimum and
maximum purchase commitments, and prices are adjusted periodically, according to prevailing market
prices.
Iodine: Competition
The world’s main iodine producers are based in Chile, Japan and the United States. Iodine is also produced
in Russia, Turkmenistan, Azerbaijan, Indonesia and China.
Iodine is produced in Chile using a unique mineral known as caliche ore, whereas in Japan, the United
States, Russia, Turkmenistan, Azerbaijan, and Indonesia, producers extract iodine from underground
brines that are mainly obtained together with the extraction of natural gas and petroleum. In China, iodine
is extracted from seaweed.
Five Chilean companies accounted for approximately 59% of total global sales of iodine in 2017, including
SQM, with approximately 35%, and four other producers, accounting for the remaining 24%. The other
Chilean producers are: Atacama Chemical S.A. (Cosayach), controlled by the Chilean holding Inverraz
S.A.; ACF Minera S.A. owned by the Chilean family Urruticoechea; Algorta Norte S.A., a joint venture
between ACF Minera S.A. and Toyota Tsusho; and Atacama Minerals, recently acquired by Chinese
company Tewoo.
We estimate that eight Japanese iodine producers accounted for approximately 28% of global iodine sales
in 2017, including recycled iodine.
We estimate that iodine producers in the United States (one of which is owned by Toyota Tsusho and
another is owned by Ise Chemicals Ltd., both of which are Japanese companies) accounted for nearly 5%
of world iodine sales in 2017.

3) DESCRIPTION OF BUSINESS ENVIRONMENT
21
Iodine recycling is a growing trend worldwide. Several producers have recycling facilities where they
recover iodine and iodine derivatives from iodine waste streams. Iodine recycling, mainly related to LCD
and LED consumption, has reduced during the past year and currently represents approximately 17% of
world iodine sales. It is estimated that approximately 70% of total world iodine recycling was done by
Japanese iodine producers.
Through ASG or alone, we are also actively participating in the iodine recycling business using iodinated
side-streams from a variety of chemical processes in Europe and the United States.
The prices of iodine and iodine derivative products are determined by market conditions. World iodine
prices vary depending upon, among other things, the relationship between supply and demand at any given
time. Iodine supply varies primarily as a result of the production levels of the iodine producers (including
us) and their respective business strategies. Our annual average iodine sales prices decreased to
approximately US$20 per kilogram in 2017, continuing the downward trend observed in 2016. However,
we believe that 2018 presents better price prospects.
Demand for iodine varies depending upon overall levels of economic activity and the level of demand in
the medical, pharmaceutical, industrial and other sectors that are the main users of iodine and iodine-
derivative products. Certain substitutes for iodine are available for certain applications, such as antiseptics
and disinfectants, which could represent a cost-effective alternative to iodine depending on prevailing
prices.
The main factors of competition in the sale of iodine and iodine derivative products are reliability, price,
quality, customer service and the price and availability of substitutes. We believe we have competitive
advantages compared to other producers due to the size and quality of our mining reserves and the
available production capacity. We believe our iodine is competitive with that produced by other
manufacturers in certain advanced industrial processes. We also believe we benefit competitively from the
long-term relationships we have established with our largest customers.
Lithium and its Derivatives
We believe we are one of the world’s largest producers of lithium carbonate and lithium hydroxide. In
2017, our revenues from lithium sales amounted to US$644.6 million, representing 30% of our total
revenues. We estimate that our sales volumes accounted for approximately 23% of the global lithium
chemicals sales volumes.
Lithium: Market
The lithium market can be divided into (i) lithium minerals for direct use (in which market SQM does not
participate directly), (ii) basic lithium chemicals, which include lithium carbonate and lithium hydroxide
(as well as lithium chloride, from which lithium carbonate may be made), and (iii) inorganic and organic
lithium derivatives, which include numerous compounds produced from basic lithium chemicals (in which
market SQM does not participate directly).
Lithium carbonate and lithium hydroxide are principally used to produce the cathodes for rechargeable
batteries, taking advantage of lithium’s extreme electrochemical potential and low density. Batteries are
the leading application for lithium, accounting for approximately 59% of total lithium demand, including
batteries for electric vehicles, which accounted for approximately 27% of total lithium demand.
There are many other applications both for basic lithium chemicals and lithium derivatives, such as
lubricating greases (approximately 9% of total lithium demand), heat-resistant glass (ceramic glass)
(approximately 5% of total lithium demand), chips for the ceramics and glaze industry (approximately 4%
of total lithium demand), chemicals for air conditioning (approximately 3% of total lithium demand), and
many others, including air treatment systems, pharmaceutical synthesis and metal alloys.

3) DESCRIPTION OF BUSINESS ENVIRONMENT
22
Lithium’s main properties, which facilitate its use in this range of applications, are that it:
• is the lightest solid element at room temperature;
• has a low coefficient of thermal expansion;
• has high electrochemical potential and low density and
• is the solid with the highest specific heat capacity.
During 2017, lithium chemicals demand increased by approximately 17%, reaching approximately
212,000 metric tons, with close to 37% supplied by Chilean producers. We expect applications related to
energy storage to continue driving demand in the coming years.
Lithium: Our Products
We produce lithium carbonate at our Salar del Carmen facilities, near Antofagasta, Chile, from highly
concentrated lithium chloride produced in the Salar de Atacama, as a by-product of the potassium chloride
production. The annual production capacity of our lithium carbonate plant at the Salar del Carmen is
48,000 metric tons per year. During 2018, we plan to increase our production capacity to 70,000 metric
tons per year and start the preparation for the further expansion to 100,000 metric tons per year in 2019.
We believe that the technologies we use, together with the high concentrations of lithium and the
characteristics of the Salar de Atacama, such as high evaporation rate and concentration of other minerals,
allow us to be one of the lowest cost producers worldwide.
We also produce lithium hydroxide at the same plant at the Salar del Carmen, next to the lithium carbonate
operation. The lithium hydroxide facility has a production capacity of 6,000 metric tons per year and is
one of the largest plants in the world. During 2018, we plan to increase this capacity to 13,500 metric tons
per year through increased efficiencies and the construction of a 7,000 metric ton plant.
The following table shows our total sales volumes and revenues from lithium carbonate and its derivatives
for 2017, 2016 and 2015:
2017 2016 2015
Sales volumes (Th. MT)
Lithium and derivatives 49.7 49.7 38.7
Revenues (in US$ millions) 644.6 514.6 223.0
Our revenues in 2017 were US$644.6 million, a 25% increase from US$514.6 million in 2016, due to
significantly higher prices during the year. The average price for 2017 was approximately 25% higher than
the average price in 2016, as global demand growth outpaced supply growth.
Lithium: Marketing and Customers
In 2017, we sold our lithium products in approximately 42 countries to approximately 198 customers, and
most of our sales were to customers outside of Chile. Two customers each accounted for more than 10%
of our lithium revenues in 2017, accounting for approximately 22% of our lithium revenues. Our ten
largest customers accounted in the aggregate for approximately 68% of revenues. Only one supplier
accounted for over 10% of the cost of sales of this business line, accounting for approximately 14% of the
cost of sales.
The following table shows the geographical breakdown of our sales for 2017, 2016 and 2015:
Sales Breakdown 2017 2016 2015

3) DESCRIPTION OF BUSINESS ENVIRONMENT
23
North America 7% 8% 11%
Europe 14% 19% 21%
Central and South America 1% 1% 1%
Asia and Others 79% 73% 67%
We sell lithium carbonate and lithium hydroxide through our own worldwide network of representative
offices and through our sales, support and distribution affiliates. We maintain inventories of these products
at our facilities throughout the world to facilitate prompt delivery to customers. Sales of lithium carbonate
and lithium hydroxide are made pursuant to spot purchase orders or within the framework of supply
agreements. Supply agreements generally specify annual minimum and maximum purchase commitments,
and prices are adjusted periodically, according to prevailing market prices.
Lithium: Competition
Lithium is produced mainly from two sources: (i) concentrated brines and (ii) minerals. During 2017, the
main lithium brines producers were Chile, Argentina and China, while the main lithium mineral producers
were Australia and China. With total sales of approximately 49,700 metric tons of lithium carbonate
equivalent (LCE), SQM’s market share of lithium chemicals was approximately 23% in 2017. One of our
main competitors is Albemarle Corporation (“Albemarle”), which produces lithium carbonate and lithium
chloride in Chile and the United States, along with lithium derivatives in the United States, Germany,
Taiwan and China, with a market share of approximately 16%. Albemarle also owns 49% of Talison
Lithium Pty Ltd. (“Talison”), an Australian company, that is the largest producer of concentrated lithium
minerals in the world, based in Western Australia. The remaining 51% of Talison is owned by Sichuan
Tianqi Lithium Industries (“Tianqi”), a Chinese company producing basic lithium chemicals in China
from concentrated lithium minerals. Talison sells a part of its concentrated lithium mineral production to
the direct use market, but most of its production, representing approximately 27% of total lithium chemical
demand, is converted into basic lithium chemicals in China by Tianqi and Albemarle.
Another important competitor is FMC Corporation (“FMC”), with an estimated market share of
approximately 9%. FMC has production facilities in Argentina through Minera del Altiplano S.A., where
it produces lithium chloride and lithium carbonate. In addition, FMC produces lithium derivatives in the
United States and in the United Kingdom. Orocobre Ltd. is also based in Argentina and produces lithium
carbonate, reaching a market share of approximately 5%.
During 2017, two companies started their production of concentrated lithium minerals in Western
Australia, which are then converted into lithium chemicals in China. Together, these companies sell
approximately 11% of the total lithium demand in 2017. These companies are Neometals Ltd. with
operations in Mt. Marion, one of the owners is Jiangxi Ganfeng Lithium Co. (“Ganfeng”), a Chinese
company producing basic chemicals and lithium derivatives, and Galaxy Resources Ltd., with operations
in Mt. Cattlin. In addition, there were at least ten other companies producing lithium in China from brines
or minerals, which together represented about 9% of the global market in 2017.
We believe that lithium production will increase in the near future, balancing the explosive growth in
demand. A number of new projects to develop lithium deposits has been announced recently. Some of
these projects are already in the advanced stages of development and others could materialize in the
medium term.
Potassium
We produce potassium chloride and potassium sulfate by extracting brines from the Salar de Atacama that
are rich in potassium chloride and other salts.
Potassium is one of the three macronutrients that a plant needs to develop. Although potassium does not
form part of a plant’s structure, it is essential to the development of its basic functions. Potassium chloride

3) DESCRIPTION OF BUSINESS ENVIRONMENT
24
is the most commonly used potassium-based fertilizer. It is used to fertilize crops that can tolerate
relatively high levels of chloride, and to fertilize crops that are grown under conditions with sufficient
rainfall or irrigation practices that prevent chloride from accumulating to excess levels in the rooting
systems of the plant.
Some benefits that may be obtained through the use of potassium are:
increased yield and quality;
increased production of proteins;
increased photosynthesis;
intensified transport and storage of assimilates;
prolonged and more intense assimilation period;
improved water efficiency;
regulated opening and closure of stomata and
synthesis of lycopene.
Potassium chloride is also an important component for our specialty plant nutrition product line, where it
is used as a raw material to produce potassium nitrate.
Since 2009, our effective end product capacity has increased to over 2 million metric tons per year,
granting us improved flexibility and market coverage.
In 2017, our potassium chloride and potassium sulfate revenues amounted to US$379.3 million,
representing 18% of our total revenues and a 6% decrease compared to 2016, as a result of reduced sales
volumes.
Potassium: Market
During the last decade, growth in demand for potassium chloride, and for fertilizers in general, has been
driven by several key factors, such as a growing world population, higher demand for protein-based diets
and less arable land. All of these factors contribute to fertilizer demand growth as a result of efforts to
maximize crop yields and use resources more efficiently. For the last ten years, the compound annual
growth for the global potassium chloride market was approximately 1-2%. We estimate that demand
totaled approximately 63 million metric tons in 2017, an increase from 59 million tons in 2016.
According to studies prepared by the International Fertilizer Industry Association, cereals account for
approximately 45% of world potassium consumption, including corn (14%), rice (13%) and wheat (3%).
Oilseeds, predominantly soybeans and palm oil, represent approximately 16% of total potassium demand.
Fruits and vegetables account for approximately 22% of world potassium demand, and sugar crops account
for close to 7%.
Potassium: Our Products
Potassium chloride differs from our specialty plant nutrition products because it is a commodity fertilizer
and contains chloride. We offer potassium chloride in two grades: standard and compacted. Potassium
sulfate is considered a specialty fertilizer and we offer this product in soluble grades.
The following table shows our sales volumes of and revenues from potassium chloride and potassium
sulfate for 2017, 2016 and 2015:
2017 2016 2015
Sales volumes (Th. MT)
Potassium chloride and potassium sulfate 1,344.3 1,534.7 1,241.8
Revenues (in US$ millions) 379.3 403.3 430.2

3) DESCRIPTION OF BUSINESS ENVIRONMENT
25
Potassium: Marketing and Customers
In 2017, we sold potassium chloride and potassium sulfate to approximately 530 customers in over 80
countries. There were two individual customers that each accounted for more than 10% of our revenues
of potassium chloride and potassium sulfate in 2017, totaling approximately 21% of the revenues of
potassium chloride and potassium sulfate during this period. We estimate that our ten largest customers
accounted in the aggregate for approximately 55% of such revenues. One supplier accounted for more
than 10% of the cost of sales of this business line, accounting for approximately 16% of the cost of sales
for the business line.
The following table shows the geographical breakdown of our sales for 2017, 2016 and 2015:
Sales Breakdown 2017 2016 2015
North America 18% 20% 22%
Europe 19% 20% 12%
Central and South America 38% 38% 42%
Asia and Others 25% 22% 24%
Potassium: Competition
We estimate that we accounted for less than 3% of global sales of potassium chloride in 2017. Our main
competitors are Nutrien (formerly PCS), Uralkali, Belaruskali and Mosaic. We estimate that in 2017, PCS
accounted for approximately 20% of global sales, Uralkali accounted for approximately 15% of global
sales, Belaruskali accounted for approximately 14% of global sales and Mosaic accounted for
approximately 14% of global sales.
In the potassium sulfate market, we have several competitors, of which the most important are K+S KALI
GmbH (Germany), Tessenderlo Chemie (Belgium) and Great Salt Lake Minerals Corp. (United States).
We estimate that these three producers account for approximately 30% of the worldwide production of
potassium sulfate. SQM accounts for less than 2% of global production.
Industrial Chemicals
In addition to producing sodium and potassium nitrate for agricultural applications, we produce different
grades of these products for industrial applications. The different grades differ mainly in their chemical
purity. We enjoy certain operational flexibility producing industrial nitrates, because they are produced
from the same process as their equivalent agricultural grades, needing only an additional step of
purification. We may, with certain constraints, shift production from one grade to the other depending on
market conditions. This flexibility allows us to maximize yields and to reduce commercial risk.
In addition to producing industrial nitrates, we produce, market and sell industrial-grade potassium
chloride.
In 2017, our revenues from industrial chemicals were US$135.6 million, representing approximately 6%
of our total revenues for that year.
Industrial Chemicals: Market
Industrial sodium and potassium nitrates are used in a wide range of industrial applications, including the
production of glass, ceramics, explosives, charcoal briquettes, metal treatments together with various
chemical processes.

3) DESCRIPTION OF BUSINESS ENVIRONMENT
26
In addition, this product line has also experienced growth from the use of industrial nitrates as thermal
storage in concentrated solar power plants (commonly known as “CSP”). Solar salts for this specific
application contain a blend of 60% sodium nitrate and 40% potassium nitrate by weight ratio used as a
storage and heat transfer medium. Unlike traditional photovoltaic plants, these new plants use a “thermal
battery” that contains molten sodium nitrate and potassium nitrate, which store the heat collected during
the day. The salts are heated up during the day, while the plants are operating under direct sunlight, and at
night they release the solar energy that they have captured, allowing the plants to operate even during
hours of darkness. Depending on the power plant technology, solar salts are also used as a heat transfer
fluid in the plant system and thereby make CSP plants even more efficient, increasing their output and
reducing the Levelized Cost of Electricity (LCOE).
Experts believe that CSP plays a critical role in electricity grid stabilization and manageability due to its
inherent large scale storage capability. Nevertheless, such large installations are capital intensive and are
strongly influenced by the generation mix in each country. Therefore, fluctuations in solar salts demand
are unavoidable in terms of quantity and timing. In 2017, we supplied CSP projects in South Africa,
Morocco, Kuwait and Israel totaling over 88,000 metric tons. In 2018 we should further supply a CSP
plant in Kuwait and another one in South Africa, while negotiating the supply to other very large
installations in Dubai, Morocco and Chile.
As reported by the International Energy Agency (IEA), in 2016, global total cumulative electricity capacity
grew by 4% and reached a total of 6,650 GW. Renewables provided almost two-thirds of this growth with
a record addition of 165 GW, 6% higher compared to 2015. Renewables remain the largest source of
cumulative capacity at 2,135 GW and this trend is expected to continue in the next years to come. Under
these conditions, energy storage is becoming of critical importance and its role in increasing the electrical
grid stability and dispatchability of the electricity generated by renewable technologies is receiving a
growing interest from utilities, grid operators as well as governments and lenders.
According to the IEA, CSP capacity is expected to grow by over 5 GW over 2017-2022, with new
deployment moving into nascent markets, most notably Chile, Kuwait, Morocco, South Africa and the
United Arab Emirates, as well as continued growth in China. Projects with larger storage capacity and
decreasing investment costs for experienced developers mark the trend for the coming five years.
We are also experiencing a growing interest in using solar salts in thermal storage solutions not related to
CSP technology. Due to their proven performance, solar salts are being tested in industrial heat processes
and heat waste solutions. These new applications may open new opportunities to the solar salts uses in the
near future.
Industrial-grade potassium chloride is used as an additive in oil drilling as well as in food processing,
among other applications.
Industrial Chemicals: Our Products
The following table shows our sales volumes of industrial chemicals and total revenues for 2017, 2016
and 2015: 2017 2016 2015
Sales volumes (Th. MT)
Industrial chemicals 167.6 128.9 126.1
Revenues (in US$ millions) 135.6 104.1 97.1
Revenues for industrial chemicals increased from US$104.1 million in 2016 to US$135.6 million in 2017,
as a result of higher sales volumes in this business line.
Industrial Chemicals: Marketing and Customers

3) DESCRIPTION OF BUSINESS ENVIRONMENT
27
We sold our industrial nitrate products in approximately 55 countries in 2017 to approximately 296
customers. Four customers accounted for more than 10% of our revenues of industrial chemicals in 2017,
accounting for approximately 57%, and our ten largest customers accounted in the aggregate for
approximately 68% of such revenues. No supplier accounted for more than 10% of the cost of sales of this
business line.
The following table shows the geographical breakdown of our sales for 2017, 2016 and 2015:
Sales Breakdown 2017 2016 2015
North America 19% 24% 31%
Europe 21% 14% 15%
Central and South America 7% 9% 11%
Asia and Others 53% 54% 43%
We sell our industrial chemical products mainly through our own worldwide network of representative
offices and through our sales and distribution affiliates. We maintain inventories of our different grades
of sodium nitrate and potassium nitrate products at our facilities in Europe, North America, South Africa,
Asia and South America to achieve prompt deliveries to customers. Our Research and Development
department, together with our foreign affiliates, provides technical support to our customers and
continuously works with them to develop new products or applications for our products.
Industrial Chemicals: Competition
We believe we are one of the leading producers of sodium nitrate and potassium nitrate for industrial uses.
In the case of industrial sodium nitrate, we estimate that our sales represented close to 37% of world
demand in 2017 (excluding internal demand for China and India, for which we believe reliable estimates
are not available). Our competitors are mainly based in Europe and Asia, producing sodium nitrate as a
by-product of other production processes. In refined grade sodium nitrate, BASF AG (“BASF”), a German
corporation and several producers in China and Eastern Europe are highly competitive in the European
and Asian markets. Our industrial sodium nitrate products also compete indirectly with substitute
chemicals, including sodium carbonate, sodium sulfate, calcium nitrate and ammonium nitrate, which may
be used in certain applications instead of sodium nitrate and are available from a large number of producers
worldwide.
Our main competitor in the industrial potassium nitrate business is Haifa Chemicals (“Haifa”), which we
estimate had a market share of 26%. We estimate that our market share was approximately 30% for 2017.
In the solar salts business, we believe we have been the market leader since we started selling to
commercial projects in 2007. Our competitors include Haifa, which is a potassium nitrate supplier, and
BASF, which is a sodium nitrate supplier.
Producers compete in the market for industrial sodium and potassium nitrate based on reliability, product
quality, price and customer service. We believe that we are a low cost producer of both products and are
able to produce high quality products.
In the industrial potassium chloride market, we are a relatively small producer, mainly supplying regional
needs.
Other Products
A large part of our other revenue is related to fertilizer trading, usually commodities. These fertilizers are
traded in large volumes worldwide. We have developed a trade, supply and inventory management

3) DESCRIPTION OF BUSINESS ENVIRONMENT
28
business that allows us to respond quickly and effectively to the changing fertilizer market in which we
operate and profit on these trades.
Trend Information
Our revenues increased 11.2% to US$2,157.3 million in 2017 from US$1,939.3 million in 2016. Gross
profit increased 24.8% to US$762.5 million in 2017, which represented 35.3% of revenues, from
US$611.0 million in 2016, which represented 31.5% of revenues. Profit attributable to controlling
interests increased 53.7% to US$427.7 million in 2017 from US$278.3 million in 2016.
Our sales volumes in the specialty plant nutrition business line increased 14.9% in 2017 compared to 2016,
while average prices decreased by 2.7%. As a result, our revenues in this business line increased by 11.8%.
Higher sales volumes seen during 2017 were due to demand growth and limited supply from our
competitors. We expect to see similar sales volumes in 2018. We sell various products within this business
line, and most of our specialty fertilizers are sold as either field fertilizers or water soluble fertilizers. Our
strategy in this business line has been to focus primarily on the water soluble fertilizer market, which in
general yields higher margins and has more growth potential. Average prices in this business line were
slightly lower in 2017, and we expect average prices to be flat in 2018.
Our sales volumes in the iodine business line increased 24.4% in 2017. We also saw prices stabilize during
the first half of the year and slightly improving in the second half of the year. Still, the average prices in
2017 were 12.3% lower than the average prices seen in 2016. Increased sales volumes compensated for
lower prices resulting in an increase of 9.1% in our revenues for this business line. We believe that the
pricing trend will continue into 2018 with average prices slightly higher than in 2017. According to our
estimates, the global iodine demand grew slightly in 2017 reaching almost 35,300 MT and we increased
our market share to over 35%. We expect to increase our iodine sales volumes in line with the market
growth, maintaining our current market share.
We saw similar sales volumes in the lithium business line in 2017 compared to 2016. The lithium market
continued its strong growth in 2017, with total demand growth reaching close to 17% according to our
estimates. Supply did not keep the same pace, and therefore market conditions remained tight and prices
increased significantly during the year. This pricing trend, given that the sales volumes stayed at the same
level as in 2016, impacted our revenues for 2017 by almost US$130 million. Average prices in this
business line increased another 25% compared to average prices seen during 2016. We believe that the
market price could be almost 20% higher in the first half of 2018 compared to the fourth quarter of 2017.
However, we expect that new projects could increase their supply in the second half of 2018 resulting in
more stable or slightly lower average prices. Still, we expect averages prices to be higher in 2018 compared
to the average prices seen in 2017. We believe that the worldwide lithium market could grow almost 20%
in 2018, driven by the development of energy storage and batteries for electric vehicles.
Once the amendments to the Lease Agreement and Project Agreement with Corfo become effective, the
higher lease payment rate will be applied to the revenues related to lithium. We expect to increase our
sales volumes to almost 55,000 metric tons in 2018; however, we are not able to confirm whether the
increased sales volumes combined with higher prices could offset the impact of higher lease payments on
the gross margin of this business line.
Our sales volumes in the potassium business line decreased by 12.4% in 2017 compared to 2016, as we
focused our production efforts in the Salar de Atacama on increasing lithium yields. Average prices in the
potassium chloride and potassium sulfate business line increased approximately 7.4% during 2017 when
compared to 2016, reaching US$282/MT. We believe that we could see a continued decrease in potassium
chloride production during 2018 with sales volumes of approximately one million metric tons, as we are
increasing our lithium production. The higher prices reflected the stronger global demand for potassium

3) DESCRIPTION OF BUSINESS ENVIRONMENT
29
chloride in 2017, reaching almost 63 million metric tons. We believe that average prices for this business
line could remain flat or show a slight growth in 2018.
Our sales volumes in the industrial chemicals product line increased 30.0% in 2017 compared to 2016,
driven by higher sales volumes of solar salts. Solar salts sales depend on the ramp up of the concentrated
solar power plants (CSP) projects and we expect our sales volumes in 2018 to be approximately 50,000
metric tons. During 2017, prices remained flat compared to 2016.
Production Process
Our integrated production process can be classified according to our natural resources:
Caliche ore deposits, which contain nitrates, iodine and potassium; and
Brines from the Salar de Atacama, which contain potassium, lithium, sulfate, boron and
magnesium.
Caliche Ore Deposits
Caliche ore deposits are located in northern Chile. During 2017, our mining operations concentrated in the
first Region where we worked in the mining sector Tente en el Aire and continued with the exploration of
the mining sector Nueva Victoria Oeste. We believe that a concentrated mining operation allows us to
capture operating synergies that will increase efficiency and reduce costs. Mining operations at the Pampa
Blanca site, the El Toco mine (which is part of the María Elena site) and the Pedro de Valdivia site were
suspended in March 2010, November 2013 and November 2015, respectively, in an effort to optimize our
production facilities with lower production costs.
Caliche ore is found under a layer of barren overburden in seams with variable thickness from twenty
centimeters to four meters, and with the overburden varying in thickness between half a meter and two
meters.
Before proper mining begins, the exploration stage is carried out, including complete geological
reconnaissance, sampling and drilling caliche ore to determine the quality and characteristics of each
deposit. Drill-hole samples are properly identified and tested at our chemical laboratories. With the
exploration information on a closed grid pattern of drill holes, the ore evaluation stage provides
information for mine planning purposes. Mine planning is done on a long-term basis (ten years), medium-
term basis (three years) and short-term basis (one year). Once all of this information has been compiled,
detailed planning for the exploitation of the mine takes place.
The mining process generally begins with bulldozers first breaking and then removing the overburden in
the mining area. This process is followed by an inspection and review of the drill holes before production
drilling and blasting occurs to break the caliche seams. Front-end loaders load the ore onto off-road trucks,
which take it to the leaching heaps to be processed.
During 2017, SQM ran various tests with a continuous mining equipment replacing the drilling and
blasting process and obtaining a smaller ore size (under 6 inches) that allows a better metallurgical
recovery. The tests will conclude in 2018.
The run of mine ore is loaded in heaps and leached with water to produce concentrated solutions containing
iodine, nitrate and potassium. These solutions are then sent to plants where iodine is extracted through
both solvent-extraction and blow out processes. The remaining solutions are subsequently sent to solar
evaporation ponds where the solutions are evaporated and salts rich in nitrate and potassium are produced. These concentrated salts are then sent to Coya Sur where they are used to produce potassium nitrate.

3) DESCRIPTION OF BUSINESS ENVIRONMENT
30
During 2017, the Pedro de Valdivia and María Elena sites generated solutions produced by leaching the
mine tailings. These solutions are treated at the iodide plants at Pedro de Valdivia and María Elena. The
iodide that is produced at the María Elena plant is subsequently sent to Pedro de Valdivia in order to
produce prilled iodine. After iodide is obtained at both plants, the remaining solutions, which are rich in
nitrate and potassium, are sent to the solar evaporation ponds at Coya Sur in order to be used in the
production of potassium nitrate.
Caliche Ore-Derived Products
Caliche ore-derived products are: sodium nitrate, potassium nitrate, sodium potassium nitrate and iodine.
Sodium Nitrate
During 2017, sodium nitrate for both agricultural and industrial applications was produced by inventory
generated at the Pedro de Valdivia facility and subsequently processed at the Coya Sur plants. The
production at the Pedro de Valdivia facility, until November 2015, generated approximately 700,000 tons
of inventory. As of December 2017, we had approximately 277,000 tons of crystallized sodium nitrate in
inventory, which will provide us with enough sodium nitrate to produce finished nitrates for approximately
two years. For subsequent production, we are developing the project of adapting the available
crystallization plants at Coya Sur to be able to produce sodium nitrate using nitrate salts from our Nueva
Victoria facility.
Crystallized sodium nitrate is an intermediate product that is subsequently processed further at the Coya
Sur production plants to produce sodium nitrate, potassium nitrate and sodium potassium nitrate in
different chemical and physical qualities, including crystallized and prilled products. Finally, the products
are transported by truck to our port facilities in Tocopilla for shipping to customers and distributors
worldwide.
Potassium Nitrate
Potassium nitrate is produced at our Coya Sur facility using a production process developed in-house. The
brines generated by the leaching processes at Pedro de Valdivia and María Elena are pumped to Coya
Sur’s solar evaporation ponds for a nitrate concentration process. After the nitrate concentration process,
the brine is pumped to a conversion plant where potassium salts from the Salar de Atacama and nitrate
and potassium salts produced at Nueva Victoria or Coya Sur, are added. A chemical reaction begins,
transforming sodium nitrate into potassium nitrate and discarding formed sodium chloride. This brine is
pumped to a crystallization plant, which crystallizes the potassium nitrate by cooling it at atmospheric
pressure, and separating it from the liquid by centrifuge.
Our current potassium nitrate production capacity at Coya Sur is approximately 1,300,000 metric tons per
year. Since the end of 2013, we have been working with external advisors to implement the “lean” method
of manufacturing in our potassium nitrate plants. We achieved complete implementation of this method
of manufacturing during 2015. The improvements we have achieved have enabled us to reduce costs,
improve energy consumption, increase the production of potassium nitrate and decrease our accident rates.
This method is based on increasing the involvement of our workers in decision-making, and strengthening
the leadership of our production supervisors. The goal is to identify opportunities to improve the
production process and reduce waste on an ongoing basis.
During 2017, new operational improvements have been achieved by significantly integrating the
production process of the Coya Sur facilities, allowing new increases in production capacity without major
investments and improving the use of raw materials from the Salar de Atacama and Nueva Victoria.
Sodium Potassium Nitrate

3) DESCRIPTION OF BUSINESS ENVIRONMENT
31
Sodium potassium nitrate is a mixture of approximately two parts sodium nitrate per one part potassium
nitrate. We produce sodium potassium nitrate at our Coya Sur prilling facilities using standard, non-
patented production methods we have developed. Crystallized sodium nitrate is supplied together with the
crystallized potassium nitrate to the prilling plant where it is mixed producing sodium potassium nitrate,
which is then melted and prilled. The prilled sodium potassium nitrate is transported to Tocopilla for bulk
shipment to customers.
The production process for sodium potassium nitrate is basically the same as that for sodium nitrate and
potassium nitrate. With certain production restraints and following market conditions, we may supply
sodium nitrate, potassium nitrate or sodium potassium nitrate, either in prilled or crystallized form.
The sodium nitrate and potassium nitrate produced at Coya Sur are transported to Tocopilla for shipping
and delivery to customers and distributors. All potassium nitrate produced in crystallized or prilled form
at Coya Sur has been certified by TÜV-Rheiland under the quality standard ISO 9001:2008.
Iodine and Iodine Derivatives
During 2017, we produced iodine at our facilities at Nueva Victoria (including the Iris facility), Pedro de
Valdivia and María Elena. Iodine is extracted from solutions produced by leaching caliche ore.
As in the case of nitrates, the process of extracting iodine from the caliche ore is well established, but
variations in the iodine and other chemical contents of the treated ore and other operating parameters
require a high level of know-how to manage the process effectively and efficiently.
The solutions resulting from the leaching of caliche carry iodine in iodate form. Part of the iodate solution
is reduced to iodide using sulfur dioxide, which is produced by combusting (burning) sulfur. The resulting
iodide is combined with the rest of the untreated iodate solution to release elemental iodine in low
concentrations. The iodine is then extracted from the aqueous solutions and concentrated in iodide form
using a solvent extraction and stripping plant in the Pedro de Valdivia and Nueva Victoria facilities and
using a blow out plant in Iris. The concentrated iodide is oxidized to metallic iodine, which is then refined
through a smelting process and prilled. We have obtained patents in the United States and Chile (Chilean
patent number 47,080) for our iodine prilling process.
Prilled iodine is tested for quality control purposes, using international standard procedures that we have
implemented. It is then packed in 20 to 50 kilogram drums or 350 to 700 kilogram maxibags and
transported by truck to Antofagasta, Mejillones, or Iquique for export. Our iodine and iodine derivatives
production facilities have qualified under the ISO-9001:2008 program, providing third-party
certification—by TÜV-Rheiland—of the quality management system. The last recertification process was
approved in February 2011. Iodine from the Iris plant was certified under ISO-9001:2008 in April 2012.
Our total iodine production in 2017 was 9,696 metric tons: 7,476 metric tons from Nueva Victoria, 1,328
metric tons from Iris, 851 metric tons from Pedro de Valdivia, and 41 metric tons from María Elena. Nueva
Victoria is also equipped to toll iodine from iodide delivered from our other facilities. We have the
flexibility to adjust our production according to market conditions. Following the production facility
restructuring at Pedro de Valdivia and Nueva Victoria, our total current effective production capacity at
our iodine production plants is approximately 11,000 metric tons per year. We are currently developing a
project to expand the production capacity of iodide and iodine in Nueva Victoria to increase our total
effective production capacity to 14,000 metric tons per year.
We use a portion of the iodine we produce to manufacture inorganic iodine derivatives, which are
intermediate products used for manufacturing agricultural and nutritional applications, at facilities located
near Santiago, Chile. We also produce inorganic and organic iodine derivative products together with

3) DESCRIPTION OF BUSINESS ENVIRONMENT
32
Ajay, which purchases iodine from us. In the past, we have primarily sold our iodine derivative products
in South America, Africa and Asia, while Ajay and its affiliates have primarily sold their iodine derivative
products in North America and Europe.
In September 2010, CONAMA, currently known as the Environmental Evaluation Service, approved the
environmental study of our Pampa Hermosa project in the Tarapacá Region of Chile. This environmental
permit allows for an increase in the production capacity of our Nueva Victoria operations to 11,000 metric
tons of iodine per year and to produce up to 1.2 million metric tons of crystallized nitrates, mine up to 37
million metric tons of caliche per year and use new water rights of up to 570.8 liters per second. In recent
years, we have made investments in order to increase the water capacity in the Nueva Victoria operations
from two water sources approved by the environmental study of Pampa Hermosa, expand the capacity of
solar evaporation ponds, and implement new areas of mining and collection of solutions. Our current
production capacity at Nueva Victoria is approximately 10,000 metric tons per year of iodine (including
the Iris operations) and 900,000 metric tons per year of nitrates. Additional expansions may be done from
time to time in the future, depending on market conditions.
Salar de Atacama Brine Deposits
The Salar de Atacama, located approximately 250 kilometers east of Antofagasta, is a salt-encrusted
depression in the Atacama Desert, within which lies an underground deposit of brines contained in porous
sodium chloride rock fed by an underground inflow from the Andes mountains. Brines are pumped from
depths of 1.5 to 60 meters below surface, through a field of wells that are located in the Salar de Atacama,
distributed in areas authorized for exploitation, and which contain relatively high concentrations of
potassium, lithium, sulfate, boron and other minerals.
The brines are estimated to cover a surface of approximately 2,800 square kilometers and contain
commercially exploitable deposits of potassium, lithium, sulfates and boron. Concentrations vary at
different locations throughout the Salar de Atacama. Our mining exploitation rights to the Salar de
Atacama are pursuant to the Lease Agreement, which expires in 2030. The Lease Agreement permits the
CCHEN to establish a total accumulated extraction and sales limit of 180,100 tons of lithium metal
(958,672 tons of lithium carbonate equivalent) in the aggregate for all periods. For the year ended
December 31, 2017, revenues related to products originating from the Salar de Atacama represented 47%
of our consolidated revenues, consisting of revenues from our potassium business line and our lithium and
derivatives business line for the period. All of our products originating from the Salar de Atacama are
derived from our extraction operations under the Lease Agreement. As of December 31, 2017, only 13
years remain on the term of the Lease Agreement and we had extracted approximately 64% of the total
accumulated extraction and sales limit of lithium.
On January 17, 2018, Corfo and our subsidiaries SQM Salar and SQM Potasio S.A. entered into the Corfo
Arbitration Agreement, which, among other things, provide for the amendment of the Lease Agreement
and the Project Agreement. As part of the agreement to amend the Lease Agreement, Corfo authorized an
increase of the production and sales of lithium products produced in the Salar de Atacama up to 349,553
metric tons of lithium metallic equivalent (1,860,670 tons of lithium carbonate equivalent), which is in
addition to the approximately 64,816 metric tons of lithium metallic equivalent (345,015 tons of lithium
carbonate equivalent) remaining from the originally authorized amount. The amendment of the Lease
Agreement and the Project Agreement remains subject to the issuance of the applicable resolutions of the
Office of the Comptroller General of the Republic (Contraloría General de la República), as well as the
approval by the Governing Board of CCHEN, and is currently being challenged by the Atacamenos
Indigenous Organization (Consejo de Pueblos Atacamenos) and the Atacamenos.
Products Derived from the Salar de Atacama Brines

3) DESCRIPTION OF BUSINESS ENVIRONMENT
33
The products derived from the Salar de Atacama brines are: potassium chloride, potassium sulfate, lithium
carbonate, lithium hydroxide, lithium chloride, boric acid and bischofite (magnesium chloride).
Potassium Chloride
We use potassium chloride in the production of potassium nitrate. Production of our own supplies of
potassium chloride provides us with substantial raw material cost savings. We also sell potassium chloride
to third parties, primarily as a commodity fertilizer.
In order to produce potassium chloride, brines from the Salar de Atacama are pumped to solar evaporation
ponds. Evaporation of the water contained in the brine, results in a crystallized mixture of salts with various
content levels of potassium, sodium and magnesium. In the first stage of the precipitation, sodium chloride
salts are removed; these salts are not used in the production process of other products. After further
evaporation, the sodium and potassium salts are harvested and sent for treatment at one of the wet
potassium chloride plants where potassium chloride is separated by a grinding, flotation, and filtering
process. In the final evaporation stage, salts containing magnesium are harvested and eventually can be
treated at one of the cold leach plants where magnesium is removed. Potassium chloride is transported
approximately 300 kilometers to our Coya Sur facilities via a dedicated truck transport system, where it is
used in the production of potassium nitrate. We sell potassium chloride produced at the Salar de Atacama
in excess of our needs to third parties. All of our potassium-related plants in the Salar de Atacama currently
have a nominal production capacity in excess of up to 2.6 million metric tons per year. Actual production
capacity depends on volume, metallurgical recovery rates and quality of the mining resources pumped
from the Salar de Atacama.
The by-products of the potassium chloride production process are (i) solutions remaining after removal of
the potassium chloride, which are used to produce lithium carbonate as described below, with the excess
amount not required for lithium carbonate production being reinjected into the Salar de Atacama; (ii)
sodium chloride, which is similar to the surface material of the Salar de Atacama and is deposited at sites
near the production facility and (iii) other salts containing magnesium chloride.
Lithium Carbonate and Lithium Chloride
After the production of potassium chloride, a portion of the solutions remaining is sent to additional solar
concentration ponds adjacent to the potassium concentration ponds. At this stage, the solution is
concentrated and purified by precipitation to remove impurities it may still contain, including calcium,
sulfate, potassium, sodium and magnesium. Next is the process of concentration and purification of the
remaining concentrated solution of lithium chloride, which is transported by truck to the Salar del Carmen
production facility located near Antofagasta, approximately 230 kilometers from the Salar de Atacama.
At this plant, the solution is further purified and treated with sodium carbonate to produce lithium
carbonate, which is dried and then, if necessary, compacted and finally packaged for shipment. The
production capacity of our lithium carbonate facility is approximately 48,000 metric tons per year.
Currently, the necessary investments are being made to reach a production of 70,000 metric tons per year
and start the preparation for the further expansion to 100,000 metric tons per year in 2019.
Future production will depend on the actual volumes and quality of the lithium solutions sent by the Salar
de Atacama operations, as well as prevailing market conditions. Our future production was also subject to
the extraction limit of 180,100 tons of lithium (958,672 tons of lithium carbonate equivalent) in the
aggregate for all periods of the Lease Agreement mentioned above which may be increased in the event
the Lease Agreement is amended as described above.
Our lithium carbonate production quality assurance program has been certified by TÜV-Rheiland under
ISO 9001:2000 since 2005 and under ISO 9001:2008 since October 2009.

3) DESCRIPTION OF BUSINESS ENVIRONMENT
34
Lithium Hydroxide
Lithium carbonate is sold to customers, and we also use it as a raw material for our lithium hydroxide
production, which started operations at the end of 2005. This facility has a production capacity of 6,000
metric tons per year, and is located in the Salar del Carmen, adjacent to our lithium carbonate operations.
In 2018, the necessary investments will be made to build a second lithium hydroxide plant, which will
have a capacity of 7,000 metric tons per year. In the production process, lithium carbonate is reacted with
a lime solution to produce lithium hydroxide brine and calcium carbonate salt, which is filtered and piled
in reservoirs. The lithium hydroxide solution is evaporated in a multiple effect evaporator and crystallized
to produce the lithium hydroxide, which is filtered, dried and packaged for shipment to customers.
Our lithium hydroxide production quality assurance program has been certified by TÜV-Rheiland under
ISO 9001:2000 since 2007 and under ISO 9001:2008 since October 2009.
Potassium Sulfate and Boric Acid
Approximately 12 kilometers northeast of the potassium chloride facilities at the Salar de Atacama, we
use the brines from the Salar de Atacama to produce potassium sulfate, potassium chloride (as a by-product
of the potassium sulfate process) and, depending on market conditions, boric acid. The plant is located in
an area of the Salar de Atacama where high sulfate and potassium concentrations are found in the brines
to produce potassium sulfate. The brine is pumped to solar evaporation ponds, where sodium chloride salts
are precipitated, harvested and put into piles. After further evaporation, the sulfate and potassium salts
precipitate in different concentrations and are harvested and sent for processing to the potassium sulfate
plant. Potassium sulfate is produced using flotation, concentration and reaction processes, after which it is
crystallized, filtered, dried, classified and packaged for shipment.
Production capacity for the potassium sulfate plant is approximately 340,000 metric tons per year, of which
approximately 95,000 metric tons correspond to potassium chloride obtained as a byproduct of the
potassium sulfate process. This capacity is part of the total nominal plant capacity of 2.6 million metric
tons per year. In our dual plant complex, we may switch, to some extent, between potassium chloride and
potassium sulfate production. Part of the pond system in this area is also used to process potassium chloride
brines extracted from the low sulfate concentration areas found in the Salar de Atacama. Depending on
the conditions for the optimization of the deposit operation and/or market conditions, potassium sulfate
production can be modified to produce potassium chloride.
The principal by-products of the production of potassium sulfate are: (i) non-commercial sodium chloride,
which is deposited at sites near the production facility and (ii) remaining solutions, which are re-injected
into the Salar de Atacama or returned to the evaporation ponds. The principal by-products of the boric
acid production process are remaining solutions that are treated with sodium carbonate to neutralize acidity
and then are reinjected into the Salar de Atacama.
Raw Materials
The main raw material that we require in the production of nitrate and iodine is caliche ore, which is
obtained from our surface mines. The main raw material in the production of potassium chloride, lithium
carbonate and potassium sulfate is the brine extracted from our operations at the Salar de Atacama.
Other important raw materials are sodium carbonate (used for lithium carbonate production and for the
neutralization of iodine solutions), sulfuric acid, kerosene, anti-caking and anti-dust agents, ammonium
nitrate (used for the preparation of explosives in the mining operations), woven bags for packaging our
final products, electricity acquired from electric utilities companies, and liquefied natural gas and fuel oil
for heat generation. Our raw material costs (excluding caliche ore and salar brines and including energy)
represented approximately 14% of our cost of sales in 2017.

3) DESCRIPTION OF BUSINESS ENVIRONMENT
35
We have been connected to the northern power grid in Chile, which currently supplies electricity to most
cities and industrial facilities in northern Chile, since April 2000. We have several electricity supply
agreements signed with major producers in Chile, which are within the contract terms. Our electricity
needs are primarily covered by the Electrical Energy Supply Agreement that we entered into with AES
Gener S.A. on December 31, 2012. Pursuant to the terms of the Electrical Energy Supply Agreement, we
are required to purchase an amount of electricity that exceeds the amount that we estimate we will need
for our operations. The excess amount is sold at marginal cost, which could result in a material loss for us.
For the supply of liquefied natural gas, in 2013 and 2014 we had a contract with Solgas. For 2015, 2016
and 2017, we executed supply contracts with Enel Chile S.A. as with Solgas, primarily to serve our
operations at the Salar del Carmen and Coya Sur.
We obtain ammonium nitrate, sulfuric acid, kerosene and soda ash from several large suppliers, mainly in
Chile and the United States, under long-term contracts or general agreements, some of which contain
provisions for annual revisions of prices, quantities and deliveries. Diesel fuel is obtained under contracts
that provide fuel at international market prices.
We believe that all of our contracts and agreements with third-party suppliers with respect to our main raw
materials contain standard and customary commercial terms and conditions.
Water Supply
We hold water rights for the supply of surface and subterranean water near our production facilities. The
main sources of water for our nitrate and iodine facilities at Pedro de Valdivia, María Elena and Coya Sur
are the Loa and San Salvador rivers, which run near our production facilities. Water for our Nueva Victoria
and Salar de Atacama facilities is obtained from wells near the production facilities. In addition, we buy
water from third parties for our production processes at the Salar del Carmen lithium carbonate and lithium
hydroxide plants, and we also purchase potable water from local utility companies. We have not
experienced significant difficulties obtaining the necessary water to conduct our operations.
Research and Development, Patents and Licenses, Etc.
One of the main objectives of our research and development team is to develop new processes and products
in order to maximize the returns obtained from the resources that we exploit. Our research is performed
by three different units, whose research topics cover all of the processes involved in the production of our
products, including chemical process design, phase chemistry, chemical analysis methodologies and
physical properties of finished products.
Our research and development policy emphasizes the following: (i) optimizing current processes in order
to decrease costs and improve product quality through the implementation of new technology, (ii)
developing higher-margin products from current products through vertical integration or different product
specifications and (iii) adding value to inventories.
Our research and development activities have been instrumental in improving our production processes
and developing new value-added products. As a result of research and development activities, new
methods of extraction, crystallization and finishing products have been developed. Technological
advances in recent years have enabled us to improve process efficiency for the nitrate, potassium and
lithium operations, improve the physical quality of our prilled products and reduce dust emissions and
caking by applying specially designed additives to our products handled in bulk. Our research and

3) DESCRIPTION OF BUSINESS ENVIRONMENT
36
development efforts have also resulted in new, value-added markets for our products. One example is the
use of sodium nitrate and potassium nitrate as thermal storage in solar power plants.
We have patented several production processes for nitrate, iodine and lithium products. These patents have
been filed mainly in the United States, Chile and in other countries when necessary. The patents used in
our production processes include Chilean patent No. 47,080 for iodine (production of spherical granules
of chemicals that sublime), Japanese patent No. 4,889,848 for nitrates (granular fertilizers) and patents
Nos. 41,838 from Chile, 5393-B and 5391-B from Bolivia, AR001918B1 and AR001916B1 from
Argentina and 5,676,916 and 5,939,038 from the U.S. for lithium (removal of boron from brines).
For the years ended December 31, 2017, 2016 and 2015, we invested US$6.4 million, US$11.0 million
and US$4.4 million, respectively, in research and development activities.
Licenses, Franchises, and Royalties
We do not have contracts that give rise to an obligation for the Company to make payments for licenses,
franchises or royalties in any of our business lines, other than payments provided for in the Royalty Law.
We have subscribed purchase option contracts for mining concessions such that, in the event that third
parties exercise the respective option, we have the right to receive royalty payments as a result of the
exploitation of such concessions.
See section 3)D) Description of Business Environment: Property and Facilities for information about our
concessions.
3) D) DESCRIPTION OF BUSINESS ENVIRONMENT: PROPERTY AND FACILITIES
We carry out our operations through the use of mining rights, production facilities and transportation and
storage facilities. Discussion of our mining rights is organized below according to the geographic location
of our mining operations. Our caliche ore mining interests are located throughout the valley of the
Tarapacá and Antofagasta regions of northern Chile (in a part of the country known as “el Norte Grande”).
From caliche ore, we produce products based on nitrates and iodine, and caliche also contains
concentrations of potassium. Our mining interests in the brine deposits of the Salar de Atacama are found
within the Atacama Desert, in the eastern region of el Norte Grande. From these brines we produce
products based on potassium, sulfate, lithium and boron.
The map below shows the location of our principal mining operations and the exploitation and exploration
mining concessions that have been granted to us, as well as the mining properties that we lease from Corfo:

3) DESCRIPTION OF BUSINESS ENVIRONMENT
37

3) DESCRIPTION OF BUSINESS ENVIRONMENT
38
Mining Concessions
Mining Concessions for the Exploration and Exploitation of Caliche Ore Mining Resources
We hold our mining rights pursuant to mining concessions for exploration and exploitation of mining
resources that have been granted pursuant to applicable law in Chile:
(1) “Mining Exploitation Concessions”: entitle us to use the land in order to exploit the mineral
resources contained therein on a perpetual basis, subject to annual payments to the Chilean
government.
(2) “Mining Exploration Concessions”: entitle us to use the land in order to explore for and verify the
existence of mineral resources for a period of two years, at the expiration of which the concession
may be extended one time only for two additional years, if the area covered by the concession is
reduced by half. We may alternatively request an exploitation concession in respect of the area
covered by the original exploration concession, which must be made within the timeframe
established by the original exploration concession.
A Mining Exploration Concession is generally obtained for purposes of evaluating the mineral resources
in a defined area. If the holder of the Mining Exploration Concession determines that the area does not
contain commercially exploitable mineral resources, the Mining Exploration Concession is usually
allowed to lapse. An application also can be made for a Mining Exploitation Concession without first
having obtained a Mining Exploration Concession for the area involved.
As of December 31, 2017, the surface area covered by Mining Exploitation Concessions that have been
granted in relation to the caliche resources of SQM S.A.’s mining sites is approximately 576,707 hectares.
In addition, as of December 31, 2017, the surface area covered by Mining Exploration Concessions in
relation to the caliche resources of SQM S.A.’s mining sites is approximately 2,200 hectares. We have not
requested additional mining rights.
Mining Concessions for the Exploitation of Brines at the Salar de Atacama
As of December 31, 2017, our subsidiary SQM Salar held exclusive rights to exploit the mineral resources
in an area covering approximately 140,000 hectares of land in the Salar de Atacama in northern Chile, of
which SQM Salar is only entitled to exploit the mineral resources in 81,920 hectares. These rights are
owned by Corfo and leased to SQM Salar pursuant to the Lease Agreement. Corfo cannot unilaterally
amend the Lease Agreement, and the rights to exploit the resources cannot be transferred. The Lease
Agreement establishes that SQM Salar is responsible for making quarterly lease payments to Corfo
according to specified percentages of the value of production of minerals extracted from the Salar de
Atacama brines, maintaining Corfo’s rights over the Mining Exploitation Concessions and making annual
payments to the Chilean government for such concession rights. The Lease Agreement was entered into
in 1993 and expires on December 31, 2030.
Under the terms of the Project Agreement, Corfo has agreed that it will not permit any other person to
explore, exploit or mine any mineral resources in the approximately 140,000 hectares area of the Salar de
Atacama mentioned above. The Project Agreement expires on December 31, 2030.
SQM Salar holds an additional 255,142 hectares of constituted Mining Exploitation Concessions in areas
near the Salar de Atacama, which correspond to mining reserves that have not been exploited. SQM Salar
also holds Mining Exploitation Concessions that are in the process of being granted covering 71,006
hectares in areas near the Salar de Atacama.
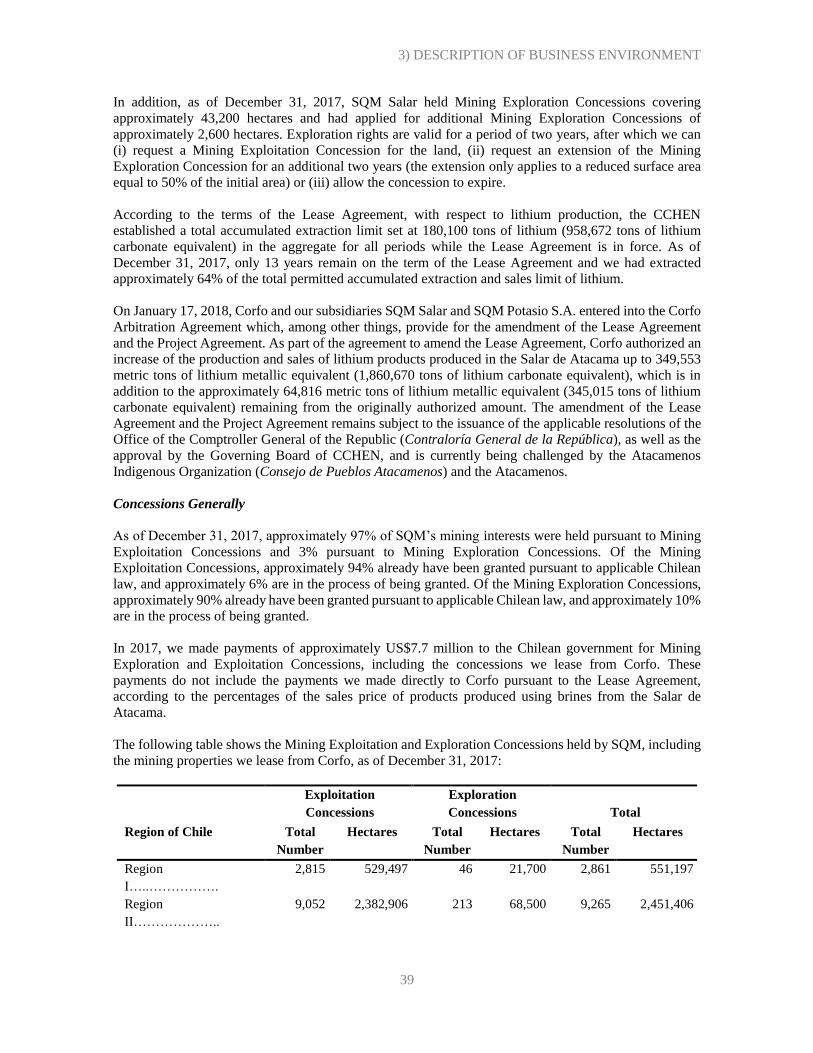
3) DESCRIPTION OF BUSINESS ENVIRONMENT
39
In addition, as of December 31, 2017, SQM Salar held Mining Exploration Concessions covering
approximately 43,200 hectares and had applied for additional Mining Exploration Concessions of
approximately 2,600 hectares. Exploration rights are valid for a period of two years, after which we can
(i) request a Mining Exploitation Concession for the land, (ii) request an extension of the Mining
Exploration Concession for an additional two years (the extension only applies to a reduced surface area
equal to 50% of the initial area) or (iii) allow the concession to expire.
According to the terms of the Lease Agreement, with respect to lithium production, the CCHEN
established a total accumulated extraction limit set at 180,100 tons of lithium (958,672 tons of lithium
carbonate equivalent) in the aggregate for all periods while the Lease Agreement is in force. As of
December 31, 2017, only 13 years remain on the term of the Lease Agreement and we had extracted
approximately 64% of the total permitted accumulated extraction and sales limit of lithium.
On January 17, 2018, Corfo and our subsidiaries SQM Salar and SQM Potasio S.A. entered into the Corfo
Arbitration Agreement which, among other things, provide for the amendment of the Lease Agreement
and the Project Agreement. As part of the agreement to amend the Lease Agreement, Corfo authorized an
increase of the production and sales of lithium products produced in the Salar de Atacama up to 349,553
metric tons of lithium metallic equivalent (1,860,670 tons of lithium carbonate equivalent), which is in
addition to the approximately 64,816 metric tons of lithium metallic equivalent (345,015 tons of lithium
carbonate equivalent) remaining from the originally authorized amount. The amendment of the Lease
Agreement and the Project Agreement remains subject to the issuance of the applicable resolutions of the
Office of the Comptroller General of the Republic (Contraloría General de la República), as well as the
approval by the Governing Board of CCHEN, and is currently being challenged by the Atacamenos
Indigenous Organization (Consejo de Pueblos Atacamenos) and the Atacamenos.
Concessions Generally
As of December 31, 2017, approximately 97% of SQM’s mining interests were held pursuant to Mining
Exploitation Concessions and 3% pursuant to Mining Exploration Concessions. Of the Mining
Exploitation Concessions, approximately 94% already have been granted pursuant to applicable Chilean
law, and approximately 6% are in the process of being granted. Of the Mining Exploration Concessions,
approximately 90% already have been granted pursuant to applicable Chilean law, and approximately 10%
are in the process of being granted.
In 2017, we made payments of approximately US$7.7 million to the Chilean government for Mining
Exploration and Exploitation Concessions, including the concessions we lease from Corfo. These
payments do not include the payments we made directly to Corfo pursuant to the Lease Agreement,
according to the percentages of the sales price of products produced using brines from the Salar de
Atacama.
The following table shows the Mining Exploitation and Exploration Concessions held by SQM, including
the mining properties we lease from Corfo, as of December 31, 2017:
Exploitation
Concessions
Exploration
Concessions
Total
Region of Chile Total
Number
Hectares Total
Number
Hectares Total
Number
Hectares
Region
I…..…………….
2,815 529,497 46 21,700 2,861 551,197
Region
II………………..
9,052 2,382,906 213 68,500 9,265 2,451,406

3) DESCRIPTION OF BUSINESS ENVIRONMENT
40
Region III and
others…...
423 98,749 36 9,900 459 108,649
Total…………………
…
12,290 3,011,152 295 100,100 12,585 3,111,252
The majority of the Mining Exploitation Concessions held by SQM were requested primarily for non-
metallic mining purposes. However, a small percentage of our Mining Concessions were requested for
metallic mining purposes. The annual payment to the Chilean government for this group of concessions is
higher.
Geological studies over mining properties that were requested primarily for non-metallic mining purposes
may show that the concession area is of interest for metallic mining purposes, in which case we must
inform the Sernageomin, indicating that the type of substance contained by such Mining Concessions has
changed, for purposes of the annual payment for these rights.
Caliche: Facilities and Reserves
Caliche: Facilities
During 2017, caliche ore mining operations were focused in the first region of Chile, and our Nueva
Victoria mine was exploited. In November 2015, the mining and nitrate operations at Pedro de Valdivia
were suspended, and iodine production was reduced at the Pedro de Valdivia site, in order to take
advantage of the highly efficient production facilities at Nueva Victoria. Operations at the Pampa Blanca
site were suspended in 2010, and operations at the María Elena site were suspended in October 2013.
Nueva Victoria
The Nueva Victoria mine and facilities are located 140 kilometers southeast of Iquique and are accessible
by highway. Since 2007, the Nueva Victoria mine includes the mining properties Soronal, Mapocho and
Iris. At this site, we use caliche to produce salts rich in nitrates and iodine, through heap leaching and the
use of solar evaporation ponds. The main production facilities at this site include the operation centers for
the heap leaching process, the iodide and iodine plants at Nueva Victoria and Iris and the evaporation
ponds at the Sur Viejo sector of the site. The areas currently being mined are located approximately 4
kilometers northeast of Nueva Victoria. Solar energy and electricity are the primary sources of power for
this operation. We are currently developing a project to expand the production capacity of iodide and
iodine in Nueva Victoria to reach 11,000 metric tons per year.
Pampa Blanca
The mining facilities at Pampa Blanca, which is located 100 kilometers northeast of Antofagasta, have
been suspended since March 2010. At this site, we used caliche to produce nitrates and iodine through
heap leaching and the use of solar evaporation ponds. The main production facilities at this site included
the operation centers for the heap leaching system and the iodide plant. Electricity was the primary source
of power for this operation.
Pedro de Valdivia The Pedro de Valdivia mine and facilities are located 170 kilometers northeast of Antofagasta and are
accessible by highway. At this site, we used caliche to produce nitrates and iodine through vat leaching
and solar evaporation ponds. The main production facilities at this site include the crushing, vat leaching,
fines processing, nitrate crystallization plant, and iodide and iodine plants. In November 2015, the mining
and nitrate operations at Pedro de Valdivia were suspended, and iodine production was reduced.
Electricity, natural gas and fuel oil are the primary sources of power for this operation.
María Elena

3) DESCRIPTION OF BUSINESS ENVIRONMENT
41
The María Elena mine and facilities, named El Toco, are located 220 kilometers northeast of Antofagasta
and are accessible by highway. Until February 2010, caliche was used at this facility to produce nitrates
and iodine through vat leaching. Subsequently, these facilities were equipped to produce nitrates and
iodine through the use of heap leaching and solar evaporation ponds. Heap leaching operations at this site
were suspended in October 2013. During 2017, we continued to produce solutions rich in iodine and
nitrates by leaching the mine tailings. These solutions are treated at the iodide plant at María Elena, and
subsequently the prilled iodine is produced at Pedro de Valdivia.
Caliche: Reserves
Our in-house staff of geologists and mining engineers prepares our estimates of caliche ore reserves. The
Proven and Probable Reserve figures presented below are estimates, and may be subject to modifications
due to natural factors that affect the distribution of mineral grades, which would, in turn, modify the
recovery of nitrate and iodine. Therefore, no assurance can be given that the indicated levels of recovery
of nitrates and iodine will be realized.
We estimate ore reserves based on evaluations, performed by engineers and geologists, of assay values
derived from sampling of drill-holes and other openings. Drill-holes have been made at different space
intervals in order to recognize mining resources. Normally, we start with 400x400 meters and then we
reduce spacing to 200x200 meters, 100x100 meters and 50x50 meters. The geological occurrence of
caliche ore is unique and different from other metallic and non-metallic minerals. Caliche ore is found in
large horizontal layers at depths ranging from one to four meters and has an overburden between zero and
two meters. This horizontal layering is a natural geological condition and allows the Company to estimate
the continuity of the caliche bed based on surface geological reconnaissance and analysis of samples and
trenches. Mineral resources can be calculated using the information from the drill-hole sampling.
A Mineral Resource is a concentration or occurrence of natural, solid, inorganic or fossilized organic
material in or on the Earth’s crust in such form or quantity and of such grade or quality that it has
reasonable prospects for economic extraction. The location, quantity, grade, geological characteristics and
continuity of a mineral resource are known, estimated or interpreted from specific geological,
metallurgical and technological evidence.
A Measured Resource is the part of a Mineral Resource for which tonnage, densities, shape, physical
characteristics, grade and mineral content can be estimated with a high level of confidence. The estimate
is based on detailed exploration, sampling and testing information gathered through appropriate sampling
techniques from locations such as outcrops, trenches, and exploratory drill holes.
An Indicated Mineral Resource is the part of a Mineral Resource for which tonnage, densities, shape,
physical characteristics grade and mineral content can be estimated with a reasonable level of confidence.
The estimate is based on detailed exploration, sampling and testing information gathered through
appropriate sampling techniques from locations such as outcrops, trenches and exploratory drill holes.
According to our experience in caliche ore, the grid pattern drill-holes with spacing equal to or less than
100 meters produce data on the caliche resources that is sufficiently defined to consider them Measured
Resources and then, adjusting for technical, economic and legal aspects, as Proven Reserves. These
reserves are obtained using the Kriging Method and the application of operating parameters to obtain
economically profitable reserves.
Similarly, the information obtained from detailed geologic work and samples taken from grid pattern drill-
holes with spacing equal to or less than 200 meters can be used to determine Indicated Resources. By
adjusting such Indicated Resources to account for technical, economic and legal factors, it is possible to
calculate Probable Reserves. Probable Reserves are calculated by using a polygon-based methodology

3) DESCRIPTION OF BUSINESS ENVIRONMENT
42
and have an uncertainty or margin of error greater than that of Proven Reserves. However, the degree of
certainty of Probable Reserves is high enough to assume continuity between points of observation.
Proven Reserves are the economically mineable part of a Measured Resource. The calculation of the
reserves includes the application of mining parameters including maximum overburden, minimum
thickness of caliche ore, stripping ratio, cutoff grade and application of dilution factors to the grade values.
Appropriate assessments, including pre-feasibility studies or feasibility studies, have been carried out and
include consideration of metallurgical, economic, marketing, legal, environmental, social and
governmental factors. These assessments demonstrate at the time of reporting that extraction is reasonably
justified.
Probable Reserves are the economically mineable part of an Indicated Resource and in some cases a
Measured Resource. The calculation of the reserves includes the application of mining parameters
including maximum overburden, minimum thickness of caliche ore, stripping ratio, cutoff grade and
application of dilution factors to the grade values. Appropriate assessments, including pre-feasibility
studies, have been carried out or are in process and include consideration of metallurgical, economic,
marketing, legal, environmental, social and governmental factors. These assessments demonstrate at the
time of reporting that extraction is reasonably justified.
The estimates of Proven Reserves of caliche ore at each of our mines as of December 31, 2017 are set
forth below. The Company holds 100% of the concession rights for each of these mines.
Mine
Proven
Reserves (1)
(millions of
metric tons)
Nitrate
Average
Grade
(percentage by
weight)
Iodine
Average
Grade
(parts per
million)
Cutoff Grade
Average for Mine
(2)
Pedro de Valdivia (3) 109.0 7.1% 377 Nitrate 6.0 %
María Elena (4) 83.3 7.2% 436 Iodine 300 ppm
Pampa Blanca 54.7 5.7% 538 Iodine 300 ppm
Nueva Victoria (5) 346.2 6.3% 426 Iodine 300 ppm
In addition, the estimates of our Probable Reserves of caliche ore at each of our principal mines as of
December 31, 2017, are as follows:
Mine
Probable
Reserves (6)
(millions of
metric tons)
Nitrate
Average
Grade
(percentage by
weight)
Iodine
Average
Grade
(parts per
million)
Cutoff Grade
Average for Mine
(3)
Pedro de Valdivia (3) 334.7 7.3% 421 Nitrate 6.0 %
María Elena (4) 148.8 7.2% 381 Iodine 300 ppm
Pampa Blanca 464.6 5.7% 540 Iodine 300 ppm
Nueva Victoria (5) 1,020.7 5.3% 421 Iodine 300 ppm
Notes on Reserves:
(1) The Proven Reserves set forth in the table above are shown before losses related to exploitation and mineral treatment.
Proven Reserves are affected by mining exploitation methods, which result in differences between the estimated reserves
that are available for exploitation in the mining plan and the recoverable material that is finally transferred to the leaching
vats or heaps. The average mining exploitation factor for each of our different mines ranges between 80% and 90%,
whereas the average global metallurgical recoveries of processes for nitrate and iodine contained in the recovered material
vary between 60% and 70%.
(2) The cutoff grades for the Proven and Probable Reserves vary according to the objectives of each mine. These amounts
correspond to the averages of the different areas.

3) DESCRIPTION OF BUSINESS ENVIRONMENT
43
(3) Probable Reserves can be expressed as Proven Reserves using a conversion factor, only for purposes of obtaining a
projection to be used for long-term planning purposes. On average, this conversion factor is higher than 60%, depending
on geological conditions and caliche ore continuity, which vary from mine to mine (Pedro de Valdivia 60%, María Elena
50%, Pampa Blanca 70% and Nueva Victoria 60%).
The complete technical supporting documentation for the information set forth in the table above is
contained in the report “Methodology, Procedure, and Classification of SQM’s Nitrate and Iodine
Resources and Reserves for the Year 2017,” was prepared for each mine by the geologist Vladimir
Tejerina and other engineering professionals employed by SQM and validated by Mr. Sergio Alarcón and
Mr. Orlando Rojas.
Mr. Sergio Alarcón is a geologist with more than 30 years of experience in the field. He is currently
employed by SQM as a Senior Geologist in the Mining Production area. Mr. Alarcón is a Competent
Person (Persona Competente), as that term is defined under Chilean Law No. 20,235, known as the Law
that Regulates the Position of Competent Person and Creates the Qualifying Committee for Competencies
in Mining Resources and Reserves (Ley que Regula la Figura de las Personas Competentes y Crea la
Comisión Calificadora de Competencias de Recursos y Reservas Mineras or “Competent Person Law”).
He is registered under No. 164 in the Public Registry of Competent Persons in Mining Resources and
Reserves in accordance with the Competent Person Law and related regulations. He has worked as a
geologist with both metallic and non-metallic deposits, with vast experience in the latter.
Mr. Orlando Rojas is a civil mining engineer and independent consultant. He is Partner and Chief
Executive Officer of the company EMI-Ingenieros y Consultores S.A., whose offices are located at Renato
Sánchez No. 3357, Las Condes, Santiago, Chile. He is a member of the Institute of Mining Engineers and
is registered under No. 118 in the Public Registry of Competent Persons in Mining Resources and
Reserves in accordance with the Competent Person Law and related regulations. He has worked as a
mining engineer for 40 years since graduating from university, including more than 34 years working on
estimates for reserves and resources.
Copies of the certificates of qualified competency issued by the Chilean Mining Commission are
presented below:

3) DESCRIPTION OF BUSINESS ENVIRONMENT
44

3) DESCRIPTION OF BUSINESS ENVIRONMENT
45

3) DESCRIPTION OF BUSINESS ENVIRONMENT
46
The proven and probable reserves shown above are the result of the evaluation of approximately 20.98%
of the total caliche-related mining property of our Company. However, we have explored more intensely
the areas in which we believe there is a higher potential of finding high-grade caliche ore minerals. The
remaining 79.02% of this area has not been explored or has had limited reconnaissance, which is not
sufficient to determine the sources of potential and hypothetical resources. In 2017, we did not carry out
basic reconnaissance of new mining properties. With respect to detailed explorations, in 2017, we carried
out recategorizations of indicated resources in the Nueva Victoria West South and Tente en el Aire sectors,
totaling 1,493.9 hectares, which is still in process. Our 2018 exploration program includes the exploration
of the Tente en el Air section, which totals 3,114 hectares, and the basic study of 24,607 hectares of Franja
Oeste sector. The reserves shown in these tables are calculated based on properties that are not involved
in any legal disputes between SQM and other parties.
Caliche ore is the key raw material used in the production of iodine, specialty plant nutrients and industrial
chemicals. The following gross margins for the business lines specified were calculated on the same basis
as cut off grades used to estimate our reserves. We expect costs to remain relatively stable in the near
future.
2017 2016 2015
Gross
Margin
Price Gross
Margin
Price Gross
Margin
Price
Iodine and
Derivatives
21% US$20/kg 17% US$23/kg 30% US$28/kg
Specialty Plant
Nutrition
20% US$722/ton 23% US$742/ton 29% US$784/ton
Industrial
Chemicals
32% US$809/ton 35% US$808/ton 27% US$770/ton
We maintain an ongoing program of exploration and resource evaluation on the land surrounding our
production mines, and other sites for which we have the appropriate concessions.
Brines from the Salar de Atacama: Facilities and Reserves
Salar de Atacama: Facilities
Salar de Atacama
Our facilities at the Salar de Atacama are located 208 kilometers to the east of the city of Antofagasta and
188 kilometers to the southeast of the city of María Elena. At this site we use brines extracted from the
salar to produce potassium chloride, potassium sulfate, boric acid, magnesium chloride salts and lithium
solutions, which are subsequently sent to our lithium carbonate plant at the Salar del Carmen for
processing. The main production plants at this site include the potassium chloride flotation plants (MOP-
H I and II), the potassium carnallite plants (PC I and extension), the potassium sulfate flotation plant (SOP-
H), the boric acid plant (ABO), the potassium chloride drying plant (Dual Plant or MOP-S), the potassium
chloride compacting plant (MOP-G), the potassium sulfate drying plant (SOP-S) and the potassium sulfate
compacting plant (SOP-G). Solar energy is the primary energy source used for the Salar de Atacama
operations.
Salar de Atacama: Reserves
Our in-house staff of hydro-geologists and geologists prepares our estimates of the reserve base of
potassium, sulfate, lithium and boron dissolved in brines at the Salar de Atacama. We have exploitation
concessions covering an area of 81,920 hectares, in which we have carried out geological exploitation,
brine sampling and geostatistical analysis. We estimate that our proven and probable reserves as of
December 31, 2017, based on economic restrictions, geological exploitation, brine sampling and
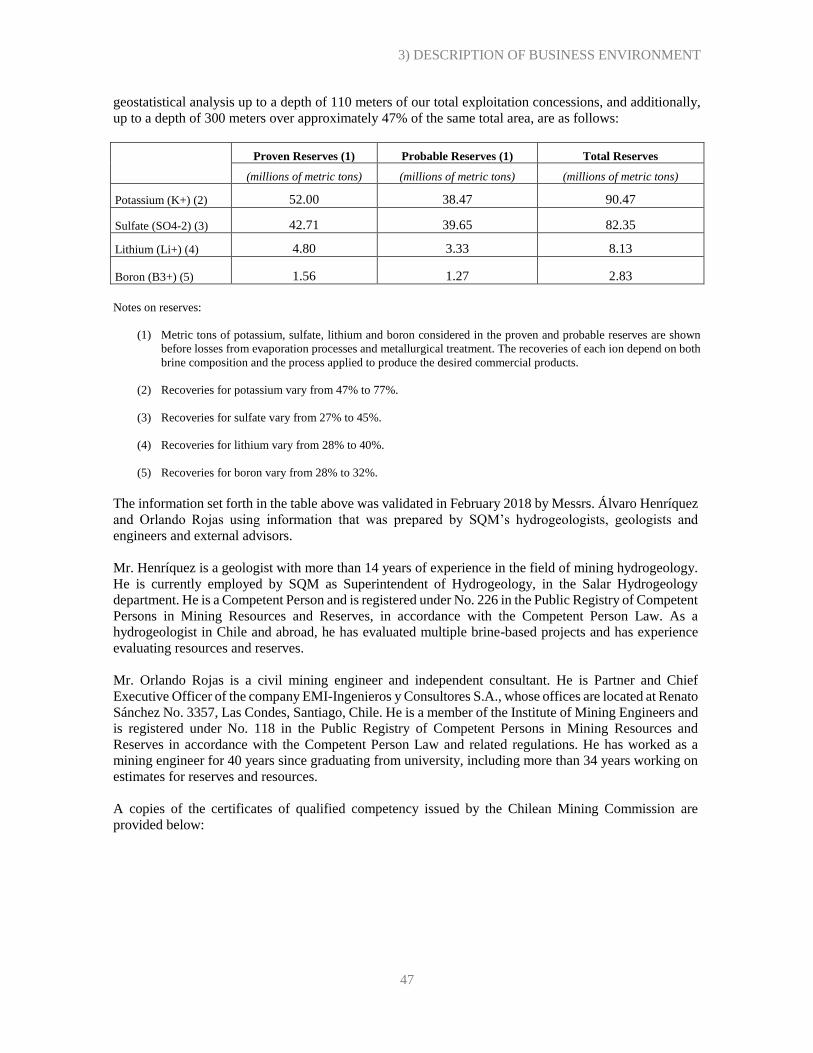
3) DESCRIPTION OF BUSINESS ENVIRONMENT
47
geostatistical analysis up to a depth of 110 meters of our total exploitation concessions, and additionally,
up to a depth of 300 meters over approximately 47% of the same total area, are as follows:
Proven Reserves (1) Probable Reserves (1) Total Reserves
(millions of metric tons) (millions of metric tons) (millions of metric tons)
Potassium (K+) (2) 52.00 38.47 90.47
Sulfate (SO4-2) (3) 42.71 39.65 82.35
Lithium (Li+) (4) 4.80 3.33 8.13
Boron (B3+) (5) 1.56 1.27 2.83
Notes on reserves:
(1) Metric tons of potassium, sulfate, lithium and boron considered in the proven and probable reserves are shown
before losses from evaporation processes and metallurgical treatment. The recoveries of each ion depend on both
brine composition and the process applied to produce the desired commercial products.
(2) Recoveries for potassium vary from 47% to 77%.
(3) Recoveries for sulfate vary from 27% to 45%.
(4) Recoveries for lithium vary from 28% to 40%.
(5) Recoveries for boron vary from 28% to 32%.
The information set forth in the table above was validated in February 2018 by Messrs. Álvaro Henríquez
and Orlando Rojas using information that was prepared by SQM’s hydrogeologists, geologists and
engineers and external advisors.
Mr. Henríquez is a geologist with more than 14 years of experience in the field of mining hydrogeology.
He is currently employed by SQM as Superintendent of Hydrogeology, in the Salar Hydrogeology
department. He is a Competent Person and is registered under No. 226 in the Public Registry of Competent
Persons in Mining Resources and Reserves, in accordance with the Competent Person Law. As a
hydrogeologist in Chile and abroad, he has evaluated multiple brine-based projects and has experience
evaluating resources and reserves.
Mr. Orlando Rojas is a civil mining engineer and independent consultant. He is Partner and Chief
Executive Officer of the company EMI-Ingenieros y Consultores S.A., whose offices are located at Renato
Sánchez No. 3357, Las Condes, Santiago, Chile. He is a member of the Institute of Mining Engineers and
is registered under No. 118 in the Public Registry of Competent Persons in Mining Resources and
Reserves in accordance with the Competent Person Law and related regulations. He has worked as a
mining engineer for 40 years since graduating from university, including more than 34 years working on
estimates for reserves and resources.
A copies of the certificates of qualified competency issued by the Chilean Mining Commission are
provided below:

3) DESCRIPTION OF BUSINESS ENVIRONMENT
48

3) DESCRIPTION OF BUSINESS ENVIRONMENT
49

3) DESCRIPTION OF BUSINESS ENVIRONMENT
50
A cutoff grade of 1% K is used in the calculation, considering a low margin scenario using only MOP-
S as and using diluted brine with higher levels of contaminants as the raw material and with recovery
yields of approximately 47%, which is on the lower end of the range. In this scenario, considering current
market conditions and market conditions from recent years, the production cost of MOP production is still
competitive.
The cutoff grade for lithium extraction is set at 0.05% Li. The cost of the process is competitive in the
market despite a small cost increase due to the expansions in the evaporation area (to reach the required
Li concentration) and to the use of additives to maintain the quality of the brine that is used to feed the
plant.
The proven and probable reserves are based on production experience, drilling, brine sampling and geo-
statistic reservoir modeling in order to estimate brine volumes and their composition. We calculate the
reserve base, which is the volume of brine effectively drainable or exploitable in each evaluation unit, by
building a three-dimensional block model. The following variables are used to populate the model:
Porosity: obtained from measurements of drainable porosity in core rocks, test pumping data,
geophysical records and changes in the level of the brine. The volume of brine is estimated on
the basis of the interpolation of the drainable porosity data.
Grades: The brine chemistry is subjected to an exploratory data analysis and a variographic
analysis, in order to determine the chemical populations in the Salar. Subsequently, the grades
are interpolated using the Kriging method.
Based on the chemical characteristics, the volume of brine and drainable porosity, we determine the
number of metric tons for each of the chemical ions being evaluated.
Reserves are defined as those geographical blocks which belong to properly identified hydrogeological
units with proven historical brine yield production, and a quality and piezometric brine monitoring
network to control brine evolution over time. Reserve classification is finally achieved by using the
geostatistical estimation error and hydrogeological knowledge of the units that have been explored, as an
indicator between proven and probable reserves.
Probable reserves and inferred resources are being explored in order to be able to reclassify them as proven
reserves and indicated or measured resources, respectively. This exploration includes systematic packer
testing, chemical brine sampling and long-term pilot production pumping tests.
We consider chemical parameters to determine the process to be applied to the brines. These parameters
are used to estimate potential restrictions on production yields, and the economic feasibility of producing
such commercial products as potassium chloride, potassium sulfate, lithium carbonate and boric acid is
determined on the basis of the evaluation.
Complementing the reserves information, SQM has an environmental impact assessment (RCA 226/06)
which defines a maximum brine extraction until the end of the Lease Agreement (December 31, 2030).
Considering the authorized maximum brine production rates, and including reinjection factors, we have
performed several hydrogeological numeric simulations to estimate changes in the volume and quality of
the brine during the life of the project, considering the same ponds infrastructure existing on January 1,
2018. According to these simulations, a total of 20.9 million metric tons of potassium and 1.55 million
metric tons of lithium will be extracted from the producing wells, without considering the returns by direct
and indirect reinjection. On the other hand, the proven and probable base reserve, within the authorized
area of environmental extraction (RCA 226/06), corresponds to 34.01 million metric tons of potassium
and 3.99 million metric tons of lithium, enough to satisfy the demand of the project until the end of the
concession.

3) DESCRIPTION OF BUSINESS ENVIRONMENT
51
Brines from the Salar de Atacama are the key raw material used in the production of potassium chloride
and potassium sulfate, and lithium and its derivatives. The following gross margins for the business lines
specified were calculated on the same basis as cut off grades used to estimate our reserves. We expect
costs to remain relatively stable in the near future.
2017 2016 2015
Gross
Margin
Price Gross
Margin
Price Gross
Margin
Price
Potassium
Chloride and
Potassium Sulfate 17% US$282/ton 11% US$263/ton 29% US$347/ton
Lithium and
Derivatives 71% US$12,970/ton 66% US$10,362/ton 51% US$5,759/ton
Other Production Facilities
Coya Sur
The Coya Sur site is located approximately 15 kilometers south of María Elena, and production activities
undertaken there are associated with the production of potassium nitrate and finished products. The main
production plants at this site include four potassium nitrate plants with a total capacity of 1,300,000 metric
tons per year. There are also five production lines for crystallized nitrates, with a total capacity of
1,200,000 metric tons per year, and a prilling plant with a capacity of 320,000 metric tons per year. The
potassium nitrate produced at Coya Sur is an intermediate product that is used as a raw material for the
production of finished products (crystallized nitrates and prilled nitrates). Therefore, the production
capacities listed above are not independent of one another and cannot be added together to obtain an overall
total capacity. Natural gas is the main source of energy for our Coya Sur operation.
Salar del Carmen
The Salar del Carmen site is located approximately 14 kilometers to the east of Antofagasta. The
production plants at this facility include the lithium carbonate plant, with a production capacity of 48,000
metric tons per year, and the lithium hydroxide plant, with a production capacity of 6,000 metric tons per
year. Electricity and natural gas are the main sources of energy for our Salar del Carmen operation.

3) DESCRIPTION OF BUSINESS ENVIRONMENT
52
The following table provides a summary of our production facilities:
Facility Type of Facility
Approximate
Size
(hectares) (1)
Nominal Production
Capacity
(thousands of metric tons/year)
Weighted
Average Age
(years) (2)
Gross
Book
Value
(millions of
US$) (2)
Coya Sur (3) (4) Nitrates production 1,518 Potassium nitrate: 1,000
Crystallized nitrates: 1,200
Prilled nitrates: 320
8.3 573.1
María Elena (5) (6) Nitrates and iodine
production
35,830 Nitrates: n/a
Iodine: 1.6
Prilled nitrates: 300
14.5 433.2
Nueva Victoria (5) (7) Concentrated nitrate salts
and iodine production
47,492 Iodine: 9.0 8.3 490.6
Pampa Blanca (5) (7) (8) Concentrated nitrate salts
and iodide production
10,441 Nitrates: n/a
Iodine: n/a
9.5 7.1
Pedro de Valdivia (3) (9) Nitrates and iodine
production
253,880 Nitrates: n/a
Iodine: 3.2
12.4 217.8
Salar de Atacama (3) (10) Potassium chloride,
potassium sulfate, lithium
chloride, and boric acid
production
35,911 Potassium chloride: 2,680
Potassium sulfate: 245
Boric acid: 15
9.9 1,542.5
Salar del Carmen,
Antofagasta (3)
Lithium carbonate and
lithium hydroxide
production
126 Lithium carbonate: 48
Lithium hydroxide: 6
12.1 178.4
Tocopilla (11) Port facilities 22 - 12.7 175.4
(1) Approximate size considers both the production facilities and the mine for María Elena, Nueva Victoria, Pampa
Blanca, Pedro de Valdivia and the Salar de Atacama. Mining areas are those authorized for exploitation by the
environmental authority and/or Sernageomin.
(2) Weighted average age and gross book value correspond to production facilities, excluding the mine, for María Elena,
Nueva Victoria, Pampa Blanca, Pedro de Valdivia and the Salar de Atacama.
(3) Includes production facilities and solar evaporation ponds.
(4) The potassium nitrate produced at Coya Sur is an intermediate product that is used as a raw material for the production
of finished products (crystallized nitrates and prilled nitrates). Therefore, the production capacities listed above are
not independent of one another and cannot be added together to obtain an overall total capacity.
(5) Includes production facilities, solar evaporation ponds and leaching heaps.
(6) Operations at the El Toco mine at María Elena were suspended in November 2013.
(7) The nominal production capacity for iodine considers the capacity of our plants. The effective capacity is 11,000
metric tons per year.
(8) Operations at Pampa Blanca were suspended in March 2010.
(9) In November 2015, the mining and nitrate operations at Pedro de Valdivia were suspended, and iodine production
was reduced at the Pedro de Valdivia site, in order to take advantage of the highly efficient production facilities at
Nueva Victoria.
(10) Potassium chloride and potassium sulfate are produced in a dual plant, and the production capacity for each of these
products depends on the production mix. Therefore, the production capacities for these two products are not
independent of one another and cannot be added together to obtain an overall total capacity.
(11) The Tocopilla port facilities were originally constructed in 1961 and have been refurbished and expanded since that
time.
The railway line that runs between our Coya Sur production facilities and our Tocopilla port facilities was
damaged in August 2015 as a result of storms in the north of Chile. The train is not currently operating
and as a consequence, we have replaced the train with trucks to ship products from Coya Sur. Detailed engineering studies were performed to assess the damage of the railway. During the third quarter of 2016,
the report was completed; it concluded that the cost and time needed to repair the railway at this time is
not economical in the short and medium term. As a result of this determination, the Company wrote-off

3) DESCRIPTION OF BUSINESS ENVIRONMENT
53
the assets related to the train. We do not believe it will materially impact future sales volumes or
transportation costs.
We consider the condition of our principal plant and equipment to be good, with the exception of the
railway line.
We directly or indirectly through subsidiaries own, lease or hold concessions over the facilities at which
we carry out our operations. Such facilities are free of any material liens, pledges or encumbrances, and
we believe they are suitable and adequate for the business we conduct in them.
Extraction Yields
The following table shows certain operating data relating to each of our mines for 2017, 2016 and 2015:
(in thousands, unless otherwise stated) 2017 2016 2015
Pedro de Valdivia(1)
Metric tons of ore mined .......................................................... - - 9,754
Average grade nitrate (% by weight) ....................................... - - 7.8
Iodine (parts per million (ppm)) ............................................... - - 424
Metric tons of crystallized nitrate produced ............................. - - 346
Metric tons of iodine produced ................................................ 0.9 0.6 2.8
Maria Elena(2)
Metric tons of ore mined .......................................................... - - -
Average grade nitrate (% by weight) ....................................... - - -
Iodine (ppm) ............................................................................ - - -
Metric tons of crystallized nitrate produced ............................. - - -
Metric tons of iodine produced ................................................ 0.0 0.2 0.1
Coya Sur(3)
Metric tons of crystallized nitrate produced ............................. 613 573 611
Pampa Blanca(2)
Metric tons of ore mined .......................................................... - - –
Iodine (ppm) ............................................................................ - - –
Metric tons of iodine produced ................................................ - - –
Nueva Victoria
Metric tons of ore mined .......................................................... 36,383 29,902 23,969
Iodine (ppm) ............................................................................ 458 454 458
Metric tons of iodine produced ................................................ 8.8 7.7 7.5
Salar de Atacama (4)
Metric tons of lithium carbonate produced .............................. 45 44 33
Metric tons of potassium chloride and potassium sulfate and
potassium salts produced ..................................................... 1,881 2,045
1,988

3) DESCRIPTION OF BUSINESS ENVIRONMENT
54
(1) In November 2015, mining and nitrate operations at Pedro de Valdivia were suspended, and iodine production was
reduced at the Pedro de Valdivia site, in order to take advantage of the highly efficient production facilities at Nueva
Victoria.
(2) Operations at the El Toco and Pampa Blanca mines were suspended in November 2013 and March 2010, respectively.
During 2014 and 2015, María Elena obtained production from caliche ore exploited in prior years.
(3) Includes production at Coya Sur from treatment of nitrates solutions from María Elena and Pedro de Valdivia, nitrate
salts from pile treatment at Nueva Victoria, and net production from NPT, or technical grade potassium nitrate, plants.
(4) Lithium carbonate is extracted at the Salar de Atacama and processed at our facilities at
the Salar del Carmen. Potassium salts include synthetic sylvinite produced in the plant and other harvested potassium
salts (natural sylvinite, carnalites and harvests from plant ponds) that are sent to Coya Sur for the production of
crystallized nitrates.
Transportation and Storage Facilities
The transportation of our products is carried out by trucks that are operated by dedicated third parties
through long term contracts. Furthermore, we own port and storage facilities for the transportation and
management of finished products and consumable materials.
Our main centers for the production and storage of raw materials are the Nueva Victoria, Coya Sur and
Salar de Atacama facilities. Other facilities include chemical plants for the finished products of lithium
carbonate and lithium hydroxide at the Salar del Carmen plant. The Port of Tocopilla terminal, which we
own, has a surface area of approximately 22 hectares and is the principal facility for the storage and
shipment of our bulk products and packaged potassium chloride (MOP), potassium sulfate (SOP) and
nitrates.
The nitrate finished products are produced at our Coya Sur facilities and then transported via trucks to the
Port of Tocopilla terminal where they are stored and shipped, either packaged (polypropylene bags,
polyethylene or polypropylene FIBC big bags) or in bulk. The potassium chloride is produced at our Salar
de Atacama facilities and we transport it by truck, either to the Port of Tocopilla terminal or the Coya Sur
facility. The product transported to Coya Sur is an intermediate product that is used as a raw material for
the production of potassium nitrate. On the other hand, the product transported to the Port of Tocopilla is
a final product that will be shipped or transported to the client or affiliate. The raw material of nitrate for
the production of potassium nitrate in Coya Sur is currently produced at Nueva Victoria and the remaining
raw material is provided from historical stock stored in Coya Sur that was produced at the Pedro de
Valdivia facility when it was operating. This raw material is obtained from the processing of caliche that
is extracted from our mines. On the other hand, potassium sulfate is produced at our Salar de Atacama
facilities and later transported by trucks to the Port of Tocopilla terminal.
The lithium chloride solution, which contains a high concentration of boron, produced at our Salar de
Atacama facilities, is transported to the lithium carbon plant in the Salar del Carmen area where the
finished lithium carbonate is produced. Part of the lithium carbonate is provided to the adjacent lithium
hydroxide plant where the finished lithium hydroxide is produced. These two products are packed in
packaging of distinct characteristics (polyethylene bags, multi-layer or polypropylene FIBC big bags),
stored within the same facilities and secured in roofed storerooms. Thereafter, they are consolidated into
containers that are transported by trucks to a transit warehouse or directly to port terminals for their
subsequent shipment. The port terminals used are currently suited to receive container ships and are
situated in Antofagasta, Mejillones and Iquique.
Iodine obtained from the same caliche used for the production of nitrates, is processed, packaged and
stored exclusively in the Pedro de Valdivia and Nueva Victoria facilities. The packaging used for iodine
are drums and polypropylene FIBC big bags with an internal polyethylene bag and oxygen barrier, which
at the time of transportation are consolidated into containers and sent by truck to port terminals suited for
their management, principally located in Antofagasta, Mejillones and Iquique. Thereafter, they are sent to
distinct markets by container ship or by truck to Santiago where iodine derivatives are produced in the
Ajay-SQM Chile plants.

3) DESCRIPTION OF BUSINESS ENVIRONMENT
55
The Port of Tocopilla terminal facilities are located approximately 186 kilometers north of Antofagasta,
approximately 124 kilometers west of María Elena and Coya Sur and 372 kilometers to the west of Salar
de Atacama. Our affiliate, Servicios Integrales de Tránsitos y Transferencias S.A. (SIT), operates facilities
for the shipment of products and the delivery of certain raw materials based on renewable concessions
granted by Chilean regulatory authorities, provided that the facilities are used in accordance with the
authorization granted and we pay an annual concession fee. The Port of Tocopilla terminal facilities
include a truck weighing machine that confirms product entry into the port and transfers the product to
distinct storage zones, a piezometer within the shipping system to carry out bulk product loaded onto ships
and a crane with a 40 ton capacity for the loading of sealed product onto ships.
The storage facilities consist of a system of six silos, with a total storage capacity of 55,000 metric tons,
and a mixed storage area of open storehouses with a total storage capacity of approximately 250,000 metric
tons. In addition, to fulfill future storage needs, we will continue to make investments in accordance with
the investment plan outlined by management. The products are also put into bags at the Port of Tocopilla
terminal facilities where the bagging capacity is established by two bag packaging machines, one for sacks
and polypropylene FIBC big bags and one for FFS polyethylene. The products that are packaged in
Tocopilla may be subsequently shipped at the same port or may also be consolidated into trucks or
containers for its subsequent dispatch to clients by land or sea through containers from other ports,
principally located in Antofagasta, Mejillones and Iquique.
For the transportation of bulk product, the transportation belt system extends across the coastline to deliver
products directly to the hatches of bulk cargo ships. The nominal load capacity of this shipping system is
1,200 tons per hour. The transportation of packaged product is carried out utilizing the same bulk cargo
ships using trailers without motors located in the dock and loaded by a crane with a 40 ton capacity from
the Port of Tocopilla terminal. Thereafter, they are towed and unloaded using ship cranes to the respective
warehouses.
We normally contract bulk cargo ships to transfer the product from the Port of Tocopilla terminal to our
hubs around the world or to clients directly, who, in certain instances, use their own contracted vessels for
delivery.
Tocopilla processes related to the reception, handling, storage and shipment of bulk/packaged nitrates
produced at Coya Sur are certified by the third-party organization TÜV-Rheiland under the quality
standard ISO 9001:2008.
Computer System
In addition to the above-listed facilities, we operate varies computer and information systems linking our
principal subsidiaries to our operating facilities throughout Chile via a local area network. The computer
and information system is used mainly for accounting, monitoring of supplies and inventories, billing,
quality control, research activities and production process and maintenance control. The mainframe
computing system is located at our offices in Santiago.
In addition, we have incorporated Cloud technologies to have a platform that allows us to support new
business processes, related to IoT (Internet of Things), Advanced Analytics and business enablers.
3) E) DESCRIPTION OF BUSINESS ENVIRONMENT: RISK FACTORS
Risk Factors
Our operations are subject to certain risk factors that may affect SQM’s business financial condition or
results of operations. In addition to other information contained in this Annual Report, you should

3) DESCRIPTION OF BUSINESS ENVIRONMENT
56
carefully consider the risks described below. These risks are not the only ones we face. Additional risks
not currently known to us or that are known but that we currently believe are not significant may also
affect our business operations. Our business, financial condition, cash flows or results of operations could
be materially affected by the occurrence any of these risks.
Risks Relating to our Business
We could be subject to numerous risks in the U.S. and Chile as a result of ongoing investigations by
the Chilean Internal Revenue Service and the Chilean Public Prosecutor in relation to certain
payments made by SQM between the tax years 2009 and 2015
The SII has conducted investigations related to the payment of invoices by SQM and its subsidiaries,
SQM Salar S.A. and SQM Industrial S.A., for services that may not have been properly supported or that
may not have been necessary to generate corporate income. The Chilean Public Prosecutor also has
conducted related inquiries to determine whether such payments may be linked with alleged violations by
SQM, these subsidiaries and public officials of political contribution or anti-corruption laws.
On February 26, 2015, SQM’s Board of Directors resolved to establish an ad-hoc committee of the Board
of Directors (the “ad-hoc Committee”) authorized to conduct an internal investigation relating to the
issues that were the subject of the SII and the Chilean Public Prosecutor investigations and to retain such
independent external advice as it deemed appropriate. The original members of the ad-hoc Committee
were former Board members José María Eyzaguirre B., Juan Antonio Guzmán M. and Wolf von Appen
B.
The ad-hoc Committee engaged its own lawyers from Chile and the U.S. and forensic accountants from
the U.S. to assist with its internal review. The U.S. lawyers retained by the ad-hoc Committee were
principally charged with reviewing the relevant facts and analyzing those facts against the requirements
of the U.S. Foreign Corrupt Practices Act (FCPA). The factual findings of the ad-hoc Committee,
however, were ultimately shared with Chilean as well as U.S. authorities.
On March 12, 2015, José María Eyzaguirre B. resigned from the ad-hoc Committee and his position was
subsequently filled by former Board member Hernán Büchi B.
On March 16, 2015, the Board of Directors decided to terminate the employment contract of the
Company’s then- CEO, Patricio Contesse G. This followed his failure to cooperate with the ad-hoc
Committee’s investigation.
On March 17, 2015, three members of the Board of Directors resigned, all of whom had been nominated
by Potash Corporation of Saskatchewan Inc. (“PCS”), which was one of SQM’s two principal shareholder
groups at such time. PCS merged with Agrium Inc. on January 1, 2018, forming Nutrien Ltd. (“Nutrien”),
which is currently the owner of 32% of the total outstanding shares of SQM. PCS issued a press release
stating that the directors resigned because of their concern that they could not ensure that the Company
was conducting an appropriate investigation and collaborating effectively with the Chilean Public
Prosecutor.
On March 20, 2015, the Company identified to the SII approximately US$11 million in payments of
invoices that may not have been properly supported by services rendered or that may not qualify as tax
expenses under the Chilean tax code. These payments originated from the office of the former CEO,
Patricio Contesse G., during the six-year tax period from 2009 to 2014. As a result, the Company
subsequently submitted amendments to its tax returns for the 2009 to 2014 tax years and thereafter paid
taxes and interest relating to such amended returns totaling approximately US$7 million. On April 24,
2015, the Company announced that it had identified up to an additional US$2 million in payments by its
subsidiary SQM Salar S.A. during the same six-year tax period that were also authorized by the former

3) DESCRIPTION OF BUSINESS ENVIRONMENT
57
CEO and that may be deemed not properly supported by services rendered or that may not qualify as tax
expenses under the Chilean tax code. Subsequently, SQM Salar filed amended tax returns and paid taxes
and interest relating to such amended returns totaling approximately US$1.2 million. On August 14, 2015,
the Company announced that it had identified to the SII approximately US$1.6 million in additional
payments by SQM S.A. and its subsidiary SQM Industrial S.A. that may be deemed not properly
supported by services rendered or that may not qualify as tax expenses under the Chilean tax code. SQM
S.A. and SQM Industrial S.A. subsequently filed amended tax returns and, in early 2016, SQM Industrial
S.A. paid taxes and interest relating to such amended returns totaling approximately US$0.3 million, and
SQM S.A. paid taxes and interest relating to such amended returns totaling approximately US$1.3 million.
The statute of limitations under Chilean law for tax claims is up to six years, during which period the
former CEO had an annual discretionary budget covering the Company and its subsidiaries of
approximately US$6 million.
On March 23, 2015, the SII, based on the Income Tax Law (Ley de Impuesto a La Renta), filed a criminal
claim against the Company’s former CEO and the current CEO and CFO in their capacities as the
Company’s tax representatives relating to part of the payments referred to above. This and subsequent
related similar claims filed by the SII against these officers and third parties are currently under review
by the Chilean Public Prosecutor.
On March 31, 2015, the CMF filed an administrative claim against five then-current and former members
of the Board of Directors, alleging that they did not release information in a timely manner relating to the
payments that are subject to the tax claim referred to above. On September 30, 2015, the CMF proceeded
to fine them UF1,000 each (approximately US$36,000). They are currently appealing this decision to the
Chilean courts.
On April 24, 2015, new members were elected to the Board of Directors at the Annual General
Shareholders’ Meeting, including three new members that were nominated by PCS, and the ad-hoc
Committee was subsequently reconstituted by Board of Directors members Robert A. Kirkpatrick, Wolf
von Appen B. and Edward J. Waitzer.
On April 30, 2015, the Chilean Public Prosecutor, after reviewing the claims filed by the SII, informed
the Company’s former CEO that it was formally investigating allegations that he approved the payment
of invoices that may not be properly supported by services rendered or that may not qualify as tax expenses
under the Chilean tax code and in connection therewith made intentionally false or incomplete
declarations or used fraudulent procedures designed to conceal or disguise the true amount of transactions
or to circumvent taxes. If he is finally adjudicated responsible, the Company may also be subject to the
payment of a fine by the Chilean Criminal Court totaling 50% to 300% of the taxes paid. The Company
estimates that no provision is needed at this stage.
On May 11, 2015, the SII filed an additional criminal claim against the former CEO and the current CEO
and CFO in their capacities as the Company’s tax representatives alleging violations of the Chilean
Inheritance and Donations Law (Ley sobre Impuesto a Las Herencias, Asignaciones y Donaciones). The
claim states that the Company paid two invoices in 2009 and 2010 totaling approximately US$175,000
that are alleged to have been improperly supported. The claim states that these payments should have
been classified as donations, and appropriate taxes should have been paid. These payments were
accounted for in the amended tax returns filed with the SII. Subsequently, the SII filed a number of
additional claims against these officers and third parties alleging violations of Chilean tax law and the
Chilean Inheritance and Donations Law. The most recent of these criminal claims was filed by the SII on
March 9, 2016. All of these claims are under review by the Chilean Public Prosecutor.
On September 29, 2015, the Company was notified of a labor lawsuit by its former CEO, Patricio
Contesse, claiming payment from the Company related to the termination of his employment contract.
The total amount claimed in the lawsuit is approximately Ch$4.0 billion (approximately US$5.7 million),

3) DESCRIPTION OF BUSINESS ENVIRONMENT
58
including severance payments for years of service and other legal or contractual payments. The lower
court held that Mr. Contesse’s claim was barred by the statute of limitations. On November 8, 2016, the
Santiago Court of Appeals overruled the lower court decision. On March 27, 2017, the Company reached
an agreement with Mr. Contesse to terminate the labor lawsuit Mr. Contesse filed against the Company.
The amount included in the agreement was provisioned for in the financial statements as of December 31,
2016.
On October 14, 2015, two class action complaints then pending against the Company, our former CEO
and current CEO and CFO, alleging violations of the U.S. securities laws in connection with the subject
matter of the investigations described above, were consolidated into a single action in the United States
District Court for the Southern District of New York. On November, 13, 2015, our former CEO and
current CEO and CFO were voluntarily dismissed from the case without prejudice. On January 15, 2016,
the lead plaintiff filed a consolidated class action complaint exclusively against the Company. On January
10, 2018, the lead plaintiff filed a motion to certify a class consisting of all persons who purchased SQM
ADSs between June 30, 2010 and March 18, 2015. For more information on the consolidated class action,
see “Item 8.A.7 Legal Proceedings.”
During 2015, the ad-hoc Committee that was established in February 15, 2015, conducted an investigation
into whether the Company faced possible liability under the FCPA. The ad-hoc Committee engaged its
own separate counsel, Shearman & Sterling LLP, which presented a report to the Board of Directors on
December 15, 2015.
Following the presentation by the ad-hoc Committee of its findings to the Board of Directors, the
Company voluntarily shared the findings of the ad-hoc Committee investigation with authorities in Chile
and the U.S. (including the U.S. Securities and Exchange Commission (“SEC”) and the U.S. Department
of Justice (“DOJ”)).
On January 13, 2017, the Company and the DOJ reached agreement on the terms of a Deferred
Prosecution Agreement (“DPA”) that would resolve the DOJ’s inquiry, based on alleged violations of the
books and records and internal controls provisions of the Foreign Corrupt Practices Act. Among other
terms, the DPA called for the Company to pay a monetary penalty of US$15,487,500, and engage a
compliance monitor for a term of two (2) years. Upon successful completion of the three (3) year term of
the DPA, all charges against the Company will be dismissed. On the same date, the SEC agreed to resolve
its inquiry through an administrative cease and desist order, arising out of the alleged violations of the
same accounting provisions of the FCPA. Among other terms, the SEC order called for the Company to
pay an additional monetary penalty of US$15 million. These penalties were reflected in the 2016 financial
statements.
On January 26, 2018, the 8th Court of Santiago approved a deferred prosecution agreement proposed by
the Chilean Public Prosecutor relating to SQM and its subsidiaries SQM Salar and SQM Nitratos S.A., to
suspend an investigation against these entities related to potential corruption issues and responsibility for
the lack of supervision and management. Under the deferred prosecution agreement, SQM, SQM Salar
and SQM Nitratos S.A., have not admitted responsibility in the matter subject to the investigation but
agreed to pay an aggregate amount of (i) Ch$900,000,000 to the Chilean government, and (ii)
Ch$1,650,000,000 to various charitable organizations. As of January 26, 2018, these amounts were
equivalent to approximately US$1.5 million and US$2.8 million, respectively, and were accrued in the
Consolidated Financial Statements of the Company for 2017. In addition, the companies have agreed to
provide the Chilean Public Prosecutor with a report on the enhancements to their compliance program,
implemented in recent years, with special emphasis on the incorporation of best practices in various
jurisdictions.
Responding to our regulators’ inquiries and any future civil, criminal or regulatory inquiries or
proceedings diverts our management’s attention from day-to-day operations. Additionally, expenses that

3) DESCRIPTION OF BUSINESS ENVIRONMENT
59
may arise from responding to such inquiries or proceedings, our review of responsive materials, any
related litigation or other associated activities may continue to be significant. Current and former
employees, officers and directors may seek indemnification, advancement or reimbursement of expenses
from us, including attorneys’ fees, with respect to the current inquiry or future proceedings related to this
matter. The occurrence of any of the foregoing or adverse determination in litigation or other proceedings
or similar actions could materially and adversely affect our business, financial condition, cash flows,
results of operations and the prices of our securities.
The failure to amend the Lease Agreement and the Project Agreement relating to the Salar de Atacama
concession could have a material adverse effect on our business, financial condition and results of
operations
Our subsidiary SQM Salar S.A. (“SQM Salar”), as leaseholder, holds exclusive and temporary rights over
the mineral resources in an area covering approximately 140,000 hectares of land in the Salar de Atacama
in northern Chile, of which SQM Salar is entitled to exploit the mineral resources in 81,920 hectares.
These rights are owned by Corfo and leased to SQM Salar pursuant to (i) a 1993 lease agreement over
mining exploitation concessions between SQM Salar and Corfo, a Chilean government entity (the “Lease
Agreement”), and (ii) the Salar de Atacama project agreement between Corfo and SQM Salar (the “Project
Agreement”). Corfo may not unilaterally amend the Lease Agreement or the Project Agreement. The
Lease Agreement establishes that SQM Salar is responsible for making quarterly lease payments to Corfo,
maintaining Corfo’s rights over the mining exploitation concessions, and making annual payments to the
Chilean government for such concession rights. The Lease Agreement expires on December 31, 2030.
Furthermore, under the regulations of the Chilean Nuclear Energy Commission (Comisión Chilena de
Energía Nuclear or “CCHEN”), we were limited to 180,100 tons of total lithium metallic equivalent
(958,672 tons of lithium carbonate equivalent) extraction in the aggregate for all periods. For the year
ended December 31, 2017, revenues related to products originating from the Salar de Atacama represented
47% of our consolidated revenues, consisting of revenues from our potassium business line and our
lithium and derivatives business line for the period. All of our products originating from the Salar de
Atacama are derived from our extraction operations under the Lease Agreement. As of December 31,
2017, only 13 years remain on the term of the Lease Agreement and we had extracted approximately 64%
of the total permitted accumulated extraction and sales limit of lithium.
On January 17, 2018, Corfo, SQM Salar and SQM Potasio S.A. entered into the Corfo Arbitration
Agreement to (i) terminate the arbitration proceedings and (ii) amend the Lease Agreement and the Project
Agreement. The agreement to amend the Lease Agreement for the Salar de Atacama concession and the
Project Agreement seeks to reflect, among other terms, the following: (i) an increase in lease payments
by increasing the lease rates associated with the sale of the different products produced in the Salar de
Atacama; (ii) a commitment by SQM Salar to contribute (a) between US$10.8 and US$18.9 million per
year to research and development efforts, (b) between US$10 to US$15 million per year to the
communities in close proximity to the Salar de Atacama, and (c) 1.7% of total annual sales of SQM Salar
to regional development; (iii) the authorization by Corfo to increase the production and sales of lithium
products produced in the Salar de Atacama up to 349,553 metric tons of lithium metallic equivalent
(1,860,670 tons of lithium carbonate equivalent), which is in addition to the approximately 64,816 metric
tons of lithium metallic equivalent (345,015 tons of lithium carbonate equivalent) remaining from the
originally authorized amount; (iv) an obligation of SQM Salar to offer part of its lithium production (up
to a maximum of 25%) at a preferential price to value-added producers that will potentially develop in
Chile; (v) an obligation of SQM Salar to strengthen its corporate governance by incorporating various
audit, environmental control and coordination mechanisms with Corfo, which shall be set forth in
amendments to the By-laws of SQM Salar, including among others: (a) incorporating specific rules for
the management of the company, including that two of the directors of SQM Salar are independent and
meet the requirements established for independent directors of a public company and (b) requiring the
Board of Directors of SQM Salar to designate a committee to monitor compliance with the Lease
Agreement and the Project Agreement and to establish the regulations that will govern this committee and

3) DESCRIPTION OF BUSINESS ENVIRONMENT
60
its functions; (vi) extensive regulation regarding the return of assets upon termination of the contracts and
granting purchase options; and (vii) prohibitions against the sale of lithium brine extracted from leased
mining concessions by the Company, SQM Salar and SQM Potasio S.A. For further information on the
terms of the Corfo Arbitration Agreement, see Note 33.2 to our Consolidated Financial Statements. These
amendments remain subject to the issuance of the applicable resolutions of the Office of the Comptroller
General of the Republic (Contraloría General de la República).
On February 15, 2018 and February 16, 2018, the Atacamenos Indigenous Organization (Consejo de Pueblos Atacamenos) and the Atacamenos initiated legal actions challenging the amendment of the Lease
Agreement and the Project Agreement. The legal actions are pending before the Santiago Court of
Appeals.
On March 8, 2018, the CCHEN published its authorization for the increase in the quota of the amount of
lithium that may be extracted from the Salar de Atacama concession for all periods for which there are
increases under the proposed Lease Agreement amendment with Corfo. The effectiveness of the
authorization is subject to certain conditions relating to antitrust matters and the approval of the
amendment of the Lease Agreement by the Governing Board of CCHEN. There can be no assurance that
all of the conditions to the CCHEN authorization will be satisfied or that the CCHEN authorization will
become effective.
In addition, in connection with the Corfo Arbitration Agreement, on December 18, 2017, the companies
that are part of the Pampa Group entered into an agreement for the benefit of Corfo (the “Pampa Group
Agreement”), which, among other things, provides for: (i) the termination of the Joint Operation
Agreement, and (ii) an agreement to not enter into any joint action with third parties that allows Pampa
Group to acquire the status of sole controller or joint controller, as defined by article 97 of the Chilean
Securities Market Law. The obligations set forth in clause (ii) expire on December 31, 2030. In addition,
the Pampa Group Agreement also includes numerous provisions relating to corporate governance and
control. The effectiveness of the obligations of the parties to the Pampa Group Agreement is subject to
the effectiveness of the amendment of the Lease Agreement and the Project Agreement, which remain
subject to the issuance of the applicable resolutions of the Office of the Comptroller General of the
Republic (Contraloría General de la República) and is currently being challenged by the Atacamenos
Indigenous Organization (Consejo de Pueblos Atacamenos) and the Atacamenos. See “Item 8.A.7 Legal
Proceedings.” Neither SQM nor any of its subsidiaries, including SQM Potasio S.A. and SQM Salar, is a
party to the Pampa Group Agreement.
In the event the Lease Agreement is not amended as contemplated by the Corfo Arbitration Agreement,
or the CCHEN authorization for the increased extraction quota consent is delayed or does not become
effective, there can be no assurance that we will not reach the lithium extraction limit referred to above
prior to the expiration of the term of the Lease Agreement. In such event, we would then be unable to
continue extraction of lithium under the Lease Agreement, which could have a material adverse impact
on our revenues. Therefore, the failure to make effective the amendment of the Lease Agreement and the
Project Agreement could have a material adverse effect on our business, financial condition and results
of operations.
Our market reputation, commercial dealings or the price of our securities could be adversely affected
by the negative outcome of certain proceedings against certain former members of our Board and
certain other named defendants
On September 10, 2013, the SVS issued a press release disclosing it had instituted certain administrative
proceedings (the “Cascading Companies Proceedings”) against (i) Julio Ponce Lerou (who was the
Chairman of the Board and a director of the Company until April 24, 2015), (ii) Patricio Contesse Fica,
who was a director of the Company until April 24, 2015 and is the son of Patricio Contesse González
(who was the Company’s CEO until March 16, 2015), and (iii) other named defendants. The Company

3) DESCRIPTION OF BUSINESS ENVIRONMENT
61
has been informed that Mr. Ponce and persons related to him beneficially owned 29.97% of SQM’s total
shares as of December 31, 2015. See Section 4)A)i) “Ownership Control Situation”. The SVS alleged
breaches of Chilean corporate and securities laws in connection with acts performed by entities with direct
or indirect share ownership interests in SQM (the “Cascading Companies”). The allegations made in
connection with the Cascading Companies Proceedings do not relate to the Company’s operations, nor do
they relate to any acts or omissions of the Company or any of its directors, officers or employees in their
capacities as such.
In connection with the Cascading Companies Proceedings, the SVS alleged the existence of a scheme
involving the named defendants whereby, through a number of transactions occurring between 2009 and
2011, the Cascading Companies allegedly sold securities of various companies, including securities of
SQM, at below-market prices to companies related to Mr. Ponce and other named defendants. These
companies allegedly subsequently sold such securities after a lapse of time, in most cases back to the
Cascading Companies, at prices higher than the purchase price. The SVS alleged violations by the
defendants of a number of Chilean corporate and securities laws in furtherance of the alleged scheme.
On January 31, 2014, the SVS added a number of Chilean financial institutions and asset managers, and
certain of their controlling persons, executives or other principals, as named defendants to the Cascading
Companies Proceedings. On September 2, 2014, the SVS issued a decision imposing an aggregate fine
against all of the defendants of UF 4,0110,000 (approximately US$144.7 million as of December 31,
2015), including a fine against Mr. Ponce of UF 1,700,000 (approximately US$61.4 million as of
December 31, 2015) and a fine against Mr. Contesse Fica of UF 60,000 (approximately US$2.2 million
as of December 31, 2015). The defendants are currently challenging the SVS administrative decision
before a Chilean Civil Court.
The High Complexity Crimes Unit (Unidad de Delitos de Alta Complejidad) of the Metropolitan District
Central Northern Attorney’s Office (Fiscalía Metropolitana Centro Norte) is also investigating various
criminal complaints filed against various parties to the Cascading Companies Proceedings. The SII
requested payment of taxes by the Cascading Companies, and the Cascading Companies have filed a
complaint with the tax courts.
If, for any reason, the Company is unable to differentiate itself from the named defendants, such failure
could have a material adverse effect on the Company’s market reputation and commercial dealings.
Furthermore, we cannot assure you that a non-appealable ruling in connection with the Cascading
Companies Proceedings or the investigations of the High Complexity Crimes Unit or the SII that is
adverse to Mr. Ponce or Mr. Contesse Fica will not have a material adverse effect on our market
reputation, commercial dealings and the price of our securities, or that the Cascading Companies will not
sell shares of the Company or vote to increase the dividends we pay to our shareholders.
Our annual report for the year ended December 31, 2014 on Form 20-F filed with the SEC identified
a material weakness in our internal controls over payments directed by the office of the former Chief
Executive Officer as of December 31, 2014
In the past, our management determined that the Company did not maintain effective control over
payments directed by the office of the former CEO. This determination was reported in our annual report
for the year ended December 31, 2014 on Form 20-F, filed with the SEC on May 18, 2015.
We believe we have taken the necessary steps to remediate the identified material weakness and enhance
our internal controls. However, any failure to maintain effective internal control over financial reporting
could (i) result in a material misstatement in our financial reporting or financial statements that would not
be prevented or detected, (ii) cause us to fail to meet our reporting obligations under applicable securities
laws or (iii) cause investors to lose confidence in our financial reporting or financial statements, the

3) DESCRIPTION OF BUSINESS ENVIRONMENT
62
occurrence of any of which could materially and adversely affect our business, financial condition, cash
flows, results of operations and the prices of our securities.
Volatility of world fertilizer and chemical prices and changes in production capacities could affect our
business, financial condition and results of operations
The prices of our products are determined principally by world prices, which, in some cases, have been
subject to substantial volatility in recent years. World fertilizer and chemical prices vary depending upon
the relationship between supply and demand at any given time. Supply and demand dynamics for our
products are tied to a certain extent to global economic cycles, and have been impacted by circumstances
related to such cycles. Furthermore, the supply of certain fertilizers or chemical products, including certain
products that we provide, varies principally depending on the production of the major producers,
(including us) and their respective business strategies.
World prices of potassium-based fertilizers (including some of our specialty plant nutrients and potassium
chloride) fluctuated as a result of the broader global economic and financial conditions. During the second
half of 2013, potassium prices declined as a result of an unexpected announcement made by the Russian
company Uralkali (“Uralkali”) that it was terminating its participation in Belarus Potash Corporation
(“BPC”). As a result of the termination of Uralkali’s participation in BPC, there was increased price
competition in the market. The average price for our potassium chloride and potassium sulfate business
line was approximately 7% higher in 2017 compared to 2016. Our sales volumes for this business line
were approximately 12% lower in 2017 compared to 2016. We cannot assure you that potassium-based
fertilizer prices and sales volumes will not decline in the future.
Iodine prices followed an upward trend beginning at the end of 2008 and continuing through 2012,
reaching an average price of approximately US$53 per kilogram in 2012, over 40% higher than average
prices in 2011. During the following years, supply growth outpaced demand growth, causing a decline in
iodine prices. We obtained an average price for iodine of approximately US$20 per kilogram in 2017,
approximately 12% less than average prices obtained in 2016. We cannot assure you that iodine prices or
sales volumes will not continue to decline in the future.
Driven mostly by an increase in demand related to battery use, lithium demand growth in 2016 was
accompanied by an increase in supply that was lower than expected, and as a result, average prices for
this business line increased approximately 80% compared to 2015. In 2017, lithium demand continued to
grow creating tight market conditions and increasing prices by 25% compared to 2016. We cannot assure
you that lithium prices and sales volumes will not decline in the future.
We expect that prices for the products we manufacture will continue to be influenced, among other things,
by worldwide supply and demand and the business strategies of major producers. Some of the major
producers (including us) have increased or have the ability to increase production. As a result, the prices
of our products may be subject to substantial volatility. High volatility or a substantial decline in the prices
or sales volumes of one or more of our products could have a material adverse effect on our business,
financial condition and results of operations.
Our sales to emerging markets and expansion strategy expose us to risks related to economic conditions
and trends in those countries
We sell our products in more than 110 countries around the world. In 2017, approximately 42% of our
sales were made in emerging market countries: 11% in Latin America (excluding Chile); 9% in Africa
and the Middle East (excluding Israel); 7% in Chile and 15% in Asia and Oceania (excluding Australia,
Japan, New Zealand, South Korea and Singapore). We expect to expand our sales in these and other
emerging markets in the future. In addition, we may carry out acquisitions or joint ventures in jurisdictions
in which we currently do not operate, relating to any of our businesses or to new businesses in which we

3) DESCRIPTION OF BUSINESS ENVIRONMENT
63
believe we may have sustainable competitive advantages. The results of our operations and our prospects
in other countries in which we establish operations will depend, in part, on the general level of political
stability and economic activity and policies in those countries. Future developments in the political
systems or economies of these countries or the implementation of future governmental policies in those
countries, including the imposition of withholding and other taxes, restrictions on the payment of
dividends or repatriation of capital, the imposition of import duties or other restrictions, the imposition of
new environmental regulations or price controls or changes in relevant laws or regulations, could have a
material adverse effect on our business, financial condition and results of operations in those countries.
Our inventory levels may increase for economic or operational reasons
In general, economic conditions or operational factors can affect our inventory levels. Higher inventories
carry a financial risk due to increased need for cash to fund working capital and could imply increased
risk of loss of product. We cannot assure you that inventory levels will not continue to remain high or
increase further in the future. These factors could have a material adverse effect on our business, financial
condition and results of operations.
Our level of and exposure to unrecoverable accounts receivable may significantly increase
Potentially negative effects of global economic conditions on the financial condition of our customers
may include the extension of the payment terms of our accounts receivable and may increase our exposure
to bad debt. While we have implemented certain safeguards, such as using credit insurance, letters of
credit and prepayment for a portion of sales, to minimize this risk, the increase in our accounts receivable
coupled with the financial condition of customers may result in losses that could have a material adverse
effect on our business, financial condition and results of operations.
New production of iodine or lithium carbonate from current or new competitors in the markets in
which we operate could adversely affect prices
In recent years, new and existing competitors have increased the supply of iodine and lithium carbonate,
which has affected prices for both products. Further production increases could negatively impact prices.
There is limited information on the status of new iodine or lithium carbonate production capacity
expansion projects being developed by current and potential competitors and, as such, we cannot make
accurate projections regarding the capacities of possible new entrants into the market and the dates on
which they could become operational. If these potential projects are completed in the short term, they
could adversely affect market prices and our market share, which, in turn, could have a material adverse
effect on our business, financial condition and results of operations.
We have a capital expenditure program that is subject to significant risks and uncertainties
Our business is capital intensive. Specifically, the exploration and exploitation of reserves, mining and
processing costs, the maintenance of machinery and equipment and compliance with applicable laws and
regulations require substantial capital expenditures. We must continue to invest capital to maintain or to
increase our exploitation levels and the amount of finished products we produce.
In addition, we require environmental permits for our new projects. Obtaining permits in certain cases
may cause significant delays in the execution and implementation of new projects and, consequently, may
require us to reassess the related risks and economic incentives. We cannot assure you that we will be
able to maintain our production levels or generate sufficient cash flow, or that we will have access to
sufficient investments, loans or other financing alternatives, to continue our activities at or above present
levels, or that we will be able to implement our projects or receive the necessary permits required for them

3) DESCRIPTION OF BUSINESS ENVIRONMENT
64
in time. Any or all of these factors may have a material adverse effect on our business, financial condition
and results of operations.
High raw materials and energy prices could increase our production costs and cost of sales, and energy
may become unavailable at any price
We rely on certain raw materials and various energy sources (diesel, electricity, liquefied natural gas, fuel
oil and others) to manufacture our products. Purchases of energy and raw materials we do not produce
constitute an important part of our cost of sales, approximately 14% in 2017. In addition, we may not be
able to obtain energy at any price if supplies are curtailed or otherwise become unavailable. To the extent
we are unable to pass on increases in the prices of energy and raw materials to our customers or we are
unable to obtain energy, our business, financial condition and results of operations could be materially
adversely affected.
Our reserves estimates are internally prepared and not subject to review by external geologists or an
external auditing firm and could be subject to significant changes, which may have a material adverse
effect on our business, financial condition and results of operations
Our caliche ore mining reserves estimates and our Salar de Atacama brine mining reserve estimates are
prepared by our own geologists and hydrogeologists and are not subject to review by external geologists
or an external auditing firm. Estimation methods involve numerous uncertainties as to the quantity and
quality of the reserves, and reserve estimates could change upwards or downwards. A downward change
in the quantity and/or quality of our reserves could affect future volumes and costs of production and
therefore have a material adverse effect on our business, financial condition and results of operations.
Quality standards in markets in which we sell our products could become stricter over time
In the markets in which we do business, customers may impose quality standards on our products and/or
governments may enact stricter regulations for the distribution and/or use of our products. As a result, if
we cannot meet such new standards or regulations, we may not be able to sell our products. In addition,
our cost of production may increase in order to meet any such newly imposed or enacted standards or
regulations. Failure to sell our products in one or more markets or to important customers could materially
adversely affect our business, financial condition and results of operations.
Chemical and physical properties of our products could adversely affect their commercialization
Since our products are derived from natural resources, they contain inorganic impurities that may not
meet certain customer or government standards. As a result, we may not be able to sell our products if we
cannot meet such requirements. In addition, our cost of production may increase in order to meet such
standards. Failure to meet such standards could materially adversely affect our business, financial
condition and results of operations if we are unable to sell our products in one or more markets or to
important customers in such markets.
Our business is subject to many operating and other risks for which we may not be fully covered under
our insurance policies
Our facilities and business operations in Chile and abroad are insured against losses, damage or other
risks by insurance policies that are standard for the industry and that would reasonably be expected to be
sufficient by prudent and experienced persons engaged in businesses similar to ours.
We may be subject to certain events that may not be covered under our insurance policies, which could
have a material adverse effect on our business, financial condition and results of operations. Additionally,
as a result of major earthquakes and unexpected rains and flooding in Chile, as well as other natural

3) DESCRIPTION OF BUSINESS ENVIRONMENT
65
disasters worldwide, conditions in the insurance market have changed and may continue to change in the
future, and as a result, we may face higher premiums and reduced coverage, which could have a material
adverse effect on our business, financial condition and results of operations.
Changes in technology or other developments could result in preferences for substitute products
Our products, particularly iodine, lithium, and their derivatives, are preferred raw materials for certain
industrial applications, such as rechargeable batteries and LCDs. Changes in technology, the development
of substitute raw materials or other developments could adversely affect demand for these and other
products which we produce. In addition, other alternatives to our products may become more
economically attractive as global commodity prices shift. Any of these events could have a material
adverse effect on our business, financial condition and results of operations.
We are exposed to labor strikes and labor liabilities that could impact our production levels and costs
Over 95% of our employees are employed in Chile, of which approximately 64% were represented by 22
labor unions as of December 31, 2017. As of July 31, 2017 we renegotiated collective labor contracts
with three unions. As a result, all collective labor contracts were renegotiated for the next three years as
of that date. From November 2017, we started a new cycle of the individual labor contract negotiations.
We are exposed to labor strikes and illegal work stoppages that could impact our production levels. If a
strike or illegal work stoppage occurs and continues for a sustained period of time, we could be faced with
increased costs and even disruption in our product flow that could have a material adverse effect on our
business, financial condition and results of operations.
Chilean Law No. 20,123, known as the Subcontracting Law, provides that when a serious workplace
accident occurs, the company in charge of the workplace must halt work at the site where the accident
took place until authorities from either the National Geology and Mining Service (Servicio Nacional de
Geología y Minería or “Sernageomin”), the Labor Board (Dirección del Trabajo or “Labor Board”), or
the National Health Service (Servicio Nacional de Salud), inspect the site and prescribe the measures such
company must take to minimize the risk of similar accidents taking place in the future. Work may not be
resumed until the applicable company has taken the prescribed measures, and the period of time before
work may be resumed may last for a number of hours, days, or longer. The effects of this law could have
a material adverse effect on our business, financial condition and results of operations.
On September 8, 2016, Chilean Law No. 20,940 was published and modified the Labor Code by
introducing, among other things, changes to the formation of trade unions, the election of inter-company
union delegates, the presence of women on union boards, anti-union practices and related sanctions, and
collective negotiations. Due to these changes to the labor regulations, we may face an increase in our
expenses that may have a significant adverse effect on our business, financial condition, and results of
operations.
Lawsuits and arbitrations could adversely impact us
We are party to a range of lawsuits and arbitrations involving different matters as described in Note 19.1
of our Consolidated Financial Statements. Although we intend to defend our positions vigorously, our
defense of these actions may not be successful. Adverse judgments or settlements in these lawsuits may
have a material adverse effect on our business, financial condition and results of operations. In addition,
our strategy of being a world leader includes entering into commercial and production alliances, joint
ventures and acquisitions to improve our global competitive position. As these operations increase in
complexity and are carried out in different jurisdictions, we might be subject to legal proceedings that, if
settled against us, could have a material adverse effect on our business, financial condition and results of
operations.

3) DESCRIPTION OF BUSINESS ENVIRONMENT
66
We have operations in multiple jurisdictions with differing regulatory, tax and other regimes
We operate in multiple jurisdictions with complex regulatory environments that are subject to different
interpretations by companies and respective governmental authorities. These jurisdictions may have
different tax codes, environmental regulations, labor codes and legal framework, which adds complexity
to our compliance with these regulations. Any failure to comply with such regulations could have a
material adverse effect on our business, financial condition and results of operations.
Environmental laws and regulations could expose us to higher costs, liabilities, claims and failure to
meet current and future production targets
Our operations in Chile are subject to national and local regulations relating to environmental protection.
In accordance with such regulations, we are required to conduct environmental impact studies or
statements before we conduct any new projects or activities or significant modifications of existing
projects that could impact the environment or the health of people in the surrounding areas. We are also
required to obtain an environmental license for certain projects and activities. The Environmental
Evaluation Service (Servicio de Evaluación Ambiental or “Environmental Evaluation Service”) evaluates
environmental impact studies submitted for its approval. The public, government agencies or local
authorities may review and challenge projects that may adversely affect the environment, either before
these projects are executed or once they are operating, if they fail to comply with applicable regulations.
In order to ensure compliance with environmental regulations, Chilean authorities may impose fines up
to approximately US$9 million per infraction, revoke environmental permits or temporarily or
permanently close facilities, among other enforcement measures.
Chilean environmental regulations have become increasingly stringent in recent years, both with respect
to the approval of new projects and in connection with the implementation and development of projects
already approved, and we believe that this trend is likely to continue. Given public interest in
environmental enforcement matters, these regulations or their application may also be subject to political
considerations that are beyond our control.
We regularly monitor the impact of our operations on the environment and on the health of people in the
surrounding areas and have, from time to time, made modifications to our facilities to minimize any
adverse impact. Future developments in the creation or implementation of environmental requirements or
their interpretation could result in substantially increased capital, operation or compliance costs or
otherwise adversely affect our business, financial condition and results of operations.
The success of our current investments at the Salar de Atacama and Nueva Victoria is dependent on the
behavior of the ecosystem variables being monitored over time. If the behavior of these variables in future
years does not meet environmental requirements, our operation may be subject to important restrictions
by the authorities on the maximum allowable amounts of brine and water extraction. For example, on
December 13, 2017, the First Environmental Court of Antofagasta ordered the temporary and partial
closure of certain water extraction wells located in the Salar de Llamara. These wells allow the Company
to extract approximately 124 liters per second of water, almost 15% of the water used in the Company´s
operations in the First Region of Chile for iodine and nitrate production.
Our future development depends on our ability to sustain future production levels, which requires
additional investments and the submission of the corresponding environmental impact studies or
statements. If we fail to obtain approval or required environmental licenses, our ability to maintain
production at specified levels will be seriously impaired, thus having a material adverse effect on our
business, financial condition and results of operations.
In addition, our worldwide operations are subject to international and other local environmental
regulations. Since environmental laws and regulations in the different jurisdictions in which we operate

3) DESCRIPTION OF BUSINESS ENVIRONMENT
67
may change, we cannot guarantee that future environmental laws, or changes to existing environmental
laws, will not materially adversely impact our business, financial condition and results of operations.
Our water supply could be affected by geological changes or climate change
Our access to water may be impacted by changes in geology, climate change or other natural factors, such
as wells drying up or reductions in the amount of water available in the wells or rivers from which we
obtain water, that we cannot control. Any such change may have a material adverse effect on our business,
financial condition and results of operations.
Any loss of key personnel may materially and adversely affect our business
Our success depends in large part on the skills, experience and efforts of our senior management team
and other key personnel. The loss of the services of key members of our senior management or employees
with critical skills could have a negative effect on our business, financial condition and results of
operations. If we are not able to attract or retain highly skilled, talented and qualified senior managers or
other key personnel, our ability to fully implement our business objectives may be materially and
adversely affected.
A significant percentage of our shares are held by two principal shareholder groups who may have an
interest that is different from that of other shareholders and of each other. Any change in such
principal shareholder groups may result in a change of control of the Company or of its Board of
Directors or its management, which may have a material adverse effect on our business, financial
condition and results of operations
As of February 7, 2018, two principal shareholder groups held in the aggregate 64.08% of the total
outstanding shares of SQM, including a majority of our Series A common shares, and have the power to
elect seven of our eight directors. The interests of the two principal shareholder groups may in some cases
differ from those of other shareholders and of each other.
One of the principal shareholder groups is Nutrien (formerly PCS prior to the merger with Agrium Inc.
on January 1, 2018), which currently owns 32% of the total outstanding shares of SQM. Nutrien is
required to divest all of its ownership in SQM within 18 months of the merger with Agrium Inc. pursuant
to the terms of the approval of the merger of PCS and Agrium Inc. by the Competition Commission of
India. As of the date of this Annual Report, Nutrien has not yet completed the sale of any portion of its
interest in SQM.
The other principal shareholder group consists of the Pampa Group and the Kowa Group (each as defined
in “Item 7.A. Major Shareholders”), which currently owns 32.08% of the total outstanding shares of SQM.
This shareholder group may lose its Controller Group status under Chilean law upon the termination of
the Joint Operation Agreement (as defined in the section “4)A) Ownership and shares: ownership”) as
required under the Pampa Group Agreement entered into by the Pampa Group members in connection
with the Corfo Arbitration Agreement. See section “4)A) Ownership and shares: ownership”.
In addition, on April 17, 2017, certain entities owned by the Pampa Group, the Kowa Group and PCS
entered into an agreement with respect to certain corporate governance matters of SQM. See section “4)A)
Ownership and shares: ownership”.
The divestiture by Nutrien, the loss of the Controller Group status by the Pampa Group and the Kowa
Group, or a combination thereof, may have a material adverse effect on our business, financial condition
and results of operations.
Risks Relating to Financial Markets

3) DESCRIPTION OF BUSINESS ENVIRONMENT
68
Currency fluctuations may have a negative effect on our financial performance
We transact a significant portion of our business in U.S. dollars, and the U.S. dollar is the currency of the
primary economic environment in which we operate. In addition, the U.S. dollar is our functional currency
for financial statement reporting purposes. A significant portion of our costs, however, is related to the
Chilean peso. Therefore, an increase or decrease in the exchange rate between the Chilean peso and the
U.S. dollar would affect our costs of production. The Chilean peso has been subject to large devaluations
and revaluations in the past and may be subject to significant fluctuations in the future. As of December
31, 2017, the Chilean peso exchange rate was Ch$614.75 per U.S. dollar, while as of December 31, 2016,
the Chilean peso exchange rate was Ch$669.47 per U.S. dollar. The Chilean peso therefore appreciated
against the U.S. dollar by 8.0% in 2017. As of April 2, 2018, the Observed Exchange Rate was Ch$603.39
per U.S. dollar.
As an international company operating in several other countries, we also transact business and have
assets and liabilities in other non-U.S. dollar currencies, such as, among others, the Euro, the South
African rand, the Mexican peso, the Chinese yuan, the Thai baht and the Brazilian real. As a result,
fluctuations in the exchange rates of such foreign currencies to the U.S. dollar may have a material adverse
effect on our business, financial condition and results of operations.
Interest rate fluctuations may have a material impact on our financial performance
As of December 31, 2017, we did not have any outstanding short or long-term debt bearing interest based
on LIBOR or other variable interest rates. Should we have such debt in the future, a relative increase in
the rate could materially impact our business, financial condition and results of operations.
Risks Relating to Chile
As we are a company based in Chile, we are exposed to Chilean political risks
Our business, results of operations, financial condition and prospects could be affected by changes in
policies of the Chilean government, other political developments in or affecting Chile, legal changes in
the standards or administrative practices of Chilean authorities or the interpretation of such standards and
practices, over which we have no control.
Changes in regulations regarding, or any revocation or suspension of our concessions could negatively
affect our business
Any changes to regulations to which we are subject or adverse changes to our concession rights, or a
revocation or suspension of our concessions, could have a material adverse effect on our business,
financial condition and results of operations.
Changes in mining or port concessions could affect our operating costs
We conduct our mining operations, including brine extraction, under exploitation and exploration
concessions granted in accordance with provisions of the Chilean constitution and related laws and
statutes. Our exploitation concessions essentially grant a perpetual right (with the exception of the Salar
de Atacama rights, which have been leased to us until 2030) to conduct mining operations in the areas
covered by the concessions, provided that we pay annual concession fees. Our exploration concessions
permit us to explore for mineral resources on the land covered thereby for a specified period of time and
to subsequently request a corresponding exploitation concession. Our subsidiary SQM Salar, as
leaseholder, holds exclusive and temporary rights over the mineral resources in an area covering
approximately 140,000 hectares of land in the Salar de Atacama in northern Chile, of which SQM Salar

3) DESCRIPTION OF BUSINESS ENVIRONMENT
69
is entitled to exploit the mineral resources of 81,920 hectares. These rights are owned by Corfo and leased
to SQM Salar pursuant to the Lease Agreement between Corfo and SQM Salar. Corfo may not unilaterally
modify the Lease Agreement, and the rights to exploit the mineral substances cannot be transferred. The
Lease Agreement establishes that SQM Salar is responsible for making quarterly lease payments to Corfo,
maintaining Corfo’s rights over the mining exploitation concessions, and making annual payments to the
Chilean government for such concession rights. The Lease Agreement expires on December 31, 2030.
Furthermore, under the regulations of the Chilean Nuclear and Energy Commission (Comisión Chilena
de Energía Nuclear or “CCHEN”), we are limited to 180,100 tons of total lithium (958,672 tons of lithium
carbonate equivalent) extraction in the aggregate for all periods. As of December 31, 2017, only 13 years
remain on the term of the Lease Agreement and we had extracted approximately 64% of the total
accumulated extraction and sales limit of lithium.
On January 17, 2018, Corfo and our subsidiaries SQM Salar and SQM Potasio S.A. entered into the Corfo
Arbitration Agreement, which, among other things, provide for the amendment of the Lease Agreement
and the Project Agreement. As part of the agreement to amend the Lease Agreement, Corfo authorized an
increase of the production and sales of lithium products produced in the Salar de Atacama up to 349,553
metric tons of lithium metallic equivalent (1,860,670 tons of lithium carbonate equivalent), which is in
addition to the approximately 64,816 metric tons of lithium metallic equivalent (345,015 tons of lithium
carbonate equivalent) remaining from the originally authorized amount. The amendment of the Lease
Agreement and the Project Agreement remains subject to the issuance of the applicable resolutions of the
Office of the Comptroller General of the Republic (Contraloría General de la República), as well as the
approval by the Governing Board of CCHEN, and is currently being challenged by the Atacamenos
Indigenous Organization (Consejo de Pueblos Atacamenos) and the Atacamenos.
In the event the Lease Agreement is not amended, there can be no assurance that we will not reach the
lithium extraction limit referred to above prior to the expiration of the term of the Lease Agreement.
We also operate port facilities at Tocopilla, Chile for the shipment of products and the delivery of raw
materials pursuant to maritime concessions, which have been granted under applicable Chilean laws and
are normally renewable on application, provided that such facilities are used as authorized and annual
concession fees are paid.
Any significant changes to any of these concessions could have a material adverse effect on our business,
financial condition and results of operations.
Changes in water rights laws and other regulations could affect our operating costs
We hold water use rights that are key to our operations. These rights were obtained from the Chilean
Water Authority (Dirección General de Aguas) for supply of water from rivers and wells near our
production facilities, which we believe are sufficient to meet current operating requirements. However,
the Chilean water rights code (Código de Aguas or the “Water Code”) is subject to changes, which could
have a material adverse impact on our business, financial condition and results of operations. For example,
a series of bills are currently being discussed at the Chilean National Congress that seek to desalinate
seawater for use in mining production processes, amend the Mining Code for water use in mining
operations, amend the Political Constitution on water and introduce changes to the regulatory framework
governing the terms of inspection and sanction of water. As a result, the amount of water that we can
actually use under our existing rights may be reduced or the cost of such use could increase. These and
potential future changes to the Water Code or other relevant regulations could have a material adverse
effect on our business, financial condition and results of operations.
The Chilean government could levy additional taxes on corporations operating in Chile
In Chile, there is a royalty tax that is applied to mining activities developed in the country.

3) DESCRIPTION OF BUSINESS ENVIRONMENT
70
On September 29, 2014, Law No. 20,780 was published (the “Tax Reform”), introducing significant
changes to the Chilean taxation system and strengthening the powers of the SII to control and prevent tax
avoidance. Subsequently, on February 8, 2016, Law No. 20,899 that simplifies the income tax system and
modifies other legal tax provisions was published. As a result of these reforms, open stock corporations
like SQM are subject to the partially integrated shareholder tax regime (sistema parcialmente integrado).
The corporate tax rate applicable to us increased to 25.5% in 2017 and will increase to a maximum rate
of 27% in 2018.
Under the partially integrated shareholder taxation regime, shareholders bear the tax on dividends upon
payment, but they will only be permitted to credit against such shareholder taxes a portion of the Chilean
corporate tax paid by us on our earnings, unless the shareholder is resident in a country with a tax treaty
in force with Chile or signed with Chile prior to January 1, 2017, whether or not in force. In that case,
100% of the Chilean corporate tax paid by us may be credited against the final taxes at the shareholder
level.
As a result, foreign shareholders resident in a non-treaty jurisdiction will be subject to a higher effective
tax rate than residents of treaty jurisdictions. There is a temporary rule in effect from January 1, 2017
through December 31, 2019 that treaty jurisdictions for this purpose will include jurisdictions with tax
treaties signed with Chile prior to January 1, 2017, whether or not such treaties are in force. This is
currently the status of the treaty signed between Chile and United States.
The Tax Reform tax increase prompted a US$52.3 million increase in our deferred tax liabilities as of
December 31, 2014. In accordance with IAS 12, the effects generated by the change in the income tax
rate approved by Law No. 20.780 on income and deferred taxes were applied to the income statement as
of December 31, 2014.
In addition, the Tax Reform may have other material adverse effects on our business, financial condition
and results of operations. Likewise, we cannot assure you that the manner in which the Royalty Law (as
defined below) or the corporate tax rate are interpreted and applied will not change in the future. The
Chilean government may decide to levy additional taxes on mining companies or other corporations in
Chile. Such changes could have a material adverse effect on our business, financial condition and results
of operations.
Ratification of the International Labor Organization’s Convention 169 concerning indigenous and
tribal peoples might affect our development plans
Chile, a member of the International Labor Organization (“ILO”), has ratified the ILO’s Convention 169
(the “Indigenous Rights Convention”) concerning indigenous and tribal people. The Indigenous Rights
Convention established several rights for indigenous people and communities. Among other rights, the
Indigenous Rights Convention states that (i) indigenous groups should be notified and consulted prior to
the development of any project on land deemed indigenous, although veto rights are not mentioned and
(ii) indigenous groups have, to the extent possible, a stake in benefits resulting from the exploitation of
natural resources in indigenous land. The extent of these benefits has not been defined by the Chilean
government. The Chilean government has addressed item (i) above through Supreme Decree No. 66
issued by the Social Development Ministry. This decree requires government entities to consult
indigenous groups that may be directly affected by the adoption of legislative or administrative measures,
and it also defines criteria for the projects or activities that must be reviewed through the environmental
evaluation system that also require such consultation. To the extent that the new rights outlined in the
Indigenous Rights Convention become laws or regulations in Chile, they could affect the development of
our investment projects in lands that have been defined as indigenous, which could have a material adverse
effect on our business, financial condition and results of operations.

3) DESCRIPTION OF BUSINESS ENVIRONMENT
71
Chile is located in a seismically active region
Chile is prone to earthquakes because it is located along major fault lines. The most recent major
earthquakes in Chile, which occurred in April 2017 in the Valparaiso region and in December 2016 in
Chiloe Island, had a magnitude of 6.9 and 7.6, respectively, on the Richter scale. There were also
earthquakes in 2015, 2014 and 2010 that caused substantial damage to some areas of the country. Chile
has also experienced volcanic activity. A major earthquake or a volcanic eruption could have significant
negative consequences for our operations and for the general infrastructure, such as roads, rail, and access
to goods, in Chile. Although we maintain industry standard insurance policies that include earthquake
coverage, we cannot assure you that a future seismic or volcanic event will not have a material adverse
effect on our business, financial condition and results of operations.
Risks Relating to our Shares and to our ADSs
The price of our ADSs and the U.S. dollar value of any dividends will be affected by fluctuations in the
U.S. dollar/Chilean peso exchange rate
Chilean trading in the shares underlying our ADSs is conducted in Chilean pesos. The depositary will
receive cash distributions that we make with respect to the shares in Chilean pesos. The depositary will
convert such Chilean pesos to U.S. dollars at the then prevailing exchange rate to make dividend and other
distribution payments in respect of ADSs. If the value of the Chilean peso falls relative to the U.S. dollar,
the value of the ADSs and any distributions to be received from the depositary will decrease.
Developments in other emerging markets could materially affect the value of our ADSs and our shares
The Chilean financial and securities markets are, to varying degrees, influenced by economic and market
conditions in other emerging market countries or regions of the world. Although economic conditions are
different in each country or region, investor reaction to developments in one country or region can have
significant effects on the securities of issuers in other countries and regions, including Chile and Latin
America. Events in other parts of the world may have a material effect on Chilean financial and securities
markets and on the value of our ADSs and our shares.
The volatility and low liquidity of the Chilean securities markets could affect the ability of our
shareholders to sell our ADSs
The Chilean securities markets are substantially smaller, less liquid and more volatile than the major
securities markets in the United States. The volatility and low liquidity of the Chilean markets could
increase the price volatility of our ADSs and may impair the ability of a holder to sell our ADSs into the
Chilean market in the amount and at the price and time he wishes to do so.
Our share or ADS price may react negatively to future acquisitions and investments
As world leaders in our core businesses, part of our strategy is to look for opportunities that will allow us
to consolidate and strengthen our competitive position in jurisdictions in which we currently do not
operate. Pursuant to this strategy, we may carry out acquisitions or joint ventures relating to any of our
businesses or to new businesses in which we believe we may have sustainable competitive advantages.
Depending on our capital structure at the time of such acquisitions or joint ventures, we may need to raise
significant debt and/or equity which will affect our financial condition and future cash flows. Any change
in our financial condition could affect our results of operations, negatively impacting our share or ADS
price.
ADS holders may be unable to enforce rights under U.S. Securities Laws

3) DESCRIPTION OF BUSINESS ENVIRONMENT
72
Because we are a Chilean company subject to Chilean law, the rights of our shareholders may differ from
the rights of shareholders in companies incorporated in the United States, and ADS holders may not be
able to enforce or may have difficulty enforcing rights currently in effect under U.S. federal or state
securities laws.
Our Company is an open stock corporation incorporated under the laws of the Republic of Chile. Most
of our directors and officers reside outside the United States, principally in Chile. All or a substantial
portion of the assets of these persons are located outside the United States. As a result, if any of our
shareholders, including holders of our ADSs, were to bring a lawsuit against our officers or directors in
the United States, it may be difficult for them to effect service of legal process within the United States
upon these persons. Likewise, it may be difficult for them to enforce judgments obtained in United States
courts based upon the civil liability provisions of the federal securities laws in the United States against
them in the United States.
In addition, there is no treaty between the United States and Chile providing for the reciprocal enforcement
of foreign judgments. However, Chilean courts have enforced judgments rendered in the United States,
provided that the Chilean court finds that the United States court respected basic principles of due process
and public policy. Nevertheless, there is doubt as to whether an action could be brought successfully in
Chile in the first instance on the basis of liability based solely upon the civil liability provisions of the
United States federal securities laws.
As preemptive rights may be unavailable for our ADS holders, they have the risk of their holdings being
diluted if we issue new stock
Chilean laws require companies to offer their shareholders preemptive rights whenever issuing new shares
of capital stock so shareholders can maintain their existing ownership percentage in a company. If we
increase our capital by issuing new shares, a holder may subscribe for up to the number of shares that
would prevent dilution of the holder’s ownership interest.
If we issue preemptive rights, United States holders of ADSs would not be able to exercise their rights
unless a registration statement under the Securities Act were effective with respect to such rights and the
shares issuable upon exercise of such rights or an exemption from registration were available. We cannot
assure holders of ADSs that we will file a registration statement or that an exemption from registration
will be available. We may, in our absolute discretion, decide not to prepare and file such a registration
statement. If our holders were unable to exercise their preemptive rights because we did not file a
registration statement, the depositary bank would attempt to sell their rights and distribute the net proceeds
from the sale to them, after deducting the depositary’s fees and expenses. If the depositary could not sell
the rights, they would expire and holders of ADSs would not realize any value from them. In either case,
ADS holders’ equity interest in us would be diluted in proportion to the increase in our capital stock.
If we were classified as a Passive Foreign Investment Company by the U.S. Internal Revenue Service,
there could be adverse consequences for U.S. investors
We believe that we were not classified as a Passive Foreign Investment Company (“PFIC”) for 2017.
Characterization as a PFIC could result in adverse U.S. tax consequences to you if you are a U.S. investor
in our shares or ADSs. For example, if we (or any of our subsidiaries) are a PFIC, our U.S. investors may
become subject to increased tax liabilities under U.S. tax laws and regulations and will become subject to
burdensome reporting requirements. The determination of whether or not we (or any of our subsidiaries
or portfolio companies) are a PFIC is made on an annual basis and will depend on the composition of our
(or their) income and assets from time to time.
U.S. federal income tax reform could adversely affect us and holders of our shares and ADSs

3) DESCRIPTION OF BUSINESS ENVIRONMENT
73
On December 22, 2017, President Trump signed into law H.R. 1, originally known as the “Tax Cuts and
Jobs Act,” which significantly reformed the Internal Revenue Code of 1986, as amended. The impact of
this tax reform, or of any future administrative guidance interpreting provisions thereof, on holders of our
ADSs or shares is uncertain and could be adverse. Prospective investors are urged to consult with their
own legal and tax advisors with respect to any such legislation and the potential tax consequences of
purchasing, holding, and disposing of our shares and ADSs.
Changes in Chilean tax regulations could have adverse consequences for U.S. investors
Currently cash dividends paid by us to foreign shareholders are subject to a 35% Chilean withholding tax.
When the Company pays a corporate income tax on the income from which the dividend is paid, known
as a “First Category tax”, a credit effectively reduces the rate of Withholding Tax. Changes in Chilean
tax regulations could have adverse consequences for U.S. investors.
3) F) DESCRIPTION OF BUSINESS ENVIRONMENT: CAPITAL EXPENDITURE PROGRAM
We regularly review different opportunities to improve our production methods, reduce costs, increase
production capacity of existing products and develop new products and markets. Additionally, significant
capital expenditures are required every year in order to sustain our production capacity. We are focused
on developing new products in response to identified customer demand, as well as new products that can
be derived as part of our existing production or other products that could fit our long-term development
strategy. Our capital expenditures in Chile have been mainly related to the organic growth and
sustainability of our business, including the construction of new facilities and the renovation of plants and
equipment. From 2016 we began to invest in lithium projects outside Chile, starting with the Minera Exar
project in Argentina and continuing with Mount Holland project in Australia in 2017.
Our capital expenditures for the years ended December 31, 2017, 2016 and 2015 were as follows:
(in millions of U.S. dollars) 2017 2016 2015
Capital Expenditures 142.1 131.3 111.3
During 2017, we had total capital expenditures of US$142.1 million, primarily related to:
Capacity expansion projects related to lithium carbonate and lithium hydroxide production in
Chile;
Investments in mining workshop and operations centers to relocate operations from Nueva
Victoria mine to mining sector Tente en el Aire;
Capacity expansion project related to potassium nitrate production;
General maintenance of all production units and Tocopilla port in order to ensure the fulfillment
of production and sales targets.
During 2016, we had total capital expenditures of US$131.3 million, primarily related to:
Completion of the project related to the expansion of ponds at Nueva Victoria to increase the
production of iodine and nitrates;
Capacity expansion projects related to our potassium nitrate production;
Capacity expansion project related to our lithium hydroxide production;
Improvements in the open storage areas at the Port of Tocopilla;
General maintenance of all production units in order to ensure the fulfillment of production targets
and the safety of all of our employees.
During 2015, we had total capital expenditures of US$111.3 million, primarily related to:

3) DESCRIPTION OF BUSINESS ENVIRONMENT
74
Expansion of ponds at Nueva Victoria in order to increase the production of iodine and nitrates;
Refining system at potassium nitrate plants;
Exploration and construction of new wells to sustain production at the Salar de Atacama and
Maintenance of production facilities in order to ensure production goals are met, as well as
improvements in the open storage areas at the Port of Tocopilla.
The Board of Directors has approved a capital expenditure framework for 2018 of approximately US$517
million focused on the maintenance of our production facilities in order to strengthen our ability to meet
our production goals and to increase our production capacity, primarily in lithium. We estimate that we
will invest approximately US$360 million in our operations in Chile, including maintenance of our
production facilities, an additional expansion of lithium carbonate capacity to 100,000 metric tons,
completion of hydroxide capacity expansion, the expansion of iodine production capacity in Nueva
Victoria and the expansion of productive capacity of potassium nitrate in Coya Sur. Our projected
investments of approximately US$157 million in projects outside Chile include the development of lithium
projects Minera Exar in Argentina and Mount Holland in Australia. We do not expect that our 2018 capital
investment program will require external financing. However, we always have the option to access capital
markets in order to optimize our financial position.

4) OWNERSHIP AND SHARES
75
4) OWNERSHIP AND SHARES
4) A) OWNERSHIP AND SHARES: OWNERSHIP
i) OWNERSHIP CONTROL SITUATION
At December 31, 2017, SQM has a “controlling group” as such term is defined in Title XV of Chilean
Law No. 18,045. SQM has been informed that, as of December 31, 2017, Mr. Julio Ponce Lerou (ID No.
4.250.719-9) and related persons control 100% of Inversiones SQYA Ltda. (“SQYA”) and 100% of
Inversiones SQ Ltda. These two companies control indirectly 29.97% of all shares of SQM (consisting of
71,871,838 Series A shares and 7,007,688 Series B shares), as follows: (i) Inversiones SQ Ltda. controls
0.0258% of Norte Grande S.A. (“Norte Grande”) and SQYA controls 67.59% of Norte Grande, which
controls 76.82% of Sociedad de Inversiones Oro Blanco S.A., which controls 88.64% of Sociedad de
Inversiones Pampa Calichera S.A. (“Pampa Calichera”), which controls 19.72% of SQM, as of December
31, 2016; (ii) Pampa Calichera controls 99.99% of Inversiones Global Mining Chile Limitada, which
controls 3.34% of SQM and (iii) Norte Grande controls 76.34% of Nitratos de Chile S.A., which controls
98.89% of Potasios de Chile S.A., which controls 10.07% of Pampa Calichera and 6.91% of SQM. Thus,
Pampa Calichera and its related companies, Inversiones Global Mining Chile Limitada and Potasios de
Chile S.A. (together, “Pampa Group”), control 29.97% of SQM. For the breakdown by series of share of
the Pampa Group’s ownership of shares in SQM, see Section 4)A)iii) Identification of 12 Largest
Shareholders.
As of December 31, 2017, Kowa Company Ltd., Inversiones La Esperanza (Chile) Limitada, Kochi S.A.,
and La Esperanza Delaware Corporation (together, “Kowa Group”) are owners of 2.11% of all shares in
SQM. On December 21, 2006, Pampa Group and Kowa Group entered into a Joint Operation Agreement
which currently allows them to have the status of “controlling group” of the Company. The
aforementioned Joint Operation Agreement refers to a filing made with the CMF that was filed by
Sociedad de Inversiones Pampa Calichera S.A. on December 21, 2006, as amended on April 3, 2008 and
March 17, 2009.

4) OWNERSHIP AND SHARES
76
Ownership Control Situation

4) OWNERSHIP AND SHARES
77
ii) IDENTIFICATION OF NON-CONTROLLING MAJORITY SHAREHOLDERS
As of December 31, 2017, Potash Corporation of Saskatchewan Inc. (“PCS”) owns 100% of Inversiones
El Boldo Limitada, 100% of Inversiones RAC Chile S.A. and 100% of Inversiones PCS Chile Limitada,
and, accordingly, is the beneficial owner of 84,222,887 of SQM’s shares, or 32.00% of SQM’s total shares.
iii) IDENTIFICATION OF 12 LARGEST SHAREHOLDERS
As of December 31, 2017, the 12 largest shareholders including both Series A and Series B shares were:
Series A + Series B Taxpayer ID
Number of
Shares
%
Ownership
THE BANK OF NEW YORK MELLON ADRS(1) 59.030.820-K 54,599,961 20.74%
SOCIEDAD DE INVERSIONES PAMPA
CALICHERA SA(2) 96.511.530-7 51,901,840 19.72%
INVERSIONES EL BOLDO LIMITADA 77.633.940-7 45,693,872 17.36%
INVERSIONES RAC CHILE SA 79.744.950-4 21,403,015 8.13%
POTASIOS DE CHILE SA(2) 76.165.311-3 18,179,147 6.91%
INVERSIONES PCS CHILE LIMITADA 77.297.720-4 17,126,000 6.51%
INVERSIONES GLOBAL MINING CHILE
LIMITADA(2) 96.863.960-9 8,798,539 3.34%
BANCO DE CHILE POR CUENTA DE TERCEROS
NO RESIDENTES 97.004.000-5 8,394,289 3.19%
BANCO ITAU CORPBANCA POR CUENTA DE
INVERSIONISTAS EXTRANJEROS 97.023.000-9 7,036,629 2.67%
BANCO SANTANDER POR CUENTA DE
INVERSIONISTAS EXTRANJEROS 97.036.000-K 4,593,336 1.75%
INVERSIONES LA ESPERANZA CHILE
LIMITADA(2) 79.798.650-K 3,758,098 1.43%
MBI CORREDORES DE BOLSA SA 96.921.130-0 2,502,475 0.95%
Subtotal 12 Largest Shareholders, Series A and B 243,987,201 94.70%
Total Shares, Series A and B 263,196,524 100% (1) The Bank of New York Mellon is the depositary bank for the Company’s ADSs traded on the New York Stock
Exchange. Information about ADS holders is provided at the end of this section.
(2) Indicates shareholder belongs to Controlling Group.

4) OWNERSHIP AND SHARES
78
As of December 31, 2017, the 12 largest shareholders of Series A shares were:
Series A Taxpayer ID Number of Shares % Ownership
SOCIEDAD DE INVERSIONES PAMPA
CALICHERA SA(1) 96.511.530-7 44,894,152 31.43%
INVERSIONES EL BOLDO LIMITADA 77.633.940-7 29,330,326 20.54%
INVERSIONES RAC CHILE SA 79.744.950-4 19,200,242 13.44%
POTASIOS DE CHILE SA(1) 76.165.311-3 18,179,147 12.73%
INVERSIONES PCS CHILE LIMITADA 77.297.720-4 15,526,000 10.87%
INVERSIONES GLOBAL MINING CHILE
LIMITADA(1) 96.863.960-9 8,798,539 6.16%
INVERSIONES LA ESPERANZA CHILE
LIMITADA(1) 79.798.650-K 3,711,598 2.60%
KOWA CO LTD(1) 59.046.730-8 781,429 0.55%
KOCHI S.A. (1) 96.518.570-4 737,057 0.52%
LA ESPERANZA DELAWARE CORPORATION(1) 59.023.690-K 227,550 0.16%
BANCHILE CORREDORES DE BOLSA S.A. 96.571.220-8 181,125 0.13%
INVERSIONES RENTAMAX LIMITADA 76.056.187-8 154,000 0.11%
Subtotal 12 Largest Shareholders, Series A 141,721,165 99.23%
Total Shares, Series A 142,819,552 100% (1) Indicates shareholder belongs to Controlling Group.

4) OWNERSHIP AND SHARES
79
As of December 31, 2017, the 12 largest shareholders of Series B shares were:
Series B Taxpayer ID Number of Shares % Ownership
THE BANK OF NEW YORK MELLON ADRS(1) 59.030.820-K 54,599,961 45.36%
INVERSIONES EL BOLDO LIMITADA 77.633.940-7 16,363,546 13.59%
BANCO DE CHILE POR CUENTA DE TERCEROS
NO RESIDENTES 97.004.000-5 8,394,289 6.97%
BANCO ITAU POR CUENTA DE INVERSIONISTAS
EXTRANJEROS 97.023.000-9 7,017,504 5.83%
SOCIEDAD DE INVERSIONES PAMPA
CALICHERA SA(2) 96.511.530-7 7,007,688 5.82%
BANCO SANTANDER POR CUENTA DE INV
EXTRANJEROS 97.036.000-K 4,593,336 3.82%
MBI CORREDORES DE BOLSA SA 96.921.130-0 2,501,593 2.08%
INVERSIONES RAC CHILE SA 79.744.950-4 2,202,773 1.83%
INVERSIONES PCS CHILE LIMITADA 77.297.720-4 1,600,000 1.33%
BANCHILE CORREDORES DE BOLSA SA 96.571.220-8 1,337,067 1.11%
RENTA 4 CORREDORES DE BOLSA S.A. 76.529.250-6 1,181,000 0.98%
LARRAIN VIAL S.A. CORREDORA DE BOLSA 80.537.000-9 1,167,776 0.97%
Subtotal 12 Largest Shareholders, Series B 107,966,533 89.69%
Total Shares, Series B 120,376,972 100% (1) The Bank of New York Mellon is the depositary bank for the Company’s ADSs traded on the New York Stock
Exchange. Information about ADS holders is provided at the end of this section.
(2) Indicates shareholder belongs to Controlling Group.

4) OWNERSHIP AND SHARES
80
The Bank of New York Mellon is the depositary bank for the Company’s ADSs traded on the New York
Stock Exchange. According to public 13F filings with the U.S. Securities and Exchange Commission, the
12 largest ADS holders as of December 31, 2017 were:
ADSs (Series B)
Taxpayer
ID Number of ADSs
% Ownership
Series B
%
Ownership
Total
Shares
WILLIAM BLAIR INVESTMENT
MANAGEMENT LLC
N/A 2,724,430 2.26% 1.04%
SAILINGSTONE CAPITAL PARTNERS LLC N/A 2,675,600 2.22% 1.02%
GLOBAL X MANAGEMENT CO. LLC N/A 2,279,880 1.89% 0.87%
ABERDEEN ASSET MANAGERS LTD. N/A 2,094,650 1.74% 0.80%
ADAGE CAPITAL MANAGEMENT LP N/A 1,757,728 1.46% 0.67%
AXIOM INTERNATIONAL INVESTORS LLC N/A 1,636,150 1.36% 0.62%
FIDELITY MANAGEMENT & RESEARCH CO. N/A 1,409,888 1.17% 0.54%
THE VANGUARD GROUP, INC. N/A 1,375,860 1.14% 0.52%
TIDE POINT CAPITAL MANAGEMENT LP N/A 1,105,535 0.92% 0.42%
RENAISSANCE TECHNOLOGIES LLC N/A 901,300 0.75% 0.34%
BAMCO, INC. N/A 866,086 0.72% 0.33%
ARTISAN PARTNERS LP N/A 815,238 0.68% 0.31%
Subtotal 12 Largest ADS Holders 19,642,345 16.32% 7.46%
Total ADSs as of December 31, 2016 54,599,961 45.36% 20.74%
iv) TOTAL NUMBER OF SHAREHOLDERS
The following table shows the total number of SQM´s shareholders as of December 31, 2017:
Shareholders
Registry
ADS
Holders
Registry
Total
Holders
Total Number of Shareholders, Series A and B 1.240 63 1.303
Total Number of Shareholders, Series A 373 - 373
Total Number of Shareholders, Series B 1.161 63 1.224

4) OWNERSHIP AND SHARES
81
v) SIGNIFICANT CHANGES IN SHARE OWNERSHIP
There have not been any major changes in SQM’s share ownership during the year 2017.
4) B) OWNERSHIP STRUCTURE AND SHARES: SHARES AND THEIR CHARACTERISTICS
AND RIGHTS
i) DESCRIPTION OF SERIES OF SHARES
Dividends are annually distributed to the Series A and Series B shareholders of record on the fifth business
day prior to the date for payment of the dividends. The By-laws do not specify a time limit after which
dividend entitlement elapses but Chilean regulations establish that after 5 years, unclaimed dividends are
to be donated to the Chilean Fire Department.
Article 5 of the Company’s By-laws establishes that Series B shares may in no case exceed fifty percent
of the issued, outstanding and paid shares of SQM. Series B shares have a restricted right to vote as they
can only elect one Director of the Company, regardless of their capital stock’s share. Series B shares have
the right to call for an Ordinary or Extraordinary Shareholders’ Meeting when the shareholders of at least
5% of the Series B shares request so and to call for an Extraordinary Board of Directors Meeting without
the Chairman’s authorization when it is requested by the Director elected by the shareholders of the Series
B shares. Series A shares have the option to exclude the Director elected by Series B shareholders from
the voting process in which the Chairman of the Board is to be elected, if there is a tie in the first voting
process. Articles 31 and 31 bis of the Company’s By-laws establish that in General Shareholders’ Meetings
each shareholder will have a right to one vote for each share he owns or represents and (a) that no
shareholder will have the right to vote for himself or on behalf of other shareholders of the same Series A
or Series B shares representing more than 37.5% of the total outstanding shares with right to vote of each
Series and (b) that no shareholder will have the right to vote for himself or on behalf of other shareholders
representing more than 32% of the total outstanding shares with a right to vote. In calculating a single
shareholder’s ownership of Series A or B shares, the shareholder’s stock and those pertaining to third
parties related to them are to be added.
Article 5 bis of the Company’s By-laws establishes that no person may directly or by means of related
third persons concentrate more than 32% of the Company’s total shares with right to vote.
Each Series A share and Series B share is entitled to share equally in the Company’s profits, i.e., they have
the same rights on any dividends declared on the outstanding shares of SQM.
The Company By-laws do not contain any provision relating to (a) redemption provisions (b) sinking
funds or (c) liability to capital calls by the Company.
As established in article 103 of Law No. 18,046, a company subject to the supervision of the SVS may be
liquidated in the following cases:
(a) Expiration of the duration term, if any, as established in its By-laws;
(b) All the shares end up in the possession of one individual for more than ten continuous days;
(c) By agreement of an Extraordinary Shareholders Meeting;
(d) By abolition, pursuant to applicable laws, of the decree that authorized its existence;
(e) Any other reason contemplated in its By-laws.
Article 40 of the Company’s By-laws states that in the event of liquidation, the Shareholders’ Meeting
will appoint a three-member receiver committee that will have the authority to carry out the liquidation
process. Any surplus will be distributed equally among the shareholders.

4) OWNERSHIP AND SHARES
82
The only way to change the rights of the holders of the SQM shares is by modifying its By-laws, which
can only be carried out by an Extraordinary Shareholders’ Meeting, as established in article
28 of the Company By-laws.
Total number of shares:
Series A: 142,819,552
Series B: 120,376,972
ii) DIVIDEND POLICY
SQM’s dividend policy for 2017, which was announced at the General Ordinary Shareholders’ Meeting
on April 28, 2017, was to distribute to the SQM’s shareholders as a final dividend a percentage of our net
income that is determined as per following financial parameters:
- 100% of the 2017 net income, when the following financial parameters are met: (a) the total sum
of cash and cash equivalent, and other current financial assets (“Cash”) divided by the total sum
of the current financial liabilities (“Current Financial Liabilities”) is equal to or greater than 2.5
times, and (b) the total sum of the current liabilities and the non-current liabilities (“Total
Liabilities”) divided by the total sum of the equity (“Equity”) is equal to or less than 1.1 times.
- 80% of the 2017 net income when the following financial parameters are met: (a) Cash divided
by Current Financial Liabilities is equal to or greater than 2.0 times, and (b) the total sum of the
Total Liabilities divided by the total Equity is equal to or less than 1.2 times.
- 60% of the 2017 net income when the following financial parameters are met: (a) Cash divided
by Current Financial Liabilities is equal to or greater than 1.5 times, and (b) Total Liabilities
divided by Equity is equal to or less than 1.3 times.
If none of the foregoing financial parameters are met, the Company shall distribute and pay, as a final
dividend, and in favor of the respective shareholders, 50% of the 2017 net income.
According to the dividend policy for 2017, the dividends are distributed and paid during 2017, in the form
of three interim dividends (dividendos provisorios) that will be charged against the final dividend. At the
ordinary shareholders meeting that will be held in 2018, the Board of Directors shall propose a final
dividend pursuant to the financial parameters expressed above, discounting the total amount of the interim
dividends previously distributed during 2017.
On May 17, 2017, the Board of Directors agreed to pay and distribute on June 15, 2017 a provisional
dividend of US$103 million, equivalent to US$0.39222 per share, to be charged against the 2017 net
income.
On August 23, 2017, the Board of Directors agreed to pay and distribute on September 14, 2017 a
provisional dividend of US$101 million, equivalent to US$0.38432 per share, to be charged against the
2017 net income.
On November 22, 2017, the Board of Directors agreed to pay and distribute on December14, 2017 a
provisional dividend of US$113 million, equivalent to US$0.42879 per share, to be charged against the
2017 net income.

4) OWNERSHIP AND SHARES
83
iii) (1) STATISTICAL INFORMATION: DIVIDENDS
All series A and series B shares carry equal rights to share in any dividend declared on SQM’s
shareholder capital in circulation. During the past three years, the Company has paid out the
following dividends:
Payout Year US$ Total
(in millions)
US$/Share
2015 39.0 0.14811
2015 (Interim) 84.0 0.31915
2016 22.6 0.08581
2016 (Special) 150.0 0.56992
2016 (Interim) 225.0 0.85487
2017 53.3 0.20248
2017 (Interim) 103.2 0.39222
2017 (Interim) 101.2 0.38432
2017 (Interim) 112.9 0.42879
iii) (2) STATISTICAL INFORMATION: SHARE TRANSACTIONS
SQM’s Series A and Series B shares are traded on the Santiago Stock Exchange, the Santiago
Electronic Stock Exchange and the Valparaíso Stock Exchange. The Company’s Series B shares
are traded as ADSs on the New York Stock Exchange. As of March 31, 2017, June 30, 2017,
September 30, 2017 and December 31, 2017, the Series B shares had a stock market presence
(presencia bursátil) in the Santiago Stock Exchange of 100%, and the Series A shares did not
have a stock market presence.
Information on SQM’s shares on Chilean stock exchanges:
Average Price (Ch$/Share)
Number of Shares Traded Amount Traded
(Millions of Ch$)
SQM-A SQM-B SQM-A SQM-B SQM-A SQM-B
2017 25,289.49 27,159.79 51,325 65,675,843 1,381 1,822,615
I Quarter 22,082.99 21,346.10 7,773 14,471,667 168 309,153
II Quarter 22,546.13 23,427.37 10,101 17,415,152 237 408,935
III Quarter 24,863.39 28,300.72 19,529 16,675,134 495 481,649
IV Quarter 32,113.77 36,236.06 13,922 17,113,890 481 622,878
Source: Bloomberg, Composite Exchange
Information on SQM’s shares on the New York Stock Exchange:
Average Price (US$/ADS)
Number of Shares Traded Amount Traded
(Millions of US$)
SQM-B SQM-B SQM-B
2016 42.52 247,016,910 11,316
I Quarter 32.54 38,546,208 1,250
II Quarter 35.13 58,716,834 2,072
III Quarter 44.91 71,140,321 3,474
IV Quarter 57.34 78,613,547 4,520
Source: Bloomberg, Composite Exchange
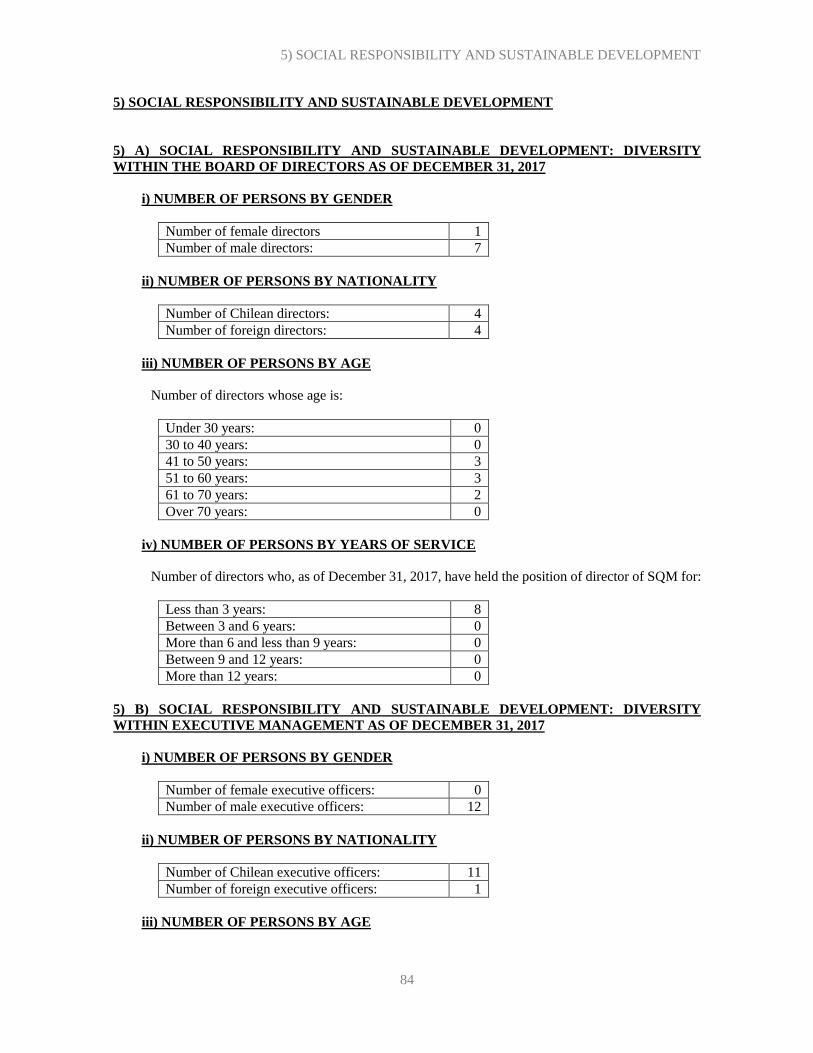
5) SOCIAL RESPONSIBILITY AND SUSTAINABLE DEVELOPMENT
84
5) SOCIAL RESPONSIBILITY AND SUSTAINABLE DEVELOPMENT
5) A) SOCIAL RESPONSIBILITY AND SUSTAINABLE DEVELOPMENT: DIVERSITY
WITHIN THE BOARD OF DIRECTORS AS OF DECEMBER 31, 2017
i) NUMBER OF PERSONS BY GENDER
Number of female directors 1
Number of male directors: 7
ii) NUMBER OF PERSONS BY NATIONALITY
Number of Chilean directors: 4
Number of foreign directors: 4
iii) NUMBER OF PERSONS BY AGE
Number of directors whose age is:
Under 30 years: 0
30 to 40 years: 0
41 to 50 years: 3
51 to 60 years: 3
61 to 70 years: 2
Over 70 years: 0
iv) NUMBER OF PERSONS BY YEARS OF SERVICE
Number of directors who, as of December 31, 2017, have held the position of director of SQM for:
Less than 3 years: 8
Between 3 and 6 years: 0
More than 6 and less than 9 years: 0
Between 9 and 12 years: 0
More than 12 years: 0
5) B) SOCIAL RESPONSIBILITY AND SUSTAINABLE DEVELOPMENT: DIVERSITY
WITHIN EXECUTIVE MANAGEMENT AS OF DECEMBER 31, 2017
i) NUMBER OF PERSONS BY GENDER
Number of female executive officers: 0
Number of male executive officers: 12
ii) NUMBER OF PERSONS BY NATIONALITY
Number of Chilean executive officers: 11
Number of foreign executive officers: 1
iii) NUMBER OF PERSONS BY AGE

5) SOCIAL RESPONSIBILITY AND SUSTAINABLE DEVELOPMENT
85
Number of executive officers whose age is:
Under 30 years: 0
30 to 40 years: 4
41 to 50 years: 3
51 to 60 years: 4
61 to 70 years: 1
Over 70 years: 0
iv) NUMBER OF PERSONS BY YEARS OF SERVICE
Number of executive officers who, as of December 31, 2017, have worked at SQM for:
Less than 3 years: 2
Between 3 and 6 years: 2
More than 6 and less than 9 years: 0
Between 9 and 12 years: 2
More than 12 years: 6
5) C) SOCIAL RESPONSIBILITY AND SUSTAINABLE DEVELOPMENT: DIVERSITY
WITHIN THE ORGANIZATION
i) NUMBER OF PERSONS BY GENDER
Total number of female employees: 727
Total number of male employees: 4.194
ii) NUMBER OF PERSONS BY NATIONALITY
Total number of Chilean employees: 4.630
Total number of foreign employees: 291
iii) NUMBER OF PERSONS BY AGE
Total number of employees whose age is:
Under 30 years: 791
30 to 40 years: 1.878
41 to 50 years: 1.329
51 to 60 years: 742
61 to 70 years: 177
Over 70 years: 4
iv) NUMBER OF PERSONS BY YEARS OF SERVICE
Total number of employees who, as of December 31, 2017, have worked at SQM for:
Less than 3 years: 1.858
Between 3 and 6 years: 1.478
More than 6 and less than 9 years: 441
Between 9 and 12 years: 433
More than 12 years: 711

5) SOCIAL RESPONSIBILITY AND SUSTAINABLE DEVELOPMENT
86
5) D) SOCIAL RESPONSIBILITY AND SUSTAINABLE DEVELOPMENT: SALARY GAP BY
GENDER
Proportion of the average gross base salary represented by female employees compared to male
employees, disclosed according to the type of position:
Position Type Hay
Methodology Group Level (1)
Female Employees
(%)
Administrative 12 93
Manager (Support Area) 18 (2) N/A
19 (2) N/A
21 (2) N/A
18 104
19
20
83
110
Manager (Sales Area) 20 (2) N/A
Chief Executive Officer 26 (2) N/A
Manager (Operations Area) 19 (2) 151
20 (2) N/A
21 (2) N/A
N/A
Manager 13 (2) N/A
14 108
15 91
Manager 13 106
14 86
15 100
16 94
Department Head 15
16
17 (2)
92
91
N/A
Operator 11 97
12 102
13 (2) N/A
Professional 12 0
13 104
14 102
15 99
Senior Professional 14 109
15 133
16 88

5) SOCIAL RESPONSIBILITY AND SUSTAINABLE DEVELOPMENT
87
Position Type Hay
Methodology
Group Level (1)
Female Employees
(%)
Superintendent/Deputy Manager 15 (2) N/A
16 94
17 129
18 107
19 (2) N/A
Operations Supervisor 13 125
Technician 12 88
13 94
Salesperson 13 132
Vice President 21(2) N/A
22 (2) N/A
23 (2) N/A
(1) The Hay Methodology is a system that is used at companies around the world in order to evaluate positions in
such a way that they can be compared among companies of different sizes and industries. Group levels are
determined on the basis of multiple variables, including company size and the level of responsibility assigned to
the position (defined primarily as a function of knowledge, autonomy and responsibility for results).
(2) All employees at this position/group level are men.

6) MANAGEMENT AND PERSONNEL
88
6) MANAGEMENT AND PERSONNEL
6) A) MANAGEMENT AND PERSONNEL: ORGANIZATIONAL CHART
Organizational Chart
(1) On April 11, 2017, Pauline De Vidts left the Company and the area of VP Public Affairs and Sustainability was
reformed and incorporated into VP Corporate Services, General Counsel and VP Operations.
6) B) MANAGEMENT AND PERSONNEL: INFORMATION ABOUT THE BOARD OF
DIRECTORS
i) GENERAL INFORMATION ABOUT THE BOARD OF DIRECTORS
SQM’s Board of Directors comprises 8 members, none of which are alternate directors. The entire Board
of Directors is regularly elected every three years at our ordinary shareholders’ meeting. The Board of
Directors may appoint replacements to fill any vacancies that occur during periods between elections. If a
vacancy occurs, the entire Board must be elected or re-elected at the next regularly scheduled meeting of
shareholders. The last election of the Board of Directors took place at the ordinary shareholders’ meeting
held on April 28, 2017. On January 24, 2018, Joanne L. Boyes and Robert A. Kirkpatrick presented to the
Board of Directors their resignations from the position as directors of SQM. On the same day, Darryl Stann
was appointed as Company´s director, replacing Joanne L. Boyes. On February 19, 2018, Mr. Mark F.
Fracchia was appointed as SQM´s director replacing Mr. Kirkpatrick. As a result of the resignation of Ms.

6) MANAGEMENT AND PERSONNEL
89
Boyes and Mr. Kirkpatrick, pursuant to the Company’s By-laws, the entire Board of Directors will be
elected at the next Annual Ordinary Shareholders’ Meeting on April 27, 2018.
ii) IDENTIFICATION OF THE BOARD MEMBERS
Directors as of December 31, 2017:
Name Title Profession Chilean
Taxpayer ID
Date of Original
Election
Date of
Last
Reelection
Eugenio Ponce Lerou Chairman Mechanical
Engineer
5.370.715-7 Apr. 2016 Apr. 2017
Gerardo Jofré
Miranda
Vice Chairman Business
Administrator
5.672.444-3 Apr. 2017 N/A
Joanne L. Boyes Director Chartered
Professional
Accountant
48.188.014-9 Apr. 2015 Apr. 2017
Hernán Büchi Buc Director Civil Engineer 5.718.666-6 Apr. 2017 N/A
Gonzalo Guerrero
Yamamoto
Director Lawyer 10.581.580-8 Apr. 2016 Apr. 2017
Robert A. Kirkpatrick Director Lawyer 48.187.982-5 Apr. 2015 Apr. 2017
Fernando Massu Tare Director Business
Administrator
6.783.826-2 Apr. 2017 N/A
Arnfinn F. Prugger Director Geoscientist 48.187.981-7 Apr. 2015 Apr. 2017
Directors not on the Board as of December 31, 2017 but who were on the Board within the last
two years:
Name Title Profession Chilean
Taxpayer ID
Date of
Original
Election
Date of
Last
Reelection
Date Left
Board
Juan Antonio
Guzmán Molinari
Chairman Chemical and
Mechanical
Engineer
5.123.918-0 Apr. 2013 n/a Apr. 2016
Wolf Von Appen
Behrmann
Director Entrepreneur 2.884.455-7 May 2005 Apr. 2015 Apr. 2016
Edward J. Waitzer Vice
Chairman
Lawyer 21.376.788-7 Apr. 2015 Apr. 2016 Apr. 2017
Hans Dieter
Linneberg Arancibia
Director Economist 8.321.556-9 Apr. 2015 Apr. 2016 Apr. 2017
Julio Rebolledo
Díaz
Director Academic and
consultant
12.587.799-0 Apr. 2016 N/A Apr. 2017

6) MANAGEMENT AND PERSONNEL
90
iii) REMUNERATIONS OF THE DIRECTORS
Summary of remunerations paid to members of the Board of Directors between January and December 2017 (in Ch$):
SQM S.A.
Total
Board of Directors Directors’ Committee
Corporate
Governance
Committee
Safety, Health and
Environment
Committee
Total
SQMC
S.A.
Board of
Directors
Directors Fixed Variable Fixed Variable Fixed Fixed Fixed
Luis Eugenio Ponce Lerou 117,050,478 249,564,682 366,615,160 9,571,861 376,187,021
Hans Dieter Linneberg A. 21,148,732 110,917,489 7,930,776 36,972,496 5,287,185 182,256,678 182,256,678
Gonzalo Guerrero Yamamoto 63,812,422 110,917,489 15,953,107 190,683,018 190,683,018
Julio Cesar Rebolledo Diaz 26,418,328 110,917,488 9,906,874 36,972,496 184,215,186 184,215,186
Edward J. Waitzer 26,418,328 110,917,488 9,906,874 36,972,569 6,604,583 190,819,842 190,819,842
Robert A. Kikpatrick 95,162,822 110,917,701 23,790,710 229,871,233 229,871,233
Arnfinn F. Prugger 95,162,822 110,917,701 23,790,710 229,871,233 229,871,233
Joanne L. Boyes 95,162,822 110,917,701 13,989,025 14,464,693 234,534,241 234,534,241
Hernan Büchi Buc 37,304,063 9,326,017 9,326,017 55,956,097 55,956,097
Gerardo Jofré Miranda 37,304,064 13,989,025 9,326,017 60,619,106 60,619,106
Fernando Massu Taré 37,304,062 13,989,025 51,293,087 51,293,087
TOTAL 652,248,943 1,025,987,739 69,711,599 110,917,561 54,334,511 63,534,526 1,976,734,879 9,571,861 1,986,306,740

6) MANAGEMENT AND PERSONNEL
91
Summary of remunerations paid to members of the Board of Directors between January and December 2016 (in Ch$):
SQM S.A. SQMC S.A.
Board of Directors Directors’ Committee
Corporate
Governance
Committee
Safety, Health
and
Environment
Committee
Ad-Hoc
Committee
Total Board of
Directors Total
Directors Fixed Variable Fixed Variable Fixed Fixed Fixed Fixed
Luis Eugenio Ponce Lerou 62,862,957 - - - - - - 62,862,957 9,378,257 9,378,257
Edward J. Waitzer 67,475,936 85,483,912 25,306,478 28,494,860 16,868,988 - 7,709,225 231,339,399 - -
Joanne L. Boyes 36,035,504 85,483,912 - - - 9,008,878 - 130,528,294 - -
Hernán Büchi Buc 20,613,068 85,483,912 7,729,901 28,494,860 - - - 142,321,741 - -
Gonzalo Guerrero Yamamoto 41,908,638 - - - - 10,477,162 - 52,385,800 - -
Juan Antonio Guzmán Molinari 38,608,329 192,338,636 - - - - - 230,946,965 - -
Robert A. Kirkpatrick 36,035,504 85,483,912 - - 9,008,878 - 7,709,225 138,237,519 - -
Hans Dieter Linneberg A. 67,647,524 85,483,912 25,367,824 28,494,860 16,911,885 - - 223,906,005 - -
Arnfinn F. Prugger 36,035,504 85,483,912 - - - 9,008,878 - 130,528,294 - -
Julio Cesar Rebolledo Diaz 36,639,042 - 13,739,642 - - - - 50,378,684 - -
Wolf Von Appen B. 30,858,568 85,483,912 - - - 7,714,644 7,714,644 131,771,768 - -
TOTAL 474,720,574 790,726,020 72,143,845 85,484,580 42,789,751 36,209,562 23,133,094 1,525,207,426 9,378,257 9,378,257

6) MANAGEMENT AND PERSONNEL
92
iv) ADVISORY SERVICES CONTRACTED BY THE BOARD OF DIRECTORS
During 2016, the Board of Directors contracted the following advisory services:
Entity Type of Service Amount (US$)
PriceWaterhouseCoopers Financial statement audit US$1,40 million
Shearman & Sterling Legal US$0,55 million
Grupo Vial Serrano Legal US$0,07 million
Others Legal US$0,04 million
TOTAL US$2,06 million
v) BOARD OF DIRECTORS TRAINING
During 2017, the Board of Directors received training in the following areas:
(1) Orientation for new Board members
(2) Labour Law
(3) Securites Market Law and FCPA
(4) Tax Legislation
(5) SQM’s By-laws
6) C) MANAGEMENT AND PERSONNEL: INFORMATION ABOUT THE DIRECTORS’
COMMITTEE
i) DIRECTORS’ COMMITTEE FORMED IN ACCORDANCE WITH ARTICLE 50 PART TWO
OF LAW NO, 18,046
As of December 31, 2017, the Company had a Directors’ Committee to carry out the functions established
under Article 50, part two, of Law No, 18,046.
ii) IDENTIFICATION OF MEMBERS OF THE DIRECTORS’ COMMITTEE
As of December 31, 2017, the Company’s Directors’ Committee was comprised of three Directors: Mr.
Gerardo Jofré M., Mr. Fernando Massu T. and Ms. Joanne L. Boyes. Under the regulations in force as of
December 31, 2017, Messrs. Jofré and Massu held and continue to hold the position of Independent Director.
Ms. Boyes, who was an executive officer of Nutrien (formerly PCS prior to the merger with Agrium Inc. on
January 1, 2018) during her service on our Directors’ Committee, served as an observer on audit committee
matters. Mr. Jofré held and continues to hold the position of Chairman of the Directors’ Committee.
The members of this Directors’ Committee were elected on April 28, 2017. On that date, three elected
directors became new members of the Directors´ Committee, replacing Hans Dieter Linneberg A., Julio
Rebolledo D. and Edward J. Waitzer. The Directors’ Committee had previously remained unchanged since
May 18, 2016.
iii) REMUNERATIONS OF THE DIRECTORS’ COMMITTEE
On April 28, 2017, it was agreed at the SQM Ordinary Shareholders’ Meeting that each Director sitting on
the Directors’ Committee would receive monthly remunerations of 75 UF, and annual remunerations
equivalent to 0,02% of the Company’s liquid net earnings for the 2017 financial year. This compensation
package is fixed regardless of the number of sessions held by the Committee during the period, and separate
to the remunerations received by the members in their capacity as members of the Company’s Board of
Directors.

6) MANAGEMENT AND PERSONNEL
93
For further information about remunerations paid to the members of the Directors’ Committee during 2017
and 2016, see section 5)B)iii) Remunerations of the Directors.
iv) ACTIVITIES OF THE DIRECTORS’ COMMITTEE
During 2017, the Directors’ Committee of SQM (the “Committee”) analyzed (i) the Company’s Unaudited
Financial Statements and Reports; (ii) the Company’s Audited Financial Statements and Reports; (iii) the
Reports and proposals of external auditors, accounts inspectors and independent risk rating agencies for the
Company; (iv) the proposal to SQM’s Board of Directors about the external auditors and independent rating
agencies that the Board could recommend to the respective shareholders’ meeting for their subsequent
appointment; (v) the tax and other services, other than audit services, provided by the Company’s external
auditors and its subsidiaries in Chile and abroad; (vi) the remuneration and compensation plans for the
Company’s main executives; (vii) the information related to the Company’s operations as referred to in Title
XVI of the Corporations Act; (viii) the report on internal control of the Company and (ix) the various matters
referred to in the Chapter titled “Directors’ Committee” included in SQM’s Financial Statements at
December 31, 2017.
Regarding the above, the Committee:
(a) Examined the information regarding the financial statements of SQM for the 2017 business year
and the Report issued thereon by the External Auditors of SQM, Similarly, it also examined the
Company’s Interim Consolidated Financial Statements for the 2017 business year.
(b) Examined at its meeting No. 118 on November 22, 2017, the execution of a bond issue agreement
(“Agreement”) with BTG Pactual. BTG Pactual is a related party because SQM´s director Mr.
Massú is a president of that entity. The Director´s Committee approved the Agreement. In its
meeting No. 746 on November 22, 2017, the Board of Directors was duly informed of such
approval and, in turn, also confirmed that the Agreement was on terms, prices and other conditions
similar to those prevailing in the respective markets at the pertinent time and approved the
execution of the Agreement, by the unanimous vote of directors present at the meeting with the
abstention of Mr. Massú.
(c) Proposed to the Company’s Board of Directors the names of the External Auditors and the
Independent Risk Rating Agencies for SQM and the Company’s Board of Directors, in turn,
suggested their appointment to the respective Annual Ordinary Shareholders Meeting of SQM. The
Company’s Board of Directors approved said suggestions and the Shareholders’ Meeting also
ratified them.
(b) Examined and approved the remuneration system and the compensation plans for the Company’s
employees and senior executives.
The Committee also (i) authorized the contracting by the Company of various consulting services with PwC,
(ii) reviewed the expenses of the Company's CEO, and (iii) reviewed the reports from the Company’s internal
audit and risk and compliance areas.
Finally, the Committee issued the Annual Management Report referred to in Law No, 18,046.
On April 28, 2017, the Annual General Shareholders’ Meeting of SQM approved an operational budget for
the Committee; the operational budget is equivalent to the annual remuneration of the members of the
Committee. The activities carried out by the Committee, as well as the expenses incurred by it, are disclosed
at the General Shareholders Meeting.

6) MANAGEMENT AND PERSONNEL
94
Article 50 bis of the Chilean Corporations Act states that the Committee should consist of three Directors, of
which at least one member should preferably be independent from the controller (i.e., any person or entity
who “controls” the company for Chilean law purposes), if any, and that their functions be remunerated.
v) ADVISORY SERVICES CONTRACTED BY THE DIRECTORS’ COMMITTEE
During 2017 the Committee incurred expenses of approximately US$167,000 related to the advisory services
of Internal Audit and SOX Audit.

6) MANAGEMENT AND PERSONNEL
95
6) D) MANAGEMENT AND PERSONNEL: MAIN EXECUTIVES
i) IDENTIFICATION OF EXECUTIVE OFFICERS
As of December 31, 2017, the following executives served on the Company’s executive management team:
Name Position Profession Chilean
Taxpayer ID
In Position
Since
Years of
Service at
SQM(1)
Patricio de
Solminihac T.
Chief Executive
Officer
Industrial Civil
Engineer
6.263.302-6 Mar. 2015 30 years
Ricardo Ramos
R.
Chief Financial
Officer and Vice
President of
Corporate Services
Industrial Civil
Engineer
8.037.690-1 May.2016 29 years
Gonazlo
Aguirre T.
General Counsel Lawyer 13.441.419-7
Sep. 2016 2 years
Pablo Altimiras
C.
Vice President of
Development and
Planning
Industrial Civil
Engineer
13.657.862-6 May. 2016 12 years
Juan Carlos
Barrera P.
Vice President of
Operations,
Potassium and
Lithium
Industrial Civil
Engineer
10.528.182-K Jan. 2007 27 years
Jose Miguel
Berguño C.
Vice President of
Human Resources
and Performance
Industrial Civil
Engineer
10.903.992-6 May.2016 6 years
Frank Biot Vice President of
Sales, Potassium and
Nitrate
Economist N/A May. 2016 33 years
Carlos Díaz O. Vice President of
Operations, Nitrates
and Iodine
Industrial Civil
Engineer
10.476.287-5 Oct. 2012 22 years
Gerardo Illanes
G.
Vice President of
Finance
Industrial Civil
Engineer
13.904.120-8 May. 2016 12 years
Daniel Jiménez
Sch.
Vice President of
Sales, Iodine,
Lithium and
Industrial Chemicals
Industrial Civil
Engineer
6.362.533-7 May. 2016 27 years
Raúl Puerto M. Internal Audit
Manager
Industrial
Engineer
14.757.436-K Jan. 2016 2 years
Andrés Yaksic
B.
Risk Management
and Compliance
Officer
Industrial Civil
Engineer
15.313.670-K Oct. 2015 10 years
(1) Years of service at SQM includes SQM S.A. and its subsidiaries.
ii) REMUNERATIONS OF MAIN EXECUTIVES
Remunerations for the main executives for 2017 and 2016 were as follows:
Year Number of
Executives (1)
Fixed Salary
(Millions of Ch$)
Variable Salary
(Millions of Ch$)
Total Salary
(Millions of Ch$)
2017 115 11,798 5,026 16,824
2016 105 10,951 2,732 13,683 (1) Considers the average number of executives during the period.

6) MANAGEMENT AND PERSONNEL
96
iii) COMPENSATION PLANS
Executive incentive plans: the organization’s goal is to create value for its interest groups, and to this end
SQM S.A. has developed a variable incentives system that recognizes people’s commitment to the
organization and its operating results.
Directors: the only remunerations assigned to the Board of Directors are disclosed in section 5)B)iii)
Remunerations of the Directors. The Company has not implemented any incentive plans for its Directors.
SQM Executive Officers: the Company provides its executives with an annual bonus plan, based on
Company’s operating results and safety indices. SQM also operates a compensation plan designed to retain
its executives by providing bonuses linked to the Company’s share price.
6) E) MANAGEMENT AND PERSONNEL: NUMBER OF EMPLOYEES
As of December 31, 2017, SQM and its subsidiaries had 4,921 employees, detailed as follows:
Employee Type Parent Subsidiaries Total
Executives 43 77 120
Professionals 143 942 1,085
Technicians and operators 248 3,177 3,425
Foreigners 19 272 291
Total 453 4,468 4,921

6) MANAGEMENT AND PERSONNEL
97
6) F) MANAGEMENT AND PERSONNEL: SHARE OWNERSHIP OF EXECUTIVE OFFICERS
AND BOARD MEMBERS
We have been informed that the following Directors own shares of SQM as of December 31, 2017:
Name Position Percentage of Shares in
SQM
Eugenio Ponce Lerou Chairman 0%
Gerardo Jofré Miranda Vice Chairman 0%
Joanne L. Boyes Director 0%
Hernán Büchi Buc Director 0%
Gonzalo Guerrero Yamamoto Director <1%
Robert A. Kirkpatrick Director 0%
Fernando Massu Tare Director 0%
Arnfinn F. Prugger Director 0%
We have been informed that the following executive officers own shares of SQM as of December 31, 2017:
Name Position Percentage of Shares in
SQM
Patricio de Solminihac T. Chief Executive Officer 0%
Ricardo Ramos R. Chief Financial Officer and Vice
President of Corporate Services 0%
Gonzalo Aguirre T. General Counsel 0%
Pablo Altimiras C. Vice President of Development and
Planning 0%
Juan Carlos Barrera P. Vice President of Operations,
Potassium and Lithium <1%
Jose Miguel Berguño C. Vice President of Human Resources
and Performance <1%
Carlos Díaz O. Vice President of Operations,
Nitrates and Iodine 0%
Gerardo Illanes G. Vice President of Finance <1%
Daniel Jiménez Sch. Vice President of Sales of Iodine,
Lithium and Industrial Chemicals 0%
Raúl Puerto M. Internal Audit Manager 0%
Andrés Yaksic B. Risk Management and Compliance
Officer 0%

7) INFORMATION ABOUT SUBSIDIARIES AND ASSOCIATES
98
7) INFORMATION ABOUT SUBSIDIARIES AND ASSOCIATES
7) A) INFORMATION ABOUT SUBSIDIARIES AND ASSOCIATES: SUBSIDIARIES AND
ASSOCIATES
Subsidiaries in Chile
AGRORAMA S.A.: Type of company: Corporation
Capital: US$162,700
Ownership: 99.999% SQMC S.A.
0.001% minority interest
Investment as % of SQM S.A.’s
individual assets: -0. 0509874%
Corporate purpose: Sales and distribution of fertilizers, pesticides and agricultural
inputs
Board of Directors: Daniel Pizarro Rosas
Rodrigo Millán Riffo
Enrique Olivares Carlini
CEO: Carlos Arredondo Belmar
Relationship with parent company: Distribution
Contracts with parent company: Not applicable
Address: El Trovador 4280, office 1106, Las Condes, Santiago, Chile
Telephone: (56) 2 2425 3883
Fax: (56) 2 2425 2068
AJAY-SQM CHILE S.A.:
Type of company: Corporation
Capital: US$5,313,794
Ownership: 51% SQM S.A.
49% Non-related parties
Investment as % of SQM S.A.’s
individual assets: 0.2371145%
Corporate purpose: Iodine processing
Board of Directors: Daniel Jimenez S.*
Felipe Smith de A.
Alan Shipp
Charles Pittard
CEO: Marco Orellana L.
Relationship with parent company: Production
Contracts with parent company: Distribution
Address: Avda Pdte. Eduardo Frei N° 4900, Renca, Santiago, Chile
Telephone: (56) 2 2443 7110
Fax: (56) 2 2443 7114
ALMACENES Y DEPOSITOS LTDA.:
Type of company: Limited liability corporation
Capital: US$1,263,943
Ownership: 99% SQM Potasio S.A.
1% SQM S.A.
Investment as % of SQM S.A.’s
* Director, CEO o Executive Office of SQM S.A.

7) INFORMATION ABOUT SUBSIDIARIES AND ASSOCIATES
99
individual assets: 0.0096117%
Corporate purpose: General deposit activities
Board of Directors: None
CEO: Patricio de Solminihac T.*
Address: El Trovador 4285, Las Condes, Santiago, Chile
Relationship with parent company: Support
Contracts with parent company: Not applicable
Telephone: (56) 2 2425 2000
Fax: (56) 2 2425 2268
COMERCIAL AGRORAMA LTDA Type of company: Limited liability corporation
Capital: US$1,301,600
Ownership: 70% SQMC S.A.
30% Non-related parties
Investment as % of SQM S.A.’s
individual assets: -0.0071379%
Corporate purpose: Sales and distribution of fertilizers, pesticides and agricultural
inputs
Board of Directors: Daniel Pizarro R.
Rodrigo Millán R.
Enrique Olivares C.
Tullio Callegari P.
Alejandro Bitrán M.
CEO: Carlos Arredondo B.
Relationship with parent company: Distribution
Contracts with parent company: Not applicable
Address: El Trovador 4285, office 1106, Las Condes, Santiago, Chile
Telephone: (56) 2 2425 2000
Fax: (56) 2 2425 2068
COMERCIAL HYDRO S.A.: Type of company: Corporation
Capital: US$4,818,186
Ownership: 99.9999% SQMC S.A.
0.0001% SQMC Internacional Ltda.
Investment as % of SQM S.A.’s
individual assets: 0.0816901%
Corporate purpose: Import and marketing of fertilizers
Board of Directors: Carlos Ríos M.
Roberto Campusano B.
Daniel Pizarro R.
CEO: Daniel Pizarro R.
Relationship with parent company: Support
Contracts with parent company: None
Address: El Trovador 4285, Las Condes, Santiago, Chile
Telephone: (56) 2 2425 2525
Fax: (56) 2 2425 2268
EXPLORACIONES MINERAS S.A.: Type of company: Corporation
Capital: US$30,100,000
Ownership: 0.269103% SQM S.A.

7) INFORMATION ABOUT SUBSIDIARIES AND ASSOCIATES
100
99.730897% SQM Potasio S.A.
Investment as % of SQM S.A.’s
individual assets: 0.7137683%
Corporate purpose: Operation of other mines and quarries
Board of Directors: Patricio de Solminihac T.*
Ricardo Ramos R.*
Daniel Jimenez S.*
CEO: Patricio de Solminihac T.*
Relationship with parent company: Support
Contracts with parent company: Not applicable
Address: El Trovador 4285, Las Condes, Santiago, Chile
Telephone: (56) 2 2425 2000
Fax: (56) 2 2425 2434
INSTITUCION DE SALUD PREVISIONAL NORTE GRANDE LTDA.: Type of company: Limited liability corporation
Capital: US$81,350
Ownership: 99% SQM Industrial S.A.
1% SQM S.A.
Investment as % of SQM S.A.’s
individual assets: 0.0180448%
Corporate purpose: Administration of health matters for SQM S.A.
Board of Directors: Not applicable
CEO: Humberto Riquelme
Relationship with parent company: Support
Contracts with parent company: Support
Address: Aníbal Pinto N° 3228, Antofagasta, Chile
Telephone: (56) 5 5241 2621
Fax: (56) 5 5241 2632
ORCOMA ESTUDIOS SPA: Type of company: Joint stock company
Capital: US$4,631,507
Ownership: 51% SQM S.A.
49% Non-related parties
Investment as % of SQM S.A.’s
individual assets: 0.0649912%
Corporate purpose: Exploration, measurement, prospection and research of
mineral deposits for extraction, production and mineral
processing
Legal representative: Patricio de Solminihac T.*
Ricardo Ramos*
Relationship with parent company: Not applicable
Contracts with parent company: None
Address: Apoquindo 3721, office 131, Las Condes, Santiago, Chile
Telephone: (56) 2 367 3000
ORCOMA SPA:
Type of company: Joint stock company
Capital: US$2,357,731
Ownership: 100% SQM S.A.
Investment as % of SQM S.A.’s

7) INFORMATION ABOUT SUBSIDIARIES AND ASSOCIATES
101
individual assets: 0.0643519%
Corporate purpose: Exploration, measurement, prospection, research,
development and operation of mineral deposits for extraction,
production and processing
Legal representative: Patricio de Solminihac*
Ricardo Ramos*
Relationship with parent company: Not applicable
Contracts with parent company: None
Address: Apoquindo 3721, office 131, Las Condes, Santiago, Chile
Telephone: (56) 2 367 3000
PROINSA LTDA.:
Type of company: Limited liability corporation
Capital: US$66,799
Ownership: 99.9% SQMC S.A.
0.1% Non-related parties
Investment as % of SQM S.A.’s
individual assets: 0.0009852%
Corporate purpose: Production and marketing of fertilizers
Board of Directors: None
CEO: Daniel Pizarro R.
Relationship with parent company: Support
Contracts with parent company: Not applicable
Address: El Trovador 4285, Las Condes, Santiago, Chile
Telephone: (56) 2 2425 2525
Fax: (56) 2 2425 2268
SERVICIOS INTEGRALES DE TRANSITOS Y TRANSFERENCIAS S.A.:
Type of company: Corporation
Capital: US$9,873,573
Ownership: 99.99966% SQM Industrial S.A.
0.00034% SQM S.A.
Investment as % of SQM S.A.’s
individual assets: 0.1542424%
Corporate purpose: Transport and storage of merchandise
Board of Directors: Juan Carlos Barrera P.*
Ricardo Ramos R.*
Patricio de Solminihac T.*
Daniel Jiménez S.*
Carlos Diaz O. *
CEO: Patricio de Solminihac T.*
Relationship with parent company: Distribution
Contracts with parent company: Not applicable
Address: Arturo Prat N° 1060, Tocopilla, Chile
Telephone: (56) 5 5241 4452
Fax: (56) 5 5241 4488
SOCIEDAD PRESTADORA DE SERVICIOS DE SALUD CRUZ DEL NORTE S.A.:
Type of company: Corporation
Capital: US$81,350
Ownership: 99% SQM Industrial S.A.
1% SQM Potasio S.A.
Investment as % of SQM S.A.’s

7) INFORMATION ABOUT SUBSIDIARIES AND ASSOCIATES
102
individual assets: 0.0025147%
Corporate purpose: Provision of health-related services
Board of Directors: Miguel Diaz Peñaloza
Mauricio Guerra Oliveros
David Zapata F.
CEO: David Zapata F.
Relationship with parent company: Support
Contracts with parent company: Support
Address: El Trovador 4285, Las Condes, Santiago, Chile
Telephone: (56) 2 2425 2000
Fax: (56) 2 2425 2068
SOQUIMICH COMERCIAL S.A.: Type of company: Open stock corporation
Capital: US$61,745,898
Ownership: 60.6383212% SQM Industrial S.A.
0.0000004% SQM S.A.
39.3616784% Non-related parties
Investment as % of SQM S.A.’s
individual assets: 2.0807361%
Corporate purpose: Production and marketing of fertilizers
Board of Directors: Ricardo Ramos R. *
Bogdan Borkowski S.
Alfredo Doberti D.
Francisco Javier Fontaine S.
Gerardo Illanes G. *
Daniel Jiménez S. *
Eugenio Ponce L.*
CEO: Daniel Pizarro R.
Relationship with parent company: Distribution
Contracts with parent company: Supply
Address: El Trovador 4285, Las Condes, Santiago, Chile
Telephone: (56) 2 2425 2525
Fax: (56) 2 2425 2268
SQM INDUSTRIAL S.A.:
Type of company: Corporation
Capital: US$715,066,287
Ownership: 99.047043% SQM S.A.
0.952957% SQM Potasio S.A.
Investment as % of SQM S.A.’s
individual assets: 25.6847481%
Corporate purpose: Operation of extraction plants, holdings and transfer of
mineral substances and raw materials
CEO: Patricio de Solminihac T.*
Board of Directors: Patricio de Solminihac T.*
Ricardo Ramos*
Carlos Diaz O.*
Relationship with parent company: Production
Contracts with parent company: Not applicable
Address: El Trovador 4285, Las Condes, Santiago, Chile
Telephone: (56) 2 2425 2525
Fax: (56) 2 2425 2268

7) INFORMATION ABOUT SUBSIDIARIES AND ASSOCIATES
103
SQM MAG SPA:
Type of company: Joint stock company
Capital: US$10,000
Ownership: 100% SQM Potasio S.A.
Investment as % of SQM S.A.’s
individual assets: 0.0002743%
Corporate purpose: Mining exploration and exploitation
Board of Directors: Patricio de Solminihac T.*
Ricardo Ramos R.*
Daniel Jiménez S.*
Carlos Diaz O.*
Juan Carlos Barrera P.*
CEO: Juan Pablo Bellolio R.
Relationship with parent company: Production
Contracts with parent company: Not applicable
Address: Los Militares 4290, 1st floor, Las Condes, Santiago, Chile
Telephone: (56) 2 2425 2467
SQM NITRATOS S.A.:
Type of company: Corporation
Capital: US$30,349,981
Ownership: 99.99999782% SQM S.A.
0.00000218% SQM Potasio S.A.
Investment as % of SQM S.A.’s
individual assets: 1.7480744%
Corporate purpose: Production and sale of fertilizers
Board of Directors: Patricio de Solminihac T.*
Ricardo Ramos R.*
Daniel Jiménez S.*
Carlos Diaz O.*
Juan Carlos Barrera P.*
CEO: Patricio de Solminihac T.*
Relationship with parent company: Production
Contracts with parent company: Not applicable
Address: El Trovador 4285, Las Condes, Santiago, Chile
Telephone: (56) 2 2425 2000
Fax: (56) 2 2425 2268
SQM POTASIO S.A.:
Type of company: Corporation
Capital: US$257,010,492
Ownership: 99.999999% SQM S.A.
0.000001% Non-related parties
Investment as % of SQM S.A.’s
individual assets: 29.8008603%
Corporate purpose: Extraction of minerals for fertilizer and chemical production
Board of Directors: Patricio de Solminihac T.*
Ricardo Ramos R.*
Carlos Diaz O.*
Daniel Jiménez S.*
Juan Carlos Barrera P.*
CEO: Patricio de Solminihac T.*

7) INFORMATION ABOUT SUBSIDIARIES AND ASSOCIATES
104
Relationship with parent company: Production
Contracts with parent company: Not applicable
Address: El Trovador 4285, Las Condes, Santiago, Chile
Telephone: (56) 2 2425 2000
Fax: (56) 2 2425 2268
SQM SALAR S.A.:
Type of company: Corporation
Capital: US$38,000,000
Ownership: 81.82% SQM Potasio S.A.
18.18% SQM S.A.
Investment as % of SQM S.A.’s
individual assets: 24.9709305%
Corporate purpose: Exploitation and marketing of potassium, lithium and other
products
Board of Directors: Patricio de Solminihac T.*
Daniel Jiménez S.*
Ricardo Ramos R.*
Carlos Diaz O.*
CEO: Patricio de Solminihac T.*
Relationship with parent company: Production
Contracts with parent company: Not applicable
Address: El Trovador 4285, Las Condes, Santiago, Chile
Telephone: (56) 2 2425 2000
Fax: (56) 2 2425 2268
SOQUIMICH COMERCIAL INTERNACIONAL LTDA.:
Type of company: Limited liability corporation
Capital: US$943,764
Ownership: 99.7423% SQMC S.A.
0.2577% Proinsa Ltda.
Investment as % of SQM S.A.’s
individual assets: 0.0036417%
Corporate purpose: Marketing, import and export of fertilizers
Board of Directors: None
CEO: Daniel Pizarro R.
Relationship with parent company: Support
Contracts with parent company: Not applicable
Address: El Trovador 4285, Las Condes, Santiago, Chile
Telephone: (56) 2 2425 2525
Fax: (56) 2 2425 2268
International Subsidiaries
ADMINISTRACION Y SERVICIOS SANTIAGO S.A. DE C.V.: Type of company: Variable capital corporation
Capital: US$6,612
Ownership: 99.998% SQM Industrial S.A.
0.002% SQM North America Corporation
Investment as % of SQM S.A.’s
individual assets: -0.0093361%
Corporate purpose: Services
Board of Directors: Christian Lüders M.

7) INFORMATION ABOUT SUBSIDIARIES AND ASSOCIATES
105
Ricardo Ramos R.*
Frank Biot*
Gerardo Illanes G.*
Gonzalo Aguirre T.*
Alvaro Fernandez G.
Patricio de Solminihac T.*
Matías Murillo G.
CEO: Christian Lüders M.
Relationship with parent company: Support
Contracts with parent company: Not applicable
Address: Av. Moctezuma 144-4, Ciudad del Sol, CP 45050, Zapopan,
Jalisco, Mexico
Telephone: (52 33) 35401100
Fax: (52 33) 35401100
COMERCIAL CAIMÁN INTERNACIONAL S.A.: Type of company: Corporation
Capital: US$1,000
Ownership: 100% SQM Investment Corporation N.V.
Investment as % of SQM S.A.’s
individual assets: -0.0236107%
Corporate purpose: Marketing, importing and exporting
Board of Directors: Christian Lüders M.
Andrés Yaksic B.*
Matías Murillo G.
CEO: Christian Lüders M.
Relationship with parent company: Support
Contracts with parent company: Not applicable
Address: Edificio Plaza Bancomer, Calle 50, Panama, Republic of
Panama
Telephone: (52 33) 35101100
Fax: (52 33) 35101100
NITRATOS NATURAIS DO CHILE SERVICIOS LTDA.: Type of company: Limited liability corporation
Capital: US$774,294
Ownership: 29.18% SQM Industrial S.A.
70.82% SQM Brasil Ltda.
Investment as % of SQM S.A.’s
individual assets: -0.0907946%
Corporate purpose: Marketing advisory services, representation of other foreign
and local companies, administrative support in general
Board of Directors: None
Legal representative: Martim de Almeida Sampaio
Relationship with parent company: Support
Contracts with parent company: Not applicable
Address: Calçada das Margaridas, nº 163, sala 02, Centro Comercial de
Alphaville, Alphaville, Barueri, CEP 06453-038, Sao Paulo,
Brazil
Telephone: (55 11) 4195 6315
NORTH AMERICAN TRADING COMPANY: Type of company: Corporation

7) INFORMATION ABOUT SUBSIDIARIES AND ASSOCIATES
106
Capital: US$338,124
Ownership: 100% SQM North America Corporation
Investment as % of SQM S.A.’s
individual assets: 0.0072355%
Corporate purpose: Investment company
Board of Directors: Ricardo Ramos R.*
Daniel Jiménez S.*
President: Pablo Hernandez
Relationship with parent company: Support
Contracts with parent company: Not applicable
Address: 2727 Paces Ferry Road, Building Two, Suite 1425, Atlanta,
GA 30339
Telephone: (1 770) 916 9400
Fax: (1 770) 916 9401
ROYAL SEED TRADING A.V.V.: Type of company: Limited liability corporation
Capital: US$6,000
Ownership: 1.67% SQM S.A.
98.33% SQM Potasio S.A.
Investment as % of SQM S.A.’s
individual assets: -0.5150199%
Corporate purpose: Investment and marketing of moveable property and real
estate
Board of Directors: IMC International Management & Trust Company N.V.
CEO: IMC International Management & Trust Company N.V.
Relationship with parent company: Support
Contracts with parent company: Not applicable
Address: L. G. Smith Blv 62 Miramar Building, Suite 304, Orangestad,
Aruba
Telephone: 297 582 3301
Fax: 297 583 6454
RS AGRO CHEMICAL TRADING CORP. A.V.V.: Type of company: Limited liability corporation
Capital: US$6,000
Ownership: 98.3333% SQM S.A.
1.6667% SQM Potasio S.A.
Investment as % of SQM S.A.’s
individual assets: 0,1410017%
Corporate purpose: Investment and marketing of moveable property and real
estate
Board of Directors: IMC International Management & Trust Company N.V.
CEO: IMC International Management & Trust Company N.V.
Relationship with parent company: Support
Contracts with parent company: Not applicable
Address: L. G. Smith Blv 62 Miramar Building, Suite 304, Orangestad,
Aruba
Telephone: 297 582 3301
Fax: 297 583 6454
SACAL S.A.: Type of company: Corporation

7) INFORMATION ABOUT SUBSIDIARIES AND ASSOCIATES
107
Capital: US$6,019
Ownership: 95% SQM Potasio S.A.
5% SQM Idustrial S.A.
Investment as % of SQM S.A.’s
individual assets: 0,0001651%
Corporate purpose: Mining
Board of Directors: Fernando Gabriel Gonzalez Torres
Mario Leonardo Turzi
Legal representative: Fernando Gabriel Gonzalez Torres
Relationship with parent company: Support
Contracts with parent company: Not applicable
Address: Av. Leandro N. Alem 882, piso 13, Ciudad de Buenos Aires,
Argentina
Telephone: 297 582 3301
Fax: 297 583 6454
SOQUIMICH EUROPEAN HOLDINGS B.V.:
Type of company: Limited liability corporation
Capital: US$15,815,547
Ownership: 100% SQM Corporation N.V.
Investment as % of SQM S.A.’s
individual assets: 3.2308722%
Corporate purpose: Investment company
Board of Directors: Frank Biot*
Patrick Vanbeneden
Paul van Duuren
Dennis Beets
CEO: None
Relationship with parent company: Distribution
Contracts with parent company: Not applicable
Address: Luna Arena, Herikerbergweg 238, 1101 CM Amsterdam Zuid-
Oost, Netherlands
Telephone: (31 20) 5755600
Fax: (31 20) 6730016
SOQUIMICH S.L.R. ARGENTINA:
Type of company: Limited liability corporation
Capital: S$1,656,500
Ownership: 99.99906% SQM Investment Corporation
0.00094% SQM Industrial S.A.
Investment as % of SQM S.A.’s
individual assets: 0.0001453%
Corporate purpose: Import, export, sales and marketing of fertilizers, sodium
nitrate, iodine, iodine salts, sodium sulfate, potassium nitrate
and all classes of agricultural and industrial inputs
Board of Directors: None
CEO: Carlos Balter
Relationship with parent company: Support
Contracts with parent company: Not applicable
Address: Espejo 65 – Oficina 6 – 5500 Mendoza, Argentina
Telephone: (54 261) 434 0301
Fax: (54 261) 434 0301

7) INFORMATION ABOUT SUBSIDIARIES AND ASSOCIATES
108
SQI CORPORATION N.V.:
Type of company: Corporation
Capital: US$22,000
Ownership: 99.98413% SQM Potasio S.A.
0.01587% SQM S.A.
Investment as % of SQM S.A.’s
individual assets: -0.0005046%
Corporate purpose: Investment in moveable goods and real estate
Board of Directors: TMF Group
CEO: TMF Group
Relationship with parent company: Support
Contracts with parent company: Not applicable
Address: Pietermaai 15, Curacao
Telephone: (59) (99) 4612544
Fax: (59) (99) 4612647
SQM AFRICA:
Type of company: Limited liability corporation
Capital: US$70,699
Ownership: 100% Soquimich European Holdings B.V.
Investment as % of SQM S.A.’s
individual assets: 0.2150563%
Corporate purpose: Marketing of specialty plant nutrients and industrial products
Board of Directors: Frank Biot*
Patrick Vanbeneden
Emmanuel de Marez
Public Officer: Ettienne Strydom
Relationship with parent company: Distribution
Contracts with parent company: Not applicable
Address: Building 33 Waterford Office Park, Waterford Drive,
2055 Fourways, Johannesburg, South Africa
Telephone: (27 11) 6580018
Fax: (27 11) 6581101
SQM AUSTRALIA PTY:
Type of company: Limited liability corporation
Capital: US$25,653,923
Ownership: 100% SQM Potasio S.A.
Investment as % of SQM S.A.’s
individual assets: 0,7035857%
Corporate purpose: Mining
Board of Directors: Pablo Andres Altimiras C.*
Juan Carlos Barrera P. *
Jay Leary
Legal representative: Jay Leary
Relationship with parent company: Production
Contracts with parent company: Not applicable
Address: Level 16, 201 Elizabeth Street, Sydney, NSW 2000
Telephone: Not applicable
Fax: Not applicable
SQM (BEIJING) COMMERCIAL CO. LTDA.: Type of company: Limited liability corporation

7) INFORMATION ABOUT SUBSIDIARIES AND ASSOCIATES
109
Capital: US$1,600,000
Ownership: 100% SQM Industrial S.A.
Investment as % of SQM S.A.’s
individual assets: 0,0631374%
Corporate purpose: Commission agent and marketing of chemical products
Board of Directors: Patricio de Solminihac T.*
Frank Biot*
Ricardo Ramos R.*
CEO: Victor Larrondo G.
Relationship with parent company: Distribution
Contracts with parent company: Commercial agency agreement
Address: Room 1502, CBD International Mansion No. 16 Yong An
Dong Li, Jian Wai Ave Beijing, 100022, P.R. China,
Telephone: (86 10) 6461 8950
Fax: (86 10) 8454 0885
SQM BRASIL SERVICIOS LTDA.:
Type of company: Limited liability corporation
Capital: US$2,190,000
Ownership: 98.91% SQM Industrial
1.09% SQM S.A.
Investment as % of SQM S.A.’s
individual assets: -0.0773625%
Corporate purpose: Marketing advisory services, representation of other foreign
and domestic companies, administrative support in general
Board of Directors: None
Legal representative: Martim de Almeida Sampaio
Relationship with parent company: Support
Contracts with parent company: Not applicable
Address: Calçada das Margaridas, nº 163, sala 02, Centro Comercial de
Alphaville, Alphaville, Barueri, CEP 06453-038, Sao Paulo,
Brazil
Telephone: (55 11) 4195 6315
SQM COLOMBIA LTDA.:
Type of company: Join stock company
Capital: US$646,783
Ownership: 100% SQM Industrial
Investment as % of SQM S.A.’s
individual assets: 0,0102978%
Corporate purpose: Manufacturing, import, sales and export of fertilizers
Board of Directors: Christian Luders
Matias Murillo
Patricio de Solminihac T.*
Gonzalo Aguirre*
Gerardo Illanes*
Frank Biot*
Sebastian Sanchez
Legal representative: Christian Luders
Matias Murillo
Relationship with parent company: Support
Contracts with parent company: Not applicable
Address: Calle 72 No. 10-07 oficina 401

7) INFORMATION ABOUT SUBSIDIARIES AND ASSOCIATES
110
Telephone: (+57) 1 746 1000
Fax: (+57) 1 746 1000
SQM COMERCIAL DE MEXICO S.A. de C.V.:
Type of company: Variable capital corporation
Capital: US$22,044,533
Ownership: 99.94% SQM Industrial S.A.
0.05% SQM Potasio S.A.
0.0015% SQM S.A.
Investment as % of SQM S.A.’s
individual assets: 0.8483193%
Corporate purpose: Import, export and marketing of fertilizers
Board of Directors: Christian Lüders M.
Ricardo Ramos R.*
Frank Biot*
Gerardo Illanes G.*
Gonzalo Aguirre T.*
Alvaro Fernandez G.
Patricio de Solminihac T.*
Matías Murillo G.
CEO: Christian Lüders M.
Relationship with parent company: Distribution
Contracts with parent company: Not applicable
Address: Av. Moctezuma 144-4, Ciudad del Sol, CP 45050, Zapopan,
Jalisco, Mexico
Telephone: (52 33) 35401100
Fax: (52 33) 35401100
SQM CORPORATION N.V.: Type of company: Corporation
Capital: US$12,939,718
Ownership: 99.9794% SQM Industrial S.A.
0.0204% SQI Corporation N.V.
0.0002% SQM S.A.
Investment as % of SQM S.A.’s
individual assets: 3.5919678%
Corporate purpose: Investment in moveable goods and real estate
Board of Directors: TMF Group
CEO: TMF Group
Relationship with parent company: Support
Contracts with parent company: Not applicable
Address: Pietermaai 15, Curacao
Telephone: (59) (99) 4335119
Fax: (59) (99) 4335119
SQM ECUADOR S.A.:
Type of company: Corporation
Capital: US$416,900
Ownership: 99.996% SQM Industrial S.A.
0.004% SQM S.A.
Investment as % of SQM S.A.’s
individual assets: 0.0556108%
Corporate purpose: Wholesale fertilizer sales

7) INFORMATION ABOUT SUBSIDIARIES AND ASSOCIATES
111
Board of Directors: None
CEO: Christian Luders
Relationship with parent company: Distribution
Contracts with parent company: Not applicable
Address: Av. Constitución y Av. Juan Tanca Marengo, Edificio
Executive Center, Piso 3 Oficina 304-305, Guayaquil,
Ecuador
Telephone: (593 4) 2158639
Fax: (593 4) 2158639 ext 11
SQM EUROPE N.V.: Type of company: Corporation
Capital: US$21,736,572
Ownership: 99.42% Soquimich European Holdings B.V.
0.58% SQM S.A.
Investment as % of SQM S.A.’s
individual assets: 1.7083656%
Corporate purpose: Distribution and marketing of specialty plant nutrients and
industrial products in Europe, Northern Africa and the Middle
and Far East
Board of Directors: Ricardo Ramos R.*
Patricio de Solminihac T.*
Daniel Jiménez S.*
Gerardo Illanes G.*
CEO: Frank Biot*
Relationship with parent company: Support and Distribution
Contracts with parent company: Not applicable
Address: Houtdok-Noordkaai 25a, 2030, Antwerp, Belgium
Telephone: (32 3) 2039700
Fax: (32 3) 2312782
SQM FRANCE S.A. Type of company: Corporation
Capital: US$204,061
Ownership: 100% Soquimich European Holdings NV
Investment as % of SQM S.A.’s
individual assets: 0.0065024%
Corporate purpose: Distribution
Board of Directors:
Legal representative: Oliver Lecaplain
Relationship with parent company: Support
Contracts with parent company: Not applicable
Address: Zac Des Pommiers, 27930 Fauville, France
Telephone: None
SQM IBERIAN S.A.
Type of company: Corporation
Capital: US$133,127
Ownership: 100% Soquimich European Holdings B.V.
Investment as % of SQM S.A.’s
individual assets: 0.2761602%
Corporate purpose: Distribution and marketing of specialty plant nutrients and
technical products in Spain

7) INFORMATION ABOUT SUBSIDIARIES AND ASSOCIATES
112
Board of Directors: Frank Biot*
Jorge Lütken
Erik Borghys
Gerardo Illanes G.*
Gerencia: José Andrés Cayuela
Enrique Torras
Erik Lütken R.
Relationship with parent company: Distribution
Contracts with parent company: Not applicable
Address: Provenza 251 Principal 1a CP 08008 Barcelona, Spain
Telephone: (34 93) 4877806
Fax: (34 93) 4872344
SQM INDONESIA S.A.:
Type of company: Corporation
Capital: US$35,909
Ownership: 80% Soquimich European Holding B.V.
20% Non-related parties
Investment as % of SQM S.A.’s
individual assets: 0.0000704%
Corporate purpose: Import trading and distribution services
Board of Directors: Frank Biot* (President)
Patrick Vanbeneden
Rudy Ismanto
CEO: Not applicable
Relationship with parent company: Not applicable
Contracts with parent company: Not applicable
Address: Perumahanbumi Dirgantara Permai, Jl,
Suryadarma Blok Aw No. 15, Rt. 01/09, 17436 Jatisari
Pondok Gede, Indonesia
Telephone: (62 21) 86607760
Fax: (62 21) 86607761
SQM INTERNATIONAL N.V.: Type of company: Corporation
Capital: US$0
Ownership: 99.42% Soquimich European Holdings B.V.
0.52% SQM S.A.
Investment as % of SQM S.A.’s
individual assets: 0%
Corporate purpose: Distribution and sales of specialty plant nutrients and industrial
products in Europe, North Africa and the Middle and Far East
Board of Directors: Ricardo Ramos R.*
Patricio de Solminihac T.*
Daniel Jiménez S.*
Gerardo Illanes G.*
CEO: Frank Biot*
Relationship with parent company: Support and distribution
Contracts with parent company: Not applicable
Address: Houtdok-Noordkaai 25a, 2030, Antwerp, Bélgica
Telephone: (32 3) 2039700
Fax: (32 3) 2312782

7) INFORMATION ABOUT SUBSIDIARIES AND ASSOCIATES
113
SQM INVESTMENT CORPORATION N.V.:
Type of company: Corporation
Capital: US$50,000
Ownership: 99.00% SQM Potasio S.A.
1.00% SQM S.A.
Investment as % of SQM S.A.’s
individual assets: 1.0669497%
Corporate purpose: Investment and marketing of moveable goods and real estate
Board of Directors: TMF Group
CEO: TMF Group
Relationship with parent company: Support
Contracts with parent company: Not applicable
Address: Pietermaai 15, Curacao
Telephone: (59) (99) 4335119
Fax: (59) (99) 4335119
SQM ITALIA SRL:
Type of company: Limited liability corporation
Capital: US$306,602
Ownership: 100% Soquimich European Holdings NV
Investment as % of SQM S.A.’s
individual assets: 0.0334745%
Corporate purpose: Distribution
Board of Directors:
CEO: Silvio Maria Parri
Frank Biot*
Relationship with parent company: Support
Contracts with parent company: Not applicable
Address: Via A. Meucci, N°5, 50012 – Bagno A Ripoli –Firenze, Italy
Telephone: +39 055 644 418
Fax: None
SQM JAPAN CO. LTD.:
Type of company: Limited liability corporation
Capital: US$87,413
Ownership: 15.8147% SQM Potasio S.A.
84.0256% Soquimich European Holdings B.V.
0,5376% SQM S.A.
Investment as % of SQM S.A.’s
individual assets: -0.0641551%
Corporate purpose: Marketing of products in Asia/Oceania and marketing
assistance
Board of Directors: Patricio de Solminihac*
Daniel Jimenez S.*
Mayo Shibazaki
CEO: Mayo Shibazaki
Relationship with parent company: Distribution and marketing
Contracts with parent company: Commercial agency agreement
Address: From 1st Bldg 207, 5-3-10 Minami- Aoyama, Minatoku,
Tokyo, Japan 107-0062
Telephone: (81 3) 5778 3311
Fax: (81 3) 5778 3312

7) INFORMATION ABOUT SUBSIDIARIES AND ASSOCIATES
114
SQM LITHIUM SPECIALTIES LIMITED PARTNERSHIP, L.L.P:
Type of company: Limited liability partnership
Capital: US$33,712,430
Ownership: 99% SQM Virginia LLC
1% North American Trading Co.
Investment as % of SQM S.A.’s
individual assets: 0,3974931%
Corporate purpose: Production and marketing of lithium derivatives
Board of Directors: None
President: Pablo Hernandez
Relationship with parent company: Support
Contracts with parent company: Not applicable
Address: 2727 Paces Ferry Road, Building Two, Suite 1425, Atlanta,
GA 30339
Telephone: 1 (770) 916 9400
Fax: 1 (770) 916 9401
SQM NITRATOS MEXICO S.A. de C.V.:
Type of company: Variable capital corporation
Capital: US$5,636
Ownership: 99.998% SQM Industrial S.A.
0.002% SQM North America Corporation
Investment as % of SQM S.A.’s
individual assets: 0,0005285%
Corporate purpose: Services
Board of Directors: Christian Lüders M.
Ricardo Ramos R.*
Frank Biot*
Gerardo Illanes G.*
Gonzalo Aguirre T.*
Alvaro Fernandez G.
Patricio de Solminihac T.*
Matías Murillo G.
CEO: Christian Lüders M.*
Relationship with parent company: Support
Contracts with parent company: Not applicable
Address: Av. Moctezuma 144-4, Ciudad del Sol, CP 45050, Zapopan,
Jalisco, Mexico
Telephone: (52 33) 35401100
Fax: (52 33) 35401100
SQM NORTH AMERICA CORPORATION: Type of company: Corporation
Capital: US$30,140,100
Ownership: 51% SQM Industrial S.A.
40% SQM S.A.
9% Soquimich European Holdings B.V.
Investment as % of SQM S.A.’s
individual assets: -0.4406799%
Corporate purpose: Marketing of nitrates, fertilizers, iodine and lithium in North
America
Board of Directors: Patricio de Solminihac T.*
Frank Biot*

7) INFORMATION ABOUT SUBSIDIARIES AND ASSOCIATES
115
Ricardo Ramos R.*
Daniel Jiménez S. *
Gonzalo Aguirre T.*
President: Pablo Hernandez
Relationship with parent company: Distribution
Contracts with parent company: Not applicable
Address: 2727 Paces Ferry Road, Building Two, Suite 1425, Atlanta,
GA 30339
Telephone: (1 770) 916 9400
Fax: (1 770) 916 9401
SQM OCEANIA PTY LIMITED:
Type of company: Limited liability corporation
Capital: US$1
Ownership: 100% SQM Soquimich European Holdings B.V.
Investment as % of SQM S.A.’s
individual assets: 0.0580924%
Corporate purpose: Import, export and distribution of fertilizers and industrial
products
Board of Directors: Frank Biot*
Patrick Vanbeneden
Gerardo Illanes G.*
Carlos Díaz O.*
Geoffrey Walker
Stefan Debruyne
CEO: None
Relationship with parent company: Distribution
Contracts with parent company: Not applicable
Address: Level 16 201 Elizabeth street, Sydney NSW 2000
Telephone: (61 412) 558911
Fax: (61 293) 479221
SQM PERÚ S.A.:
Type of company: Corporation
Capital: US$17,427
Ownership: 99.02% SQM Industrial S.A.
0.98% SQM S.A.
Investment as % of SQM S.A.’s
individual assets: -0.0245534%
Corporate purpose: Marketing of agricultural and industrial inputs
Board of Directors: Ricardo Ramos*
Gonzalo Aguirre T.*
Andrés Yaksic B.*
CEO: Andrés Yaksic B.*
Relationship with parent company: Support
Contracts with parent company: Not applicable
Address: Avenida Camino Real Nº 390 of 801, San Isidro, Lima, Peru
Telephone: (511) 6112121
Fax: (511) 6112122
SQM (THAILAND) LIMITED:
Type of company: Limited liability corporation
Capital: US$3,364,341

7) INFORMATION ABOUT SUBSIDIARIES AND ASSOCIATES
116
Ownership: 99.996% SQM European Holdings NV
0.004% Non-related parties
Investment as % of SQM S.A.’s
individual assets: 0.0819687%
Corporate purpose: Marketing of fertilizers and industrial chemicals
Board of Directors: Andrés Yaksic B.*
Patrick Vanbeneden
Tim Boeckx
Pattamakan Suparp
Legal representative: Tim Boeckx
Relationship with parent company: Distribution
Contracts with parent company: Not applicable
Address: Unit 2962, Level 29, No, 388, Exchange Tower, Sukhumvit
Road, Klongtoey District, Bangkok, Thailand
Telephone: (66) 2104 9136
SQM SHANGHAI CHEMICALS CORPORATION:
Type of company: Corporation
Capital: US$3,000,000
Ownership: 100% SQM Industrial S.A.
Investment as % of SQM S.A.’s
individual assets: 0%
Corporate purpose: Investment company
Board of Directors: Gonzalo Aguirre T.*
Gerardo Illanes G.*
Daniel Jimenez S.*
President: Daniel Jimenez S.*
Relationship with parent company: Distribution
Contracts with parent company: Not applicable
Address: Huaihai Road 300, Room 33, Huangpu District, Shanghai,
China
Telephone: Not applicable
Fax: Not applicable
SQM VIRGINIA L.L.C.:
Type of company: Limited liability corporation
Capital: US $33,375,305
Ownership: 100% SQM North America Corporation
Investment as % of SQM S.A.’s
individual assets: 0.3935182%
Corporate purpose: Investment company
Board of Directors: Daniel Jimenez S.*
Gerardo Illanes G.*
President: Pablo Hernandez
Relationship with parent company: Support
Contracts with parent company: Not applicable
Address: 2727 Paces Ferry Road, Building Two, Suite 1425, Atlanta,
GA 30339
Telephone: (1 770) 916 9400
Fax: (1 770) 916 9401
SQMC HOLDING CORPORATION:

7) INFORMATION ABOUT SUBSIDIARIES AND ASSOCIATES
117
Type of company: Corporation
Capital: US$3,000,000
Ownership: 99.9% SQM Potasio S.A.
0.1% SQM S.A.
Investment as % of SQM S.A.’s
individual assets: 1.0639355%
Corporate purpose: Investment company
Board of Directors: Daniel Jimenez S.*
Felipe Smith*
President: Pablo Hernandez
Relationship with parent company: Support
Contracts with parent company: Not applicable
Address: 2727 Paces Ferry Road, Building Two, Suite 1425, Atlanta,
GA 30339
Telephone: (1 770) 916 9400
Fax: (1 770) 916 9401
International Associates
ABU DHABI FERTILIZER INDUSTRIES CO. W.L.L.:
Type of company: Limited liability corporation
Capital: US$1,443,047
Ownership: 37% SQM Corporation N.V.
63% Non-related parties
Investment as % of SQM S.A.’s
individual assets: 0.4408087%
Corporate purpose: Distribution and marketing of specialty plant nutrients
Board of Directors: Yousef Al Tawil
Emmanuel De Marez
Frank Biot*
Ahmed Almehairy
CEO: Patrick Vanbeneden
Relationship with parent company: Distribution
Contracts with parent company: Not applicable
Address: PO Box 71871, Abu Dhabi, United Arab Emirates
Telephone: (971) 25511700
Fax: (971) 25511702
AJAY EUROPE SARL: Type of company: Limited liability corporation
Capital: US$4,178,900
Ownership: 50% Soquimich European Holdings B.V.
50% Non-related parties
Investment as % of SQM S.A.’s
individual assets: 0.247569%
Corporate purpose: Production and distribution of iodine
Board of Directors: Daniel Jimenez S.*
Alan Shipp
Felipe Smith
Charles Pittard
CEO: Alan Shipp
Relationship with parent company: Production
Contracts with parent company: Supply
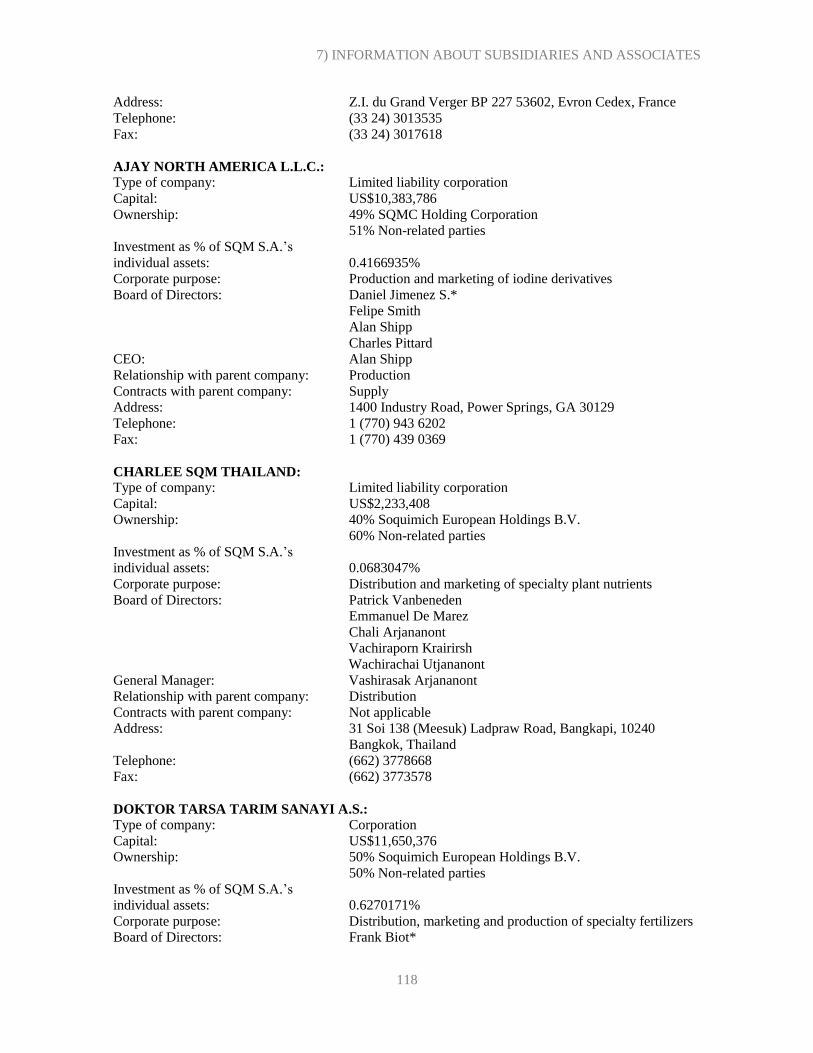
7) INFORMATION ABOUT SUBSIDIARIES AND ASSOCIATES
118
Address: Z.I. du Grand Verger BP 227 53602, Evron Cedex, France
Telephone: (33 24) 3013535
Fax: (33 24) 3017618
AJAY NORTH AMERICA L.L.C.: Type of company: Limited liability corporation
Capital: US$10,383,786
Ownership: 49% SQMC Holding Corporation
51% Non-related parties
Investment as % of SQM S.A.’s
individual assets: 0.4166935%
Corporate purpose: Production and marketing of iodine derivatives
Board of Directors: Daniel Jimenez S.*
Felipe Smith
Alan Shipp
Charles Pittard
CEO: Alan Shipp
Relationship with parent company: Production
Contracts with parent company: Supply
Address: 1400 Industry Road, Power Springs, GA 30129
Telephone: 1 (770) 943 6202
Fax: 1 (770) 439 0369
CHARLEE SQM THAILAND: Type of company: Limited liability corporation
Capital: US$2,233,408
Ownership: 40% Soquimich European Holdings B.V.
60% Non-related parties
Investment as % of SQM S.A.’s
individual assets: 0.0683047%
Corporate purpose: Distribution and marketing of specialty plant nutrients
Board of Directors: Patrick Vanbeneden
Emmanuel De Marez
Chali Arjananont
Vachiraporn Krairirsh
Wachirachai Utjananont
General Manager: Vashirasak Arjananont
Relationship with parent company: Distribution
Contracts with parent company: Not applicable
Address: 31 Soi 138 (Meesuk) Ladpraw Road, Bangkapi, 10240
Bangkok, Thailand
Telephone: (662) 3778668
Fax: (662) 3773578
DOKTOR TARSA TARIM SANAYI A.S.: Type of company: Corporation
Capital: US$11,650,376
Ownership: 50% Soquimich European Holdings B.V.
50% Non-related parties
Investment as % of SQM S.A.’s
individual assets: 0.6270171%
Corporate purpose: Distribution, marketing and production of specialty fertilizers
Board of Directors: Frank Biot*

7) INFORMATION ABOUT SUBSIDIARIES AND ASSOCIATES
119
Ali B. Ozman
Esther Ozman
CEO: Ali B. Ozman
Relationship with parent company: Distribution
Contracts with parent company: Not applicable
Address: Organize Sanayi Bolgesi, Ikinci Kisim, 22 cadde TR07100
Antalya, Turkey
Telephone: (90 2) 422494646
Fax: (90 2) 422494600
PLANTACOTE NV: Type of company: Limited liability corporation
Capital: US$3,005,898
Ownership: 100% Doktor Tarsa Tarim Sanayi A.S.
Investment as % of SQM S.A.’s
individual assets: 0.0364646%
Corporate purpose: Production and marketing of specialty products
Board of Directors: Ali B. Özman
Patrick Vanbeneden
Frank Biot*
CEO: Toon Vanderhallen
Relationship with parent company: Production and distribution
Contracts with parent company: None
Address: Houtdok-Noordkaai 25a – 2030 Antwerp - Belgium
Telephone: (32) 3 203 97 17
Fax: (32) 3 203 97 72
SQM MED TURKEY:
Type of company: Corporation
Capital: US$196,510
Ownership: 50% Soquimich European Holdings B.V.
50% Non-related parties
Investment as % of SQM S.A.’s
individual assets: -0,0012867%
Corporate purpose: Production and marketing of specialty products
Board of Directors: Patrick Vanbeneden
Ali B. Özman
Esther Ozman
CEO: Ali B. Özman
Relationship with parent company: Support
Contracts with parent company: None
Address: Organize Sanayi Bolgesi, Ikinci, Kisim, 22 cadde TR07100
Antalya, Turkey
Telephone: (90 2) 422494646
Fax: (90 2) 422494600
KORE POTASH LIMITED: Type of company: Limited liability corporation
Capital: US$204,575,827
Ownership: 18.02% SQM S.A.
81.98% Non-related parties
Investment as % of SQM S.A.’s
individual assets: 0.7625085%

7) INFORMATION ABOUT SUBSIDIARIES AND ASSOCIATES
120
Corporate purpose: Exploration of mineral resources and project development
Board of Directors: David Hathorn
Sean Bennett
Jonathan Trollip
Leonard Math
Timothy Keating
Pablo Altimiras C.*
CEO: Sean Bennett
Relationship with parent company: Support
Contracts with parent company: None
Address: Level 3, 88 William Street, Perth WA 6000, Australia
Telephone: (61) 8 9463 2463
Fax: (61) 8 9463 2499
There were no significant changes in the ownership structure of SQM’s subsidiaries and associates during
2017.

7) INFORMATION ABOUT SUBSIDIARIES AND ASSOCIATES
121

7) INFORMATION ABOUT SUBSIDIARIES AND ASSOCIATES
122
7) B) INFORMATION ABOUT OTHER INVESTEES
Joint Ventures or Joint Control
COROMANDEL (SQM INDIA) P LTD.: Type of company: Limited liability corporation
Capital: US$1,579,200
Ownership: 50% Soquimich European Holdings NV
50% Non-related parties
Investment as % of SQM S.A.’s
individual assets: 0.0504179%
Corporate purpose: Distribution, marketing and production of specialty fertilizers
Board of directors: Patrick Vanbeneden
Emmanuel De Marez
Sameer Goel
CEO: Mahadev Suvarna
Relationship with parent company: Distribution
Contracts with parent company: Not applicable
Address: Coromandel House 1-2-10, Sardar Patel Road, Secunderabad-500 003,
Andhra Pradesh, India
Telephone: 91-40-27842034
QINGDAO SQM-STAR CROP NUTRITION CO. LTD.:
Type of company: Limited liability corporation
Capital: US$2,000,000
Ownership: 50% SQM Industrial S.A.
50% Non-related parties
Investment as % of SQM S.A.’s
individual assets: 0.081731%
Corporate purpose: Production and marketing of soluble fertilizers
Board of directors: Li Xiang
Alfredo Doberti
Wan Taibin
Frank Biot*
CEO: Li Xiang
Relationship with parent company: Production
Contracts with parent company: Not applicable
Address: No, 36, Road 7 Longquan River, Longquan Town, Jimo City, Qingdao
Municipality, Shangdong Province, China
Telephone: (86) 532 809 65 366
SICHUAN SQM-MIGAO CHEMICAL FERTILIZER CO. LTD.: Type of company: Limited liability corporation
Capital: US$28,000,000
Ownership: 50% SQM Industrial S.A.
50% Migao Corporation
Investment as % of SQM S.A.’s
individual assets: 0.3138666%
Corporate purpose: Production and marketing of fertilizers
Board of directors: Alfredo Doberti
Liu Yaqin
Liu Guocai
Frank Biot*

7) INFORMATION ABOUT SUBSIDIARIES AND ASSOCIATES
123
CEO: Sun Pingfu
Relationship with parent company: Production
Contracts with parent company: Not applicable
Address: Huangjin Road, Dawan Town, Qingbaijiang District, Chengdu
Municipality, Sichuan Province, China
Telephone: (86) 532 809 65 366
SQM VITAS BRASIL: Type of company: Limited liability corporation
Capital: US$4,300,597
Ownership: 99.99% SQM Vitas FZCO
0.01% Non-related parties
Investment as % of SQM S.A.’s
individual assets: 0.1508824%
Corporate purpose: Production, distribution and marketing of specialty plant nutrients
Board of directors: Frank Biot*
Karina Kuzmak-Bourdet
Alfredo Doberti
CEO: Leandro Ries
Relationship with parent company: Production and distribution
Contracts with parent company: Not applicable
Address: Via Candeias, Km, 01, Sem Numero, Lote 4, Bairro Cia Norte, Candeias,
Bahia – Brazil CEP 43,805 – 190, Caixa Postal 138
Telephone: (55) 71 3602 3056
Fax: None
SQM VITAS HOLLAND:
Type of company: Limited liability corporation
Capital: US$120,236
Ownership: 50% Soquimich European Holdings NV
50% Non-related parties
Investment as % of SQM S.A.’s
individual assets: 0.039205%
Corporate purpose: Investment company
Board of directors: Frank Biot*
Patrick Vanbeneden
Paul van Duuren
Dennis Beets
CEO: Not applicable
Relationship with parent company: Support
Contracts with parent company: Not applicable
Address: Luna ArenA, Herikerbergweg 238, 1101 CM Amsterdam Zuid-Oost,
Netherlands
Telephone: (31 20) 5755600
Fax: (31 20) 6730016
SQM VITAS FZCO: Type of company: Free zone company
Capital: US$1,413,820
Ownership: 49.5% SQM Industrial S.A.
0.5% SQM S.A.
50% Non-related parties
Investment as % of SQM S.A.’s

7) INFORMATION ABOUT SUBSIDIARIES AND ASSOCIATES
124
individual assets: 0.5962555%
Corporate purpose: Production, distribution and marketing of specialty plant nutrients
Board of directors: Patrick Vanbeneden
Karina Kuzmak-Bourdet
Frank Biot*
CEO: Patrick Vanbeneden
Relationship with parent company: Production and distribution
Contracts with parent company: Not applicable
Address: Jebel Ali Free Zone, PO Box 18222, Dubai, United Arab Emirates
Telephone: (971 4) 8838506
Fax: (971 4) 8838507
SQM VITAS PERÚ S.A.C.: Type of company: Corporation
Capital: US$4,063,802
Ownership: 99.99999% SQM Vitas FZCO
0.00001% SQM Industrial S.A.
Investment as % of SQM S.A.’s
individual assets: 0.0817419%
Corporate purpose: Production, distribution and marketing of specialty plant nutrients
Board of directors: Frank Biot*
Karina Kuzmak-Bourdet
Alfredo Doberti
CEO: Diego San Martin
Relationship with parent company: Production and distribution
Contracts with parent company: Not applicable
Address: Av. Juan de Arona N°151 Of. 303, Torre B, San Isidro, Lima, Peru
Telephone: (511) 611 2121
Fax: (511) 611 2121
PLANTACOTE BV:
Type of company: Limited liability corporation
Capital: US$1,803,539
Ownership: 100% SQM Vitas BV
Investment as % of SQM S.A.’s
individual assets: 0.0091794%
Corporate purpose: Production, distribution and marketing of specialty plant nutrients
Board of directors: Patrick Vanbeneden
Frank Biot*
Karina Kuzmak-Bourdet
CEO: Toon Vanderhallen
Relationship with parent company: Production and distribution
Contracts with parent company: Not applicable
Address: Luna ArenA, Herikerbergweg 238, 1101 CM Ambsterdam Zuid-Oost,
Netherlands
Telephone: (32) 471 953405
Fax: None
MINERA EXAR S.A.: Type of company: Limited liability corporation
Capital: US$47,605,745
Ownership: 50% SQM Potasio S.A.

7) INFORMATION ABOUT SUBSIDIARIES AND ASSOCIATES
125
50% Non-related parties
Investment as % of SQM S.A.’s
individual assets: 0.7366741%
Corporate purpose: Production, distribution and marketing of specialty plant nutrients
Board of directors: Franco Mignacco
Pablo Altimiras C.*
Gabriel Marcelo Rubacha
Mariano Julio Etchegaray
William Thomas Hodgson
Norberto Carlos Caneva
Juan Carlos Barrera*
Fernando Gabriel González
CEO: Franco Mignacco
Relationship with parent company: Production
Contracts with parent company: Not applicable
Address: Palma Carrillo N° 54 – PB- OF. 7 – San Salvador de Jujuy – Provincia de
Jujuy – República Argentina 4600
Telephone: (32) 471 953405
Fax: None

8) INFORMATION ABOUT RELEVANT OR ESSENTIAL FACTS
126
8) INFORMATION ABOUT RELEVANT OR ESSENTIAL FACTS
Relevant or Essential Facts Pertaining to SQM S.A.
The following events occurred or were reported as essential events or events of interest to the CMF, the Stock
Exchanges and included on the Company’s website:
On January 13, 2017, SQM S.A. reported the following:
Pursuant to the terms disclosed in the confidential essential fact report dated December 28, 2016, on this date, the
Company has entered into agreements with the Department of Justice, the “DOJ”, and the Securities and Exchange
Commission, the “SEC”, both of the United States of America (the “United States”), in relation to the investigations
by such agencies of facts related to payments to providers and entities that were tied to persons with political
exposure between 2008 and 2015, which facts resulted in an internal investigation on behalf of the Company by an
ad hoc committee of the Board of Directors that was led by the law firm Shearman & Sterling (the “Investigated
Facts”). The Company’s securities are publicly traded in the United States and the Company is therefore subject to
the legislation of that country. The Company voluntarily presented the results of the internal investigation and
supporting documents to the DOJ and the SEC as well as the corresponding authorities in Chile.
Pursuant to the terms of the agreement with the DOJ, entitled the Deferred Prosecution Agreement (the “DPA”),
the Company agrees that the DOJ will file charges against the Company alleging (i) one count of violating sections
78m(b)(2)(B), 78m(b)(5) and 78ff(a) of Title 15, of the United States Code (the “Code”), which violation relates to
the failure to implement effective internal accounting systems and internal accounting controls and (ii) one count of
violating sections 78m(b)(2)(A), 78m(b)(5) and 78ff(a) of Title 15, of the same Code, which violation relates to the
to the failure to maintain accurate books and records related to the Investigated Facts. By virtue of the DPA, the
DOJ has agreed not to pursue such charges against the Company for a period of 3 years and release the Company
from liability thereafter, as long as during such term the Company complies with the terms of the DPA, including
the payment of a penalty of 15,487,500 United States dollars (“Dollars”) and the acceptance of an external monitor
for a period of 24 months (the “Monitor”) to evaluate the Company’s compliance program, followed by an additional
year in which the Company will report independently.
In the DPA, the DOJ does not file any other charges in relation to the Investigated Facts. The agreement with the
DOJ states that the Company received cooperation credit based on its cooperation with the DOJ investigation, which
included, among other things, conducting a thorough internal investigation.
In relation to the agreement with the SEC, the Company has agreed (i) to pay a penalty of 15 million dollars and (ii)
to maintain a Monitor for the abovementioned period, as a consequence of the violation of sections 13(b)(2)(A) and
(B) of the U.S. Securities Exchange Act relating to the bookkeeping and internal accounting control systems
required of securities issuers in the United States.
The SEC has issued a Cease and Desist Order that does not identify any other violations of United States law and
in which the SEC notes the fact that the Company has taken corrective measures, including the termination of the
former CEO, Mr. Patricio Contesse, the creation of a corporate governance committee, the separation and
strengthening of the internal auditing and compliance and risk management departments, the hiring of additional
experienced compliance and auditing personnel, the expansion of the accounting and compliance systems, and the
hiring of external experts to review and improve the Company’s controls and payment process approvals.
On March 2, 2017, the following was reported:
As of yesterday, March 1, 2017, the Board of Directors of the Company, by split vote and with the favorable
vote of the directors Gonzalo Guerrero Y., Hans Dieter Linneberg, Julio Rebolledo D. and Eugenio Ponce L., has approved to sign an out-of-court transaction with Mr. Patricio Contesse González, former CEO of
the Company, to terminate the labor lawsuit filed by Mr. Contesse against the Company. This lawsuit is

8) INFORMATION ABOUT RELEVANT OR ESSENTIAL FACTS
127
being processed in the First Labor Court of Santiago, where the amount to be paid to Mr. Patricio Contesse
must be determined, following the judgement from November 8, 2016, the Court of Appeals of Santiago
decided to revoke the first instance judgement that initially accepted the statute of limitations exception
alleged by the Company. The Company has authorized its attorneys to carry out the negotiation of this
agreement.
Given that the final amounts of the transaction have not yet been agreed and that the Company cannot
ensure that such transaction materializes, the disclosure of this information may harm the interest of the
Company. The Board of Directors of the Company, unanimously and with the assistance of all its members,
has instructed to communicate this information in a reserved fact.
It is estimated that a transaction with Mr. Contesse could be reached within the next 45 days, during which
time this information would be kept as reserved.
Finally, we inform that the CEO, Mr. Patricio de Solminihac T., the Vice President of Corporate Services,
Mr. Ricardo Ramos R., and the Legal Vice President, Mr. Gonzalo Aguirre T., together with the advisors
of the Society, Mr. Manuel José Vial V. and Martín del Río P., in addition to the members of the board of
directors, are the people who are aware of the decisions of the board of directors, and who are hereby
notified.
On March 22, 2017, it was informed that the Company´s Board of Directors held an ordinary board meeting, and
were informed that Julio Rebolledo D. would resign from his position as board member of SQM effective April 27,
2017.
On March 27, 2017, the Company came to an agreement with the former CEO of the Company, Mr. Patricio
Contesse Gonzalez, which allowed the Company to terminate the labor law suit (“Labor Suit”) which Mr. Contesse
filed against the Company. This suit was first heard before the First Labor Court of Santiago (Primer Juzgado de
Letras del Trabajo de Santiago) in which both parties discussed the severance amount to be paid to by the Company
to Mr. Contesse. The judgement by the First Appeals Court of Santiago (Iltma. Corte de Apelaciones de Santiago)
dated November 8, 2016, upheld the appeal filed by Mr. Contesse, reversing the first judgement, which initially
received the objection opposed by the Company, stating the action for recovery of compensation deducted in the
Labor Suit.
The amount that the Company has agreed to paid to terminate the Labor Suit is less than the amount the Company
was sued for by Mr. Patricio Contesse. The amount related to this Labor Suit has been provisioned for in the financial
statements as of December 31, 2016.
On April 11, 2017, the Board of Directors of SQM met in an extraordinary board meeting to recommend to the
shareholders at the next Annual General Shareholders’ Meeting (“Shareholders’ Meeting”) to be held on April 28,
2017, the payment of a definitive dividend representing 100% of the 2016 net income of the Company. Therefore,
and subject to the approval at the Shareholders meeting, the Company shall pay a final dividend of US$1.05735 per
share as a result of the distributable net income obtained during 2016. Nevertheless, the amount of US$0.85487 per
share must be deducted from the final dividend, which was already paid as a provisional dividend. The balance, in
the amount of US$0.20248 per share, shall be paid and distributed to Company’s shareholders who are registered
with the respective registry on the fifth business day before the day on which the final dividend payment shall be
made.
Said amounts of US$0.20248 per share related to the dividend discussed above shall be paid in the equivalent in
Chilean national currency according to the value of the "Observed Dollar” or "US Dollar” that appears published in
the Official Gazette on April 28, 2017.
This shall be paid to the corresponding shareholders, in person or through their duly authorized representatives,
starting at 9:00am on May 11, 2017.
8) INFORMATION ABOUT RELEVANT OR ESSENTIAL FACTS
128
On April 28, 2017 the Company informed that its shareholders met today at the Company’s 42nd Annual General
Meeting and, among other aspects, agreed to the following:
To approve the Company’s Balance Sheet, the Financial Statements, the Annual Report, the Account
Inspectors’ Report, and the External Auditors’ Report for the year ending on December 31, 2016.
To appoint PricewaterhouseCoopers Consultores, Auditores y Compañía Limitada as the Company’s
External Auditors for 2017.
To approve the distribution of a final dividend as recommended by the Board of Directors (“Board”) as was
communicated as an essential fact (hecho esencial) on April 11, 2017.
Company Board elections, it was decided that the Board would be composed of the following members:
Joanne Boyes, Robert A. Kirkpatrick, Eugenio Ponce Lerou, Gonzalo Guerrero Yamamoto, Arnfinn F.
Prugger, Hernán Büchi Buc, Fernando Massú Taré and Juan Gerardo Jofré Miranda, with the last two
members being independent, and
To approve the remuneration structure for the Board members, and the members of the Board committees,
and expenses associated with each.
In an extraordinary Board meeting on this same date, the Board agreed to the following:
To nominate Mr. Eugenio Ponce Lerou as Chairman of the Board
To nominate Mr. Juan Gerardo Jofré Miranda as Vice Chairman of the Board and
That the composition of the Board Committees would be as follows:
- Directors’ Committee: Juan Gerardo Jofré Miranda, Fernando Massú Taré and Joanne L. Boyes.
- Corporate Governance Committee: Robert A. Kirkpatrick, Hernán Büchi Buc and Juan Gerardo Jofré
Miranda.
- Safety, Health and Environment Committee: Arnfinn F. Prugger, Gonzalo Guerrero Yamamoto and
Hernán Büchi Buc.
On May 17, the Board of Directors of the Company unanimously agreed to the following:
To pay an interim dividend equal to US$0.39222 per share, to be charged against 2017 retained earnings. This
amount shall be paid in the equivalent in Chilean pesos according to the value of the "Observed Dollar” or "US
Dollar” that appears published in the Official Gazette on May 31, 2017.
This shall be paid to the corresponding shareholders, in person or through their duly authorized representatives,
starting at 9:00am on June 15, 2017 to shareholders who are registered on the shareholders’ registry of the Company
five business days prior to June 15, 2017.
On July 11, 2017, it was announced that Kidman Resources Limited (“Kidman”) (Australian Securities Exchange:
KDR) has accepted an offer (“Offer”) made by SQM, setting out terms in which an affiliate of SQM will acquire
50% of the interest of the Mt. Holland lithium project in Western Australia (“Project”); both parties will form a
50/50 joint venture (“Joint Venture”). The Offer is subject to SQM and Kidman agreeing on formal documentation,
reflecting the commercial terms outlined in the Offer, on or before September 30, 2017. Key terms: in consideration
for the acquisition of the 50% interest in the Project, SQM will pay US$30 million in cash to Kidman. Additionally,
SQM will contribute US$80 million to fund part of the development costs in relation to the Project. As part of this
expenditure contribution, following the execution of the formal documentation, SQM will provide a US$21.5
million convertible loan to Kidman, to advance the Project while outstanding conditions required for
implementation of the Joint Venture are satisfied. The Joint Venture will develop a spodumene mine and
concentration plant (“Mine”) and a refinery plant to process the concentrate produced by the Mine. The initial
production target would be approximately 40 K MT per year of lithium carbonate equivalent (LCE) in 2021.Kidman
will retain the exclusive right to exploit gold from within the Project area. The Offer is subject to SQM and Kidman
entering into formal agreements, which reflect the commercial terms in the Offer, on or before September 30, 2017.
On August 23, 2017, the Board of Directors of the Company approved the following:

8) INFORMATION ABOUT RELEVANT OR ESSENTIAL FACTS
129
To pay an interim dividend equal to US$0.38432 per share, to be charged against 2017 retained earnings.
This amount shall be paid in the equivalent in Chilean pesos according to the value of the "Observed Dollar”
or "US Dollar” that appears published in the Official Gazette on August 31, 2017.
This shall be paid to the corresponding shareholders who are registered on the shareholders’ registry of the
Company five business days prior to September 14, 2017, in person or through their duly authorized
representatives, starting at 9:00am on September 14, 2017.
On September 11, 2017, SQM informed the CMF that the Company and its subsidiary SQM Australia Pty Ltd
(“SQM Australia”), have signed a purchase agreement with MH Gold Pty Ltd, Montague Resources Australia Pty
Ltd and Kidman Resources Limited (“Kidman”, all together as the “Sellers”) to acquire 50% of the assets in the
lithium mining project called Mount Holland, located in the State of Western Australia, Australia (the
“Agreement”). The Agreement is subject to compliance with usual terms and conditions for this type of transaction,
including but not limited to the granting of government approvals for the transfer of mining property (the
"Conditions").
Pending compliance with the Conditions, SQM Australia has committed to grant Kidman up to US$21.5 million in
credit (“Credit”) which will be used by Kidman to continue the development of the Mt. Holland project.
Once the Conditions are met, SQM Australia will pay the Sellers a price of (a) (i) US$5 million, plus (ii) US$10
million in capital contributions to the project on behalf of the Sellers and (b) (i) a deferred price amounting to US$25
million, plus (ii) US$30 million in capital contributions to the project on behalf of the Sellers. This price is subject
to certain adjustments described in the Agreement, including the repayment of the Credit. SQM Australia, has also
committed to make capital contributions of US$10 million and US$30 million, together with the contributions from
the Sellers, to finance the development of the project.
In compliance with the Conditions, SQM Australia and the Sellers will sign, among others, a joint venture agreement
for the development, construction and operation of the mining project, a concentration plant and a refining plant to
produce lithium carbonate and lithium hydroxide, and the agreements allowing said joint venture to explore and
exploit lithium on the mining property of the Sellers not included in the Agreement.
On November 21, 2017, the Public Prosecutor's Office requested the 8th Guarantee Court to (i) formalize an
investigation against Sociedad Química y Minera de Chile S.A., SQM Salar S.A. and SQM Nitrates S.A. and (ii)
explore an alternative way out of the procedure, in case RUC 600245171-2, where the criminal liability of said
companies is investigated under Law 20,393.
On November 22, 2017, the Board of Directors of the Company approved to pay an interim dividend equal to
US$0.42879 per share, to be charged against 2017 retained earnings. This amount shall be paid in the equivalent in
Chilean pesos according to the value of the "Observed Dollar” or "US Dollar” that appears published in the Official
Gazette on November 30, 2017.
This shall be paid to the corresponding shareholders who are registered on the shareholders’ registry of the Company
five business days prior to December 14, 2017, in person or through their duly authorized representatives, starting
at 9:00am on December 14, 2017.
On December 18, 2017, the CMF was informed that SQM, SQM Salar S.A., SQM Potasio S.A. and la Corporación
de Fomento a la Producción (“Corfo”), agreed before the arbitrator, Mr. Hector Humeres to begin a new thirty day
conciliation process (the “Conciliation”). The goal of this new conciliation process is to end the arbitrations between
the two parties, and eventually make modifications of the existing contractual conditions of the Lease Agreement
and the Project Agreement (the “Agreements”) signed on November 12, 1993. These Agreements are related to the leasing and the exploration of Corfo’s mining rights in the Salar de Atacama.

8) INFORMATION ABOUT RELEVANT OR ESSENTIAL FACTS
130
Additionally, the Company has become aware that the shareholders Sociedad de Inversiones Pampa Calichera S.A.,
Potasios de Chile S.A. and Inversiones Global Mining (Chile) Limitada have informed the market that they have
reached an agreement with Corfo in relation to corporate governance matters of the Company. This agreement was
recently published by SQM as information of interest (hecho de interés), and is subject, among other conditions, to
the modification of the Agreements being discussed as part of the Conciliation.
On December 20, 2017, the Company and its subsidiary SQM Australia Pty (“SQM Australia”), finalized the
purchase of 50% of the assets of the Mount Holland Lithium Project in Australia (the “Project”). This purchase is
from MH Gold Pty Ltd, Montague Resources Australia Pty Ltd y Kidman Resources Limited (“Kidman” and as a
Group the “Sellers”), as the result of compliance of the conditions established in the purchase agreement (the
“Agreement”) agreed by the Sellers and informed to the Superintendencia de Valores y Seguros (“SVS”) on
September 11, 2017.
SQM Australia and the Sellers have also signed a joint venture agreement describing the development, construction
and mining operations, concentration and refining plants for the production of lithium carbonate and lithium
hydroxide. This joint venture agreement will also allow for the exploration and exploitation of Sellers’s lithium
rights which are not included in the Agreement.
Under the Agreement, SQM Australia has committed to pay a price of US$34,715,985, of which by today has paid
US$9.715.985, having a balance of US$25 million subject to the compliance of the conditions established in the
Agreement. SQM Australia is also obligated to make capital contributions to the Project for (i) US$37,514,804
million on behalf of the Sellers, of which has already materialized US$7,514,804, having the balance subject to the
compliance of certain conditions, and (ii) US$37.514.804 million on its behalf, of which has already contributed
the amount of US$7.514.804, having also the balance subject to the compliance of certain conditions.
Relevant or Essential Facts Pertaining to Soquimich Comercial S.A. (SQMC)
On March 21, 2017, the CMF and the stock exchanges were informed, as essential fact, that the Board of SQMC,
during the its session today, after analyzing the investment plan of the Company, the resources with which it counts
or may count for the next years, projections or future conditions and, among other aspects, the amount, composition
and origin of the net profits of the 2016 business year, agreed, unanimously of the present Directors, to modify the
"Policy of 2016 Commercial Year Dividends "that was presented to the Ordinary Shareholders' Meeting of SQMC
held on April 25, 2016, in the sense of proposing to the next Ordinary Meeting of Shareholders of the Company to
be held on April 28, 2017, that it considers to distribute and pay in favor of the respective shareholders, 100% of
the net profit of the commercial year 2016, in replacement of the 50% considered origininally. Likewise, and based
on the foregoing, the Board of Directors agreed, also unanimously, to propose the payment of a final dividend of
US$0.02220 per share, based on the dollar exchange rate observed on the day on which said dividend is approved
at the General Shareholders´ Meeting of the Company, in favor of those shareholders of the Company that are
registered in the respective registry on the fifth business day prior to date on which the same will be paid. This
amount will be proposed to be paid in favor of the corresponding shareholders, personally or through duly authorized
representatives, and from 09:00 hours on Wednesday, May 24, 2017.
On October 24, 2017, the CMF and the stock exchanges were informed, as essential fact, that the Board of SQMC,
at the meeting of the day, learned about the request filed this same date by a shareholder of the Company
representing more than 10% of the issued shares issued with the right to vote, to summon an Extraordinary
Shareholders' Meeting of SQMC in order for it to know and decide on the distribution of a special dividend (dividend eventual), with a charge to the accumulated profits, for a total amount of US$24,000,000. In consideration of the
foregoing, and in accordance with the provisions of Art. 58 N 03 of Law 18,046 of Public Companies, the Board of
Directors unanimously agreed to call an Extraordinary Shareholders' Meeting of SQMC to hear and resolve of the
matter indicated, to be held within 30 days from this date.
On November 23, 2017, the CMF and the stock exchanges were informed, as essential fact, that the shareholders of
SQMC, meeting at the Extraordinary Meeting held at 4:00 p.m. on Thursday, November 23, 2017, agreed by

8) INFORMATION ABOUT RELEVANT OR ESSENTIAL FACTS
131
majority to reject the distribution of a special dividend (dividendo eventual), charged to the accumulated profits, for
a total amount of US$24,000,000, according to the meeting request submitted to the Extraordinary Shareholders'
Meeting by a shareholder representing more than 10% of the issued shares with the right to vote of the Company.
For information on essential or relevant facts taking place prior to the period covered by this report that during the
year have had a significant influence or effect on the Company’s business development, its financial statements, its
securities or the offer of the latter, or may have in future years, see sections 3) a) Historical Information, 3) c)
Activities and Businesses and 3) e) Risk Factors.
9) SUMMARY OF COMMENTS AND PROPOSALS BY SHAREHOLDERS AND THE DIRECTORS’
COMMITTEE
According to Chilean Law No, 18,046, section 3, article 74, there have been no comments or proposals from SQM’s
shareholders or Directors’ Committee regarding the Company’s business.

10) FINANCIAL REPORTS
132
10) FINANCIAL REPORTS
10) A) FINANCIAL REPORTS OF THE REPORTING ENTITY
Report of Independent Auditors

10) FINANCIAL REPORTS
133

10) FINANCIAL REPORTS
134
Table of Contents –Consolidated Financial Statements
CONSOLIDATED CLASSIFIED STATEMENTS OF FINANCIAL POSITION ......................................................... 139
CONSOLIDATED STATEMENTS OF INCOME BY FUNCTION ............................................................................... 141
CONSOLIDATED STATEMENTS OF COMPREHENSIVE INCOME ....................................................................... 143
CONSOLIDATED STATEMENTS OF CASH FLOWS .................................................................................................. 144
CONSOLIDATED STATEMENTS OF CHANGES IN EQUITY ................................................................................... 146
NOTE 1 IDENTIFICATION AND ACTIVITIES OF THE COMPANY AND SUBSIDIARIES ............................... 148
1.1 HISTORICAL BACKGROUND .......................................................................................................................................... 148
1.2 MAIN DOMICILE WHERE THE COMPANY PERFORMS ITS PRODUCTION ACTIVITIES ........................................................ 148
1.3 CODES OF MAIN ACTIVITIES ......................................................................................................................................... 148
1.4 DESCRIPTION OF THE NATURE OF OPERATIONS AND MAIN ACTIVITIES ......................................................................... 148
1.5 OTHER BACKGROUND .................................................................................................................................................. 150
NOTE 2 BASIS OF PRESENTATION FOR THE CONSOLIDATED FINANCIAL STATEMENTS ..................... 152
2.1 ACCOUNTING PERIOD .................................................................................................................................................. 152
2.2 CONSOLIDATED FINANCIAL STATEMENTS .................................................................................................................... 152
2.3 BASIS OF MEASUREMENT ............................................................................................................................................. 152
2.4 ACCOUNTING PRONOUNCEMENTS ................................................................................................................................ 153
2.5 BASIS OF CONSOLIDATION ........................................................................................................................................... 158
NOTE 3 SIGNIFICANT ACCOUNTING POLICIES .................................................................................................... 161
3.1 CLASSIFICATION OF BALANCES AS CURRENT AND NON-CURRENT ................................................................................ 161
3.2 FUNCTIONAL AND PRESENTATION CURRENCY ............................................................................................................. 161
3.3 FOREIGN CURRENCY TRANSLATION ............................................................................................................................. 161
3.4 SUBSIDIARIES .............................................................................................................................................................. 163
3.5 CONSOLIDATED STATEMENT OF CASH FLOWS .............................................................................................................. 163
3.6 FINANCIAL ASSETS ...................................................................................................................................................... 163
3.7 FINANCIAL LIABILITIES ................................................................................................................................................ 164
3.8 FINANCIAL INSTRUMENTS AT FAIR VALUE THROUGH PROFIT OR LOSS ......................................................................... 164
3.9 FINANCIAL INSTRUMENT OFFSETTING .......................................................................................................................... 164
3.10 RECLASSIFICATION OF FINANCIAL INSTRUMENTS ........................................................................................................ 164
3.11 DERIVATIVE AND HEDGING FINANCIAL INSTRUMENTS ................................................................................................. 164
3.12 AVAILABLE FOR SALE FINANCIAL ASSETS .................................................................................................................... 166
3.13 DERECOGNITION OF FINANCIAL INSTRUMENTS ............................................................................................................ 166
3.14 DERIVATIVE FINANCIAL INSTRUMENTS ........................................................................................................................ 166
3.15 FAIR VALUE INITIAL MEASUREMENTS .......................................................................................................................... 166
3.16 DEFERRED ACQUISITION COSTS FROM INSURANCE CONTRACTS ................................................................................... 167
3.17 TRADE AND OTHER RECEIVABLES ................................................................................................................................ 167
3.18 INVENTORY MEASUREMENT......................................................................................................................................... 168
3.19 INVESTMENTS IN ASSOCIATES AND JOINT VENTURES ................................................................................................... 168
3.20 TRANSACTIONS WITH NON-CONTROLLING INTERESTS ................................................................................................. 169
3.21 RELATED PARTY TRANSACTIONS ................................................................................................................................. 169
3.22 PROPERTY, PLANT AND EQUIPMENT ............................................................................................................................. 170
3.23 DEPRECIATION OF PROPERTY, PLANT AND EQUIPMENT ................................................................................................ 171
3.24 GOODWILL ................................................................................................................................................................... 171

10) FINANCIAL REPORTS
135
3.25 INTANGIBLE ASSETS OTHER THAN GOODWILL .............................................................................................................. 172
3.26 RESEARCH AND DEVELOPMENT EXPENSES ................................................................................................................... 173
3.27 PROSPECTING EXPENSES .............................................................................................................................................. 173
3.28 IMPAIRMENT OF NON-FINANCIAL ASSETS ..................................................................................................................... 174
3.29 MINIMUM DIVIDEND .................................................................................................................................................... 174
3.30 EARNINGS PER SHARE .................................................................................................................................................. 175
3.31 TRADE AND OTHER PAYABLES ..................................................................................................................................... 175
3.32 INTEREST-BEARING BORROWINGS ............................................................................................................................... 175
3.33 OTHER PROVISIONS ...................................................................................................................................................... 176
3.34 OBLIGATIONS RELATED TO EMPLOYEE TERMINATION BENEFITS AND PENSION COMMITMENTS ................................... 177
3.35 COMPENSATION PLANS ................................................................................................................................................ 177
3.36 REVENUE RECOGNITION .............................................................................................................................................. 178
3.37 FINANCE INCOME AND FINANCE COSTS ........................................................................................................................ 178
3.38 INCOME TAX AND DEFERRED TAXES ............................................................................................................................ 179
3.39 SEGMENT REPORTING .................................................................................................................................................. 180
3.40 RESPONSIBILITY FOR INFORMATION AND ESTIMATES MADE ........................................................................................... 181
3.41 ENVIRONMENT............................................................................................................................................................. 182
NOTE 4 FINANCIAL RISK MANAGEMENT ............................................................................................................... 182
4.1 FINANCIAL RISK MANAGEMENT POLICY ....................................................................................................................... 182
4.2 RISK FACTORS ............................................................................................................................................................. 183
4.3 RISK MEASUREMENT .................................................................................................................................................... 187
NOTE 5 CHANGES IN ACCOUNTING ESTIMATES AND POLICIES (CONSISTENT PRESENTATION) ...... 188
5.1 CHANGES IN ACCOUNTING ESTIMATES ......................................................................................................................... 188
5.2 CHANGES IN ACCOUNTING POLICIES ............................................................................................................................ 188
NOTE 6 BACKGROUND OF COMPANIES INCLUDED IN CONSOLIDATION ................................................... 189
6.1 PARENT’S STAND-ALONE ASSETS AND LIABILITIES ............................................................................................................ 189
6.2 PARENT ENTITY ........................................................................................................................................................... 189
6.3 JOINT ARRANGEMENTS OF CONTROLLING INTEREST .................................................................................................... 189
6.4 GENERAL INFORMATION ON CONSOLIDATED SUBSIDIARIES ......................................................................................... 190
6.5 INFORMATION ATTRIBUTABLE TO NON-CONTROLLING INTERESTS ............................................................................... 193
6.6 INFORMATION ON CONSOLIDATED SUBSIDIARIES ......................................................................................................... 194
6.7 DETAIL OF TRANSACTIONS BETWEEN CONSOLIDATED COMPANIES .............................................................................. 198
NOTE 7 CASH AND CASH EQUIVALENTS ................................................................................................................ 200
7.1 TYPES OF CASH AND CASH EQUIVALENTS .................................................................................................................... 200
7.2 SHORT-TERM INVESTMENTS, CLASSIFIED AS CASH EQUIVALENTS ................................................................................ 200
7.3 INFORMATION ON CASH AND CASH EQUIVALENTS BY CURRENCY ................................................................................ 201
7.4 AMOUNT RESTRICTED (UNAVAILABLE) CASH BALANCES ............................................................................................. 201
7.5 SHORT-TERM DEPOSITS, CLASSIFIED AS CASH EQUIVALENTS ....................................................................................... 202
NOTE 8 INVENTORIES ................................................................................................................................................... 204
NOTE 9 RELATED PARTY DISCLOSURES ................................................................................................................ 205
9.1 RELATED PARTY DISCLOSURES .................................................................................................................................... 205
9.2 RELATIONSHIPS BETWEEN THE PARENT AND THE ENTITY ............................................................................................ 205
9.3 DETAILED IDENTIFICATION OF THE LINK BETWEEN THE PARENT AND SUBSIDIARY ...................................................... 207
9.4 DETAIL OF RELATED PARTIES AND RELATED PARTY TRANSACTIONS ........................................................................... 209
9.5 TRADE RECEIVABLES DUE FROM RELATED PARTIES, CURRENT: ................................................................................... 210
9.6 TRADE PAYABLES DUE TO RELATED PARTIES, CURRENT: ............................................................................................. 210
9.7 BOARD OF DIRECTORS AND SENIOR MANAGEMENT .................................................................................................... 211

10) FINANCIAL REPORTS
136
9.8 KEY MANAGEMENT PERSONNEL COMPENSATION ......................................................................................................... 214
NOTE 10 FINANCIAL INSTRUMENTS ........................................................................................................................ 215
10.1 TYPES OF OTHER FINANCIAL ASSETS ............................................................................................................................ 215
10.2 TRADE AND OTHER RECEIVABLES ................................................................................................................................ 216
10.3 HEDGING ASSETS AND LIABILITIES .............................................................................................................................. 219
10.4 FINANCIAL LIABILITIES ................................................................................................................................................ 221
10.5 TRADE AND OTHER PAYABLES ..................................................................................................................................... 231
10.6 FINANCIAL LIABILITIES AT FAIR VALUE THROUGH PROFIT OR LOSS ............................................................................. 232
10.7 FINANCIAL ASSET AND LIABILITY CATEGORIES ............................................................................................................ 233
10.8 FAIR VALUE MEASUREMENT OF ASSETS AND LIABILITIES ............................................................................................ 235
10.9 FINANCIAL ASSETS PLEDGED AS A GUARANTEE ........................................................................................................... 237
10.10 ESTIMATED FAIR VALUE OF FINANCIAL INSTRUMENTS AND FINANCIAL DERIVATIVES ................................................. 238
10.11 NATURE AND SCOPE OF RISKS ARISING FROM FINANCING INSTRUMENTS ..................................................................... 239
NOTE 11 EQUITY-ACCOUNTED INVESTEES........................................................................................................... 240
11.1 INVESTMENTS IN ASSOCIATES RECOGNIZED ACCORDING TO THE EQUITY METHOD OF ACCOUNTING ........................... 240
11.2 ASSETS, LIABILITIES, REVENUE AND EXPENSES OF ASSOCIATES ................................................................................... 242
11.3 OTHER INFORMATION .................................................................................................................................................. 243
11.4 DISCLOSURES ON INTEREST IN ASSOCIATES ................................................................................................................. 243
NOTE 12 JOINT VENTURES .......................................................................................................................................... 244
12.1 POLICY FOR THE ACCOUNTING OF EQUITY ACCOUNTED INVESTMENT IN JOINT VENTURES ........................................... 244
12.2 DISCLOSURES OF INTEREST IN JOINT VENTURES ........................................................................................................... 244
12.3 INVESTMENT IN JOINT VENTURES ACCOUNTED FOR UNDER THE EQUITY METHOD OF ACCOUNTING ............................. 245
12.4 ASSETS, LIABILITIES, REVENUE AND EXPENSES FROM JOINT VENTURES: ...................................................................... 249
12.5 OTHER JOINT VENTURE DISCLOSURES: ........................................................................................................................ 250
NOTE 13 INTANGIBLE ASSETS AND GOODWILL .................................................................................................. 251
13.1 BALANCES ................................................................................................................................................................... 251
13.2 DISCLOSURES ON INTANGIBLE ASSETS AND GOODWILL ............................................................................................... 251
NOTE 14 PROPERTY, PLANT AND EQUIPMENT .................................................................................................... 257
14.1 TYPES OF PROPERTY, PLANT AND EQUIPMENT ............................................................................................................. 257
14.2 RECONCILIATION OF CHANGES IN PROPERTY, PLANT AND EQUIPMENT BY TYPE: ......................................................... 259
14.3 DETAIL OF PROPERTY, PLANT AND EQUIPMENT PLEDGED AS GUARANTEE ................................................................... 263
14.4 IMPAIRMENT OF ASSETS ............................................................................................................................................... 263
14.5 ADDITIONAL INFORMATION ......................................................................................................................................... 263
14.5 ADDITIONAL INFORMATION (CONTINUED) ................................................................................................................... 264
NOTE 15 EMPLOYEE BENEFITS ................................................................................................................................. 265
15.1 PROVISIONS FOR EMPLOYEE BENEFITS ......................................................................................................................... 265
15.2 POLICIES ON DEFINED BENEFIT PLAN ........................................................................................................................... 266
15.3 OTHER LONG-TERM BENEFITS ...................................................................................................................................... 267
15.4 POST-EMPLOYMENT BENEFIT OBLIGATIONS ................................................................................................................. 268
15.5 STAFF SEVERANCE INDEMNITIES .................................................................................................................................. 269
NOTE 16 EXECUTIVE COMPENSATION PLAN ....................................................................................................... 271
NOTE 17 DISCLOSURES ON EQUITY ......................................................................................................................... 272
17.1 CAPITAL MANAGEMENT ............................................................................................................................................... 272
17.2 DISCLOSURES ON PREFERRED SHARE CAPITAL ............................................................................................................. 273

10) FINANCIAL REPORTS
137
17.3 DISCLOSURES ON RESERVES IN EQUITY ........................................................................................................................ 275
17.4 DIVIDEND POLICIES ..................................................................................................................................................... 278
17.5 INTERIM AND PROVISIONAL DIVIDENDS ....................................................................................................................... 279
NOTE 18 PROVISIONS AND OTHER NON-FINANCIAL LIABILITIES ................................................................ 281
18.1 TYPES OF PROVISIONS .................................................................................................................................................. 281
18.2 DESCRIPTION OF OTHER PROVISIONS ........................................................................................................................... 282
18.3 CHANGES IN PROVISIONS ............................................................................................................................................. 283
NOTE 19 CONTINGENCIES AND RESTRICTIONS .................................................................................................. 284
19.1 LAWSUITS AND OTHER RELEVANT EVENTS .................................................................................................................. 284
19.2 RESTRICTIONS TO MANAGEMENT OR FINANCIAL LIMITS .............................................................................................. 291
19.3 ENVIRONMENTAL CONTINGENCIES .............................................................................................................................. 292
19.4 TAX CONTINGENCY ...................................................................................................................................................... 293
19.5 RESTRICTED OR PLEDGED CASH ................................................................................................................................... 294
19.6 SECURITIES OBTAINED FROM THIRD PARTIES ............................................................................................................... 295
19.7 INDIRECT GUARANTEES ............................................................................................................................................... 296
NOTE 20 EARNINGS PER SHARE ................................................................................................................................ 298
NOTE 21 BORROWING COSTS .................................................................................................................................... 298
21.1 COSTS OF CAPITALIZED INTEREST, PROPERTY, PLANT AND EQUIPMENT ....................................................................... 299
NOTE 22 EFFECT OF FLUCTUATIONS IN FOREIGN CURRENCY EXCHANGE RATES ............................... 299
NOTE 23 ENVIRONMENT .............................................................................................................................................. 301
23.1 DISCLOSURES OF DISBURSEMENTS RELATED TO THE ENVIRONMENT ........................................................................... 301
23.2 DETAIL OF INFORMATION ON DISBURSEMENTS RELATED TO THE ENVIRONMENT ......................................................... 302
23.3 DESCRIPTION OF EACH PROJECT, INDICATING WHETHER THESE ARE IN PROCESS OR HAVE BEEN FINISHED .................. 307
NOTE 24 OTHER CURRENT AND NON-CURRENT NON-FINANCIAL ASSETS ................................................ 311
NOTE 25 REPORTABLE SEGMENTS .......................................................................................................................... 312
25.1 REPORTABLE SEGMENTS .............................................................................................................................................. 312
25.2 REPORTABLE SEGMENT DISCLOSURES: ........................................................................................................................ 314
25.3 STATEMENT OF COMPREHENSIVE INCOME CLASSIFIED BY REPORTABLE SEGMENTS BASED ON GROUPS OF PRODUCTS 316
25.4 REVENUE FROM TRANSACTIONS WITH OTHER COMPANY’S OPERATING SEGMENTS ..................................................... 318
25.5 DISCLOSURES ON GEOGRAPHICAL AREAS .................................................................................................................... 318
25.6 DISCLOSURES ON MAIN CUSTOMERS ............................................................................................................................ 318
25.7 SEGMENTS BY GEOGRAPHICAL AREAS AS OF DECEMBER 31, 2017, 2016 AND 2015 .................................................... 319
25.8 PROPERTY, PLANT AND EQUIPMENT CLASSIFIED BY GEOGRAPHICAL AREAS ................................................................ 320
NOTE 26 GAINS (LOSSES) FROM OPERATING ACTIVITIES IN THE STATEMENT OF INCOME BY
FUNCTION OF EXPENSES, INCLUDED ACCORDING TO THEIR NATURE ........................................................ 321
26.1 REVENUE ..................................................................................................................................................................... 321
26.2 COST OF SALES ............................................................................................................................................................ 321
26.3 OTHER INCOME ............................................................................................................................................................ 322
26.4 ADMINISTRATIVE EXPENSES ........................................................................................................................................ 322
26.5 OTHER EXPENSES BY FUNCTION ................................................................................................................................... 323
26.6 OTHER INCOME (EXPENSES) ......................................................................................................................................... 323
26.7 SUMMARY OF EXPENSES BY NATURE ........................................................................................................................... 324
26.8 FINANCE EXPENSES ...................................................................................................................................................... 325

10) FINANCIAL REPORTS
138
NOTE 27 INCOME TAX AND DEFERRED TAXES .................................................................................................... 326
27.1 CURRENT AND NON-CURRENT TAX ASSETS .................................................................................................................. 326
27.2 CURRENT TAX LIABILITIES ........................................................................................................................................... 327
27.3 INCOME TAX AND DEFERRED TAXES ............................................................................................................................ 328
NOTE 28 DISCLOSURES ON THE EFFECTS OF FLUCTUATIONS IN FOREIGN CURRENCY EXCHANGE
RATES 339
NOTE 29 MINERAL RESOURCE EXPLORATION AND EVALUATION EXPENDITURE ................................ 344
NOTE 30 LAWSUITS AND COMPLAINTS .................................................................................................................. 345
NOTE 31 SANCTION PROCEEDINGS ......................................................................................................................... 348
NOTE 32 RAILWAY FOR TRANSPORTATION OF PRODUCTS BETWEEN THE SITE COYA SUR AND THE
PORT OF TOCOPILLA ...................................................................................................................................................... 348
NOTE 33 EVENTS OCCURRED AFTER THE REPORTING DATE ........................................................................ 349
33.1 AUTHORIZATION OF THE FINANCIAL STATEMENTS ...................................................................................................... 349
33.2 DISCLOSURES ON EVENTS OCCURRING AFTER THE REPORTING DATE ........................................................................... 349
33.3 DETAIL OF DIVIDENDS DECLARED AFTER THE REPORTING DATE .................................................................................. 353

10) FINANCIAL REPORTS
139
Consolidated Classified Statements of Financial Position
_____________________________________________________________________________
Assets Note
As of
December
31, 2017
ThUS$
As of
December 31,
2016
ThUS$
Current assets
Cash and cash equivalents 7.1 630,438 514,669
Other current financial assets 10.1 366,979 289,189
Other current non-financial assets 24 26,883 30,273
Trade and other receivables, current 10.2 446,875 368,761
Trade receivables due from related parties, current 9.5 59,132 82,259
Current inventories 8 902,074 993,072
Current tax assets 27.1 32,291 51,632
Current assets other than those classified as held for sale or
disposal 2,464,672 2,329,855
Non-current assets or groups of assets classified as held for sale 1,589 2,056
Total current assets 2,466,261 2,331,911
Non-current assets
Other non-current financial assets 10.1 62,879 34,099
Other non-current non-financial assets 24 19,262 24,690
Trade receivables, non-current 10.2 1,912 1,840
Investments classified using the equity method of accounting 11.1-12.3 126,425 113,140
Intangible assets other than goodwill 13.1 105,948 109,439
Goodwill 13.1 44,177 37,972
Property, plant and equipment 14.1 1,437,193 1,532,710
Tax assets, non-current 27.1 32,179 32,179
Total non-current assets 1,829,975 1,886,069
Total assets 4,296,236 4,217,980
The accompanying notes form an integral part of these consolidated financial statements.

10) FINANCIAL REPORTS
140
Consolidated Classified Statements of Financial Position, (continued)
_____________________________________________________________________________
Liabilities and Equity Note
As of December
31, 2017
ThUS$
As of December
31, 2016
ThUS$
Current liabilities
Other current financial liabilities 10.4 220,328 179,144
Trade and other payables, current 10.5 196,280 200,496
Trade payables due to related parties, current 9.6 1,365 7
Other current provisions 18.1 63,445 41,912
Current tax liabilities 27.2 75,402 75,872
Provisions for employee benefits, current 15.1 22,421 20,998
Other current liabilities 18.3 168,804 61,920
Total current liabilities 748,045 580,349
Non-current liabilities
Other non-current financial liabilities 10.4 1,031,507 1,093,438
Other non-current provisions 18.1 30,001 8,934
Deferred tax liabilities 27.3 205,283 205,455
Provisions for employee benefits, non-current 15.1 33,932 22,532
Total non-current liabilities 1,300,723 1,330,359
Total liabilities 2,048,768 1,910,708
Equity 17
Share capital 477,386 477,386
Retained earnings 1,724,784 1,781,576
Other reserves (14,349) (12,888)
Equity attributable to owners of the Parent 2,187,821 2,246,074
Non-controlling interests 59,647 61,198
Total equity 2,247,468 2,307,272
Total liabilities and equity 4,296,236 4,217,980
The accompanying notes form an integral part of these consolidated financial statements.

10) FINANCIAL REPORTS
141
Consolidated Statements of Income by Function
January to December
Note 2017
ThUS$
2016
ThUS$
Revenue 26.1 2,157,323 1,939,322
Cost of sales 26.2 (1,394,822) (1,328,285)
Gross profit 762,501 611,037
Other income 26.3 17,827 15,202
Administrative expenses 26.4 (101,171) (88,436)
Other expenses by function 26.5 (61,638) (89,731)
Other gains (losses) 26.6 543 679
Profit (loss) from operating activities 618,062 448,751
Finance income 13,499 10,129
Finance costs 21-26.8 (50,124) (57,498)
Share of profit of associates and joint ventures accounted for
using the equity method 11-12 14,452
13,047
Foreign currency translation differences 22 (1,299) 460
Profit (loss) before taxes 594,590 414,889
Income tax expense, continuing operations 27.3 (166,173) (132,965)
Profit for the year 428,417 281,924
Profit attributable to
Owners of the Parent 427,697 278,290
Non-controlling interests 720 3,634
Profit for the year 428,417 281,924
The accompanying notes form an integral part of these consolidated financial statements.

10) FINANCIAL REPORTS
142
Consolidated Statements of Income by Function, (continued)
_____________________________________________________________________________
January to December
Note 2017 2016
US$ US$ Earnings per share
Common shares Basic earnings per share (US$ per share 20 1.6250 1.0573 Diluted common shares Diluted earnings per share (US$ per share) 20 1.6250 1.0573
The accompanying notes form an integral part of these consolidated financial statements.
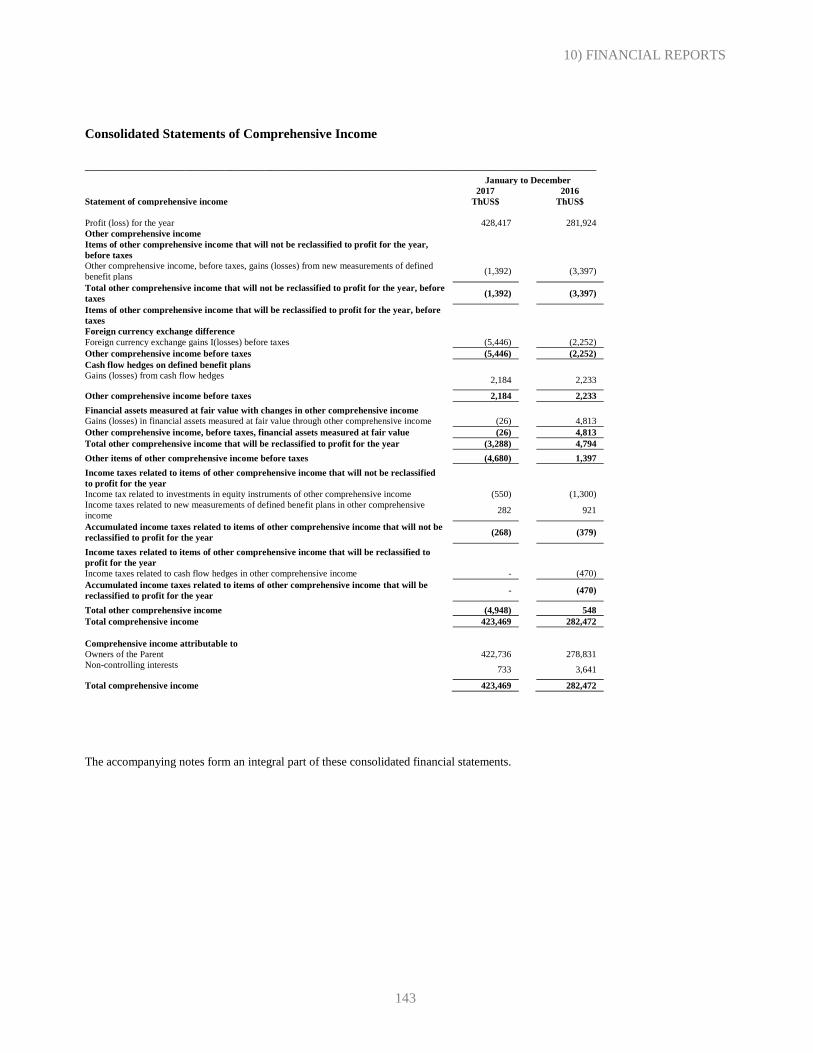
10) FINANCIAL REPORTS
143
Consolidated Statements of Comprehensive Income
_____________________________________________________________________________ January to December
2017 2016
Statement of comprehensive income ThUS$ ThUS$
Profit (loss) for the year 428,417 281,924
Other comprehensive income
Items of other comprehensive income that will not be reclassified to profit for the year,
before taxes
Other comprehensive income, before taxes, gains (losses) from new measurements of defined
benefit plans (1,392) (3,397)
Total other comprehensive income that will not be reclassified to profit for the year, before
taxes (1,392) (3,397)
Items of other comprehensive income that will be reclassified to profit for the year, before
taxes
Foreign currency exchange difference
Foreign currency exchange gains I(losses) before taxes (5,446) (2,252)
Other comprehensive income before taxes (5,446) (2,252)
Cash flow hedges on defined benefit plans
Gains (losses) from cash flow hedges 2,184 2,233
Other comprehensive income before taxes 2,184 2,233
Financial assets measured at fair value with changes in other comprehensive income
Gains (losses) in financial assets measured at fair value through other comprehensive income (26) 4,813
Other comprehensive income, before taxes, financial assets measured at fair value (26) 4,813
Total other comprehensive income that will be reclassified to profit for the year (3,288) 4,794
Other items of other comprehensive income before taxes (4,680) 1,397
Income taxes related to items of other comprehensive income that will not be reclassified
to profit for the year
Income tax related to investments in equity instruments of other comprehensive income (550) (1,300)
Income taxes related to new measurements of defined benefit plans in other comprehensive
income 282 921
Accumulated income taxes related to items of other comprehensive income that will not be
reclassified to profit for the year (268) (379)
Income taxes related to items of other comprehensive income that will be reclassified to
profit for the year
Income taxes related to cash flow hedges in other comprehensive income - (470)
Accumulated income taxes related to items of other comprehensive income that will be
reclassified to profit for the year - (470)
Total other comprehensive income (4,948) 548
Total comprehensive income 423,469 282,472
Comprehensive income attributable to
Owners of the Parent 422,736 278,831
Non-controlling interests 733 3,641
Total comprehensive income 423,469 282,472
The accompanying notes form an integral part of these consolidated financial statements.

10) FINANCIAL REPORTS
144
Consolidated Statements of Cash Flows
Consolidated Statements of cash flows Note 12/31/2017
ThUS$
12/31/2016
ThUS$
Cash flows from operating activities
Cash receipts from sales of goods and rendering of services 2,082,366 1,874,202
Cash receipts from premiums and benefits, annuities and other benefits from
policies entered
2,967 5,071
Cash payments to suppliers for the provision of goods and services (1) (959,213) (851,972)
Cash payments to and on behalf of employees (227,103) (204,609)
Other payments related to operating activities (34,956) (32,185)
Net cash generated from (used in) operating activities 864,061 790,507
Dividends received 2,091 4,345
Interest paid (18,964) (55,217)
Interest received 13,499 10,550
Income taxes paid (148,568) (113,991)
Other incomes (outflows) of cash (2) (8,122) (2,532)
Net cash generated from (used in) operating activities 703,997 633,662
Cash flows from (used in) investing activities
Payments made to acquire interest in joint ventures (38,088) (45,000)
Proceeds from the sale of property, plant and equipment 229 4,347
Acquisition of property, plant and equipment (142,144) (131,251)
Proceeds from sales of intangible assets 8,640 3,435
Purchases of intangible assets - (2,090)
Cash advances and loans granted to third parties 78 (163)
Proceeds from the repayment of advances and loans granted to third parties - -
Other inflows (outflows) of cash (3) (76,782) 333,108
Net cash generated from (used in) investing activities (248,067) 162,386
(1) Includes a payment of ThUS$30,000 made to the SEC and the DOJ, which was provisioned in 2016.
(2) Other inflows (outflows) of cash from operating activities include increases (decreases) net of Value Added Tax.
(3) Other inflows (outflows) of cash include investments and redemptions of time deposits and other financial instruments that do not
qualify as cash and cash equivalent in accordance with IAS 7, paragraph 7, since they mature in more than 90 days from the original
investment date.
The accompanying notes form an integral part of these consolidated financial statements.

10) FINANCIAL REPORTS
145
Consolidated Statements of Cash Flows, (continued)
_____________________________________________________________________________
Note 12/31/2017
ThUS$
12/31/2016
ThUS$
Cash flows used in financing activities
Proceeds from short-term borrowings 143,000 100,000
Repayment of borrowings (126,712) (517,000)
Dividends paid (373,933) (399,410)
Net cash generated used in financing activities (357,645) (816,410)
Net increase (decrease) in cash and cash equivalents before the effect of
changes in the exchange rate
98,285 (20,362)
Effects of exchange rate fluctuations on cash held 17,484 7,772
Net (decrease) increase in cash and cash equivalents 115,769 (12,590)
Cash and cash equivalents at beginning of period 514,669 527,259
Cash and cash equivalents at end of period 630,438 514,669
The accompanying notes form an integral part of these consolidated financial statements.

10) FINANCIAL REPORTS
146
Consolidated Statements of Changes in Equity
2017 Share
capital
Foreign
currency
translation
difference
reserves
Cash flow
hedge
reserves
Reserve for
gains (losses)
from financial
assets measured
at fair value
through other
comprehensive
income
Actuarial
gains (losses)
from defined
benefit plans
Other
miscellaneous
reserves
Other
reserves
Retained
earnings
Equity
attributable
to owners of
the Parent
Non-
controlling
interests
Total
ThUS$ ThUS$ ThUS$ ThUS$ ThUS$ ThUS$ ThUS$ ThUS$ ThUS$ ThUS$
Equity at beginning of the year 477,386 (19,463) 64 3,513 (4,834) 7,832 (12,888) 1,781,576 2,246,074 61,198 2,307,272
Profit for the year - - - - - - - 427,697 427,697 720 428,417
Other comprehensive income - (5,450) 2,184 (576) (1,119) - (4,961) - (4,961) 13 (4,948)
Comprehensive income - (5,450) 2,184 (576) (1,119) - (4,961) 427,697 422,736 733 423,469
Dividends - - - - - - - (480,989) (480,989) (2,284) (483,273)
Increase (decrease) due to transfers and
other changes - - -
- - 3,500 3,500 (3,500) - - -
Increase (decrease) in equity - (5,450) 2,184 (576) (1,119) 3,500 (1,461) (56,792) (58,253) (1,551) (59,804)
Equity as of December 31, 2017 477,386 (24,913) 2,248 2,937 (5,953) 11,332 (14,349) 1,724,784 2,187,821 59,647 2,247,468
The accompanying notes form an integral part of these consolidated financial statements.

10) FINANCIAL REPORTS
147
Consolidated Statements of Changes in Equity
2016 Share
capital
Foreign
currency
translation
difference
reserves
Cash flow
hedge
reserves
Reserve for
gains (losses)
from financial
assets measured
at fair value
through other
comprehensive
income
Actuarial
gains (losses)
from defined
benefit plans
Other
miscellaneous
reserves
Other
reserves
Retained
earnings
Equity
attributable
to owners of
the Parent
Non-
controlling
interests
Total
ThUS$ ThUS$ ThUS$ ThUS$ ThUS$ ThUS$ ThUS$ ThUS$ ThUS$ ThUS$ ThUS$
Equity at beginning of the year 477,386 (14,035) (1,699) (2,386) (1,677) (19,797) 1,882,196 2,339,785 60,571 2,400,356
Profit for the year - - - - - - 278,290 278,290 3,634 281,924
Other comprehensive income - (2,287) 1,763 3,513 (2,448) - 541 - 541 7 548
Comprehensive income - (2,287) 1,763 3,513 (2,448) - 541 278,290 278,831 3,641 282,472
Dividends - - - - - - - (375,000) (375,000) (3,014) (378,014)
Increase (decrease) due to transfers and
other changes (3,141) - - - 9,509 6,368 (3,910) 2,458 - 2,458
Increase (decrease) in equity - (5,428) 1,763 3,513 (2,448) 9,509 6,909 (100,620) (93,711) 627 (93,084)
Equity as of December 31, 2016 477,386 (19,463) 64 3,513 (4,834) 7,832 (12,888) 1,781,576 2,246,074 61,198 2,307,272
The accompanying notes form an integral part of these consolidated financial statements.

10) FINANCIAL REPORTS
148
Note 1 Identification and Activities of the Company and Subsidiaries
1.1 Historical background
Sociedad Química y Minera de Chile S.A. "SQM" is an open stock corporation organized under the laws of the
Republic of Chile and its Tax Identification Number is 93.007.000-9.
The Company was incorporated through a public deed dated June 17, 1968 by the notary public of Santiago MR.
Sergio Rodríguez Garcés. Its existence was approved by Decree No. 1,164 of June 22, 1968 of the Ministry of
Finance, and it was registered on June 29, 1968 in the Registry of Commerce of Santiago, on page 4,537 No. 1,992.
SQM's headquarters are located at El Trovador 4285, Fl. 6, Las Condes, Santiago, Chile. The Company's telephone
number is +56 2 2425-2000.
The Company is registered with the Securities Registry of the Financial Markets Commission (CMF), which was
formerly the Chilean Superintendence of Securities and Insurance (SVS) under No. 0184 dated March 18. 1983 and
is subject to the inspection of the SVS.
1.2 Main domicile where the Company performs its production activities
The Company’s main domiciles are: Calle Dos Sur plot No. 5 - Antofagasta; Arturo Prat 1060 - Tocopilla;
Administration Building w/n - Maria Elena; Administration Building w/n Pedro de Valdivia - María Elena, Anibal
Pinto 3228 - Antofagasta, Kilometer 1378 Ruta 5 Norte Highway - Antofagasta, Coya Sur Plant w/n - Maria Elena,
kilometer 1760 Ruta 5 Norte Highway - Pozo Almonte, Salar de Atacama (Atacama Saltpeter deposit) potassium
chloride plant s/n - San Pedro de Atacama, potassium sulfate plant at Salar de Atacama s/n – San Pedro de Atacama,
Minsal Mining Camp s/n CL Plant CL, Potassium– San Pedro de Atacama, formerly the Iris Saltpeter office S/N,
Commune of Pozo Almonte, Iquique.
1.3 Codes of main activities
The codes of the main activities as established by the Financial Markets Commission (CMF), which was formerly
the Chilean Superintendence of Securities and Insurance are as follows:
- 1700 (Mining)
- 2200 (Chemical products)
- 1300 (Investment)
1.4 Description of the nature of operations and main activities
Our products are mainly derived from mineral deposits found in northern Chile. We mine and process caliche ore
and brine deposits. The ore deposit in northern Chile contains nitrate and iodine deposits. The brine deposits of the
Salar de Atacama, in northern Chile, contain high concentrations of lithium and potassium as well as significant
concentrations of sulfate.

10) FINANCIAL REPORTS
149
Note 1 Identification and Activities of the Company and Subsidiaries (continued)
1.4 Description of the nature of operations and main activities, continued
From our caliche ore deposits located in the north of Chile, we produce a wide range of nitrate-based products used
for specialty plant nutrients and industrial applications, as well as iodine and iodine derivatives. At the Salar de
Atacama, we extract brines rich in potassium, lithium and sulfate in order to produce potassium chloride, potassium
sulfate, lithium solutions, and bischofite (magnesium chloride). We produce lithium carbonate and lithium hydroxide
at our plant near the city of Antofagasta, Chile, from the solutions brought from the Salar de Atacama.
We sell our products in over 100 countries worldwide through our global distribution network and generate our
revenue mainly from abroad.
Our products are divided into six categories: specialty plant nutrition, iodine and its derivatives, lithium and its
derivatives, industrial chemicals, potassium and other products and services, described as follows:
Specialty plant nutrition: SQM produces and sells four types of specialty plant nutrition in this line of business:
potassium nitrate, sodium nitrate, sodium potassium nitrate, and specialty mixes. This business is characterized by
being closely related to its customers for which it has specialized staff who provide expert advisory in best practices
for fertilization according to each type of crop, soil and climate. Within this type of business, potassium derivative
products and especially potassium nitrate have had a leading role because of the contribution they make to developing
crops, ensuring an improvement in post-crop life, in addition to improving quality, flavor and fruit color. The
potassium nitrate, which is sold in multiple formats and as a part of other specialty mixtures, is complemented by
sodium nitrate, potassium sodium nitrate, and more than 200 fertilizing mixtures.
Iodine: The Company is a major global producer of iodine. Iodine is widely used in the pharmaceutical industry,
technology and nutrition. Additionally, iodine is used as X ray contrast media and polarizing film for LCD displays.
Lithium: The Company’s lithium is mainly used for manufacturing rechargeable batteries for cell phones, cameras
and notebooks. By manufacturing lithium-based products, SQM provides significant materials for addressing great
challenges, such as the efficient use of energy and raw materials. Lithium is not only used for rechargeable batteries
for small electrical appliances such as mobile phones, tablets and laptops, but is also used in industrial applications,
such as the manufacturing of glass, ceramics and lubricating greases. Other uses include the pharmaceutical and
chemical industries.

10) FINANCIAL REPORTS
150
Note 1 Identification and Activities of the Company and Subsidiaries (continued)
1.4 Description of the nature of operations and main activities, continued
Industrial chemicals: Industrial chemicals are products used as supplies for a number of production processes. SQM
participates in this line of business producing sodium nitrate, potassium nitrate and potassium chloride. Industrial
nitrates have increased their importance over the last few years due to their use as storage means for thermal energy
at solar energy plants, which are widely used in countries such as Spain and the United States in their quest to
decrease CO2 emissions.
Potassium: Potassium is a primary essential macro-nutrient, and even though does not form part of the plant’s
structure, it has a significant role for the development of its basic functions, ensuring the quality of a crop, increasing
post-crop life, improving crop flavor, the amount of vitamins it contains and its physical appearance. Within this
business line, SQM also has potassium chlorate and potassium sulfate, both extracted from the salt layer located
under the Salar de Atacama (the Atacama Saltpeter Deposit).
Other products and services: This business line includes revenue from commodities, services, interests, royalties
and dividends.
1.5 Other background
Staff
As of December 31, 2017, and December 31, 2016, the workforce was as follows:
12/31/2017 12/31/2016
Employees SQM S.A.
Other
subsidiaries Total
SQM S.A.
Other
subsidiaries Total
Executives 43 77 120 31 72 103
Professionals 143 942 1,085 119 919 1,038
Technicians and operators 248 3,177 3,425 262 3,076 3,338
Foreign employees 19 272 291 8 264 272
Overall total 453 4,468 4,921 420 4,331 4,751

10) FINANCIAL REPORTS
151
Note 1 Identification and Activities of the Company and subsidiaries (continued)
1.5 Other background, continued
Main shareholders
The table below establishes certain information about the beneficial property of Series A and Series B shares of SQM
as of December 31, 2017 and December 31, 2016 with respect to each shareholder with an interest in excess of 5%
of outstanding Series A or B shares.
The information below is taken from our records and reports controlled in the Central Securities Depository and
reported to the Financial Markets Commission (CMF), which was formerly the Superintendence of Securities and
Insurance (SVS) and the Chilean Stock Exchange, whose main shareholders are as follows:
Shareholder as of December 31, 2017 No. of Series A with
ownership % of Series A shares No. of Series B with
ownership % of Series B
shares % of total shares
The Bank of New York Mellon, ADRs - - 54,599,961 45.36% 20.74%
Sociedad de Inversiones Pampa Calichera S.A.(*) 44,894,152 31.43% 7,007,688 5.82% 19.72%
Inversiones El Boldo Limitada 29,330,326 20.54% 16,363,546 13.59% 17.36%
Inversiones RAC Chile S.A. 19,200,242 13.44% 2,202,773 1.83% 8.13%
Potasios de Chile S.A.(*) 18,179,147 12.73% - - 6.91%
Inversiones PCS Chile Limitada 15,526,000 10.87% 1,600,000 1.33% 6.51%
Inversiones Global Mining (Chile) Limitada (*) 8,798,539 6.16% - - 3.34%
Banco de Chile por Cuenta de Terceros no Residentes - - 8,394,289 6.97% 3.19%
Banco Itau por Cuenta de Inversionistas 19,125 0.01% 7,017,504 5.63% 2.67%
Banco Santander por cuenta de inversionistas extranjeros - - 4,593,336 3.82 1.75%
(*) Total Pampa Group 29.97%
Shareholder as of December 31, 2016 No. of Series A with
ownership % of Series A shares No. of Series B with
ownership % of Series B
shares % of total shares The Bank of New York Mellon, ADRs - - 59,373,011 49.32% 22.56%
Sociedad de Inversiones Pampa Calichera S.A.(*) 44,894,152 31.43% 7,007,688 5.82% 19.72%
Inversiones El Boldo Limitada 29,330,326 20.54% 16,363,546 13.59% 17.36%
Inversiones RAC Chile S.A. 19,200,242 13.44% 2,202,773 1.83% 8.13%
Potasios de Chile S.A.(*) 18,179,147 12.73% - - 6.91%
Inversiones PCS Chile Limitada 15,526,000 10.87% 1,600,000 1.33% 6.51%
Banco de Chile on behalf of non-resident third parties - - 8,962,355 7.45% 3.41%
Inversiones Global Mining (Chile) Limitada (*) 8,798,539 6.16% - - 3.34%
Banco Itaú on behalf of investors 20,950 0.01% 6,502,217 5.40% 2.48%
Inversiones La Esperanza Limitada 3,711,598 2.60% 46,500 0.04% 1.43%
(*) Total Pampa Group 29.97%
On December 31, 2017 the total number of shareholders had risen to 1,240.

10) FINANCIAL REPORTS
152
Note 2 Basis of presentation for the consolidated financial statements
2.1 Accounting period
These consolidated financial statements cover the following periods:
- Consolidated Statements of Financial Position as of December 31, 2017 and, 2016.
- Consolidated Statements of Changes in Equity as of December 31, 2017 and 2016
- Consolidated Statements of Comprehensive Income as of December 31, 2017 and 2016
- Consolidated Statements of Direct-Method Cash Flows as of December 31, 2017 and 2016.
2.2 Consolidated financial statements
The consolidated financial statements of Sociedad Química y Minera de Chile S.A. and its Subsidiaries were prepared
in accordance with International Financial Reporting Standards (hereinafter “IFRS”) and represent the full, explicit
and unreserved adoption of International Financial Reporting Standards as issued by the International Accounting
Standards Board (hereinafter the “IASB”).
These consolidated financial statements fairly reflect the Company’s financial position, the comprehensive results of
operations, changes in equity and cash flows occurring during the years then ended.
IFRS establish certain alternatives for their application. Those applied by the Company are detailed in this Note.
The accounting policies used in the preparation of these consolidated annual accounts comply with each IFRS in
force at their date of presentation.
For the closing date of these consolidated financial statements certain reclassifications have been made for the
captions current tax assets, other non-current financial assets, equity accounted investees, current tax assets, non-
current as of December 31, 2016, for consistent presentation and comparability to the figures as of December 31,
2017.
2.3 Basis of measurement
The consolidated financial statements have been prepared on the historical cost basis except for the following:
- Inventories are recorded at the lower of cost and net realizable value.
- Financial derivatives at fair value; and
- Staff severance indemnities and pension commitments at actuarial value
- Certain financial investments classified as available for sale measured at fair value with an offsetting entry
in other comprehensive income.
- Other current and non-current assets and financial liabilities at amortized cost

10) FINANCIAL REPORTS
153
Note 2 Basis of presentation for the consolidated financial statements (continued)
2.4 Accounting pronouncements
New accounting pronouncements
a) The following standards, interpretations and amendments are mandatory for the first time for annual periods
beginning on January 1, 2017:
Amendments and improvements Mandatory for annual
periods beginning on
Amendment to IAS 7 “Statement of Cash Flows”. Published in February 2016. The amendment introduces an
additional disclosure initiative that enables users of financial statements to evaluate changes in liabilities arising
from financing activities.
01/01/2017
Amendment to IAS 12 “Income Taxes”. Published in February 2016. The amendment clarifies how to account
for a deferred tax asset that is related to a debt instrument measured at fair value.
01/01/2017
Amendment to IFRS 12 “Disclosure of Interests in Other Entities”. Published in December 2016. The
amendment clarifies the scope of this standard. These amendments must be applied retroactively to annual
periods as of January 1, 2017.
01/01/2017
The adoption of the standards, amendments and interpretations indicated above has no significant impact on the
Company’s consolidated financial statements.

10) FINANCIAL REPORTS
154
Note 2 Basis of presentation for the consolidated financial statements (continued)
2.4 Accounting pronouncements, continued
b) Standards, interpretations and amendments issued that had not become effective for financial statements
beginning on January 1, 2017 and which the Company has not adopted early are as follows:
Standards and interpretations Mandatory for annual periods
beginning on
The International Financial Reporting Standard No. 9 (IFRS 9) Financial Instruments - Published in July 2014.
The IASB has published a complete new version of IFRS 9, which replaces the guidance in IAS 39. This final
version includes requirements regarding the classification and measurement of financial assets and liabilities
and a new model for the recognition of expected credit losses that replaces the incurred loss impairment model
used today. The part relating to hedge accounting that forms part of this final version of IFRS 9 was published
in November 2013.
01/01/2018
The Company’s trade receivables are maintained to obtain contractual cash flows (charge and collect) and do
not contain a significant financing component, being recognized at the transaction price defined in IFRS 15.
Meanwhile, the Company is using the simplified approach for recognizing expected credit losses if there is
no significant increase in the credit risk since initial recognition and the terms of sale are less than 12 months.
Similarly, the Company is using an impairment model for trade receivables based on expected credit losses
that considers the credit risk separately from its hedges, generating an effect equal to that established in the
previous accounting standard IAS 39. The Company has established the procedures and controls for beginning
to apply IFRS 9 as of January 1, 2018.

10) FINANCIAL REPORTS
155
Note 2 Basis of presentation for the consolidated financial statements (continued)
2.4 Accounting pronouncements, continued
Standards and interpretations Mandatory for annual
periods beginning on
The International Financial Reporting Standard No. 15 (IFRS 15) Revenue from Contracts with Customers -
Published in May 2014 by the IASB. This established the principles that an entity must apply for presenting
useful information to users of financial statements with regard to the nature, amount, timing and uncertainty
of revenue and cash flows from a contract with a customer, as of January 1, 2018. The basic principle is that
an entity will recognize revenue representing the transfer of goods or services to customers in an amount that
reflects the consideration that the entity expects to receive in exchange for such goods or services. The new
standard establishes a framework of five steps to determine when to recognize revenue and at what amount.
The standard is focused on recognizing the revenue as the different obligations of performance, transfer of
control, risks and benefits are fulfilled. This standard replaces the following standards and interpretations:
IAS 18 Revenue; IAS 11 Construction contracts; IFRIC 13 Customer Loyalty Programs; IFRIC 15
Agreements for the Construction of Real Estate; IFRIC 18 Transfers of Assets from Customers; and SIC-31
Revenue - Barter Transactions Involving Advertising Services.
01/01/2018
In April 2016, the IASB published an amendment to introduce clarifications with regard to identifying
performance obligations in contracts with customers, to account for licensing involving intellectual property
and for assessing principal versus agent considerations (i.e. Recording revenue on a gross basis versus the net
amount it retains), among other aspects. These amendments are also effective as of January 1, 2018.
The Company's revenue is mainly derived from its principal performance obligation to transfer its products
under agreements in which the transfer of the control, risks and benefits of the property and the fulfillment of
the Company’s performance obligations happen at the same time. The Company has carried out a detailed
evaluation and executed a plan for the implementation of IFRS 15. As part of this process, the Company has
analyzed the performance obligations underlying revenue recognition, such as the performance obligation to
transport products to customers, in line with the terms and conditions previously established in contracts and
there is no significant impact - the performance obligation has been satisfied. With regard to products invoiced
with a deferred shipment date, the transfer of control has been assessed over and above the transfer of risks
and benefits established in the previous standard and a prepayment is estimated in revenue recognition,
without a significant impact. Other considerations were also assessed, such as rebates, discounts, guarantees,
financing components and product personalization. Based on this analysis, the Company has concluded that
these last items will not generate an impact nor are significant changes expected in the recording of revenue
as a result of applying this new standard, except for the impact on disclosures. The Company has established
the procedures and controls for beginning to apply IFRS 15 as of January 1, 2018. It intends to recognize the
cumulative effect of applying IFRS 15 as an adjustment to the opening balance of equity as of that date,
without making adjustments to the comparative information for prior periods.
01/01/2018
IFRS 16 “Leases” – Published in January 2016 establishes the principle for recognizing, measuring,
presenting and disclosing leases. IFRS 16 replaces IAS 17 and introduces a single lessee accounting model,
requiring lessees to recognize assets and liabilities for all leases with a lease term of more than 12 months
unless the underlying asset has a low value. IFRS 16 applies to annual reporting periods beginning on or after
January 1, 2019. Earlier application is permitted for entities that apply IFRS 15 before the initial application
date of IFRS 16.
01/01/2019
IFRS 17 “Insurance Contracts”. Published in May 2017, this replaces IFRS 4. IFRS 17 will mainly change
the accounting for those entities that issue insurance contacts and investment contracts with discretionary
participation features. IFRS 17 is effective for annual reporting periods beginning on or after January 1, 2021.
Earlier application is permitted if both IFRS 15 Revenue from Contracts with Customers and IFRS 9 Financial
Instruments have also been applied.
01/01/2021
IFRIC 22 “Foreign Currency Transactions and Advance Consideration”. Published in December 2016. This
Interpretation applies to a foreign currency transaction (or part of one) if an entity recognizes a non-financial
asset or non-financial liability arising from the payment or receipt of an advance consideration prior to the
entity recognizing the related asset, expense or income (or the applicable portion thereof). The interpretation
provides a guideline for the transaction date to be used for both single payments/receipts and situations when
there are multiple payments/receipts. Its objective is to reduce diversity in practice.
01/01/2018

10) FINANCIAL REPORTS
156
Note 2 Basis of presentation for the consolidated financial statements (continued)
2.4 Accounting pronouncements, continued
Amendments and improvements Mandatory for annual periods
beginning on
IFRIC 23 “Uncertainty over Income Tax Treatments”. Published in June 2016. This interpretation clarifies how
to apply the recognition and measurement requirements in IAS 12, when there is uncertainty over income tax
treatments.
01/01/2019
Amendment to IFRS 15 “Revenue from Contracts with Customers”. Published in April 2016. The amendment
provides clarifications with regard to identifying performance obligations in contracts with customers,
accounting for licensing involving intellectual property and assessing principal versus agent considerations (i.e.
recording revenue on a gross basis versus the net amount it retains). It includes new and modified illustrative
examples as a guide, along with practical examples related to the transition to the new standard on revenue.
01/01/2018
Amendment to IAS 28 “Investments in Associates and Joint Ventures” in regard to measuring an associate or
joint venture at fair value. Published in December 2016.
01/01/2018
Amendment to IFRS 9 “Financial Instruments”. Published in October 2017. The amendment permits more
assets to be measured at amortized cost than under the previous version of IFRS 9, in particular some prepayable
financial assets with negative compensation. The assets affected, which include some loans and debt securities,
would otherwise have been measured at fair value through profit and loss (FVTPL). For them to qualify for
amortized cost measurement, the negative compensation must be "reasonable compensation for early
termination of the contract”.
01/01/2019
Amendment to IAS 28 “Investments in Associates and Joint Ventures” Published in October 2017. This
amendment clarifies that companies should apply IFRS 9 to account for long-term interests in an associate or
joint venture to which the equity method is not applied. The Board has published an example that illustrates
how companies should apply the requirements of IFRS 9 and IAS 28 to long-term interests in an associate or
joint venture.
01/01/2019
Amendment to IFRS 3 “Business Combinations” Published in December 2017. The amendment clarifies that
gaining control of a company that is a joint venture is a business combination that is achieved in stages. The
acquirer must remeasure previously held interests in that business at fair value at the date of acquisition.
01/01/2019
Amendment to IFRS 11 “Joint Arrangements” Published in December 2017. The amendment clarifies that
when an entity obtains joint control of a business that is a joint operation, the entity does not remeasure
previously held interests in that business.
01/01/2019

10) FINANCIAL REPORTS
157
Note 2 Basis of presentation for the consolidated financial statements (continued)
2.4 Accounting pronouncements, continued
Amendments and improvements Mandatory for annual
periods beginning on or after
Amendment to IAS 12 “Income Taxes”. Published in December 2017. This amendment clarifies that the
income tax consequences of dividends on financial instruments classified as equity should be recognized
when the past transactions or events that generated distributable profits were originally recognized.
01/01/2019
Amendment to IAS 23 “Borrowing Costs”. Published in December 2017. This amendment clarifies that the
borrowing costs of specific borrowings that remain outstanding after the related qualifying asset is ready for
intended use or for sale will be considered as part of the general borrowing costs of the entity.
01/01/2019
The following amendment was issued by the IASB and was originally scheduled to take effect in 2016. However, the organization
has changed its position and the mandatory effective date is now to be determined.
Amendment to IFRS 10 “Consolidated Financial Statements” and IAS 28 “Investments in Associates and
Joint Ventures”. Published in September 2014. These amendments address an inconsistency between the
requirements in IFRS 10 and those in IAS 28 in dealing with the sale or contribution of assets between an
investor and its associate or joint venture. The main consequence of the amendments is that a full gain or
loss is recognized when a transaction involves a business (whether it is housed in a subsidiary or not). A
partial gain or loss is recognized when a transaction involves assets that do not constitute a business, even
if these assets are housed in a subsidiary.
Undetermined
Management believes the adoption of the standards, interpretations and amendments applicable as of January 1, 2018, will have
no significant impact on the Company’s financial statements. For those standards to be applied as of 2019, the corresponding
studies and analysis will be carried out during 2018.

10) FINANCIAL REPORTS
158
Note 2 Basis of presentation for the consolidated financial statements (continued)
2.5 Basis of consolidation
(a) Subsidiaries
These are all those entities where Sociedad Química y Minera de Chile S.A. has control over directing their financial
and operational policies. This is generally accompanied by a share of more than half of the voting rights. Subsidiaries
apply the same accounting policies of their Parent.
To account for the acquisition, the Company uses the acquisition method. Under this method the acquisition cost is
the fair value of assets delivered, equity securities issued, and liabilities incurred or assumed at the date of exchange.
Identifiable assets acquired, and liabilities and contingencies assumed in a business combination are measured initially
at fair value at the acquisition date. For each business combination, the Company will measure non-controlling interest
of the acquiree either at fair value or as proportional share of net identifiable assets of the acquiree. For more
information, please see Note 6.4
Companies included in consolidation:
TAX ID
No. Foreign subsidiaries Country of
origin Functional currency
Ownership interest
12/31/2017 12/31/2016
Direct Indirect Total Total
Foreign Nitratos Naturais Do Chile Ltda. Brazil US$ 0.0000 100.0000 100.0000 100.0000
Foreign Nitrate Corporation Of Chile Ltd. United
Kingdom US$ 0.0000 100.0000 100.0000 100.0000
Foreign SQM North America Corp. USA US$ 40.0000 60.0000 100.0000 100.0000
Foreign SQM Europe N.V. Belgium US$ 0.5800 99.4200 100.0000 100.0000
Foreign Soquimich S.R.L. Argentina Argentina US$ 0.0000 100.0000 100.0000 100.0000
Foreign Soquimich European Holding B.V. Netherlands US$ 0.0000 100.0000 100.0000 100.0000
Foreign SQM Corporation N.V. Netherlands US$ 0.0002 99.9998 100.0000 100.0000
Foreign SQI Corporation N.V. Netherlands US$ 0.0159 99.9841 100.0000 100.0000
Foreign SQM Comercial De México S.A. de C.V. Mexico US$ 0.0100 99.9900 100.0000 100.0000
Foreign North American Trading Company USA US$ 0.0000 100.0000 100.0000 100.0000
Foreign Administración y Servicios Santiago S.A.
de C.V. Mexico US$ 0.0000 100.0000 100.0000 100.0000
Foreign SQM Peru S.A. Peru US$ 0.9800 99.0200 100.0000 100.0000
Foreign SQM Ecuador S.A. Ecuador US$ 0.0040 99.9960 100.0000 100.0000
Foreign SQM Nitratos Mexico S.A. de C.V. Mexico US$ 0.0000 100.0000 100.0000 100.0000
Foreign SQMC Holding Corporation L.L.P. USA. US$ 0.1000 99.9000 100.0000 100.0000
Foreign SQM Investment Corporation N.V. Netherlands US$ 1.0000 99.0000 100.0000 100.0000
Foreign SQM Brasil Limitada Brazil US$ 1.0900 98.9100 100.0000 100.0000
Foreign SQM France S.A. France US$ 0.0000 100.0000 100.0000 100.0000
Foreign SQM Japan Co. Ltd. Japan US$ 0.1597 99.8403 100.0000 100.0000
Foreign Royal Seed Trading Corporation A.V.V. Aruba US$ 1.6700 98.3300 100.0000 100.0000
Foreign SQM Oceania Pty Limited Australia US$ 0.0000 100.0000 100.0000 100.0000
Foreign Rs Agro-Chemical Trading Corporation
A.V.V. Aruba US$ 98.3333 1.6667 100.0000 100.0000
Foreign SQM Colombia SAS Colombia US$ 0.0000 100.0000 100.0000 -
Foreign SQM Australia PTY Australia Australia Dollar 0.0000 100.0000 100.0000 -
Foreign SACAL S.A. Argentina Argentinean Peso 0.0000 100.0000 100.0000 -

10) FINANCIAL REPORTS
159
Note 2 Basis of presentation for the consolidated financial statements (continued)
2.5 Basis of consolidation, continued
TAX ID No. Foreign subsidiaries Country of
origin Functional currency
Ownership interest
12/31/2017 12/31/2016
Direct Indirect Total Total
Foreign SQM Indonesia S.A. Indonesia US$ 0.0000 80.0000 80.0000 80.0000
Foreign SQM Virginia L.L.C. USA US$ 0.0000 100.0000 100.0000 100.0000
Foreign SQM Italia SRL Italy US$ 0.0000 100.0000 100.0000 100.0000
Foreign Comercial Caimán Internacional S.A. Panama US$ 0.0000 100.0000 100.0000 100.0000
Foreign SQM Africa Pty. South Africa US$ 0.0000 100.0000 100.0000 100.0000
Foreign SQM Lithium Specialties LLC USA US$ 0.0000 100.0000 100.0000 100.0000
Foreign SQM Iberian S.A. Spain US$ 0.0000 100.0000 100.0000 100.0000
Foreign SQM Agro India Pvt. Ltd. India US$ 0.0000 100.0000 100.0000 100.0000
Foreign SQM Beijing Commercial Co. Ltd. China US$ 0.0000 100.0000 100.0000 100.0000
Foreign SQM Thailand Limited Thailand US$ 0.0000 99.996 99.996 99.996
TAX ID No. Domestic subsidiaries Country of
origin Functional currency
Ownership interest
12/31/2017 12/31/2016
Direct Indirect Total Total
96.801.610-5 Comercial Hydro S.A. Chile US$ 0.0000 60.6383 60.6383 60.6383
96.651.060-9 SQM Potasio S.A. Chile US$ 99.9999 0.0000 99.9999 99.9999
96.592.190-7 SQM Nitratos S.A. Chile US$ 99.9999 0.0001 100.0000 100.0000
96.592.180-K Ajay SQM Chile S.A. Chile US$ 51.0000 0.0000 51.0000 51.0000
86.630.200-6 SQMC Internacional Ltda. Chile Ch$ 0.0000 60.6381 60.6381 60.6381
79.947.100-0 SQM Industrial S.A. Chile US$ 99.0470 0.9530 100.0000 100.0000
79.906.120-1 Isapre Norte Grande Ltda. Chile Ch$ 1.0000 99.0000 100.0000 100.0000
79.876.080-7 Almacenes y Depósitos Ltda. Chile Ch$ 1.0000 99.0000 100.0000 100.0000
79.770.780-5 Servicios Integrales de Tránsitos y
Transferencias S.A. Chile
US$ 0.0003 99.9997 100.0000 100.0000
79.768.170-9 Soquimich Comercial S.A. Chile US$ 0.0000 60.6383 60.6383 60.6383
79.626.800-K SQM Salar S.A. Chile US$ 18.1800 81.8200 100.0000 100.0000
78.053.910-0 Proinsa Ltda. Chile Ch$ 0.0000 60.5800 60.5800 60.5800
76.534.490-5 Sociedad Prestadora de Servicios de Salud
Cruz del Norte S.A. Chile
Ch$ 0.0000 100.0000 100.0000 100.0000
76.425.380-9 Exploraciones Mineras S.A. Chile US$ 0.2691 99.7309 100.0000 100.0000
76.064.419-6 Comercial Agrorama Ltda. (a) Chile Ch$ 0.0000 42.4468 42.4468 42.4468
76.145.229-0 Agrorama S.A. Chile Ch$ 0.0000 60.6377 60.6377 60.6377
76.359.919-1 Orcoma Estudios SPA Chile US$ 51.0000 0.0000 51.0000 51.0000
76.360.575-2 Orcoma SPA Chile US$ 100.0000 0.0000 100.0000 100.0000
76.686.311-9 SQM MaG SpA. Chile US$ 100.0000 0.0000 100.0000 100,0000
(a) The Company consolidated Comercial Agrorama Ltda. as it has the control of this company’s relevant activities.

10) FINANCIAL REPORTS
160
Note 2 Basis of presentation for the consolidated financial statements (continued)
2.5 Basis of consolidation, continued
Subsidiaries are consolidated using the line-by-line method, adding the items that represent assets, liabilities, revenues,
and expenses of similar content, and eliminating those related to intragroup transactions.
Profit or loss of subsidiaries acquired or divested during the year are included in profit or loss accounts consolidated
from the date control is transferred to the Group, or up to the date control is lost, as applicable.
Non-controlling interest represents the equity of a subsidiary not directly or indirectly attributable to the Parent.

10) FINANCIAL REPORTS
161
Note 3 Significant accounting policies
3.1 Classification of balances as current and non-current
In the attached consolidated statement of financial position, balances are classified in consideration of their recovery
(maturity) dates; i.e., those maturing within a period equal to or less than 12 months are classified as current counted
from the closing date of the consolidated financial statements and those with maturity dates exceeding the
aforementioned period are classified as non-current.
The exception to the foregoing relates to deferred taxes, which are classified as non-current, regardless of the maturity
they have.
3.2 Functional and presentation currency
The Company’s consolidated financial statements are presented in United States dollars (“U.S. dollars” or “US$”),
which is the Company’s functional and presentation currency and is the currency of the main economic environment
in which it operates.
Consequently, the term foreign currency is defined as any currency other than the U.S. dollar.
The consolidated financial statements are presented in thousands of United States dollars without decimals.
3.3 Foreign currency translation
(a) Group entities:
The revenue, expenses, assets and liabilities of all entities that have a functional currency other than the presentation
currency are converted to the presentation currency as follows:
- Assets and liabilities are converted at the closing exchange rate prevailing on the reporting date.
- Revenues and expenses of each profit or loss account are converted at monthly average exchange rates.
- All resulting foreign currency translation gains and losses are recognized as a separate component in translation
reserves.
In consolidation, foreign currency differences arising from the translation of a net investment in foreign entities are
recorded in equity (other reserves). At the date of disposal, such foreign currency translation differences are recognized
in the statement of income as part of the gain or loss from the sale.

10) FINANCIAL REPORTS
162
Note 3 Significant accounting policies (continued)
3.3 Foreign currency translation, continued
The main exchange rates and the adjustment unit used to translate monetary assets and liabilities, expressed in foreign
currency at the end of each period in respect to U.S. dollars, are as follows:
12/31/2017 12/31/2016
US$ US$
Brazilian real 3.02 3.25
New Peruvian sol 3.08 3.35
Argentine peso 18.40 15.84
Japanese yen 113.00 116.83
Euro 0.83 0.95
Mexican peso 19.65 20.63
Australian dollar 0.78 0.72
Pound Sterling 0.74 0.81
South African rand 12.35 13.70
Ecuadorian dollar 1.00 1.00
Chilean peso 614.75 669.47
Chinese yuan 6.51 6.67
Indian rupee 63.84 66.60
Thai baht 32.85 34.59
UF (*) 43.59 39.36
(*) The Unidad de Fomento (UF) is an indexed monetary unit used in Chile, calculated based on the variation in the
Consumer Price Index (CPI).
(b) Transactions and balances
Non-monetary transactions in currencies other than the functional currency (U.S. dollar) are translated to the
respective functional currencies of Group entities at the exchange rate on the date of the transaction. Monetary assets
and liabilities denominated in foreign currencies at the reporting date are retranslated to the functional currency at the
exchange rate at that date. All differences are recorded in the statement of income except for all monetary items that
provide an effective hedge for a net investment in a foreign operation. These items are recognized in other
comprehensive income on the divestment, when they are recognized in the statement of income. Charges and credits
attributable to foreign currency translation differences on those hedge monetary items are also recognized in other
comprehensive income.
Non-monetary assets and liabilities that are measured at historical cost in a foreign currency are retranslated to the
functional currency at the historical exchange rate of the transaction. Non-monetary items that are measured based on
fair value in a foreign currency are translated using the exchange rate at the date on which the fair value is determined.

10) FINANCIAL REPORTS
163
Note 3 Significant accounting policies (continued)
3.4 Subsidiaries
SQM S.A. uses the level of control it has in subsidiaries as a basis to determine their share in the consolidated financial
statements. This control consists of the Company’s ability to exercise power in the subsidiary, exposure, or right, to
variable performance from its share in the investee and the ability to use its power on the investee to have an influence
on the amount of the investor’s performance.
The Company prepares the consolidated financial statements using consistent accounting policies for the entire Group.
The consolidation of a subsidiary commences when the Company has control over the subsidiary and stops when
control ceases.
3.5 Consolidated statement of cash flows
Cash equivalents correspond to highly-liquid short-term investments that are easily convertible into known amounts
of cash. They are subject to insignificant risk of changes in their value and mature in less than three months from the
date of acquisition of the instrument.
For the purposes of the statement of cash flows, cash and cash equivalents comprise cash and cash equivalents as
defined above.
The statement of cash flows includes movements in cash performed during the year, determined using the direct
method.
3.6 Financial assets
Management determines the classification of its financial assets at the time of initial recognition, on the basis of the
business model for the management of financial assets and the characteristics of contractual cash flows from the
financial assets. In accordance with IAS 39, financial assets are measured initially at fair value plus transaction costs
that may have been incurred and are directly attributable to the acquisition of the financial asset. Subsequently,
financial assets are measured at amortized cost or fair value.
The Company assesses, at each reporting date, whether there is objective evidence that an asset or group of assets is
impaired. An asset or group of financial assets is impaired if and only if there is evidence of impairment as a result of
one or more events occurring after the initial recognition of the asset or group of assets. For the recognition of
impairment, the loss event has to have an impact on the estimate of future cash flows from the asset or groups of
financial assets.
10) FINANCIAL REPORTS
164
Note 3 Significant accounting policies (continued)
3.7 Financial liabilities
Management determines the classification of its financial liabilities at the time of initial recognition. As established in
IAS 39, financial liabilities at the time of initial recognition are measured at fair value, less transaction costs that may
have been incurred and are directly attributable to the issue of the financial liability. Subsequently, these are measured
at amortized cost using the effective interest method. Financial liabilities that have been initially recognized at fair
value through profit or loss will be measured subsequently at fair value.
3.8 Financial instruments at fair value through profit or loss
Management will irrevocably determine, at the time of initial recognition, the designation of a financial instrument at
fair value through profit or loss. By doing so, this eliminates and/or significantly reduces the measurement or
recognition inconsistency that would otherwise have arisen from the measurement of assets or liabilities or from the
recognition of gains and losses from them on different bases.
3.9 Financial instrument offsetting
The Company offsets an asset and liability if and only if it presently has a legally enforceable right of setting off the
amounts recognized and has the intent of settling for the net amount of realizing the asset and settling the liability
simultaneously.
3.10 Reclassification of financial instruments
At such time when the Company changes its business model for managing financial assets, it will reclassify those
financial assets affected by the new business model.
Financial liabilities could not be reclassified.
3.11 Derivative and hedging financial instruments
Derivatives are recognized initially at fair value as of the date on which the derivatives contract is signed and, they
are subsequently assessed at fair value. The method for recognizing the resulting gain or loss depends on whether the
derivative has been designated as an accounting hedge instrument and, if so, it depends on the type of hedging, which
may be as follows:
a) Fair value hedge of assets and liabilities recognized (fair value hedges);
b) Hedging of a single risk associated with an asset or liability recognized or a highly probable forecast
transaction (cash flow hedge).
At the beginning of the transaction, the Company documents the relationship that exists between hedging instruments
and those items hedged, as well as their objectives for risk management purposes and the strategy to conduct different
hedging operations.

10) FINANCIAL REPORTS
165
Note 3 Significant accounting policies (continued)
3.11 Derivative and hedging financial instruments, continued
The Company also documents its evaluation both at the beginning and at the end of each period if the derivatives used
in hedging transactions are highly effective to offset changes in the fair value or in cash flows of hedged items.
The fair value of derivative instruments used for hedging purposes is shown in Note 10.3 (hedging assets and
liabilities). Changes in the cash flow hedge reserve are classified as a non-current asset or liability if the remaining
expiration period of the hedged item is more than 12 months, and as a current asset or liability if the remaining
expiration period of the entry is less than 12 months.
Derivatives that are not designated or do not qualify as hedging derivatives are classified as current assets or liabilities,
and changes in the fair value are directly recognized through profit or loss.
a) Fair value hedge
Changes in the fair value of derivatives that are designated and qualify as fair value hedges are recorded in profit or
loss, together with any changes in the fair value of the hedged asset or liability that are attributable to the hedged risk.
The gain or loss relating to the effective portion of interest rate swaps that hedge fixed rate borrowings is recognized
in profit or loss within finance costs, together with changes in the fair value of the hedged fixed rate borrowings
attributable to interest rate risk. The gain or loss relating to the ineffective portion is recognized in profit or loss within
other income or other expenses. If the hedge no longer meets the criteria for hedge accounting, the adjustment to the
carrying amount of a hedged item for which the effective interest method is used is amortized to profit or loss over
the period to maturity using a recalculated effective interest rate.
b) Cash flow hedges
The portion of the derivative instruments used to mitigate cash flow fluctuations related to sales revenue or expenses
is recognized in gross margin as a cost or undistributed revenue. The accrued portion of these instruments is
recognized in other income or expenditure.

10) FINANCIAL REPORTS
166
Note 3 Significant accounting policies (continued)
3.12 Available for sale financial assets
Available for sale financial assets are non-derivative financial assets, which have been designated as available for sale
and are not classified in any of the previous categories of financial instruments. Available for sale financial instruments
are initially recognized at fair value plus any directly attributable transaction costs.
Subsequent to initial recognition, they are recognized at fair value and changes other than impairment losses are
recognized in other comprehensive income and presented in equity in the fair value reserve. If an investment is
derecognized, the accumulated gain or loss is reclassified to profit or loss.
3.13 Derecognition of financial instruments
In accordance with IAS 39, the Company derecognizes a financial asset when the contractual rights to the cash flows
from the asset expire, or it transfers the rights to receive the contractual cash flows in a transaction in which
substantially all the risks and rewards of ownership of the financial asset are transferred; and the control of the financial
assets has not been retained.
The Company derecognizes a financial liability when its contractual obligations or a part of these are discharged, paid
to the creditor or legally extinguished.
3.14 Derivative financial instruments
The Company maintains derivative financial instruments to hedge its exposure to foreign currencies. Derivative
financial instruments are recognized initially at fair value; attributable transact ion costs are recognized when
incurred. Subsequent to initial recognition, any changes in the fair value of such derivatives are recognized in profit
or loss as part of gains and losses.
The Company permanently assesses the existence of embedded derivatives, both in its contracts and financial
instruments. As of December 31, 2017, and December 31, 2016, there were no embedded derivatives.
3.15 Fair value initial measurements
From the initial recognition, the Company measures its assets and liabilities at fair value plus or minus transaction
costs incurred that are directly attributable to the acquisition of a financial asset or issuance of a financial liability.

10) FINANCIAL REPORTS
167
Note 3 Significant accounting policies (continued)
3.16 Deferred acquisition costs from insurance contracts
Acquisition costs from insurance contracts are classified as prepayments and correspond to insurance contracts in
force, recognized using the straight-line method and on an accrual basis, and are recognized under other non-financial
assets.
3.17 Trade and other receivables
The Company’s trade receivables are maintained to obtain contractual cash flows (charge and collect) and do not
contain a significant financing component, being recognized at the transaction price defined in IFRS 15. Meanwhile,
the Company is using the simplified approach for recognizing expected credit losses if there is no significant increase
in the credit risk since initial recognition and the terms of sale are less than 12 months. Similarly, the Company is
using an impairment model for trade receivables based on expected credit losses that considers the credit risk
separately from its hedges, generating an effect equal to that established in the previous accounting standard IAS 39.
The Company has established the procedures and controls for beginning to apply IFRS 9 as of January 1, 2018.

10) FINANCIAL REPORTS
168
Note 3 Significant accounting policies (continued)
3.18 Inventory measurement
The Company measures inventories at the lower of production cost and net realizable value. The cost price of finished
products and work in progress includes the direct cost of materials and, when applicable, labor costs, the depreciation
of goods that are involved in the production process, the indirect costs incurred in transforming raw materials into
finished products, and general expenses incurred in carrying inventories to their current location and conditions. The
method used to determine the cost of inventories is the weighted average monthly cost and the average cost of
warehouse storage.
Commercial discounts, rebates obtained, and other similar entries are deducted when determining the acquisition price.
The net realizable value represents the estimate of the sales price, less all the estimated costs involved in making the
finished product and the costs that will be incurred in the commercialization, sales, and distribution processes.
The Company conducts an evaluation of the net realizable value of inventories at the end of each year, recording an
estimate with a charge to profit or loss when the inventory costs exceed the realizable value. This estimate is made
for all the finished and intermediate products in the Company’s inventory. The valuation of obsolete, impaired or
slow-moving products relates to their estimated net realizable value.
The provisions for uncertainties in the technical specifications for the Company’s stocks of finished goods and work
in progress have been made based on a technical study which covers the different variables that affect products in
stock (such as density and humidity). This study is updated periodically to include new measurement technologies
and the results from previous financial periods.
Inventories of raw materials, supplies, materials and parts are recorded at the lower of acquisition cost or market value.
The acquisition cost is calculated according to the average acquisition price method. Nonetheless, an estimate is made
for each financial period of the potential lower value of that proportion of the inventory that consists of obsolete,
defective or slow-moving materials. This provision reduces the value of the Company’s raw materials, supplies,
materials and parts.
3.19 Investments in associates and joint ventures
Interests in companies over which joint control is exercised (joint venture) or where an entity has a significant
influence (associates) are recognized using the equity method of accounting. Significant influence is presumed to exist
when interest greater than 20% is held in the capital of an investee.
Under this method, the investment is recognized in the statement of financial position at cost plus changes, subsequent
to the acquisition, and considering the proportional share in the equity of the associate. For such purposes, the interest
percentage in the ownership of the associate is used. The associated goodwill acquired is included in the carrying
amount of the investee and is not amortized. The debit or credit to profit or loss reflects the proportional share in the
profit or loss of the associate.

10) FINANCIAL REPORTS
169
Note 3 Significant accounting policies (continued)
3.19 Investments in associates and joint ventures, continued
Unrealized gains for transactions with affiliates or associates are eliminated according to the Company’s interest
percentage in such entities. Unrealized losses are also eliminated, except if the transaction provides evidence of
impairment loss of the transferred asset.
Changes in the equity of associates are recognized on a proportional basis with a charge or credit to “Other reserves”
and classified according to their origin.
Reporting dates of the associate, the Company and related policies are similar for equivalent transactions and events
under similar circumstances.
In the event that the significant influence is lost or the investment is sold or is held as available for sale, the equity
method is discontinued, suspending the recognition of the proportional share of profit or loss.
If the resulting amount according to the equity method is negative, the share of profit or loss is reflected as zero in the
consolidated financial statements, unless a commitment exists by the Company to reinstate the Company’s equity
position, in which case the related provision for risks and expenses is recorded.
Dividends received by these companies are recorded by reducing the equity value, and the proportional share of profit
or loss recognized according to the equity share are included in the consolidated profit or loss accounts in the caption
“Equity share of profit (loss) of associates and joint ventures that are accounted for using the equity method of
accounting”.
3.20 Transactions with non-controlling interests
Non-controlling interests are recorded in the consolidated statement of financial position within equity, but separate
from equity attributable to the owners of the Parent.
3.21 Related party transactions
Transactions between the Company and its subsidiaries are part of the Company’s normal operations within its scope
of business activities. Conditions for such transactions are those normally effective for those types of operations with
regard to terms and market prices. These transactions have been eliminated in consolidation. The expiration conditions
vary according to the originating transaction.

10) FINANCIAL REPORTS
170
Note 3 Significant accounting policies (continued)
3.22 Property, plant and equipment
The assets tangible property, plant and equipment assets are stated at acquisition cost, net of the related accumulated
depreciation, amortization and impairment losses that they might have experienced.
In addition to the price paid for the acquisition of tangible property, plant and equipment, the Company has considered
the following concepts as part of the acquisition cost, as applicable:
1. Accrued interest expenses during the construction period that are directly attributable to the acquisition,
construction or production of qualifying assets, which are those that require a substantial period prior to being ready
for use. The interest rate used is that related to the project’s specific financing or, should this not exist, the average
financing rate of the investor company.
2. The future costs that the Company will have to experience, related to the closure of its facilities at the end of
their useful life, are included at the present value of disbursements expected to be required to settle the obligation.
Construction-in-progress is transferred to property, plant and equipment in operation once the assets are available for
use and the related depreciation and amortization begins on that date.
Extension, modernization or improvement costs that represent an increase in productivity, ability or efficiency or an
extension of the useful lives of property, plant and equipment are capitalized as a higher cost of the related assets. All
the remaining maintenance, preservation and repair expenses are charged to expense as they are incurred.
The replacement of full assets, which increase the asset’s useful life or its economic capacity, are recorded as a higher
value of property, plant and equipment with the related derecognition of replaced or renewed elements.
Gains or losses which are generated from the sale or disposal of property, plant and equipment are recognized as
income (or loss) in the period, and calculated as the difference between the asset’s sales value and its net carrying
value.
Costs derived from the daily maintenance of property, plant and equipment are recognized when incurred.

10) FINANCIAL REPORTS
171
Note 3 Significant accounting policies (continued)
3.23 Depreciation of property, plant and equipment
Property, plant and equipment are depreciated through the straight-line distribution of cost over the estimated technical
useful life of the asset, which is the period in which the Company expects to use the asset. When components of one
item of property, plant and equipment have different useful lives, they are recorded as separate assets. Useful lives are
reviewed on an annual basis.
In the case of mobile equipment, depreciation is performed depending on the hours of operation
The useful lives used for the depreciation and amortization of assets included in property, plant and equipment in
years are presented below.
Classes of property, plant and equipment Minimum life or
rate (years)
Maximum life or
rate (years) Mining assets 3 10
Energy generating assets 3 16
Buildings 3 30
Supplies and accessories 2 15
Office equipment 3 20
Transport equipment 3 20 Network and communication equipment 2 15
IT equipment 2 15
Machinery, plant and equipment 2 20
Other property, plant and equipment 1 26
3.24 Goodwill
Goodwill acquired represents the excess in acquisition cost on the fair value of the Company's ownership of the net
identifiable assets of the subsidiary on the acquisition date. Goodwill acquired related to the acquisition of subsidiaries
is included in goodwill, which is subject to impairment tests annually or more frequently if events or changes in
circumstances indicate that it might be impaired, and is stated at cost less accumulated impairment losses. Gains and
losses related to the sale of an entity include the carrying value of goodwill related to the entity sold.
This intangible asset is assigned to cash-generating units with the purpose of testing impairment losses. It is allocated
based on cash-generating units expected to obtain benefits from the business combination from which the
aforementioned goodwill acquired arose.

10) FINANCIAL REPORTS
172
Note 3 Significant accounting policies (continued)
3.25 Intangible assets other than goodwill
Intangible assets mainly relate to water rights, rights issues, electric line easement expenses and software license and
development expenses.
(a) Water rights
Water rights acquired by the Company relate to water from natural sources and are recorded at acquisition cost. Given
that these assets represent legal rights granted in perpetuity to the Company, they are not amortized, but are subject to
annual impairment tests.
(b) Rights of way for electric lines
As required for the operation of industrial plants, the Company has paid rights of way in order to install wires for the
different electric lines on third party land. These rights are presented under intangible assets. Amounts paid are
capitalized at the date of the agreement and charged to the statement of income, according to the life of the right of
way.
(c) Computer software
Licenses for IT programs acquired are capitalized based on their acquisition and customization costs. These costs are
amortized over their estimated useful lives.
Expenses related to the development or maintenance of IT programs are recognized as an expense as and when
incurred. Costs directly related to the production of unique and identifiable IT programs controlled by the Group, and
which will probably generate economic benefits that are higher than its costs during more than a year, are recognized
as intangible assets. Direct costs include the expenses of employees who develop information technology software
and general expenses in accordance with corporate charges received.
The costs of development for IT programs recognized as assets are amortized over their estimated useful lives.
(d) Mining property and concession rights
The Company holds mining property and concession rights from the Chilean Government. Property rights are usually
obtained at no initial cost (other than the payment of mining patents and minor recording expenses) and once the rights
on these concessions have been obtained, they are retained by the Company while annual patents are paid. Such
patents, which are paid annually, are recorded as prepaid assets and amortized over the following twelve months.
Amounts attributable to mining concessions acquired from third parties that are not from the Chilean Government are
recorded at acquisition cost within intangible assets.
No impairment of intangible assets exists as of December 31, 2017 and December 31, 2016.

10) FINANCIAL REPORTS
173
Note 3 Significant accounting policies (continued)
3.26 Research and development expenses
Research and development expenses are charged to profit or loss in the period in which the expenditure was incurred.
3.27 Prospecting expenses
The Company has mining property and concession rights from the Chilean Government and others that it has acquired
from third parties other than the Chilean Government, destined to the exploitation of caliche ore and saltpeter deposits
and also the exploration of these types of deposits.
Upon obtaining these rights, the Company initially records disbursements directly associated with the exploration and
evaluation of deposits (associated with small deposits with trading feasibility) as asset at cost. Such disbursements
include the following concepts:
- Disbursements for geological reconnaissance evaluation
- Disbursements for drilling
- Disbursements for drilling work and sampling
- Disbursements for activities related to technical assessment and trading feasibility of drilling work
- And any disbursement directly related to specific projects where its objective is finding mining resources.
Subsequently, the Company distinguishes exploration and evaluation projects according to the economic feasibility
of the mineral extracted in the area or exploration, among those that finally will deliver future benefits to the Company
(profitable projects) and those projects that are unlikely to bring profit to the Company in the future (i.e., when the ore
grade at the site is low and its exploitation is not economically profitable).
If technical studies determine that the ore grade is not economically suitable for exploitation, the asset is directly
expensed. Otherwise, it is held in the caption “other non-current assets”, reclassifying the portion related to the area
to be exploited in the year in the caption inventories and such amount is amortized as production cost on the basis of
estimated tons to be extracted.
The technical reasons for this classification correspond to the fact that this is an identifiable non-monetary asset that
is owned to be used in the production of our processes as a main raw material.
For this reason and because our disbursements correspond to reserves that have proved to be financially feasible and
used as a principal raw material in our production processes, these are presented as inventories that will be exploited
within the commercial year and the remainder as development expenses for small deposits and prospecting expenses
in the caption “other non-current assets”.

10) FINANCIAL REPORTS
174
Note 3 Significant accounting policies (continued)
3.28 Impairment of non-financial assets
Assets subject to depreciation and amortization are also subject to impairment testing, provided that an event or change
in the circumstances indicates that the amounts in the accounting records may not be recoverable. An impairment loss
is recognized for the excess of the book value of the asset over its recoverable amount.
The recoverable amount of an asset is the higher between the fair value of an asset or cash generating unit (“CGU”)
less costs of sales and its value in use, and is determined for an individual asset unless the asset does not generate any
cash inflows that are clearly independent from other assets or groups of assets.
When the carrying value of an asset exceeds its recoverable amount, the asset is considered an impaired asset and is
reduced to its net recoverable amount.
In evaluating value in use, estimated future cash flows are discounted using a pre-tax discount rate that reflects current
market assessment, the value of money over time and the specific asset risks.
To determine the fair value less costs to sell, an appropriate valuation model is used.
Impairment losses from continuing operations are recognized with a debit to profit or loss in the categories of expenses
associated with the impaired asset function, except for properties reevaluated previously where the revaluation was
taken to equity.
For assets other than acquired goodwill, an annual evaluation is carried out to determine whether any previously
recognized impairment losses have already decreased or ceased to exist. If this should be the case, the recoverable
amount is estimated. A previously recognized impairment loss is only reversed if there have been changes in the
estimates used to determine the asset’s recoverable amount since the last time an impairment loss was recognized. If
this is the case, the carrying value of the asset is increased to its recoverable amount. This increased amount cannot
exceed the carrying value that would have been determined, net of depreciation, if an asset impairment loss had not
been recognized in prior years. This reversal is recognized with a credit to profit or loss.
3.29 Minimum dividend
As required by the Shareholders’ Corporations Act, unless decided otherwise by a unanimous vote by the shareholders
of subscribed and paid shares, a public company must distribute dividends as agreed by the shareholders at the General
Shareholders’ Meeting held each year. This must entail a minimum of 30% of its profits, except when the Company
records unabsorbed losses from prior years. However, the Company has set a policy to distribute 50% of its profits
for the year, unless decided otherwise by a unanimous vote by the shareholders at the General Shareholders´ meeting
held each year.
At an extraordinary meeting held on April 11, 2017, the Company’s Board of Directors made a recommendation for
discussion at the Ordinary Shareholders’ Meeting (the Meeting), which was held on April 28, 2017, that the Company
should distribute and pay dividends based on 100% of the Company’s net profit for distribution for the financial year
2016. This recommendation was accepted by the Meeting.

10) FINANCIAL REPORTS
175
Note 3 Significant accounting policies (continued)
3.29 Minimum dividend, continued
For 2017, the Company has defined the following dividend policy: (a) To distribute and pay a dividend to the
respective shareholders, a percentage of the profits to be determined as follows:
(i) 100% of the profit for 2017 if all the following financial parameters are met: (a) that the total of cash and cash
equivalents and other current financial assets (“Cash”) divided by the addition of other current financial liabilities (the
“Short-term Financial Liabilities”) is equal to or more than 2.5 times, and (b) the total of current liabilities and non-
current liabilities (“Total Liabilities”) divided by total equity (“Equity”) is equal to or less than 1.1 times.
(ii) 80% of profit for 2017 if all the following financial parameters are met: (a) that Cash divided by Short-term
Financial Liabilities is equal to or more than 2.0 times, and (b) Total Liabilities divided by Total Equity is equal to or
less than 1.2 times.
(iii) 60% of profit for 2017 if all the following financial parameters are met: (a) that Cash divided by Short-term
Financial Liabilities is equal to or more than 1.5 times, and (b) Total Liabilities divided by Total Equity is equal to or
less than 1.3 times. Should none of these parameters be met, the Company will distribute and pay as dividend 50% of
the profit for 2017 to the respective shareholders.
3.30 Earnings per share
The basic earnings per share amounts are calculated by dividing the profit for the year attributable to the ordinary
owners of the parent by the weighted average number of ordinary shares outstanding during the year.
The Company has not conducted any type of operation of potential dilutive effect that would entail the disclosure of
diluted earnings per share.
3.31 Trade and other payables
Trade and other payables are measured at fair value plus all costs associated with the transaction. Subsequently, these
are carried out at amortized cost using the effective interest rate method.
3.32 Interest-bearing borrowings
At initial recognition, interest-bearing borrowings are measured at fair value net of transaction costs incurred.
Subsequently, they are measured at amortized cost using the effective interest rate method. Amortized cost is
calculated considering any premium or discount from the acquisition and includes costs of transactions which are an
integral part of the effective interest rate.
These are recorded as non-current when their expiration period exceeds twelve months and as current when the term
is lower than such term. Interest expense is calculated in the year in which it is accrued following a financial criterion.

10) FINANCIAL REPORTS
176
Note 3 Significant accounting policies (continued)
3.33 Other provisions
Provisions are recognized when:
- The Company has a present obligation or constructive obligation as the result of a past event.
- It is more likely than not that certain resources must be used, including benefits, to settle the obligation.
- A reliable estimate can be made of the amount of the obligation.
In the event that the provision or a portion of it is reimbursed, the reimbursement is recognized as a separate asset
solely if there is certainty of income.
In the consolidated statement of income, the expense for any provision is presented net of any reimbursement.
Should the effect of the value of money over time be significant, provisions are discounted using a discount rate before
tax that reflects the liability’s specific risks. When a discount rate is used, the increase in the provision over time is
recognized as a finance cost.
The Company’s policy is to maintain provisions to cover risks and expenses based on a better estimate to deal with
possible or certain and quantifiable responsibilities from current litigation, compensations or obligations, pending
expenses for which the amount has not yet been determined, collaterals and other similar guarantees for which the
Company is responsible. These are recorded at the time the responsibility or the obligation that determines the
compensation or payment is generated.

10) FINANCIAL REPORTS
177
Note 3 Significant accounting policies (continued)
3.34 Obligations related to employee termination benefits and pension commitments
Obligations towards the Company’s employees comply with the provisions of the collective bargaining agreements
in force, which are formalized through collective employment agreements and individual employment contracts,
except for the United States, which is regulated in accordance with employment plans in force up to 2002. (See more
details in Note 15.4)
These obligations are valued using actuarial calculations, according to the projected unit credit method which
considers such assumptions as the mortality rate, employee turnover, interest rates, retirement dates, effects related to
increases in employees’ salaries, as well as the effects on variations in services derived from variations in the inflation
rate. The criteria in force contained in the revised IAS 19 are also taken into account.
Actuarial gains and losses that may be generated by variations in defined, pre-established obligations are directly
recorded in other comprehensive income.
Actuarial losses and gains have their origin in departures between the estimate and the actual behavior of actuarial
assumptions or in the reformulation of established actuarial assumptions.
The discount rate used by the Company for calculating the obligation was 5.111% and 4.522% for the periods ended
December 31, 2017 and December 31, 2016, respectively.
The Company’s subsidiary SQM North America has established pension plans for its retired employees that are
calculated by measuring the projected obligation using a net salary progressive rate net of adjustments for inflation,
mortality and turnover assumptions, deducting the resulting amounts at present value using a 3.75% interest rate for
2017 and 4.5% for 2016. The net balance of this obligation is presented under the non-current provisions for employee
benefits (refer to Note 15.4).
3.35 Compensation plans
Compensation plans implemented through benefits provided in share-based payments settled in cash are recognized
in the financial statements at their fair value, in accordance with International Financial Reporting Standards No. 2
"Share-based Payments.” Changes in the fair value of options granted are recognized with a charge to payroll on a
straight-line basis during the period between the date on which these options are granted and the payment date (see
Note 16).

10) FINANCIAL REPORTS
178
Note 3 Significant accounting policies (continued)
3.36 Revenue recognition
Revenue includes the fair value of considerations received or receivable for the sale of goods and services during the
performance of the Company's activities. Revenue is presented net of value added tax, estimated returns, rebates and
discounts and after the elimination of sales among subsidiaries.
Revenue is recognized when its amount can be stated reliably, it is probable that the future economic rewards will
flow to the entity and it meets the specific conditions for each type of activity-related revenue, as follows:
(a) Sale of goods
The sale of goods is recognized when the Company has delivered products to the customer, and there is no obligation
pending compliance that could affect the acceptance of products by the customer. The delivery does not occur until
products have been shipped to the customer or confirmed as received by the customer, and the related risks of
obsolescence and loss have been transferred to the customer and the customer has accepted the products in accordance
with the conditions established in the sale, when the acceptance period has ended, or when there is objective evidence
that those criteria required for acceptance have been met.
Sales are recognized in consideration of the price set in the sales agreement, net of volume discounts and estimated
returns at the date of the sale. Volume discounts are evaluated in consideration of annual foreseen purchases and in
accordance with the criteria defined in agreements.
(b) Sale of services
Revenue associated with the rendering of services is recognized considering the degree of completion of the service
as of the date of presentation of the consolidated classified statement of financial position, provided that the result
from the transaction can be estimated reliably.
(c) Interest income
Interest income is recognized when interest is accrued in consideration of the principal pending payment using the
effective interest rate method.
(d) Income from dividends
Income from dividends is recognized when the right to receive the payment is established.
3.37 Finance income and finance costs
Finance income is mainly composed of interest income in financial instruments such as term deposits and mutual fund
deposits. Interest income is recognized in profit or loss at amortized cost, using the effective interest rate method.
Finance costs are mainly composed of interest on bank borrowing expenses, interest on bonds issued and interest
capitalized for borrowing costs for the acquisition, construction or production or qualifying assets.
Borrowing costs and bonds issued are recognized in profit or loss using the effective interest rate method.

10) FINANCIAL REPORTS
179
Note 3 Significant accounting policies (continued)
3.37 Finance income and finance costs, continued
For finance costs accrued during the construction period that are directly attributable to the acquisition, construction
or production of qualifying assets, the effective interest rate related to the project’s specific financing is used. If none
exists, the average financing rate of the subsidiary making the investment is utilized.
Borrowing and financing costs that are directly attributable to the acquisition, construction or production of an asset
are capitalized as part of that asset’s cost.
3.38 Income tax and deferred taxes
Corporate income tax for the year is determined as the sum of current taxes from the different consolidated companies.
Current taxes are based on the application of the various types of taxes attributable to taxable income for the year.
Differences between the book value of assets and liabilities and their tax basis generate the balance of deferred tax
assets or liabilities, which are calculated using the tax rates expected to be applicable when the assets and liabilities
are realized.
In conformity with current Chilean tax regulations, the provision for corporate income tax and taxes on mining activity
is recognized on an accrual basis, presenting the net balances of accumulated monthly tax provisional payments for
the fiscal period and associated credits. The balances of these accounts are presented in current income taxes
recoverable or current taxes payable, as applicable.
Tax on companies and variations in deferred tax assets or liabilities that are not the result of business combinations
are recorded in the statement of income accounts or equity accounts in the consolidated statement of financial position,
considering the origin of the gains or losses which have generated them.
At each reporting period, the carrying amount of deferred tax assets has been reviewed and reduced to the extent where
there will not be sufficient taxable income to allow the recovery of all or a portion of the deferred tax assets. Likewise,
as of the date of the consolidated financial statements, deferred tax assets that are not recognized were evaluated and
not recognized as it was more likely than not that future taxable income will allow for recovery of the deferred tax
asset.
With respect to deductible temporary differences associated with investments in subsidiaries, associated companies
and interest in joint ventures, deferred tax assets are recognized solely provided that it is more likely than not that the
temporary differences will be reversed in the near future and that there will be taxable income with which they may
be used.
The deferred income tax related to entries directly recognized in equity is recognized with an effect on equity and not
with an effect on profit or loss.
Deferred tax assets and liabilities are offset if there is a legally receivable right of offsetting tax assets against tax
liabilities and the deferred tax is related to the same tax entity and authority.

10) FINANCIAL REPORTS
180
Note 3 Significant accounting policies (continued)
3.39 Segment reporting
IFRS 8 requires that companies adopt a “management approach” to disclose information on the operations generated
by its operating segments. In general, this is the information that management uses internally for the evaluation of
segment performance and making the decision on how to allocate resources for this purpose.
An operating segment is a group of assets and operations responsible for providing products or services subject to
risks and performance that are different from those of other business segments. A geographical segment is responsible
for providing products or services in a given economic environment subject to risks and performance that are different
from those of other segments operating in other economic environments.
For assets and liabilities, the allocation to each segment is not possible given that these are associated with more than
one segment, except for depreciation, amortization and impairment of assets, which are directly allocated to the
applicable segments, in accordance with the criteria established in the costing process for product inventories.
The following operating segments have been identified by the Company:
- Specialty plant nutrients
- Industrial chemicals
- Iodine and derivatives
- Lithium and derivatives
- Potassium
- Other products and services

10) FINANCIAL REPORTS
181
Note 3 Significant accounting policies (continued)
3.40 Responsibility for Information and Estimates Made
The Management of Sociedad Química y Minera de Chile S.A. and its subsidiaries is responsible for the information
contained in these consolidated financial statements, which expressly indicate that all the principles and criteria
included in IFRS, as issued by the International Accounting Standards Board (IASB), have been applied in full.
In preparing the consolidated financial statements of Sociedad Química y Minera de Chile S.A. and its subsidiaries,
Management has made judgments and estimates to quantify certain assets, liabilities, revenues, expenses and
commitments included therein. Basically, these estimates refer to:
- The useful lives of property, plant and equipment, and intangible assets and their residual value
Estimated useful lives are determined based on current facts and past experience, and take into
consideration the anticipated physical life of the asset, the potential for technological obsolescence, and
regulations. See notes 3.22, 13 and 14.
- Impairment losses of certain assets - Assets, including property, plant and equipment, exploration assets,
goodwill and intangible assets are reviewed for impairment whenever events or changes in circumstances
indicate that their carrying amounts exceed their recoverable amounts. If an impairment assessment is
required, the assessment of fair value often requires estimates and assumptions such as discount rates,
exchange rates, commodity prices, future capital requirements and future operating performance.
Changes in such estimates could impact the recoverable values of these assets. Estimates are reviewed
regularly by management. See notes 13 and 14.
- Assumptions used in calculating the actuarial amount of pension-related and severance indemnity
payment benefit commitments. See Note 15.
- Contingencies – The amount recognized as a provision, including legal, contractual, constructive and
other exposures or obligations, is the best estimate of the consideration required to settle the related
liability, including any related interest charges, taking into account the risks and uncertainties
surrounding the obligation. In addition, contingencies will only be resolved when one or more future
events occur or fail to occur. Therefore, the assessment of contingencies inherently involves the exercise
of significant judgment and estimates of the outcome of future events. The Company assesses its
liabilities and contingencies based upon the best information available, relevant tax laws and other
appropriate requirements. See notes 18 and 19.
- Provisions on the basis of technical studies that cover the different variables affecting products in stock
(density and moisture, among others), and related allowance.
- Obsolescence to ensure that the carrying value of inventory is not in excess of the net realizable Inventory
valuation requires judgment to determine obsolescence and estimates of provisions for value. See note
8.
Despite the fact that these estimates have been made on the basis of the best information available on the date of
preparation of these consolidated financial statements, certain events may occur in the future and oblige their
amendment (upwards or downwards) over the next few years, which would be made prospectively, recognizing the
effects of the change in estimates in the related future consolidated financial statements.

10) FINANCIAL REPORTS
182
Note 3 Significant accounting policies (continued)
3.41 Environment
In general, the Company follows the criteria of considering amounts used in environmental protection and
improvement as environmental expenses. However, the cost of facilities, machinery and equipment used for the same
purpose are considered property, plant and equipment, as the case may be.
Note 4 Financial risk management
4.1 Financial risk management policy
The Company’s financial risk management policy is focused on safeguarding the stability and sustainability of
Sociedad Química y Minera de Chile S.A. and its subsidiaries with regard to all such relevant financial uncertainty
components.
The Company’s operations are subject to certain financial risk factors that may affect its financial position or results.
The most significant risk exposures are market risk, liquidity risk, currency risk, doubtful accounts risk, and interest
rate risk, among others.
There could also be additional risks, which are either unknown or known but not currently deemed to be significant,
which could also affect the Company’s business operations, its business, financial position, or profit or loss.
The financial risk management structure includes identifying, determining, analyzing, quantifying, measuring and
controlling these events. Management and, in particular, Finance Management, is responsible for constantly assessing
the financial risk. The Company uses derivatives to hedge a significant portion of those risks.

10) FINANCIAL REPORTS
183
Note 4 Financial risk management, continued
4.2 Risk factors
4.2.1 Market risk
Market risk refers to the uncertainty associated with fluctuations in market variables affecting the Company’s assets
and liabilities, including:
a) Price risk: The Company’s product prices are affected by the fluctuations in international prices of fertilizers
and chemicals, as well as changes in production capacities or market demand, all of which might affect the
Company’s business, financial position and results of operations.
b) Commodity price risk: The Company is exposed to changes in commodity prices and energy which may have
an impact on its production costs that may cause unstable results.
At present, the SQM Group incurs an annual expenditure of approximately US$117 million associated with
fuel, gas, energy and equivalents, of which US$77 million is related to direct electricity consumption. A change
of 10% in the prices of energy required for the Company’s operations may involve costs of approximately
US$12 million in short-term movements.
The markets in which the Company operates are unpredictable, exposed to significant fluctuations in supply
and demand, and high price volatility. Additionally, the supply of certain fertilizers or chemicals, including
certain products in which the Company trades vary, mainly depending on the production of top producers and
their related business strategies. Accordingly, the Company cannot forecast with certainty changes in demand,
responses from competitors or fluctuations in the final price of its products. These factors can lead to
significant impacts on the Company’s product sales volumes, financial position and share price.
c) Quality standards: In the markets in which we operate, customers might impose quality standards on our
products and/or governments could enact more stringent standards for the distribution and/or use of our
products. Consequently, we might not be able to sell our products if we are not able to meet those new
standards. In addition, our production costs might increase to meet such new standards. Not being able to sell
our products in one or more markets or to key customers might significantly affect our business, financial
position or the results of our operations.

10) FINANCIAL REPORTS
184
Note 4 Financial risk management, continued
4.2.2 Credit risk
A contraction of the global economy and the potentially adverse effects in the financial position of our customers may
extend the receivables recovery period for SQM, increasing its exposure to doubtful account risk. While measures
have been taken to minimize such risk, the global economic situation may result in losses that might have a material
adverse effect on the Company’s business, financial position or results of operations.
To mitigate these risks, SQM actively controls debt collection and has established certain safeguards which include
loan insurance, letters of credit, and prepayments for a portion of receivables.
Financial investments correspond to time deposits with maturities exceeding 90 days and less than 360 days from the
investment date, so they are not exposed to significant market risks.
The credit quality of financial assets that are neither past due nor impaired can be assessed by reference to external
credit ratings (if available) or to historical information about counterparty default rates:
Financial institution Financial assets Rating Institution 12/31/2017
Moody´s S&P Fitch
ThUS$
Banco BBVA Chile Time deposits P-2 A-2 - 41,860
Banco Crédito e Inversiones Time deposits P-1 A-1- F-1+ 120,616
Banco Santander - Santiago Time deposits P-1 A-1 F-1 35,558 BBVA Banco Francés Time deposits - - - 163
Itau-Corpbanca Time deposits P-2 A-2 - 75,072
JP Morgan US dollar Liquidity Fund Institutional Investment fund deposits - - - 143,333 Legg Mason - Western Asset Institutional Cash
Reserves Investment fund deposits - - -
144,464
Scotiabank Sud Americano Time deposits - - - 12,520 Nedbank Time deposits P-3 B - 3,686
ABN Armo Bank Time deposits - 1,439
Total 578,711
Financial institution Financial assets Rating Institution 12/31/2017
Moody´s S&P Fitch ThUS$
Banco BBVA Chile 90 days to 1 year - - - 1,207
Banco Crédito e Inversiones 90 days to 1 year P-1 A-1 F-1 71,748 Banco de Chile 90 days to 1 year - - - 4,834
Itau-Corpbanca 90 days to 1 year P-1 A-2 - 77,526
Banco Santander - Santiago 90 days to 1 year P-1 A-1 F-1 163,269 Morgan Stanley 90 days to 1 year P-2 A-2 F-1 4,191
Banco Security 90 days to 1 year - - - 28,592
Scotiabank Sud Americano 90 days to 1 year - - - 13,765
Total 365,132

10) FINANCIAL REPORTS
185
Note 4 Financial risk management, continued
4.2.3 Currency risk
As a result of its influence on price level determination as well as its relationship with cost of sales, and since a
significant portion of the Company’s business transactions are performed in that foreign currency, the functional
currency of SQM is the United States dollar. However, the global business activities of the Company expose it to the
foreign exchange fluctuations of several currencies with respect to the value of the U.S. dollar. Accordingly, SQM
has entered into hedge contracts to mitigate the exposure generated by its main mismatches (assets, net of liabilities)
in currencies other than the U.S. dollar against foreign exchange fluctuation. These contracts are periodically updated
depending on the mismatch amount to be hedged in such currencies. Occasionally, and subject to the Board of
Directors’ approval, in the short-term the Company insures cash flows from certain specific items in currencies other
than the U.S. dollar.
A significant portion of the Company’s costs, particularly payroll, is denominated in Chilean pesos. Accordingly, an
increase or decrease in the exchange rate against the U.S. dollar would affect the Company’s profit for the period.
Approximately US$370 million of the Company’s costs are denominated in Chilean pesos. A significant portion of
the effect of such obligations on the statement of financial position is hedged by derivative instrument transactions on
the balance mismatch in such currency.
As of December 31, 2017, the Company recorded derivative instruments classified as currency and interest rate hedges
associated with all the bonds payable, denominated in UF, with a fair value of US$5 million against SQM. As of
December 31, 2016, this amounts to US$41 million against SQM.
As of December 31, 2017, the Chilean peso to U.S. dollar exchange rate was Ch$614.75 per US$1.00 (Ch$ 669.47
per US$ 1.00 as of December 31, 2016).

10) FINANCIAL REPORTS
186
Note 4 Financial risk management, continued
4.2.4 Interest rate risk
Interest rate fluctuations, primarily due to the uncertain future behavior of markets, may have a material impact on the
financial results of the Company.
The Company has current and non-current debts valued at the LIBOR rate, plus a spread. The Company is partially
exposed to fluctuations in this rate, as SQM currently holds hedging derivative instruments to hedge a portion of its
liabilities subject to LIBOR rate fluctuations.
As of December 31, 2017, the Company has no financial liabilities linked to variations in the LIBOR rate and,
therefore, significant increases in that rate would not impact its financial position.
In addition, as of December 31, 2017, the Company's financial liabilities are mainly concentrated in the long-term and
approximately 7% have maturities of less than 12 months, decreasing in the process the exposure to changes in interest
rates.
4.2.5 Liquidity risk
Liquidity risk relates to the funds needed to comply with payment obligations. The Company’s objective is to maintain
financial flexibility through a comfortable balance between fund requirements and cash flows from regular business
operations, bank borrowings, bonds, short term investments, and marketable securities, among others.
The Company has an important capital expense program which is subject to change over time.
On the other hand, world financial markets go through periods of contraction and expansion that are unforeseeable in
the long-term and may affect SQM’s access to financial resources. Such factors may have a material adverse impact
on the Company’s business, financial position and results of operations.
SQM constantly monitors the matching of its obligations with its investments, taking due care of maturities of both,
from a conservative perspective, as part of this financial risk management strategy. As of December 31, 2017, the
Company had unused, available revolving credit facilities with banks, for a total of approximately US$248 million.
The position in other cash and cash equivalents generated by the Company are invested in highly liquid mutual funds
with an AAA risk rating.

10) FINANCIAL REPORTS
187
Note 4 Financial risk management, continued
4.2.5 Liquidity risk, continued
Nature of undiscounted cash flows
As of December 31, 2017 Carrying amount Less than 1 year 1 to 5 years Over 5 years Total
(in millions of US$)
Other non-derivative financial liabilities
Bank borrowings 163.57 164.78 - - 164.78
Unsecured obligations 1,054.89 47.45 522.52 751.67 1,321.64
Subtotal 1,218.46 212.23 522.52 751.67 1,486.42
Other derivative financial liabilities
Hedging liabilities 28.38 37.01 (9.51) (18.36) 9.14
Derivative financial instruments 0.80 0.80 - - 0.80
Subtotal 29.18 37.81 (9.51) (18.36) 9.94
Total 1,247.63 250.04 513.01 733.31 1,496.37
Nature of undiscounted cash flows
As of December 31, 2016 Carrying amount Less than 1 1 to 5 years Over 5 years Total
(in millions of US$)
Other non-derivative financial liabilities
Bank borrowings 101.27 102.08 - - 102.08
Unsecured obligations 1,130.22 94.76 479.54 873.91 1,448.21
Subtotal 1,231.49 196.84 479.54 873.91 1,550.29
Other derivative financial liabilities
Hedging liabilities 42.62 17.20 40.33 (23.58) 33.95
Derivative financial instruments (2.175) (2.18) - - (2.18)
Subtotal 40.445 15.02 40.33 (23.58) 31.77
Total 1,271.94 211.86 519.87 850.33 1,582.06
4.3 Risk measurement
The Company has methods to measure the effectiveness and efficiency of financial risk hedging strategies, both
prospectively and retrospectively. These methods are consistent with the risk management profile of the Group.

10) FINANCIAL REPORTS
188
Note 5 Changes in accounting estimates and policies (consistent presentation)
5.1 Changes in accounting estimates
The Company had no changes in the determination of accounting estimates at the closing date of the consolidated
financial statements. (For more information, see Note 3.40).
5.2 Changes in accounting policies
As of December 31, 2017, the Company’s consolidated financial statements present no changes in accounting policies
or estimates compared to the prior period (for further details refer to Note 3.40).
The consolidated statements of financial position as of December 31, 2017 and December 31, 2016 and the statements
of comprehensive income, changes in equity and cash flows for the periods ended December 31, 2017 and 2016, have
been prepared in accordance with the Standards issued by the Financial Markets Commission, which was formerly
the Chilean Superintendence of Securities and Insurance (SVS), which consider the International Financial Reporting
Standards (IFRS).
The accounting principles and criteria were applied consistently.

10) FINANCIAL REPORTS
189
Note 6 Background of companies included in consolidation
6.1 Parent’s stand-alone assets and liabilities
12/31/2017 12/31/2016
ThUS$ ThUS$
Assets 3,658,528 3,824,137 Liabilities (1,470,707) (1,578,063)
Equity 2,187,821 2,246,074
6.2 Parent entity
As provided in the Company’s by-laws, no shareholder can concentrate more than 32% of the Company’s voting right
shares and therefore there is no controlling entity.
6.3 Joint arrangements of controlling interest
Sociedad de Inversiones Pampa Calichera S.A., Potasios de Chile S.A., and Inversiones Global Mining (Chile) Ltda.,
collectively the Pampa Group, are the owners of a number of shares that as of December 31, 2017 are equivalent to
29.97% of the current total amount of issued, subscribed and fully-paid shares in the Company. In addition, Kowa
Company Ltd., Inversiones La Esperanza (Chile) Limitada, Kochi S.A. and La Esperanza Delaware Corporation,
collectively the Kowa Group, are the owners of a number of shares equivalent to 2.12% of the total amount of issued,
subscribed and fully-paid shares of SQM S.A.
The Pampa Group and the Kowa Group have informed SQM S.A., the Financial Markets Commission (formerly the
Chilean SVS), and the relevant stock exchanges in Chile and abroad that they are not and have never been mutually
related parties. This is independent of the fact that on December 21, 2006 the two Groups entered into a Joint Action
Agreement (JAA) related to those shares. Consequently, neither the Pampa Group nor the Kowa Group individually
owns more than 32% of the voting right capital of SQM S.A.
This Joint Action Agreement has not transformed the Pampa and Kowa Groups into mutually related parties. The
Joint Action Agreement has only transformed the current controller of SQM S.A., composed of the Pampa Group, and
the Kowa Group, into related parties of SQM S.A.
Detail of effective concentration
Tax ID No. Name Ownership interest
%
96,511,530-7 Sociedad de Inversiones Pampa Calichera S.A. 19.72 76,165,311-5 Potasios de Chile S.A. 6.91
96,863,960-9 Inversiones Global Mining (Chile) Limitada 3.34
Total Pampa Group 29.97
79,798,650-k Inversiones la Esperanza (Chile) Ltda. 1.43
59,046,730-8 Kowa Co Ltd. 0.30
96,518,570-4 Kochi S.A. 0.30
59,023,690-k La Esperanza Delaware Corporation 0.09
Total Kowa Group 2.12

10) FINANCIAL REPORTS
190
Note 6 Background of companies included in consolidation (continued)
6.4 General information on consolidated subsidiaries
As of December 31, 2017 and December 31, 2016, the general information of the companies on which the Company exercises control and significant influence
is as follows:
Ownership interest
Subsidiary Tax ID Address Country of
incorporation
Functional
currency
Direct Indirect Total
SQM Nitratos S.A. 96.592.190-7 El Trovador 4285 Las Condes Chile US$ 99.9999 0.0001 100.0000
Proinsa Ltda. 78.053.910-0 El Trovador 4285 Las Condes Chile Ch$ - 60.5800 60.5800
SQMC Internacional Ltda. 86.630.200-6 El Trovador 4285 Las Condes Chile Ch$ - 60.6381 60.6381
SQM Potasio S.A. 96.651.060-9 El Trovador 4285 Las Condes Chile US$ 99.9999 - 99.9999
Serv. Integrales de Tránsito y Transf. S.A. 79.770.780-5 Arturo Prat 1060, Tocopilla Chile US$ 0.0003 99.9997 100.0000
Isapre Norte Grande Ltda. 79.906.120-1 Anibal Pinto 3228, Antofagasta Chile Ch$ 1.0000 99.0000 100.0000
Ajay SQM Chile S.A. 96.592.180-K Av. Pdte. Eduardo Frei 4900, Santiago Chile US$ 51.0000 - 51.0000
Almacenes y Depósitos Ltda. 79.876.080-7 El Trovador 4285 Las Condes Chile Ch$ 1.0000 99.0000 100.0000
SQM Salar S.A. 79.626.800-K El Trovador 4285 Las Condes Chile US$ 18.1800 81.8200 100.0000
SQM Industrial S.A. 79.947.100-0 El Trovador 4285 Las Condes Chile US$ 99.0470 0.9530 100.0000
Exploraciones Mineras S.A. 76.425.380-9 El Trovador 4285 Las Condes Chile US$ 0.2691 99.7309 100.0000
Sociedad Prestadora de Servicios de Salud Cruz del
Norte S.A. 76.534.490-5 Anibal Pinto 3228, Antofagasta Chile Ch$ - 100.0000 100.0000
Soquimich Comercial S.A. 79.768.170-9 El Trovador 4285 Las Condes Chile US$ - 60.6383 60.6383
Comercial Agrorama Ltda. (*) 76.064.419-6 El Trovador 4285 Las Condes Chile US$ - 42.4468 42.4468
Comercial Hydro S.A. 96.801.610-5 El Trovador 4285 Las Condes Chile Ch$ - 60.6383 60.6383
Agrorama S.A. 76.145.229-0 El Trovador 4285 Las Condes Chile Ch$ - 60.6377 60.6377
Orcoma Estudios SPA 76.359.919-1 Apoquindo 3721 Of.131 Las Condes Chile US$ 51.0000 - 51.0000
Orcoma SPA 76.360.575-2 Apoquindo 3721 Of.131 Las Condes Chile US$ 100.0000 - 100.0000
SQM MaG SpA. 76.686.311-9 Los Militares 4290, Las Condes Chile US$ 100.0000 - 100.0000
SQM North America Corp. Foreign 2727 Paces Ferry Road, Building Two, Suite 1425, Atlanta,
GA United States US$ 40.0000 60.0000 100.0000
RS Agro Chemical Trading Corporation A.V.V. Foreign Caya Ernesto O. Petronia 17, Orangestad Aruba US$ 98.3333 1.6667 100.0000
Nitratos Naturais do Chile Ltda. Foreign Al. Tocantis 75, 6° Andar, Conunto 608 Edif. West Gate,
Alphaville Barureri, CEP 06455-020, Sao Paulo Brazil US$ - 100.0000 100.0000
Nitrate Corporation of Chile Ltd. Foreign 1 More London Place London SE1 2AF United Kingdom US$ - 100.0000 100.0000
SQM Corporation N.V. Foreign Pietermaai 123, P.O. Box 897, Willemstad, Curacao Netherlands US$ 0.0002 99.9998 100.0000
SQM Peru S.A. Foreign Avenida Camino Real N° 348 of. 702, San Isidro, Lima Peru US$ 0.9800 99.0200 100.0000
SQM Ecuador S.A. Foreign Av. José Orrantia y Av. Juan Tanca Marengo Edificio
Executive Center Piso 2 Oficina 211 Ecuador US$ 0.0040 99.9960 100.0000
SQM Brasil Ltda. Foreign Al. Tocantis 75, 6° Andar, Conunto 608 Edif. West Gate,
Alphaville Barureri, CEP 06455-020, Sao Paulo Brazil US$ 1.0900 98.9100 100.0000
(*) SQM is the Parent of Soquimich Comercial and the latter is the Parent of Comercial Agrorama Ltda. SQM controls the management of Comercial Agrorama Ltda.

10) FINANCIAL REPORTS
191
Note 6 Background of companies included in consolidation (continued)
6.4 General information on consolidated subsidiaries, continued
Ownership interest
Subsidiary Tax ID Address Country of
incorporation
Functional
currency
Direct Indirect Total
SQI Corporation N.V. Foreign Pietermaai 123, P.O. Box 897, Willemstad, Curacao Netherlands US$ 0.0159 99.9841 100.0000
SQMC Holding Corporation L.L.P. Foreign 2727 Paces Ferry Road, Building Two, Suite 1425, Atlanta United States US$ 0.1000 99.9000 100.0000
SQM Japan Co. Ltd. Foreign From 1st Bldg 207, 5-3-10 Minami- Aoyama, Minato-ku,
Tokyo Japan US$ 0.1597 99.8403 100.0000
SQM Europe N.V. Foreign Houtdok-Noordkaai 25a B-2030 Antwerp, Belgium Belgium US$ 0.5800 99.4200 100.0000
SQM Italia SRL Foreign Via A. Meucci, 5 500 15 Grassina Firenze Italy US$ - 100.0000 100.0000
SQM Indonesia S.A. Foreign Perumahan Bumi Dirgantara Permai, Jl Suryadarma Blok Aw
No 15 Rt 01/09 17436 Jatisari Pondok Gede Indonesia US$ - 80.0000 80.0000
North American Trading Company Foreign 2727 Paces Ferry Road, Building Two, Suite 1425, Atlanta,
GA United States US$ - 100.0000 100.0000
SQM Virginia LLC Foreign 2727 Paces Ferry Road, Building Two, Suite 1425, Atlanta,
GA United States US$ - 100.0000 100.0000
SQM Comercial de México S.A. de C.V. Foreign Av. Moctezuma 144-4 Ciudad del Sol. CP 45050, Zapopan,
Jalisco México Mexico US$ 0.0010 99.9900 100.0000
SQM Investment Corporation N.V. Foreign Pietermaai 123, P.O. Box 897, Willemstad, Curacao Netherlands US$ 1.0000 99.0000 100.0000
Royal Seed Trading Corporation A.V.V. Foreign Caya Ernesto O. Petronia 17, Orangestad Aruba US$ 1.6700 98.3300 100.0000
SQM Lithium Specialties LLP Foreign 2727 Paces Ferry Road, Building Two, Suite 1425, Atlanta,
GA United States US$ - 100.0000 100.0000
Soquimich SRL Argentina Foreign Espejo 65 Oficina 6 – 5500 Mendoza Argentina US$ - 100.0000 100.0000
Comercial Caimán Internacional S.A. Foreign Edificio Plaza Bancomer Calle 50 Panama US$ - 100.0000 100.0000
SQM France S.A. Foreign ZAC des Pommiers 27930 FAUVILLE France US$ - 100.0000 100.0000
Administración y Servicios Santiago S.A. de C.V. Foreign Av. Moctezuma 144-4 Ciudad del Sol. CP 45050, Zapopan,
Jalisco México Mexico US$ - 100.0000 100.0000
SQM Nitratos México S.A. de C.V. Foreign Av. Moctezuma 144-4 Ciudad del Sol. CP 45050, Zapopan,
Jalisco México Mexico US$ - 100.0000 100.0000
SQM Australia PTY Foreign Level 16, 201 Elizabeth Street Sydney Australia Australian
dollar - 100.0000 100.0000
SACAL S.A. Foreign Av. Leandro N. Alem 882, piso 13 Buenos Aires Argentina Argentine
peso - 100.0000 100.0000

10) FINANCIAL REPORTS
192
Note 6 Background of companies included in consolidation (continued)
6.4 General information on consolidated subsidiaries, continued
Ownership interest
Subsidiary Tax ID Address Country of
incorporation
Functional
currency
Direct Indirect Total
Soquimich European Holding B.V. Foreign Loacalellikade 1 Parnassustoren 1076 AZ Amsterdam Netherlands US$ - 100.0000 100.0000
SQM Iberian S.A. Foreign Provenza 251 Principal 1a CP 08008, Barcelona Spain US$ - 100.0000 100.0000
SQM Africa Pty Ltd. Foreign Tramore House, 3 Wterford Office Park, Waterford Drive,
2191 Fourways, Johannesburg South Africa US$ - 100.0000 100.0000
SQM Oceania Pty Ltd. Foreign Level 9, 50 Park Street, Sydney NSW 2000, Sydney Australia US$ - 100.0000 100.0000
SQM Agro India Pvt. Ltd. Foreign C 30 Chiragh Enclave New Delhi, 110048 India US$ - 100.0000 100.0000
SQM Beijing Commercial Co. Ltd. Foreign Room 1001C, CBD International Mansion N 16 Yong An
Dong Li, Jian Wai Ave Beijing 100022, P.R. China US$ - 100.0000 100.0000
SQM Thailand Limited Foreign Unit 2962, Level 29, N° 388, Exchange Tower Sukhumvit
Road, Klongtoey Bangkok Thailand US$ - 99.996 99.996
SQM Colombia SAS Foreign Cra 7 No 32 – 33 piso 29 Pbx: (571) 3384904 Fax: (571)
3384905 Bogotá D.C. – Colombia Colombia US$ - 100.0000 100.0000

10) FINANCIAL REPORTS
193
Note 6 Background of companies included in consolidation (continued)
6.5 Information attributable to non-controlling interests
Subsidiary
% of interests in
the ownership held
by non-controlling
interests.
Profit (loss) attributable to non-
controlling interests
Equity, non-controlling
interests
Dividends paid to non-
controlling interests
12/31/2017 12/31/2016 12/31/2017 12/31/2016 12/31/2017 12/31/2016
ThUS$ ThUS$ ThUS$ ThUS$ ThUS$ ThUS$
Proinsa Ltda. 0.1% - - - - - -
SQM Potasio S.A. 0.0000001% - - - - - -
Ajay SQM Chile S.A. 49% (1,023) 1,360 8,307 8,303 989 1,163
SQM Indonesia S.A. 20% - - 1 1 - -
Soquimich Comercial S.A. 39.3616784% (100) 2,378 49,247 50,416 1,264 1,851
Comercial Agrorama Ltda. 30% 403 (106) (184) 201 - -
Agrorama S.A. 0.001% - - - - - -
Orcoma Estudios SPA 49% - 2 2,277 2,277 - -
SQM (Thailand) Limited. 0.004% - - - - - -
Total (720) 3,634 59,648 61,198 2,253 3,014

10) FINANCIAL REPORTS
194
Note 6 Background of companies included in consolidation (continued)
6.6 Information on consolidated subsidiaries
12/31/2017
Subsidiary
Assets Liabilities Revenue
Profit (loss)
Comprehensiv
e income (loss)
Current Non-current Current Non-current
ThUS$ ThUS$ ThUS$ ThUS$ ThUS$ ThUS$ ThUS$
SQM Nitratos S.A. 353,821 39,144 324,738 4,489 100,626 5,569 5,607
Proinsa Ltda. 59 1 - - - (3) (3)
SQMC Internacional Ltda. 219 - - - - (3) (3)
SQM Potasio S.A. 243,513 951,448 85,279 23,092 4,129 282,442 282,874
Serv. Integrales de Tránsito y Transf. S.A. 27,822 36,606 57,208 1,596 35,210 1,727 1,712
Isapre Norte Grande Ltda. 561 834 590 147 1,952 44 65
Ajay SQM Chile S.A. 17,048 1,143 779 459 23,732 2,088 2,088
Almacenes y Depósitos Ltda. 301 50 1 - - (7) 83
SQM Salar S.A. 760,900 785,082 449,049 186,451 985,654 347,790 348,313
SQM Industrial S.A. 982,835 666,097 618,289 94,135 685,294 48,988 49,011
Exploraciones Mineras S.A. 540 31,691 6,206 - - (55) (55)
Sociedad Prestadora de Servicios de Salud Cruz del Norte
S.A. 372 624
551 353
887
43
27
Soquimich Comercial S.A. 159,943 14,395 46,180 4,632 117,745 254 277
Comercial Agrorama Ltda. 9,977 1,852 12,388 54 13,061 (1,342) (1,341)
Comercial Hydro S.A. 4,944 41 63 11 30 140 140
Agrorama S.A. 11,343 625 14,956 78 14,275 (2,041) (2,059)
Orcoma SpA - 2,360 14 - - - -
Orcoma Estudio SpA 341 4,356 50 - - - -
Compañia Minera Arfwedon SPA 10 - - - - - -
SQM North America Corp. 131,452 15,442 162,180 782 250,522 (1,384) (1,652)
RS Agro Chemical Trading Corporation A.V.V. 5,164 - 23 - - (30) (30)
Nitratos Naturais do Chile Ltda. - 141 3,451 - - (111) (111)
Nitrate Corporation of Chile Ltd. 5,076 - - - - - -
SQM Corporation N.V. 668 133,876 3,575 - - 21,089 21,065
SQM Perú S.A. 270 - 1,166 - - 24 24
SQM Ecuador S.A. 21,642 116 19,651 80 26,025 622 622
SQM Brasil Ltda. 187 - 663 2,345 336 (42) (42)
SQI Corporation N.V. 16 26 61 - - (1) (1)
SQMC Holding Corporation L.L.P. 24,600 15,193 1,000 - - 2,263 2,263
SQM Japan Co. Ltd. 43,656 302 40,992 626 114,006 (2,168) (2,168)

10) FINANCIAL REPORTS
195
Note 6 Background of companies included in consolidation (continued)
6.6 Information on consolidated subsidiaries, continued
12/31/2017
Subsidiary Assets Liabilities
Revenue
Profit (loss) Comprehensiv
e income (loss) Current Non-current Current Non-current
ThUS$ ThUS$ ThUS$ ThUS$ ThUS$ ThUS$ ThUS$
SQM Europe N.V. 399,601 2,599 339,910 - 923,087 11,097 11,097
SQM Italia SRL 1,216 - 16 - - (3) (3)
SQM Indonesia S.A. 4 - 1 - - - -
North American Trading Company 158 145 39 - - - -
SQM Virginia LLC 14,807 14,348 14,807 - - (8) (8)
SQM Comercial de México S.A. de C.V. 92,961 2,288 64,318 - 193,523 4,381 4,381
SQM Investment Corporation N.V. 52,639 86 12,955 866 - (7,198) (7,198)
Royal Seed Trading Corporation A.V.V. 31,040 - 49,818 - - 2,348 2,348
SQM Lithium Specialties LLP 15,755 3 1,264 - - (8) (8)
Soquimich SRL Argentina 168 - 173 - - (37) (37)
Comercial Caimán Internacional S.A. 262 - 1,122 - - 3 3
SQM France S.A. 345 6 114 - - - -
Administración y Servicios Santiago S.A. de C.V. 162 86 531 58 2,813 47 47
SQM Nitratos México S.A. de C.V. 49 8 30 7 301 6 6
Soquimich European Holding B.V. 53,664 137,393 71,761 1,493 - 18,476 18,452
SQM Iberian S.A. 57,241 1,720 48,891 - 175,936 119 119
SQM Africa Pty Ltd. 76,888 1,514 70,561 - 101,152 1,135 1,135
SQM Oceanía Pty Ltd. 4,151 - 2,033 - 2,045 301 301
SQM Agro India Pvt. Ltd. - - - - - - -
SQM Beijing Commercial Co. Ltd. 8,804 16 6,518 - 3,691 151 151
SQM Thailand Limited 12,113 5 9,128 - 5,694 43 43
SQM Colombia SAS 278 131 33 - - (271) (271)
SQM Australia Pty 854 24,800 - - - - -
Sacal S.A. 6 - - - - - -
Total 3,630,466 2,886,593 2,543,126 321,754 3,781,726 736,478 737,264

10) FINANCIAL REPORTS
196
Note 6 Background of companies included in consolidation (continued)
6.6 Information on consolidated subsidiaries, continued
12/31/2016
Subsidiary
Assets Liabilities Revenue
Profit (loss)
Comprehensiv
e income (loss)
Current Non-current Current Non-current
ThUS$ ThUS$ ThUS$ ThUS$ ThUS$ ThUS$ ThUS$
SQM Nitratos S.A. 656,221 54,180 644.,610 5,990 96,235 12,178 12,164
Proinsa Ltda. 56 1 - - - (4) (4)
SQMC Internacional Ltda. 204 - - - - (3) (3)
SQM Potasio S.A. 176,976 722,965 37,167 26,933 5,902 253,322 252,435
Serv. Integrales de Tránsito y Transf. S.A. 75,296 36,407 107,567 224 30,315 (18,192) (18,362)
Isapre Norte Grande Ltda. 664 746 714 131 3,053 23 23
Ajay SQM Chile S.A. 17,240 1,069 975 388 28,035 2,776 2,776
Almacenes y Depósitos Ltda. 278 45 1 - - (10) 105
SQM Salar S.A. 785,127 828,606 751,857 195,369 975,326 316,182 316,024
SQM Industrial S.A. 1,212,960 658,277 882,593 97,714 600,075 17,262 21,790
Exploraciones Mineras S.A. 510 31,598 6,027 - - (286) (284)
Sociedad Prestadora de Servicios de Salud Cruz del Norte
S.A. 337 632
614 291
2,265
85
-
Soquimich Comercial S.A. 153,068 14,663 38,533 1,115 134,501 6,041 6,020
Comercial Agrorama Ltda. 10,759 1,589 11,644 35 15,185 (356) (341)
Comercial Hydro S.A. 5,242 56 115 15 47 350 350
Agrorama S.A. 12,348 842 14,078 37 16,462 (582) (584)
Orcoma SpA - 2,360 14 - - (1) (1)
Orcoma Estudio SpA 671 4,135 159 - - 4 4
SQM North America Corp. 175,834 15,621 204,201 485 228,229 (27,821) (29,082)
RS Agro Chemical Trading Corporation A.V.V. 5,179 - 8 - - (23) (23)
Nitratos Naturais do Chile Ltda. 6 251 3,456 - - (175) (175)
Nitrate Corporation of Chile Ltd. 5,076 - - - - - -
SQM Corporation N.V. 668 116,267 3,568 - - 2,479 5,819
SQM Perú S.A. 249 1 1,170 - 8 (165) (165)
SQM Ecuador S.A. 18,870 121 17,538 41 24,161 471 471
SQM Brasil Ltda. 200 1 714 2,266 296 (173) (173)
SQI Corporation N.V. - 23 55 - - (17) (17)
SQMC Holding Corporation L.L.P. 23,135 13,936 1,000 - - 1.977 1,977
SQM Japan Co. Ltd. 2,868 276 6,708 561 3,013 (7,615) (7,615)

10) FINANCIAL REPORTS
197
Note 6 Background of companies included in consolidation (continued)
6.6 Information on consolidated subsidiaries, continued
12/31/2016
Subsidiary Assets Liabilities
Revenue
Profit (loss) Comprehensive
income (loss) Current Non-current Current Non-current
ThUS$ ThUS$ ThUS$ ThUS$ ThUS$ ThUS$ ThUS$
SQM Europe N.V. 365,805 2,510 317,147 - 723,192 6,118 8,075
SQM Italia SRL 1,086 - 14 - - - -
SQM Indonesia S.A. 3 - 1 - - - -
North American Trading Company 158 145 39 - - - -
SQM Virginia LLC 14,811 14,357 14,811 - - (3) (3)
SQM Comercial de México S.A. de C.V. 73,791 2,200 49,048 - 186,769 (1,757) (1,757)
SQM Investment Corporation N.V. 53,037 117 6,191 863 - (5,441) (5,441)
Royal Seed Trading Corporation A.V.V. 28,662 - 49,788 - - (914) (719)
SQM Lithium Specialties LLP 15,763 3 1,264 - - (3) (3)
Soquimich SRL Argentina 209 - 177 - - (12) (12)
Comercial Caimán Internacional S.A. 259 - 1,122 - - (2) (2)
SQM France S.A. 345 6 114 - - - -
Administración y Servicios Santiago S.A. de C.V. 148 24 504 55 2,687 268 268
SQM Nitratos México S.A. de C.V. 41 1 24 6 266 (2) (2)
Soquimich European Holding B.V. 55,198 115,761 65,005 3,142 - 1,025 5,581
SQM Iberian S.A. 81,119 1,709 73,198 - 146,677 3,501 9,464
SQM Africa Pty Ltd. 89,627 1,399 84,292 - 92,122 (7,627) (7,627)
SQM Oceanía Pty Ltd. 2,387 - 570 - 2,383 (99) (99)
SQM Agro India Pvt. Ltd. 1 - 1 - - (3) (3)
SQM Beijing Commercial Co. Ltd. 2,285 30 171 - 5,106 (34) (34)
SQM Thailand Limited 10,228 5 7,288 - 5,579 319 319
SQM Vitas Spain S.A. 2,287 686 1,583 - 13,673 157 253
Total 4,137,292 2,643,621 3,407,438 335,661 3,341,562 553,218 571,387

10) FINANCIAL REPORTS
198
Note 6 Background of companies included in consolidation (continued)
6.7 Detail of transactions between consolidated companies
a) Transactions conducted in 2017
On January 1, 2017, the subsidiary SQM Iberian S.A. absorbed the joint venture SQM Vitas Spain.
On January 10, 2017, SQM Japan Co. Ltd. carried out a capital increase of ThUS$8,676. Only Soquimich European
Holding B.V. subscribed shares, thereby increasing its interest from 46.24% to 84.03% and reducing the interest
held by SQM S.A. from 0.54% to 0.16% and by SQM Potasio S.A. from 53.22% to 15.81%. This had no impact on
the consolidated results of SQM S.A., which continues to hold 100% of SQM Japan Co. Ltd. in its consolidated
statement of financial position.
On February 10, 2017, the subsidiary Compañía Minera Arfwedson SAP was created in Chile with a capital
contribution from SQM S.A. equivalent to ThUS$10 for a 100% interest. On August 29, 2017, the company's name
was changed to "SQM MAG SpA". The transaction had no impact on the Company's consolidated results.
On April 19, 2017, the subsidiary SACAL S.A. was incorporated with capital of ThUS$7. The company is owned
by SQM Potasio S.A. (95%) and SQM Industrial S.A. (5%). The transaction had no impact on the Company's
consolidated results.
On May 4, 2017 SQI Corporation NV carried out a capital increase of ThUS$15.7, which belongs to SQM S.A.
(with a share of 0.01587%) and SQM Potasio S.A. (with a share of 99.98413%).
On July 31, 2017, the company SQM Trading was legally formed. No capital contributions have been recorded as
of December 31, 2017. The subsidiary is owned by SQM S.A. (0.58%) and Soquimich European Holding (99.42%).
The transaction had no impact on the Company's consolidated results.
SQM International NV (previously SQM Trading NV) was incorporated on July 31, 2017, born from the partial
separation of SQM Europe NV into SQM Europe NV and SQM International NV, both of which retained the same
ownership structure as before. For the purposes of tax in Belgium, this separation was made effective retroactively
as of January 1, 2017. In the annual accounts for 2017 to be presented in 2018 to the local authorities in Belgium,
the statement of financial position and transactions are separated as of the effective date. There are no effects on the
consolidated financial statements as of December 31, 2017.
During July 2017, the subsidiary SQM Agro India Private Limited was closed. The transaction had no impact on the
Company's consolidated results.
On August 14, 2017, SQM Colombia SAS agreed to carry out a capital increase of ThUS$1,814.64, which was
subscribed by its owner SQM Industrial S.A. To date, it has paid ThUS$641. The transaction had no impact on the
Company's consolidated results.

10) FINANCIAL REPORTS
199
Note 6 Background of companies included in consolidation (continued)
6.7 Detail of transactions between consolidated companies, continued
a) Transactions conducted in 2017, continued
On August 29, 2017, Compañía Minera Arfwedson SpA, changed its name to SQM MaG SpA.
On August 31, 2017, the subsidiary SQM Australia Pty Ltd. was created with initial capital of ThUS$7,000
(ThAUD8,729). This subsidiary is fully owned (100%) by SQM Potasio S.A. The functional currency of SQM
Australia Pty Ltd, is the Australian dollar (AUD). Later, on December 14 of the same year, additional capital of
ThUS$18,500 (AUD 24,105.5) was invested. These transactions had no impact on the Company's consolidated
results.
On December 26, 2017, the company SQM (Shanghai) Chemicals Co. was legally formed. No capital contributions
had been recorded as of December 31, 2017.
b) Transactions conducted in 2016
On May 12, 2016, the subsidiary SQM Iberian S.A. purchased 100% of SQM Vitas Spain for ThUS$1,710,
generating a loss of ThUS$104.
On October 3, 2016, SQM Colombia SAS was incorporated with capital of ThUS$10.6. The company is fully
(100%) owned by SQM Industrial S.A. The transaction had no impact on the Company's consolidated results.
On December 5, 2016, Soquimich European Holding B.V. contributed capital of ThUS$1,721 to SQM Japan Co.
Ltd, as part of a capital increase. Following the contribution, the ownership structure of SQM Japan Co Ltd. is as
follows:
1. SQM S.A. with 0.54%,
2. SQM Potasio S.A. with 53.22%,
3. Soquimich European Holding B.V. with 46.24%.
This transaction had no impact on results.

10) FINANCIAL REPORTS
200
Note 7 Cash and cash equivalents
7.1 Types of cash and cash equivalents
As of December 31, 2017 and December 31, 2016, cash and cash equivalents are detailed as follows:
a) Cash
12/31/2017 12/31/20161
ThUS$ ThUS$ Cash on hand 60 53
Cash in banks 50,137 80,287
Other demand deposits 1,530 1,260
Total cash 51,727 81,600
b) Cash equivalents
12/31/2017 12/31/2016
ThUS$ ThUS$
Short-term deposits, classified as cash equivalents 290,914 95,673
Short-term investments, classified as cash equivalents 287,797 337,396
Total cash equivalents 578,711 433,069
Total cash and cash equivalents 630,438 514,669
7.2 Short-term investments, classified as cash equivalents
As of December 31, 2017 and December 31, 2016, the short-term investments classified as cash and cash equivalents
relate to mutual funds (investment liquidity funds) for investments in:
Institution 12/31/2017
ThUS$
12/31/2016
ThUS$ Legg Mason - Western Asset Institutional Cash
Reserves 144,464 178,446
JP Morgan US dollar Liquidity Fund Institutional 143,333 158,950
Total 287,797 337,396
Short-term investments are highly liquid fund manager accounts that are basically invested in short-term fixed rate
notes in the U.S. market.

10) FINANCIAL REPORTS
201
Note 7 Cash and cash equivalents (continued)
7.3 Information on cash and cash equivalents by currency
As of December 31, 2017 and December 31, 2016, information on cash and cash equivalents by currency is detailed
as follows:
(*) The Company maintains financial derivative policies which allow to minimize the risk of the variation in
Chilean pesos exchange rate.
7.4 Amount restricted (unavailable) cash balances
Cash on hand and in current bank accounts are available resources, and their carrying value is equal to their fair
value.
As of December 31, 2017 and December 31, 2016, restricted cash balances are presented in Note 10.9.
Original currency 12/31/2017 12/31/2016
ThUS$ ThUS$
Chilean Peso (*) 579 6,044
US Dollar 612,727 490,978
Euro 9,782 11,386
Mexican Peso 258 309
South African Rand 4,074 3,250
Japanese Yen 1,773 2,149
Peruvian Sol 8 3
Brazilian Real 38 59
Chinese Yuan 1,143 400
Indian Rupee - 8
Thai Baht - 8
Argentine Peso 1 4
Pound Sterling 55 71
Total 630,438 514,669

10) FINANCIAL REPORTS
202
Note 7 Cash and cash equivalents (continued)
7.5 Short-term deposits, classified as cash equivalents
The detail at the end of each period is as follows:
2017
Receiver of the deposit Type of deposit Original Currency Interest rate Placement date Expiration date
Principal
ThUS$
Interest accrued
to-date
ThUS$ 12/31/2017
ThUS$
Scotiabank Sud Americano Fixed term 0.24 11-21-2017 1-2-2018 8,943 30 8,973
Banco Itau Chile Fixed term Ch$ 0.24 11-28-2017 1-2-2018 15,652 41 15,693
Banco Itau Chile Fixed term Ch$ 0.24 11-28-2017 1-2-2018 15,652 41 15,693
Banco BBVA Chile Fixed term Ch$ 0.23 11-28-2017 1-2-2018 15,652 40 15,692
Banco BBVA Chile Fixed term Ch$ 0.23 11-28-2017 1-2-2018 15,652 40 15,692
Banco Itau Chile Fixed term Ch$ 0.25 11-29-2017 2-27-2018 18,857 50 18,907
Banco Crédito e Inversiones Fixed term Ch$ 0.26 12-12-2017 1-11-2018 15,982 26 16,008
Banco Crédito e Inversiones Fixed term Ch$ 0.26 12-12-2017 1-11-2018 8,524 14 8,538
Banco Itau Chile Fixed term Ch$ 0.24 12-12-2017 1-11-2018 15,982 24 16,006
Banco Itau Chile Fixed term Ch$ 0.24 12-12-2017 1-11-2018 7,458 11 7,469
Banco Crédito e Inversiones Fixed term Ch$ 0.26 12-14-2017 1-16-2018 19,780 29 19,809
Banco Crédito e Inversiones Fixed term Ch$ 0.26 12-14-2017 1-16-2018 15,665 23 15,688
Banco Crédito e Inversiones Fixed term Ch$ 0.26 12-14-2017 1-16-2018 11,488 17 11,505
Banco Crédito e Inversiones Fixed term Ch$ 0.26 12-15-2017 1-16-2018 15,568 22 15,590
Banco Crédito e Inversiones Fixed term Ch$ 0.26 12-15-2017 1-16-2018 15,568 22 15,590
Banco Crédito e Inversiones Fixed term Ch$ 0.26 12-15-2017 1-16-2018 15,568 22 15,590
Banco BBVA Chile Fixed term Ch$ 0.24 12-29-2017 1-10-2018 4,107 1 4,108
Banco BBVA Chile Fixed term Ch$ 0.24 12-29-2017 1-10-2018 2,765 - 2,765
Banco Santander - Santiago Fixed term US$ 0.28 12-27-2017 1-18-2018 700 - 700
Banco Santander - Santiago Fixed term US$ 0.4 12-15-2017 2-13-2018 15,000 27 15,027
Banco Santander - Santiago Fixed term US$ 0.4 12-15-2017 2-13-2018 14,000 25 14,025
Corpbanca Fixed term Ch$ 0.22 12-28-2017 1-4-2018 1,301 - 1,301
Scotiabank Sud Americano Fixed term Ch$ 0.21 12-29-2017 1-5-2018 976 - 976
Scotiabank Sud Americano Fixed term Ch$ 0.21 12-29-2017 1-5-2018 569 - 569
Banco Santander - Santiago Fixed term US$ 2.45 12-6-2017 1-5-2018 3,500 6 3,506
Scotiabank Sud Americano Fixed term US$ 3.40 12-15-2017 1-16-2018 2,000 3 2,003
Banco BBVA Chile Fixed term US$ 2.80 12-26-2017 1-26-2018 2,200 1 2,201
Banco Crédito e Inversiones Fixed term US$ 2.3 12-27-2017 1-4-2018 2,300 1 2,301
Banco Santander - Santiago Fixed term US$ 2.88 12-27-2017 1-4-2018 2,300 1 2,301
Banco BBVA Chile Fixed term US$ 2.80 12-27-2017 1-4-2018 1,400 - 1,400
BBVA Banco Francés Fixed term US$ 0.19 12-112017 1/31/2017 163 - 163
Nedbank On demand US$ - 12-1-2017 1/31/2017 3,686 - 3,686
ABN Amro Bank Fixed term US$ - 12-31-2017 1/2/2018 1,439 - 1,439
Total 290,397 517 290,914

10) FINANCIAL REPORTS
203
Note 7 Cash and cash equivalents (continued)
7.5 Short-term deposits, classified as cash equivalents, continued
2016
Receiver of the deposit Type of deposit Original Currency Interest rate Placement date Expiration date
Principal
ThUS$
Interest accrued
to-date
ThUS$ 12/31/2016
ThUS$
Scotiabank Sud Americano Fixed term US$ 1.28 12/29/2016 1/31/2017 9,900 1 9,901
Banco de Chile Fixed term US$ 0.90 12/30/2016 1/9/2017 15,000 1 15,001
Banco Crédito e Inversiones Fixed term US$ 0.90 12/30/2016 1/10/2017 10,000 - 10,000
Banco Crédito e Inversiones Fixed term US$ 0.93 10/11/2016 1/30/2017 13,000 27 13,027
Banco BBVA Chile Fixed term US$ 0.75 10/11/2016 1/30/2017 2,000 3 2,003
Banco Santander - Santiago Fixed term US$ 1.21 12/1/2016 1/3/2017 3,500 4 3,504
Banco de Chile Fixed term US$ 0.76 12/7/2016 1/6/2017 3,900 2 3,902
Banco Santander - Santiago Fixed term US$ 0.90 12/12/2016 1/12/2017 5,000 2 5,002
Banco de Chile Fixed term US$ 1.30 12/12/2016 1/12/2017 1,700 1 1,701
Banco Crédito e Inversiones Fixed term US$ 0.88 12/14/2016 1/17/2017 2,000 1 2,001
Corpbanca Fixed term US$ 1.28 12/20/2016 2/21/2017 800 - 800
Scotiabank Sud Americano Fixed term US$ 1.28 12/20/2016 2/21/2017 5,000 2 5,002
Banco Santander - Santiago Fixed term US$ 0.75 12/22/2016 1/23/2017 3,500 1 3,501
Banco Santander - Santiago Fixed term US$ 1.25 12/28/2016 2/9/2017 3,900 1 3,901
Banco Security Fixed term US$ 1.31 12/28/2016 2/9/2017 3,300 - 3,300
Banco Security Fixed term US$ 1.00 12/29/2016 1/30/2017 3,800 - 3,800
Banco Santander - Santiago Fixed term Ch$ 0.31 12/16/2016 1/2/2017 1,942 3 1,945
Corpbanca Fixed term Ch$ 0.32 12/29/2016 1/9/2017 597 1 598
Scotiabank Sud Americano Fixed term Ch$ 0.33 12/30/2016 1/9/2017 2,091 - 2,091
Citibank New York Overnight US$ 0.01 12/31/2016 1/1/2017 1,742 - 1,742
BBVA Banco Francés Fixed term US$ 0.21 24/102016 1/31/2017 199 - 199
Nedbank On demand US$ - 12/1/2016 1/31/2017 2,752 - 2,752
Total 95,623 50 95,673

10) FINANCIAL REPORTS
204
Note 8 Inventories
The composition of inventory at each period-end is as follows:
Type of inventory 12/31/2017
ThUS$
12/31/2016
ThUS$
Raw material reserves 9,364 7,536
Supplies for production reserves 22,257 23,610
Products-in-progress reserves 456,333 482,261
Finished product reserves 414,120 479,665
Total 902,074 993,072
As of December 31, 2017, the Company has inventory of caliche ore (in piles or undergoing leaching process)
available for processing valued at ThUS$62,476 (ThUS$ 43,400 as of December 31, 2016), (included in work in
progress).
Inventory reserves recognized as of December 31, 2017 amount to ThUS$96,284, and ThUS$81,295 as of December
31, 2016. Inventory reserves have been made based on a technical study that covers the different variables affecting
products in stock (density and humidity, among others).
In the case of inventories of raw materials, supplies, materials and parts, provisions have been made at the lower
value associated with the proportion of obsolete, defective or slow-moving materials.
The breakdown of inventory reserves is detailed as follows:
Type of inventory 12/31/2017
ThUS$
12/31/2016
ThUS$
Raw material reserves 93 93
Supplies for production - 920
Products-in-progress reserves 80,249 50,925
Finished product reserves 15,942 29,357
Total 96,284 81,295
The Company has not delivered inventory as collateral for the periods indicated above.

10) FINANCIAL REPORTS
205
Note 8 Inventories, continued
As of December 31, 2017and 2016, movements in provisions are detailed as follows:
Note 9 Related party disclosures
9.1 Related party disclosures
Balances pending at period-end are not guaranteed, accrue no interest and are settled in cash. No guarantees have
been delivered or received for trade and other receivables due from related parties or trade and other payables due
to related parties.
9.2 Relationships between the parent and the entity
According to the Company’s by-laws the indicated in the Note 6.3, no shareholder can own more than 32% of the
Company’s voting right shares.
Sociedad de Inversiones Pampa Calichera S.A., Potasios de Chile S.A., and Inversiones Global Mining (Chile) Ltda.,
collectively the Pampa Group, are the owners of a number of shares that as of December 31, 2017 are equivalent to
29.97% of the current total amount of issued, subscribed and fully-paid shares in the Company. In addition, Kowa
Company Ltd., Inversiones La Esperanza (Chile) Limitada, Kochi S.A. and La Esperanza Delaware Corporation,
collectively the Kowa Group, are the owners of a number of shares equivalent to 2.12% of the total amount of issued,
subscribed and fully-paid shares of SQM S.A.
The Pampa Group and the Kowa Group have informed SQM S.A., the Financial Markets Commission (formerly the
Chilean SVS) and the relevant stock exchanges in Chile and abroad that they are not and have never been mutually
related parties. This is independent of the fact that on December 21, 2006 the two Groups entered into a Joint Action
Agreement (JAA) related to those shares. Consequently, neither the Pampa Group nor the Kowa Group individually
owns more than 32% of the voting right capital of SQM S.A.
This Joint Action Agreement has not transformed the Pampa and Kowa Groups into mutually related parties. The
Joint Action Agreement has only transformed the current controller of SQM S.A., composed of the Pampa Group,
and the Kowa Group, into related parties of SQM S.A.
Reconciliation 12/31/2017 12/31/2016
ThUS$ ThUS$
Opening balance 81,295 80,369
Changes
Additional provisions 21,953 9,831
Increase (decrease) in existing provisions (6,964) (8,905)
Total changes 14,989 926
Final Balance 96,284 81,295

10) FINANCIAL REPORTS
206
Note 9 Related party disclosures (continued)
9.2 Relationships between the parent and the entity, continued
Detail of effective concentration
Tax ID No. Name Ownership interest
%
96,511,530-7 Sociedad de Inversiones Pampa Calichera S.A. 19.72
76,165,311-5 Potasios de Chile S.A. 6.91 96,863,960-9 Inversiones Global Mining (Chile) Ltda. 3.34
Total Pampa Group 29.97
79,798,650-k Inversiones la Esperanza (Chile) Ltda. 1.43
59,046,730-8 Kowa Co Ltd. 0.30
96,518,570-4 Kochi S.A. 0.30 59,023,690-k La Esperanza Delaware Corporation 0.09
Total Kowa Group 2.12

10) FINANCIAL REPORTS
207
Note 9 Related party disclosures (continued)
9.3 Detailed identification of the link between the Parent and subsidiary
As of December 31, 2017 and December 31, 2016, the detail of entities that are related parties of the SQM S.A.
Group is as follows:
Tax ID No. Name Country of origin Functional currency Nature
Foreign Nitratos Naturais Do Chile Ltda. Brazil US$ Subsidiary
Foreign Nitrate Corporation Of Chile Ltd. United Kingdom US$ Subsidiary Foreign SQM North America Corp. United States US$ Subsidiary Foreign SQM Europe N.V. Belgium US$ Subsidiary Foreign Soquimich S.R.L. Argentina Argentina US$ Subsidiary Foreign Soquimich European Holding B.V. The Netherlands US$ Subsidiary Foreign SQM Corporation N.V. The Netherlands US$ Subsidiary Foreign SQI Corporation N.V. The Netherlands US$ Subsidiary Foreign SQM Comercial De México S.A. de C.V. Mexico US$ Subsidiary Foreign North American Trading Company United States US$ Subsidiary Foreign Administración y Servicios Santiago S.A. de C.V. Mexico US$ Subsidiary Foreign SQM Peru S.A. Peru US$ Subsidiary Foreign SQM Ecuador S.A. Ecuador US$ Subsidiary Foreign SQM Nitratos Mexico S.A. de C.V. Mexico US$ Subsidiary Foreign SQMC Holding Corporation L.L.P. United States US$ Subsidiary Foreign SQM Investment Corporation N.V. The Netherlands US$ Subsidiary Foreign SQM Brasil Limitada Brazil US$ Subsidiary Foreign SQM France S.A. France US$ Subsidiary Foreign SQM Japan Co. Ltd. Japan US$ Subsidiary Foreign Royal Seed Trading Corporation A.V.V. Aruba US$ Subsidiary Foreign SQM Oceania Pty Limited Australia US$ Subsidiary Foreign Rs Agro-Chemical Trading Corporation A.V.V. Aruba US$ Subsidiary Foreign SQM Indonesia S.A. Indonesia US$ Subsidiary Foreign SQM Virginia L.L.C. United States US$ Subsidiary Foreign SQM Italia SRL Italy US$ Subsidiary
Foreign Comercial Caiman Internacional S.A. Panamá US$ Subsidiary Foreign SQM Africa Pty. Ltd. South Africa US$ Subsidiary
Foreign SQM Colombia SAS Colombia US$ Subsidiary
Foreign SQM Lithium Specialties LLC United States US$ Subsidiary Foreign SQM Iberian S.A. Spain US$ Subsidiary
Foreign SQM Agro India Pvt. Ltd. India US$ Subsidiary
Foreign SQM Beijing Commercial Co. Ltd. China US$ Subsidiary Foreign SQM Thailand Limited Thailand US$ Subsidiary
Foreign SQM Australia PTY Australia Australian dollar Subsidiary
Foreign SACAL S.A. Argentina Argentine peso Subsidiary 96,801,610-5 Comercial Hydro S.A. Chile US$ Subsidiary
96,651,060-9 SQM Potasio S.A. Chile US$ Subsidiary
96,592,190-7 SQM Nitratos S.A. Chile US$ Subsidiary 96,592,180-K Ajay SQM Chile S.A. Chile US$ Subsidiary

10) FINANCIAL REPORTS
208
Note 9 Related party disclosures (continued)
9.3 Detailed identification of the link between the Parent and subsidiary, continued
As of December 31, 2017 and December 31, 2016, the detail of entities that are related parties of the SQM S.A:
Group is as follows:
Tax ID No. Name Country of origin Functional currency Nature
86,630,200-6 SQMC Internacional Ltda. Chile Chilean peso Subsidiary 79,947,100-0 SQM Industrial S.A. Chile US$ Subsidiary 79,906,120-1 Isapre Norte Grande Ltda. Chile Chilean peso Subsidiary 79,876,080-7 Almacenes y Depósitos Ltda. Chile Chilean peso Subsidiary 79,770,780-5 Servicios Integrales de Tránsitos y Transferencias S.A. Chile US$ Subsidiary 79,768,170-9 Soquimich Comercial S.A. Chile US$ Subsidiary 79,626,800-K SQM Salar S.A. Chile US$ Subsidiary 78,053,910-0 Proinsa Ltda. Chile Chilean peso Subsidiary
76,534,490-5 Sociedad Prestadora de Servicios de Salud Cruz del
Norte S.A. Chile Chilean peso Subsidiary
76,425,380-9 Exploraciones Mineras S.A. Chile US$ Subsidiary 76,064,419-6 Comercial Agrorama Ltda. Chile Chilean peso Subsidiary 76,145,229-0 Agrorama S.A. Chile Chilean peso Subsidiary 76,359,919-1 Orcoma Estudios SPA Chile US$ Subsidiary
76,360,575-2 Orcoma SPA Chile US$ Subsidiary
76,686,311-9 SQM MaG SpA Chile US$ Subsidiary Foreign Abu Dhabi Fertilizer Industries WWL Arab Emirates Arab Emirates dirham Associate Foreign Doktor Tarsa Tarim Sanayi AS Turkey Turkish lira Associate Foreign Ajay North America United States US$ Associate Foreign Ajay Europe SARL France Euro Associate Foreign SQM Eastmed Turkey Turkey Euro Associate Foreign Charlee SQM Thailand Co. Ltd. Thailand Thai baht Associate Foreign Kore Potash Ltd. Australia US$ Associate
Foreign Sichuan SQM Migao Chemical Fertilizers Co Ltda. China US$ Joint venture Foreign Coromandel SQM India India Indian rupee Joint venture Foreign SQM Vitas Fzco. Arab Emirates Arab Emirates dirham Joint venture Foreign SQM Star Qingdao Corp Nutrition Co., Ltd. China US$ Joint venture Foreign SQM Vitas Holland B.V. Dutch Antilles Euro Joint venture
Foreign Kowa Company Ltd. Japan US$ Joint control
Foreign Minera Exar S.A. Argentina US$ Joint control
96,511,530-7 Sociedad de Inversiones Pampa Calichera Chile US$ Joint control
96,529,340-k Norte Grande S.A. Chile Chilean peso Other related parties
79,049,778-9 Callegari Agricola S.A. Chile Chilean peso Other related parties Foreign Coromandel Internacional India Indian rupee Other related parties
Foreign Vitas Roullier SAS France Euro Other related parties
Foreign SQM Vitas Brazil Agroindustria Brazil US$ Other related parties Foreign SQM Vitas Peru S.A.C. Peru US$ Other related parties
Foreign SQM Vitas Plantacote B.V Dutch Antilles Euro Other related parties
Foreign Terra Tarsa B.V. Holland Euro Other related parties Foreign Plantacote N.V. Belgium Euro Other related parties
Foreign Doktolab Tarim Arastima San. Tic As Turkey Turkish Lira Other related parties
Foreign Terra Tarsa Ukraine LLC Ukraine Ukrainian Grivna Other related parties Foreign Terra Tarsa Don LLC Russian Federation Russian ruble Other related parties

10) FINANCIAL REPORTS
209
Note 9 Related party disclosures (continued)
9.4 Detail of related parties and related party transactions
Transactions between the Parent and its subsidiaries, associated businesses, joint ventures and other related parties
are part of the Company's common transactions. Their conditions are those customary for this type of transactions
in respect of terms and market prices. In addition, these have been eliminated in consolidation and are not detailed
in this note.
Maturity terms for each case vary by virtue of the transaction giving rise to them.
As of December 31, 2017 and December 31, 2016, the detail of significant transactions with related parties is as
follows:
Tax ID No. Company Nature Country of origin Transaction 12/31/2017
ThUS$
12/31/2016
ThUS$
Foreign Doktor Tarsa Tarim Sanayi As Associate Turkey Sale of products 17,538 11,619
Foreign Ajay Europe S.A.R.L. Associate France Sale of products 15,706 17,977
Foreign Ajay Europe S.A.R.L. Associate France Dividends 969 1,338
Foreign Ajay North America LLC. Associate United States Sale of products 13,206 12,865
Foreign Ajay North America LLC. Associate United States Dividends 1,123 2,605
Foreign Abu Dhabi Fertilizer Industries WWL Associate
United Arab
Emirates Sale of products 4,351 8,312
Foreign Charlee SQM Thailand Co. Ltd. Associate Thailand Sale of products 5,102 3,798
Foreign Charlee SQM Thailand Co. Ltd. Associate Thailand Dividends - -
77,557,430-5 Sales de Magnesio Ltda. Associate Chile Sale of products 45 -
Foreign Kowa Company Ltd.
Other related
parties Japan Sale of products 132,495 91,678
Foreign Kowa Company Ltd.
Other related
parties Japan Services received - -
Foreign SQM Vitas Brasil Agroindustria
Joint control or
significant
influence Brazil Sale of products 31,137 17,686
Foreign SQM Vitas Peru S.A.C.
Joint control or
significant
influence Peru Sale of products 23,058 22,090
Foreign SQM Vitas Fzco. Joint venture
United Arab
Emirates Sale of products 85 965
Foreign
Sichuan SQM Migao Chemical
Fertilizers Co Ltda. Joint venture China Sale of products - 9,950
Foreign
Sichuan SQM Migao Chemical
Fertilizers Co Ltda. Joint venture China Sale of services 252 257
Foreign Coromandel SQM India Joint venture India Sale of products 8,011 4,630
Foreign SQM Vitas Spain Joint venture Spain Sale of products - 5,528
Foreign SQM Vitas Plantacote B.V. Joint venture Netherlands Sale of products - 49
Foreign
SQM Star Qingdao Corp Nutrition
Co., Ltd. Joint venture China Sale of products 200 166
Foreign SQM Vitas Holland B.V. Joint venture Holland Sale of products - 634
79,049,778-9 Callegari Agrícola S.A.
Other related
parties Chile Sale of products 210 44
Foreign Minera Exar S.A. Joint venture Argentina Loans 11,000 -
Foreign Terra Tarsa Ukraine LLC Associate Turkey Sale of services 1,218 -
Foreign Terra Tarsa Don LLC Joint venture
Russian
Federation Sale of products 423 -
Foreing Plantacote N.V. Associate Belgium Sale of products 2,108 -

10) FINANCIAL REPORTS
210
Note 9 Related party disclosures (continued)
9.5 Trade receivables due from related parties, current:
Tax ID N° Company Nature Country of origin Currency 12/31/2017 12/31/2016
ThUS$ ThUS$
Foreign Charlee SQM Thailand Co. Ltd. Associate Thailand US$ 1,204 1,315 Foreign Ajay Europe S.A.R.L. Associate France Euro 4,689 3,801 Foreign Ajay North America LLC. Associate United States US$ 2,005 3,095
Foreign
Abu Dhabi Fertilizer Industries
WWL Associate United Arab Emirates
Arab Emirates
dirham 73 764 Foreign Kowa Company Ltd. Jointly controlled entity Japan US$ 5,008 34,377
96.511.530-7
Soc.de Inversiones Pampa
Calichera Jointly controlled entity Chile US$ 6 6 Foreign SQM Vitas Brasil Agroindustria Joint venture Brazil US$ 17,293 9,580 Foreign SQM Vitas Peru S.A.C. Joint venture Peru US$ 13,766 13,318 Foreign Coromandel SQM India Joint venture India Indian rupee 3,804 1,177
Foreign Sichuan SQM Migao Chemical Fertilizers Co Ltda.
Joint venture China US$ - 14,547
79.049.778-9 Callegari Agrícola S.A. Other related parties Chile Ch$ - 41
Foreign SQM Vitas Fzco. Joint venture United Arab Emirates
Arab Emirates
dirham - 97 Foreign SQM Vitas Plantacote B.V. Joint venture Holland Euro - 91
Foreign
SQM Star Qingdao Corp
Nutrition Co., Ltd. Joint venture China
US$ 50 48 Foreign Plantacote N.V. Associate Belgium Euro 190 2 Foreign Terra Tarsa Don LLC Associate Russian Federation Russian ruble 44
Foreign Minera Exar S.A. Joint venture Argentina US$ 11,000 -
Total 59,132 82,259
9.6 Trade payables due to related parties, current:
Tax ID
No. Company. Nature
Country of
origin Currency
12/31/2017 12/31/2016
ThUS$ ThUS$
Foreign Doktor Tarsa Tarim Sanayi AS Associate Turkey YTL 11 7
Foreign Terra Tarsa Ukraine LLC
Other related
parties
Ukraine Ukrainian Grivna
7 -
Foreign SQM Star Qingdao Corp Nutrition
Co., Ltd. Joint venture China US$ 725 -
Foreign Sichuan SQM Migao Chemical
Fertilizers Co Ltda. Joint venture China US$ 584 -
Foreign SQM Vitas Fzco. Joint venture
United Arab
Emirates Arab Emirates dirham 38 -
Current Total 1,365 7

10) FINANCIAL REPORTS
211
Note 9 Related party disclosures (continued)
9.7 Board of Directors and Senior Management
1) Board of directors
SQM S.A. is managed by a Board of Directors which is composed of 8 regular directors, 2 of whom are independent
directors, who are elected for a three-year period. The present Board of Directors was elected by the shareholders at
the Ordinary Shareholders' Meeting of April 28, 2017.
As of December 31, 2017, the Company has the following Committees:
- Directors’ Committee: composed of Juan Gerardo Jofré Miranda, Fernando Massú Taré and Joanne L.
Boyes. Such Committee performs the duties contained in Article 50 bis of Law No. 18.046, the Chilean
“Securities Act”.
- Health, Safety and Environmental Matters Committee: composed of Arnfinn F. Prugger, Gonzalo Guerrero
Y. and Hernán Büchi Buc.
- Corporate Governance Committee: composed of Robert A. Kirkpatrick, Hernán Büchi Buc and Juan
Gerardo Jofré Miranda.
During the periods covered by these financial statements, there are no pending balances receivable and payable
between the Company, its directors or members of Senior Management, other than those related to remuneration,
fee allowances and profit-sharing. In addition, there were no transactions conducted between the Company, its
directors or members of Senior Management.

10) FINANCIAL REPORTS
212
Note 9 Related party disclosures (continued)
9.7 Board of Directors and Senior Management, continued
2) Directors’ Compensation
Directors’ compensation is detailed as follows:
a) The payment of a fixed, gross and monthly amount of four hundred UF in favor of the Chairman of the Board
of Directors of SQM S.A. and of two hundred UF in favor of the remaining seven Directors of SQM S.A. and
regardless of the number of Board of Directors’ Meetings held or not held during the related month.
b) A payment in domestic currency in favor of the Chairman of the Company’s Board of Directors consisting of a
variable and gross amount equivalent to 0.15% of profit for the period effectively earned by the Company during
the 2017 fiscal year.
c) A payment in domestic currency in favor of each Company’s directors excluding the Chairman of the Board,
consisting of a variable and gross amount equivalent to 0.06% of profit for the period effectively earned by the
Company during the 2017 fiscal year.
d) The fixed and variable amounts indicated above cannot be altered and those expressed in percentages will be
paid after the related General Shareholders’ Meeting of SQM S.A. approves the Balance Sheet, Financial
Statements, Annual Report, the Account Inspectors’ Report and Independent Auditor’s Report of SQM S.A. for
the commercial year ended December 31, 2017.
e) The amounts expressed in UF will be paid in accordance with the value determined by the Chilean
Superintendence of Banks and Financial Institutions (SBIF), the Central Bank of Chile (Banco Central de Chile)
or another relevant institution replacing them during the last day of the calendar year applicable. The amounts
reflected in or referred to in U.S. dollars will be converted to Chilean pesos and paid in Chilean pesos in
accordance with the exchange rate in force when the dividend for the 2017 fiscal year is paid.
f) Therefore, the remunerations and profit sharing paid to members of the Board of Directors and Audit Committee
during 2017 amount to ThUS$3,231 (ThUS$ 2,292 as of December 31, 2016).
3) Directors’ Committee
The remuneration of the Directors Committee comprises:
a) The payment of a fixed, gross and monthly amount of UF 75 in favor of each of the 3 directors that are members
of the Directors’ Committee, regardless of the number of meetings of the Directors’ Committee that have or
have not been held during the month concerned.
b) The payment in domestic currency and in favor of each of the 3 directors of a variable and gross amount
equivalent to 0.02% of total net profit that the Company effectively obtains during the 2017 fiscal year.

10) FINANCIAL REPORTS
213
Note 9 Related party disclosures (continued)
9.7 Board of Directors and Senior Management, continued
c) The fixed and variable amounts indicated above cannot be altered and those expressed in percentages will be
paid after the related General Shareholders’ Meeting of SQM S.A. approves the Balance Sheet, Financial
Statements, Annual Report, the Account Inspectors’ Report and Independent Auditor’s Report of SQM S.A. for
the commercial year ended December 31, 2017.
d) The amounts expressed in UF will be paid in accordance with the value determined by the Chilean
Superintendence of Banks and Financial Institutions (SBIF), the Central Bank of Chile (Banco Central de Chile)
or another relevant institution replacing them during the last day of the calendar year applicable. The amounts
reflected in or referred to in U.S. dollars will be converted to Chilean pesos and paid in Chilean pesos in
accordance with the exchange rate in force when the dividend for the 2017 fiscal year is paid.
4) Health, Safety and Environmental Matters Committee:
The remuneration for this committee is composed of the payment of a fixed, gross and monthly amount of
UF 50 for each of the 3 Directors on the committee, regardless of the number of meetings it has held.
5) Corporate Governance Committee
The remuneration for this committee is composed of the payment of a fixed, gross and monthly amount of
UF 50 for each of the 3 Directors on the committee regardless of the number of meetings it has held.
6) No guarantees have been constituted in favor of the directors.
7) Senior management compensation:
a) As of December 31, 2017, the global compensation paid to the 115 main executives amounts to ThUS$27,367
and the global compensation paid to the 105 main executives as of December 31, 2016 amounted to
ThUS$20,439. This includes monthly fixed salary and variable performance bonuses.
b) SQM S.A. has an annual bonus plan based on goal achievement and individual contribution to the Company’s
results. These incentives are structured as a minimum and maximum number of gross monthly salaries and are
paid once a year.
c) The Company also has retention bonuses for its executives. The value of these bonuses is linked to the
Company's stock price and is payable in cash during the first quarter of 2021 (see Note 16).

10) FINANCIAL REPORTS
214
Note 9 Related party disclosures (continued)
9.7 Board of Directors and Senior Management, continued
8) No guarantees have been constituted in favor of the Company’s management.
9) The Company’s Managers and Directors do not receive or have not received any benefit during the period
ended December 31, 2017 and the year ended December 31, 2016 or compensation for the concept of
pensions, life insurance, paid time off, profit sharing, incentives, or benefits due to disability other than those
mentioned in the preceding points.
9.8 Key management personnel compensation
As of December 31, 2017, there are 115 people occupying key management personnel posts (there were 105 as of
December 31, 2016).
12/31/2017 12/31/2016
ThUS$ ThUS$
Key management personnel compensation (1) 27,367 20,439
(1) Corresponds to a number of executives (see Note 9.7 6) b).

10) FINANCIAL REPORTS
215
Note 10 Financial instruments
Financial instruments in accordance with IAS 39 are detailed as follows:
10.1 Types of other financial assets
Description of other financial assets 12/31/2017
ThUS$
12/31/2016
ThUS$
Other current financial assets (1) 360,941 284,160
Derivatives (2) 6,038 4,095
Hedging assets - 934
Total other current financial assets 366,979 289,189
Other non-current financial assets (3) 62,879 34,099
Total other non-current financial assets 62,879 34,099
(1) Relates to term deposits with maturities exceeding 90 days and less than 360 days from the investment date.
(2) Relates to forwards and options that were not classified as hedging instruments (see detail in Note 10.3).
(3) The detail of other financial assets, non-current is as follows:
12/31/2017
ThUS$
12/31/2016
ThUS$
Non-current investments not accounted for using the equity accounting method,
classified as available for sale 9,179 6,899
Share purchase option (1) 20,000 20,000
Hedging assets 8,910 7,156
Contribution for constitution of Joint Venture (2) 24,745 -
Other financial assets, non-current 45 44
Total other financial assets, non-current 62,879 34,099
(1) SQM S.A. signed a contract with Kore Potash Limited and, as part of the deal, SQM acquired 20 million share options valued at
ThUS$20,000.
(2) SQM Potasio S.A. contributed ThUS$24,745 to set up Western Australia Lithium (WAL). This has still not been legally constituted as a
company, so the funds remain in trust waiting to be transferred to WAL.
Detail of other current financial assets
Institution 12/31/2017
ThUS$
12/31/2016
ThUS$ Banco Santander 163,269 54,364
Banco de Crédito e Inversiones 71,748 40,627
Banco Itaú - Corpbanca 77,527 63,969
Banco Security 28,592 15,007
Morgan Stanley - 3,150
Scotiabank Sud Americano 13,764 107,043
Banco Chile 4,834 -
Banco BBVA Chile 1,207 -
Total 360,941 284,160

10) FINANCIAL REPORTS
216
Note 10 Financial instruments, (continued)
10.2 Trade and other receivables
12/31/2017 12/31/2016
Current Non-current Total Current Non-current Total
ThUS$ ThUS$ ThUS$ ThUS$ ThUS$$ ThUS$
Trade receivables 412,321 - 412,321 344,839 - 344,839
Prepayments 16,177 - 16,177 6,621 - 6,621
Other receivables 18,377 1,912 20,289 17,301 1,840 19,141
Total trade and other receivables 446,875 1,912 448,787 368,761 1,840 370,601
12/31/2017 12/31/2016
Assets before
allowances
Allowance for
doubtful trade
receivables
Assets for trade
receivables, net
Assets before
allowances
Allowance for
doubtful trade
receivables
Assets for trade
receivables, net
ThUS$ ThUS$ ThUS$ ThUS$ ThUS$ ThUS$ Receivables related to credit operations,
current 427,400 (15,079) 412,321
361,656 (16,817) 344,839
Trade receivables, current 427,400 (15,079) 412,321 361,656 (16,817) 344,839
Prepayments, current 16,877 (700) 16,177 9,421 (2,800) 6,621
Other receivables, current 23,409 (5,032) 18,377 19,300 (1,999) 17,301
Current trade and other receivables 40,286 (5,732) 34,554 28,721 (4,799) 23,922
Other receivables, non-current 1,912 - 1,912 1,840 - 1,840
Non-current receivables 1,912 - 1,912 1,840 - 1,840
Total trade and other receivables 469,598 (20,811) 448,787 392,217 (21,616) 370,601
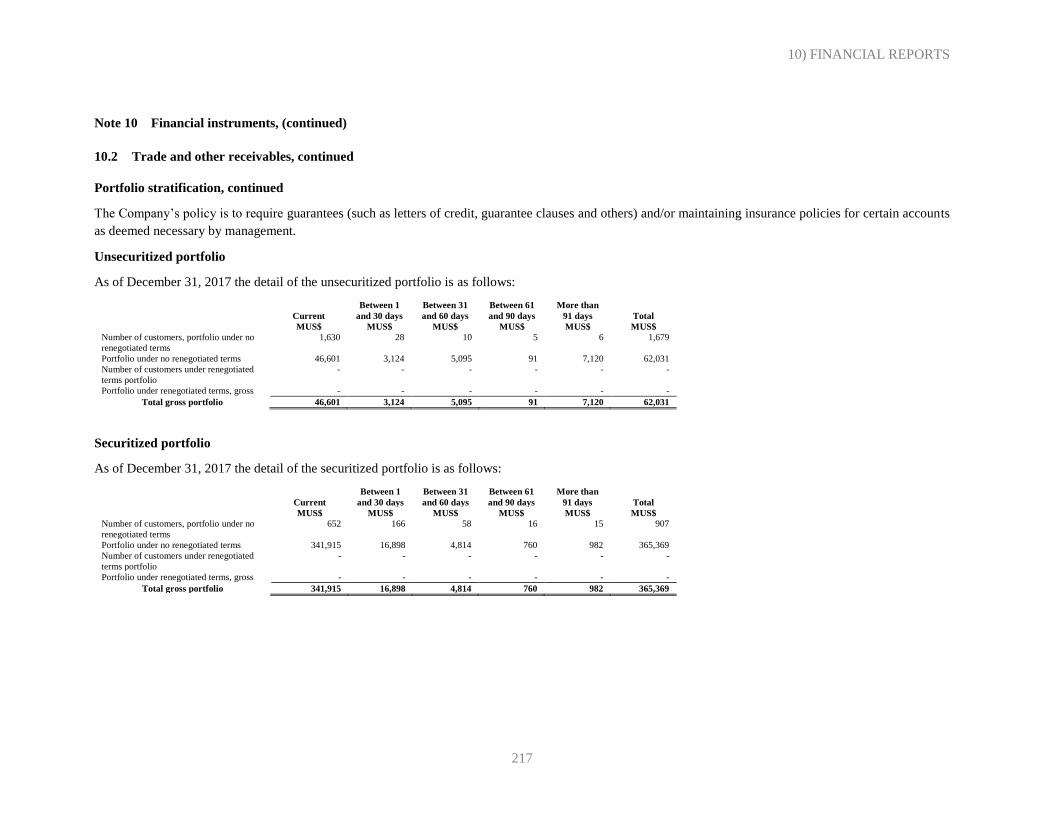
10) FINANCIAL REPORTS
217
Note 10 Financial instruments, (continued)
10.2 Trade and other receivables, continued
Portfolio stratification, continued
The Company’s policy is to require guarantees (such as letters of credit, guarantee clauses and others) and/or maintaining insurance policies for certain accounts
as deemed necessary by management.
Unsecuritized portfolio
As of December 31, 2017 the detail of the unsecuritized portfolio is as follows:
Current
Between 1
and 30 days
Between 31
and 60 days
Between 61
and 90 days
More than
91 days Total
MUS$ MUS$ MUS$ MUS$ MUS$ MUS$
Number of customers, portfolio under no
renegotiated terms
1,630 28 10 5 6 1,679
Portfolio under no renegotiated terms 46,601 3,124 5,095 91 7,120 62,031
Number of customers under renegotiated
terms portfolio
- - - - - -
Portfolio under renegotiated terms, gross - - - - - -
Total gross portfolio 46,601 3,124 5,095 91 7,120 62,031
Securitized portfolio
As of December 31, 2017 the detail of the securitized portfolio is as follows:
Current
Between 1
and 30 days
Between 31
and 60 days
Between 61
and 90 days
More than
91 days Total
MUS$ MUS$ MUS$ MUS$ MUS$ MUS$
Number of customers, portfolio under no
renegotiated terms
652 166 58 16 15 907
Portfolio under no renegotiated terms 341,915 16,898 4,814 760 982 365,369
Number of customers under renegotiated
terms portfolio
- - - - - -
Portfolio under renegotiated terms, gross - - - - - -
Total gross portfolio 341,915 16,898 4,814 760 982 365,369

10) FINANCIAL REPORTS
218
Note 10 Financial instruments, (continued)
10.2 Trade and other receivables, continued
Unsecuritized portfolio
As of December 31, 2016 the detail of the unsecuritized portfolio is as follows:
Current
Between 1
and 30 days
Between 31
and 60 days
Between 61
and 90 days
More than
91 days Total
MUS$ MUS$ MUS$ MUS$ MUS$ MUS$
Number of customers, portfolio under no
renegotiated terms
48 55 7 - 26 136
Portfolio under no renegotiated terms 32,233 26,696 2,411 - 5,210 66,549
Number of customers under renegotiated
terms portfolio
- - - - - -
Portfolio under renegotiated terms, gross - - - - - -
Total gross portfolio 32,233 26,696 2,411 - 5,210 66,549
Securitized portfolio
As of December 31, 2016 the detail of the securitized portfolio is as follows:
Current
Between 1
and 30 days
Between 31
and 60 days
Between 61
and 90 days
More than
91 days Total
MUS$ MUS$ MUS$ MUS$ MUS$ MUS$
Number of customers, portfolio under no
renegotiated terms
455 118 52 19 14 658
Portfolio under no renegotiated terms 271,839 16,036 4,807 1,182 1,243 295,107
Number of customers under renegotiated
terms portfolio
- - - - - -
Portfolio under renegotiated terms, gross - - - - - -
Total gross portfolio 271,839 16,036 4,807 1,182 1,243 295,107
As of December 31, 2017and 2016, movements in provisions are as follows:
Credit risk concentration
Credit risk concentration with respect to trade receivables is reduced due to the great number of entities in the
Company’s client base and their distribution throughout the world.
Reconciliation 12/31/2017 12/31/2016
ThUS$ ThUS$
Opening balance 21,616 19,731
Additional provisions 7,172 10,632
Increase (decrease in provisions) (7,977) (8,747)
Closing balance 20,811 21,616

10) FINANCIAL REPORTS
219
Note 10 Financial instruments (continued)
10.3 Hedging assets and liabilities
The balance represents derivative instruments measured at fair value which have been classified as hedges from
exchange and interest rate risks related to the total obligations associated with bonds in Chilean pesos and UF. As
of December 31, 2017, the notional amount of cash flows in Cross Currency Swap contracts agreed upon in US
dollars amounted to ThUS$266,335 and as of December 31, 2016 such contracts amounted to ThUS$320,155.
Hedging assets with
underlying debt
Derivative
instruments (Fwds)
Effect on profit or loss
for the period
Derivative
instruments
Hedging reserve in
gross equity
Deferred tax
hedging reserve
in equity Hedging reserve
in equity
ThUS$ ThUS$ ThUS$ ThUS$ ThUS$
December 31, 2017 8,910 5,641 2,170 - 2,170
Hedging liabilities with
underlying debt
Derivative
instruments (CCS)
Effect on profit or loss
for the period
Derivative
instruments
Hedging reserve
in gross equity
Deferred tax
hedging reserve
in equity
Hedging
reserve in
equity
ThUS$ ThUS$ ThUS$ ThUS$ ThUS$
December 31, 2017 17,128 33,696 41 - 41
Hedging liabilities with
underlying investments
Derivative
instruments
(CCS)
Effect on profit or loss
for the period
Derivative
instruments
Hedging reserve in
gross equity
Deferred tax
hedging reserve
in equity
Hedging
reserve in
equity
ThUS$ ThUS$ ThUS$ ThUS$ ThUS$
December 31, 2017 (20,159) (20,256) 97 - 97
Hedging assets with
underlying debt
Derivative
instruments (Fwds)
Effect on profit or loss
for the period
Derivative
instruments
Hedging reserve in
gross equity
Deferred tax
hedging reserve
in equity Hedging reserve
in equity
ThUS$ ThUS$ ThUS$ ThUS$ ThUS$
December 31, 2016 830 789 41 (9) 32
Hedging liabilities with
underlying debt
Derivative
instruments (CCS)
Effect on profit or loss
for the period
Derivative
instruments
Hedging reserve
in gross equity
Deferred tax
hedging reserve
in equity
Hedging
reserve in
equity
ThUS$ ThUS$ ThUS$ ThUS$ ThUS$
December 31, 2016 43,235 28,108 (29) 5 (24)

10) FINANCIAL REPORTS
220
Note 10 Financial instruments (continued)
10.3 Hedging assets and liabilities, continued
The balances in the “effect on profit or loss” column consider the interim effects of the contracts in force as of
December 31, 2017 and 2016.
Derivative contract maturities are detailed as follows:
Series Contract amount
ThUS$ Currency Maturity date
H 191,638 UF 01/05/2018
O 58,748 UF 02/01/2022
The Company uses cross currency swap derivative instruments to hedge the possible financial risk associated with
the volatility of the exchange rate associated with Chilean pesos and UF. The objective is to hedge the exchange rate
financial risks associated with bonds payable. Hedges are documented and tested to measure their effectiveness.
Based on a comparison of critical terms, hedging is highly effective, given that the hedged amount is consistent with
obligations maintained for bonds denominated in Chilean pesos and UF. Likewise, hedging contracts are
denominated in the same currencies and have the same expiration dates of bond principal and interest payments.
Hedge Accounting
The Company classifies derivative instruments as hedging that may include derivative or embedded derivatives
either as fair value hedge derivative instruments, cash flow hedge derivative instruments, or hedge derivative
instruments for net investment in a business abroad.
a) Fair value hedge
Changes in fair values of derivative instruments classified as fair value hedge derivative instruments are accounted
for in gains and losses immediately along with any change in the fair value of the hedged item that is attributable to
the risk being hedged.
The Company documents the relationship between hedge instruments and the hedged item along with the objectives
of its risk management and strategy to carry out different hedging transactions. In addition, upon commencement of
the period hedged and then on a quarterly basis, the Company documents whether hedge instruments have been
efficient and met the objective of hedging market fluctuations. For this purpose, we use the effectiveness test. A
hedge instrument is deemed effective if the effectiveness test result is between 80% and 125%.
Hedging liabilities with
underlying investments
Derivative
instruments
(CCS)
Effect on profit or loss
for the period
Derivative
instruments
Hedging reserve in
gross equity
Deferred tax
hedging reserve
in equity
Hedging
reserve in
equity
ThUS$ ThUS$ ThUS$ ThUS$ ThUS$
December 31, 2016 218 (294) 76 (19) 57

10) FINANCIAL REPORTS
221
Note 10 Financial instruments (continued)
10.3 Hedging assets and liabilities, continued
The hedge instruments are classified as effective or not effective on the basis of the effectiveness test results. At
present, hedges are classified as effective on the basis of the effectiveness tests. This note includes the detail of fair
values of derivatives classified as hedging instruments.
b) Cash flow hedges
Cash flow hedges cover exposure to the cash flow variations attributable to a risk associated with a specific
transaction that is very likely to be executed, which may have material effects on the results of the Company.
10.4 Financial liabilities
Other current and non-current financial liabilities
As of December 31, 2017 and December 31, 2016, the detail is as follows:
12/31/2017 12/31/2016
Current Non-current Total Current Non-current Total
ThUS$ ThUS$ ThUS$ ThUS$ ThUS$ ThUS$
Bank borrowings 163,568 - 163,568 101,270 - 101,270
Obligations with the public
(bonds) 13,494 1,031,507 1,045,001
58,973 1,059,706
1,118,679
Derivatives 5,979 - 5,979 1,920 - 1,920
Hedging liabilities 37,287 - 37,287 16,981 33,732 50,713
Total 220,328 1,031,507 1,251,835 179,144 1,093,438 1,272,582
Note 10 Financial instruments (continued)
10.4 Financial liabilities, continued
Current and non-current bank borrowings
As of December 31, 2017 and December 31, 2016, the detail is as follows:
12/31/2017 12/31/2016
ThUS$ ThUS$
Long-term bank borrowings - -
Short-term bank borrowings 163,568 101.270
Short-term borrowings and current portion of long-term borrowings 163,568 101.270
Total bank borrowings 163,568 101.270
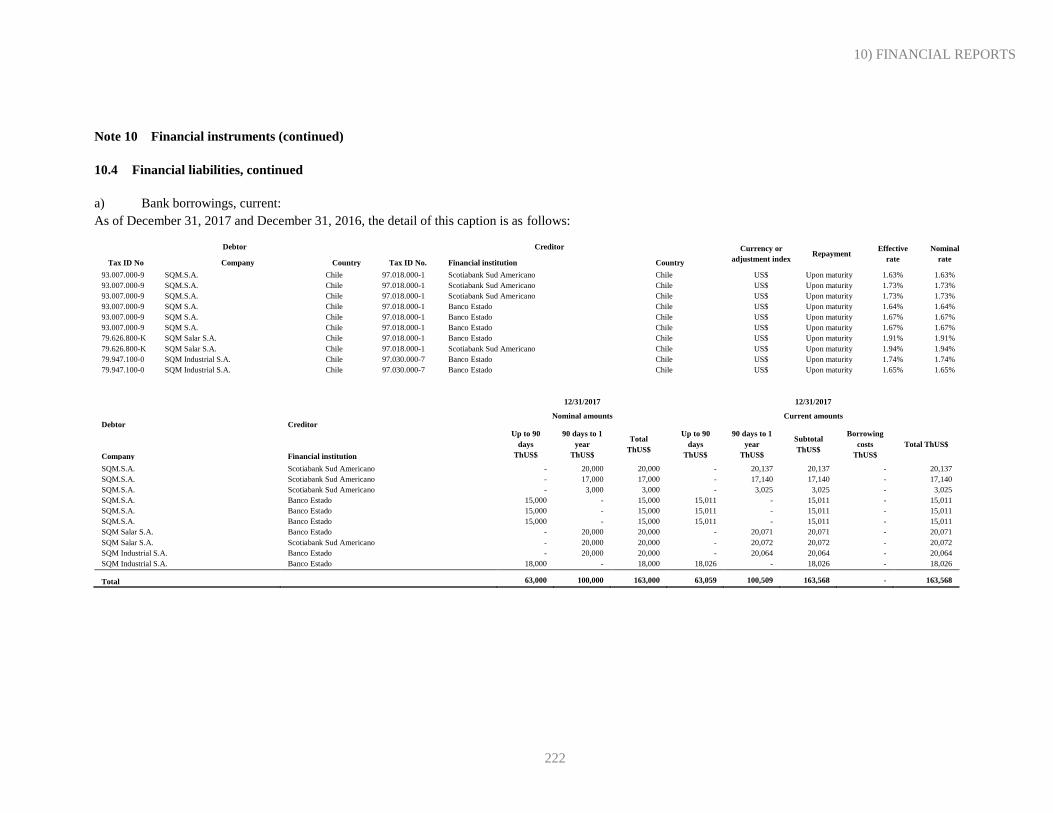
10) FINANCIAL REPORTS
222
Note 10 Financial instruments (continued)
10.4 Financial liabilities, continued
a) Bank borrowings, current:
As of December 31, 2017 and December 31, 2016, the detail of this caption is as follows:
Debtor Creditor Currency or
adjustment index Repayment
Effective
rate
Nominal
rate Tax ID No Company Country Tax ID No. Financial institution Country
93.007.000-9 SQM.S.A. Chile 97.018.000-1 Scotiabank Sud Americano Chile US$ Upon maturity 1.63% 1.63%
93.007.000-9 SQM.S.A. Chile 97.018.000-1 Scotiabank Sud Americano Chile US$ Upon maturity 1.73% 1.73%
93.007.000-9 SQM.S.A. Chile 97.018.000-1 Scotiabank Sud Americano Chile US$ Upon maturity 1.73% 1.73%
93.007.000-9 SQM S.A. Chile 97.018.000-1 Banco Estado Chile US$ Upon maturity 1.64% 1.64%
93.007.000-9 SQM S.A. Chile 97.018.000-1 Banco Estado Chile US$ Upon maturity 1.67% 1.67%
93.007.000-9 SQM S.A. Chile 97.018.000-1 Banco Estado Chile US$ Upon maturity 1.67% 1.67%
79.626.800-K SQM Salar S.A. Chile 97.018.000-1 Banco Estado Chile US$ Upon maturity 1.91% 1.91%
79.626.800-K SQM Salar S.A. Chile 97.018.000-1 Scotiabank Sud Americano Chile US$ Upon maturity 1.94% 1.94%
79.947.100-0 SQM Industrial S.A. Chile 97.030.000-7 Banco Estado Chile US$ Upon maturity 1.74% 1.74%
79.947.100-0 SQM Industrial S.A. Chile 97.030.000-7 Banco Estado Chile US$ Upon maturity 1.65% 1.65%
12/31/2017 12/31/2017
Debtor Creditor Nominal amounts Current amounts
Company Financial institution
Up to 90
days
ThUS$
90 days to 1
year
ThUS$
Total
ThUS$
Up to 90
days
ThUS$
90 days to 1
year
ThUS$
Subtotal
ThUS$
Borrowing
costs
ThUS$
Total ThUS$
SQM.S.A. Scotiabank Sud Americano - 20,000 20,000 - 20,137 20,137 - 20,137
SQM.S.A. Scotiabank Sud Americano - 17,000 17,000 - 17,140 17,140 - 17,140
SQM.S.A. Scotiabank Sud Americano - 3,000 3,000 - 3,025 3,025 - 3,025
SQM.S.A. Banco Estado 15,000 - 15,000 15,011 - 15,011 - 15,011
SQM.S.A. Banco Estado 15,000 - 15,000 15,011 - 15,011 - 15,011
SQM.S.A. Banco Estado 15,000 - 15,000 15,011 - 15,011 - 15,011
SQM Salar S.A. Banco Estado - 20,000 20,000 - 20,071 20,071 - 20,071
SQM Salar S.A. Scotiabank Sud Americano - 20,000 20,000 - 20,072 20,072 - 20,072
SQM Industrial S.A. Banco Estado - 20,000 20,000 - 20,064 20,064 - 20,064
SQM Industrial S.A. Banco Estado 18,000 - 18,000 18,026 - 18,026 - 18,026
Total 63,000 100,000 163,000 63,059 100,509 163,568 - 163,568

10) FINANCIAL REPORTS
223
Note 10 Financial instruments (continued)
10.4 Financial liabilities, continued
Debtor Creditor Currency or
adjustment index Repayment
Effective
rate
Nominal
rate Tax ID No Company Country Tax ID No. Financial institution Country
93.007.000-9 SQM.S.A. Chile 97.018.000-1 Scotiabank Sud Americano Chile US$ Upon maturity 1.00% 1.00%
93.007.000-9 SQM.S.A. Chile 97.030.000-7 Banco Estado Chile US$ Upon maturity 4.3% 4.3%
93.007.000-9 SQM.S.A. Chile 97.018.000-1 Scotiabank Sud Americano Chile US$ Upon maturity 0.74% 0.85%
93.007.000-9 SQM.S.A. Chile 97.018.000-1 Scotiabank Sud Americano Chile US$ Upon maturity 0.74% 0.84%
79.626.800-K SQM Salar S.A. Chile 97.018.000-1 Scotiabank Sud Americano Chile US$ Upon maturity 1.34% 0.84%
79.947.100-0 SQM Industrial S.A. Chile 97.030.000-7 Banco Estado Chile US$ Upon maturity 1.20% 1.20%
12/31/2016 1231/2016
Debtor Creditor Nominal amounts Current amounts
Company Financial institution
Up to 90
days
ThUS$
90 days to 1
year
ThUS$
Total
ThUS$
Up to 90
days
ThUS$
90 days to 1
year
ThUS$
Subtotal
ThUS$
Borrowing
costs
ThUS$
Total ThUS$
SQM.S.A. Scotiabank Sud Americano - 20,000 20,000 30 20,000 20,030 - 20,030
SQM.S.A. Banco Estado - 20,412 20,412 - 20,919 20,919 - 20,919
SQM.S.A. Scotiabank Sud Americano - 17,000 17,000 - 17,057 17,057 - 17,057
SQM.S.A. Scotiabank Sud Americano - 3,000 3,000 - 3,010 3,010 - 3,010
SQM Salar S.A. Scotiabank Sud Americano - 20,000 20,000 - 20,042 20,042 - 20,042
SQM Industrial S.A. Banco Estado 20,000 - 20,000 20,212 - 20,212 - 20,212
Total 20,000 80,412 100,412 20,242 81,028 101,270 - 101,270

10) FINANCIAL REPORTS
224
Note 10 Financial instruments (continued)
10.4 Financial liabilities, continued
b) Unsecured obligations, current:
As of December 31, 2017 and December 31, 2016, the detail of current unsecured interest-bearing obligations is composed of promissory notes and bonds, as follows:
Bonds
Debtor
Number of
registration or ID of
the instrument
Series Maturity
date
Currency or
adjustment
index
Periodicity Effective rate Nominal rate
Tax ID No. Company País Payment of
interest Repayment
93,007,000-9 SQM S.A. Chile - ThUS$250,000 04/21/2018 US$ Semiannual Upon maturity 1.47% 5.50%
93,007,000-9 SQM S.A. Chile - ThUS$250,000 01/28/2018 US$ Semiannual Upon maturity 3.17% 4.38%
93,007,000-9 SQM S.A. Chile - ThUS$300,000 0403/2018 US$ Semiannual Upon maturity 2.12% 3.63%
93,007,000-9 SQM S.A. Chile 564 H 01/05/2018 UF Semiannual Semiannual 2.18% 4.90%
93,007,000-9 SQM S.A. Chile 699 O 02/01/2018 UF Semiannual Upon maturity 2.80% 3.80%
Series
12/31/2017 12/31/2017
Nominal maturities Current maturities
Company Country Up to 90 days
91 days to 1
year Total Up to 90 days
91 days to 1
year Subtotal
Bond
issuance
costs
Total
ThUS$ ThUS$ ThUS$ ThUS$ ThUS$ ThUS$ ThUS$ ThUS$
SQM S.A. Chile ThUS$250,000 - - - 2,674 2,674 (385) 2,289
SQM S.A. Chile ThUS$250,000 - - 4,648 - 4,648 (433) 4,215
SQM S.A. Chile ThUS$300,000 - - - - 2,658 2,658 (615) 2,043
SQM S.A. Chile H - - - 4,127 - 4,127 (139) 3,988
SQM S.A. Chile O - - - 1,026 - 1,026 (67) 959
Total - - - 9,801 5,332 15,133 (1,639) 13,494
Effective rates of bonds in Chilean pesos and UF are expressed and calculated in U.S. dollars based on the flows agreed in Cross Currency Swap Agreements.

10) FINANCIAL REPORTS
225
Note 10 Financial instruments (continued)
10.4 Financial liabilities, continued
Debtor
Number of
registration or ID of
the instrument
Series Maturity
date
Currency or
adjustment
index
Periodicity Effective rate Nominal rate
Tax ID No. Company País Payment of
interest Repayment
93.007.000-9 SQM S.A. Chile - ThUS$250,000 10/21/2016 US$ Semiannual Upon maturity 1.97% 5.50%
93.007.000-9 SQM S.A. Chile - ThUS$250,000 01/28/2017 US$ Semiannual Upon maturity 3.61% 4.38%
93.007.000-9 SQM S.A. Chile - ThUS$300,000 10/03/2016 US$ Semiannual Upon maturity 2.48% 3.63%
93.007.000-9 SQM S.A. Chile 446 C 12/01/2016 UF Semiannual Semiannual 1.34% 4.00%
93.007.000-9 SQM S.A. Chile 564 H 01/05/2017 UF Semiannual Semiannual 2.47% 4.90%
93.007.000-9 SQM S.A. Chile 700 M 02/01/2017 UF Semiannual Upon maturity 0.69% 3.30%
93.007.000-9 SQM S.A. Chile 699 O 02/01/2017 UF Semiannual Upon maturity 3.00% 3.80%
Series
12/31/2016 12/31/2016
Nominal maturities Current maturities
Company Country Up to 90 days
91 days to 1
year Total Up to 90 days
91 days to 1
year Subtotal
Bond
issuance
costs
Total
ThUS$ ThUS$ ThUS$ ThUS$ ThUS$ ThUS$ ThUS$ ThUS$
SQM S.A. Chile ThUS$250,000 - - - - 2,674 2,674 (386) 2,288
SQM S.A. Chile ThUS$250,000 - - - 4,649 - 4,649 (433) 4,216
SQM S.A. Chile ThUS$300,000 - - - - 2,658 2,658 (615) 2,043
SQM S.A. Chile C - 5,903 5,903 - 6,098 6,098 - 6,098
SQM S.A. Chile H - - - 3,726 - 3,726 (139) 3,587
SQM S.A. Chile M 39,356 - 39,356 39,893 - 39,893 (11) 39,882
SQM S.A. Chile O - - - 926 - 926 (67) 859
Total 39,356 5,903 45,259 49,194 11,430 60,624 (1,651) 58,973
Effective rates of bonds in Chilean pesos and UF are expressed and calculated in U.S. dollars based on the flows agreed in Cross Currency Swap Agreements.
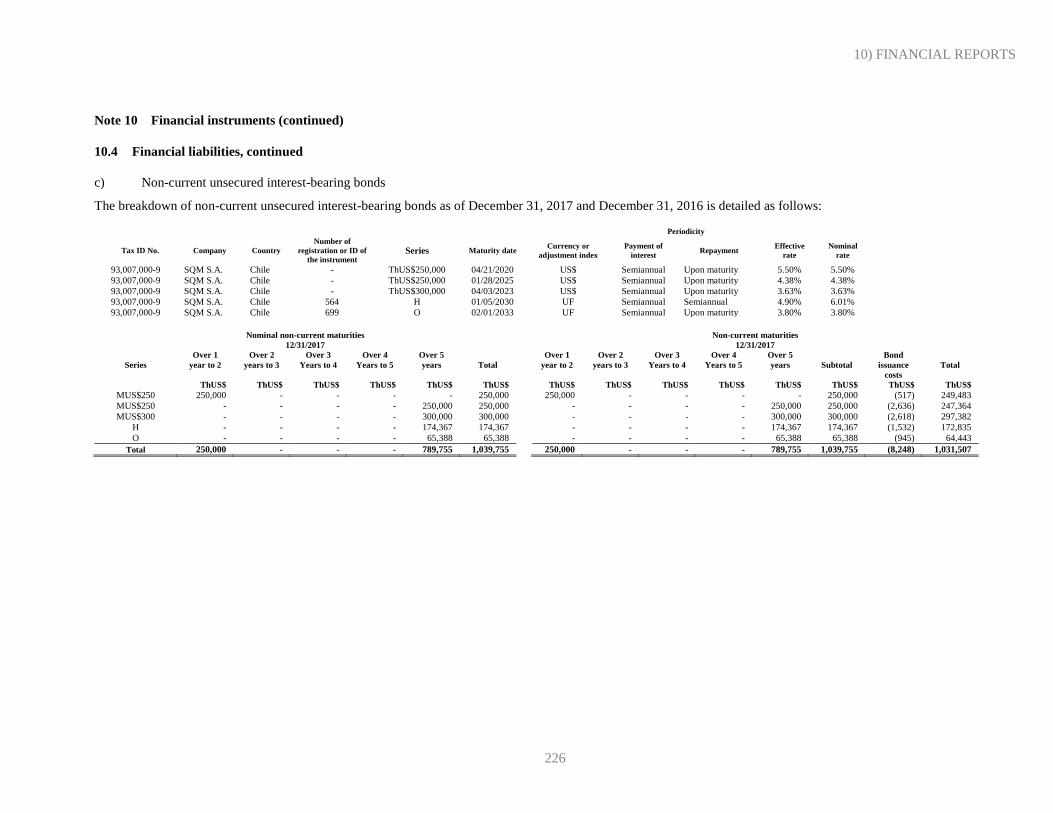
10) FINANCIAL REPORTS
226
Note 10 Financial instruments (continued)
10.4 Financial liabilities, continued
c) Non-current unsecured interest-bearing bonds
The breakdown of non-current unsecured interest-bearing bonds as of December 31, 2017 and December 31, 2016 is detailed as follows:
Periodicity
Tax ID No. Company Country
Number of
registration or ID of
the instrument Series Maturity date
Currency or
adjustment index Payment of
interest Repayment
Effective
rate Nominal
rate
93,007,000-9 SQM S.A. Chile - ThUS$250,000 04/21/2020 US$ Semiannual Upon maturity 5.50% 5.50%
93,007,000-9 SQM S.A. Chile - ThUS$250,000 01/28/2025 US$ Semiannual Upon maturity 4.38% 4.38%
93,007,000-9 SQM S.A. Chile - ThUS$300,000 04/03/2023 US$ Semiannual Upon maturity 3.63% 3.63%
93,007,000-9 SQM S.A. Chile 564 H 01/05/2030 UF Semiannual Semiannual 4.90% 6.01%
93,007,000-9 SQM S.A. Chile 699 O 02/01/2033 UF Semiannual Upon maturity 3.80% 3.80%
Nominal non-current maturities
12/31/2017
Non-current maturities
12/31/2017
Series
Over 1
year to 2
Over 2
years to 3
Over 3
Years to 4
Over 4
Years to 5
Over 5
years
Total
Over 1
year to 2
Over 2
years to 3
Over 3
Years to 4
Over 4
Years to 5
Over 5
years
Subtotal
Bond
issuance
costs
Total
ThUS$ ThUS$ ThUS$ ThUS$ ThUS$ ThUS$ ThUS$ ThUS$ ThUS$ ThUS$ ThUS$ ThUS$ ThUS$ ThUS$
MUS$250 250,000 - - - - 250,000 250,000 - - - - 250,000 (517) 249,483
MUS$250 - - - - 250,000 250,000 - - - - 250,000 250,000 (2,636) 247,364
MUS$300 - - - - 300,000 300,000 - - - - 300,000 300,000 (2,618) 297,382
H - - - - 174,367 174,367 - - - - 174,367 174,367 (1,532) 172,835
O - - - - 65,388 65,388 - - - - 65,388 65,388 (945) 64,443
Total 250,000 - - - 789,755 1,039,755 250,000 - - - 789,755 1,039,755 (8,248) 1,031,507

10) FINANCIAL REPORTS
227
Note 10 Financial instruments (continued)
10.4 Financial liabilities, continued
d) Non-current unsecured interest-bearing bonds, continued
As of December 31, 2017 and December 31, 2016, the breakdown of unsecured interest-bearing liabilities, non-current is as follows:
Periodicity
Tax ID No. Company Country
Number of
registration or ID of
the instrument Series Maturity date
Currency or
adjustment index Payment of
interest Repayment
Effective
rate Nominal
rate
93,007,000-9 SQM S.A. Chile - ThUS$250,000 04/21/2020 US$ Semiannual Upon maturity 5.94% 5.50%
93,007,000-9 SQM S.A. Chile - ThUS$250,000 01/28/2025 US$ Semiannual Upon maturity 4.62% 4.38%
93,007,000-9 SQM S.A. Chile - ThUS$300,000 04/03/2023 US$ Semiannual Upon maturity 3.95% 3.63%
93,007,000-9 SQM S.A. Chile 446 C 12/01/2026 UF Semiannual Semiannual 5.57% 4.00%
93,007,000-9 SQM S.A. Chile 564 H 01/05/2030 UF Semiannual Semiannual 5.22% 4.90%
93,007,000-9 SQM S.A. Chile 699 O 02/01/2033 UF Semiannual Upon maturity 3.97% 3.80%
Nominal non-current maturities
12/31/2016
Non-current maturities
12/31/2016
Series
Over 1
year to 2
Over 2
years to 3
Over 3
Years to 4
Over 4
Years to 5
Over 5
years
Total
Over 1
year to 2
Over 2
years to 3
Over 3
Years to 4
Over 4
Years to 5
Over 5
years
Subtotal
Bond
issuance
costs
Total
ThUS$ ThUS$ ThUS$ ThUS$ ThUS$ ThUS$ ThUS$ ThUS$ ThUS$ ThUS$ ThUS$ ThUS$ ThUS$ ThUS$
MUS$250 - 250,000 - - - 250,000 - 250,000 - - - 250,000 (904) 249,096
MUS$250 - - - - 250,000 250,000 - - - - 250,000 250,000 (3,069) 246,931
MUS$300 - - - - 300,000 300,000 - - - - 300,000 300,000 (3,230) 296,770
C 5,903 5,903 5,903 5,903 29,519 53,131 5,903 5,903 5,903 5,903 29,519 53,131 - 53,131
H - - - - 157,426 157,426 - - - - 157,426 157,426 (1,671) 155,755
O - - - - 59,035 59,035 - - - - 59,035 59,035 (1,012) 58,023
Total 5,903 255,903 5,903 5,903 795,980 1,069,592 5,903 255,903 5,903 5,903 795,980 1,069,592 (9,886) 1,059,706

10) FINANCIAL REPORTS
228
Note 10 Financial instruments (continued)
10.4 Financial liabilities, continued
e) Additional information
On December 15, 2017, the Company filed a request with the Financial Markets Commission (FMC, formerly the
Chilean Superintendence of Securities and Insurance) to modify the bond line registered in the FMC Securities
Registry on December 31, 2008, under number 563. The main objective of this change is to adapt the obligations
and grounds for early payment and default to the Company's current circumstances. If the modified line is approved
by the Financial Markets Commission, a series of bonds denominated Series P will be issued for a nominal value of
up to UF 3 million, with a maturity date of January 15, 2028.
Once these bonds have been approved by the Financial Markets Commission, they are expected to be placed through
direct sale to investors.
Bonds
On December 31, 2017 and December 31, 2016, short term bonds of ThUS$13,494 and ThUS$58,973 respectively
were classified as short-term, consisting of the current portion due plus accrued interest to date; debt is presented
net of bond issuance costs. The non-current portion consisted of ThUS$1,031,507 on December 31, 2017 and
ThUS$1,059,706 on December 31, 2016, corresponding to the issuance series H bonds second issue single series
bonds (ThUS$250), series M bonds, series O bonds, third issue single series bonds (ThUS$300) and fourth issue
single series bonds (ThUS$250) excluding debt issue costs.
As of December 31, 2017 and December 31, 2016, the details of each issuance are as follows:
Series “C” bonds
On January 24, 2006, the Company placed Series C bonds for UF 3,000,000 (ThUS$101,918) at an annual rate of
4.00%.
On July 5, 2017, the Series C bond was prepaid.
As of December 31, 2017, December 31 and 2016, the Company has made the following payments with a charge to
the Series C bonds:
Payments made 12/31/2017 12/31/2016
ThUS$ ThUS$
Principal payment 57,290 5,729
Interest payment 1,515 3,275

10) FINANCIAL REPORTS
229
Note 10 Financial instruments (continued)
10.4 Financial liabilities, continued
Single series first issue ThUS$200,000
On April 5, 2006, the Company placed Single Series bonds for ThUS$200,000 at an annual rate of 6.125% under
"Rule 144 and regulation S of the U.S. Securities Act of 1933."
As of December 31, 2017, December 31 and 2016, the Company has made the following payments with a charge to
the Single series bonds:
Payments made 12/31/2017
ThUS$
12/31/2016
ThUS$
Payments of principal owed - 200,000
Payments of interest - 6,125
Series “G” and “H” bonds
On January 13, 2009, the Company placed two bond series in the domestic market. The first was Series H for UF
4,000,000 (ThUS$139,216) at an annual interest rate of 4.9%, with a term of 21 years and payment of the principal
beginning in 2019. The second was Series G for ThCh$21,000,000 (ThUS$34,146), which was placed at a term of
5 years with a single payment at the maturity of the term and an annual interest rate of 7%.
As of December 31, 2017, December 31 and 2016, the Company has made the following payments with a charge to
the Series H bonds:
Payments made 12/31/2017
ThUS$
12/31/2016
ThUS$
Payments of interest, Series H bonds 7,691 7,289

10) FINANCIAL REPORTS
230
Note 10 Financial instruments (continued)
10.4 Financial liabilities, continued
Single series bonds, second issue ThUS$250,000
On April 21, 2010, the Company informed the Financial Markets Commission (formerly the Chilean
Superintendence of Securities and Insurance) of its placement in international markets of an unsecured bond of
ThUS$250,000 with a maturity of 10 years beginning on the aforementioned date with an annual interest rate of
5.5% and destined to refinance long-term liabilities.
As of December 31, 2017, December 31 and 2016, the detail of payments charged to the line of single series bonds,
second issue is as follows:
Payments made 12/31/2017
ThUS$
12/31/2016
ThUS$
Interest payment 13,750 13,750
Series “M” and “O” bonds
On April 4, 2012, the Company placed two bond series in the domestic market. Series M for UF 1,000,000
(ThUS$46,601) was placed at a term of 5 years with a single payment at the maturity of the term and an annual
interest rate of 3.3%. Series O for UF 1,500,000 (ThUS$69,901) was placed at a term of 21 years with a single
payment at the maturity of the term and an annual interest rate of 3.80%
As of December 31, 2017, December 31 and 2016 the Company has made the following payments with a charge to
the Series M and O bonds:
Payments made 12/31/2017
ThUS$
12/31/2016
ThUS$
Payment of interest, Series M bonds 667 1,242
Payment of interest, Series O bonds 2,301 2,142
Single series bonds, third issue ThUS$300,000
On April 3, 2013, the Company issued a non-guaranteed bond in the United States with a value of US$300 million.
The bond is for a 10-year term with an annual coupon rate of 3.625% and an annual yield of 3.716%. This rate
equates to a difference of 180 basis points to comparable US Treasury bonds. The funds raised will be used to
refinance long term liabilities and finance general corporate objectives.
As of December 31, 2017, December 31 and 2016, the following payments have been made with a debit to the line
of single-series bonds, third issue:
Payments made 12/31/2017
ThUS$
12/31/2016
ThUS$
Payment of interest 10,875 10,875

10) FINANCIAL REPORTS
231
Note 10 Financial instruments (continued)
10.4 Financial liabilities, continued
Single series bonds, fourth issuance ThUS$250
On October 23, 2014, the Company informed the Financial Markets Commission (formerly the Chilean
Superintendence of Securities and Insurance) that Sociedad Química y Minera de Chile S.A. had agreed to issue and
place unsecured bonds of ThUS$250,000 in international markets. These mature in 2025 and have annual interest
rate of 4.375%, equivalent to a spread of 215 basis points on comparable US Treasury bonds, which were offered to
investors at a price of 99.410% with respect to capital. The aforementioned agreement was agreed on October 23,
2014 and the issuance and placement of such bonds was performed in conformity with the provisions of Rule 144A
of the US Securities Act of 1933 and these bonds will not be publicly offered in Chile.
As of December 31, 2017, December 31 and 2016, the following payments have been made.
Payments made 12/31/2017
ThUS$
12/31/2016
ThUS$
Payment of interest 10,938 10,938
10.5 Trade and other payables
12/31/2017 12/31/2016
Current
Non-
current Total Current
Non-
current Total
ThUS$ ThUS$ ThUS$ ThUS$ ThUS$ ThUS$
Accounts payable 195.858 - 195,858 200,215 - 200,215
Other accounts payable 422 - 422 281 - 281
Total 196.280 - 196,280 200,496 - 200,496
Purchase commitments held by the Company are recognized as liabilities when the goods and services are received
by the Company. As of December 31, 2017, the Company has purchase orders amounting to ThUS$41,601
(ThUS$19,959 as of December 31, 2016).

10) FINANCIAL REPORTS
232
Note 10 Financial instruments (continued)
10.6 Financial liabilities at fair value through profit or loss
This balance relates to derivative instruments measured at their fair value, which has generated balances against the
Company. The detail of this type of instrument is as follows:
Financial liabilities at fair value
through profit or loss 12/31/2017
ThUS$ Effect on
profit or loss
as of
12/31/2017
12/31/2016
ThUS$ Effect on
profit or loss
as of
12/31/2016
ThUS$ ThUS$
Current Derivative instruments (IRS) - - - (229)
- - - (229)
Balances in the “effect on profit or loss” column consider the effects of agreements which were in force as of
December 31, 2017, including derivatives received during the year.

10) FINANCIAL REPORTS
233
Note 10 Financial instruments (continued)
10.7 Financial asset and liability categories
a) Financial Assets
12/31/2017 12/31/2016
Financial
Current Non-current Total
Current Non-
current Total
Description of financial assets instruments Amount
ThUS$
Amount
ThUS$
Amount
ThUS$
Amount
ThUS$
Amount
ThUS$
Amount
ThUS$
Cash and cash equivalent 630,438 - 630,438 514,669 - 514,669
Trade receivables due from related parties 74,089 - 74,089 82,259 - 82,259
Financial assets measured at amortized cost Term deposits 360,941 45 360,986 284,160 44 284,204
Loans and receivables measured at amortized cost
Trade and
other
receivables
423,047 1,912 424,959 368,761 1,840 370,601
Total financial assets measured at amortized cost 1,488,515 1,957 1,490,472 1,249,849 1,884 1,251,733
Financial assets at fair value through profit or loss Derivative
instruments 6,038 8,910 14,948
5,029
7,156
12,185
Financial assets classified as available for sale at fair value through equity Other
investments - 53,924 53,924 - 26,899 26,899
Total financial assets at fair value 6,038 62,834 68,872 5,029 34,055 39,084
Total financial assets 1,494,553 64,791 1,559,344 1,254,878 35,939 1,290,817

10) FINANCIAL REPORTS
234
Note 10 Financial instruments (continued)
10.7 Financial asset and liability categories (continued)
b) Financial liabilities
12/31/2017
12/31/2016
Financial
Current Non-current Total
Current Non-
current Total
Description of financial liabilities instruments Amount
ThUS$
Amount
ThUS$
Amount
ThUS$
Amount
ThUS$
Amount
ThUS$
Amount
ThUS$
Trade payables due to related parties
1,365 - 1,365 7 - 7
Financial liabilities at fair value through profit or loss Derivative
instruments 43,266 - 43,266 18,901 33,732 52,633
Financial liabilities at fair value through profit or loss 44,631 - 44,631 18,908 33,732 52,640
Financial liabilities measured at amortized cost Bank borrowings 163,568 - 163,568 101,270 - 101,270
Financial liabilities measured at amortized cost Obligations with
the public 13,494 1,031,507 1,045,001 58,973 1,059,706 1,118,679
Financial liabilities measured at amortized cost Trade and other
payables 196,280 - 196,280 200,496 - 200,496
Total financial liabilities measured at amortized cost 373,342 1,031,507 1,404,849 360,739 1,059,706 1,420,445
Total financial liabilities 417,973 1,031,507 1,449,480 379,647 1,093,438 1,473,085

10) FINANCIAL REPORTS
235
Note 10 Financial instruments (continued)
10.8 Fair value measurement of assets and liabilities
Financial assets and liabilities measured at fair value consist of Options and Forwards hedging the mismatch in the
balance sheet and cash flows, Cross Currency Swaps (CCS) to hedge bonds issued in local currency ($/UF), and
Interest Rate Swaps (IRS) to hedge LIBOR rate debt issued.
The value of the Company’s assets and liabilities recognized by CCS contracts is calculated as the difference
between the present value of discounted cash flows of the asset (pesos/UF) and liability (US$) parts of the derivative.
In the case of the IRS, the asset value recognized is calculated as the difference between the discounted cash flows
of the asset (variable rate) and liability (fixed rate) parts of the derivative. Forwards: Are calculated as the difference
between the strike price of the contract and the spot price plus the forwards points at the date of the contract. Options:
The value recognized is calculated using the Black-Scholes method.
In the case of CCS, the entry data used for the valuation models are UF, peso, USD and basis swap rates. In the case
of fair value calculations for IRS, the FRA (Forward Rate Agreement) rate and ICVS 23 Curve (Bloomberg:
cash/deposits rates, futures, swaps). In the case of forwards, the forwards curve for the currency in question is used.
Finally, with options, the spot price, risk-free rate and volatility of exchange rate are used, all in accordance with the
currencies used in each valuation. The financial information used as entry data for the Company’s valuation models
is obtained from Bloomberg, the well-known financial software company. Conversely, the fair value provided by
the counterparties of derivatives contracts is used only as a control and not for valuation.
The effects on profit or loss of movements in these amounts may be recognized in the caption Finance costs, foreign
currency translation gain (loss) or cash flow hedges in the statement of comprehensive income, depending on each
particular case.
The fair value measurement of debt is only performed to determine the present market value of secured and
unsecured long-term obligations; bonds denominated in local currency (Ch$/UF) and foreign currency (US$), credits
denominated in foreign currency (US$), which is classified under Level 2 in the fair value hierarchy established by
IFRS.
The value of the Company’s reported liabilities is calculated as the present value of discounted cash flows at market
rates at the time of valuation, taking into account the maturity date and exchange rate. The entry data used for the
model includes the UF and peso rates, which are obtained using Bloomberg, the well-known financial software
company and the “Asociación de Bancos e Instituciones Financieras” (ABIF) (Association of Banks and Financial
Institutions’).

10) FINANCIAL REPORTS
236
Note 10 Financial instruments (continued)
10.8 Fair value measurement of assets and liabilities, continued
Fair value hierarchy
The fair value hierarchy is detailed as follows:
a) Level 1: using quoted prices (unadjusted) only in active markets.
b) Level 2: when in any phase in the valuation process inputs other than quoted prices have been used in
Level 1 that are observable directly in markets.
c) Level 3: inputs for the asset or liability that are not based on observable market data.
The valuation technique used for determining fair value of our hedging instruments is that indicated in Level 2.
Fair value Measurement methodology
12/31/2017 Level 1 Level 2 Level 3
ThUS$ ThUS$ ThUS$ ThUS$
Financial assets
Investment
Investment SQM Australia 24,746 - 24,746
Shares 9,159 9,159 - -
Non-hedging derivatives
Forwards 2,744 - 2,744 -
Options 110 - 110 -
Swaps 3,184 - 3,184 -
Hedging derivatives
Swaps 8,726 - 8,726 -
Deposits, more than 90 days 360,941 360,941 -
Shares purchase option 20,000 20,000 -
Other 249 - 249 -
Financial liabilities
Non-hedging derivatives
Forwards 5,534 - 5,534 -
Options 445 - 445 -
Hedging derivatives
Swaps 37,287 - 37,287 -
Bank loans 163,568 - 163,568 -
Non-guaranteed bonds 1,039,956 - 1,039,956 -
Other 5,945 - 5,945 -

10) FINANCIAL REPORTS
237
Note 10 Financial instruments (continued)
10.8 Fair value measurement of assets and liabilities, continued
Fair value Measurement methodology
12/31/2016 Level 1 Level 2 Level 3
ThUS$ ThUS$ ThUS$ ThUS$
Financial assets
Investment
Shares 6,879 6,879 - -
Non-hedging derivatives
Forwards 924 - 924 -
Options 426 - 426 -
Swaps 2,745 - 2,745 -
Hedging derivatives
Swaps 8,090 - 8,090 -
Deposits, more than 90 days 284,159 284,159 -
Shares purchase option 20,000 20,000 -
Other 2,809 - 2,809 -
Financial liabilities
Non-hedging derivatives
Forwards 871 - 871 -
Options 363 - 363 -
Hedging derivatives
Swaps 50,713 - 50,713 -
Bank loans 101,270 - 101,270 -
Non-guaranteed bonds 1,103,324 - 1,103,324 -
Other 16,041 - 16,041 -
10.9 Financial assets pledged as a guarantee
On November 4, 2004, Isapre Norte Grande maintains a guarantee equivalent to the total amount owed to its
members and healthcare providers, which is managed and maintained by Banco de Chile.
As of December 31, 2017 and December 31, 2016, assets pledged as guarantees are as follows:
Restricted cash 12/31/2017
ThUS$
12/31/2016
ThUS$
Isapre Norte Grande Ltda. 771 685
Total 771 685

10) FINANCIAL REPORTS
238
Note 10 Financial instruments (continued)
10.10 Estimated fair value of financial instruments and financial derivatives
As required by IFRS 7, the following information is presented for the disclosure of the estimated fair value of
financial assets and liabilities.
Although inputs represent Management's best estimate, they are subjective and involve significant estimates related
to the current economic and market conditions, as well as risk features.
Methodologies and assumptions used depend on the risk terms and characteristics of instruments and include the
following as a summary:
- Cash equivalent approximates fair value due to the short-term maturities of these instruments.
- The fair value of trade receivables, current is considered to be equal to the carrying amount due to the maturity
of such accounts at short-term.
- The fair value of other current financial liabilities is considered to be equal to their carrying values.
- For interest-bearing liabilities with original maturity of more than a year, fair values are calculated by
discounting contractual cash flows at their original current market rates with similar terms.
- The fair value of debt is considered in Level 2.
- For forward and swap contracts, fair value is determined using quoted market prices of financial instruments
with similar characteristics.

10) FINANCIAL REPORTS
239
Note 10 Financial instruments (continued)
10.10 Estimated fair value of financial instruments and financial derivatives, continued
The detail of the Company’s instruments at carrying value and estimated fair value is as follows:
12/31/2017 12/31/2016
Carrying value Fair value Carrying value Fair value
ThUS$ ThUS$ ThUS$ ThUS$
Cash and cash equivalents 630,438 630,438 514,669 514,669
Current trade and other receivables 446,875 446,875 368,761 368,761
Receivables due from related parties, current 59,132 59,132 82,259 82,259
Other financial assets, current:
- Time deposits 360,941 360,941 284,160 284,160
- Derivative instruments 6,038 6,038 4,095 4,095
- Hedging assets - - 934 934
Total other current financial assets 366,979 366,979 289,189 289,189
Non-Current Trade Receivables 1,912 1,912 1,840 1,840
Other non-current financial assets: 62,879 62,879 34,099 34,099
Total other non-current financial assets: 62,879 62,879 34,099 34,099
Other financial liabilities, current:
- Bank loans 163,568 163,568 101,270 101,270
- Derivative instruments 5,979 5,979 1,920 1,920
- Hedging liabilities 37,287 37,287 16,981 16,981
- Unsecured obligations 13,494 13,494 58,973 58,973
Other financial liabilities, current 220,328 220,328 179,144 179,144
Current and non-current accounts payable 196,280 196,280 200,496 200,496
Payables due to related parties, non-current 1,365 1,365 7 7
Other non-current financial liabilities:
- Bank loans - - - -
- Unsecured obligations 1,031,507 1,131,639 1,059,706 1,195,512
- Non-current hedging liabilities - - 33,732 33,732
Other non-current financial liabilities: 1,031,507 1,131,639 1,093,438 1,229,244
All the fair value estimates are included in levels 1 and 2.
10.11 Nature and scope of risks arising from financing instruments
As indicated in paragraphs 33 to 42 of IFRS 7 the disclosure of information associated with the nature and scope of
risks arising from financial instruments is presented in Note 4 - Financial Risk Management.

10) FINANCIAL REPORTS
240
Note 11 Equity-accounted investees
11.1 Investments in associates recognized according to the equity method of accounting
As of December 31, 2017 and December 31, 2016, in accordance with criteria established in Note 3.19, investment in associates recognized according to the
equity method of accounting and joint ventures are as follows:
Associates
Equity-accounted investees
Share in profit (loss) of
associates and joint ventures
accounted for using the
equity method
Share in other comprehensive
income of associates and joint
ventures accounted for using the
equity method, net of tax
Share in total other
comprehensive income of
associates and joint ventures
accounted for using the
equity method
12/31/2017 12/31/2016 12/31/2017 12/31/2016 12/31/2017 12/31/2016 12/31/2017 12/31/2016
ThUS$ ThUS$ ThUS$ ThUS$ ThUS$ ThUS$ ThUS$ ThUS$
Abu Dhabi Fertilizer Industries WWL 15,936 13,343 1,483 1,482 - - 1,483 1,482
Doktor Tarsa Tarim Sanayi AS 21,788 16,712 6,427 4,026 - 590 6,427 4,616
Ajay North America 14,432 13,457 3,677 2,794 - - 3,677 2,794
Ajay Europe SARL 8,144 7,373 1,049 1,132 26 (7) 1,075 1,126
Charlee SQM Thailand Co. Ltd, 2,301 1,763 393 244 - - 393 244
SQM Eastmed Turkey. (47) - (25) - - - (25) -
Total 62,601 52,648 13,004 9,678 26 583 13,030 10,262

10) FINANCIAL REPORTS
241
Note 11 Equity-accounted investees (continued)
11.1 Investments in associates recognized according to the equity method of accounting, continued
Associate
Description of the nature of the relationship
Domicile Country of
incorporation
Share of ownership
in associates
Dividends received
12/31/2017 12/31/2016
ThUS$ ThUS$
Abu Dhabi Fertilizer Industries WWL
Distribution and commercialization of specialty
plant nutrients in the Middle East.
PO Box 71871, Abu Dhabi United Arab
Emirates 37% - -
Doktor Tarsa Tarim Sanayi AS
Distribution and commercialization of specialty
plant nutrients in Turkey.
Organize Sanayi Bolgesi, Ikinci Kisim, 22
cadde TR07100 Antalya Turkey 50% - -
Ajay North America Production and distribution of iodine derivatives.
1400 Industry RD Power Springs GA
30129 United States 49% 1,123 2,605
Ajay Europe SARL
Production and commercialization of iodine
derivatives.
Z.I. du Grand Verger BP 227 53602 Evron
Cedex France 50% 968 1,338
SQM Eastmed Turkey
Production and commercialization of specialty
products.
Organize Sanayi Bolgesi, Ikinci Kisim, 22
cadde TR07100 Antalya Turkey 50% - -
Charlee SQM Thailand Co. Ltd.
Distribution and commercialization of specialty
plant nutrients.
31 Soi 138 (Meesuk) LLapdrawrd,
Bangkapi, 10240 Bangkok Thailand 40% - -
The companies described in the table below are related parties of the following associates:
(1) Doktor Tarsa Tarim Sanayi AS
(2) Terra Tarsa B.V.
Description of the nature of the relationship
Domicile Country of
incorporation
Share of
ownership in
associates
Dividends received
Terra Tarsa B.V. (1) Distribution and trading of specialty plant nutrients.
Herikerbergweg 238, Luna Arena, 1101CM
Amsterdam PO Box 23393, 1100DW Amsterdam
Zuidoost
Holland 50% - -
Plantacote N.V. (1) Sale of CRF and production and sales of WSNPK Houtdok-Noordkaai 25a, 2030 Antwerpen,
Belgium Belgium 100% - -
Doktolab Tarim Arastima San. Tic As (1) Laboratory services 27. Cd. No:2, 07190 Aosb 2. Kısım/Döşemealtı,
Antalya, Turkey Turkey 100% - -
Terra Tarsa Ukraine LLC (2) Distribution and trading of specialty plant nutrients. 74800 Ukraine, Kakhovka, 4 Yuzhnaya Str. Ukraine 100% - -
Terra Tarsa Don LLC (2) Distribution and sale of specialty fertilizers Zorge Street, house 17, 344090, Rostov-on-Don Russian Federation 100% - -

10) FINANCIAL REPORTS
242
Note 11 Equity-accounted investees (continued)
11.2 Assets, liabilities, revenue and expenses of associates
12/31/2017
Revenue
Gain (loss) from
continuing
operations
Other
comprehensive
income
Comprehensive
income
Assets Liabilities
Current Non-current Current Non-current
ThUS$ ThUS$ ThUS$ ThUS$ ThUS$ ThUS$ ThUS$ ThUS$
Abu Dhabi Fertilizer Industries WWL 44,801 2,032 3,764 - 35,131 4,008 - 4,008
Doktor Tarsa Tarim Sanayi AS 81,057 10,731 36,960 11,251 75,269 12,854 - 12,854
Ajay North America 19,426 12,498 2,470 - 36,185 7,505 - 7,505
Ajay Europe SARL 23,555 1,266 8,534 - 32,310 2,098 52 2,150
Charlee SQM Thailand Co. Ltd. 8,585 712 3,292 255 13,618 981 - 981
SQM Eastmed Turkey 3,981 2,671 4,487 2,260 2,389 (49) - (49)
Total 181,405 29,910 59,507 13,766 194,902 27,397 52 27,449
12/31/2016
Revenue
Gain (loss) from
continuing
operations
Other
comprehensive
income
Comprehensive
income
Assets Liabilities
Current Non-current Current Non-current
ThUS$ ThUS$ ThUS$ ThUS$ ThUS$ ThUS$ ThUS$ ThUS$
Abu Dhabi Fertilizer Industries WWL 37,801 2,104 3,843 - 41,442 4,005 - 4,005
Doktor Tarsa Tarim Sanayi AS 68,449 5,984 39,729 1,281 83,905 8,052 1,180 9,232
Ajay North America 18,844 11,633 3,015 - 35,715 5,702 - 5,702
Ajay Europe SARL 20,675 1,361 7,290 - 33,319 2,265 (13) 2,252
Charlee SQM Thailand Co. Ltd. 6,264 591 2,448 - 12,065 609 - 609
SQM Eastmed Turkey 727 2,265 719 2,362 833 (200) - (200)
Total 152,760 23,938 57,044 3,643 207,279 20,433 1,167 21,600

10) FINANCIAL REPORTS
243
Note 11 Investment in Associates (continued)
11.3 Other information
The Company has no participation in unrecognized losses in investments in associates.
The Company has no investments that are unaccounted for according to the equity method of accounting.
The equity method was applied to the Statement of Financial Position as of December 31, 2017 and December 31,
2016.
The basis of preparation of the financial information of associates corresponds to the amounts included in the
financial statements in conformity with the entity’s IFRS.
11.4 Disclosures on interest in associates
a) Transactions conducted in 2017:
As of December 31, 2017, a capital increase was registered for Plantacote N.V. in a sum of ThUS$4,208 (equivalent
to Th€3,500), which is 100% owned by the associate company Doktor Tarsa Tarim. The functional currency of
Plantacote N.V. is the Euro. The contribution was made under the heading “Subordinated loan from Dr. Tarsa”. This
contribution had no impact on the Company's consolidated results.
b) Transactions conducted in 2016:
During December 2016, SQM Salar S.A. sold the interest it had in Sales de Magnesio Ltda. to Rockwood Litio Ltda.
generating a gain of ThUS$7,635.

10) FINANCIAL REPORTS
244
Note 12 Joint Ventures
12.1 Policy for the accounting of equity accounted investment in joint ventures
The method for recognizing joint ventures is that in which participation is initially recorded at cost, and subsequently
adjusted, considering changes after the acquisition in the portion of the entity’s net assets that correspond to the
investor. Profit or loss for the period will include the portion of the entity’s entire profit or loss that correspond to
the investor. For these joint ventures there is no quoted market price to measure these investments.
There are no significant restrictions on these joint ventures for the transfer of funds as payment of dividends or
others.
At the date of issuance of these financial statements, SQM is not aware of the existence of any significant contingent
liabilities associated with the partnerships in joint ventures.
12.2 Disclosures of interest in joint ventures
a) Operations conducted in 2017
On June 30, 2017, SQM Potasio S.A. recognized the lower value generated by the acquisition of 50% of the joint
venture Minera Exar S.A. in the amount ThUS$6,205.
On October 6, 2017, a capital contribution of ThUS$13,300 (ThARS230,422.5) was made in mining company
EXAR S.A., which is 50% owned by the subsidiary SQM Potasio S.A. The functional currency of EXAR S.A. is
the Argentine peso (ARS). This contribution had no impact on the Company's consolidated results.
b) Operations conducted in 2016
On March 28, 2016, Sociedad Química y Minera de Chile S.A. agreed to enter into a joint venture with Lithium
Americas Corp to develop the Cauchari-Olaroz lithium project in Argentina.
SQM Potasio S.A. made a capital contribution of ThUS$25,000 in exchange for 50% of the ownership of Minera
Exar S.A.
During May 2016, SQM Vitas Holland B.V. sold its interest in SQM Vitas Spain, to SQM Iberian S.A. This resulted
in the latter entity gaining 100% interest in this transaction, generating a loss of ThUS$104.

10) FINANCIAL REPORTS
245
Note 12 Joint Ventures (continued)
12.3 Investment in joint ventures accounted for under the equity method of accounting
Joint venture
Domicile
Country of
incorporation
Share of interest in
ownership
Dividends received
Description of the nature of the relationship 12/31/2017 12/31/2016
ThUS$ ThUS$
Sichuan SQM Migao Chemical Fertilizers Co.
Ltda.
Production and distribution of soluble fertilizers.
Huangjing Road, Dawan Town,
Qingbaijiang District, Chengdu
Municipality, Sichuan Province China 50% - -
Coromandel SQM India Production and distribution of potassium nitrate.
1-2-10, Sardar Patel Road, Secunderabad –
500003 Andhra Pradesh India 50% - -
SQM Vitas Fzco.
Production and commercialization of specialty plant
and animal nutrition and industrial hygiene.
Jebel ALI Free Zone P.O. Box 18222,
Dubai
United Arab
Emirates 50% - -
SQM Star Qingdao Corp Nutrition. Co. Ltd.
Production and distribution of nutrient plant solutions
with specialties NPK soluble
Longquan Town, Jimo City, Qingdao
Municipality, Shangdong Province China 50% - -
SQM Vitas Holland B.V (1) Without information
Herikerbergweg 238, 1101 CM Amsterdam
Zuidoost
Holland
50% - -
Minera Exar S.A. Exploration and exploitation of minerals, processing
and trading of such minerals
Dr. Sabín 1082 Ciudad de Nieva – San
Salvador de Jujuy- Jujuy- República
Argentina
Argentina 50% - -
(1) During May 2016, SQM Vitas Holland B.V. sold its interest in SQM Vitas Spain, to SQM Iberian S.A. resulting in the latter obtaining 100% in this transaction generating a loss of ThUS$ 104.
The companies described in the following table are related to the following joint ventures:
(1) SQM Vitas Fzco.
(2) SQM Vitas Holland B.V.
Domicile
Country of
incorporation
Share of interest in
ownership Dividends received
SQM Vitas Brazil Agroindustria (1)
Production and commercialization of specialty plant
and animal nutrition and industrial hygiene.
Via Cndeias, Km. 01 Sem Numero, Lote 4,
Bairro Cia Norte, Candeias, Bahia. Brazil 49.99% - -
SQM Vitas Peru S.A.C (1)
Production and commercialization of specialty plant
and animal nutrition and industrial hygiene
Av. Juan de Arona 187, Torre B, Oficina
301-II, San Isidro, Lima Peru 50% - -
SQM Vitas Plantacote B.V. (2) Production and commercialization of controlled-
released fertilizers
Herikerbergweg 238, 1101 CM Amsterdam
Zuidoost
Holland 50% - -

10) FINANCIAL REPORTS
246
Note 12 Joint Ventures (continued)
12.3 Investment in joint ventures accounted for under the equity method of accounting, continued:
Joint Venture Final reporting period date
Accounting method
Sichuan SQM Migao Chemical Fertilizers Co Ltda. December 31, 2017 Equity method
Coromandel SQM India December 31, 2017 Equity method
SQM Vitas Fzco. December 31, 2017 Equity method
SQM Star Qingdao Corp Nutrition Co., Ltd. December 31, 2017 Equity method
SQM Vitas Brazil Agroindustria December 31, 2017 Equity method
SQM Vitas Southern Africa Pty. December 31, 2017 Equity method
SQM Vitas Perú S.A.C. December 31, 2017 Equity method
SQM Vitas Holland B.V. December 31, 2017 Equity method
SQM Vitas Plantacote B.V. December 31, 2017 Equity method
Minera Exar S.A. December 31, 2017 Equity method
Joint Venture Equity-accounted investees
Share in profit (loss) of
associates and joint ventures
accounted for using the equity
method
12/31/2017 12/31/2016 12/31/2017 12/31/2016
ThUS$ ThUS$ ThUS$ ThUS$
Sichuan SQM Migao Chemical Fertilizers Co. Ltd. 11,444 12,150 (535) (1,372)
Coromandel SQM India 1,633 1,499 165 435
SQM Vitas Fzco, 19,478 17,956 1,502 3,458
SQM Star Qingdao Corp. Nutrition Co. Ltd. 2,980 2,618 361 163
SQM Vitas Holland 1,429 1,269 (18) 171
Minera Exar S.A. 26,860 25,000 (27) -
Total 63,824 60,492 1,448 2,855

10) FINANCIAL REPORTS
247
Note 12 Joint Ventures (continued)
12.3 Investment in joint ventures accounted for under the equity method of accounting, continued:
Joint Venture
Share on other comprehensive
income of associates and joint
ventures accounted for using the
equity method, net of tax
comprehensive income of associates and joint ventures accounted for using the equity method
Share on total other
comprehensive income of
associates and joint ventures
accounted for using the equity
method
12/31/2017 12/31/2016 12/31/2017 12/31/2016
ThUS$ ThUS$ ThUS$ ThUS$
Sichuan SQM Migao Chemical Fertilizers Co. Ltd. - - (535) (1,372)
Coromandel SQM India - - 165 435
SQM Vitas Fzco, (5) 449 1,497 3,907
SQM Star Qingdao Corp. Nutrition Co. Ltd. - - 361 163
SQM Vitas Holland - - (18) 171
Minera Exar S.A. - (27) -
Total (5) 449 1,443 3,304
Joint Venture Equity-accounted investees
Share in profit (loss) of
associates and joint ventures
accounted for using the equity
method
12/31/2017 12/31/2016 12/31/2017 12/31/2016
ThUS$ ThUS$ ThUS$ ThUS$
SQM Vitas Brazil Agroindustria(1) 11,003 9,343 1,753 4,570
SQM Vitas Peru S.A.C (1) 5,961 5,964 (216) 815
SQM Vitas Plantacote B.V. (2) 669 588 (1) 187
SQM Vitas Spain (2) - - - -
Total 17,633 15,895 1,536 5,572

10) FINANCIAL REPORTS
248
Note 12 Joint Ventures (continued)
12.3 Investment in joint ventures accounted for under the equity method of accounting, continued:
Joint Venture
Share in other comprehensive
income of associates and joint
ventures accounted for using the
equity method, net of tax
Share in total other
comprehensive income of
associates and joint ventures
accounted for using the equity
method
12/31/2017 12/31/2016 12/31/2017 12/31/2016
ThUS$ ThUS$ ThUS$ ThUS$
SQM Vitas Brazil Agroindustria(1) (51) 2,845 826 5,130
SQM Vitas Peru S.A.C (1) - - (108) 408
SQM Vitas Plantacote B.V. (2) - - (1) (80)
SQM Vitas Spain (2) - - - -
Total (51) 2,845 717 5,458
The following companies are subsidiaries of
(1) SQM Vitas Fzco.
(2) SQM Vitas Holland
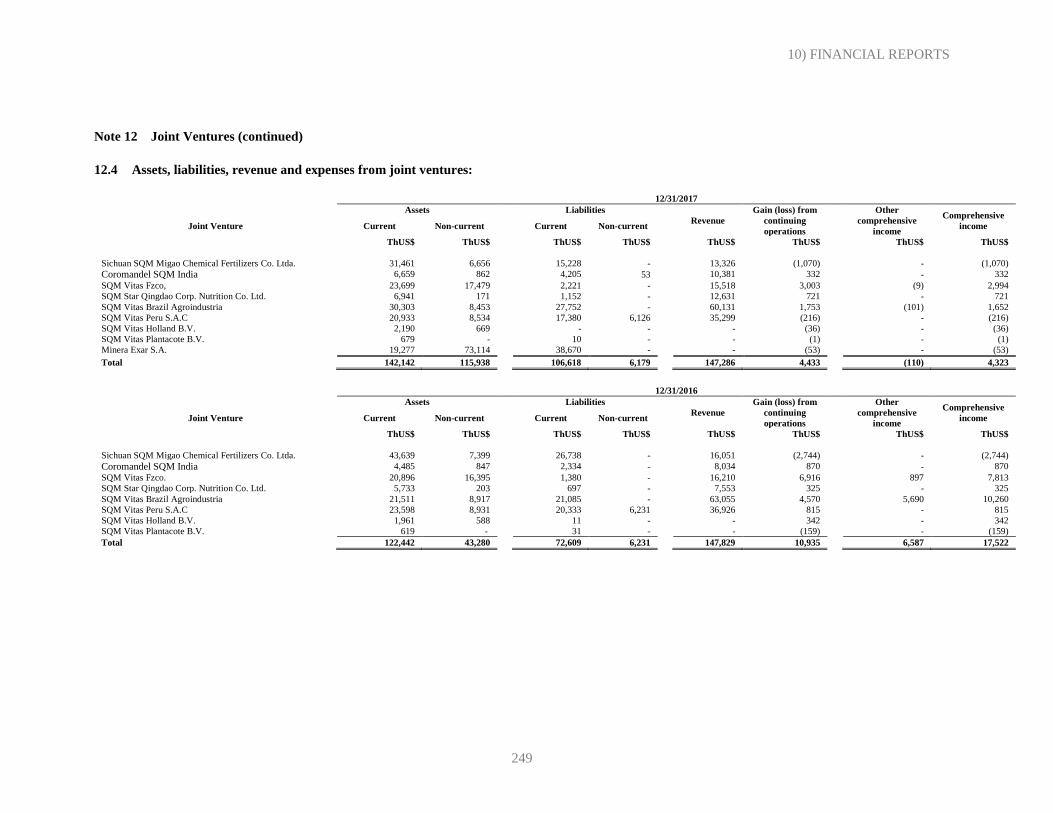
10) FINANCIAL REPORTS
249
Note 12 Joint Ventures (continued)
12.4 Assets, liabilities, revenue and expenses from joint ventures:
12/31/2017
Assets Liabilities
Revenue
Gain (loss) from
continuing
operations
Other
comprehensive
income
Comprehensive
income Joint Venture Current Non-current Current Non-current
ThUS$ ThUS$ ThUS$ ThUS$ ThUS$ ThUS$ ThUS$ ThUS$
Sichuan SQM Migao Chemical Fertilizers Co. Ltda. 31,461 6,656 15,228 - 13,326 (1,070) - (1,070)
Coromandel SQM India 6,659 862 4,205 53 10,381 332 - 332
SQM Vitas Fzco, 23,699 17,479 2,221 - 15,518 3,003 (9) 2,994
SQM Star Qingdao Corp. Nutrition Co. Ltd. 6,941 171 1,152 - 12,631 721 - 721
SQM Vitas Brazil Agroindustria 30,303 8,453 27,752 - 60,131 1,753 (101) 1,652
SQM Vitas Peru S.A.C 20,933 8,534 17,380 6,126 35,299 (216) - (216)
SQM Vitas Holland B.V. 2,190 669 - - - (36) - (36)
SQM Vitas Plantacote B.V. 679 - 10 - - (1) - (1)
Minera Exar S.A. 19,277 73,114 38,670 - - (53) - (53)
Total 142,142 115,938 106,618 6,179 147,286 4,433 (110) 4,323
12/31/2016
Assets Liabilities
Revenue
Gain (loss) from
continuing
operations
Other
comprehensive
income
Comprehensive
income Joint Venture Current Non-current Current Non-current
ThUS$ ThUS$ ThUS$ ThUS$ ThUS$ ThUS$ ThUS$ ThUS$
Sichuan SQM Migao Chemical Fertilizers Co. Ltda. 43,639 7,399 26,738 - 16,051 (2,744) - (2,744)
Coromandel SQM India 4,485 847 2,334 - 8,034 870 - 870
SQM Vitas Fzco. 20,896 16,395 1,380 - 16,210 6,916 897 7,813
SQM Star Qingdao Corp. Nutrition Co. Ltd. 5,733 203 697 - 7,553 325 - 325
SQM Vitas Brazil Agroindustria 21,511 8,917 21,085 - 63,055 4,570 5,690 10,260
SQM Vitas Peru S.A.C 23,598 8,931 20,333 6,231 36,926 815 - 815
SQM Vitas Holland B.V. 1,961 588 11 - - 342 - 342
SQM Vitas Plantacote B.V. 619 - 31 - - (159) - (159)
Total 122,442 43,280 72,609 6,231 147,829 10,935 6,587 17,522

10) FINANCIAL REPORTS
250
Note 12 Joint Ventures (continued)
12.5 Other Joint Venture disclosures:
Cash and cash equivalents Other current financial liabilities Other non-current financial liabilities
12/31/2017 12/31/2016 12/31/2017 12/31/2016 12/31/2017 12/31/2016
ThUS$ ThUS$ ThUS$ ThUS$ ThUS$ ThUS$$
Sichuan SQM Migao Chemical Fertilizers Co. Ltda. 6,198 4,097 - - - -
Coromandel SQM India 1,118 15 - 478 - -
SQM Vitas Fzco, 15,307 11,514 - - - -
SQM Star Qingdao Corp. Nutrition Co. Ltd. 3,675 3,756 - - - -
SQM Vitas Brazil Agroindustria 5,139 2,168 7,342 8,718 - -
SQM Vitas Peru S.A.C. 687 958 2,215 3,834 1,372 1,781
SQM Vitas Holland B.V. 2,190 1,961 - - - -
SQM Vitas Plantacote B.V. 679 615 - - - -
Minera Exar S.A. 9,189 - - - -
Total 44,182 25,084 9,557 13,030 1,372 1,781
Depreciation and amortization
expense
Interest expense
Income tax expense, continuing
operations
12/31/2017 12/31/2016 12/31/2017 12/31/2016 12/31/2017 12/31/2016
ThUS$ ThUS$ ThUS$ ThUS$ ThUS$ ThUS$
Sichuan SQM Migao Chemical Fertilizers Co. Ltda. (696) (691) (25) (433) 303 200
Coromandel SQM India - - (16) (49) (485) (44)
SQM Vitas Fzco. (553) (717) (19) (16) - -
SQM Star Qingdao Corp. Nutrition Co. Ltd. (68) (64) - (1) (174) (195)
SQM Vitas Brazil Agroindustria (453) (438) (1,253) (2,127) (283) (337)
SQM Vitas Peru S.A.C. (375) (82) (432) (323) (214) (362)
SQM Vitas Holland B.V. - - - - - -
SQM Vitas Plantacote B.V. - - (1) (1) - -
Minera Exar S.A. (523) - (32) - (620) -
SQM Vitas Spain - - - - - -
Total (2,668) (1,992) (1,778) (2,950) (1,473) (738)
The basis of preparation of the financial information of joint ventures corresponds to the amounts included in the financial statements in conformity with the
entity’s IFRS.

10) FINANCIAL REPORTS
251
Note 13 Intangible assets and goodwill
13.1 Balances
12/31/2017 12/31/2016
ThUS$ ThUS$ Intangible assets other than goodwill 105,948 109,439 Goodwill (1) 44,177 37,972
Total 150,125 147,411
(1) The recoverable amount of the cash-generating unit has been determined based on a calculation of the value
in use which used cash flow projections for a 5-year period, plus perpetuity.
The present value of the future cash flows generated by these assets has been estimated given a variance in
sales volumes, market prices and costs, discounted at weighted average cost of capital (WACC) of 8.04%.
13.2 Disclosures on intangible assets and goodwill
Intangible assets relate to goodwill, water rights, trademarks, industrial patents, rights of way, software, and mining
claims which correspond to exploitation rights acquired from third-parties.
Balances and movements in the main classes of intangible assets as of December 31, 2017 and December 31, 2016
are detailed as follows:
12/31/2017
Intangible assets and goodwill Useful life
Gross amount
ThUS$
Accumulated
Amortization
ThUS$
Net Value
ThUS$
Software Finite 25,060 (19,769) 5,291
Intellectual property rights, patents and other
industrial property rights, service Finite 1,250 (1,061) 189
Intellectual property rights, patents and other
industrial property rights, service Indefinite 98,518 - 98,518
Other intangible assets Indefinite 1,950 - 1,950
Intangible assets other than goodwill 126,778 (20,830) 105,948
Goodwill Indefinite 44,177 - 44,177
Total intangible assets and goodwill 170,955 (20,830) 150,125

10) FINANCIAL REPORTS
252
Note 13 Intangible assets and goodwill (continued)
13.2 Disclosures on intangible assets and goodwill, continued
12/31/2016
Intangible assets and goodwill Useful life
Gross amount
ThUS$
Accumulated
Amortization
ThUS$
Net Value
ThUS$
Software Finite 23,280 (16,234) 7,046
Intellectual property rights, patents and other
industrial property rights, service Finite 1,483 (1,023) 460
Intellectual property rights, patents and other
industrial property rights, service Indefinite 98,596 - 98,596
Other intangible assets Indefinite 3,337 - 3,337
Intangible assets other than goodwill 126,696 (17,257) 109,439
Goodwill Indefinite 37,972 - 37,972
Total intangible assets and goodwill 164,668 (17,257) 147,411
a) Estimated useful lives or amortization rates used for finite identifiable intangible assets
Finite useful life measures the lifetime or the number of productive units or other similar variables which constitute
its useful life.
The estimated useful life for software is 3 and 6 years. For other finite useful life assets, the period in which they
are amortized relates to periods defined by contracts or the rights which generate them.
Intellectual property rights, patents and other industrial property rights, service and exploitation rights, mainly relate
to water rights and have a finite useful life to the extent to which they are subject to a fixed-term contract or otherwise
they are considered to be indefinite.
b) Method used to express the amortization of identifiable intangible assets (life or rate)
The method used to express the amortization is useful life, and estimated tons to be extracted in the case of mining
claims.
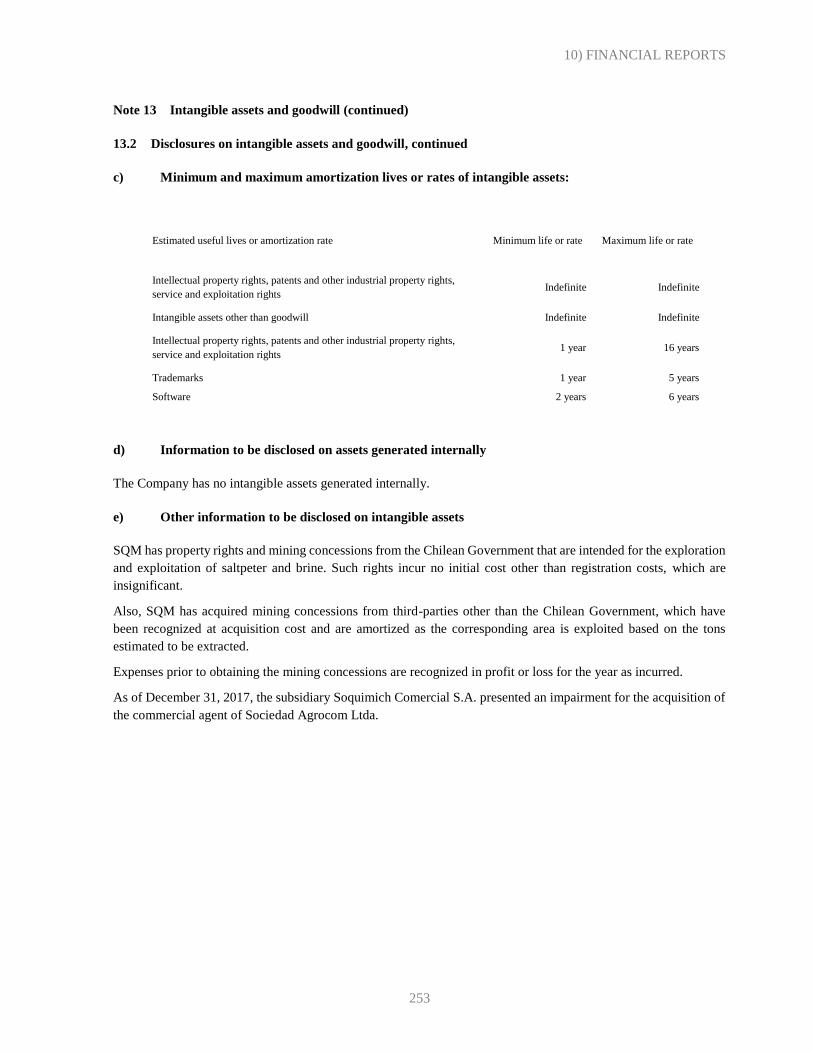
10) FINANCIAL REPORTS
253
Note 13 Intangible assets and goodwill (continued)
13.2 Disclosures on intangible assets and goodwill, continued
c) Minimum and maximum amortization lives or rates of intangible assets:
Estimated useful lives or amortization rate Minimum life or rate Maximum life or rate
Intellectual property rights, patents and other industrial property rights,
service and exploitation rights Indefinite Indefinite
Intangible assets other than goodwill Indefinite Indefinite
Intellectual property rights, patents and other industrial property rights,
service and exploitation rights 1 year 16 years
Trademarks 1 year 5 years
Software 2 years 6 years
d) Information to be disclosed on assets generated internally
The Company has no intangible assets generated internally.
e) Other information to be disclosed on intangible assets
SQM has property rights and mining concessions from the Chilean Government that are intended for the exploration
and exploitation of saltpeter and brine. Such rights incur no initial cost other than registration costs, which are
insignificant.
Also, SQM has acquired mining concessions from third-parties other than the Chilean Government, which have
been recognized at acquisition cost and are amortized as the corresponding area is exploited based on the tons
estimated to be extracted.
Expenses prior to obtaining the mining concessions are recognized in profit or loss for the year as incurred.
As of December 31, 2017, the subsidiary Soquimich Comercial S.A. presented an impairment for the acquisition of
the commercial agent of Sociedad Agrocom Ltda.

10) FINANCIAL REPORTS
254
Note 13 Intangible assets and goodwill (continued)
13.2 Disclosures on intangible assets and goodwill, continued
f) Movements in identifiable intangible assets as of December 31, 2017:
Movements in identifiable intangible assets, gross Trademarks Software
Intellectual property rights,
patents and other industrial
property rights, service, rights
of way
Intellectual property rights,
patents and other industrial
property rights, service, rights
of way
Other
intangible
assets
Goodwill Identifiable
intangible assets
ThUS$ ThUS$ ThUS$ ThUS$ ThUS$ ThUS$ ThUS$
Opening balance - 23,280 1,483 98,596 3,337 37,972 164,668
Additions - 939 8 - 204 6,205 7,356
Impairment - - - (205) - - (205)
Increases (decreases) for transfers - - - - (1,164) - (1,164)
Other increases (decreases) - 841 (241) 127 (427) - 300
Final balance - 25,060 1,250 98,518 1,950 44,177 170,955
Movements in identifiable intangible assets, accumulated
amortization Trademarks Software
Intellectual property rights,
patents and other industrial
property rights, service, rights
of way
Intellectual property rights,
patents and other industrial
property rights, service, rights
of way
Other
intangible
assets
Goodwill Identifiable
intangible assets
ThUS$ ThUS$ ThUS$ ThUS$ ThUS$ ThUS$ ThUS$
Opening balance - (16,234) (1,023) - - - (17,257)
Additions - - - - - - -
Amortization - (2,653) (38) - - - (2,691)
Other increases (decreases) - (882) - - - - (882)
Final balance - (19,769) (1,061) - - - (20,830)

10) FINANCIAL REPORTS
255
Note 13 Intangible assets and goodwill (continued)
13.2 Disclosures on intangible assets and goodwill, continued
f) Movements in identifiable intangible assets as of December 31, 2017, continued
Movements in identifiable intangible assets, net Trademarks Software
Intellectual property rights,
patents and other industrial
property rights, service, rights
of way
Intellectual property rights,
patents and other industrial
property rights, service rights
of way
Other
intangible
assets
Goodwill Identifiable
intangible assets
ThUS$ ThUS$ ThUS$ ThUS$ ThUS$ ThUS$ ThUS$
Opening balance - 7,046 460 98,596 3,337 37,972 147,411
Additions - 939 8 - 204 6,205 7,356
Amortization - - - (205) - - (205)
Impairment - (2,653) (38) - - - (2,691)
Increases (decreases) for transfers - - - - (1,164) - (1,164)
Other increases (decreases) - (41) (241) 127 (427) - (582)
Final balance - 5,291 189 98,518 1,950 44,177 150,125
g) Movements in identifiable intangible assets as of December 31, 2016:
Movements in identifiable intangible assets, gross Trademarks Software
Intellectual property rights,
patents and other industrial
property rights, service, rights
of way
Intellectual property rights,
patents and other industrial
property rights, service, rights
of way
Other
intangible
assets
Goodwill Identifiable
intangible assets
ThUS$ ThUS$ ThUS$ ThUS$ ThUS$ ThUS$ ThUS$
Opening balance 3,821 23,251 1,448 96,500 3,651 38,388 167,059
Additions - 160 25 2,100 - - 2,285
Other increases (decreases) (3,821) (131) 10 (4) (314) (416) (4,676)
Final balance - 23,280 1,483 98,596 3,337 37,972 164,668

10) FINANCIAL REPORTS
256
Note 13 Intangible assets and goodwill (continued)
13.2 Disclosures on intangible assets and goodwill, continued
g) Movements in identifiable intangible assets as of December 31, 2016:
Movements in identifiable intangible assets, accumulated
amortization Trademarks Software
Intellectual property rights,
patents and other industrial
property rights, service, rights
of way
Intellectual property rights,
patents and other industrial
property rights, service, rights
of way
Other
intangible
assets
Goodwill Identifiable
intangible assets
ThUS$ ThUS$ ThUS$ ThUS$ ThUS$ ThUS$ ThUS$
Opening balance (3,821) (13,438) (984) - - - (18,243)
Additions - - - - - - -
Amortization - (2,796) (38) - - - (2,834)
Other increases (decreases) 3,821 - (1) - - - 3,820
Final balance - (16,234) (1,023) - - - (17,257)
Movements in identifiable intangible assets, net Trademarks Software
Intellectual property rights,
patents and other industrial
property rights, service rights
of way
Intellectual property rights,
patents and other industrial
property rights, service rights
of way
Other
intangible
assets
Goodwill Identifiable
intangible assets
ThUS$ ThUS$ ThUS$ ThUS$ ThUS$ ThUS$ ThUS$
Opening balance - 9,813 464 96,500 3,651 38,388 148,816
Additions - 160 25 2,100 - - 2,285
Amortization - (2,796) (38) - - - (2,834)
Other increases (decreases) - (131) 9 (4) (314) (416) (856)
Final balance - 7,046 460 98,596 3,337 37,972 147,411

10) FINANCIAL REPORTS
257
Note 14 Property, plant and equipment
As of December 31, 2017 and December 31, 2016, the detail of property, plant and equipment is as follows:
14.1 Types of property, plant and equipment
Description of types of property, plant and equipment
12/31/2017
ThUS$
12/31/2016
ThUS$
Property, plant and equipment, net
Land 32,739 32,702
Buildings 230,319 237,585
Other property, plant and equipment 24,862 26,417
Transport equipment 3,257 3,355
Supplies and accessories 1,872 1,773 Office equipment 487 3,642
Network and communication equipment 1,050 1,686
Mining assets 16,237 24,643
IT equipment 3,401 366
Energy generating assets 7,861 8,191
Constructions in progress 165,054 170,710
Machinery, plant and equipment (1) 950,054 1,021,640
Total 1,437,193 1,532,710
Property, plant and equipment, gross
Land 32,739 32,702
Buildings 610,264 582,082
Other property, plant and equipment 244,831 253,555 Transport equipment 11,195 10,819
Supplies and accessories 19,498 18,259
Office equipment 11,105 17,731
Network and communication equipment 7,356 7,522
Mining assets 129,028 158,514
IT equipment 27,038 20,316
Energy generating assets 36,643 34,812
Constructions in progress 165,054 170,710 Machinery, plant and equipment 2,938,287 2,833,819
Total 4,233,038 4,140,841
Accumulated depreciation and value impairment of property, plant and
equipment, total
Accumulated depreciation and impairment of buildings 379,945 344,497
Accumulated depreciation and impairment of other property, plant and equipment 219,969 227,138
Accumulated depreciation and impairment of transport equipment 7,938 7,464
Accumulated depreciation and impairment of supplies and accessories 17,626 16,486
Accumulated depreciation and impairment of office equipment 10,618 14,089
Accumulated depreciation and impairment of network and communication equipment 6,306 5,836
Accumulated depreciation and impairment of mining assets 112,791 133,871 Accumulated depreciation and impairment of IT equipment 23,637 19,950
Accumulated depreciation and impairment of energy generating assets 28,782 26,621
Accumulated depreciation and impairment of machinery, plant and equipment 1,988,233 1,812,179
Total 2,795,845 2,608,131

10) FINANCIAL REPORTS
258
Note 14 Property, plant and equipment, (continued)
14.1 Types of property, plant and equipment, continued
(1) The detail of machinery, plant and equipment is as follows:
Description of classes of property, plant and equipment
12/31/2017
ThUS$
31/12/2016
ThUS$
Property, plant and equipment, net
Pumps 33,614 40,306
Conveyor belt 24,832 28,307 Crystallizer 15,519 17,585
Plant equipment 186,885 208,137
Water tanks 11,296 10,614
Filter 18,572 21,484
Facilities/electrical equipment 105,600 111,876
Other machinery, plant and equipment 72,812 57,298
Piping 113,641 124,699 Pond 275,731 299,956
Well 46,802 50,647
Parts 44,750 50,731
Total 950,054 1,021,640

10) FINANCIAL REPORTS
259
Note 14 Property, plant and equipment (continued)
14.2 Reconciliation of changes in property, plant and equipment by type:
Reconciliation of changes in property, plant and equipment by class as of December 31, 2017 and December 31, 2016:
Reconciliation of changes in property, plant
and equipment by class as of December 31,
2017, gross amount Land Buildings
Other
property, plant
and equipment
Transport
equipment
Supplies and
accessories
Equipment
office
Network and
communication
equipment Mining assets IT equipment
Energy
generating
assets
Assets under
construction
Machinery, plant
and equipment
Property, plant
and equipment
ThUS$ ThUS$ ThUS$ ThUS$ ThUS$ ThUS$ ThUS$ ThUS$ ThUS$ ThUS$ ThUS$ ThUS$ ThUS$
Opening balance 32,702 582,082 253,555 10,819 18,259 17,731 7,522 158,514 20,316 34,812 170,710 2,833,819 4,140,841
Changes
Additions - 189 541 - 115 42 12 - 899 122 158,797 26,067 186,784
Disposals - (59) (11,623) (321) - (23) - (30,082) (57) - (16,761) (3,374) (62,300) Increase (decrease) in foreign currency translation
difference 45 103 3 1 - - - - (2) - 1 118 269
Reclassifications - 23,336 8,255 696 1,044 172 123 596 122 1,709 (120,668) 84,424 (191)
Other increases (decreases) (*) 403 4,669 (5,900) - 80 (6,817) (301) - 5,760 - (27,025) (2,767) (31,898) Decreases for classification as held for sale (1) (411) (56) - - - - - - - - - - (467)
Total changes 37 28,182 (8,724) 376 1,239 (6,626) (166) (29,486) 6,722 1,831 (5,656) 104,468 92,197
Closing balance 32,739 610,264 244,831 11,195 19,498 11,105 7,356 129,028 27,038 36,643 165,054 2,938,287 4,233,038
Reconciliation of changes in property, plant and
equipment by class as of December 31, 2017,
accumulated depreciation
Land Buildings Other
property, plant
and equipment
Transport
equipment
Supplies and
accessories
Equipment
office
Network and
communication
equipment
Mining assets IT equipment Energy
generating
assets
Assets under
construction
Machinery, plant
and equipment
Property, plant
and equipment
ThUS$ ThUS$ ThUS$ ThUS$ ThUS$ ThUS$ ThUS$ ThUS$ ThUS$ ThUS$ ThUS$ ThUS$ ThUS$
Opening balance - (344,497) (227,138) (7,464) (16,486) (14,089) (5,836) (133,871) (19,950) (26,621) - (1,812,179) (2,608,131)
Changes
Disposals - 58 11,622 312 - 3 - 30,083 25 - - 3,210 45,313
Depreciation expense - (33,306) (6,759) (730) (1,047) (357) (665) (10,638) (909) (2,184) - (175,770) (232,365)
Impairment - - - - - - - - - - - - - Increase (decrease) in foreign currency translation
difference - -
- (35) (3) (2) - - - - (11) - - (58) (109)
Reclassifications - (62) 38 (32) (110) (69) (25) - (46) 26 - 344 64 Other increases (decreases) (*) - (2,102) 2,271 (22) 17 3,894 220 1,635 (2,746) (3) - (3,780) (616) Decreases for classification as held for sale (1) - (1) - - - - - - - - - - (1)
Total changes - (35,448) 7,169 (474) (1,140) 3,471 (470) 21,080 (3,687) (2,161) - (176,054) (187,714)
Closing balance - (379,945) (219,969) (7,938) (17,626) (10,618) (6,306) (112,791) (23,637) (28,782) - (1,988,233) (2,795,845)

10) FINANCIAL REPORTS
260
Note 14 Property, plant and equipment (continued)
14.2 Reconciliation of changes in property, plant and equipment by type, continued:
Reconciliation of changes in property,
plant and equipment by class as of
December 31, 2017, net amount Land Buildings
Other
property, plant
and equipment
Transport
equipment
Supplies and
accessories
Equipment
office
Network and
communication
equipment Mining assets IT equipment
Energy
generating
assets
Assets under
construction
Machinery, plant
and equipment
Property, plant
and equipment
ThUS$ ThUS$ ThUS$ ThUS$ ThUS$ ThUS$ ThUS$ ThUS$ ThUS$ ThUS$ ThUS$ ThUS$ ThUS$
Opening balance 32,702 237,585 26,417 3,355 1,773 3,642 1,686 24,643 366 8,191 170,710 1,021,640 1,532,710
Changes
Additions - 189 541 - 115 42 12 - 899 122 158,797 26,067 186,784
Disposals - (1) (1) (9) - (20) - 1 (32) - (16,761) (164) (16,987)
Depreciation expense - (33,306) (6,759) (730) (1,047) (357) (665) (10,638) (909) (2,184) - (175,770) (232,365)
Impairment - - - - - - - - - - - - -
Increase (decrease) in foreign currency
translation difference 45 68 - (1) - - - - (13) - 1 60 160
Reclassifications - 23,274 8,293 664 934 103 98 596 76 1,735 (120,668) 84,768 (127)
Other increases (decreases) (*) 403 2,566 (3,629) (22) 97 (2,923) (81) 1,635 3,014 (3) (27,025) (6,547) (32,515)
Decreases for classification as held for sale (1) (411) (56) - - - - - - - - - - (467)
Total changes 37 (7,266) (1,555) (98) 99 (3,155) (636) (8,406) 3,035 (330) (5,656) (71,586) (95,517)
Closing balance 32,739 230,319 24,862 3,257 1,872 487 1,050 16,237 3,401 7,861 165,054 950,054 1,437,193
(*) The net balance of other increases (decreases) corresponds to all those items that are reclassified to or from property, plant and equipment. They can have the
following origin:1) work in progress which is expensed to profit or loss, forming part of operating costs or other expenses per function, as appropriate, 2) the
variation representing the purchase and use of materials and spare parts, 3) projects corresponding mainly to exploration expenditures and ground studies that are
reclassified to the item other non-current financial assets, 4) Software that is reclassified to Intangibles.
((1) Any property, plant and equipment (disposal group) that, at the closing date of the financial statements, is subject to a commitment for sale or where the sales
process has been initiated and where the sale is expected to occur within twelve months of that date, is classified by the Company as non-current assets held for
sale.
These assets or disposal groups are valued at the lower of carrying amount or the estimated sales value less the costs to sell and stop being amortized from the
moment they are classified as non-current assets held for sale.

10) FINANCIAL REPORTS
261
Note 14 Property, plant and equipment (continued)
14.2 Reconciliation of changes in property, plant and equipment by type, continued:
Reconciliation of changes in property, plant
and equipment by class as of December 31,
2016, gross amount Land Buildings
Other
property, plant
and equipment
Transport
equipment
Supplies and
accessories
Equipment
office
Network and
communication
equipment Mining assets IT equipment
Energy
generating
assets
Assets under
construction
Machinery, plant
and equipment
Property, plant
and equipment
ThUS$ ThUS$ ThUS$ ThUS$ ThUS$ ThUS$ ThUS$ ThUS$ ThUS$ ThUS$ ThUS$ ThUS$ ThUS$
Opening balance 34,589 564,708 248,493 16,170 17,877 18,858 7,323 157,481 19,732 34,579 151,831 2,751,631 4,023,272
Changes
Additions - - 545 49 - 753 - - - - 145,605 2,146 149,098
Disposals - - (753) (5,540) (28) (1) - - - - (3,370) (1,165) (10,857)
Increase (decrease) in foreign currency translation
difference
28 1 65 8 - 52 - - - - - 19 173
Reclassifications - 17,373 5,809 277 410 51 199 1,033 584 233 (101,104) 80,987 5,852
Other increases (decreases) (*) (24) - (410) (145) - (1,982) - - - - (22,252) 201 (24,612)
Decreases for classification as held for sale (1) (1.891) - (194) - - - - - - - - - (2,085)
Total changes (1,887) 17,374 5,062 (5,351) 382 (1,127) 199 1,033 584 233 18,879 82,188 117,569
Closing balance 32,702 582,082 253,555 10,819 18,259 17,731 7,522 158,514 20,316 34,812 170,710 2,833,819 4,140,841
Reconciliation of changes in property, plant and
equipment by class as of December 31, 2016,
accumulated depreciation Land Buildings
Other
property, plant
and equipment
Transport
equipment
Supplies and
accessories
Equipment
office
Network and
communication
equipment Mining assets IT equipment
Energy
generating
assets
Assets under
construction
Machinery, plant
and equipment
Property, plant
and equipment
ThUS$ ThUS$ ThUS$ ThUS$ ThUS$ ThUS$ ThUS$ ThUS$ ThUS$ ThUS$ ThUS$ ThUS$ ThUS$
Opening balance - (310,676) (196,262) (12,355) (13,870) (15,393) (5,041) (122,034) (18,770) (23,332) - (1,621,963) (2,339,696)
Changes
Disposals - - - 5,540 28 - - - - - - 759 6,327
Depreciation expense - (33,470) (7,288) (683) (2,265) (845) (774) (11,837) (1,179) (2,374) - (178,942) (239,657)
Impairment - (338) (23,861) (81) (379) (1) (21) - (1) (915) - (5,985) (31,582)
Increase (decrease) in foreign currency translation
difference - (13) (14) (14) - (28) - - - - - - (69)
Reclassifications - - - - - - - - - - - (5,852) (5,852)
Other increases (decreases) (*) - - 258 129 - 2,178 - - - - - (196) 2,369
Decreases for classification as held for sale (1) - - 29 - - - - - - - - - 29
Total changes - (33,821) (30,876) 4,891 (2,616) 1,304 (795) (11,837) (1,180) (3,289) - (190,216) (268,435)
Closing balance - (344,497) (227,138) (7,464) (16,486) (14,089) (5,836) (133,871) (19,950) (26,621) - (1,812,179) (2,608,131)

10) FINANCIAL REPORTS
262
Note 14 Property, plant and equipment (continued)
14.2 Reconciliation of changes in property, plant and equipment by type, continued:
Reconciliation of changes in property, plant
and equipment by class as of December 31,
2016, net amount Land Buildings
Other
property, plant
and equipment
Transport
equipment
Supplies and
accessories
Equipment
office
Network and
communication
equipment Mining assets IT equipment
Energy
generating
assets
Assets under
construction
Machinery, plant
and equipment
Property, plant
and equipment
ThUS$ ThUS$ ThUS$ ThUS$ ThUS$ ThUS$ ThUS$ ThUS$ ThUS$ ThUS$ ThUS$ ThUS$ ThUS$
Opening balance 34,589 254,032 52,231 3,815 4,007 3,465 2,282 35,447 962 11,247 151,831 1,129,668 1,683,576
Changes
Additions - - 545 49 - 753 - - - - 145,605 2,146 149,098
Disposals - - (753) - - (1) - - - - (3,370) (406) (4,530)
Depreciation expense - (33,470) (7,288) (683) (2,265) (845) (774) (11,837) (1,179) (2,374) - (178,942) (239,657)
Impairment - (338) (23,861) (81) (379) (1) (21) - (1) (915) - (5,985) (31,582)
Increase (decrease) in foreign currency
translation difference 28 (12) 51 (6) - 24 - - - - - 19 104
Reclassifications - 17,373 5,809 277 410 51 199 1,033 584 233 (101,104) 75,135 -
Other increases (decreases) (*) (24) - (152) (16) - 196 - - - - (22,252) 5 (22,243)
Decreases to be classified as held for sale (1) (1.891) - (165) - - - - - - - - - (2.056)
Total changes (1,887) (16,447) (25,814) (460) (2,234) 177 (596) (10,804) (596) (3,056) 18,879 (108,028) (150,866)
Closing balance 32,702 237,585 26,417 3,355 1,773 3,642 1,686 24,643 366 8,191 170,710 1,021,640 1,532,710
(*) The net balance of other increases (decreases) corresponds to all those items that are reclassified to or from property, plant and equipment. They can have the
following origin:1) work in progress which are expensed to profit or loss, forming part of operating costs or other expenses per function, as appropriate, 2) the
variation representing the purchase and use of materials and spare parts, 3) projects corresponding mainly to exploration expenditures and ground studies that are
reclassified to the item other non-current financial assets, 4) Software that is reclassified to Intangibles.

10) FINANCIAL REPORTS
263
Note 14 Property, plant and equipment (continued)
14.3 Detail of property, plant and equipment pledged as guarantee
There are no restrictions in title or guarantees for compliance with obligations that affect property, plant and
equipment.
14.4 Impairment of assets
As indicated in Note 3.28 to the financial statements, the recoverable amount of property, plant and equipment is
measured provided that there is an indication that the asset could be impaired. As of December 31, 2017, there were
no impairment adjustments and as of December 31, 2016 there were impairment adjustments associated with the
closure of railway facilities for the transportation of products.
Railway for transportation of products from the Coya Sur location and the Port of Tocopilla
As a result of the rain storms that affected the Tocopilla Zone at the beginning of August 2015, SQM S.A. confirmed
damages to several sections of the railway between the Coya Sur and Tocopilla sites. As of that date, the Company
has used trucks to replace rail transportation. SQM has carried out several internal and external studies with the
purpose of determining what would be necessary to repair the damage to the railway.
These reports revealed that repairing the damage would entail high long-term costs, and it is therefore not convenient
to repair the railway in the short- to medium-term. This decision does not affect the production process or imply
additional employee reductions.
Consequently, SQM has adjusted the value of the assets associated with the railway (fixed equipment, facilities and
rolling stock), which has translated into a charge of approximately US$32 million, which is reflected in the line other
expenses by function in the consolidated statement of income for the period. This amount represents around 0,8% of
SQM’s total assets and 11% of revenue reported at the end of December 2016.
14.5 Additional information
Interest capitalized in construction-in-progress:
The amount capitalized for this concept amounted to ThUS$4,382 as of December 31, 2017 and ThUS$ 5,406 as of
December 31, 2016.
Financing costs are not capitalized for periods which exceed the normal term of acquisition, construction or
installation of the asset, such as occur with delays, interruptions or a temporary suspension of the project due to
technical, financial or other issues, which prevent the asset from being maintained in good condition for its use.

10) FINANCIAL REPORTS
264
Note 14 Property, plant and equipment (continued)
14.5 Additional information (continued)
Assets held for sale
The non-current assets held for sale and the components of the disposal groups classified as held for sale are presented
in the Consolidated Statement of Financial Position as a line for the following concept: “Non-current assets or groups
of assets classified as held for sale”.
The following table shows the main classes of non-current assets held for sale:
Assets held for sale 12/31/2017 12/31/2016
ThUS$ ThUS$
Land 1,480 1,891
Facilities and fixtures 109 165
Total 1,589 2,056

10) FINANCIAL REPORTS
265
Note 15 Employee benefits
15.1 Provisions for employee benefits
Classes of benefits and expenses by employee 12/31/2017 12/31/2016
ThUS$ ThUS$
Current
Profit sharing and bonuses 22,421 20,998
Total 22,421 20,998
Non-current
Profit sharing and bonuses 6,487 -
Severance indemnity payments 27,445 22,532
Total 33,932 22,532

10) FINANCIAL REPORTS
266
Note 15 Employee benefits (continued)
15.2 Policies on defined benefit plan
This policy is applied to all benefits received for services provided by the Company's employees.
Short-term benefits for active employees are represented by salaries, social welfare benefits, paid time off, sickness
and other types of leave, profit sharing and incentives and non-monetary benefits; e.g., healthcare service, housing,
subsidized or free goods or services. These will be paid in a term which does not exceed twelve months.
The Company only provides compensation and benefits to active employees, with the exemption of SQM North
America, which applies the definitions under 15.4 below.
SQM maintains incentive programs for its employees based on their personal performance, the Company’s
performance and other short-term and long-term indicators.
For each incentive bonus delivered to the Company’s employees, there will be a disbursement in the first quarter of
the following year and this will be calculated based on profit for the period at the end of each period applying a factor
obtained subsequent to each employee’s appraisal process.
Employee benefits include retention bonuses for the Company’s executives, which are linked to the Company’s share
price and are paid in cash. The short-term portion is presented as a provision for current employee benefits and the
long-term portion as non-current.
Staff severance indemnities are agreed and payable based on the final salary, calculated in accordance with each year
of service to the Company, with certain maximum limits in respect of either the number of years or in monetary terms.
In general, this benefit is payable when the employee or worker ceases to provide his/her services to the Company
and there are a number of different circumstances through which a person can be eligible for it, as indicated in the
respective agreements; e.g., retirement, dismissal, voluntary retirement, incapacity or disability, death, etc.
Law No. 19,728 published on May 14, 2001 which became effective on October 1, 2002 required “Compulsory
Unemployment Insurance” in favor of all dependent employees regulated by the Chilean Labor Code. Article 5 of
this law established that this insurance is paid through monthly contribution payments by both the employee and the
employer.

10) FINANCIAL REPORTS
267
Note 15 Employee benefits (continued)
15.3 Other long-term benefits
The other long-term benefits relate to staff severance indemnities and are recorded at their actuarial value, and an
executive compensation plan (see Note 16).
Staff severance indemnities at actuarial value 12/31/2017 12/31/2016
ThUS$ ThUS$
Staff severance indemnities, Chile 25,893 21,384
Executives compensation plan 6,487 -
Other obligations in companies elsewhere 1,552 1,148
Total other non-current liabilities 33,932 22,532
The actuarial assessment method has been used to calculate the Company’s obligations with respect to staff severance
indemnities, which relate to defined benefit plans consisting of days of remuneration per year served at the time of
retirement under conditions agreed in the respective agreements established between the Company and its employees.
Under this benefit plan, the Company retains the obligation to pay staff severance indemnities related to retirement,
without establishing a separate fund with specific assets, which is referred to as not funded. The discount interest rate
of expected flows to be used was 4.89%.
Benefit payment conditions
The staff severance indemnity benefit relates to remuneration days for years worked for the Company without a limit
being imposed in regard of amount of salary or years of service. It applies when employees cease to work for the
Company because they are made redundant or in the event of their death. This benefit is applicable up to a maximum
age of 65 for men and 60 for women, which are the usual retirement ages according to the Chilean pensions system
as established in Decree Law 3,500 of 1.980.
Methodology
The Company’s benefits obligation under IAS 19 Projected Benefit Obligation (PBO) is determined as follows:
To determine the Company's total liability, we used computer software to develop a mathematical simulation model
using the data for each individual employee.

10) FINANCIAL REPORTS
268
Note 15 Employee benefits (continued)
15.3 Other long-term benefits, continued
This model considered months as discrete time; i.e., the Company determined the age of each person and his/her
salary on a monthly basis according to the growth rate. Thus, information on each person was simulated from the
beginning of his/her employment contract or when he/she started earning benefits up to the month in which he/she
reaches normal retirement age, generating in each period the possible retirement according to the Company’s turnover
rate and the mortality rate according to the age reached. When he/she reaches the retirement age, the employee finishes
his/her service for the Company and receives a retirement indemnity.
The methodology followed to determine the accrual for all the employees covered by agreements took account of the
turnover rates and the mortality rate RV-2009 established by the Financial Markets Commission (formerly the Chilean
Superintendence of Securities and Insurance) to calculate pension-related life insurance reserves in Chile according
to the Accumulated Benefit Valuation or Accrued Cost of Benefit Method. This methodology is established in IAS
19 on Retirement Benefit Costs.
15.4 Post-employment benefit obligations
Our subsidiary SQM North America, together with its employees established a pension plan until 2002 called the
“SQM North America Retirement Income Plan”. This obligation is calculated measuring the expected future forecast
staff severance indemnity obligation using a net salary gradual rate of restatements for inflation, mortality and
turnover assumptions, discounting the resulting amounts at present value using the interest rate defined by the
authorities.
Since 2003, SQM North America offers to its employees’ benefits related to pension plans based on the 401-K system,
which do not generate obligations for the Company.
Reconciliation 12/31/2017 12/31/2016
Changes in the benefit obligation ThUS$ ThUS$
Benefit obligation at the beginning of the year 8,185 7,949
Service cost 2 2
Interest cost 359 387
Actuarial loss 556 200
Benefits paid (347) (353)
Benefit obligation at the end of the year 8,755 8,185

10) FINANCIAL REPORTS
269
Note 15 Employee benefits (continued)
15.4 Post-employment benefit obligations, continued
12/31/2017 12/31/2016
Changes in the plan assets: ThUS$ ThUS$
Fair value of plan assets at the beginning of the year 7,404 7,464
Actual return (loss) in plan assets 1,694 293
Benefits paid (347) (353)
Fair value of plan assets at the end of the year 8,751 7,404
Financing status (4) (781)
Items not yet recognized as net periodic pension cost components:
Net actuarial loss at the beginning of the year (3,432) (3,165)
Amortization during the year 219 184
Net estimated gain or loss occurred during the year 599 (451)
Adjustment to recognize the minimum pension obligation (2,614) (3,432)
The net periodic pension expense was composed of the following components for the years ended December 31, 2017, 2016 and 2015:
Reconciliation 12/31/2017 12/31/2016
ThUS$ ThUS$
Service cost or benefits received during the year 2 2
Interest cost in benefit obligation 359 387
Actual return in plan assets 1,694 293
Amortization of prior year losses 219 184
Net gain during the year 599 610
Net periodic pension expense 41 29
15.5 Staff severance indemnities
As of December 31, 2017 and 2016, severance indemnities calculated at the actuarial value are as follows:
12/31/2017
ThUS$
12/31/2016
ThUS$
Opening balance (22,532) (21,995)
Current cost of service (934) (1,333)
Interest cost (1,488) (1,407)
Actuarial gain/loss (1,144) (2,253)
Exchange rate difference (2,284) (1,215)
Benefits paid during the year 937 5,671
Balance (27,445) (22,532)

10) FINANCIAL REPORTS
270
Note 15 Employee benefits (continued)
15.5 Staff severance indemnities, continued
a) Actuarial assumptions
The liability recorded for staff severance indemnity is valued at the actuarial value method, using the following
actuarial assumptions:
12/31/2017 12/31/2016
Mortality rate RV - 2014 RV - 2009
Actual annual interest rate 5.114% 4.522%
Voluntary retirement rate:
Men 6.49% 7.16% annual
Women 6.49% 7.16% annual
Salary increase 3.00% 3.60% annual
Retirement age:
Men 65 65 years
Women 60 60 years
b) Sensitivity analysis of assumptions
As of December 31, 2017 and December 31, 2016, the Company has conducted a sensitivity analysis of the main
assumptions of the actuarial calculation, determining the following:
Sensitivity analysis 12/31/2017 Effect + 100 basis points
ThUS$
Effect - 100 basis points
ThUS$
Discount rate (1,991) 2,436
Employee turnover rate (252) 281
Sensitivity analysis 12/31/2016 Effect + 100 basis points
ThUS$
Effect - 100 basis points
ThUS$
Discount rate (1,576) 1,773
Employee turnover rate (207) 231
Sensitivity relates to an increase/decrease of 100 basis points.

10) FINANCIAL REPORTS
271
Note 16 Executive compensation plan
The Company currently has a compensation plan with the purpose of motivating the Company’s executives and
encouraging them to remain with the Company, by granting payments based on the change in the price of SQM’s
shares.
Average Share Price Spread
Plan characteristics
This compensation plan is related to the Company’s performance through the SQM Series B share price (Santiago
Stock Exchange).
Plan participants
A total of 39 Company executives are entitled to this plan, provided that they continue to work for the Company
through to the end of 2020. The payment dates, if applicable, will be during the first quarter of 2021.
Compensation
The compensation payable to each executive is calculated by multiplying a) by b):
a) The average price of Series B shares on the Santiago Stock Exchange during the fourth quarter of
2020, at its equivalent amount in United States dollars (with a maximum amount or limit amount of
US$54 per share),
b) By a number equal to the quantity of shares that have been individually assigned to each executive
included in the plan.
This compensation plan was approved by the Company’s Board of Directors and its application started on January 1,
2017.
The plan’s effect on the profit and loss as of December 31, 2017 totaled ThUS$6,487.

10) FINANCIAL REPORTS
272
Note 17 Disclosures on equity
The detail and movements in the funds of equity accounts are shown in the consolidated statement of changes in
equity.
17.1 Capital management
The main object of capital management relative to the administration of the Company’s financial debt and equity is
to ensure the regular conduct of operations and business continuity in the long term, with the constant intention of
maintaining an adequate level of liquidity and in compliance with the financial safeguards established in the debt
contracts in force. Within this framework, decisions are made in order to maximize the value of SQM.
Capital management must comply with, among others, the limits contemplated in the Financing Policy approved by
the Shareholders’ Meeting, which establish a maximum consolidated indebtedness level of 1.5 times the debt to equity
ratio. This limit can be exceeded only if the Company’s management has first obtained express approval at an
Extraordinary Shareholders’ Meeting.
In addition, capital management must comply with the external capital requirements (or covenants) imposed in its
financial obligations, which regulate the indebtedness level to 1.2 times, its strictest level.
In conjunction with the level of indebtedness, it is also important for the Company to maintain a comfortable profile
of maturities for its financial obligations, in order to oversee the relation between its short-term financial obligations
and the long-term maturities, and the relation they have with the Company’s asset distribution. Consequently, the
Company has maintained a liquidity level of 3 times during the last periods.
The Company’s management controls capital management based on the following ratios:
CAPITAL
MANAGEMENT 12/31/2017 12/31/2016 Description (1) Calculation (1)
Net Financial Debt
ThUS$
245,508 461,569
Financial Debt – Financial
Resources
Other current Financial Liabilities + Other
Non-Current Financial Liabilities – Cash and
Cash Equivalents – Other Current Financial
Assets – Hedging Assets, non-current
Liquidity
3.29 4.02 Current Asset divided by Current
Liability Total Current Assets / Total Current Liabilities
Net Debt /
Capitalization
0.10 0.17
Net Financial Debt divided by
Total Equity
Net financial debt / (Net financial debt +
Total Equity)
ROE 19.1% 12.25% Income divided by Total Equity Total Income / Equity (UH 12 months)
EBITDA (MUS$)
894,588 796,134
EBITDA
Gross Profit-Administrative Expenses +
Adjustments for depreciation and amortization
expenses.
ROA
21.4% 16.0%
EBITDA – Depreciation divided by Net Total Assets of financial
resources less related parties’
investments
(Gross Income – Administrative Expenses)/
(Total Assets – Cash and Cash Equivalents –
Other Current Financial Assets – Other Non-Current Financial Assets – Equity-accounted
Investees) (UH 12 months)
Indebtedness 0.91 0.83 Total Liability on Equity Total Liabilities / Total Equity
(1) Assumes the absolute value of the accounting records

10) FINANCIAL REPORTS
273
Note 17 Disclosures on equity (continued)
17.1 Capital management, continued
The Company’s capital requirements change according to variables such as working capital needs, new investment
financing and dividends, among others. The Company manages its capital structure and makes adjustments on the
basis of the predominant economic conditions so as to mitigate the risks associated with adverse market conditions
and take advantage of the opportunities there may be to improve the liquidity position.
There have been no changes in the capital management objectives or policy within the years reported in this document.
No breaches of external requirements of capital imposed (or covenants) have been recorded.
17.2 Disclosures on preferred share capital
Issued share capital is divided into 263,196,524 fully paid and subscribed shares composed of 142,819,552 Series
"A" shares and 120,376,972 Series “B” shares, where both series are preferred shares.
The preferential voting rights for each series are detailed as follows:
Series “A”:
If the election of the Company’s President results in a tie vote, the Company's directors may vote once again, without
the vote of the director elected by the Series B shareholders.
Series “B”:
1) A general or extraordinary shareholders' meeting may be called at the request of shareholders representing 5%
of the Company's Series B shares.
2) An extraordinary meeting of the Board of Directors may be called with or without the agreement of the
Company's President, at the request of the director elected by Series B shareholders.
As of December 31, 2017 and December 31, 2016, the Group does not maintain shares in the parent either directly or
through those companies in which it has investments.

10) FINANCIAL REPORTS
274
Note 17 Disclosures on equity (continued)
17.2 Disclosures on preferred share capital, continued
Detail of types of capital in preference shares:
Type of capital in preferred shares 12/31/2017 12/31/2016
Description of type of capital in preferred
shares Series A Series B Series A Series B
Number of authorized shares 142,819,552 120,376,972 142,819,552 120,376,972
Number of fully subscribed and paid shares 142,819,552 120,376,972 142,819,552 120,376,972
Number of subscribed, partially paid shares - - - -
Par value of shares in ThUS$ 0.9435 2.8464 0.9435 2.8464
Increase (decrease) in the number of current
shares - - - -
Number of current shares 142,819,552 120,376,972 142,819,552 120,376,972
Number of shares owned by the entity or its
subsidiaries or associates - - - -
Number of shares whose issuance is reserved
due to the existence of options or agreements to
dispose shares
- - - -
Capital amount in shares ThUS$ 134,750 342,636 134,750 342,636
Amount of premium issuance ThUS$ - - - -
Amount of reserves ThUS$ - - - -
Total number of subscribed shares, total 142,819,552 120,376,972 142,819,552 120,376,972
As of December 31, 2017 and December 31, 2016, the Company has not placed any new issuances of shares on the
market.

10) FINANCIAL REPORTS
275
Note 17 Disclosures on equity (continued)
17.3 Disclosures on reserves in equity
As of December 31, 2017 and December 31, 2016, this caption comprises the following:
12/31/2017 12/31/2016
ThUS$ ThUS$
Reserve for currency exchange conversion (24,913) (19,463)
Reserve for cash flow hedges 2,248 64
Reserve for gains and losses from financial assets
measured at fair value through other comprehensive
income 2,937
3,513
Reserve for actuarial gains or losses in defined benefit
plans (5,953)
(4,834)
Other reserves 11,332 7,832
Total other reserves (14,349) (12,888)
Reserves for foreign currency translation differences
This balance reflects retained earnings for changes in the exchange rate when converting the financial statements of
subsidiaries whose functional currency is that of each company’s origin country and the presentation currency is the
US dollar.
Reserve for cash flow hedges
The Company maintains, as hedge instruments, financial derivatives related to obligations with the public issued in
UF and Chilean pesos. Changes from the fair value of derivatives designated and classified as hedges are recognized
under this classification.
Reserve for gains and losses from financial assets measured at fair value through other comprehensive income
This caption includes investments in shares where the Company has no significant influence and these have
accordingly been measured at fair value through equity. In the event that such equity instruments are fully or partially
disposed of, the proportional accumulated effect of accumulated fair value will be transferred to profit or loss.
Reserve for actuarial gains or losses in defined benefit plans
For domestic subsidiaries the effects of changes in assumptions are considered, mainly changes in the discount rate.
The subsidiary SQM North America has established pension plans for its retired employees that are calculated by
measuring the projected obligation of staff severance indemnities using a net salary progressive rate net of
adjustments to inflation, mortality and turnover assumptions, deducting the resulting amounts at present value using
a 5.5% interest rate for 2017 and 2016.
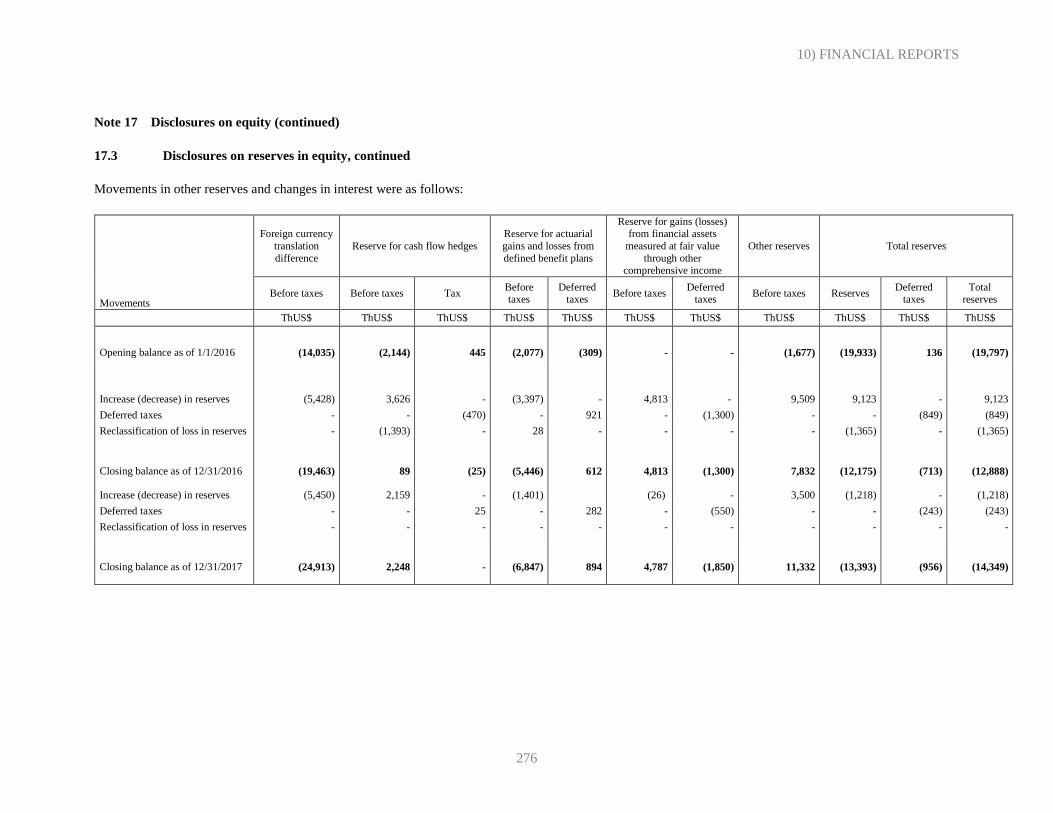
10) FINANCIAL REPORTS
276
Note 17 Disclosures on equity (continued)
17.3 Disclosures on reserves in equity, continued
Movements in other reserves and changes in interest were as follows:
Movements
Foreign currency
translation
difference
Reserve for cash flow hedges
Reserve for actuarial
gains and losses from
defined benefit plans
Reserve for gains (losses) from financial assets
measured at fair value
through other
comprehensive income
Other reserves Total reserves
Before taxes Before taxes Tax Before taxes
Deferred taxes
Before taxes Deferred
taxes Before taxes Reserves
Deferred taxes
Total reserves
ThUS$ ThUS$ ThUS$ ThUS$ ThUS$ ThUS$ ThUS$ ThUS$ ThUS$ ThUS$ ThUS$
Opening balance as of 1/1/2016 (14,035) (2,144) 445 (2,077) (309) - - (1,677) (19,933) 136 (19,797)
Increase (decrease) in reserves (5,428) 3,626 - (3,397) - 4,813 - 9,509 9,123 - 9,123
Deferred taxes - - (470) - 921 - (1,300) - - (849) (849)
Reclassification of loss in reserves - (1,393) - 28 - - - - (1,365) - (1,365)
Closing balance as of 12/31/2016 (19,463) 89 (25) (5,446) 612 4,813 (1,300) 7,832 (12,175) (713) (12,888) Increase (decrease) in reserves (5,450) 2,159 - (1,401) (26) - 3,500 (1,218) - (1,218)
Deferred taxes - - 25 - 282 - (550) - - (243) (243)
Reclassification of loss in reserves - - - - - - - - - - -
Closing balance as of 12/31/2017 (24,913) 2,248 - (6,847) 894 4,787 (1,850) 11,332 (13,393) (956) (14,349)

10) FINANCIAL REPORTS
277
Note 17 Disclosures on equity (continued)
17.3 Disclosures on reserves in equity, continued
Other reserves
This caption corresponds to the legal reserves reported in the individual financial statements of the subsidiaries that
are mentioned below and that have been recognized in SQM’s equity through the application of the equity method.
In the case of SQM Iberian S.A., the variation between the two periods corresponds to the results obtained in the
previous financial year which are presented as forming part of other reserves because of local regulations.
12/31/2017 12/31/2016
Subsidiary - Associate ThUS$ ThUS$
SQM Iberian S.A. 9,464 5,964
SQM Europe NV 1,957 1,957
Soquimich European holding B.V. 828 828
Abu Dhabi Fertilizer Industries WWL 455 455
Doktor Tarsa Tarim Sanayi AS 305 305
Total 13,009 9,509
Corresponds to the acquisition of the subsidiary SQM Iberian S.A., which was
already under Company ownership at the acquisition date (IAS 27 R). (1.677)
(1,677)
Total Other reserves 11.332 7,832

10) FINANCIAL REPORTS
278
Note 17 - Disclosures on equity (continued)
17.4 Dividend policies
As required by Article 79 of the Chilean Companies Act, unless otherwise decided by unanimous vote of the holders
of issued and subscribed shares, we must distribute a cash dividend in an amount equal to at least 30% of our
consolidated profit for the year ended as of December 31, unless and except to the extent it has a deficit in retained
earnings (losses not absorbed in prior years).
At an extraordinary meeting held on April 11, 2017, the Company’s Board of Directors made a recommendation for
discussion at the Ordinary Shareholders’ Meeting (the Meeting), which was held on April 28, 2017, that the Company
should distribute and pay dividends based on 100% of the Company’s net profit for distribution for the financial year
2016. This recommendation was accepted by the Meeting.
For 2017, the Company has defined the following dividend policy: (a) To distribute and pay a dividend to the
respective shareholders a percentage of the profits to be determined as follows:
(i) 100% of the profit for 2017 if all the following financial parameters are met: (a) that the total of cash and cash
equivalents and other current financial assets (“Cash”) divided by the addition of other current financial liabilities
(the “Short-term Financial Liabilities”) is equal to or more than 2.5 times, and (b) the total of current liabilities and
non-current liabilities (“Total Liabilities”) divided by total equity (“Equity”) is equal to or less than 1.1 times.
(ii) 80% of profit for 2017 if all the following financial parameters are met: (a) that Cash divided by Short-term
Financial Liabilities is equal to or more than 2.0 times, and (b) Total Liabilities divided by Total Equity is equal to or
less than 1.2 times.
(iii) 60% of profit for 2017 if all the following financial parameters are met: (a) that Cash divided by Short-term
Financial Liabilities is equal to or more than 1.5 times, and (b) Total Liabilities divided by Total Equity is equal to or
less than 1.3 times. Should none of these parameters be met, the Company will distribute and pay as dividend 50%
of the profit for 2017 to the respective shareholders.

10) FINANCIAL REPORTS
279
Note 17 Disclosures on equity (continued)
17.5 Interim and provisional dividends
On November 22, 2017, the Company’s Board of Directors agreed to pay a provisional dividend equivalent to
US$0.42879 per share with a charge to profit for 2017. Such amount will be paid in its equivalent in Chilean pesos,
the domestic currency, according to the observed U.S. dollar exchange rate published in the Official Gazette on
November 30, 2017.
This dividend will be paid to shareholders, in person or through their duly authorized representatives, starting at 9:00
a.m. on December 14, 2017. The shareholders who are registered in the Shareholders’ Registry five business days
prior to the date of payment will be entitled to the dividend.
On August 23, 2017, the Company’s Board of Directors agreed to pay a provisional dividend equivalent to
US$0.38432 per share with a charge to profit for 2017. Such amount will be paid in its equivalent in Chilean pesos,
the domestic currency, according to the observed U.S. dollar exchange rate published in the Official Gazette on
August 31, 2017.
On May 17, 2017, the Board of Directors unanimously agreed to pay a provisional dividend equivalent to US$0.39222
per share with a debit to the profit for 2017. Such amount will be paid in its equivalent in Chilean pesos, the domestic
currency, according to observed U.S. dollar exchange rate published in the Official Gazette on May 31, 2017.
At the General Ordinary Shareholders' Meeting of April 28, 2017, the shareholders agreed to the payment of a
dividend of US$1.05735 per share from the net profit for distribution obtained during the 2016 fiscal year, from which
must be discounted the sum of US$0.85487 per share, which was already paid as a provisional dividend, resulting in
a remaining balance of US$0.20248 per share.
On November 23, 2016, the Board of Directors of Sociedad Química y Minera de Chile S.A approved the payment
of a provisional dividend of US$225 million, equivalent to US$0.85487 per share with a charge to profit for 2016.
This amount would be paid at its equivalent in Chilean pesos using the observed U.S. dollar exchange rate published
in the Official Gazette on December 13, 2016.
This dividend payment would be made in favor of the shareholders personally or through their duly authorized
representatives from 9:00 am on December 20, 2016. The shareholders who are registered with the Shareholders’
Registry five business days prior to December 20, 2016 will be entitled to the dividend.

10) FINANCIAL REPORTS
280
Note 17 - Disclosures on equity (continued)
17.5 Interim and provisional dividends, continued
Change in 2016 Dividend Policy
On November 23, 2016, the provisional dividend described above and the Dividend Policy for the 2016 fiscal year
were approved as communicated at the Ordinary Shareholders’ Meeting of April 26, 2016 (the “Dividend Policy”),
was amended as follows:
(i) Not to distribute more provisional dividends during 2016 except for the dividend approved on that date, to
be paid during the last quarter of 2016.
(ii) The remaining amount of net profit for 2016, if any, to be retained and used for the financing of own
operations or activities associated with one or more of the Company’s investment projects, without prejudice,
however, to the possible future capitalization of all or a portion of this or its distribution as a dividend as determined
by the shareholders at the Company’s Ordinary Shareholders’ Meeting.
(iii) The Dividend Policy described above relates to the intent or expectation of the Board of Directors with
respect to such matter. Consequently, compliance with this Dividend Policy is necessarily dependent on the net profits
that are finally obtained and the profit or loss indicated by the Company’s regular forecasts.
If the Dividend Policy is subject to substantive change, the Board of Directors will communicate and inform its
shareholders about any such change in a timely manner in the form of an essential event. On March 22, 2016, the
Company communicated that the Directors of Sociedad Química y Minera de Chile S.A. (SQM), at the Ordinary
Meeting had unanimously agreed the following:
To partially amend “SQM S.A.’s Dividend Policy for the 2015 fiscal year with the main purpose of including in such
“Policy” the payment of an interim dividend of US$150,000,000, equivalent to US$0.56992 per share, to be paid
with a charge to retained earnings of SQM S.A.”. This was reported to the Ordinary Shareholders’ Meeting of April
24, 2015.
The dividends presented as deducted from equity are as follows:
12/31/2017
ThUS$
12/31/2016
ThUS$
Dividends attributable to owners of the parent 55,501 3,014
Provisional dividend 317,243 225,000
Interim dividend 150,000
Dividend payable 110,529 -
Total 483,273 378,014

10) FINANCIAL REPORTS
281
Note 18 Provisions and other non-financial liabilities
18.1 Types of provisions
12/31/2017 12/31/2016
Current Non-
current
Total Current
Non-
current
Total
ThUS$ ThUS$ ThUS$ ThUS$ ThUS$ ThUS$
Provision for legal complaints (*) 16,419 3,000 19,419 20,867 3,000 23,867
Provision for dismantling, restoration and rehabilitation cost - 26,954 26,954 - 5,890 5,890
Other provisions (**) 47,026 47 47,073 21,045 44 21,089
Total 63,445 30,001 93,446 41,912 8,934 50,846
(*) These provisions correspond to legal processes that are pending resolution or that have not yet been disbursed. These provisions are mainly related to litigation
involving the subsidiaries located in Chile, Brazil and the United States (see note 19.1).
(**) See Note 18.2

10) FINANCIAL REPORTS
282
Note 18 Provisions and other non-financial liabilities (continued)
18.2 Description of other provisions
Current provisions, other short-term provisions 12/31/2017 12/31/2016
ThUS$ ThUS$
Provision for tax loss in fiscal litigation 739 750
Rent under Lease contract with CORFO(*) 32,331 11,452
Provision for additional tax related to foreign loans 416 450
End of agreement bonus 4,522 5,365
Directors’ per diem allowance 2,630 1,918
Provision for subsidiary restructuring 6,000 -
Miscellaneous provisions 388 1,110
Total 47,026 21,045
Other long-term provisions
Investments with negative equity 47 44
Total 47 44
(*) Rent for the lease contract with CORFO: This relates to the lease of mining properties that SQM Salar S.A.
pays on a quarterly basis to the state entity “Corporación de Fomento” (CORFO). The amount payable is calculated
based on the sales of products extracted from the Atacama Saltpeter Deposit. It includes US$20.4 million
corresponding to the payment that forms part of the agreement reached with CORFO (see note 33.2).
These amounts are paid on a quarterly basis.
Other liabilities non-financial current
Description of other liabilities 12/31/2017 12/31/2016
ThUS$ ThUS$
Tax withholdings 7,404 14,340
VAT payable 3,344 3,949
Guarantees received 2,638 2,638
Accrual for dividend 110,529 1,189
Monthly tax provisional payments 11,684 9,545
Deferred income 5,301 6,507
Withholdings from employees and salaries payable 6,725 5,552
Accrued vacations (*) 19,042 15,841
Other current liabilities 2,137 2,359
Total 168,804 61,920
(*) Vacation benefit (short-term benefits to employees, current) is in line with the provisions established in Chile’s
Labor Code, which indicates that employees with more than a year of service will be entitled to annual vacation for
a period of at least fifteen paid business days. The Company provides the benefit of two additional vacation days

10) FINANCIAL REPORTS
283
Note 18 Provisions and other non-financial liabilities (continued)
18.3 Changes in provisions
Description of items that gave rise to variations as of
12/31/2017
Legal
complaints
Provision for
dismantling,
restoration and
rehabilitation cost
Other
provisions
Total
ThUS$ ThUS$ ThUS$ ThUS$
Total provisions, initial balance 23,867 5,890 21,089 50,846
Changes in provisions:
Additional provisions 6,352 21,064 33,507 60,923
Provision used (10,800) - (7,538) (18,338) Increase(decrease) in foreign currency exchange - - 9 9
others - - 6 6
Total provisions, final balance 19,419 21,954 47,073 93,446
Description of items that gave rise to variations as of
12/31/2016
Legal
complaints
Provision for
dismantling,
restoration and
rehabilitation cost
Other
provisions
Total
ThUS$ ThUS$ ThUS$ ThUS$
Total provisions, initial balance 21,067 5,890 13,445 40,402
Changes in provisions: Additional provisions 2,800 - 54,310 57,110
Provision used - - (47,261) (47,261)
Increase(decrease) in foreign currency exchange - - 128 128 Others - - 467 467
Total provisions, final balance 23,867 5,890 21,089 50,846

10) FINANCIAL REPORTS
284
Note 19 Contingencies and restrictions
In accordance with note 18.1, the Company has only registered a provision for those lawsuits in which there is a
probability that the judgments will be unfavorable to the Company. The Company is party to the following lawsuits
and other relevant legal actions:
19.1 Lawsuits and other relevant events
1. Plaintiff : Nancy Erika Urra Muñoz.
Defendants : Fresia Flores Zamorano, Duratec-Vinilit S.A. and the Company and their insurers.
Date : December 2008.
Court : 1st Civil Court of Santiago.
Reason : Labor Accident.
Status : Judgment favorable for the Company. Appeal filed by the plaintiff.
Nominal value : ThUS$550.
2. Plaintiff : City of Pomona, California USA.
Defendant : SQM North America Corporation.
Date : December 2010.
Court : United States District Court Central District of California.
Reason : Payment of expenses and other amounts related to the treatment of groundwater to
allow for its consumption by removing the existing perchlorate in such groundwater that
allegedly comes from Chilean fertilizers.
Status : On August 7, 2017, the Unites States Court of Appeals for the Ninth Circuit ordered the
beginning of a new trial.
Nominal value : ThUS$32,000.
3. Plaintiff : City of Lindsay, California USA.
Defendant : SQM North America Corporation and the Company (still not noticed)
Date : December 2010.
Court : United States District Court Eastern District of California.
Reason : Payment of expenses and other amounts related to the treatment of groundwater to allow
for its consumption by removing the existing perchlorate in such groundwater that
allegedly comes from Chilean fertilizers.
Status : Filing of the case. Processing suspended.
Nominal value : Not possible to determine.
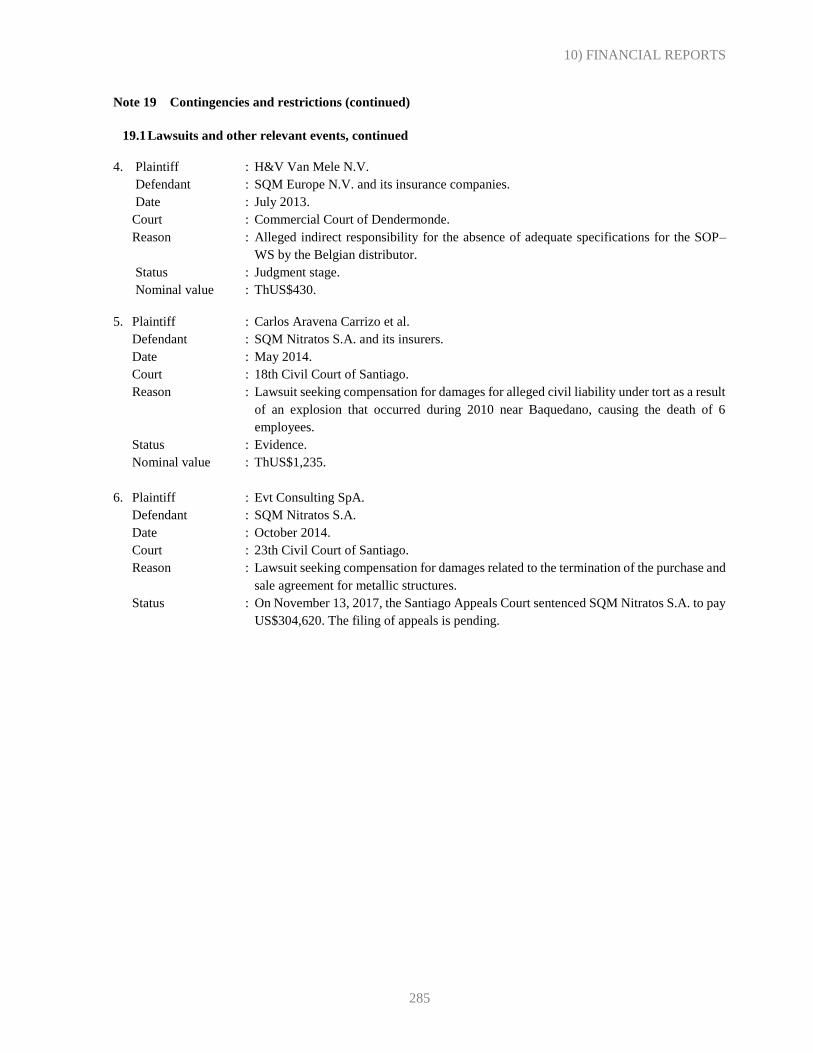
10) FINANCIAL REPORTS
285
Note 19 Contingencies and restrictions (continued)
19.1 Lawsuits and other relevant events, continued
4. Plaintiff : H&V Van Mele N.V.
Defendant : SQM Europe N.V. and its insurance companies.
Date : July 2013.
Court : Commercial Court of Dendermonde.
Reason : Alleged indirect responsibility for the absence of adequate specifications for the SOP–
WS by the Belgian distributor.
Status : Judgment stage.
Nominal value : ThUS$430.
5. Plaintiff : Carlos Aravena Carrizo et al.
Defendant : SQM Nitratos S.A. and its insurers.
Date : May 2014.
Court : 18th Civil Court of Santiago.
Reason : Lawsuit seeking compensation for damages for alleged civil liability under tort as a result
of an explosion that occurred during 2010 near Baquedano, causing the death of 6
employees.
Status : Evidence.
Nominal value : ThUS$1,235.
6. Plaintiff : Evt Consulting SpA.
Defendant : SQM Nitratos S.A.
Date : October 2014.
Court : 23th Civil Court of Santiago.
Reason : Lawsuit seeking compensation for damages related to the termination of the purchase and
sale agreement for metallic structures.
Status : On November 13, 2017, the Santiago Appeals Court sentenced SQM Nitratos S.A. to pay
US$304,620. The filing of appeals is pending.

10) FINANCIAL REPORTS
286
Note 19 Contingencies and restrictions (continued)
19.1 Lawsuits and other relevant events, continued
7. Plaintiff : SQM Salar and the Company.
Defendant : Seguros Generales Suramericana S.A. (formerly - RSA Seguros Chile S.A.)
Date : August 29, 2016
Court : Arbitration Court – Arbitrator Mr. Gonzalo Fernández.
Reason : Complaint for forced compliance and collection of indemnification for insurance claim
of February 7 and 8, 2013.
Status : Evidence stage
Nominal value : MUS$20,658.
8. Plaintiff : Tyne and Wear Pension Fund as represented by the Council of the Borough of South
Tyneside acting as Lead Plaintiff.
Defendant : The Company
Date : January 2016.
Court : United States District Court – Southern District of New York.
Reason : Alleged damage to ADS holders of the Company resulting from alleged noncompliance
with the securities regulations in the United States by the Company.
Status : Initial stage of disclosure of background information.
Nominal value : Not determined.
9. Plaintiff : Ernesto Saldaña González et al.
Defendant : SQM Salar S.A., SQM Industrial S.A. (“SQM Industrial”) and their insurance
companies
Date : May 2016.
Court : 13th Civil Court of Santiago.
Reason : Lawsuit seeking compensation for damages for alleged civil liability under tort law
arising from the accident that occurred in July 2014 in the María Elena location.
Status : Evidence stage
Nominal value : ThUS$515.

10) FINANCIAL REPORTS
287
Note 19 Contingencies and restrictions (continued)
19.1 Lawsuits and other relevant events, continued
10. Plaintiff : María Yolanda Achiardi Tapia et al.
Defendant : SQM Salar and its insurance companies and other 5 defendants
Date : February 2015.
Court : 1st Civil Court of Antofagasta.
Reason : Lawsuit seeking compensation for damages for alleged civil liability under tort law
arising from a traffic accident that occurred in April 2011 in the city of Antofagasta.
Status : Lawsuit pending notice to one of the defendants.
Nominal value : ThUS$1,265.
11. Plaintiff : The Company
Defendants : AES Gener S.A. and Empresa Eléctrica Cochrane SpA.
Date : May 11, 2017
Court : Arbitration award in accordance with the arbitration rules established by the Center for
Arbitration and Mediation of the Santiago Chamber of Commerce.
Reason : Request for the interpretation of an electricity supply agreement alleging the right by the
plaintiff to receive a collection in conformity with such agreement.
Instance : Conciliation stage
Nominal value : Not determined
12. Plaintiff : AES Gener S.A. and Empresa Eléctrica Cochrane SpA.
Defendant : The Company
Date : May 2017
Court : Arbitration award in accordance with the Arbitration Rules established by the Center for
Arbitration and Mediation of the Santiago Chamber of Commerce
Reason : Discrepancy with respect to the amount of an alleged right by the plaintiff to receive a
collection in conformity with the agreement entered into by the parties.
Instance : Deliberation stage
Nominal value : Not determined

10) FINANCIAL REPORTS
288
Note 19 Contingencies and restrictions (continued)
19.1 Lawsuits and other relevant events, continued
13. Plaintiffs : Araya Oses, Antonio et al.
Defendants : Transportes Buen Destino S.A. and SQM Salar.
Date : February 17, 2017
Court : 1st Civil Court of Santiago
Reason : Lawsuit for several or subsidiary liability for unfair dismissal, seeking the voidance of
the dismissal and collection of labor benefits.
Instance : An appeal seeking voidance of the first instance judgment is pending.
Nominal value : ThUS$235.
14. Plaintiffs : Employee Union No. 2 of SQN Nitratos Nueva Victoria.
Defendant : SQM Nitratos S.A.
Date : November 23, 2016.
Court : Labor Court of Iquique.
Reason : Lawsuit alleging differences in the calculation of the bonus payable under the Collective
Bargaining Agreement.
Instance : At the evidence stage
Nominal value : ThUS$385
15 Plaintiff : TBD
Reason : Voluntary Winding up Statement (Law No. 20.720)
Court : Civil Court of Colina
Instance : On January 4, 2017 the voluntary winding up process began. On March 8, 2017, SQM
Industrial verified credits in ordinary period associated with the sale of fuel of
Ch$217,193,666 with express reserve as to the legal compensation applicable.
Nominal value : Ch$217,193,666

10) FINANCIAL REPORTS
289
Note 19 Contingencies and restrictions (continued)
19.1 Lawsuits and other relevant events, continued
16. Plaintiffs : TBD
Defendant : SQM Salar.
Date : None
Court : Arbitration Court Arbitrator Mr. Jaime Martínez Tejeda.
Reason : Discrepancies generated in the performance of the (i) lithium brine transportation
agreement; and (ii) salt transportation agreement entered into between TBD and SQM
Salar.
Instance : The case has not been presented yet.
Nominal value : Not determined
17. Plaintiffs : Castillo, Hernán et al.
Defendants : Servicios Integrales de Tránsitos y Transferencias S.A. and SQM Industrial S.A.
Date : September 15, 2017.
Court : 1st Labor Court of Santiago.
Reason : Lawsuit to assert labor rights, seeking collection of wages owed and
other amounts.
Instance : Preparatory hearing pending.
Nominal value : ThUS$1,940
18 Plaintiffs : Vargas Guerra, Vicente Ignacio.
Defendants : SQM Nitratos S.A.
Date : January 17, 2018.
Court : 1st Labor Court of Santiago.
Reason : Lawsuit for damages related to pain and suffering and lost earnings
resulting from occupational illness.
Instance : Preparatory hearing pending.
Nominal value : ThUS$256.
19 Plaintiffs : Acosta Tapia, Eloisa del Tránsito and others as successors and assigns
of Araya Castillo, Raimundo del Rosario.
Defendants : SQM Salar S.A.
Date : January 19, 2018.
Court : 2nd Labor Court of Santiago.
Reason : Lawsuit for damages
for pain and suffering as a result of occupational illness.
Instance : Preparatory hearing pending.
Nominal value : ThUS$472
20 Plaintiffs : Roa Maluenda, Rosa del Carmen as successor and assign of
Sánchez Gamboa, Gerónimo Iván.
Defendants : SQM S.A., SQM Nitratos S.A. and SQM Industrial S.A.
Date : January 23, 2018.
Court : 1st Labor Court of Santiago.
Reason : Lawsuit for damages
for pain and suffering as a result of occupational illness.
Instance : Preparatory hearing pending.
Nominal value : ThUS$472

10) FINANCIAL REPORTS
290
Note 19 Contingencies and restrictions (continued)
19.1 Lawsuits and other relevant events, continued
The Company and its subsidiaries have been involved and will probably continue to be involved either as plaintiffs
or defendants in certain judicial proceedings that have been and will be heard by the arbitration or ordinary courts
of justice that will make the final decision. Those proceedings that are regulated by the appropriate legal
regulations are intended to exercise or oppose certain actions or exceptions related to certain mining claims either
granted or to be granted and that do not or will not affect in an essential manner the development of the Company
and its subsidiaries.
Soquimich Comercial S.A. has been involved and will probably continue being involved either as plaintiff or
defendant in certain judicial proceedings through which it intends to collect and receive the amounts owed, the total
nominal value of which is approximately US$1.2 million.
The Company has made efforts and continues making efforts to obtain payment of certain amounts that are still
owed it on occasion of their activities. Such amounts will continue to be required using judicial or non-judicial
means by the plaintiffs, and the actions and exercise related to these are currently in full force and effect.
The Company and its subsidiaries have received no legal notice on lawsuits other than those indicated above, which
exceed US$0,2 million.

10) FINANCIAL REPORTS
291
Note 19 Contingencies and restrictions (continued)
19.2 Restrictions to management or financial limits
contracts subscribed the issuance of bonuses in the local and international market require the Company to comply
with the following level of consolidated financial indicators, calculated for a moving period that considers the last
twelve months:
- To maintain a Total Indebtedness Ratio not higher than 1.2 times at its strictest level. The total Indebtedness
level is defined as the Total Liabilities divided by Total Equity.
As of December 31, 2017, the aforementioned financial indicators are as follows:
Indicator 12/31/2017 12/31/2016
Equity ThUS$ 2,247,468 2,307,272
Net Financial Debt/ EBITDA 0.27 0.58
Indebtedness 0.91 0.83
SQM Industrial and SQM Salar debt / Current assets 0.03 0.02
Bond issue agreements issued abroad require the Company to neither merge or dispose of the whole or a substantial
part of its assets, unless all the following conditions are met: (i) the legal successor company is an entity subject to
either Chilean or United States law, and assumes SQM S.A.’s obligations under a complimentary contract, (ii) the
Issuer does not fail to comply immediately after the merger or disposal, and (iii) the Issuer delivers a legal opinion
stating that the merger or disposal and the complimentary contract meet the requirements described in the original
contract.
In addition, SQM S.A. is committed to disclosing financial information on quarterly basis.
The Company and its subsidiaries have complied and are fully complying with all the aforementioned limitations,
restrictions and obligations.

10) FINANCIAL REPORTS
292
Note 19 Contingencies and restrictions (continued)
19.4 Environmental contingencies
On June 6, 2016, the Superintendence of the Environment (the “SMA”) filed charges against the Company with
respect to the Pampa Hermosa project for possible noncompliance with RCA 890/2010.
This relates to charges regarding certain variables in the follow-up plan and through the implementation of a
mitigation measure contemplated in the related environmental impact assessment. The Company submitted a
Compliance Program to the SMA for its approval. This program details the actions and commitments that the
Company will perform to overcome the objections filed by the environmental authority. On June 29, 2017, the SMA
rejected the Compliance Program submitted by the Company. On July 10, the Company presented the defense
against the charges filed by the SMA. On December 13, 2017, the First Environmental Court of Antofagasta ordered
the temporary and partial closure of the water extraction wells located in the Salar de Llamara. These wells allow
the Company to extract around 124 liters/second of water, which is approximately 15% of the water used in Chile’s
First Region.
Through a ruling dated November 28, 2016, which was modified by a ruling dated December 23, 2016, the SMA
filed charges against SQM Salar for extracting brine in excess of authorized amounts, progressively impacting the
vitality of algarrobo trees, delivering incomplete information, modifying variables and other matters.
SQM Salar has presented a compliance program detailing the actions and commitments it will carry out to address
the SMA's objections. The SMA is reviewing the compliance program.

10) FINANCIAL REPORTS
293
Note 19 Contingencies and restrictions (continued)
19.4 Tax contingency, continued
During 2015, the Company, SQM Salar and SQM Industrial submitted to the Chilean IRS four tax amendments (two
by the Company, one by SQM Salar and one by SQM Industrial).
The first two (one for SQM and one for SQM Salar), after being approved by the SII, generated payments for taxes,
interests and other charges for US$8.1 million. A provision for such amount was made in the profit or loss for the
first quarter of 2015.
Additionally, during August 2015, the Chilean IRS was provided, for its review and approval, with the
documentation necessary for amending the annual tax returns of the Company and SQM Industrial. As a result of
such amendments, the Company paid an approximate sum of US$1.4 million for taxes, interests and other charges.
This amount was recorded in a provision in the profit or loss for the second quarter of 2015.
Finally, during 2016, the last 12 invoices were amended with a payment of approximately US$50,000.
Accordingly, the SQM Group understands the internal analysis they have been performing has ended, the purpose
of which was the identification of the expenses incurred by them during the fiscal years 2008 to 2014 and which
could be a matter of tax amendment.
Because of the aforementioned amendments, the Company, SQM Salar and SQM Industrial might be affected by
additional penalties established in the first subparagraph, No. 4 of Article 97 of the Tax Code, for an amount ranging
between 50% and 300% of the taxes paid. The Company has not considered it necessary to make any provisions
related to this possible additional penalty.
On August 26, 2016, SQM Salar filed with the Third Tax and Customs Court of the Metropolitan Region a tax claim
against tax assessments Nos. 169, 170, 171 and 172, which seek to expand the application of the specific tax on
mining activities for the exploitation of lithium. The amount involved is approximately ThUS$17,809. This claim is
at the deliberation stage.
On March 24, 2017, SQM Salar filed with the Third Tax and Customs Court of the Metropolitan Region a tax claim
against tax assessment No. 207 of 2016 and ruling No. 156 of 2016, both issued by the Chilean IRS, which seek to
expand application of the specific tax on mining activities to include lithium exploitation for tax years 2015 and
2016. The amount involved is approximately US$14.4 million. This claim is at the deliberation stage.
The aforementioned amounts are classified as current tax assets, non-current as of December 31, 2017.

10) FINANCIAL REPORTS
294
Note 19 Contingencies and restrictions (continued)
19.4 Tax contingency, continued
Of the US$32.2 million under dispute, approximately US$25,2 million correspond to the potential specific tax on
mining activities related to lithium and US$7.0 million correspond to an excess charge levied by the Chilean IRS.
The Chilean IRS has not issued an assessment claiming differences in the specific tax on mining activities filed for
the years 2016 and 2017. As of the date of these financial statements, SQM has not made any provisions for these
possible differences.
If the Chilean IRS uses criteria similar to that used in previous years, it may issue an assessment in the future for the
2016 and 2017 financial years. It is reasonable to expect that should these assessments (for the years 2016 and 2017)
be issued, the value would be approximately US$30 million (without considering potential interest and fines).
19.5 Restricted or pledged cash
The subsidiary Isapre Norte Grande Ltda., in compliance with the provisions established by the Chilean
Superintendence of Healthcare, which regulates the running of pension-related health institutions, maintains a
guarantee in financial instruments delivered in deposits, custody and administration to Banco de Chile.
This guarantee, according to the regulations issued by the Chilean Superintendence of Healthcare is equivalent to
the total sum owed to its members and medical providers. Banco de Chile reports the present value of the guarantee
to the Chilean Superintendence of Healthcare and Isapre Norte Grande Ltda. on a daily basis. As of December 31,
2017, the guarantee amounts to ThUS$771.

10) FINANCIAL REPORTS
295
Note 19 Contingencies and restrictions (continued)
19.6 Securities obtained from third parties
The main security received (exceeding ThUS$100) from third parties to guarantee Soquimich Comercial S.A.’s
compliance with obligations in contracts of commercial mandates for the distribution and sale of fertilizers amounted
to ThUS$12,103 and ThUS$7,386 on December 31, 2017 and December 31, 2016 respectively; which is detailed as
follows:
Grantor Relationship
12/31/2017 12/31/2016
ThUS$ ThUS$
Ferosor Agrícola S.A. Unrelated third party
4,067 -
Tattersall Agroinsumos S.A. Unrelated third party
2,000 2,000
Contador Frutos S.A. Unrelated third party
1,743 1,574
Agrícola Lobert Ltda. Unrelated third party
1,264 1,141
Covepa SPA Unrelated third party
813 747
Johannes Epple Davanzo Unrelated third party
363 333
Hortofrutícola La Serena Unrelated third party
323 291
Juan Luis Gaete Chesta Unrelated third party
262 241
Arena Fertilizantes y Semillas Unrelated third party
244 224
Vicente Oyarce Castro Unrelated third party
244 220
Soc. Agrocom. Julio Polanco Unrelated third party
163 149
Bernardo Guzmán Schmidt Unrelated third party
138 125
Gilberto Rivas Y Cia. Ltda. Unrelated third party
138 125
Lemp Martin Julian Unrelated third party
124 111
Comercial Agrosal Ltda. Unrelated third party
116 105
Soc. Comercial el Mimbral Unrelated third party
101 -
Total
12,103 7,386

10) FINANCIAL REPORTS
296
Note 19 Contingencies and restrictions (continued)
19.7 Indirect guarantees
Guarantees in which there is no pending balance indirectly reflect that the respective guarantees are in force, have been approved by the Company’s Board of
Directors and have not been used by the respective subsidiary.
The bonds which disclose a balance as of December 31, 2017 and December 31, 2016 are detailed below:
Creditor of the guarantee
Debtor Type of
guarantee
Balances as of the closing
date of the financial
statements
Name Relationship 12/31/2017
ThUS$
12/31/2016
ThUS$
Australian and New Zealand Bank SQM North America Corp Subsidiary Bond - -
Australian and New Zealand Bank SQM Europe N.V. Subsidiary Bond - -
Generale Bank SQM North America Corp Subsidiary Bond - -
Generale Bank SQM Europe N.V. Subsidiary Bond - -
Kredietbank SQM North America Corp Subsidiary Bond - -
Kredietbank SQM Europe N.V. Subsidiary Bond - -
Banks and financial institutions SQM Investment Corp. N.V. Subsidiary Bond - -
Banks and financial institutions SQM Europe N.V. Subsidiary Bond - -
Banks and financial institutions SQM North America Corp Subsidiary Bond - -
Banks and financial institutions Nitratos Naturais do Chile Ltda. Subsidiary Bond - -
Banks and financial institutions SQM México S.A. de C.V. Subsidiary Bond - -
Banks and financial institutions SQM Brasil Ltda. Subsidiary Bond - -
“BNP” SQM Investment Corp. N.V. Subsidiary Bond - -
Sociedad Nacional de Mineria A.G. SQM Potasio S.A. Subsidiary Bond - -
Scotiabank & Trust (Cayman) Ltd. Royal Seed Trading A.V.V. Subsidiary Bond - -
Scotiabank & Trust (Cayman) Ltd. Royal Seed Trading A.V.V. Subsidiary Bond - -
Bank of America Royal Seed Trading A.V.V. Subsidiary Bond - -
Export Development Canada Royal Seed Trading A.V.V. Subsidiary Bond - -
The Bank of Tokyo-Mitsubishi UFJ Ltd. Royal Seed Trading A.V.V. Subsidiary Bond - -
JP Morgan Chase Bank SQM Industrial S.A. Subsidiary Bond - -
The Bank of Nova Scotia SQM Investment Corp. N.V. Subsidiary Bond - -

10) FINANCIAL REPORTS
297
Note 19 Contingencies and restrictions (continued)
19.8 Indirect guarantees, continued
Creditor of the guarantee
Debtor Type of
guarantee
Pending balances as of the
closing date of the financial
statements
Name Relationship 12/31/2017
ThUS$
12/31/2016
ThUS$
Credit Suisse International SQM Investment Corp. N.V. Subsidiary Bond - -
Morgan Stanley Capital Services SQM Investment Corp. N.V. Subsidiary Bond - -
The Bank of Tokyo-Mitsubishi UFJ Ltd. SQM Investment Corp. N.V. Subsidiary Bond - -
HSBC SQM Investment Corp. N.V. Subsidiary Bond - -
Deutsche Bank AG SQM Investment Corp. N.V. Subsidiary Bond - -

10) FINANCIAL REPORTS
298
Note 20 Earnings per share
Basic earnings per share are calculated by dividing net income attributable to the Company’s shareholders by the
weighted average of the number of shares in circulation during that period.
As expressed, earnings per share are detailed as follows:
Basic earnings per share 12/31/2017
ThUS$
12/31/2016
ThUS$
Earnings (losses) attributable to owners of the parent 427,697 278,290
12/31/2017
Units
12/31/2016
Units
Number of common shares in circulation 263,196,524 263,196,524
12/31/2017
12/31/2016
Basic earnings per share (US$ per share)
1.6250 1.05732
The Company has not made any operations with a potential dilutive effect that assumes diluted earnings per share
are different from the basic earnings per share.
Note 21 Borrowing costs
The cost of interest is recognized as an expense in the year in which it is incurred, except for interest that is directly
related to the acquisition and construction of tangible property, plant and equipment assets and that complies with
the requirements of IAS 23. As of December 31, 2017, total interest expenses incurred amount to ThUS$50,124
(ThUS$57.498 as of December 31, 2016).
The Company capitalizes all interest costs directly related to the construction or to the acquisition of property, plant
and equipment, which require a substantial time to be suitable for use.

10) FINANCIAL REPORTS
299
Note 21 Borrowing costs (continued)
21.1 Costs of capitalized interest, property, plant and equipment
The cost of capitalized interest is determined by applying the average or weighted average of all financing costs
incurred by the Company to the monthly end balances of works-in-progress meeting the requirements of IAS 23.
The rates and costs for capitalized interest of property, plant and equipment are detailed as follows:
12/31/2017 12/31/2016
Capitalization rate of costs for capitalized interest, property,
plant and equipment
4% 4%
Amount of costs for interest capitalized in ThUS$
4,382 5,406
Note 22 Effect of fluctuations in foreign currency exchange rates
a) Foreign currency exchange differences recognized in profit or loss except for financial instruments
measured at fair value through profit or loss:
12/31/2017
ThUS$
12/31/2016
ThUS$
Conversion foreign exchange gains (losses) recognized in
the result of the year.
(1,299) 460
Conversion foreign exchange reserves attributable to the
owners of the controlling entity
(5,450) (5.428)
Conversion foreign exchange reserves attributable to the
non-controlling entity
4 35

10) FINANCIAL REPORTS
300
Note 22 Effect of fluctuations in foreign currency exchange rates (continued)
b) Reserves for foreign currency exchange differences:
As of December 31, 2017 and 2016, foreign currency exchange differences are detailed as follows:
Detail 12/31/2017
ThUS$
12/31/2016
ThUS$
Changes in equity generated by conversion of equity value:
Comercial Hydro S.A. 1,004 1,004 SQMC Internacional Ltda. (2) (13)
Proinsa Ltda. (7) (10) Comercial Agrorama Ltda. (44) (69)
Isapre Norte Grande Ltda. (74) (124)
Almacenes y Depósitos Ltda. 97 47 Sales de Magnesio Ltda. - (29)
Sociedad Prestadora de Servicios de Salud Cruz del Norte S.A. - (6)
Agrorama S.A. (98) (49)
Doktor Tarsa (14,447) (12,264)
SQM Vitas Fzco (1,779) (1,801)
Ajay Europe (831) (1,935) SQM Eastmed Turkey (92) (95)
Charlee SQM (Thailand) Co. Ltd. (285) (460)
Coromandel SQM India (234) (282) SQM Italia SRL (154) (287)
SQM Oceania Pty Ltd. (634) (634)
SQM Indonesia S.A. (124) (124) Abu Dhabi Fertilizers Industries WWL. (435) (434)
SQM Vitas Holland (101) (280)
SQM Thailand Limited (68) (68) SQM Europe N.V. (1,550) (1,550)
Minera Exar S.A. (5,209) -
SQM Australia Pty Ltd. 154 -
Total (24,913) (19,463)
c) Functional and presentation currency
The functional currency of these companies corresponds to the currency of the country of origin of each entity, and
its presentation currency is the U.S. dollar.
d) Reasons to use one presentation currency and a different functional currency
- The total revenues of these subsidiaries are associated with the local currency.
- The commercialization cost structure of these companies is affected by the local currency.
- The equities of these companies are expressed in local currency (Chilean peso).

10) FINANCIAL REPORTS
301
Note 23 Environment
23.1 Disclosures of disbursements related to the environment
The Company is continuously concerned with protecting the environment both in its production processes and with
respect to products manufactured. This commitment is supported by the principles indicated in the Company’s
Sustainable Development Policy. The Company is currently operating under an Environmental Management System
(EMS) that has allowed it to strengthen its environmental performance through the effective application of the
Company’s Sustainable Development Policy.
Operations that use caliche as a raw material are carried out in desert areas with climatic conditions that are favorable
for drying solids and evaporating liquids using solar energy. Operations involving the open-pit extraction of
minerals, due to their low waste-to-mineral ratio, generate remaining deposits that slightly alter the environment. A
portion of the ore extracted is crushed, a process in which particle emissions occur. Currently this operation is
conducted only at the Pedro de Valdivia worksite and no ore crushing process is conducted in the María Elena sector.
Many of the Company’s products are shipped in bulk at the Port of Tocopilla. In 2007, the city of Tocopilla was
declared a zone saturated with MP10 Particles mainly due to the emissions from the electric power plants that operate
in that city. In October 2010, the Decontamination Plan for Tocopilla was put in place. Accordingly, the Company
has committed to taking several measures to mitigate the effects derived from bulk product movements in the port.
These measures have been successfully implemented since 2007.
The Company carries out environmental follow-up and monitoring plans based on specialized scientific studies.
Within this context, the Company entered into a contract with the National Forestry Corporation (CONAF) aimed
at researching the activities of flamingo groups that live in the Salar de Atacama (Atacama Saltpeter Deposit)
lagoons. Such research includes a population count of the birds, as well as breeding research. Environmental
monitoring activities carried out by the Company at the Salar de Atacama and other systems in which it operates are
supported by a number of studies that have integrated diverse scientific efforts from prestigious research centers,
including Dictuc from the Pontificia Universidad Católica in Santiago and the School of Agricultural Science of the
Universidad de Chile.

10) FINANCIAL REPORTS
302
Note 23 Environment (continued)
23.1 Disclosures of disbursements related to the environment, continued
Furthermore, within the framework of the environmental studies which the Company is conducting, the Company
performs significant activities in relation to the recording of Pre-Columbian and historical cultural heritage, as well
as the protection of heritage sites, in accordance with current Chilean laws. These activities have been especially
performed in the areas surrounding Maria Elena and the Nueva Victoria plants. This effort is being accompanied by
cultural initiatives within the community and the organization of exhibits in local and regional museums.
As emphasized in its Sustainable Development Policy, the Company strives to maintain positive relationships with
the communities surrounding the locations in which it carries out its operations, as well as to participate in
communities’ development by supporting joint projects and activities which help to improve the quality of life for
residents. For this purpose, the Company has focused its efforts on activities involving the rescue of historical
heritage, education and culture, as well as development.
In order to do so, it acts both individually and in conjunction with private and public entities.
23.2 Detail of information on disbursements related to the environment
The cumulative disbursements which the Company had incurred as of December 31, 2017 for the concept of
investments in production processes, verification and control of compliance with ordinances and laws relative to
industrial processes and facilities, including prior year disbursements related to these projects amounted to
ThUS$14,787 and are detailed as follows:

10) FINANCIAL REPORTS
303
Note 23 Environment (continued)
23.2 Detail of information on disbursements related to the environment, continued
Accumulated expenses as of 12/31/2017
Identification of the
Parent or
subsidiary
Name of the project with which expenditure is associated Concept for which the expenditure was made
or will be made Asset / Expense
Description of the
asset or expense Item
Amount of
expenditure ThUS$
Actual or estimated
date on which
expenditure was or
will be made
Miscellaneous Environment - Operating Area Not classified Expense Not classified 9.552 12/31/2017
SQM Industrial S.A. 04-IQWZ00 - Normalization TK NV liquid fuels Environmental processing Assets Not classified 37 4/1/2014
SQM Industrial S.A. 04-PPZU00 - Standardize and Certify Plant Fuel Tanks Environmental processing Assets Not classified 48 7/1/2018
SQM Industrial S.A. 04-J007000 - Environmental Impact Statement Environmental processing Expense Not classified 151 12/31/2017
SQM Industrial S.A. 04-P003600 - Opening of NPT IV Project (NK engineering studies) Sustainability: Environment and Risk Prevention Assets Not classified 181 12/31/2017
SQM Industrial S.A. 04-I012400 - Acquisition of Power Generator to Back up the Injection
System at Puquios in Salar de Llamara Sustainability: Environment and Risk Prevention Assets Not classified 34 12/31/2016
SQM Industrial S.A. 04-J004300 - Energy efficiency study Sustainability: Environment and Risk Prevention Expense Not classified 56 12/31/2017
SQM Industrial S.A. 04-J010200 - NK CS (KNO3-NaNO3 salt production at NPT2 plant) Sustainability: Environment and Risk Prevention Assets Not classified 1 4/30/2019
SQM Industrial S.A. 04-I015600 - Recovery of Reject Water from Osmosis Plant, NV Iodine
Plant
Sustainability: Environment and Risk Prevention Assets Not classified 12 12/31/2018
SQM S.A. 01-I005500 - Standardization of SO2 plants Environmental processing Assets Not classified 81 12/31/2018
SQM S.A. 01-I007100 - Environmental Follow-up Plan for Pampa del Tamarugal
for 2015-2016 Environmental processing Expense Not classified 2 1/31/2018
SQM S.A. 01-I007200 - Environmental Follow-up Plan for Salar de Llamara for
2015-2016 Sustainability: Environment and Risk Prevention Expense Not classified 2 1/31/2018
SQM S.A. 01-I013800 - Increase height of Absorber Tower Sustainability: Environment and Risk Prevention Assets Not classified 62 12/31/2018
SQM S.A. 01-I007300 - Compliance with Iodine Gas Exposure Standard Environmental processing Assets Not classified 961 12/31/2017
SQM S.A. 01-I012200 - Repair or replacement of well Sustainability: Environment and Risk Prevention Assets Not classified 41 12/31/2018
SQM Salar S.A. 19-L008100 - EIS Salar 2015 Environmental processing Expense Not classified 488 12/31/2017
SQM Salar S.A. 19-L012200 - Installation of flow meters per environmental standard Sustainability: Environment and Risk Prevention Assets Not classified 240 6/1/2018
SQM Salar S.A. 19-C002300 - Extension of LIOH 7,000 TPA Plant Sustainability: Environment and Risk Prevention Assets Not classified 230 12/31/2018
SQM Salar S.A. 19-L012100 – Renovation of equipment which must be certified in order
to gain environmental approval (RCA) Sustainability: Environment and Risk Prevention Assets Not classified 13 6/1/2018
SIT S.A. 03-T003400 - 2016 Port maintenance Capex Sustainability: Environment and Risk Prevention Assets Not classified 42 3/31/2018
SIT S.A. 03-T001900 - Storage Warehouse Cover Sustainability: Environment and Risk Prevention Assets Not classified 37 3/31/2018
SIT S.A. 03-T001800 - Mechanization of Shipment from Ca Sustainability: Environment and Risk Prevention Assets Not classified 982 5/31/2018
SIT S.A. 03-T003200 - Mechanization of Shipment from Ca Sustainability: Environment and Risk Prevention Assets Not classified 1,296 5/31/2018
SIT S.A. 03-T004200 - Encapsulado y captadores cancha 8 y 9 Sustainability: Environment and Risk Prevention Assets Not classified 58 8/30/2018
SIT S.A. 03-T004500 - Extensión y Overhaul Correa 5 Environmental processing Assets Not classified 180 8/30/2018
Total 14,787

10) FINANCIAL REPORTS
304
Note 23 Environment (continued)
23.2 Detail of information on disbursements related to the environment, continued
Future expenses as of 12/31/2017
Identification of the
Parent or subsidiary Name of the project with which expenditure is associated
Concept for which the expenditure was made or will
be made Asset / Expense
Description of the
asset or expense
Item
Amount of
expenditure ThUS$
Actual or estimated
date on which
expenditure was or
will be made
Various Environment - Operating Area Not classified Expense Not classified 10,450 12/31/2018
SQM Industrial S.A. 04-J010200 - NK CS (KNO3-NaNO3 salt production at NPT2 plant) Sustainability: Environment and Risk Prevention Assets Not classified 140 4/30/2019
SQM Industrial S.A. 04-I015600 - Recovery of Reject Water from Osmosis Plant, NV Iodine
Plant Sustainability: Environment and Risk Prevention Assets Not classified 130 12/31/2018
SQM S.A. 01-I005500 - Standardization of SO2 plants Environmental processing Assets Not classified 37 12/31/2018
SQM S.A. 01-I012200 - Repair or replacement of well Sustainability: Environment and Risk Prevention Assets Not classified 76 12/31/2018
SQM S.A. 01-I013800 - Increase height of Absorber Tower Sustainability: Environment and Risk Prevention Assets Not classified 111 12/31/2018
SQM S.A. 01-I017200 - CEDAM at Puquíos (ponds) at Llamara Sustainability: Environment and Risk Prevention Assets Not classified 260 12/31/2018
SQM S.A. 01-I017400 - Development of Pintados and surrounding area Sustainability: Environment and Risk Prevention Assets Not classified 124 12/31/2018
SIT S.A. 03-T001900 - Storage Warehouse Cover Sustainability: Environment and Risk Prevention Assets Not classified 10 3/31/2018
SIT S.A. 03-T001800 - Mechanization of Shipment from Ca Sustainability: Environment and Risk Prevention Assets Not classified 103 5/31/2018
SIT S.A. 03-T003200 - Mechanization of Shipment from Ca Sustainability: Environment and Risk Prevention Assets Not classified 254 5/31/2018
SIT S.A. 03-T004200 - Encapsulation and Collectors Yards 8 and 9 Sustainability: Environment and Risk Prevention Assets Not classified 854 8/30/2018
SIT S.A. 03-T004500 - Belt 5 Extension and Overhaul Environmental processing Assets Not classified 336 8/30/2018
SIT S.A. 03-T005000 - Ground leveling and paving of warehouse Sustainability: Environment and Risk Prevention Assets Not classified 210 9/30/2018
SQM Salar S.A. 19-L012100 – Renovation of equipment which must be certified in order
to gain environmental approval (RCA) Sustainability: Environment and Risk Prevention Assets Not classified 52 6/1/2018
SQM Salar S.A. 19-L012200 - Installation of flow meters per environmental standard Sustainability: Environment and Risk Prevention Assets Not classified 10 6/1/2018
SQM Salar S.A. 19-C002300 - Extension of LIOH 7,000 TPA Plant Sustainability: Environment and Risk Prevention Assets Not classified 28 12/31/2018
SQM Nitratos S.A 12-I012700 - Mine Site Workshop Water Recovery Plant Sustainability: Environment and Risk Prevention Assets Not classified 160 12/31/2018
Total 13,345

10) FINANCIAL REPORTS
305
Note 23 Environment (continued)
23.2 Detail of information on disbursements related to the environment, continued
Accumulated expenses as of 12/31/2016
Identification of the
Parent or subsidiary
Name of the project with which expenditure is
associated Concept for which the expenditure was made Asset / Expense
Description of the asset
or expense Item
Amount of
expenditure ThUS$
Actual or estimated
date on which
expenditure was or
will be made
Miscellaneous Environmental - Operating Area Not classified Expense Not classified 2,331 12/31/2016
SQM S.A. 01-I003200 – Standardization of hazardous materials Sustainability: Environment and Risk Prevention Assets Not classified 79 12/31/2016
SQM S.A. 01-I005500 – Standardization of SO2 plants Sustainability Assets Not classified 188 12/31/2016
SQM S.A. 01-I007300 – Compliance with Iodine Gas Exposure
Standard Sustainability: Environment and Risk Prevention Assets Not classified 721 12/31/2016
SQM S.A. 01-I006700 – Enablement of CPC wells Sustainability: Environment and Risk Prevention Expense Not classified - 12/31/2016
SQM S.A. 01-I007100 – 2015-2016 Environmental Follow-up Plan
for Pampa del Tamarugal Sustainability Expense Not classified 290 03/31/2017
SQM S.A. 01-I007200– 2015-2016 Salar de Llamara Environmental
Follow-up Plan Sustainability: Environment and Risk Prevention Assets Not classified 54 12/31/2016
SQM S.A. 01-P003500 – Tur Development Master Plan Sustainability: Environment and Risk Prevention Expense Not classified 20 12/31/2016
SQM S.A. 01-P003000 – Plant 1 Scrubber and Plant 3 Scrubber Sustainability: Environment and Risk Prevention Assets Not classified 355 12/31/2016
SQM Industrial S.A. 04-I007600– NV evaporation ponds Sustainability: Environment and Risk Prevention Expense Not classified 78 12/31/2016
SQM Industrial S.A. 04-J004100 – Coya Sur Field Disposal DIA Sustainability: Environment and Risk Prevention Expense Not classified 31 12/31/2016
SQM Industrial S.A. 04-J004300 - Energy efficiency study Sustainability: Environment and Risk Prevention Expense Not classified 31 12/31/2016
SQM Industrial S.A. 04-J007000 – Environmental Impact Statement Sustainability: Environment and Risk Prevention Expense Not classified 40 04/30/2017
SQM Industrial S.A. 04-J003300 – Improvements to water distribution Sustainability: Environment and Risk Prevention Expense Not classified 376 12/31/2016
SQM Industrial S.A. 04-P003600 - NK PV Project Sustainability: Environment and Risk Prevention Expense Not classified 214 12/31/2017
SIT S.A. 03-T003000 – Archeological salvage for northern access,
Port of Tocopilla Sustainability Expense Not classified 51 12/31/2016
SQM Salar S.A. 19-L008100 - EIS Salar 2015 Sustainability: Environment and Risk Prevention Expense Not classified 35 12/31/2016
SQM Salar S.A. 19-C001500 - 2016 Waste ponds Sustainability: Environment and Risk Prevention Expense Not classified 92 12/31/2017
Total 4,986

10) FINANCIAL REPORTS
306
Note 23 Environment (continued)
23.2 Detail of information on disbursements related to the environment, continued
Future expenses as of 12/31/2016
Identification of the
Parent or subsidiary Name of the project with which expenditure is associated Concept for which the expenditure was made Asset / Expense
Description of the
asset or expense
Item
Amount of
expenditure MUS$
Actual or estimated
date on which
expenditure was or
will be made
SQM S.A. 01-I003200 – Standardization of hazardous materials Sustainability: Environment and Risk Prevention Assets Not classified 25 12/31/2017
SQM S.A. 01-I005500 – Standardization of SO2 plants Sustainability Assets Not classified 15 12/31/2017
SQM S.A. 01-I006700 – Enablement of CPC wells Sustainability: Environment and Risk Prevention Expense Not classified 133 12/31/2017
SQM S.A. 01-I007100 – 2015-2016 Environmental Follow-up Plan for
Pampa del Tamarugal Sustainability Expense Not classified 2 03/31/2017
SQM S.A. 01-I007200– 2015-2016 Salar de Llamara Environmental
Follow-up Plan Sustainability: Environment and Risk Prevention Assets Not classified 1 12/31/2017
SQM S.A. 01-P003000 – Plant 1 Scrubber and Plant 3 Scrubber Sustainability: Environment and Risk Prevention Assets Not classified 3 12/31/2017
SQM S.A. 01-P003500 – Tur Development Master Plan Sustainability: Environment and Risk Prevention Expense Not classified 18 12/31/2017
SQM S.A. 01-I007300 – Compliance with Iodine Gas Exposure Standard Sustainability: Environment and Risk Prevention Assets Not classified 90 12/31/2017
SQM Industrial S.A. 04-I007600– NV evaporation ponds Sustainability: Environment and Risk Prevention Expense Not classified - 12/31/2017
SQM Industrial S.A. 04-J003300 – Improvements to water distribution Sustainability: Environment and Risk Prevention Expense Not classified 55 12/31/2017
SQM Industrial S.A. 04-J004300 - Energy efficiency study Sustainability: Environment and Risk Prevention Expense Not classified 54 12/31/2017
SQM Industrial S.A. 04-J007000 – Environmental Impact Statement Sustainability: Environment and Risk Prevention Expense Not classified 229 04/30/2017
SQM Industrial S.A. 04-I012400 - Acquisition of Power Generator to Back up the
Injection System at Puquios in Salar of Salar de Llamara Sustainability: Environment and Risk Prevention Assets Not classified 33 12/31/2017
SQM Industrial S.A. 04-P003600 - NK PV Project Sustainability: Environment and Risk Prevention Expense Not classified 86 01/02/2018
SQM Salar S.A. 19-L012100 – Regularization of weather station Sustainability: Environment and Risk Prevention Expense Not classified 65 12/31/2017
SQM Salar S.A. 19-C001500 - 2016 Waste ponds Sustainability: Environment and Risk Prevention Expense Not classified 27 01/01/2018
SIT S.A. 03-T003000 – Archeological salvage for northern access, Port
of Tocopilla Sustainability Expense Not classified 6 12/31/2017
Total 842

10) FINANCIAL REPORTS
307
Note 23 Environment (continued)
23.3 Description of each project, indicating whether these are in process or have been finished
SQM Industrial S.A.
IQWZ: The plant fuel tanks are being brought up to standard. This implies repairing, amending, replacing or
eliminating tanks according to their current condition. This project is in progress.
PPZU: The plant fuel tanks are being brought up to standard. This implies repairing, amending, replacing or
eliminating tanks according to their current condition. This project is in progress.
I0124: The project consists of the acquisition of a power generator to ensure that when there is a power outage,
water will continue to be injected, by operating an extraction pond to directly feed the injection pipe.
I0156: The reject water from the osmosis plant is currently discarded into the plant’s AFA pond, diluting the AFA
brine and increasing the area needed for evaporation in the Sur Viejo ponds.
J0043: To form a strategic partnership with a company linked to new technologies and energy efficiency. Search
for new and alternative technologies. Carry out engineering studies for alternatives.
J0070: This project relates to the preparation and processing of an Environmental Impact Statement (EIS), with the
purpose of obtaining the environmental authorization (RCA) for the yards. The information to be presented includes
the air quality baseline, so a PM 2.5 and gas monitoring station has been installed to complement the existing stations
at ME. This project is in progress.
J0102: It is proposed to build a new PTS plant that is integrated into the NPT 2 crystallization process. The
engineering design of this plant considers the reuse of the equipment already acquired for the NK PV plant. The
plant includes a new raw materials yard, a grinder stage (sizer), a wet mill, a dissolution stage with reactors and
thickener and a filtration and centrifuge unit for discarded salt. The crystallization from the NPT1 and NPT2 plants
will be reused, as well as the refining plant at the NPT2 plant.
P0036: The objective of this project is for the Company to build on the basic engineering that was completed in
December 2015 and develop the detailed engineering to allow the acquisition of equipment that is critical (long-
term or key for the project). This project is in progress.

10) FINANCIAL REPORTS
308
Note 23 Environment (continued)
23.3 Description of each project, indicating whether these are in process or have been finished, continued
SQM S.A.
I0055: In the SO2, plant, the gas/liquid ratio is deficient, impeding the absorption of SO2; producing losses of free
iodine through inadequate stripping of the kerosene and the prilling air. This is also causing the ducts and furnaces
to be blocked (unprogramed shutdowns), a very polluted environment for people (deviation in health and hygiene),
excessive acid rain (corrosion of the facilities) and a high factor of sulfur and sodium metabisulfite consumption.
By changing the gas extractors to increase air flows and the SO2 absorption towers for prilling, the diameter of the
ducts will be increased. This will ensure that the gas/liquid ratio is increased and sustained. In order to decrease SO2,
emissions, a scrubber unit (tower, pump, gas extractor and piping) needs to be installed following the same concept
as was developed at the ME Iodine SO2 plant.
I0071: This project consists of implementing mitigation and compensation measures in line with the commitments
in the Environmental Assessment of the Pampa Hermosa Environmental Impact Assessment (EIA). The measures
to be implemented are those included in the Salar de Llamara Environmental Management Plan for the native trees
known as tamarugos (Environmental Education Program, planting tamarugos, ex situ conservation of tamarugos,
tamarugo production, and support for the phytosanitary control of tamarugos). This project is in progress.
I0072: This project consists of implementing mitigation and compensation measures in line with the commitments
in the Environmental Assessment of the Pampa Hermosa Environmental Impact Assessment (EIA). The measures
to be implemented are those included in the Salar de Llamara Environmental Management Plan for the native trees
known as tamarugos (Environmental Education Program, planting tamarugos, ex situ conservation of tamarugos,
tamarugo production, and support for the phytosanitary control of tamarugos).
I0073: Change to the system for capturing iodine gas for operations, in line with Article 61 of Supreme Decree No.
594/1999, approving Basic Sanitary and Environmental Conditions in Workplaces. This project is in progress.
I0122: The project consists of repairing and/or replacing the environmental follow-up wells that need to be
deepened. It also includes implementing improvements in mine shaft type wells to avoid risk conditions. The priority
wells are Nos. 8 and 10-S-1 in Pampa del Tamarugal and PO-5 in Salar de Llamara. This project is in progress.
I0138: This project is to increase the height of each SO2 absorber tower (regular and stand-by towers) by 2.5 meters.
The towers’ additional height will allow the height of the packing to be increased by 2.5, thereby improving the
efficiency of the SO2 absorption. The main activities are: Basic and detailed engineering; supply of the bodies of
the absorber towers (frp), liquid distributors, tower brine pump pad, tri-pack packing type, polyethylene pipes and
fitting; gas measurement service; metallic structure manufacturing and installation services; and project start-up.

10) FINANCIAL REPORTS
309
Note 23 Environment (continued)
23.3 Description of each project, indicating whether these are in process or have been finished, continued
I0174: One of the commitments of the Pampa Hermosa project involves developing the former Pintados station.
The development proposal was presented to the authorities and once approved, it needs to be implemented (parking,
footpath, shader and information panels). One of the commitments for the Nueva Victoria and Pampa Hermosa
mining area projects is to prepare a storage place in Humberstone for storing the archaeological materials that are
recovered. This is part of the archaeological compensation measures involved in these projects. A proposal needs to
be developed and subsequently developed for the Humberstone deposit, which is subject to approval by the
authorities so its duration and costs are subject to the approval of third parties.
SIT S.A.
T0018: The project consists of the installation of an underground conveyor belt running outside of the storage boxes
in yards Nos. 8 and 9, connected to belt 5 and subsequently to the shipment system. While this is an operating
improvement, the project has an environmental component in the form of an emissions mitigation measure, because
it involves the implementation and acquisition of belt covers (to control internal emissions), in order to improve
compliance with the Tocopilla EDP. This project is in progress.
T0019: This project consists of the installation of covers (ceiling and side cover) in the 4 new storage boxes, which
will be built in the zone of current yards Nos. 8 and 9. While this is an operating improvement, the project has an
environmental component as the project involves
the building of a warehouse as an emissions control measure to improve compliance with the Tocopilla EDP and
reduce dust emissions. This project has been completed.
T0032: The project consists of the installation of an underground conveyor belt running outside of the storage boxes
in Yard No. 6, with feeding points of access directly connected to belt 6 and subsequently to the shipment system.
While this is an operating improvement, the project has an environmental component as it includes the
implementation of conveyor belt No. 6 from Yard No. 6, which is an action to control emissions as per the
commitments within the Tocopilla EDP. This project is at the start-up stage.
T0034: The project seeks to make all the investments associated with maintaining the port’s operating capacity,
guaranteeing high equipment availability for shipment purposes. While this is an operating improvement, the project
also has an environmental component. The project consists of the replenishment and/or replacement of the impaired
wind barrier membranes in Yard No. 3, which is an action to control emissions, as committed to in the Tocopilla
EDP. This project has been completed.
T0042: In order to comply with Article 13 of Supreme Decree No. 70/2010 Tocopilla EDP must incorporate dust
collectors on the TV-1 and TV-2 hoppers in yard Nos.8 and 9.

10) FINANCIAL REPORTS
310
Note 23 Environment (continued)
23.3 Description of each project, indicating whether these are in process or have been finished, continued
T0045: The conveyor belts in yard numbers 8 and 9 will be completed by being connected to conveyor belt no. 5
and thus forming part of the shipment system. This involves the extension, connection and overhaul of conveyor
belt no. 5, together with the connection to pan feeder 3 and the corresponding improvements to become an integral
part of the shipment system. This will be done in compliance with the environmental regulations established in the
Tocopilla Decontamination Plan. Atmospheric Decontamination Plan for the City of Tocopilla and surrounding area
Supreme Decree No. 70/2010, Art.13 II.3.
T0050: The loose earth soil around the storage warehouse in yard 17 is uneven which creates operational difficulties
and poses a risk both for the warehouse and operationally. The area of land to be paved measures 2100 m2. A
hazardous waste patio is also to be built.
SQM Nitratos S.A.
I0127: By installing a reverse osmosis system or a process that enables the recovery of industrial water and that
reduces the hardness of the water for cleaning the equipment, we can reuse this water to wash equipment again,
thereby reducing the damage to the electrical systems of the equipment as a result of corrosion.
SQM Salar.
C0023: A new plant extension is to be built with the capacity for 7,000 TPA of product. This project is in progress.
L0081: The authorities require several different environmental impact studies to be carried out, for the exploration
or the construction of new wells and also to support current production. This project is in progress.
L0121: The weather station in the KCL sector does not have the certification to comply with the environmental
standard RCA 226/2006. Buy and change the weather station equipment.
L0122: The project considers the change in flow meters to the new standard in addition to adding standby flow
meters. This project is in progress.

10) FINANCIAL REPORTS
311
Note 24 Other current and non-current non-financial assets
As of December 31, 2017, and December 31, 2016, the detail of other current and non-current assets is as follows:
Other non-financial assets, current 12/31/2017 12/31/2016
ThUS$ ThUS$
Domestic Value Added Tax 7,488 13,999
Foreign Value Added Tax 5,122 2,537
Prepaid mining licenses 1,205 1,136
Prepaid insurance 2,446 6,323
Other prepayments 1,443 408
Refund of Value Added Tax to exporters 4,937 855
Other taxes 4,027 4,660
Other assets 215 355
Total 26,883 30,273
Other non-financial assets, non-current 12/31/2017 12/31/2016
ThUS$ ThUS$
Stain development expenses and prospecting expenses (1) 17,721 23,008
Guarantee deposits 771 685
Other assets 770 997
Total 19,262 24,690
1) Reconciliation of changes in assets for exploration and mineral resource evaluation, by type
Movements in assets for the exploration and evaluation of mineral resources as of December 31, 2017, and December
31, 2016:
Total 17,721 23,008
As of the presentation date, no reevaluations of assets for exploration and assessment of mineral resources have been
conducted.
Reconciliation 12/31/2017 12/31/2016
ThUS$ ThUS$
Opening balance 23,008 31,911
Changes
Additions, other than business combinations - -
Depreciation and amortization (5,440) (9,498)
Increase (decrease) due to transfers and other charges 153 595
Total changes (5,287) (8,903)

10) FINANCIAL REPORTS
312
Note 25 Reportable segments
25.1 Reportable segments
General information:
The amount of each item presented in each operating segment is equal to that reported to the maximum authority
that makes decisions regarding the operation, in order to decide on the allocation of resources to the defined segments
and to assess its performance.
These operating segments mentioned are consistent with the way the Company is managed and how results will be
reported by the Company. These segments reflect separate operating results that are regularly reviewed by the person
responsible for operational decisions in order to make decisions about the resources to be allocated to the segment
and assess its performance (See Note 25.2).
The performance of each segment is measured based on net income and revenues. Sales between segments are
conducted using terms and conditions at current market rates.
Factors used to identify segments on which a report should be presented:
The segments covered in the report are strategic business units that offer different products and services. These are
managed separately because each business requires different technology and marketing strategies.
Description of the types of products and services from which each reportable segment obtains its income from
ordinary activities
The operating segments, which obtain income from ordinary activities, generate expenses and whose operating
results are reviewed on a regular basis by the maximum authority who makes decisions regarding operations, relate
to the following groups of products:
1. Specialty plant nutrients
2. Iodine and its derivatives
3. Lithium and its derivatives
4. Industrial chemicals
5. Potassium
6. Other products and services
Description of income sources for all the other segments
Information regarding assets, liabilities, profits and expenses that cannot be assigned to the segments indicated
above, due to the nature of production processes, is included under the "Unassigned amounts” category of the
disclosed information.
Basis of accounting for transactions between reportable segments
Sales between segments are made under the same conditions as those made to third parties, and how they are
presented in the income statement is constantly monitored.

10) FINANCIAL REPORTS
313
Note 25 Reportable segments (continued)
25.1 Reportable segments, continued
Description of the nature of the differences between measurements of results of reportable segments and the
result of the entity before the expense or income tax expense of incomes and discontinued operations.
The information reported in the segments is extracted from the Company’s consolidated financial statements and
therefore there is no need to prepare reconciliations between the data mentioned above and those reported in the
respective segments, according to what is stated in paragraph 28 of IFRS 8, "Operating Segments".
For the process of cost allocation in inventory valuation, we identify the direct costs (can be assigned directly to a
product) and the common costs (belong to processes of co-production, for example costs of common leaching for
the production of iodine and nitrates). The direct costs are directly associated with the product and the common costs
are allocated using percentages of sales, prices and inventory rotation.
The allocation of other common costs that are not included in the inventory valuation process, but go straight to the
cost of sales, use similar criteria: the costs associated with a product or sales in particular are assigned to that
particular product or sales, and the common costs associated with different products or business lines are allocated
according to the sales.
Description of the nature of the differences between measurements of assets of reportable segments and the
Company´s assets
Assets are not shown classified by segments, as this information is not readily available. Some of these assets are
not separable by the type of activity by which they are affected since this information is not used by management in
decision-making with respect to resources to be allocated to each defined segment. All assets are disclosed in the
"unallocated amounts" category.
Description of the nature of the differences between measurements of liabilities of reportable segments and
the Company’s liabilities
Liabilities are not shown classified by segments, as this information is not readily available. Some of these liabilities
are not separable by the type of activity by which they are affected, since this information is not used by management
in decision-making regarding resources to be allocated to each defined segment. All liabilities are disclosed in the
"unallocated amounts" category.

10) FINANCIAL REPORTS
314
Note 25 Reportable segments (continued)
25.2 Reportable segment disclosures:
12/31/2017
Operating segment items
Specialty
plant
nutrients
Iodine and its
derivatives
Lithium and its
derivatives
Industrial
chemicals Potassium
Other
products and
services
Reportable
segments
Operating
segments
Elimination of
inter-segments
amounts
Unallocated
amounts
Total
12/31/2017
ThUS$ ThUS$ ThUS$ ThUS$ ThUS$ ThUS$ ThUS$ ThUS$ ThUS$ ThUS$ ThUS$
Revenue 697,251 252,123 644,573 135,578 379,326 48,472 2,157,323 2,157,323 - - 2,157,323
Revenues from transactions with other operating segments
of the same entity 392,693 287,469 551,382 157,158 269,298 201,250 1,859,250 1,859,250 (1,859,250) - 2,157,323
Revenues from external customers and transactions
with other operating segments of the same entity 1,089,944 539,592 1,195,955 292,736 648,624 249,722 4,016,573 4,016,573 (1,859,250) - -
Costs of sales (555,356) (199,808) (189,242) (91,753) (313,690) (44,973) (1,394,822) (1,394,822) - - (1,394,822)
Administrative expenses - - - - - - - - 5,686 (106,857) (101,171)
Interest expense - - - - - - - - 83,689 (133,813) (50,124)
Depreciation and amortization expense (91,201) (35,711) (34,138) (14,867) (54,779) (7,730) (238,426) (238,426) - (89) (238,515)
The entity’s interest in the profit or loss of associates and
joint ventures accounted for by the equity method - - - - - - - - 27 14,425 14,452
Income tax expense, continuing operations - - - - - - - - (1,072) (165,101) (166,173)
Other items other than significant cash 141,895 52,315 455,331 43,825 65,636 3,499 762,501 762,501 (802,288) 634,377 594,590
Income (loss) before taxes
141,895 52,315 455,331 43,825 65,636 3,499 762,501 762,501 (803,360) 469,276 428,417 Net income (loss) from continuing operations
Net income (loss) from discontinued operations 141,895 52,315 455,331 43,825 65,636 3,499 762,501 762,501 (803,360) 469,276 428,417
Net income (loss)
- - - - - - - - (5,880,934) 10,177,170 4,296,236 Assets - - - - - - - - (3,376,995) 3,503,420 126,425
Equity-accounted investees - - - - - - - - - 117,159 117,159
Increase of non-current assets - - - - - - - - - -
Liabilities - - - - - - - - (2,286,817) 4,335,585 2,048,768
Impairment loss recognized in profit or loss (15,025) 335 1,112 (3,546) (240) (219) (17,583) (17,583) - (14,316) (31,889)
Reversal of impairment losses recognized in profit or loss
for the period - - - - -
-
- - - - -
Cash flows from (used in) operating activities - - - - - - - - - 703,997 703,997
Cash flows from (used in) investing activities - - - - - - - - - (248,067) (248,067)
Cash flows from (used in) financing activities - - - - - - - - - (357,645) (357,645)

10) FINANCIAL REPORTS
315
Note 25 Reportable segments (continued)
25.2 Reportable segment disclosures, continued
12/31/2016
Operating segment items
Specialty
plant
nutrients
Iodine and its
derivatives
Lithium and its
derivatives
Industrial
chemicals Potassium
Other
products and
services
Reportable
segments
Operating
segments
Unallocated
amounts
Elimination of
inter-segments
amounts
Total
12/31/2016
ThUS$ ThUS$ ThUS$ ThUS$ ThUS$ ThUS$ ThUS$ ThUS$ ThUS$ ThUS$ ThUS$
Revenue 623,853 231,144 514,627 104,137 403,323 62,238 1,939,322 1,939,322 - - 1,939,322
Revenues from transactions with other operating segments
of the same entity 91,087 301,917 372,838 356,334 333,823 198,836 1,654,835 1,654,835 - (1,654,835) -
Revenues from external customers and transactions with
other operating segments of the same entity 714,940 533,061 887,465 460,471 737,146 261,074 3,594,157 3,594,157 - (1,654,835) 1,939,322
Costs of sales (478,074) (191,298) (175,616) (67,378) (359,477) (56,442) (1,328,285) (1,328,285) - - (1,328,285)
Administrative expenses - - - - - - - - (94,647) 6,211 (88,436)
Interest expense - - - - - - - - (149,051) 91,553 (57,498)
Depreciation and amortization expense (89,864) (35,958) (33,010) (12,666) (67,571) (10,612) (249,681) (249,681) 8 - (249,673)
The entity’s interest in the profit or loss of associates and
joint ventures accounted for by the equity method - - - - - - - - 13,047 - 13,047
Income tax expense, continuing operations - - - - - - - - (132,965) - (132,965)
Other items other than significant cash - - - - - - - - - - -
Income (loss) before taxes 145,779 39,846 339,011 36,759 43,846 5,796 611,037 611,037 317,894 (514,042) 414,889
Net income (loss) from continuing operations 145,779 39,846 339,011 36,759 43,846 5,796 611,037 611,037 184,929 (514,042) 281,924
Net income (loss) from discontinued operations
Net income (loss) 145,779 39,846 339,011 36,759 43,846 5,796 611,037 611,037 184,929 (514,042) 281,924
Assets - - - - - - - - 10,605,056 (6,387,076) 4,217,980
Equity-accounted investees - - - - - - - - 2,783,001 (2,669,861) 133,140
Increase of non-current assets - - - - - - - - (107,268) (107,268)
Liabilities - - - - - - - - 5,321,161 (3,410,453) 1,910,708
Impairment loss recognized in profit or loss - - (251) - - (698) (949) (949) (39,595) - (40,544)
Reversal of impairment losses recognized in profit or loss
for the period 133 325 233 2,216 - 2,907 2907 - - 2,907
Cash flows from (used in) operating activities - - - - - - - - 633,662 - 633.662
Cash flows from (used in) investing activities - - - - - - - - 162,386 - 162,386
Cash flows from (used in) financing activities - - - - - - - - (816,410) - (816,410)

10) FINANCIAL REPORTS
316
Note 25 Reportable segments (continued)
25.3 Statement of comprehensive income classified by reportable segments based on groups of products
12/31/2017
Items in the statement of comprehensive income
Specialty plant
nutrients
ThUS$
Iodine and its
derivatives
ThUS$
Lithium and its
derivatives
ThUS$
Industrial
chemicals
ThUS$
Potassium
ThUS$
Other products
and services
ThUS$
Corporate Unit
ThUS$
Total segments and
Corporate unit
ThUS$
Revenue 697,251 252,123 644,573 135,578 379,326 48,472 - 2,157,323
Cost of sales (555,356) (199,808) (189,242) (91,753) (313,690) (44,973) - (1,394,822)
Gross profit 141,895 52,315 455,331 43,825 65,636 3,499
- 762,501
Other incomes by function - - - - - - 17,827 17,827
Administrative expenses - - - - - - (101,171) (101,171)
Other expenses by function - - - - - - (61,638) (61,638)
Other gains (losses) - - - - - - 543 543
Financial income - - - - - - 13,499 13,499
Financial costs - - - - - - (50,124) (50,124)
interest in the profit or loss of associates and joint
ventures accounted for by the equity method - - - - - - 14,452 14,452
Exchange differences - - - - - - (1,299) (1,299)
Profit (loss) before taxes 141,895 52,315 455,331 43,825 65,636 3,499 (167,911) 594,590
Income tax expense - - - - - - (166,173) (166,173)
Profit (loss) from continuing operations 141,895 52,315 455,331 43,825 65,636 3,499 (334,084) 429,257
Profit (loss) from discontinued operations - - - - - - - -
Profit (loss) 141,895 52,315 455,331 43,825 65,636 3,499 (334,084) 428,417
Profit (loss), attributable to
Profit (loss) attributable to the controller´s owners - - - - - - - 427,697
Profit (loss) attributable to the non-controllers - - - - - - - 720
Profit (loss) - - - - - - - 428,417

10) FINANCIAL REPORTS
317
Note 25 Reportable segments (continued)
25.3 Statement of comprehensive income classified by reportable segments based on groups of products, continued
12/31/2016
Items in the statement of comprehensive income
Specialty plant
nutrients
ThUS$
Iodine and its
derivatives
ThUS$
Lithium and its
derivatives
ThUS$
Industrial chemicals
ThUS$
Potassium
ThUS$
Other products and
services
ThUS$
Corporate Unit
ThUS$
Total segments and
Corporate unit
ThUS$
Revenue 623,853 231,144 514,627 104,137 403,323 62,238
- 1,939,322
Cost of sales (478,074) (191,298) (175,616) (67,378) (359,477) (56,442) (1,328,285)
Gross profit 145,779 39,846 339,011 36,759 43,846 5,796 - 611,037
Other incomes by function - - - - - - 15,202 15,202
Administrative expenses - - - - - - (88,436) (88,436)
Other expenses by function - - - - - - (89,731) (89,731)
Other gains (losses) - - - - - - 679 679
Financial income - - - - - - 10,129 10,129
Financial costs - - - - - - (57,498) (57,498)
interest in the profit or loss of associates and joint ventures
accounted for by the equity method - - - - - - 13,047 13,047
Exchange differences - - - - - - 460 460
Profit (loss) before taxes 145,779 39,846 339,011 36,759 43,846 5,796 (196,148) 414,889
Income tax expense - - - - - - (132,965) (132,965)
Profit (loss) from continuing operations 145,779 39,846 339,011 36,759 43,846 5,796 (329,113) 281,924
Profit (loss) from discontinued operations - - - - - - - -
Profit (loss) 145,779 39,846 339,011 36,759 43,846 5,796 (329,113) 281,924
Profit (loss), attributable to
Profit (loss) attributable to the controller´s owners - - - - - - - 278,290
Profit (loss) attributable to the non-controllers - - - - - - - 3,634
Profit (loss) - - - - - - - 281,924

10) FINANCIAL REPORTS
318
Note 25 Reportable segments (continued)
25.4 Revenue from transactions with other Company’s operating segments
12/31/2017
Items in the statement of comprehensive
income
Specialty plant
nutrients
ThUS$
Iodine and its
derivatives
ThUS$
Lithium and its
derivatives
ThUS$
Industrial
chemicals
ThUS$
Potassium
ThUS$
Other
products and
services
ThUS$
Total segments
and Corporate
unit
ThUS$
Revenue 697,251 252,123 644,573 135,578 379,326 48,472 2,157,323
12/31/2016
Items in the statement of comprehensive
income
Specialty plant
nutrients
ThUS$
Iodine and its
derivatives
ThUS$
Lithium and its
derivatives
ThUS$
Industrial
chemicals
ThUS$
Potassium
ThUS$
Other
products and
services
ThUS$
Total segments
and Corporate
unit
ThUS$
Revenue 623,853 231,144 514,627 104,137 403,323 62,238 1,939,322
25.5 Disclosures on geographical areas
As indicated in paragraph 33 of IFRS 8, the entity discloses geographical information on its revenue from operating
activities with external customers and from non-current assets that are not financial instruments, deferred income tax
assets, assets related to post-employment benefits or rights derived from insurance contracts.
25.6 Disclosures on main customers
With respect to the degree of dependency of the Company on its customers, in accordance with paragraph N° 34 of
IFRS N° 8, the Company has no external customers who individually represent 10% or more of its revenue, Credit
risk concentrations with respect to trade and other accounts receivable are limited due to the significant number of
entities in the Company’s portfolio and its worldwide distribution, The Company’s policy requires guarantees (such
as letters of credit, guarantee clauses and others) and/or to maintain insurance policies for certain accounts as deemed
necessary by the Company's Management.

10) FINANCIAL REPORTS
319
Note 25 Reportable segments (continued)
25.7 Segments by geographical areas as of December 31, 2017, 2016 and 2015
12/31/2017
Items Chile
ThUS$
Latin America and
the Caribbean
ThUS$
Europe
ThUS$
North America
ThUS$
Asia and others
ThUS$
Total
ThUS$
Revenue 140,764 228,759 1,048,556 441,377 297,867 2,157,323
Investment accounted for under the equity method (5,513) 26,860 33,318 15,193 56,567 126,425
Intangible assets other than goodwill 105,313 - 453 182 - 105,948
Goodwill 23,731 6,290 11,374 724 2,058 44,177
Property, plant and equipment, net 1,430,569 313 3,857 2,469 1,574 1,438,782
Investment property - - - - - -
Other non-current assets 19,234 28 - - - 19,262
Non-current assets that are not financial instruments 1,573,334 33,491 49,002 18,568 60,199 1,734,594
12/31/2016
Items Chile
ThUS$
Latin America and
the Caribbean
ThUS$
Europe
ThUS$
North America
ThUS$
Asia and others
ThUS$
Total
ThUS$
Revenue 162,477 240,607 411,807 416,380 708,051 1,939,323
Investment accounted for under the equity method - 5,000 25,009 13,456 69,675 113,140
Intangible assets other than goodwill 109,227 - - 211 1 109,439
Goodwill 23,731 86 11,373 724 2,058 37,972
Property, plant and equipment, net 1,526,992 234 3,521 2,536 1,483 1,534,766
Investment property - - - - - -
Other non-current assets 24,551 139 - - - 24,690
Non-current assets that are not financial instruments 1,684,501 5,459 39,903 16,927 73,217 1,820,007

10) FINANCIAL REPORTS
320
Note 25 Reportable segments (continued)
25.8 Property, plant and equipment classified by geographical areas
The company's main production facilities are located near their mines and extraction facilities in northern Chile. The
following table presents the main production facilities as of December 31, 2017 and December 31, 2016:
Location Products
- Pedro de Valdivia : Production of iodine and nitrate salts
- María Elena : Production of iodine and nitrate salts
- Coya Sur : Production of nitrate salts
- Nueva Victoria : Production of iodine and nitrate salts
- Salar de Atacama : Potassium chloride, lithium chloride, boric acid and potassium sulfate
- Salar del Carmen : Production of lithium carbonate and lithium hydroxide
- Tocopilla : Port facilities

10) FINANCIAL REPORTS
321
Note 26 Gains (losses) from operating activities in the statement of income by function of
expenses, included according to their nature
26.1 Revenue
12/31/2017 12/31/2016
ThUS$ ThUS$
Products 2,151,715 1,933,828
Services 5,608 5,494
Total 2,157,323 1,939,322
26.2 Cost of sales
12/31/2017 12/31/2016
ThUS$ ThUS$
Raw material and supplies (413,283) (335,192)
Types of employee benefits expenses
Personnel expenses (172,159) (162,335)
Depreciation expense (232,365) (271,239)
Amortization expense (2,921) (3,210)
Small deposit amortization expense (5,440) (9,498)
Impairment losses (reversals of impairment losses)
recognized in profit or loss for the period (17,583) 1,956
Operating leases (96,094) (90,325)
Investment plan expenses (13,956) (16,624)
Maintenance and repair (5,306) (6,051)
Contractors, (67,337) (62,300)
Mining concessions (7,802) (7,313)
Operations transport (54,057) (45,864)
Freight and product transport costs (131,729) (132,260)
Packaging costs (2,402) (1,712)
Purchases from third parties (113,898) (125,456)
Insurance policies (11,199) (12,110)
CORFO right (46,274) (41,962)
Other expenses, by nature (1,017) (6,790)
Total (1,394,822) (1,328,285)

10) FINANCIAL REPORTS
322
Note 26 Gains (losses) from operating activities in the statement of income by function of expenses,
included according to their nature, (continued)
26.3 Other income
12/31/2017 12/31/2016
ThUS$ ThUS$
Discounts obtained from suppliers 346 771
Indemnities received 2,813 205
Fines charged to suppliers 199 358
Taxes recovered 47 26
Amounts recovered from insurance 154 5,636
Overestimate of provisions for third-party obligations 587 573
Overestimate of doubtful accounts 3 56
Sale of property, plant and equipment 1,278 657
Sale of materials, spare parts and supplies - 30
Sale of scrap materials - 1
Options on mining claims 2,607 2,577
Interest charged to direct customers 317 -
Easements, pipelines and roads 4,656 219
Non-conventional renewable energy - 639
Reimbursement mining licenses and notary expenses 1,197 1,300
Miscellaneous services 4 -
Shares obtained in junior mining companies 2,263 421
Reversal of allowance for inventories - 815
Reimbursements from creditors - -
Other operating income 1,356 918
Total 17,827 15,202
26.4 Administrative expenses
12/31/2017 12/31/2016
ThUS$ ThUS$
Employee benefit expenses by nature
Remuneration and benefits to employees (50,684) (47,217)
Expenses for amortization (8) (6)
Advisory service (804) (1,322)
Audit fees (1,823) (1,768)
Marketing costs (1,581) (1,338)
Rent buildings and facilities (878) (494)
Advertising expenses (54) (173)
Other expenses, by nature (45,339) (36,118)
Total (101,171) (88,436)

10) FINANCIAL REPORTS
323
Note 26 Gains (losses) from operating activities in the statement of income by function of expenses,
included according to their nature (continued)
26.5 Other expenses by function
12/31//2017 12/31/2016
ThUS$ ThUS$
Classes of Employee Benefit Expenses
Depreciation and amortization expense
Depreciation of assets not in use (90) (111)
Sub total (90) (111)
Impairment losses (reversals of impairment losses) recognized in
profit (loss) for the year
Impairment of doubtful accounts (8,038) (7,198)
Sub total (8,038) (7,198)
Other expenses, by nature
Legal expenses (4,780) (5,737)
CORFO right (20,396) -
Plant suspension expenses - (32,061)
VAT and other unrecoverable taxes (1,295) (1,015)
Fines, interest and VAT (1,112) (1,379)
SEC and Department of Justice fines (*) - (30,488)
Advisory services (75) (59)
Investment plan expenses (10,006) (6,657)
Donations not accepted as tax credit (5,527) (1,692)
Provision for inventory of materials, spare parts and supplies - (815)
Indemnities paid (421)
Restructuring of joint ventures (6,000) -
Other operating expenses (3,898) (2,519)
Sub total (53,510) (82,422)
Total (61,638) (89,731)
26.6 Other income (expenses)
12/31/2017 12/31/2016
ThUS$ ThUS$
Adjust previous year application method of participation 501 (826)
Sale of investments in associates - 7,636
Provision for staff severance indemnities 192 (6,300)
Other gains (losses) (150) 169
Total 543 679

10) FINANCIAL REPORTS
324
Note 26 Gains (losses) from operating activities in the statement of income by function of expenses,
included according to their nature (continued)
This table corresponds to the summary required by the Financial Markets Commission (formerly the Chilean
Superintendence of Securities and Insurance (SVS)) and considers notes 26.2, 26.4 and 26.5.
26.7 Summary of expenses by nature
January to December
2017 2016
ThUS$ ThUS$
Raw materials and consumables (413,283) (335,192)
Classes of Employee Benefit Expenses Personnel expenses (222,843) (209,552)
Depreciation and amortization expense
Depreciation expense (232,455) (271,350) Amortization expense (2,929) (3,217)
Ground study amortization expense (5,440) (9,498)
Impairment losses (reversals of impairment losses) recognized in profit (loss)
for the year (25,621) (6,057)
Operating leases (96,094) (90,325)
Fines paid (1,112) (1,379)
Fines from SEC and the Justice department - (30,488)
Investment plan expenses (23,962) (23,281)
Maintenance and repair (5,306) (6,051)
Plant suspension expenses - (32,061)
Contractors (67,337) (62,300)
Mining concessions (7,802) (7,313)
Operations transport (54,057) (45,864)
Freight and product transport costs (131,729) (132,260)
Packaging costs (2,402) (1,712)
Sales cost of imported goods (113,898) (125,456)
Insurance (11,199) (12,110)
CORFO rights (66,670) (41,962)
Advisory services (804) (1,322)
Auditors’ fees (1,823) (1,768)
Marketing costs (1,581) (1,338)
Lease of offices and facilities (878) (494)
Advertising costs (54) (173)
Other expenses, by nature (68,352) (53,929)
Other expenses by nature (1,557,631) (1,506,452)

10) FINANCIAL REPORTS
325
Note 26 Gains (losses) from operating activities in the statement of income by function of expenses,
included according to their nature (continued)
26.8 Finance expenses
January to December
2017 2016 THUS$ THUS$ Interest expense from bank borrowings and overdrafts (1,308) (854)
Interest expense from bonds (49,373) (57.409)
Interest expense from loans (2,002) (4.581)
Capitalized interest expenses 4,382 5.406
Other finance costs (1,823) (60)
Total (50,124) (57.498)

10) FINANCIAL REPORTS
326
Note 27 Income tax and deferred taxes
Accounts receivable from taxes as of December 31, 2017 and December 31, 2016, are as follows:
27.1 Current and non-current tax assets
a) Current tax assets
12/31/2017 12/31/2016
ThUS$ ThUS$
Monthly provisional income tax payments, Chilean companies 17,613 45,955
Monthly provisional payment Royalty 588 3,542
Monthly provisional income tax payments, foreign companies 1,644 1,323
Corporate tax credits (1) 944 748
Corporate tax absorbed by tax losses - 64
Taxes in recovery process 11,502 -
Total 32,291 51,632
b) Non-current tax assets
12/31/2017 12/31/2016
ThUS$ ThUS$
Monthly provisional income tax payments, Chilean companies 6,398 6,398
Specific tax on mining activities paid (on consignment) 25,781 25,781
Total 32,179 32,179
(1) These credits are available to companies and relate to the corporate tax payment in April of the following
year. These credits include, amongst other items, training expense credits (SENCE) and property, plant and
equipment acquisition credits that are equivalent to 4% of the property, plant and equipment purchases made
during the year, in addition, some credits relate to the donations the Group has made during 2017 and 2016.

10) FINANCIAL REPORTS
327
Note 27 Income tax and deferred taxes (continued)
27.1 Current and non-current tax assets, continued
27.2 Current tax liabilities
Current tax liabilities 12/31/2017 12/31/2016
ThUS$ ThUS$
1st Category income tax 45,479 50,174
Foreign company income tax 28,996 25,276
Article 21 single tax 927 422
Total 75,402 75,872
Income tax is calculated based on the profit or loss for tax purposes that is applied to the effective tax rate applicable
in Chile. As established by Law No.20,780, an income tax rate of 21% was set starting from 2014, a rate of 22.5%
for 2015, a rate of 24% for 2016, a rate of 25.5% for 2017, and a rate of 27% starting from 2018.
The provision for royalty is determined by applying the tax rate determined for the net operating income (NOI).
Currently, the Company pays 5% for the application of the Tax Invariability Contract established with the Ministry
of Economy in 2010.
In conclusion, both concepts represent the estimated amount the Company will have to pay for income tax and tax
on mining.

10) FINANCIAL REPORTS
328
Note 27 Income tax and deferred taxes (continued)
27.3 Income tax and deferred taxes
Assets and liabilities recognized in the statement of financial position are offset if and only if:
1 The Company has legally recognized before the right of the tax authority to offset the amounts recognized
in these entries; and
2 Deferred income tax assets and liabilities are derived from income tax related to the same tax authority on:
(i) the same entity or tax subject; or
(ii) different entities or tax subjects who intend either to settle current fiscal assets and liabilities for their net
amount, or to realize assets and pay liabilities simultaneously in each of the future periods in which the
Company expects to settle or recover significant amounts of deferred tax assets or liabilities.
Recognized deferred income tax assets are the income taxes that are to be recovered in future periods, related to:
a) deductible temporary differences.
b) the offsetting of losses obtained in prior periods and not yet subject to tax deduction; and
c) the offsetting of unused credits from prior periods.
The Company recognizes a deferred tax asset when there is certainty that these can be offset with tax income from
subsequent periods, losses or fiscal credits not yet used, but solely as long as it is more likely than not that there will
be tax earnings in the future against which to charge these losses or unused fiscal credits.
Recognized deferred tax liabilities refer to the amounts of income taxes payable in future periods related to taxable
temporary differences.

10) FINANCIAL REPORTS
329
Note 27 Income tax and deferred taxes (continued)
27.3 Income tax and deferred taxes, continued
d.1) Income tax assets and liabilities as of December 31, 2017 are detailed as follows:
Net liability position
Description of deferred tax assets and liabilities Assets Liabilities
ThUS$ ThUS$
Unrealized loss - (68,544)
Property, plant and equipment and capitalized interest 211,435 -
Facility closure provision - (3,469) Manufacturing expenses 102,748 -
Staff severance indemnities unemployment insurance 6,792 -
Vacation accrual - (4,887) Inventory provision - (25,098)
Materials provision - (7,107) Forwards - (624)
Employee benefits - (2,317)
Research and development expenses 3,501 - Accounts receivable - (4,222)
Provision for legal complaints and expenses - (10,750)
Loan approval expenses 2,670 - Junior mining companies (valued based on stock price) 2,474 -
Royalty 4,084 -
Tax loss benefit - (1,437) Other 544 -
Foreign items (other) - (510)
Balances to date 334,248 (128,965)
Net balance 205,283 -

10) FINANCIAL REPORTS
330
Note 27 Income tax and deferred taxes (continued)
27.3 Income tax and deferred taxes, continued
d.2) Income tax assets and liabilities as of December 31, 2016 are detailed as follows
Net liability position
Description of deferred tax assets and liabilities Assets Liabilities
ThUS$ ThUS$
Unrealized loss - (86,156)
Property, plant and equipment and capitalized interest 225,124 -
Facility closure provision - (1,590)
Manufacturing expenses 110,630 -
Staff severance indemnities, unemployment 5,214 -
Vacation accrual - (4,061)
Inventory provision - (20,608)
Materials provision - (7,776)
Forwards - (10,206)
Employee benefits - (6,783)
Research and development expenses 4,641 -
Accounts receivable - (4,273)
Provision for legal complaints and expenses - (7,686)
Loan approval expenses 3,115 -
Junior mining companies (valued based on stock price) 1,300 -
Royalty 6,457 -
Tax loss benefit - (1,302)
Other 79 -
Foreign items (other) - (664)
Balances to date 356,560 (151,105)
Net balance 205,455 -

10) FINANCIAL REPORTS
331
Note 27 Income tax and deferred taxes (continued)
27.3 Income tax and deferred taxes, continued
d.3) Reconciliation of changes in deferred tax liabilities (assets) as of December 31, 2017
Deferred tax
liability
(asset) at
beginning of
period
Deferred tax
expense
(benefit)
recognized in
profit (loss) for
the year
Deferred
taxes related
to items
credited
(charged)
directly to
equity
Total increases
(decreases) in
deferred tax
liabilities (assets)
Deferred tax
liability (asset)
at end of period
ThUS$ ThUS$ ThUS$ ThUS$ ThUS$
Unrealized loss (86,156) 17,612 - 17,612 (68,544)
Property, plant and equipment and
capitalized interest 225,124 (13,689) - (13,689) 211,435
Facility closure provision (1,590) (1,879) - (1,879) (3,469)
Manufacturing expenses 110,630 (7,882) - (7,882) 102,748
Individual savings plans, unemployment
insurance 5,214 1,876 (298) 1,578 6,792
Vacation accrual (4,061) (826) - (826) (4,887)
Inventory provision (20,608) (4,490) - (4,490) (25,098)
Materials provision (7,776) 669 - 669 (7,107)
Forwards (10,206) 9,582 - 9,582 (624)
Employee benefits (6,783) 4,466 - 4,466 (2,317)
Research and development expenses 4,641 (1,140) - (1,140) 3,501
Accounts receivable (4,273) 51 - 51 (4,222)
Provision for legal complaints and expenses
(7,686) (3,064) - (3,064) (10,750)
Loan approval expenses 3,115 (445) - (445) 2,670
Junior mining companies (valued based
on stock price) 1,300 624 550 1,174 2,474
Royalty 6,457 (2,389) 16 (2,373) 4,084
Tax loss benefit (1,302) (135) - (135) (1,437)
Other 79 465 - 465 544
Foreign items (other) (664) 154 - 154 (510)
Total temporary differences, unused
losses and unused tax credits 205,455 (440) 268 (172) 205,283

10) FINANCIAL REPORTS
332
Note 27 Income tax and deferred taxes (continued)
27.3 Income tax and deferred taxes, continued
d.4) Reconciliation of changes in deferred tax liabilities (assets) as of December 31, 2016
Deferred tax
liability
(asset) at
beginning of
period
Deferred tax
expense
(benefit)
recognized in
profit (loss)
for the year
Deferred
taxes related
to items
credited
(charged)
directly to
equity
Total increases
(decreases) in
deferred tax
liabilities (assets)
Deferred tax
liability
(asset) at end
of period
ThUS$ ThUS$ ThUS$ ThUS$ ThUS$
Unrealized loss (87,440) 1,284 - 1,284 (86,156)
Property, plant and equipment and capitalized
interest 236,094 (10,970) - (10,970) 225,124
Facility closure provision - (1,590) - (1,590) (1,590)
Manufacturing expenses 109,134 1,496 - 1,496 110,630
Individual savings plans, unemployment insurance
4,155 1,980 (921) 1,059 5,214
Vacation accrual (3,372) (689) - (689) (4,061)
Inventory provision (29,428) 8,820 - 8,820 (20,608)
Materials provision - (7,776) - (7,776) (7,776)
Forwards (12,322) 1,646 470 2,116 (10,206)
Employee benefits (1,956) (4,827) - (4,827) (6,783)
Research and development expenses 8,247 (3,606) - (3,606) 4,641
Accounts receivable (5,076) 803 - 803 (4,273)
Provision for legal complaints and expenses (7,357) (329) - (329) (7,686)
Loan approval expenses 3,651 (536) - (536) 3,115
Junior mining companies (valued based on
stock price) - - 1,300 1,300 1,300
Royalty 6,410 47 - 47 6,457
Tax loss benefit (1,525) 223 - 223 (1,302)
Other 97 (18) - (18) 79
Foreign items (other) (82) (582) - (582) (664)
Total temporary differences, unused losses
and unused tax credits 219,230 (14,624) 849 (13,775) 205,455
During the period ended December 31, 2017 and December 31, 2016, the Company calculated and accounted for
taxable income considering a rate of 24% and 22.5% respectively, in conformity with Law No, 20,780, Tax Reform,
published in the Official Gazette on September 29, 2014.
The main amendments include a gradual increase in the corporate income tax rate up to 27% starting from 2018.
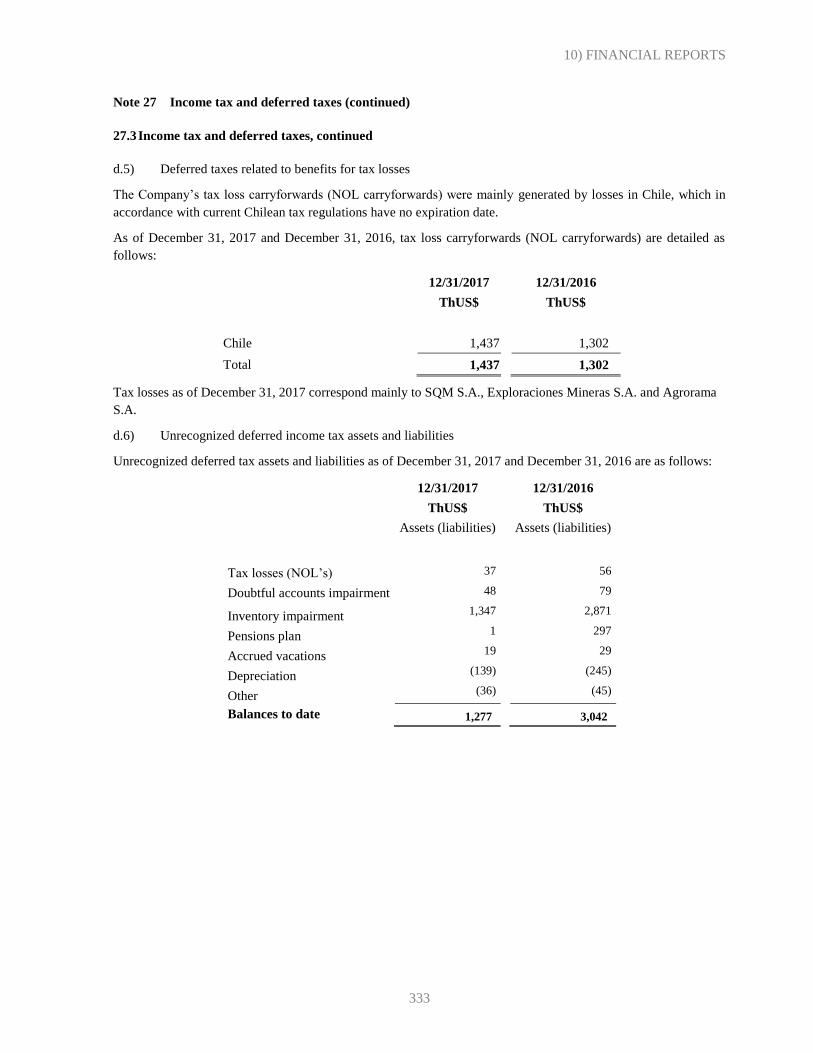
10) FINANCIAL REPORTS
333
Note 27 Income tax and deferred taxes (continued)
27.3 Income tax and deferred taxes, continued
d.5) Deferred taxes related to benefits for tax losses
The Company’s tax loss carryforwards (NOL carryforwards) were mainly generated by losses in Chile, which in
accordance with current Chilean tax regulations have no expiration date.
As of December 31, 2017 and December 31, 2016, tax loss carryforwards (NOL carryforwards) are detailed as
follows:
12/31/2017 12/31/2016
ThUS$ ThUS$
Chile 1,437 1,302
Total 1,437 1,302
Tax losses as of December 31, 2017 correspond mainly to SQM S.A., Exploraciones Mineras S.A. and Agrorama
S.A.
d.6) Unrecognized deferred income tax assets and liabilities
Unrecognized deferred tax assets and liabilities as of December 31, 2017 and December 31, 2016 are as follows:
12/31/2017 12/31/2016
ThUS$ ThUS$
Assets (liabilities) Assets (liabilities)
Tax losses (NOL’s) 37 56
Doubtful accounts impairment 48 79
Inventory impairment 1,347 2,871
Pensions plan 1 297
Accrued vacations 19 29
Depreciation (139) (245)
Other (36) (45)
Balances to date 1,277 3,042

10) FINANCIAL REPORTS
334
Note 27 Income tax and deferred taxes (continued)
27.3 Income tax and deferred taxes, continued
d.7) Movements in deferred tax assets and liabilities
Movements in deferred tax assets and liabilities as of December 31, 2017 and December 31, 2016 are detailed as
follows:
12/31/2017 12/31/2016
ThUS$ ThUS$
Liabilities
(assets)
Liabilities (assets)
Deferred tax assets and liabilities, net opening balance 205,455 219,230
Increase (decrease) in deferred taxes in profit or loss (440) (14,624)
Increase (decrease) in deferred taxes in equity 268 849
Balances to date 205,283 205,455
d.8) Disclosures on income tax expense (income)
The Company recognizes current and deferred taxes as income or expenses, and they are included in profit or loss,
unless they arise from:
(a) a transaction or event recognized in the same period or in a different period, outside profit or loss either in
other comprehensive income or directly in equity; or
(b) a business combination
Current and deferred tax expenses (income) are detailed as follows:
12/31/2017 12/31/2016
ThUS$ ThUS$
Income (expenses) Income
(expenses)
Current income tax expense
Current income tax expense (182,122) (149,669)
Adjustments to prior year current income tax 15,509 2,080
Current income tax expense, net, total (166,613) (147,589)
Deferred tax expense
Deferred tax expense (income) relating to the creation and reversal of temporary
differences 440 14,624
Deferred tax expense, net, total 440 14,624
Tax expense (income) (166,173) (132,965)

10) FINANCIAL REPORTS
335
Note 27 Income tax and deferred taxes (continued)
27.3 Income tax and deferred taxes, continued
Tax expenses (income) for foreign and domestic parties are detailed as follows:
12/31/2017 12/31/2016
ThUS$ ThUS$
Income (expenses) Income (expenses)
Current income tax expense by foreign and domestic
parties, net
Current income tax expense, foreign parties, net (14,396) (10,844)
Current income tax expense, domestic, net (152,217) (136,745)
Current income tax expense, net, total (166,613) (147,589)
Deferred tax expense by foreign and domestic parties, net
Deferred tax expense, foreign parties, net (154) 626
Deferred tax expense, domestic, net 594 13,998
Deferred tax expense, net, total 440 14,624
Income tax expense (166,173) (132,965)
d.9) Equity interest in taxation attributable to equity-accounted investees
The Company does not recognize any deferred tax liability in all cases of taxable temporary differences associated
with investments in subsidiaries, branches and associated companies or interest in joint ventures, because as
indicated in the standard, the following two conditions are jointly met:
(a) the parent, investor or interest holder is able to control the time for reversal of the temporary difference;
and
(b) It is more likely than not that the temporary difference will not be reversed in the foreseeable future.
In addition, the Company does not recognize deferred income tax assets for all deductible temporary differences
from investments in subsidiaries, branches and associated companies or interests in joint ventures because it is
unlikely that they will meet the following requirements:
(a) Temporary differences are reversed in a foreseeable future; and
(b) The Company has tax earnings, against which temporary differences can be used.

10) FINANCIAL REPORTS
336
Note 27 Income tax and deferred taxes (continued)
27.3 Income tax and deferred taxes, continued
d.10) Disclosures on the tax effects of other comprehensive income components:
Income tax related to other income and expense components with a
charge or credit to net equity
Amount before
taxes (expense)
gain
(Expense)
income for
income taxes
Amount after
taxes
12/31/2017 12/31/2017 12/31/2017
ThUS$ ThUS$ ThUS$
Gain (loss) from defined benefit plans (1,392) 282 (1,110)
Reserve for gains (losses) from financial assets measured at fair value
through other comprehensive income (26) (550) (576)
Total (1,418) (268) (1,686)
Income tax related to other income and expense components with
a charge or credit to net equity
Amount before
taxes (expense)
gain
(Expense)
income for
income taxes
Amount after
taxes
12/31/2016 12/31/2016 12/31/2016
ThUS$ ThUS$ ThUS$
Gain (loss) from defined benefit plans (3,397) 921 (2,476)
Cash flow hedge 2,233 (470) 1,763
Reserve for gains (losses) from financial assets measured at fair value
through other comprehensive income 4,813 (1,300) 3,513
Total 3,649 (849) 2,800
d.11) Explanation of the relationship between expense (income) for tax purposes and accounting income.
In accordance with paragraph No 81, letter c) of IAS 12, the Company considers that the method that discloses most
significant information for the users of its financial statements is the reconciliation of tax expense (income) to the
result of multiplying income for accounting purposes by the tax rate in force in Chile. This option is based on the
fact that the Parent and its subsidiaries incorporated in Chile generate almost the total amount of tax expense
(income) and the fact that the amounts contributed by subsidiaries incorporated in foreign countries have no relevant
significance within the context of the total amount of tax expense (income).

10) FINANCIAL REPORTS
337
Note 27 Income tax and deferred taxes (continued)
27.3 Income tax and deferred taxes, continued
Reconciliation of numbers in income tax expenses (income) and the result of multiplying financial gain by the rate
prevailing in Chile,
Income (expense)
12/31/2017 12/31/2016
ThUS$ ThUS$
Consolidated income before taxes 595,639 414,889
Income tax rate in force in Chile 25.5% 24%
Tax expense using the legal rate (151,888) (99,573)
Effect of royalty tax expense and passive income (3,529) (6,311)
Tax effect of non-taxable revenue 1,746 2,461
Effect of taxable rate of non-deductible expenses for determination of
taxable income (loss) (4,594) (10,202)
Tax effect of tax rates supported abroad (6,409) (15,933)
Other tax effects from the reconciliation between the accounting income
and tax expense Effect of changes in tax rate (1,499) (3,407)
Tax expense using the effective rate (166,173) (132,965)
d.12) Tax periods potentially subject to verification:
The Group’s Companies are potentially subject to income tax audits by tax authorities in each country. These audits
are limited to a number of interim tax periods, which, in general, when they elapse, give rise to the expiration of
these inspections,
Tax audits, due to their nature, are often complex and may require several years, Below, we provide a summary of
tax periods that are potentially subject to verification, in accordance with the tax regulations in force in the country
of origin:
Chile
According to article 200 of Decree Law No 830, the taxes will be reviewed for any deficiencies in terms of payment
and to generate any taxes that might arise. There is a 3-year prescriptive period for such review, dating from the
expiration of the legal deadline when payment should have been made. This prescriptive period can be extended to
6 years for the revision of taxes subject to declaration, when such declaration has not been filed or has been presented
with maliciously false information.

10) FINANCIAL REPORTS
338
Note 27 Income tax and deferred taxes (continued)
27.3 Income tax and deferred taxes, continued
United States
In the United States, the tax authority may review tax returns for up to 3 years from the expiration date of the tax
return, In the event that an omission or error is detected in the tax return of sales or cost of sales, the review can be
extended for a period of up to 6 years.
SQM North America Corp., a subsidiary of the Company, is being reviewed by the United States’ tax authorities.
This review could lead to adjustments to the tax declarations made by the subsidiary in the United States.
Mexico:
In Mexico, the tax authority can review tax returns up to 5 years from the expiration date of the tax return.
Spain:
In Spain, the tax authority can review tax returns up to 4 years from the expiration date of the tax return.
Belgium:
In Belgium, the tax authority may review tax returns for up to 3 years from the expiration date of the tax return if no
tax losses exist, In the event of detecting an omission or error in the tax return, the review can be extended for a
period of up to 5 years.
South Africa:
In South Africa, the tax authority may review tax returns for up to 3 years from the expiration date of the tax return,
In the event that an omission or error in the tax return is detected, the review can be extended for a period of up to 5
years.

10) FINANCIAL REPORTS
339
Note 28 Disclosures on the effects of fluctuations in foreign currency exchange rates
Assets held in foreign currency subject to fluctuations in exchange rates are detailed as follows:
Class of assets Currency 12/31/2017
ThUS
12/31/2016
ThUS$
Current assets:
Cash and cash equivalents ARS 1 4
Cash and cash equivalents BRL 38 60 Cash and cash equivalents CLP 579 6,044
Cash and cash equivalents CNY 1,143 400
Cash and cash equivalents EUR 9,782 11,386 Cash and cash equivalents GBP 55 71
Cash and cash equivalents AUD - -
Cash and cash equivalents INR - 12 Cash and cash equivalents MXN 258 310
Cash and cash equivalents PEN 8 3
Cash and cash equivalents THB - - Cash and cash equivalents YEN 1,773 2,150
Cash and cash equivalents ZAR 4,074 3,250
Subtotal cash and cash equivalents 17,711 23,690
Other current financial assets CLF - -
Other current financial assets CLP 39,126 50,740
Subtotal other current financial assets 39,126 50,740
Other current non-financial assets ARS - 5
Other current non-financial assets AUD - 45
Other current non-financial assets BRL 1 - Other current non-financial assets COP 30 -
Other current non-financial assets CLF 46 47
Other current non-financial assets CLP 12,172 14,554 Other current non-financial assets CNY 12 10
Other current non-financial assets EUR 235 822
Other current non-financial assets MXN 1,429 1,734 Other current non-financial assets THB 279 21
Other current non-financial assets PEN 20 - Other current non-financial assets YEN 18 53
Other current non-financial assets ZAR 2,941 18
Subtotal other current non-financial assets 17,183 17,309
Trade and other receivables ARS 6 -
Trade and other receivables BRL 23 23
Trade and other receivables CLF 427 545 Trade and other receivables CLP 85,837 71,908
Trade and other receivables CNY 10,426 48
Trade and other receivables EUR 49,627 30,941 Trade and other receivables GBP 90 152
Trade and other receivables MXN 195 423
Trade and other receivables AED 546 - Trade and other receivables THB 791 2,777
Trade and other receivables YEN 41,582 209
Trade and other receivables ZAR 23,825 25,835
Subtotal trade and other receivables 213,375 132,861
Receivables from related parties PEN - 40
Receivables from related parties CLP - 41 Receivables from related parties EUR 58 476
Receivables from related parties THB 74 705
Receivables from related parties CNY - 48 Receivables from related parties YEN - -
Receivables from related parties ZAR - -
Subtotal receivables from related parties 132 1,310

10) FINANCIAL REPORTS
340
Note 28 Disclosures on the effects of fluctuations in foreign currency exchange rates (continued)
Class of assets Currency 12/31/2017
ThUS$
12/31/2016
ThUS$
Current tax assets ARS 4 5
Current tax assets CLP 1,413 1,640
Current tax assets EUR 183 118
Current tax assets BRL - 3
Current tax assets ZAR 431 386
Current tax assets MXN - 202
Current tax assets PEN 201 203
Subtotal current tax assets 2,232 2,557
Subtotal current assets 289,759 228,467
Non-current assets Other non-current financial assets CLP 20 20
Other non-current financial assets YEN 42 41
Subtotal other non-current financial assets 62 61
Other non-current non-financial assets BRL 27 139
Other non-current non-financial assets CLP 822 729
Subtotal other non-current non-financial assets 849 868
Non-current right receivable CLF 209 344
Non-current right receivable COP 47 -
Non-current right receivable CLP 1,256 1,382
Subtotal non-current rights receivable 1,512 1,726
Equity-accounted investees AED 35,414 31,297
Equity-accounted investees EUR - - Equity-accounted investees IDR - -
Equity-accounted investees EUR 8,144 7,373
Equity-accounted investees INR 1,632 1,499 Equity-accounted investees THB 2,491 1,932
Equity-accounted investees TRY 21,741 16,712
Subtotal equity-accounted investees 69,422 58,813
Intangible assets other than goodwill CLP 48 294
Intangible assets other than goodwill CNY - 1
Subtotal intangible assets other than goodwill 48 295
Property, plant and equipment CLP 3,574 3,810
Subtotal property, plant and equipment 3,574 3,810
Total non-current assets 75,467 65,573
Total assets 365,226 294,040

10) FINANCIAL REPORTS
341
Note 28 Disclosures on the effects of fluctuations in foreign currency exchange rates (continued)
Liabilities held in foreign currencies are detailed as follows:
12/31/2017 12/31/2016
Class of liability Currency
91 days to 1
year
ThUS$
91 days to 1
year
ThUS$
Total
ThUS$
Up to90 days
ThUS$
91 days to 1
year
ThUS$
Total
ThUS$
Current liabilities
Other current financial liabilities CLF 4,947 - 4,947 44,327 6,098 50,425
Other current financial liabilities CLP - - - - 20,919 20,919
Subtotal other current financial liabilities 4,947 - 4,947 44,327 27,017 71,344
Trade and other payables BRL 37 - 37 38 - 38
Trade and other payables THB 91 - 91 131 - 131
Trade and other payables CLP 61,310 4,361 65,671 40,604 2,808 43,412 Trade and other payables CNY - - - - - -
Trade and other payables EUR 32,896 - 32,896 30,545 - 30,545
Trade and other payables GBP 11 - 11 6 - 6 Trade and other payables INR 1 - 1 1 - 1
Trade and other payables MXN 13 - 13 67 - 67
Trade and other payables PEN 3 - 3 4 - 4
Trade and other payables ZAR 2,541 - 2,541 3,054 - 3,054
Subtotal trade and other payables 96,903 4,361 101,264 74,450 2,808 77,258
Other current provisions ARS - 12 12 - - -
Other current provisions CLF - - - - - - Other current provisions BRL 739 - 739 - - -
Other current provisions CLP - 80 80 - 70 70 Other current provisions EUR 243 - 243 5 - 5
Other current provisions INR - - - - - -
Subtotal other current provisions 982 92 1,074 5 70 75
Current tax liabilities CLP - 326 326 - - -
Current tax liabilities BRL - 6 6 - 131 131
Current tax liabilities CNY 3 - 3 - 36 36 Current tax liabilities EUR - 644 644 - 3,987 3,987
Current tax liabilities ZAR 264 - 264 27 - 27
Current tax liabilities MXN 3 3,071 3,074 - 56 56
Subtotal current tax liabilities 270 4,047 4,317 27 4,210 4,237

10) FINANCIAL REPORTS
342
Note 28 Disclosures on the effects of fluctuations in foreign currency exchange rates (continued)
12/31/2017 12/31/2016
Class of liability Currency
Up to 90
days
ThUS$
over 90 days
to 1 year
ThUS$
Total
ThUS$
Up to90 days
ThUS$
Over 90 days
to 1 year
ThUS$
Total
ThUS$
Other current non-financial liabilities BRL 15 - 15 4 - 4 Other current non-financial liabilities CLP 8,708 1,824 10,532 7,481 2,820 10,301
Other current non-financial liabilities CNY 7 - 7 78 - 78
Other current non-financial liabilities EUR 2,955 - 2,955 958 - 958 Other current non-financial liabilities MXN 346 34 380 1,284 35 1,319
Other current non-financial liabilities YEN - - - - - -
Other current non-financial liabilities PEN 70 - 70 70 - 70
Other current non-financial liabilities GBP - - - - - -
Other current non-financial liabilities ZAR 12 - 12 866 - 866
Subtotal other current non-financial liabilities 12,113 1,858 13,971 10,741 2,855 13,596
Total current liabilities 115,215 10,358 125,573 129,550 36,960 166,510

10) FINANCIAL REPORTS
343
Note 28 Disclosures on the effects of fluctuations in foreign currency exchange rates (continued)
12/31/2017
Class of liability Currency
1 to 2
years
ThUS$
2 to 3
years
ThUS$
3 to 4
years
ThUS$
4 to 5 years
ThUS$
Over 5
years
ThUS$
Total
ThUS$
Non-current liabilities
Other non-current financial liabilities CLF - - - - 237,279 237,279
Subtotal other non-current financial liabilities - - - - 237,279 237,279
Non-current provisions for employee benefits CLP - - - - 601 601
Non-current provisions for employee benefits MXN - - - - 65 65
Non-current provisions for employee benefits YEN - - - - 626 626
Subtotal non-current provisions for employee benefits - - - - 1,292 1,292
Total non-current liabilities - - - - 238,571 238,571
12/31/2016
Class of liability Currency
1 to 2
years
ThUS$
2 to 3
years
ThUS$
3 to 4
years
ThUS$
4 to 5 years
ThUS$
Over 5
years
ThUS$
Total
ThUS$
Non-current liabilities
Other non-current financial liabilities CLF 5,903 5,903 5,903 5,903 243,297 266,909
Subtotal other non-current financial liabilities 5,903 5,903 5,903 5,903 243,297 266,909
Non-current provisions for employee benefits CLP - - - - 494 494
Non-current provisions for employee benefits MXN - - - - 61 61
Non-current provisions for employee benefits YEN - - - - 561 561
Subtotal non-current provisions for employee benefits - - - - 1,116 1,116
Total non-current liabilities 5,903 5,903 5,903 5,903 244,413 268,025

10) FINANCIAL REPORTS
344
Note 29 Mineral resource exploration and evaluation expenditure
Because of the nature of the operations of Sociedad Química y Minera de Chile S.A. and its subsidiaries and the
type of exploration they conduct (which is different from other mining businesses, where the exploration process
takes a significant amount of time), the exploration process and the definition of economic feasibility normally occur
within the year. Accordingly, although expenditure is initially capitalized, it could be recognized in profit or loss for
the same year should it not be technically and commercially feasible. This means that there is no significant
expenditure that lacks a feasibility study at the end of the year.
Prospecting expenditure can be found in 4 different stages: execution, economically feasible, not economically
feasible and under exploitation:
1. Execution: prospecting expenditures that are under execution and where the economic feasibility is not yet
known are classified in the caption property, plant and equipment. As of December 31, 2017 and December 31,
2016, the balance amounted to ThUS$21,013 and ThUS$ 12,163, respectively,
2. Economically feasible: prospecting expenditure, which upon completion, has been determined to be
economically feasible is classified in the caption non-current assets in other non-current non-financial assets. As of
December 31, 2017 and December 31, 2016, this totaled ThUS$17,721 and ThUS$ 23,008 respectively,
3. Not economically feasible: Prospecting expenditure, which upon completion, has been determined to not
be economically feasible is recorded in profit or loss. As of December 31, 2017 and December 31, 2016 there is no
expenditure for such concept.
4. Under exploitation: Prospecting expenditure under exploitation is classified in the caption current assets in
current inventories. These are amortized considering the exploited material. As of December 31, 2017 and December
31, 2016, the balance amounted to ThUS$521 and ThUS$ 674 respectively.
For the amount of capitalized expenditure, the total amount disbursed in exploration and evaluation of mineral
resources as of December 31, 2017 was ThUS$6,024, and corresponded to non-metallic projects. Such expenditure
mainly corresponds to research, including topographical, geological, exploratory drilling and sampling studies.
With respect to this expenditure, the Company classifies it in accordance with paragraph 9 IFRS 6.
Exploration expenditure where the mineral has low ore grade that is not economically exploitable is debited directly
to profit or loss.
If studies determine that the ore grade is economically exploitable, it is classified in other non-current assets in the
caption ground studies and prospecting expenses. At the time of making the decision to exploit the zone, it is
classified in the caption inventories as part of the cost of raw materials required for production purposes.

10) FINANCIAL REPORTS
345
Note 30 Lawsuits and complaints
Lawsuits and complaints
During 2015, the Chilean IRS has filed several lawsuits and complaints against a number of individuals related to
the so-called “SQM Case”, which are associated with the irregular financing of politicians. Amongst those affected
by these legal claims are the legal representatives of the Company: the CEO, Patricio de Solminihac T. and the Vice
President of Corporate Services, Ricardo Ramos R. Basically, those lawsuits and complaints relate to alleged tax
crimes associated with a possible undue decrease in the taxable net income of the Company and two of its
subsidiaries over the last seven years by recording as expenses in their accounting records invoices and fee receipts,
which could be considered to be ideologically false. Such legal actions are also filed against the taxpayers who
provided the tax documents that allowed the alleged performance of the related illicit acts. In December 2017, the
Public Prosecutor confirmed that no charges will be brought against the CEO or Vice President of Corporate
Services.
Actions performed by the Authority
The Public Ministry and the Chilean IRS (Servicio de Impuestos Internos (SII)) have performed a number of actions
within the framework of the so-called “SQM Case”, where the Company and its executives have provided their
cooperation. Several of the Company’s executives have granted access to their computers and made several
statements at the request of the Prosecutors responsible for the investigation. Additionally, SQM has provided
physical and digital copies of its accounting records and its subsidiaries’ accounting records. In addition, SQM has
also provided the Public Ministry with its email files and all the documentation that has been required by the related
authority.

10) FINANCIAL REPORTS
346
Note 30 Lawsuits and complaints, (continued)
Shearman & Sterling and Ad-Hoc Committee
On February 26, 2015, the Board of Directors of SQM established an ad-hoc committee comprised of three directors
(the “Ad-hoc Committee”), which was authorized to conduct an investigation on the matters described in the
preceding paragraph and to request any external advisory services it deemed necessary. The original members of the
Ad-hoc Committee were José María Eyzaguirre B., Juan Antonio Guzmán M. and Wolf von Appen B.
The Ad-hoc Committee hired its own legal counsel in Chile and the United States as well as forensic accountants in
the United States to support its internal investigation. The U.S. attorneys hired by the Ad-hoc Committee were
mainly charged with reviewing the important facts and analyzing them in the context of the United States Foreign
Corrupt Practices Act (“FCPA”). However, the Ad-hoc Committee’s factual conclusions were shared with both
Chilean authorities and U.S. authorities.
On December 15, 2015, the Ad-hoc Committee presented the conclusions of its investigation to the Board of
Directors of SQM. In addition to discussing the facts related to the referenced payments, the Ad-hoc Committee
concluded that, for the purposes of the FCPA:
a. payments were identified that had been authorized by the former CEO of SQM for which the Company did
not find sufficient supporting documentation;
b. no evidence was identified that demonstrated that such payments were made in order to prompt a public
official to act or abstain from acting in order to help SQM obtain economic benefits;
c. in relation to the cost centers managed by the former CEO of SQM, it was concluded that the Company's
books did not accurately reflect the transactions in question but that these transactions were determined to be
quantitatively immaterial in comparison to SQM's equity, sales, expenses and profits during that period; and
that
d. SQM's internal controls were insufficient to supervise the expenses within the cost center managed by the
former CEO of SQM and relied on the proper use of resources by Patricio Contesse G. himself.
After the Ad-hoc Committee presented its conclusions to the Board of Directors, the Company voluntarily shared
these conclusions with the Chilean and U.S. Authorities (including the SEC and the U.S. Department of Justice
(“DOJ”)) and has since collaborated by handing over documents and additional information requested by these
authorities regarding this investigation.”
10) FINANCIAL REPORTS
347
Note 30 Lawsuits and complaints, (continued)
Investigation by the Department of Justice and the Securities Exchange Commission
SQM informed the US regulating entities (Department of Justice and Securities and Exchange Commission) about
the investigation being performed by Shearman & Sterling, in conformity with the standards effective in the United
States of America. The outcome of the investigation was delivered to these regulating entities, which have started
investigations to determine the existence of possible noncompliance with FCPA (Foreign Corruption Practices Act)
or internal control standards.
On January 13, 2017, the Company entered into agreements with the Department of Justice (the “DOJ”) and the
Securities and Exchange Commission (the “SEC”), both based in the United States of America (the “United States”),
with respect to the investigations that those agencies had conducted as a result of payments to suppliers and entities
that might have been related to politically exposed persons during the years from 2008 through 2015, which resulted
in the performance of an internal investigation at the Company through an Ad-hoc Committee from its Board of
Directors and which was led by the law firm Shearman & Sterling (the “Investigated Facts”). Because the
Company’s securities are traded in the United States, the Company is subject to U.S. legislation. The Company has
voluntarily provided the results of its internal investigation and supporting documentation to the DOJ, the SEC and
the relevant Chilean authorities.
In conformity with the terms of the agreement entered into with the DOJ, referred to as Deferred Prosecution
Agreement (the “DPA”), the Company has accepted that the DOJ presents (i) a charge for the infractions referred to
the absence of implementation of effective internal accounting systems and internal accounting controls and (ii) a
charge for infractions related to failure to properly maintain accounting ledgers, records and sections with respect to
the Investigated Facts. By virtue of the DPA, the DOJ has agreed not to prosecute those charges against the Company
for a period of 3 years, releasing the Company from such responsibility after such period to the extent that within
such term the Company complies with the terms in the DPA, which include the payment of a fine of US$15,487,500
(“U.S. dollars”) and the acceptance of an external monitor for a term of 24 months (the “Monitor”) who will evaluate
the Company’s compliance program and a subsequent independent report by the Company for an additional year.
With respect to the agreement entered into with the SEC, the Company has agreed to (i) pay a fine of US$15 million
and (ii) maintain the Monitor for the aforementioned term.
The SEC has issued a Cease and Desist Order which does not identify any other events of noncompliance with the
standards applicable in the United States.
The aforementioned amounts of approximately US$30.5 million were reflected in the profit or loss of SQM during
the fourth quarter of 2016 in the line item Other expenses by function.

10) FINANCIAL REPORTS
348
Note 31 Sanction proceedings
On April 1, 2015, the SVS started an administrative proceeding against five Directors of the Company for allegedly
not having provided to the market on a timely and truthful basis information which could be significant for making
investment decisions. Such information mainly relates to the preliminary estimate of the impact on the Company’s
financial statements of certain expenses paid by the Company between 2008 and 2014 and which might not qualify
as expenses under current Chilean tax regulations because of the absence of supporting documentation.
On December 31, 2015, Sociedad Química y Minera de Chile S.A. informed the Commission for the Financial
Market (formerly the Superintendence of Securities and Insurance) that it had decided to penalize Patricio Contesse
Fica, Julio Ponce Lerou, Juan Antonio Guzmán Molinari and Wolf von Appen Berhmann, all former directors of
the Company, and Hernan Büchi Buc – a current director – for not having informed the market in a timely manner
in March 2015 in the form of an essential event as directors of the Company at that time regarding the expenses
SQM incurred during certain years for which the Company did not have sufficient supporting documentation or that
could be considered expenses not necessary for producing income. This penalty, consisting of a fine of UF 1,000
for each person, can be appealed by the affected parties before the Financial Markets Commission (formerly the
Superintendence of Securities and Insurance) or the courts of law.
Note 32 Railway for transportation of products between the site Coya Sur and the Port of
Tocopilla
As a result of the rain storms that affected the Tocopilla Zone at the beginning of August 2015, SQM S.A. confirmed
damages to several sections of the railway between the Coya Sur and Tocopilla sites. As of that date, the Company
has used trucks to replace rail transportation. SQM has carried out several internal and external studies with the
purpose of determining what would be necessary to repair the damage to the railway.
These reports revealed that repairing the damage would entail high long-term costs, and it is therefore not convenient
to repair the railway in the short- to medium-term. This decision does not affect the production process or imply
additional employee reductions.
Consequently, SQM has adjusted the value of the assets associated with the railway (fixed equipment, facilities and
rolling stock), which has translated into a charge of approximately US$32 million, which is reflected in the line
other expenses by function in the consolidated statement of income for the period. This amount represents around
0.7% of SQM’s total assets reported at the end of September 2016.

10) FINANCIAL REPORTS
349
Note 33 Events occurred after the reporting date
33.1 Authorization of the financial statements
The consolidated financial statements of Sociedad Química y Minera de Chile S.A. and subsidiaries, prepared in
accordance with International Financial Reporting Standards for the period ended December 31, 2017, were
approved and authorized for issuance by the Board of Directors at their meeting held on February 28, 2018.
33.2 Disclosures on events occurring after the reporting date
On January 17, 2018 SQM and CORFO (Corporación de Formento de la Producción) have reached an agreement
to end the arbitration process directed by the arbitrator, Mr. Héctor Humeres Noguer, in the case 1954-2014 of the
Arbitration and Mediation Center of Santiago Chamber of Commerce (Centro de Arbitrajes y Mediación de la
Cámara de Comercio de Santiago) and other cases accumulated to it (the “Agreement”). The Agreement has been
reached within the conciliation process of the arbitration and on the basis presented by the arbitrator to the parties.
Both SQM´s Board of Directors and the Board of CORFO have approved the Agreement.
The Agreement includes a total payment of US$17.5 million plus agreed interest which a subsidiary of SQM, SQM
Salar S.A. ("SQM Salar"), shall pay CORFO. This payment does not imply the recognition of having owed any
amount to CORFO, and has been agreed to with the sole purpose of ending the disputes between the parties.
Additionally, the Agreement includes important amendments to the lease agreement and project agreement signed
between CORFO and SQM in 1993, which are the contracts that currently permit the mining operations of SQM
Salar in the Salar de Atacama (the "Contracts"). The main modifications are detailed below, and will become
effective once the following resolutions have been issued: (i) the approval resolution of the Contracts by the CORFO
Council, and (ii) the resolution that executes the respective approval agreement by the Chilean Nuclear Energy
Commission (CCHEN):
a. An increase in lease payments by increasing the lease rates associated with the sale of the different products
produced in the Salar de Atacama:
In regard to lithium carbonate, the current rate of 6.8% on FOB sales shall be changed to the following
structure of progressive rates based on the final sale price:
Price US$/MT Li2CO3 Lease payment rate
$0 - $4,000 6.8%
$4,000 - $5,000 8.0%
$5,000 - $6,000 10.0%
$6,000 - $7,000 17.0%
$7,000 - $10,000 25.0%
> $10,000 40.0%
As an example and considering a price of US$12,600 per metric ton (similar to the average price seen in the third
quarter of 2017), the lease rate would have been equal to 19.14%.

10) FINANCIAL REPORTS
350
Note 33 Events occurred after the reporting date (continued)
33.2 Disclosures on events occurring after the reporting date, continued
In regard to potassium chloride, the current rate of 1.8% on FOB sales shall be changed to the following
structure of progressive rates based on the final sale price.
Price US$/MT KCL Lease payment rate
$0 - $300 3.0%
$300 - $400 7.0%
$400 - $500 10.0%
$500 - $600 15.0%
> $600 20.0%
Similarly, the lease rates associated with the other products (lithium hydroxide, potassium sulfate and
others) shall have similar changes to those described in the previous products.
b. SQM Salar commits to contribute (i) between US$10.8 and US$18.9 million per year to research and
development efforts, (ii) between US$10 to US$15 million per year to the communities in close proximity to
the Salar de Atacama, and (iii) 1.7% of total annual sales of SQM Salar to the regional development. As an
example and considering annualized SQM Salar´s revenues reported in the first nine months of 2017
(approximately US$1 billion), 1.7% of sales would have been approximately US$17 million.
c. The authorization by CORFO to increase the production and sales of lithium products produced in the Salar
de Atacama. Subject to prior authorization by CCHEN, the Agreement considers that SQM Salar will have
the right to exploit, subject to compliance with other agreed conditions, process and sell during the term of
the Agreement (until the end of 2030) up to 349,553 metric tons of lithium metallic equivalent in the addition
to the approximately remaining 64,816 metric tons of lithium metallic equivalent from the originally
authorized amount. The sum of the above amounts is equal to approximately 2.2 million metric tons of lithium
carbonate equivalent.
d. SQM Salar shall offer part of its lithium production (up to a maximum of 25%) at preferential price to value-
added producers that will potentially develop in Chile, a price based on the lowest export market price equal
in each case to the weighted average FOB price calculated on the 20% lower price of the volume exported
by SQM Salar during the last 6 months available.
e. SQM Salar shall strengthen its corporate governance, incorporating various audit, environmental control and
coordination mechanisms with CORFO. For these purposes it will be necessary to modify the bylaws of SQM
Salar, including among others: (i) to incorporate specific rules for the management of the company, in the
form that two of the directors of SQM Salar are independent and meet the requirements established for
independent directors of a public company and (ii) for the board of SQM Salar to designate a committee to
monitor compliance with the Contracts and to establish the regulations that will govern this committee and
its functions.

10) FINANCIAL REPORTS
351
Note 33 Events occurred after the reporting date (continued)
33.2 Disclosures on events occurring after the reporting date, continued
f. Extensive regulation regarding the return of assets upon termination of the Contracts and granting purchase
options, including: (i) the restitution of the assets that Corfo made available to SQM Salar under the
Contracts, (ii) a purchase option for all or part of the water rights that SQM Salar or its related parties currently
own or will obtain in the future, that benefit or are necessary for the exploitation, either currently or in the
future of the mining concessions included in the Contracts (the "Mining Concessions"), (iii) a free transfer to
CORFO of the easements, that benefit the Mining Concessions or the project, developed by SQM Salar,
excluding the mining easements constituted in the Salar del Carmen, (iv) a purchase option on the assets that
SQM Salar uses as productive facilities within the Mining Concessions and assets that benefit the project and
that are located within the area of the Mining Concessions and within the area of 10 kilometers from the limit
of the Mining concessions, (v) a purchase option on the mining concessions that SQM Salar or its related
companies currently constitute or will constitute in the future within the area of 2 kilometers from the limit
of the Mining Concessions.
g. An option for SQM Salar to sell to CORFO the facilities that are necessary to increase the additional
production and operation capacity related to the increased lithium quota. The exercise price of this option is
the replacement value of the facilities including its economic depreciation.
h. An option for CORFO to request from SQM the evaluation of a joint project with a state company for the
joint exploitation of mining property in the Salar de Maricunga. SQM commits to participate in good faith in
this process, and if there is no agreement for the project after 4 years, SQM will not be obligated to continue
such negotiations.
i. SQM, SQM Salar and SQM Potasio S.A. are prohibited to (i) sell lithium brine extracted within the Mining
Concessions, (ii) alienate and obstruct in any way, and enter into any act or contract that affects the restitution
of the assets indicated in letter (f) above, (iii) extract brine from its mining rights area within 10 kilometers
from the limit of the Mining Concessions, (iv) extract brine from its mining rights area within 2 kilometers
from the limit of Mining Concessions for a period of 15 years from the termination of the Contracts, and (v)
agree with other operators of the OMA mining rights of the Salar de Atacama on the ways of operating
resulting in a joint or integrated management of both production sites, therefore ensuring that SQM´s
operations will always be independent without facilitating operational information, commercial strategies,
information systems or common applications and/or personnel, conventions or price and other agreements
that by their nature may negatively affect the lease income of CORFO.

10) FINANCIAL REPORTS
352
Note 33 Events occurred after the reporting date (continued)
33.2 Disclosures on events occurring after the reporting date, continued
On February 15, 2018 the Asociación Indígena Consejo de Pueblos Atacameños and other indigenous Atacameño
communities lodged an appeal for legal protection against Corfo, the Company, SQM Salar and SQM Potasio S.A.
to rescind the Contracts on the grounds that their provisions will deprive, disturb and threaten in an illegal and
arbitrary way the constitutional rights of the appellants: the right to being equal before the law, the right to live in a
pollution-free environment, the right to develop any economic activity that is not immoral, against public order or
national security and the right to ownership in its different forms, by authorizing the amount of lithium metallic
equivalent that can be extracted, processed and sold to be increased to 349,553 metric tons, such extraction being
from land the appellants consider to be their ancestral property. On February 16, 2018, a number of persons
belonging to the Atacameño people also lodged an appeal to rescind the contracts for alleged threats to their rights
to life and physical and psychic integrity, equality before the law and the right to live in a pollution-free environment.
These lawsuits are pending the consideration and subsequent resolution by the Court of Appeals in Santiago.
In a board meeting on January 24, 2018, Mrs. Joanne L. Boyes and Mr. Robert A. Kirkpatrick presented their
resignation from their positions as directors of the Company. In the same session, the Board of Directors of the
Company agreed to designate Mrs. Boyes as replacement, Mr. Darryl Stann who will also become a board member
of the Company and a member of the Corporate Governance Committee.
On January 26, 2018, SQM and its subsidiaries SQM Salar S.A. and SQM Nitrates S.A. (the "Companies"), have
reached an agreement with the Public Prosecutor to put an end to the investigation of the alleged responsibility of
the Companies´ for the lack of supervision with respect to the payments to suppliers and entities that may have had
links with the politically exposed persons between 2008 and 2015. This deferred prosecution agreement (suspensión
condicional) has been proposed by the Public Prosecutor, accepted by the Companies and approved by the 8th Court
of Santiago.
Under the deferred prosecution agreement, the Companies have not admitted responsibility in the matter subject to
the investigation.
The agreement, approved by the Court, implies that the Companies must pay an aggregate amount of (i) MUS$1,464
to the Chilean State, and (ii) MUS$2.684 to various charitable organizations. In addition, the Companies must
provide the Public Prosecutor with a report on the enhancements to their compliance program, implemented in recent
years, with special emphasis on the incorporation of best practices in various jurisdictions.

10) FINANCIAL REPORTS
353
Note 33 Events occurred after the reporting date (continued)
33.2 Disclosures on events occurring after the reporting date, continued
In extraordinary board session of February 19, 2018, SQM informs that, as communicated earlier, in its ordinary
board meeting on January 24, 2018, Joanne L. Boyes and Robert A. Kirkpatrick presented their resignation from the
positions as directors of SQM. In the same session, the board of directors agreed to appoint Darryl Stann as the
replacement of Joanne L. Boyes.
In the extraordinary board meeting today, Mark F. Fracchia was appointed as the replacement of Robert A.
Kirkpatrick.
As of the date of this report preparation, the modification of the bond line registered under number 563 and referred
to in Note 10.4 e) is in the revision process by the Commission for the Financial Market, which has required certain
rectifications to the documents originally presented by the Company. The final approval is expected to occur within
the first quarter of the year, and the placement of bonds will take place within the first half of 2018.
Likewise, between the end of 2017 and the preparation of this report, the company has been preparing the
documentation to request the modification of the bond line registered in the Securities Registry maintained by the
Commission for the Financial Market dated February 14, 2012 under number 700. The purpose of this amendment
is the same as that of line 563, with the idea of placing bonds for up to UF 3 million with a maturity of 20 years. It
is expected that the request for amendment will be reviewed by the Commission for the Financial Market within the
first quarter of the year.
Once approved by the Commission for the Financial Market, the bonds will be issued under the modified line and
placed through direct private placement.
Management is not aware of any significant events that occurred between December 31, 2017 and the date of
issuance of these consolidated financial statements that may significantly affect them.
33.3 Detail of dividends declared after the reporting date
At the closing date of the financial statements, there are no dividends declared after the reporting date.

10) FINANCIAL REPORTS
354
Report of Accounting Inspectors

10) FINANCIAL REPORTS
355
Reasoned Analysis of the Financial Situation
1. Analysis of the Financial Statements
Reasoned analysis of the consolidated financial statements for the year ended December 31, 2017 (in millions
of U.S. dollars).
Statement of Financial Position
(in millions of U.S. dollars) At December 31, At December 31,
2017 2016
Total current assets 2,466.3 2,329.9
Cash and cash equivalents 630.4 514.7
Other current financial assets 367.0 289.2
Accounts receivable (1) 506.0 451
Inventories 902.1 993.1
Other 60.8 81.9
Total non-current assets 1,830.0 1,888.1
Other non-current financial assets 62.9 34.1
Investments in related parties 126.4 113.1
Property, plant and equipment 1,437.2 1,534.80
Other non-current assets 203.5 206.1
Total Assets 4,296.2 4,218.00
Total current liabilities 748.0 580.3
Other current financial liabilities 220.3 179.1
Other 527.7 401.2
Total non-current liabilities 1,300.7 1,330.4
Other non-current financial liabilities 1,031.5 1,093.4
Other 269.2 236.9
Equity before minority interest 2,187.8 2,246.1
Minority interest 59.6 61.2
Total Equity 2,247.5 2,307.3
Total Liabilities and Equity 4,296.2 4,218.0
Liquidity (2) 3.3 4.0
(1) Trade and other receivables, current + Trade receivables due from related parties, current
(2) Current assets / Current liabilities

10) FINANCIAL REPORTS
356
1.1 Analysis of the Consolidated Statement of Financial Position
As of December 31, 2017, the Company’s total assets amount to MUS$4,296.2, representing an increase of approximately 2%
compared to MUS$4,218.0 obtained as of December 31, 2016. Such difference between both periods is mainly the result of
the variance in the following captions:
Current assets increase by approximately 6%, from MUS$2,329.9 recorded at the end of the prior year to MUS$2,466.3 in the
current period.
Cash and cash equivalents increased by MUS$115.7 (22%) as of December 31, 2017 amounting to MUS$630.4. The
detail of this caption is disclosed in Note 7.
Other current financial assets increased by MUS$77.8 (27%) as of December 31, 2017 amounting to MUS$367.0. The
detail of the caption is disclosed in Note 10.
Accounts receivable increased by MUS$55.0 (12%) as of December 31, 2017 amounting to MUS$506.0. The detail of
this caption is disclosed in Notes 9 and 10.
Current inventories decreased by MUS$91.0 (9%) as of December 31, 2017 amounting to MUS$902.1. The detail of this
caption is disclosed in Note 8.
Non-current assets decreased by approximately 3%, from MUS$1,888.1 recorded at the end of prior year, to MUS$1,830.0
for the current quarter.
Property, plant and equipment decreased by MUS$97.6 (6%), as of December 31, 2017 amounting to MUS$1,437.2. The
detail of this caption is disclosed in Note 14.
As of December 31, 2017, the Company’s total liabilities amount to MUS$2,048.8, representing an increase of approximately
7% compared to MUS$1,910.7 recorded as of December 31, 2016, Such difference is mainly generated by changes in the
following captions:
Current liabilities increased by approximately 29%, from MUS$580.3 recorded at the end of December of the prior year to
MUS$748.0 for the current quarter.
Other current financial liabilities increased by MUS$41.2 (23%) as of December 31, 2017 amounting to MUS$220.3.
The detail of this caption is disclosed in Note 10.
Other current non-financial liabilities increased by MUS$126.5 (32%) as of December 31, 2017 amounting to
MUS$527.7. The detail of this caption is disclosed in Notes 9, 10, 15, 18 and 27.
Non-current liabilities decreased by approximately 2%, from MUS$1,330.4 recorded at the end of the prior year, to
MUS$1,300.7 for the current quarter.
Other non-current financial liabilities decreased by MUS$61.9 (6%) closing at December 31, 2017 amounting to
MUS$1,031.5.
The consolidated financial statements of Sociedad Química y Minera de Chile S,A, and Subsidiaries have been prepared in
accordance with International Financial Reporting Standards (hereinafter “IFRS”) and represent the comprehensive, explicit

10) FINANCIAL REPORTS
357
and unreserved adoption of International Financial Reporting Standards as issued by the International Accounting Standard
Board (IASB), Should there be any discrepancies between IFRS and the instructions issued by the Chilean Comission for the
Financial Market (CMF) the latter shall prevail.
These consolidated financial statements fairly reflect the Company’s equity and financial position and the results of its
operations, changes in in the statement of income and expenses recognized and cash flows, which have occurred in the year
then ended.
The valuation of the main assets and liabilities has been performed as follows:
Inventories: The Company states inventories for the lower of cost and net realizable value. The cost price of finished
products and products in progress includes the direct cost of materials and, when applicable, labor costs, indirect costs
incurred to transform raw materials into finished products, and general expenses incurred in carrying inventories to their
current location and conditions. The method used to determine the cost of inventories is weighted average cost.
Commercial discounts, rebates obtained, and other similar entries are deducted in the determination of the acquisition
price.
The net realizable value represents the estimate of the sales price, less all finishing estimated costs and costs which will
be incurred in commercialization, sales, and distribution processes.
The Company conducts an evaluation of the net realizable value of inventories at the end of each year, recording an
estimate with a charge to income when these are overstated. When a situation arises whereby the circumstances, which
previously caused the rebate to cease to exist, or when there is clear evidence of an increase in the net realizable value
due to a change in the economic circumstances or prices of main raw materials, the estimate made previously is modified.
The valuation of obsolete, impaired or slow-moving products relates to their net estimated, net realizable value.
The provisions for technical specification on the Company’s inventories have been made based on a technical study
covering different variables affecting products in stock (density, moist, among others).
Raw materials, supplies and materials are recorded at the lower of acquisition cost or market value. Acquisition cost is
calculated according to the annual average price method.
Property, plant and equipment: Tangible property, plant and equipment assets are stated at acquisition cost, net of the
related accumulated depreciation and impairment losses that they have experienced.

10) FINANCIAL REPORTS
358
1.2 Consolidated Statement of Comprehensive Income
Statement of Income(1)
(in millions of U.S. dollars) Fourth Quarter Accumulated at December
31,
2017 2016 2017 2016
Revenues 574.8 553.8 2,157.3 1,939.3
Specialty plant nutrition (2) 185.9 136.8 697.3 623.9
Iodine and derivatives 60.8 56.1 252.1 231.1
Lithium and derivatives 179.4 176.8 644.6 514.6
Industrial chemicals 54.6 60.8 135.6 104.1
Potassium chloride & potassium sulfate 78.4 107.3 379.3 403.3
Other revenue 15.7 16.1 48.5 62.2
Cost of sales (305.9) (288.1) (1,162.5) (1,089.9)
Depreciation and amortization (52.8) (60.9) (232.4) (238.4)
Gross margin 216.1 204.8 762.5 611.0
Administrative expenses (28.6) (25.8) (101.2) (88.4)
Finance costs (12.3) (12.3) (50.1) (57.5)
Finance income 4.7 3.2 13.5 10.1
Foreign currency translation differences (1.9) 1.0 (1.3) 0.5
Other (23.7) (36.6) (28.8) (60.8)
Profit (loss) before taxes 154.3 134.4 594.6 414.9
Income tax (42.8) (51.8) (166.2) (133.0)
Profit before minority interest 111.5 82.5 428.4 281.9
Minority interest (1.0) (1.7) (0.7) (3.6)
Profit for the year 110.5 80.9 427.7 278.3
Earnings per share (US$) 0.42 0.31 1.63 1.06
(1) A reclassification between income and costs is considered in the accumulated information
(2) Includes other specialty plant nutrition

10) FINANCIAL REPORTS
359
1.2.1 Analysis by business area and market variances
Specialty plant nutrition
Revenues from the SPN business line for the twelve months ended December 31, 2017 totaled US$697.3 million, an increase
of 11.8% compared to $623.9 million reported for the twelve months ended December 31, 2016.
Fourth quarter 2017 revenues reached US$185.9 million, 35.9% higher than the US$136.8 million reported in the fourth quarter
of 2016.
Sales volumes during 2017 for this business line increased almost 15% compared to 2016, due to demand growth and limited
supply from our competitors, we expect to see similar sales volumes in 2018. Average prices during 2017 decreased
approximately 2.7% compared to prices reported last year. We believe that the potassium nitrate market grew around 5% last
year and that it will continue its growth at a similar rate this year. We remain confident in the future of the potassium nitrate
and specialty fertilizer markets, and will continue to invest to develop and expand the market.
SPN gross profit accounted for approximately 19% of SQM’s consolidated gross profit for the twelve months ended December
31, 2017.
Iodine and derivatives
Revenues from sales of iodine and derivatives during the twelve months ended December 31, 2017 were US$252.1 million,
an increase of 9.1% compared to US$231.1 million generated for the twelve months ended December 31, 2016.
Revenues from sales of iodine and derivatives for the fourth quarter of 2017 amounted to US$60.8 million, an increase of
8.4% compared to US$56.1 million achieved during the fourth quarter of 2016.
Higher iodine revenues were the result of higher sales volumes. Average prices were approximately US$20/kg, a decrease of
about 12.3% compared to average prices seen during 2016. During the second half of 2017, we saw a slight improvement in
iodine prices. Prices during the second half of the year were approximately 5% higher than prices reported during the first
half of 2017. We believe that that trend will continue into 2018 with average prices slightly higher than in 2017.
Our sales volumes during 2017 totaled 12.7k MT/year, approximately 24.4% higher than sales volumes seen during 2016.
We believe that global iodine demand grew slightly in 2017 and we increased our market share to over 35%. We started
working on the capacity expansion project at our iodine facilities in Nueva Victoria and at the end of 2017 the effective
capacity of all of our facilities reached 11,000 MT/year. We expect to complete our expansion during the second half of
2018, bringing our total effective capacity to 14,000 MT/year.
Gross profit for the Iodine and Derivatives segment accounted for approximately 7% of SQM’s consolidated gross profit for
the twelve months ended December 31, 2017.
Lithium and derivatives
Revenues from lithium and derivatives totaled US$644.6 million during the twelve months ended December 31, 2017, an
increase of 25.3% compared to the US$514.6 million for the twelve months ended December 31, 2016.

10) FINANCIAL REPORTS
360
Lithium and derivatives revenues increased 1.5% during the fourth quarter of 2017 compared to the fourth quarter of 2016.
Total revenues amounted to US$179.4 million during the fourth quarter of 2017, compared to US$176.8 million in the fourth
quarter of 2016.
The lithium market continued its strong growth in 2017, with total demand growth reaching close to 17% according to our
estimates. Supply did not keep the same pace, and therefore market conditions remained tight and prices increased significantly
during the year.
This pricing trend, given that the sales volumes stayed at the same level as in 2016, impacted our revenues for 2017 by almost
US$130 million. Average prices in this business line increased another 25% compared to average prices seen during 2016. We
believe that the market price will remain strong in the first half of the year with the potential to stabilize or slightly decrease
in the second half of the year. However, we still expect averages prices to be higher in 2018 compared to the average prices
seen in 2017.
As we continue to move forward with our expansion from 48,000 MT/year to 70,000 MT/year in the Salar de Atacama, we
believe our 2018 sales volumes in the business line should increase by approximately 5,000 MT as we ramp up the current
production. These additional sales volumes should be seen during the second half of 2018.
Gross profit for the Lithium and Derivatives segment accounted for approximately 60% of SQM’s consolidated gross profit
for the twelve months ended December 31, 2017.
Potassium: Potassium chloride and potassium sulfate
Revenues in the potassium chloride and potassium sulfate business line were impacted by reduced sales volumes in 2017. As
anticipated, sales volumes decreased over 12% during 2017 as we focused our production efforts in the Salar de Atacama on
increasing lithium yields. We believe we could see a decrease in potassium chloride and potassium sulfate production in
2018, as we further expand our lithium production in the Salar de Atacama, and potassium chloride sales volumes could
decrease in the future.
As estimated, 2017 global potash demand increased an additional 4 million tons, as result, potash prices increased slightly
during the year. Average prices in the potassium chloride and potassium sulfate business line increased approximately 7.4%
during 2017 when compared to 2016, reaching US$282/MT. During the fourth quarter 2017 average prices increased almost
7.5% when compared to the third quarter 2017.
Gross profit for Potassium Chloride and Potassium Sulfate business line accounted for approximately 9% of SQM’s
consolidated gross profit for the twelve months ended December 31, 2017.
Industrial chemicals
Industrial chemicals revenues for the twelve months ended December 31, 2017 reached US$135.6 million, a 30.2% increase
compared to US$104.1 million for the twelve months ended December 31, 2016.
Revenues for the fourth quarter of 2017 totaled US$54.6 million, a decrease of 10.2% compared to US$60.8 million for the
fourth quarter of 2016.

10) FINANCIAL REPORTS
361
Revenues in the industrial chemicals business line increased as a result of higher sales volumes. These higher sales volumes
were related to increased sales volumes of solar salts, which totaled almost 88,000 MT this year, in line with our estimated
volumes for the year. Solar salts sales depend on the ramp up of the concentrated solar power plants (CSP) projects and we
expect our sales volumes in 2018 to be around 50,000 MT. Prices during 2017 remained flat compared to 2016.
Gross profit for the Industrial Chemicals segment accounted for approximately 6% of SQM’s consolidated gross profit for the
twelve months ended December 31, 2017.
Other commodity fertilizers and other revenues
Revenues from sales of other commodity fertilizers and other income reached US$48.5 million in the twelve months ended
December 31, 2017, lower than the US$62.2 million for the twelve months ended December 31, 2016.
Financial Information
Capital investments
Capex during 2017 reached approximately US$172 million, and the majority of these expenditures were related to
maintenance, current expansion projects related to nitrate and lithium carbonate and hydroxide production. That also included
approximately US$24 million investment in Minera Exar project and US$25 million in Mt. Holland project.
For 2018, the Board approved a total Capex framework of approximately US$517 million, of which US$360 will be invested
in Chile, including maintenance and production capacity expansions of lithium, iodine and potassium nitrate business lines.
We have revised the investment required to increase our potassium nitrate capacity to 1.5 million MT, reducing total capex to
US$50 million. We also expect to invest approximately US$157 million in projects outside Chile.
Administrative expenses
Administrative expenses totaled US$101.2 million (4.7% of revenues) for the twelve months ended December 31, 2017,
compared to US$88.4 million (4.6% of revenues) recorded during the twelve months ended December 31, 2016.
Net finance costs
Net financial expenses for the twelve months ended December 31, 2017 were US$36.6 million, compared to US$46.9 million
recorded for the twelve months ended December 31, 2016.
Income tax expense
Income tax expense reached US$166.2 million for the twelve months ended December 31, 2017, representing an effective tax
rate of 27.9%, compared to an income tax expense of US$133.0 million during the twelve months ended December 31, 2016.
The Chilean corporate tax rate was 25.5% during the 2017 period and 24% during the 2016 period.
Other
The EBITDA margin was approximately 41.4% for the twelve months ended December 31, 2017. EBITDA margin for the
twelve months ended December 31, 2016 was approximately 39.2%. The EBITDA margin for the fourth quarter of 2017 was
approximately 41.8%.

10) FINANCIAL REPORTS
362
Chile 8%
Latin America and the
Caribbean 12%
Europe 21%
North America 22%
Asia and others 37%
Geographical Revenue Distribution

10) FINANCIAL REPORTS
363
2. Financial ratios
Liquidity ratios 12-31-2017 09-30-2017
Current liquidity Times 3.30 3.79 Current assets
Current liabilities
Acid test Times 2.09 2.31 (Current assets – Inventories)
Current liabilities
Indebtedness ratios 12-31-2017 09-30-2017
Indebtedness ratio % 94 86
Liabilities
Equity attributable to owners of the
Parent
Short-term debt to total debt ratio % 36.5 32.7 Current liabilities
Total debt
Long-term debt to total debt ratio % 63.5 67.3 Non-current liabilities
Total debt
Activity ratios 12-31-2017 09-30-2017
Total assets MUS$ 4,296 4,145
Inventory turnover Times 1.55 1.51 Cost of sales LTM
Inventories
Inventory permanence Days 269 305 360 days
Inventory turnover
Profitability ratios 12-31-2017 09-30-2017
Earnings per share Times 1.63 1.52 Net profit (loss) LTM
Shares subscribed
Return on equity % 19.1 17.7 Net profit (loss) LTM
Equity
Return on assets % 21.3 21.1 Net profit (loss) LTM
Assets

10) FINANCIAL REPORTS
364
2.1 Analysis of Financial Indicators
Liquidity:
Current liquidity: the decrease in the ratio can be explained because although there was an increase in Current Assets (≈
+ US$116 million, 5%), there was also an increase in Current Liabilities (≈ + US$128 million, 21%), resulting in a lower
ratio value. The main variation of the assets was seen in the increase by almost US$110 million of Cash and Cash
Equivalents. On the liabilities side, the main change was seen in the Other Financial Liabilities, which increased by
approximately US$87 million, mainly due to the contracting of new short-term debt for investment and accounts
receivable, which increased by almost US$27 million.
Acid test: when comparing the last periods, it can be noted that there was a US$3.8 million Inventory decrease, making
the dividend ratio lower, which, together with the aforementioned proportional increases, leads to a lower ratio compared
to the previous period. However, it can be seen that in this case the ratio decreased in a smaller proportion to the previous
ratio, this is due to the fact that by subtracting the inventory from the equation (≈US$1.400 million), the dividend ratio
increase is greater than that of the previous ratio, which causes the variation to be lower.
Indebtedness:
Indebtedness ratio: the ratio increased because there was an increase in current liabilities for the aforementioned reasons
of approximately US$128 million, while the equity remained almost constant, which led to an increase in the proportion
between both values.
Proportional amount of debt: due to the variations leading to an increase in Current Liabilities explained above, it can be
concluded directly that these ratios varied as they did, since, despite the increase in Total Liabilities, it did so in a smaller
proportion than its composing parts.
Activities:
Inventory turnover and permanence: an increase in the inventory rotation can be seen mainly due to the fact that the
inventory decreased by ≈US$3.8 million (≈0%), while the cost of sales decreased by ≈US$12 million (≈3%). It should
be noted that the Sales revenues increased during the period, mainly due to the increase in prices of all products and the
increase in sales volumes of the business lines with higher margin and decrease in others with lower margin, which led
to lower cost of sales. By increasing the dividend proportionally in greater quantity than the ratio divider, a higher ratio
is therefore obtained. Due to this increase, a decrease in the permanence of inventory by 5 days was achieved, since both
ratios are inversely proportional.
Profitability:
Earnings per share: recording the same number of shares, because of an increase in profit for the period by approximately
US$112 million, an increase in this ratio is generated. For further details, please, see the statement of income for the
corresponding periods.
ROE: The increase in this ratio was due to an increase in profit for the period and a decrease in equity (US$4 million).
ROA: The increase in this ratio was due to the increase in the annual gross profit in greater proportion than that of the
Assets.
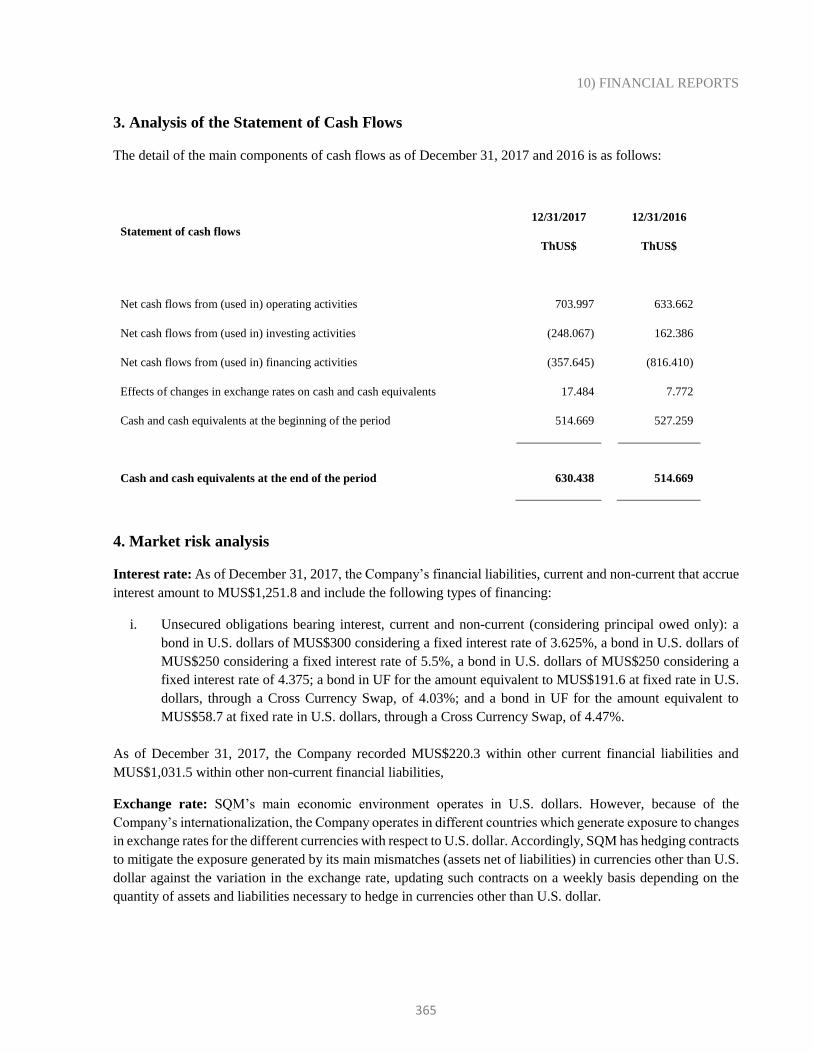
10) FINANCIAL REPORTS
365
3. Analysis of the Statement of Cash Flows
The detail of the main components of cash flows as of December 31, 2017 and 2016 is as follows:
Statement of cash flows
12/31/2017
ThUS$
12/31/2016
ThUS$
Net cash flows from (used in) operating activities 703.997 633.662
Net cash flows from (used in) investing activities (248.067) 162.386
Net cash flows from (used in) financing activities (357.645) (816.410)
Effects of changes in exchange rates on cash and cash equivalents 17.484 7.772
Cash and cash equivalents at the beginning of the period 514.669 527.259
Cash and cash equivalents at the end of the period 630.438
514.669
4. Market risk analysis
Interest rate: As of December 31, 2017, the Company’s financial liabilities, current and non-current that accrue
interest amount to MUS$1,251.8 and include the following types of financing:
i. Unsecured obligations bearing interest, current and non-current (considering principal owed only): a
bond in U.S. dollars of MUS$300 considering a fixed interest rate of 3.625%, a bond in U.S. dollars of
MUS$250 considering a fixed interest rate of 5.5%, a bond in U.S. dollars of MUS$250 considering a
fixed interest rate of 4.375; a bond in UF for the amount equivalent to MUS$191.6 at fixed rate in U.S.
dollars, through a Cross Currency Swap, of 4.03%; and a bond in UF for the amount equivalent to
MUS$58.7 at fixed rate in U.S. dollars, through a Cross Currency Swap, of 4.47%.
As of December 31, 2017, the Company recorded MUS$220.3 within other current financial liabilities and
MUS$1,031.5 within other non-current financial liabilities,
Exchange rate: SQM’s main economic environment operates in U.S. dollars. However, because of the
Company’s internationalization, the Company operates in different countries which generate exposure to changes
in exchange rates for the different currencies with respect to U.S. dollar. Accordingly, SQM has hedging contracts
to mitigate the exposure generated by its main mismatches (assets net of liabilities) in currencies other than U.S.
dollar against the variation in the exchange rate, updating such contracts on a weekly basis depending on the
quantity of assets and liabilities necessary to hedge in currencies other than U.S. dollar.

10) FINANCIAL REPORTS
366
To ensure the difference between its assets and liabilities, as of December 31, 2017, the Company had the
following derivative contracts (as the sum of the absolute value of their notional values): MUS$84 in Chilean
peso/U.S. dollar derivative contracts, MUS$33.3 in Euro/U.S. dollar derivative contracts, MUS$20 in South
African rand/U.S. dollar and MUS$19.3 in other currencies.
In addition, the Company had MUS$550 in derivative contracts to hedge its investments in term deposits in
Chilean pesos.
To hedge its expected net cash flows in Chilean pesos related to the businesses associated with the trading of
fertilizers in Chile, the Company did not maintain any Chilean peso/U.S. dollar derivative contract as of
December 31, 2017. To hedge its expected net cash flows in Euros the Company did not maintain any Euro/U.S.
dollar derivative contracts as of December 31, 2017.
Commodity prices: The main commodities the Company uses are oil (petroleum) as fuel and in all its forms,
Currently, the Company has no hedging contracts hedging international changes in prices, However, the
Company has long-term contracts for energy supply.
As indicated in the Company’s Annual Report, markets in which the Company operates are unpredictable,
exposed to significant fluctuations in supply and demand, and price high volatility. Additionally, the supply of
certain fertilizers or chemicals, including certain products which the Company trades, vary mainly depending on
the production of top producers and their related business strategies. Accordingly, the Company cannot forecast
with certainty changes in demand, responses from competitors or fluctuations in the final price of its products.
These factors can lead to significant impacts on the Company’s product sales volumes, financial position and
share price.
Note 4 of the Consolidated Financial Statements as of December 31, 2017 includes a detailed analysis of risks
associated with the Company’s businesses.

10) FINANCIAL REPORTS
367
10) B) SUMMARY FINANCIAL STATEMENTS
The summary consolidated or individual financial statements of all companies mentioned in CMF (ex)SVS
General Rule No. 346, Section I, Letter a.4.2 is provided below. The complete financial statements of such
companies are available to the public in our offices and at the offices of the CMF (ex)SVS.

10) FINANCIAL REPORTS
SQM POTASIO S.A. AND SUBSIDIARIES: SUMMARY FINANCIAL STATEMENTS
368
Summary Consolidated Classified Statements of Financial Position
Assets As of December 31, 2017
ThUS$
As of December 31, 2016
ThUS$
Current assets
Cash and cash equivalents 112,279 65,633
Trade receivables due from related parties,
current
569,033 605,444
Current inventories 185,060 190,206
Other current assets 22,529 66,553
Total current assets 888,901 927,836
Non-current assets
Property, plant and equipment 762,106 809,331
Other non-current assets 171,236 136,781
Total non-current assets 933,342 946,112
Total assets 1,822,243 1,873,948
Liabilities and Equity
Liabilities
Current liabilities
Other current financial liabilities 40,144 20,948
Trade payables due to related parties, current 202,843 559,566
Other current liabilities 136,997 139,469
Total current liabilities 379,984 719,983
Non-current liabilities
Deferred tax liabilities 185,799 196,263
Other non-current liabilities 4,157 2,402
Total non-current liabilities 189,956 198,665
Total liabilities 569,940 918,648
Equity
Equity attributable to owners of the Parent 1,086,589 835,841
Non-controlling interests 165,714 119,459
Total equity 1,252,303 955,300
Total liabilities and equity 1,822,243 1,873,948

10) FINANCIAL REPORTS
SQM POTASIO S.A. AND SUBSIDIARIES: SUMMARY FINANCIAL STATEMENTS
369
Summary Consolidated Statements of Income by Function
January to December
2017 2016
ThUS$ ThUS$
Revenue 989,783 983,229
Cost of sales (506,059) (538,890)
Gross profit 483,724 444,339
Profit (loss) from operating activities 461,166 430,888
Profit (loss) before taxes 468,750 419,514
Income tax expense, continuing operations (123,111) (113,342)
Profit for the year 345,639 306,172
Profit attributable to
Owners of the Parent 282,442 252,321
Non-controlling interests 63,197 53,851
Profit for the year 345,639 306,172
Earnings per share
Common shares
Basic earnings per share (US$ per share) 2.259 2.001
Diluted common shares
Diluted earnings per share (US$ per share) 2.259 2.001
Summary Consolidated Statements of Comprehensive Income
January to December
2017 2016
ThUS$ ThUS$
Profit for the year 345,639 306,172
Other comprehensive income (4.477) 67
Total comprehensive income 341,162 306,239
Comprehensive income attributable to
Owners of the Parent 277,869 250,799
Non-controlling interests 63,293 55,440
Total comprehensive income 341,162 306,239

10) FINANCIAL REPORTS
SQM POTASIO S.A. AND SUBSIDIARIES: SUMMARY FINANCIAL STATEMENTS
370
Summary Consolidated Statements of Cash Flows
12/31/2017 12/31/2016
ThUS$ ThUS$
Net cash generated from (used in) operating activities 137,136 555,237
Net cash generated from (used in) investing activities (83,405) (84,454)
Net cash generated from (used in) financing activities (10,000) (487,564)
Net increase (decrease) in cash and cash equivalents before the effect of changes
in the exchange rate 43,731 (16,781)
Effects of exchange rate fluctuations on cash held 2,915 845
Net (decrease) increase in cash and cash equivalents 46,646 (15,936)
Cash and cash equivalents at beginning of period 65,633 81,569
Cash and cash equivalents at end of period 112,279 65,633

10) FINANCIAL REPORTS
SQM POTASIO S.A. AND SUBSIDIARIES: SUMMARY FINANCIAL STATEMENTS
371
Summary Consolidated Statements of changes in Equity
2017
Share capital Other reserves
Retained
earnings
Equity
attributable to
owners of the
Parent
Non-controlling
interests Total
ThUS$ ThUS$ ThUS$ ThUS$ ThUS$ ThUS$
Equity at beginning of the year 257,010 8,221 570,610 835,841 119,459 955,300
Profit for the year - - 282,442 282,442 63,197 345,639
Other comprehensive income - (4,573) - (4,573) 96 (4,477)
Comprehensive income - (4,573) 282,442 277,869 63,293 341,162
Dividends - 2,914 (30,035) (27,121) (17,038) (44,159)
Increase (decrease) due to transfers and other
changes - (1,659) 252,407 250,748 46,255 297,003
Equity As of December 31, 2017 257,010 6,562 823,017 1,086,589 165,714 1,252,303
2016
Share capital Other reserves
Retained
earnings
Equity
attributable to
owners of the
Parent
Non-controlling
interests Total
ThUS$ ThUS$ ThUS$ ThUS$ ThUS$ ThUS$
Equity at beginning of the year 257,010 8,057 637,819 902,886 152,165 1,055,051
Profit for the year - - 252,322 252,332 53,851 306,173
Other comprehensive income - 93 - 93 (26) 67
Comprehensive income - 93 252,322 252,415 53,825 306,240
Dividends - - (319,531) (319,460) (86,532) (405,991)
Increase (decrease) due to transfers and other
changes - 71 (67,209) (67,045) (32,706) (99,751)
Equity As of December 31, 2016 257,010 8,221 570,610 835,841 119,459 955,300

10) FINANCIAL REPORTS
SQM POTASIO S.A. AND SUBSIDIARIES: SUMMARY FINANCIAL STATEMENTS
372
Detail of related parties and related party transactions
Transactions between the Parent and its subsidiaries are part of the Company's common transactions. Their
conditions are those customary for this type of transactions in respect of terms and market prices. In addition,
these have been eliminated in consolidation and are not detailed in this note.
Maturity terms for each case vary by virtue of the transaction giving rise to them.
As of December 31, 2017 and December 31, 2016, there are no allowances for doubtful accounts related to
balances pending of transactions with related parties as there is no impairment in them.
As of December 31, 2017 and December 31, 2016, the detail of transactions with related parties is as follows:
Tax ID No, Company Nature
Country of
origin Transaction 12/31/2017 12/31/2016
ThUS$ ThUS$
Foreign SQM Africa Pty. Ltd.. Other related parties
South
Africa Sale of products 25,813 28,932
77.557.430-5 Sales de Magnesio Ltda. Associate Chile Sale of products 39 1,343
77.557.430-5 Sales de Magnesio Ltda. Associate Chile Dividends - 402
Foreign SQM Ecuador S.A. Other related parties Ecuador Sale of products 9,885 12,236
Foreign SQM Europe N.V. Other related parties Belgium Sale of products 462,351 401,107
Foreign SQM Europe N.V. Other related parties Belgium Services received - 12
96.592.190-7 SQM Nitratos S.A. Associate Chile Current account interest 7,044 914
96.592.190-7 SQM Nitratos S.A. Associate Chile Services provided 1,421 2,088
79.947.100-0 SQM Industrial S.A. Common parent Chile Sale of products 86,108 96,037
79.947.100-0 SQM Industrial S.A. Common parent Chile Sale of fixed asset 141 47
79.947.100-0 SQM Industrial S.A. Common parent Chile Current account interest 4,487 4,327
79.947.100-0 SQM Industrial S.A. Common parent Chile Services received 1,200 1,821
79.947.100-0 SQM Industrial S.A. Common parent Chile Services provided 1,200 1,821
79.947.100-0 SQM Industrial S.A. Common parent Chile Dividends - 319
93.007.000-9 SQM S.A. Parent Chile Current account interest 1,884 1,359
93.007.000-9 SQM S.A. Parent Chile Current account interest 8,635 18,218
93.007.000-9 SQM S.A. Parent Chile Services provided 1,507 2,145
93.007.000-9 SQM S.A. Parent Chile Fixed assets purchase 181 -
93.007.000-9 SQM S.A. Parent Chile Services received 926 1,669
Foreign SQM North America Corp. Other related parties
United
States Sale of products 47,276 64,116
Foreign SQM North America Corp. Other related parties
United
States Current account interest 146 -
79.768.170-9 Soquimich Comercial S.A. Other related parties Chile Sale of products 12,387 16,620
Foreign Ajay No rth America Associate
United
States Dividends 1,123 3,759
Foreign Kowa Company Ltd. Other related parties Japan Sale of products - 68,501
79.770.780-5 SIT S.A. Other related parties Chile Current account interest 1,345 1,002
Foreign
SQM Comercial de México
S.A. de C.V. Other related parties México Sale of products 40,343 36,629
Foreign SQM Iberian S.A. Other related parties Spain Sale of products 20,107 28,438
Foreign
SQM Vitas Brasil
Agroindustria Other related parties Brazil Sale of products 16,561 9,653
Foreign SQM Vitas Perú S.A.C. Other related parties Perú Sale of products 8,180 8,278
Foreign Charlle SQM Thailandia Other related parties Thailand Sale of products - 143
Foreign SQM Thailand Limited Other related parties Thailand Sale of products 1,260 4,417
Foreign SQM Japan Co. Ltd. Subsidiary Japan Sale of products 106,402
Foreign Minera Exar Joint venture Argentina Loan 11,000

10) FINANCIAL REPORTS
SQM POTASIO S.A. AND SUBSIDIARIES: SUMMARY FINANCIAL STATEMENTS
373
Trade receivables due from related parties, current:
Tax ID N° Company Nature Country of
origin Currency
12/31/2017 12/31/2016
ThUS$ ThUS$
Foreign
Nitratos Naturais Do Chile Ltda.
Other related
parties Brazil US$ 2,358 2,358
Foreign
RS Agro Chemical Trading
Corporation A.V.V.
Other related
parties Aruba US$ 8 8
Foreign
Soquimich European Holding
B.V.
Other related
parties Dutch Antille US$ 69,741 63,770
79.770.780-5
Serv. Integrales de Tránsito y
Transf. S.A. Associate Chile US$ 121 117
Foreign SQM Thailand Limited
Other related
parties Tailandia US$ 5,677 5,730
Foreign SQM Africa Pty Ltd.
Other related
parties South Africa US$ 26,641 32,506
Foreign SQM Corporation N.V.
Other related
parties Dutch Antille US$ 3,575 3,568
Foreign SQM Ecuador S.A.
Other related
parties Ecuador US$ 9,885 12,979
Foreign SQM Europe N.V.
Other related
parties Belgium US$ 160,141 168,526
Foreign SQM Iberian S.A.
Other related
parties Spain US$ 13,551 25,271
79.947.100-0 SQM Industrial S.A. Matriz Común Chile US$ 121,486 104,468
96.592.190-7 SQM Nitratos S.A. Associate Chile US$ 40,018 -
Foreign SQM North America Corp. Associate United States US$ 6,984 19,587
Foreign SQM Perú S.A.
Other related
parties Perú US$ 65,582 96,832
79.768.170-9 Soquimich Comercial S.A.
Other related
parties Chile US$ 1,080 1,080
Foreign
SQM Comercial de México S.A.
de C.V.
Other related
parties México US$ 6,046 6,996
Foreign Kowa Company Ltd.
Other related
parties Japan US$ 12,627 14,226
Foreign Ajay North America
Other related
parties United States US$ - 25,716
Foreign Charlee SQM Thailand Co. Ltd.
Other related
parties Thailand
US$ 23 23
77.557.430-5 Sales de Magnesio Ltda Associate Chile US$ 11,000 -
Foreign Sichuan SQM Migao Chemical
Fertilizers Co Ltda.
Other related
parties China
US$ - 12,912
Foreign SQM Vitas Brasil Agroindustria
Other related
parties Brazil
US$ 7,369 3,946
Foreign SQM Vitas Fzco Other related
parties
United Arab
Emirates US$ 65 65
Foreign SQM Vitas Perú S.A.C Other related
parties Perú
US$ 4,694 4,005
93.007.000-9 SQM S.A. Parent Chile US$ 361 755
Total as of to date 569,033 605,444
Trade payables due to related parties, current:
Tax ID N° Company Nature Country of
origin Currency 12/31/2017 12/31/2016
ThUS$ ThUS$
Foreign RS Agro Chemical Tranding Associate Aruba US$ 5,156 5,168
79.770.780-5 SIT S.A. Associate Chile US$ 11,552 31,164
Foreign SQM(Beijing) Commercial Co.Ltd. Other related parties China US$ 184 991
Foreign SQM Europe N.V. Other related parties Belgium US$ - 36
79.947.100-0 SQM Industrial S.A. Matriz Común Chile US$ 14,337 14,501
Foreign Charlee SQM(thailand) Co Other related parties Thailand US$ 23 23
93.007.000-9 SQM S.A. Matriz Chile US$ 171,585 507,683
Foreign Sacal Other related parties Argentina US$ 6 -
Total as of to date 202,843 559,566

10) FINANCIAL REPORTS
SQM INDUSTRIAL S.A. AND SUBSIDIARIES: SUMMARY FINANCIAL STATEMENTS
374
Summary Consolidated Classified Statements of Financial
Assets
As of December 31,
2017
ThUS$
As of December 31,
2016
ThUS$
Current assets
Cash and cash equivalents 211,397 179,427
Trade receivables due from related parties, current 426,095 315,842
Current inventories 880,097 1,044,201
Other current assets 75,621 172,784
Total current assets 1,593,210 1,712,254
Non-current assets
Investments in associates 86,361 75,632
Property, plant and equipment 474,878 498,565
Other non-current assets 25,550 28,722
Total non-current assets 586,789 602,919
Total assets 2,179,999 2,315,173
Liabilities and Equity
Liabilities
Current liabilities
Trade payables due to related parties, current 867,067 1,117,980
Other current liabilities 249,656 172,070
Total current liabilities 1,116,723 1,290,050
Non-current liabilities
Deferred tax liabilities 54,156 64,935
Other non-current liabilities 29,226 23,629
Total non-current liabilities 83,382 88,564
Total liabilities 1,200,105 1,378,614
Equity
Equity attributable to owners of the Parent 936,509 890,930
Non-controlling interests 43,385 45,629
Total equity 979,894 936,559
Total liabilities and equity 2,179,999 2,315,173

10) FINANCIAL REPORTS
SQM INDUSTRIAL S.A. AND SUBSIDIARIES: SUMMARY FINANCIAL STATEMENTS
375
Summary Consolidated Statements of Income by Function
January to December
2017 2016
ThUS$ ThUS$
Revenue 2,093,754 1,748,595
Cost of sales (1,911,321) (1,602,817)
Gross profit 182,433 145,778
Profit (loss) from operating activities 89,402 55,461
Profit (loss) before taxes 72,381 25,203 Income tax expense, continuing operations (24,523) (16,766)
Profit for the year 47,858 8,437
Profit attributable to
Owners of the Parent 48,988 17,261
Non-controlling interests (1,130) (8,824)
Profit for the year 47,858 8,437
January to December
2017 2016
US$ US$
Earnings per share
Common shares
Basic earnings per share (US$ per share) 0.0937 0.0165
Diluted common shares
Diluted earnings per share (US$ per share) 0.0937 0.0165

10) FINANCIAL REPORTS
SQM INDUSTRIAL S.A. AND SUBSIDIARIES: SUMMARY FINANCIAL STATEMENTS
376
Summary Consolidated Statements of comprehensive income
January to December
2017 2016
ThUS$ ThUS$
Profit for the year 47,858 8,437
Other comprehensive income (567) (2,855)
Total comprehensive income 47,291 5,582
Comprehensive income attributable to Owners of the Parent 48,516 14,625 Non-controlling interests (1,225) (9,043) Total comprehensive income 47,291 5,582
Summary Consolidated Statements of Cash Flows
12/31/2017 12/31/2016
ThUS$ ThUS$
Net cash generated from (used in) operating activities
30,909
119,153
Net cash generated from (used in) investing activities (14,675) (96,092)
Net cash generated from (used in) financing activities 16,811 (33,517)
Net increase (decrease) in cash and cash equivalents before the effect of changes
in the exchange rate 33,045
(10,456)
Effects of exchange rate fluctuations on cash held (1,075) 2,165
Net (decrease) increase in cash and cash equivalents 31,970 (8,291)
Cash and cash equivalents at beginning of period 179,427 187,718
Cash and cash equivalents at end of period 211,397 179,427

10) FINANCIAL REPORTS
SQM INDUSTRIAL S.A. AND SUBSIDIARIES: SUMMARY FINANCIAL STATEMENTS
377
Summary Consolidated Statements of Changes in Equity
2017 Share capital Other reserves Retained earnings
Equity attributable to owners of the
Parent Non-controlling
interests Total ThUS$ ThUS$ ThUS$ ThUS$ ThUS$ ThUS$
Equity at beginning of the year 715,066 (7,144) 183,008 890,930 45,629 936,559 Profit for the year) - - 48,988 48,988 (1,130) 47,858 Other comprehensive income - (472) - (472) (95) (567) Comprehensive income - (472) 48,988 48,516 (1,225) 47,291 Dividends - - - - (1,264) (1,264) Increase (decrease) due to transfers and other changes
- 563 (3,500) (2,937) 245 (2,692)
Increase (decrease) in equity - 91 45,488 45,579 (2,244) 43,335
Equity as of December 31, 2017 715,066 (7,053) 228,496 936,509 43,385 979,894
2016 Share capital Other reserves Retained earnings
Equity attributable to owners of the
Parent Non-controlling
interests Total ThUS$ ThUS$ ThUS$ ThUS$ ThUS$ ThUS$
Equity at beginning of the year 715,066 (10,872) 203,365 907,559 56,523 964,082 Profit for the year) - - 17,261 17,261 (8,824) 8,437 Other comprehensive income - (2,636) - (2,636) (219) (2,855) Comprehensive income - (2,636) 17,261 14,625 (9,043) 5,582 Dividends - - (33,517) (33,517) (1,851) (35,368) Increase (decrease) due to transfers and other changes
- 6,364 (4,101) 2,263 - 2,263
Increase (decrease) in equity - 3,728 (20,357) (16,629) (10,894) (27,523)
Equity as of December 31, 2016 715,066 (7,144) 183,008 890,930 45,629 936,559

10) FINANCIAL REPORTS
SQM INDUSTRIAL S.A. AND SUBSIDIARIES: SUMMARY FINANCIAL STATEMENTS
378
Balances and transactions with related parties
Related party disclosures
Balances pending at period-end are not guaranteed, accrue no interest and are settled in cash. No guarantees have
been delivered or received for trade and other receivables due from related parties or trade and other payables
due to related parties.
Detailed identification of the link between the Parent and subsidiary
Transactions between the Parent and its subsidiaries are part of the Company's common transactions. Their
conditions are those customary for this type of transactions in respect of terms and market prices. In addition,
these have been eliminated in consolidation and are not detailed in this note.
Maturity terms for each case vary by virtue of the transaction giving rise to them.
As of December 31, 2017 and December 31, 2016, there are no allowances for doubtful accounts related to
balances pending of transactions with related parties as there is no impairment in them.
As of December 31, 2017 and December 31, 2016, the detail of transactions with related parties is as follows:
Tax ID No. Company Nature Country of origin Transaction 12/31/2017
ThUS$
12/31/2016
ThUS$
96.592.190-7 SQM Nitratos S.A. Common parent Chile Purchase products 100,626 96,235
96.592.190-7 SQM Nitratos S.A. Common parent Chile Sale of fixed assets 202 75
96.592.190-7 SQM Nitratos S.A. Common parent Chile Current account interest 24,372 26,530
96.592.190-7 SQM Nitratos S.A. Common parent Chile Current account interest 454 598
93.007.000-9 SQM S.A. Parent Chile Sale of solutions 96,569 100,830
93.007.000-9 SQM S.A. Parent Chile Current account interest 4,125 4,264
93.007.000-9 SQM S.A. Parent Chile Current account interest 12,464 3,256
93.007.000-9 SQM S.A. Parent Chile Sale of services 279 142
93.007.000-9 SQM S.A. Parent Chile Purchase fixed asset 575 526
93.007.000-9 SQM S.A. Parent Chile Sale of fixed assets 858 554
79.626.800-K SQM Salar S.A. Common parent Chile Sale of product 251 218
79.626.800-K SQM Salar S.A. Common parent Chile Sale of services 15,133 16,224
79.626.800-K SQM Salar S.A. Common parent Chile Current account interest 3,664 3,218
79.626.800-K SQM Salar S.A. Common parent Chile Current account interest 1,345 1,007

10) FINANCIAL REPORTS
SQM INDUSTRIAL S.A. AND SUBSIDIARIES: SUMMARY FINANCIAL STATEMENTS
379
Tax ID No. Company Nature Country of origin Transaction 12/31/2016
ThUS$
12/31/2015
ThUS$
79.770.780-5 Servicios Integrales de
Tránsitos y Transferencias S.A. Subsidiary Chile Sale of products 20.311 -
79.906.120-1 Isapre Norte Grande Ltda. Subsidiary Chile Sale of products 786 -
76.534.490-5 Sociedad Prestadora de
Servicios de Salud Cruz del
Norte S.A.
Subsidiary Chile Sale of products 487 -
Foreign
Royal Seed Trading
Corporation A.V.V. Other related parties Aruba Current account interest 605 -
Foreign
SQM Investment Corporation
N.V. Other related parties Dutch Antilles Current account interest 769 -
Foreign Ajay Europe SARL Associate France Sale of products 15,706 -
Foreign
Abu Dhabi Fertilizer Industries
WWL. Associate
United Arab
Emirates Sale of products 4,310 -
Foreign Ajay North America LLC Other related parties United States Sale of products 13,206 -
Foreign Doktor Tarsa Tarim Sanayi AS Associate Turkey Sale of products 17,538 -
Foreign Kowa Company Ltd. Other related parties Japan Sale of products 130,425 -
96.651.060-9 SQM Potasio S.A. Common parent Chile Current account interest 827 1,108
96.651.060-9 SQM Potasio S.A. Common parent Chile Sale of products 1,200 -
Foreign
Charlee SQM Thailand Co.
Ltd. Associate Thailand Sale of products 5,102 1,699
Foreign SQM Japon Co. Ltd. Other related parties Japan Sale of products - 348
Foreign SQM Brasil Limitada Other related parties Brazil Sale of products 336
Foreign Coromandel SQM Joint venture India Sale of products 8,011 197
Foreign
Sichuan SQM Migao Chemical
Fertiliezers Co Ltda. Joint venture China Sale of products - 9,950
Foreign
Sichuan SQM Migao Chemical
Fertiliezers Co Ltda. Joint venture China Sale of products 252
Foreign
SQM Vitas Brasil
Agroindustria Joint venture Brazil 14,575 8,033
Foreign SQM Vitas Fzco. Joint venture Arab Emirates Sale of products 82 -
Foreign SQM Vitas Perú S.A.C. Joint venture Peru Sale of products 14,878 13,708
Foreign Plantacote NV Associate Belgium Sale of products 2,108 -
Foreign Terra Tarsa Ukraine LLC Associate Turkey Sale of products 1,218 -
Foreign Terra Tarsa Don LLC Joint venture
Russian
Federation Sale of products 423 -

10) FINANCIAL REPORTS
SQM INDUSTRIAL S.A. AND SUBSIDIARIES: SUMMARY FINANCIAL STATEMENTS
380
Trade receivables due from related parties, current:
Tax ID N° Company Nature Country of origin Currency 12/31/2017 12/31/2016
ThUS$ ThUS$
79.876.080-7 Adepo Ltda Other related parties Chile Ch$ 1 1
Foreign Comercial Caiman Int. S.A. Other related parties Panama US$ 801 800
76.425.380-9 Exploraciones Mineras S.A. Other related parties Chile US$ 36 35
Foreign SQm Japan K.K. Other related parties Japan US$ - 202
Foreign Soquimich SRL Argentina Subsidiary Argentina US$ 158 158
79.049.778-9 Callegari Agrícola S.A. Jointly controlled entity Chile Ch$ - 41
Foreign Kowa Company Ltd. Jointly controlled entity Japan US$ 4,918 2,960
96.511.530-7 Soc. Inv P. Calichera S.A. Jointly controlled entity Chile US$ 7 6
Foreign Abu Dhabi Fertilizer Ind Other related parties United Arab Emirates US$ 73 764
Foreign Ajay Europe SARL Other related parties France US$ 4,250 3,678
Foreign Ajay North América llc Other related parties United States US$ 1,867 1,529
Foreign Charlee SQM Thailand Co. Other related parties Thailand Thailand Bath 1,227 1,338
Foreign Doktor Tarsa Other related parties Turkey US$ - 100
77.557.430-5 Sales de Magnesio Ltda. Other related parties Chile US$ - -
Foreign Terra Tarsa Don LLC Other related parties Federation rusa Russian Ruble 44 -
Foreign Coromandel SQM India Joint venture India Indian Rupee 3,804 1,177
Foreign Plantacote N.V. Joint venture Belgica Euro 190 -
Foreign SQM Star Qingdao Corp Nutrition Co. Ltd Joint venture China US$ - 48
Foreign SQM Migao Sichuan Fertilizer Joint venture China US$ 1,460 11,635
Foreign SQM Vitas Brasil Agroindustria Joint venture Brazil US$ 9,924 5,634
Foreign SQM Vitas Fzco. Joint venture United Arab Emirates US$ - 32
Foreign SQM Vitas Perú S.A.C Joint venture Perú US$ 9,072 9,313
Foreign SQM Vitas Plantacote B.V. Negocio conjunto Holanda US$ - 91
93.007.000-9 SQM S.A. Parent Chile US$ - 47,271
Total as of to date 37,832 86,813

10) FINANCIAL REPORTS
SQM INDUSTRIAL S.A. AND SUBSIDIARIES: SUMMARY FINANCIAL STATEMENTS
381
Trade payables due to related parties, current:
Tax ID No. Company Nature Country of origin Currency 12/31/2017 12/31/2016
ThUS$ ThUS$
Foreign Doktor Tarsa Tarim Sanaryi AS Other related parties Turkey US$ 10 8
Foreign Terra TarsaxUkraine LLC Other related parties Ucrania Ukrainean Grivna 7 -
Foreign Royal Seed Trading Co. Other related parties Aruba US$ 17,892 15,498
Foreign SQM Investment Co. Other related parties Dutch Antilles US$ 44,364 40,780
96.592.190-7 SQM Nitratos S.A. Other related parties Chile US$ 329,554 625,036
79.626.800-k SQM Salar S.A. Other related parties Chile US$ 422,962 391,151
96.651.060-9 SQM Potasio S.A. Common parent Chile Ch$ 5,751 23,519
Foreign SQMC Holding Corporation L.L.P. Other related parties United States US$ 22,482 21,980
96.592.180-k Ajay SQM Chile S.A. Other related parties Chile Ch$ - 8
Foreign SQM Star Qingdao Corp Nutrition Co. Ltd Joint venture China US$ 675
Foreign SQM Vitas Fzco. Joint venture United Arab
Emirates Arab Emirates dirham 104
-
93.007.000-9 SQM S.A. Parent Chile US$ 23,266 -
Total as of to date 867,067 1,117,980

10) FINANCIAL REPORTS
SQM NITRATOS S.A.: SUMMARY FINANCIAL STATEMENTS
382
Summary Classified Statements of Financial Position
Assets
As of December
31, 2017
ThUS$
As of December
31, 2016
ThUS$
Current assets Trade receivables due from related parties, current 333,348 638,289
Other current assets 207,473 17,932
Total current assets 353,821 656,221
Non-current assets Property, plant and equipment 33,904 44,944
Other non-current assets 5,239 9,236
Total non-current assets 39,143 54,180
Total assets 392,964 710,401
Liabilities and Equity
Liabilities
Current liabilities Trade payables due to related parties, current 311,582 632,591
Other current liabilities 13,156 12,019
Total current liabilities 324,738 644,610
Non-current liabilities
Deferred tax liabilities 4,107 5,791
Provisions for employee benefits, non-current 381 199
Total non-current liabilities 4,488 5,990
Total liabilities 329,226 650,600
Equity
Equity attributable to owners of the Parent 63,738 51,291
Non-controlling interests - -
Total equity 63,738 51,291
Total liabilities and equity 392,964 710,401

10) FINANCIAL REPORTS
SQM NITRATOS S.A.: SUMMARY FINANCIAL STATEMENTS
383
Summary Statements of Income by Function
January to December
2017 2016
ThUS$ ThUS$
Revenue 100,626 96,235
Cost of sales (92,232) (79,384)
Gross profit 8,394 16,851
Profit (loss) from operating activities 7,894 16,582
Profit (loss) before taxes 8,592 16,599
Income tax expense, continuing operations (3,023) (4,421)
Profit for the year 5,569 12,178
January to December
2017 2016
US$ US$
Earnings per share
Common shares
Basic earnings per share (US$ per share) 0.1215 0.2657
Diluted common shares
Diluted earnings per share (US$ per share) 0.1215 0.2657

10) FINANCIAL REPORTS
SQM NITRATOS S.A.: SUMMARY FINANCIAL STATEMENTS
384
Summary Statements of Comprehensive Income
2017 2016
ThUS$ ThUS$
Profit for the year 5,569 12,178 Other comprehensive income 38 (14)
Total comprehensive income 5,607 12,164
Comprehensive income attributable to
Owners of the Parent 5,607 12,164
Non-controlling interests - -
Total comprehensive income 5,507 12,164
Summary Statements of Cash Flows
12/31/2017 12/31/2016
ThUS$ ThUS$
Net cash generated from (used in) operating activities 9,660 6,880
Net cash generated from (used in) investing activities (8,896) (6,850)
Net increase (decrease) in cash and cash equivalents before the effect of
changes in the exchange rate 764 30
Effects of exchange rate fluctuations on cash held (14) (22)
Net (decrease) increase in cash and cash equivalents 750 8
Cash and cash equivalents at beginning of period 83 75
Cash and cash equivalents at end of period 833 83

10) FINANCIAL REPORTS
SQM NITRATOS S.A.: SUMMARY FINANCIAL STATEMENTS
385
Summary Statements of Changes in Equity
2017
Share capital Other reserves
Retained
earnings
Equity
attributable to
owners of the
Parent Total
ThUS$ ThUS$ ThUS$ ThUS$ ThUS$
Equity at beginning of the year 30,350 (38) 29,490 59,802 59,802
Profit for the year) - 5,569 5,569 5,569
Other comprehensive income 38 - 38 38
Comprehensive income - 38 5,569 5,607 5,607
Dividends - - (1,671) (1,671) (1,671)
Increase (decrease) in equity - - 3,898 3,936 3,936
Equity as of December 31, 2017 30,350 - 33,388 63,738 63,738
2016
Share capital Other reserves
Retained
earnings
Equity
attributable to
owners of the
Parent Total
ThUS$ ThUS$ ThUS$ ThUS$ ThUS$
Equity at beginning of the year 30,350 (24) 20,965 51,291 51,291
Profit for the year) - - 12,178 12,178 12,178
Other comprehensive income (14) - (14) (14)
Comprehensive income - (14) 12,178 12,164 12,164
Dividends - - (3,653) (3,653) (3,653)
Increase (decrease) in equity - (14) 8,525 8,511 8,511
Equity as of December 31, 2016 30,350 (38) 29,490 59,802 59,802

10) FINANCIAL REPORTS
SQM NITRATOS S.A.: SUMMARY FINANCIAL STATEMENTS
386
Related party disclosures
Balances pending at period-end are not guaranteed, accrue no interest and are settled in cash. No guarantees have
been delivered or received for trade and other receivables due from related parties or trade and other payables
due to related parties. For the period ended December 31, 2017, the Company has not recorded any impairment
in accounts receivable related to amounts owed by related parties. This evaluation is conducted every year
through an examination of the financial position of the related party in the market in which it operates.
Detail of related parties and related party transactions
Transactions between the Parent and its subsidiaries are part of the Company's common transactions. Their
conditions are those customary for this type of transactions in respect of terms and market prices.
Maturity terms for each case vary by virtue of the transaction giving rise to them.
As of December 31, 2017 and December 31, 2016, the detail of transactions with related parties is as follows:
Tax ID No Company Nature
Country of
origin Transaction
12/31/2017 12/31/2016
ThUS$ ThUS$
79.947.100-0 SQM Industrial S.A. Common parent Chile Sale of products 100,626 96,235
79.947.100-0 SQM Industrial S.A. Common parent Chile Current account interest 24,372 26,530
79.947.100-0 SQM Industrial S.A. Common parent Chile Purchase fixed asset 244 75
79.947.100-0 SQM Industrial S.A. Common parent Chile Consulting services - 3,894
93.007.000-9 SQM S.A. Parent Chile Mining concession rental service 6,079 5,806
93.007.000-9 SQM S.A. Parent Chile Services received 16 12
93.007.000-9 SQM S.A. Parent Chile Current account interest 22,338 25,374
93.007.000-9 SQM S.A. Parent Chile Consulting services 3,670 586
93.007.000-9 SQM S.A. Parent Chile Dividends 586 3,670
79.770.780-5 Serv. Integrales de Tránsito y
Transferencias S.A. Other related parties Chile Current account interest
454
598
79.626.800-K SQM Salar S.A. Other related parties Chile Current account interest 11 13
76.725.380-9 Exploraciones Mineras S.A. Other related parties Chile Current account interest 13 16
79.906.120-1 Isapre Norte Grande Ltda. Other related parties Chile Services received - 4
76.534.490-5 Sociedad Prestadora de Servicios
de Salud Cruz del Norte S.A. Other related parties Chile Services received - 4
96.651.060-9 SQM Potasio S.A. Common parent Chile Current account interest 680 885
96.651.060-9 SQM Potasio S.A. Common parent Chile Services received 1,421 2,088

10) FINANCIAL REPORTS
SQM NITRATOS S.A.: SUMMARY FINANCIAL STATEMENTS
387
Trade receivables due from related parties, current:
RUT Nombre Naturaleza País de origen Moneda 12/31/2016 12/31/2015
ThUS$ ThUS$
79.947.100-0 SQM Industrial S.A. Matriz común Chile US$ 333,348 638,289
Total as of to date 333,348 638,289
Trade payables due to related parties, current:
RUT Nombre Naturaleza País de origen Moneda 12/31/2016 12/31/2015
ThUS$ ThUS$
93.007.000-9 SQM S.A. Matriz
Chile US$ 300,804 599,751
96.651.060-9 SQM Potasio S.A. Other related parties Chile US$ 6,312 18,941
79.770.780-5 SIT S.A. Other related parties Chile US$ 3,794 13,253
79.626.800-k SQM Salar S.A. Other related parties Chile US$ 308 295
76.425.380-9 Exploraciones Mineras S.A. Other related parties Chile US$ 364 351
Total as of to date
311,582 632,591
As of December 31, 2017 and December 31, 2016, there are no allowances for doubtful accounts related to balances pending of transactions with related parties as there is no
impairment in them.

10) FINANCIAL REPORTS
ORCOMA SPA: SUMMARY FINANCIAL STATEMENTS
388
Summary Classified Statements of Financial Position
Assets As of December
31, 2017
ThUS$
As of
December 31,
2016
ThUS$
Non-current assets
Intangible assets other than goodwill 2,356 2,356
Other non-current assets 4 4
Total non-current assets 2,360 2,360
Total assets 2,360 2,360
Liabilities and Equity
As of December
31, 2017
ThUS$
As of
December 31,
2016
ThUS$
Liabilities
Current liabilities
Trade payables due to related parties, current 13 13
Total current liabilities 13 13
Equity
Share capital 2,358 2,358
Retained earnings (11) (11)
Total equity 2,347 2,347
Total liabilities and equity 2,360 2,360
Summary Statements of Income by Function
January to December
2017 2016
ThUS$ ThUS$
Administrative expenses - (5)
Income tax expenses 4
Profit (loss) from operating activities - (1)
Profit for the year - (1)

10) FINANCIAL REPORTS
ORCOMA SPA: SUMMARY FINANCIAL STATEMENTS
389
Summary Statements of Changes in Equity
2017
Share capital
Retained
earnings
Equity
attributable
to owners of
the Parent Total
THUS$ THUS$ THUS$ THUS$
Equity at beginning of the year 2,358 (11) 2,347 2,347
Profit for the year) - - - -
Other comprehensive income - - - -
Comprehensive income - - - -
Equity as of December 31, 2017 2,358 (11) 2,347 2,347
2016
Share capital
Retained
earnings
Equity
attributable
to owners of
the Parent Total
THUS$ THUS$ THUS$ THUS$
Equity at beginning of the year 2,358 (10) 2,348 2,348
Profit for the year) - (1) (1) (1)
Other comprehensive income - - - -
Comprehensive income - (1) (1) (1)
Equity as of December 31, 2016 2,358 (11) 2,347 2,347

10) FINANCIAL REPORTS
ORCOMA SPA: SUMMARY FINANCIAL STATEMENTS
390
Detail of related parties and related party transactions
Transactions between the Parent and its subsidiaries are part of the Company's common transactions.
Their conditions are those customary for this type of transactions in respect of terms and market prices
Maturity terms for each case vary by virtue of the transaction giving rise to them.
As of December 31, 2017 and December 31, 2016, there are no transactions with related entities.

10) FINANCIAL REPORTS
RS AGRO CHEMICAL TRADING CORPORATION A.V.V.: SUMMARY FINANCIAL
STATEMENTS
391
Summary Classified Statements of Financial Position
Assets
As of December
31, 2017
ThUS$
As of December
31, 2017
MUS$
Current assets
Cash and cash equivalents 8 11
Trade receivables due from related parties, current 5,156 5,168
Total current assets 5,164 5,179
Total assets 5,164 5,179
As of December
31, 2017
ThUS$
As of
December 31,
2016
MUS$
Liabilities
Current liabilities
Trade payables due to related parties, current 23 8
Total current liabilities 23 8
Equity
Share capital 6 6
Retained earnings 5,135 5,165
Total equity 5,141 5,171
Total liabilities and equity 5,164 5,179
Summary Statements of Income by Function
January to December
2017
ThUS$
2016
ThUS$
Profit (loss) from operating activities (29) (22)
Profit (loss) before taxes (30) (23)
Income tax expense, continuing operations - -
Profit (loss) from continuing operations (30) (23)
Profit for the year (30) (23)

10) FINANCIAL REPORTS
RS AGRO CHEMICAL TRADING CORPORATION A.V.V.: SUMMARY FINANCIAL
STATEMENTS
392
January to December
2017 2016
US$ US$
Earnings per share
Common shares Basic earnings per share (US$ per share)
60 60
(0.5) (0.38)
Diluted common shares Diluted earnings per share (US$ per share)
(0.5) (0.38)
Summary Statements of Comprehensive Income
January to December
2017 2016
ThUS$ ThUS$
Profit for the year (30) (23)
Total comprehensive income (30) (23)
Statements of cash flows 31/12/2017
ThUS$
31/12/2016
ThUS$
Net cash generated from (used in) operating activities (3) 5
Net increase (decrease) in cash and cash equivalents before
the effect of changes in the exchange rate (3) 5
Net (decrease) increase in cash and cash equivalents (3) 5
Cash and cash equivalents at beginning of period 11 6
Cash and cash equivalents at end of period 8 11

10) FINANCIAL REPORTS
RS AGRO CHEMICAL TRADING CORPORATION A.V.V.: SUMMARY FINANCIAL
STATEMENTS
393
Summary Statements of Changes in Equity
2017 Share
capital
Retained
earning
Total
ThUS$ ThUS$ ThUS$
Equity at beginning of the year 6 5,165 5,171
Profit for the year) - (30) (30)
Comprehensive income - (30) (30)
Equity as of December 31, 2017 6 5,135 5,141
2016 Share
capital
Retained
earning
Total
ThUS$ ThUS$ ThUS$
Equity at beginning of the year 6 5,188 5,194
Profit for the year) - (23) (23)
Comprehensive income - (23) (23)
Equity as of December 31, 2016 6 5,165 5,171

10) FINANCIAL REPORTS
RS AGRO CHEMICAL TRADING CORPORATION A.V.V.: SUMMARY FINANCIAL
STATEMENTS
394
Transactions with related parties
Transactions between the Parent and its subsidiaries are part of the Company's common transactions.
Their conditions are those customary for this type of transactions in respect of terms and market prices.
Maturity terms for each case vary by virtue of the transaction giving rise to them.
As of December 31, 2017 and December 31, 2016, there are no transactions between Rs Agro Chemical
Trading Corporation A.V.V. and related parties.
As of December 31, 2017 and December 31, 2016, there are no allowances for doubtful accounts related
to balances pending of transactions with related parties as there is no impairment in them.
Trade receivables due from related parties, current:
Tax ID No. Company Nature Country of
origin Currency
12/31/2017 12/31/2016
ThUS$ ThUS$
Foreign SQM Investment Corporation N.V. Associate Aruba US$ 5,156 5,168
Total as of to-date 5,156 5,168

10) FINANCIAL REPORTS
ORCOMA ESTUDIOS SPA: SUMMARY FINANCIAL STATEMENTS
395
Summary Classified Statements of Financial Position
Assets
As of December
31, 2017
ThUS$
As of December
31, 2016
ThUS$
Current assets Cash and cash equivalents 339 669
Other current non-financial assets 2 2
Total current assets 341 671
Non-current assets
Property, plant and equipment 4,356 4,135
Total non-current assets 4,356 4,135
Total assets 4,697 4,806
As of December
31, 2017
ThUS$
As of December
31, 2016
ThUS$
Liabilities and Equity
Liabilities
Current liabilities
Trade and other receivables, current 50 159
Total current liabilities 50 159
Total liabilities 50 159
Equity
Share capital 4,632 4,632
Retained earnings 15 15
Total equity 4,647 4,647
Total liabilities and equity 4,697 4,806

10) FINANCIAL REPORTS
ORCOMA ESTUDIOS SPA: SUMMARY FINANCIAL STATEMENTS
396
Summary Statements of Income by Function
January to December
2017 2016
ThUS$ ThUS$
Foreign currency translation differences - 1
Profit (loss) before taxes - 1
Income tax expense, continuing operations - 3
Profit (loss) from continuing operations - 4
Profit for the year - 4
Summary Statements of Comprehensive Income
January to December
2017 2016
ThUS$ ThUS$
Profit for the year - 4
Total comprehensive income - 4

10) FINANCIAL REPORTS
ORCOMA ESTUDIOS SPA: SUMMARY FINANCIAL STATEMENTS
397
Summary Statements of Cash Flows
12/31/2017 12/31/2016
ThUS$ ThUS$
Net cash generated from (used in) operating activities (109) (184)
Net cash generated from (used in) financing activities (221) (1,204)
Net increase (decrease) in cash and cash equivalents before the effect of changes
in the exchange rate (330) (1,388)
Net (decrease) increase in cash and cash equivalents (330) (1,388)
Cash and cash equivalents at beginning of period 669 2,057
Cash and cash equivalents at end of period 339 669
Summary Statements of Changes in Equity
2017
Share capital
Retained
earnings
(accumulated
deficit) Total equity
ThUS$ ThUS$ ThUS$
Initial balance, current year at 01/01/2016 4,632 15 4,647
Restated initial balance
Profit (loss) - - -
Comprehensive income - - -
Closing balance, current year at 12/31/2017 4,632 15 4,647
2016
Share capital
Retained
earnings
(accumulated
deficit) Total equity
ThUS$ ThUS$ ThUS$
Initial balance, current year at 01/01/2016 4,632 11 4,643
Restated initial balance
Profit (loss) - 4 4
Comprehensive income - 4 4
Closing balance, current year at 12/31/2016 4,632 15 4,647

10) FINANCIAL REPORTS
ORCOMA ESTUDIOS SPA: SUMMARY FINANCIAL STATEMENTS
398
Related party disclosures
Balances pending at each year-end are not guaranteed and are settled in cash. No guarantees have been delivered
or received for trade and other receivables due from related parties or trade and other payables due to related
parties. For the year ended December 31, 2017, the Company has not recorded any impairment in accounts
receivable related to amounts owed by related parties. This evaluation is conducted every year through an
examination of the financial position of the related party in the market in which it operates.
Relationships between the parent and the entity
Orcoma Estudios SPA is controlled by two shareholders: Sociedad Química y Minera de Chile S.A. and IM
Inversiones Limitada with ownership percentages of 51% and 49%, respectively.
Sociedad Química y Minera de Chile S.A. is registered with the Securities Registry of the CMF under No. 0184
of March 18, 1983, and accordingly, is subject to the oversight of such regulating authority.
Detailed identification of the link between the Parent and subsidiary
As of December 31, 2017 and December 31, 2016, the detail of entities that are related parties are as follows:
Tax ID No. Name Country of origin Functional currency Nature 93.007.000-9 Sociedad Química y Minera de Chile S.A. Chile U.S. dollar Parent
79.947.100-0 SQM Industrial S.A. Chile U.S. dollar Other related parties
As of December 31, 2017 and December 31, 2016, there are no allowances for doubtful accounts related to
balances pending of transactions with related parties as there is no impairment in them.
As of December 31, 2017 and December 31, 2016, there are no transactions with related entities.

10) FINANCIAL REPORTS AJAY SQM CHILE: SUMMARY FINANCIAL STATEMENTS
399
Summary Classified Statements of Financial Position
Assets
As of December
31, 2017
ThUS$
As of December
31, 2016
ThUS$
Current assets
Trade and other receivables, current 2,465 4,054
Trade receivables due from related parties, current 7,743 7,162
Current inventories 5,377 4,942
Other current assets 1,464 1,081
Total current assets 17,049 17,239
Non-current assets
Property, plant and equipment 1,066 990
Other non-current assets 76 79
Total non-current assets 1,142 1,069
Total assets 18,191 18,308
Liabilities and Equity
Liabilities
As of December
31, 2017
ThUS$
As of December
31, 2016
ThUS$
Current liabilities
Trade payables due to related parties, current 584 536
Other current liabilities 196 438
Total current liabilities 780 974
Non-current liabilities
Deferred tax liabilities - -
Provisions for employee benefits, non-current 459 388
Total non-current liabilities 459 388
Total liabilities 1,239 1,362
Equity
Total equity 16,952 16,946
Total liabilities and equity 18,191 18,308

10) FINANCIAL REPORTS AJAY SQM CHILE: SUMMARY FINANCIAL STATEMENTS
400
January to December
2017
ThUS$
2016
ThUS$
Revenue 23,732 28,035
Cost of sales (20,302) (23,889)
Gross profit 3,430 4,146
Profit (loss) from operating activities
Profit (loss) before taxes 2,805 3,658
Income tax expense, continuing operations (717) (882)
Profit for the year 2,088 2,776
January to December
2017 2016
US$ US$
Earnings per share
Common shares
Basic earnings per share (US$ per share) 2.189 2.911
Diluted common shares
Diluted earnings per share (US$ per share) 2.189 2.911
Summary Statements of Cash Flows
2017 2016
ThUS$ ThUS$
Net cash generated from (used in) operating activities 1,833 3,160
Net cash generated from (used in) investing activities (211) (214)
Net cash generated from (used in) financing activities (2,082) (2,374)
Net increase (decrease) in cash and cash equivalents before the effect of
changes in the exchange rate (460) 572
Effects of exchange rate fluctuations on cash held - -
Net (decrease) increase in cash and cash equivalents (460) 572
Cash and cash equivalents at beginning of period 819 247
Cash and cash equivalents at end of period 359 819

10) FINANCIAL REPORTS AJAY SQM CHILE: SUMMARY FINANCIAL STATEMENTS
401
Summary Statements of Changes in Equity
2017 Share capital Retained earnings Total
ThUS$ ThUS$ ThUS$
Equity at beginning of the year 5,314 11,230 16,946
Profit for the year) - 2,088 2,088
Comprehensive income - 2,088 2,088
Dividends - (2,082) (2,082)
Increase (decrease) in equity - 6 6
Equity as of December 31, 2017 5,314 11,638 16,952
2016 Share capital Retained earnings Total
ThUS$ ThUS$ ThUS$
Equity at beginning of the year 5,314 11,230 16,544
Profit for the year) - 2,776 2,776
Comprehensive income - 2,776 2,776
Dividends - (2,374) (2,374)
Increase (decrease) in equity - 402 402
Equity as of December 31, 2016 5,314 11,632 16,946

10) FINANCIAL REPORTS
AJAY SQM CHILE: SUMMARY FINANCIAL STATEMENTS
402
Related party disclosures
Balances pending at period-end are not guaranteed, accrue no interest and are settled in cash. No guarantees have been
delivered or received for trade and other receivables due from related parties or trade and other payables due to related
parties. For the period ended December 31, 2017, the Company has not recorded any impairment in accounts receivable
related to amounts owed by related parties. This evaluation is conducted every year through an examination of the financial
position of the related party in the market in which it operates.
Relationships between the parent and the entity
Ajay-SQM Chile S.A. is controlled by two shareholders: Sociedad Química y Minera de Chile S.A. and Ajay Chemicals
Inc. with ownership percentages of 51% and 49%, respectively.
Sociedad Química y Minera de Chile S.A. is registered with the Securities Registry of the CMF under No. 0184 dated
March 18, 1983 and is subject to the inspection of the CMF.
Detailed identification of the link between the Parent and subsidiary
As of December 31, 2017 and December 31, 2016, the detail of entities that are related parties is as follows:
Tax ID No, Name Country of
origin Functional currency Nature
93.007.000-9 Sociedad Química y Minera de Chile
S.A. Chile
US$ Parent
Trade receivables due from related parties, current:
Tax ID N° Company Nature Country of origin
Currency
12/31/2017 12/31/2016
ThUS$ ThUS$
93.007.000-9 SQM S.A. Parent Chile Ch$ 7,743 7,162
Total a la fecha 7,743 7,162
As of December 31, 2017 and December 31, 2016, there are no allowances for doubtful accounts related to balances
pending of transactions with related parties as there is no impairment in them.
As of December 31, 2017 and December 31, 2016, there are no transactions with related entities.

11) RESPONSIBILITY STATEMENT
403
11) RESPONSIBILITY STATEMENT
The Directors and Chief Executive Officer of SQM S.A. declare that we have exercised our respective
functions as administrators and chief executive of the Company in conformity with the practices that are
customarily used for such purposes in Chile and, in accordance with these practices, we swear under oath that
the information in this 2017 Annual Report is true and that we accept any liability that may arise from this
statement.


