i Socio-economic assessment of two small-scale irrigation schemes in Adami Tullu Jido Kombolcha Woreda, Central Rift Valley of Ethiopia By: Mengistu Assefa MSc Thesis in Environmental Economics and Natural Resources Group, Department of Environmental Sciences June, 2008 Supervised by: Dr. Justus Wesseler (Environmental Economics and Natural Resources Group) Dr. Huib Hengsdijk (Plant Research International) Environmental Economics and Natural Resources Group
Transcript
i
Socio-economic assessment of two small-scale irrigation
schemes in Adami Tullu Jido Kombolcha Woreda, Central Rift
Valley of Ethiopia
By: Mengistu Assefa
MSc Thesis in Environmental Economics and Natural Resources Group,
Department of Environmental Sciences
June, 2008
Supervised by: Dr. Justus Wesseler (Environmental Economics and Natural
Resources Group)
Dr. Huib Hengsdijk (Plant Research International)
Environmental Economics and Natural Resources Group
i
Socio-economic assessment of two small-scale irrigation schemes
in Adami Tullu Jido Kombolcha Woreda, Central Rift Valley of
Ethiopia
By: Mengistu Assefa
MSc Thesis in Environmental Economics and Natural Resources Group
Department of Environmental Sciences
June, 2008
Supervisors: Examiner: Dr.Justus Wesseler (ENR) Professor Ekko Van Ierland (ENR) Tel: +31(0)317482300 Tel: +31(0)317484307 [email protected][email protected]
First of all I would like to thank the Almighty God for giving me the aptitude, endurance, determination and guidance throughout the ups and downs of life. With your light, I saw my way! Several people have assisted me during my research work. Although it is not possible to mention all in a few sentences I would like to thank those who have been particularly important to my work. I feel great pleasure to express my special thanks to my supervisor Dr. Justus Wesseler for his critical and valuable comments in the course of this study. His insightful comments for the betterment of the whole work were appreciable. I would like to express my deepest gratitude to my external supervisor Dr. Huib Hengsdijk from Plant Research International for his invaluable insightful comments, guidance and assistance in finding funding for my research. With out unlimited support and guidance of my supervisors throughout the research work, this thesis would not be in this format. My particular gratitude goes to the Horn of Africa Regional Environmental Network and Centre for its financial support. I would like to thank Dr. Satishkumar Belliethathan and Mr. Bart Jan van Beuzekom from Horn of African Regional Environmental Network and Centre for their generous cooperation and facilitations of financial issues. My special thank go to Werer Agricultural Research Centre manager, Mr. Taddele Amde, for arranging transport facilities for my research. My great appreciation also goes to the Rift Valley Children and Women Development (RCWDA) Association and the International Development Enterprise (IDE) for their technical support and reception at their offices. I also thank RCWDA finance department staff members for their cooperation and administering my budget. All RCWDA and IDE staff members deserve thanks for their technical assistance and cooperation. I must thank the development agents (Usha and Abdulkadir) for providing me valuable information, coordination of the visits to farmers and assistance in primary data collection. Finally, I extend my sincere thanks to WUAs committee members and farmers in the two schemes for their fruitful cooperation. I also would like to thank my Uncle Mr. Guta Edea and his wife W/o Meseret Girma for hosting me in their room during my stay in Addis Ababa. I am also grateful to my brother Berahanu Assefa and all my friends for their encouragement and moral assistance. My sincere thank also goes to my colleague from Wageningen University Mr. Tafesse kefyalew for the good time we had in Ziway during our field work sharing the same room. Tafe, the academic and non-academic discussions we had are very important for me. Thank you for your understanding and friendliness.
Finally, I am thankful to my parents, Assefa Wendimu and Bekelech Ume, for sending me to school, encouragement and their moral and financial support.
ii
Table of content
Acknowledgement ............................................................................................................... i Table of content .................................................................................................................. ii List of Acronyms ............................................................................................................... iv List of Tables ...................................................................................................................... v List of Figures.................................................................................................................... vi Summary ........................................................................................................................... vii 1. Introduction..................................................................................................................... 1
1.1 Background and justification .................................................................................... 1 1.2 Problem statement..................................................................................................... 3 1.3 Research objectives................................................................................................... 3 1.4 Research questions.................................................................................................... 4 1.5 Organization of the thesis ......................................................................................... 4
2. Description of the study area .......................................................................................... 5 2.1 Physical characteristics ............................................................................................. 6 2.2 Climate...................................................................................................................... 6 2.3 Agriculture ................................................................................................................ 6 2.4 Crops......................................................................................................................... 7 2.5 Livestock................................................................................................................... 7 2.6 Natural resources ...................................................................................................... 7 2.7 Irrigation ................................................................................................................... 8
3. Research methodology and data sources ........................................................................ 9 3.1 Selection of irrigation schemes................................................................................. 9 3.2 Irrigation schemes..................................................................................................... 9
3.2.1 Haleku Melaka Teso .......................................................................................... 9 3.2.2 Dodicha............................................................................................................ 10
3.4 Method of data analysis .......................................................................................... 12 3.4.1 Comparison of costs and revenues................................................................... 12 3.4.2. Statistical analysis........................................................................................... 13
3.5 Scope and limitations of the study.......................................................................... 14 4. Literature review........................................................................................................... 15
4.1 Irrigation development in Ethiopia ......................................................................... 15 4.2 Water sector institutions in Ethiopia....................................................................... 17 4.3 Environmental policy in relation to Irrigation ........................................................ 19 4.4 Current status of small-scale irrigation schemes in Ethiopia.................................. 21 4.5 Socio-economic impact of small-scale irrigation...................................................25 4. 6 Transaction costs of irrigation water management ................................................ 27
5. Results........................................................................................................................... 29 5.1.1 Socio- economic characteristics of the study areas.......................................... 29 5.1.2 Farming system, land holding size and cropping pattern ................................ 31 5.1.3 Livestock holding............................................................................................. 33 5.1.4 Farm implements ............................................................................................. 37
iii
5.1.5 Labor input....................................................................................................... 38 5.1.6 Average costs and returns ................................................................................ 40 5.1.7 Households' food security................................................................................ 42 5.1.8 Linkages of irrigation....................................................................................... 44 5.1.9 Commercial aspects ......................................................................................... 47
5.2 Institutional arrangement ........................................................................................ 52 5.2.1 Organization of the irrigation schemes............................................................ 52 5.2.2 Irrigation scheme management ........................................................................ 58 5.2.3 Irrigation infrastructure.................................................................................... 58 5.2.4 Water distribution and management ................................................................ 58 5.2.5 Maintenance..................................................................................................... 63 5.2.6 Transaction costs in irrigation scheme management ....................................... 65
ADLI: Agricultural Development Led Industrialization ATJK: Adami Tullu Jido Kombolcha BCEOM: French Engineering Group CBA: Cost-Benefit Analysis CRS: Catholic Relief Service CRV: Central Rift Valley CTA: Technical Center for Agriculture and Rural Development Cooperation GDP: Gross Domestic Product EPA: Environmental Protection Authority EWRMP: Ethiopian Water Resource Management Policy FAO: Food and Agricultural Organization IDD: Irrigation Development Department IDE: International Development Enterprise MoA: Ministry of Agriculture MoRDA: Ministry of Agriculture and Rural Development MoWR: Ministry of Water Resources NEPAD: New Partnership for Africa's Development NGO: Non Governmental Organization NMTDP: National Medium-Term Development Program ODI: Overseas Development Institute OESPO: Oromia Economic Study Program Office OIDA: Oromia Irrigation Development Authority OSRDF: Oromia Social Rehabilitation development Fund PA: Peasant Association RCWDA: Rift Valley Children and Women development SMS: Subject Matter Specialist SNNPR: Southern Nations Nationality People SSA: Sub-Saharan African SSI: Small-scale Irrigation WSPD: Water Sector development Program WUA: Water User Association
v
List of Tables
Table 1. Average land holding size in Haleku and Dodicha before (2001) and after (2007) implementation of the irrigation schemes (in ha). ............................................................ 32 Table 2. Yield ranges in ATJK Woreda, Ziway Dugda Woreda and Haleku in (kg ha-1).33 Table 3. Cropping intensity in Haleku and Dodicha irrigation schemes. ......................... 33 Table 4. Livestock holding in Haleku and Dodicha irrigation schemes. .......................... 35 Table 5. Mean livestock holding in Haleku and Dodicha before (2001) and after (2007) implementation of the irrigation schemes......................................................................... 36 Table 6. Mean farm implements per household in Haleku and Dodicha before (2001) and after (2007) implementation of the irrigation schemes..................................................... 38 Table 7. Amount of labor used for different field operations in onion, tomato, maize and green bean in Haleku and Dodicha (in man days per 0.25 ha). ........................................ 39 Table 8. Mean total labor used for production of different crops in Haleku and Dodicha (in man days per 0.25 ha).................................................................................................. 40 Table 9. Mean total production costs of different crops in Haleku and Dodicha (in birr/0.25 ha)....................................................................................................................... 40 Table 10. Average productivity of different crops in Haleku and Dodicha (in kg/0.25 ha)............................................................................................................................................ 41 Table 11. Net revenues, range of net revenues and percentage of farmers with positive revenue for different crops in Haleku and Dodicha irrigation schemes (in birr per 0.25 ha). .................................................................................................................................... 42 Table 12. Loss ranges and net loss from production of different crops in Haleku and Dodicha (birr per 0.25 ha)................................................................................................. 42 Table 13. The average amount of inputs used in both schemes (per 0.25 ha). ................. 48 Table 14. Mean pesticide application frequency in different crops in Haleku and Dodicha............................................................................................................................................ 48 Table 15. Crop prices during the study period (2007 cropping season) in different market places................................................................................................................................. 50
vi
List of Figures
Figure 1: Map of CRV and its Woreda’s (Jansen et al., 2007)...........................................5 Figure 2. Drought and disaster affected populations during the last decade. ................... 16 Figure 3.Household’s age composition............................................................................. 30 Figure 4. Educational status of sample household heads in Haleku and Dodicha............ 30 Figure 5. Improved dairy cows bought by Haleku WUA................................................. 37 Figure 6. Production goals of irrigated crops.................................................................... 43 Figure 7. Perception of household’s food security after implementation of the irrigation schemes. ............................................................................................................................ 44 Figure 8. Organization of modern small-scale irrigation schemes. .................................. 53 Figure 9. Water distribution problems in Haleku and Dodicha irrigation schemes.......... 59 Figure 10. Percentage of households facing irrigation water shortages in Haleku and Dodicha............................................................................................................................. 60 Figure 11. Availability of irrigation water at the time when needed by farmers in Haleku and Dodicha ...................................................................................................................... 60 Figure 12. Opinion of farmers on the equal distribution of irrigation water in Haleku and Dodicha scheme................................................................................................................ 61 Figure 13. Farmers facing conflicts in Haleku and Dodicha ............................................ 62 Figure 14. Opinion of farmers about their scheme organization in Haleku and Dodicha 64 Figure 15. Problems in scheme maintenance according farmers in Haleku and Dodicha 64
vii
Summary
The Central Rift Valley (CRV) in Oromia and the Southern Nations and Nationality
Peoples Region (SNNPR) covers approximately 10000 km2. The CRV is one of the areas
where large investments in irrigation take place for the production of cash crops. The
increased use of water for irrigation puts a great pressure on the local hydrology and
ecosystem. The competition for irrigation water, land and biomass increases resource
management complexity. The sustainability of irrigated agriculture is questioned and the
challenge is to increase simultaneously land and water productivity in the face of the
limited availability of land and water in the CRV.
The aim of this research is to assess the social-economic performance of two community-
based small-scale irrigation schemes in Adami Tullu Jido Kombolcha Woreda (ATJK)
and to identify options to improve irrigation performance and resource management. To
realize these objectives structured household survey questionnaires, semi-structured
interviews, group discussions, field observations and literature were used. Various
households’ socio-economic characteristics ‘before and after’ implementation of the
irrigation schemes were compared to study the socio-economic impact of irrigation.
Among the 31 small-scale irrigation schemes in ATJK two modern community-based
small-scale irrigation schemes in the Kebeles Haleku and Dodicha were selected based on
accessibility, management differences, and available research time. A total of 80
households, i.e. 26 and 54 households in Haleku and Dodicha, respectively, were
interviewed based on the proportion of members in both schemes. Random sampling
method was used for the selection of households while purposive sampling was used for
the selection of key informants and focus group discussion members.
The average rain fed land holding size after implementation of the irrigation schemes
increased from 2.67 to 3.16 ha in Haleku and decreased from 1.47 ha to 1.13 ha in
Dodicha. The mean number of animals increased after implementation of the scheme in
Haleku whereas it decreased in Dodicha. However, the changes were not statistically
viii
significant. The number of farm implements increased in both irrigation schemes after
implementation of the schemes.
Labor requirements for the production of onion, tomato and green bean are almost the
same in both schemes. Depending on crop type labor requirements vary between 45-117
and 42-109 man days per ha in Haleku and Dodicha, respectively. The mean production
costs for the various crops between the two irrigation schemes were not statistically
different. The production costs for onion are highest, on average 2354 birr/0.25 ha
whereas they are lowest in maize (983 birr/0.25 ha). Mean yields of onion, maize and
green bean are significantly higher in Haleku, i.e. 3462, 2796, 1416 and 2227 kg/0.25 ha
in Haleku and 2379, 2483, 729 and 1596 kg/0.25 ha in Dodicha, respectively. As a result,
mean net revenue obtained form onion, maize and green bean are significantly higher in
Haleku. The net revenue from four different crops ranges from 7040 to 33298 birr/0.25
ha in Haleku and from 609 to 31040 birr/0.25 ha in Dodicha. Implementation of the
irrigation schemes in Haleku and Dodicha increased the households’ income compared to
the situation before implementation of the schemes and thus contributed to the food
security of households.
Farmers use on average 25-50 kg/0.25 ha DAP and 25 kg/0.25 ha urea in irrigated crops.
The types of insecticide used in both irrigation schemes are Selecron, Karate and Mitga,
and the used fungicides include Kocide, Bayleten, Pencozeb, Ridomil and Bumper.
Marketing of products, lack of extension services, lack of post-harvest facilities and lack
of credit are major constraints in both irrigation schemes.
WUAs committees are fully in charge of the scheme coordination and water management
in both irrigation schemes. Pump capacity, maintenance cost, lack of transparency
(corruption), poor scheme coordination and management were identified as major
problems in Dodicha. The lack of an auditing and monitoring system and little experience
of farmers in irrigation contributed to mismanagement and corruption. Coordination,
transparency of WUAs committees and farmers cooperation in management were
identified as important factors to improve the functioning of both irrigation schemes.
ix
Transaction costs, i.e. time for negotiating contracts, motivating the members and costs
for coordination and monitoring of scheme activities were higher in Dodicha due to poor
scheme management. Environmental problems associated with the small-scale irrigation
schemes were assessed only qualitatively. Farmers argue that water is used efficiently
since pumping bears fuel costs. Further research should investigate this claim also in
relation to the relatively low crop yields obtained in both schemes.
To improve the economic and environmental performance of small scale-irrigation
schemes institutional support (input supply, output marketing and credit services),
training of farmers on improved crop and water management issues, regular supervision
and monitoring of scheme activities are crucial.
1
1. Introduction
1.1 Background and justification
Agriculture is the mainstay of the Ethiopian economy as it accounts for about 46% of the
GDP, 85% of the export and 80% of the employment opportunities (Makombe et al.,
2007). Both industry and services depend strongly on the performance of agriculture,
which provides raw materials, generates foreign currency for import of essential inputs
and food for the fast growing population. Despite its importance for the national
economy, agriculture is largely based on subsistence farming. The productivity of the
agricultural sector is very low and lags behind the population growth rate resulting in
food insecurity. To address this problem the Ethiopian Government designed an
Agricultural Development Led Industrialization (ADLI) strategy which aims to use
agriculture as the base for the country's overall development (MoWR, 2001). This
strategy aims to enhance the productivity of small-scale farmers and to improve food
security both in the rural and urban areas. One of the policies within this strategy is
stimulate and/or support the development of small-scale irrigation. Thanks to the
enabling policies, irrigated agriculture is expanding rapidly in those areas where there is
access to irrigation water. The Central Rift Valley is one of the areas where large
investments in irrigation development are taking place for the production of cash crops.
Rapid population growth results in encroachment of marginal and environmentally
sensitive areas contributing to declining soil fertility, erosion, low crop yields, feed
shortages, progressive land degradation, and reduction of areas under fallow (Kamara et
al., 2002). The declining productivity in rain fed agriculture and the need to double food
production over the next two decades has increased the need for expansion of effective
and efficient irrigation systems (Kamara et al., 2002). Ethiopia has a National Irrigation
Development Strategy to use water and land potential to meet food self-sufficiency,
generate export earnings, and provide raw materials for industry on a sustainable basis
(MoWR, 2001). Specific objectives include to increase the irrigated area, to improve
water productivity in irrigated agriculture, to ensure the financial and technical
sustainability of irrigated areas, and to mitigate water-logging and salinity.
2
The favorable environmental conditions for the production of both horticultural and
floricultural crops in the Central Rift Valley (CRV) and the value of these crops on
international markets led to the expansion of the irrigated area. However, improperly
planned expansion of irrigation is often associated with low efficiency in water use and
with environmental problems such as salinisation, nutrient depletion, water pollution, loss
of vegetation cover, soil erosion, over grazing, soil degradation, groundwater depletion
and reduction of surface water tables (McCornick et al., 2003). These processes could
reduce the potential and actual land productivity and thus affecting food security at both
the national and local levels. At present water resources of the CRV are noticeably over-
exploited mainly due to water extraction for irrigated agriculture (Jansen et al., 2007). As
a consequence of high water abstraction for irrigation, the water level of some of the
lakes has already decreased. This may affect the productivity of the lakes, for example
the fish population in lake Abijata is affected by upstream water abstraction (Legesse et
al., 2005).
Management of land and water resources in the CRV is complex due to increased
competition for irrigation water, land and biomass. The challenge that irrigated
agriculture faces in the coming years is: How to increase water productivity in the face of
growing water scarcity and the limited availability of water for agriculture. Moreover,
climate change may affect the amount of rainfall and its distribution and requires policy
development. Therefore, it is important to evaluate the socio-economic and
environmental performance of current irrigation schemes which may contribute to
(re)design of improved resource management options. Several civil society organizations
such as Rift Valley Children and Women Development Association (RCWDA),
International Development Enterprise (IDE) and Selam Environment and Development
Association (SEDA) have projects to improve water use efficiency in irrigated
smallholder schemes to reduce poverty. My research contributes to this effort with a
focus on the institutional understanding of irrigation schemes, input use and cost-benefit
analysis of irrigated crop production as indicator of economic and institutional
performance.
3
1.2 Problem statement
The increased competition for water in the CRV puts a great pressure on the local
hydrology and ecosystem. The sustainability of irrigated agriculture is being questioned,
both economically and environmentally (Jansen et al., 2007). The majority of existing
irrigation schemes are small, serving usually not more than 200 to 300 households (Tahal
Consulting Engineers, 1988). Many of these schemes are based on stream and river
diversions and ground water wells, while some depend on small dams and perennial
springs. Most of the schemes were designed and developed without the consent of the
local communities. As a result, many of the small-scale irrigation projects have been
operating below expected returns. The sustainability of small-scale irrigation projects
depends on (operational) management. Many studies in Ethiopia focus on technical
aspects of irrigation schemes, and very little is known of the socio-economic implications
of irrigation development (Van Den Burg and Ruben, 2006).
Hence, there is a need for better understanding of the socio-economic functioning of
smallholder irrigation schemes in the CRV, which could contribute to improvements in
their performance. The aim of this research is to assess the socio-economic benefits of
two community-based small-scale irrigation schemes in Adami Tullu Jido Kombolcha
Woreda, to identify operational constraints, and to identify options to improve their
performance.
1.3 Research objectives
The overall objective of this study is to assess the profitability and sustainability of
community-based small-scale irrigation schemes in two selected study areas, i.e. the
Kebeles Haleku and Dodicha in Adami Tullu Jido Kombolcha Woreda.
More specifically, the study aims to:
� Assess changes in household’s socio-economic characteristics before and after
implementation of both irrigation schemes.
� Analyze costs and revenues of four irrigated crops in both irrigation schemes.
� Identify the institutional arrangements for water management in both irrigation
schemes.
4
� Identify transaction costs involved in irrigation scheme management.
1.4 Research questions
• What are the changes in land holding size, number of livestock and farm
implements before and after implementation of the irrigation schemes?
• What are the costs and benefits of irrigated crops in both schemes?
• What are the institutional arrangements for water management in small-scale
irrigation schemes?
• What are the transaction costs involved in irrigation scheme management?
• What measures are required to improve the performance of the existing irrigation
schemes?
1.5 Organization of the thesis
Chapter 1 introduces the problem (problem statement), defines the objectives and
specifies the research questions. Chapter 2 describes the study area and Chapter 3
explains the methodologies used for data collection, data analysis and it discusses the
scope and limitations of the study. Chapter 4 presents relevant literature related to
irrigation in Ethiopia and other parts of the world. Chapter 5 presents the main results of
the study and is the central part of the thesis. In Chapter 6 the results are discussed while
Chapter 7 presents conclusions and recommendation for future development of small-
scale irrigation schemes in the study area.
5
2. Description of the study area
The CRV is situated in the administrative regions of Oromia and the Southern Nations
and Nationality Peoples Region (SNNP) and covers approximately 10,000 km2. It is a
closed river basin and consists of a chain of lakes, streams and wetlands making the CRV
an environmentally vulnerable area. The diversity of landscapes and ecosystems
comprise unique biodiversity-rich wetlands. Due to the favorable conditions for
horticultural crop production and water availability the irrigated area has increased
rapidly in recent years. The total irrigated area was about 10,000 ha in 2007 (Rodriguez
de Francisco, 2008). This study was carried out in one of the Woredas’ in CRV, Adami
Tullu Jido Kombolcha (ATJK).
Figure 1: Map of CRV and its Woreda’s (Jansen et al., 2007)
6
2.1 Physical characteristics
Adami Tullu Jido Kombolcha Woreda (7o37’-04’N, 38o32’-39o 04’E) is 167 km from the
Capital Addis Ababa. Its area is 1403.3 km2 with a total population of 141,745 (in 1997)
of which more than 70% lives in rural areas (OESPO, 2003). The elevation of the
Woreda ranges from 1500 to about 2300 masl with mountain Aluto as highest peak of
2335 masl. The livelihoods of local farmers mainly depend on mixed farming of crops
and livestock (OESPO, 2003). There are 38 administrative Kebeles covering about 80%
of the total Woreda area; towns, military camps, private investors and other companies
occupy the remaining 20%. From the total area 45% is cultivated, about 30% is used for
grazing and woodlands, 7% is classified as marginal land and other land uses account for
about 18% (OESPO, 2003).
2.2 Climate
Adami Tullu-Jido Kombolcha (ATJK) Woreda has a semi-arid and arid climate. The
average annual precipitation is about 700 mm of which 42% falls in the period June to
September (OESPO, 2003). The driest months are November and December. The mean
annual temperature is 200C at Ziway and Adami Tullu station (OESPO, 2003). May is the
hottest month with a mean maximum temperature of 280C and the coolest month is
December with a mean minimum temperature 100C.
2.3 Agriculture
Land use is characterized by open wood land, annual crops, livestock grazing and some
irrigated agriculture (OESPO, 2003). Livestock, crops and forest products are the main
sources of income for the farmers in ATJK. Resource poor farmers (landless, few oxen
and female headed households) earn money mainly from sales of firewood and charcoal
(OESPO, 2003). During years with crop failure, most households depend on income from
tree resources, livestock and food aid. The majority of the households sell firewood and
/or charcoal during the food shortage months (June to September) (OESPO, 2003). Farm
size, number of livestock and draught animals (oxen) are the main factors which
determine the wealth status of farmers. Farm holding size ranges from 0.75 to 3 ha with
7
an average size of 1.5 ha. The average family size is 4.6 (4.9 for rural and 4.2 for urban)
(OESPO, 2003). Horticultural crop production is becoming the main source of income for
farmers living around Lake Ziway and the Bulbula River.
2.4 Crops
Maize, haricot bean, teff, wheat and sorghum are mainly grown under rain fed conditions.
The greatest proportion of the land is grown with maize and haricot bean. The land
allocated to crop production has increased from 32,030 to 63,015 ha between 1995 and
2000 (OESPO, 2003). At the same time, the average crop yield remained very low
(OESPO, 2003). In addition to low and erratic distribution of rainfall, most farmers in the
Woreda are significantly constrained by available resources such as draught power and
other agricultural inputs. The frequent droughts and high costs of the technologies
(improved seeds, fertilizers and pesticides) causes that farmers are risk-aversive and
reluctant to adopt new technologies developed for rain fed conditions.
2.5 Livestock
Livestock production is one of the major economic activities in ATJK and the number of
animals still is a symbol of wealth among farmers. The estimated livestock population in
AJTK is 139,486 cattle, 39465 goats, 6424 sheep, 11573 equines, and 45378 chickens
(OESPO, 2003). Animals graze along roads, in semi natural wood and shrub land, and on
stubble o
f harvested crops. Most of the fertile soils are cultivated with maize, haricot bean and
other crops and are not available for grazing. Due to low feed availability the output per
animal is very low (OESPO, 2003). As compared to other animal types, goat is best
adapted to prevailing conditions. Due to the shortage of water, good feed and inadequate
veterinary services, the condition of livestock is poor.
2.6 Natural resources
The natural vegetation of the area is under high pressure due to the expansion of
cultivated land, overgrazing and deforestation (OESPO, 2003). Wood and grazing land is
poorly managed and comprises scattered acacia species and shrubs, which are either
8
resistant to the destruction or inaccessible to people or livestock. The rate with which
vegetation is used for fuel or construction is far greater than the rate of regeneration. Fuel
wood is collected not only for household consumption but also for selling. Charcoal of
acacia species is an important source of income for most resource poor farmers in AJTK.
Low and irregular rainfall, lack of incentives for natural resource conservation, increasing
population, land scarcity, land tenure arrangements, and increasing demand for fuel wood
and lack of alternative energy sources together with inefficient resource management are
associated with the degradation of the natural vegetation (OESPO, 2003).
2.7 Irrigation
The agricultural potential of ATJK is low and mainly determined by the semi-arid and
arid climate. The amount of rainfall is low in relation to the high evaporative demand.
Erratic, late onset or early withdrawal of the rainy season cause frequent crop failures.
However, the availability of accessible water resources, relatively good infrastructure,
suitable soils, proximity to the market (Addis Ababa) and high radiation provide
opportunities for irrigated agriculture. In the year 2000 the irrigated area by different
sectors (small-scale farmers, State farm, Red Cross Prison farm, Churches and others)
was 1848 ha (OESPO, 2003). Both traditional and modern irrigation schemes exist in
ATJKI with 97 pumps of different capacity (OESPO, 2003). On the basis of ownership,
and farm type and size four major irrigated production system can be identified in the
CRV (Hengsdijk and Jansen, 2006), i.e. closed vegetable and flower production systems
on private farms (Sher-Ethiopia), open field vegetable and fruit production systems on
state farm (Ziway State Farm), open field vegetable and fruit production systems on
private farms (e.g. Ethio-Flora and Segel Agro P.L.C) and smallholder open-field
vegetable and fruit production systems. Latter are the largest in the CRV in terms of land
use. The total cultivated land in ATJK is 62,288 ha of which only 1210 ha is under small-
scale irrigation (Mr. Abreham, pers. com.). There are 31 small-scale irrigation schemes in
ATJK with 2250 beneficiary households.
I Traditional irrigation in this context refers to those schemes that have been initiated and constructed by the farmers using their knowledge and available resources whereas modern irrigation schemes use pumps and they are engineered and built with funds from government or NGOs.
9
3. Research methodology and data sources
This study was carried out in ATJK in two small-scale irrigation schemes, i.e. Haleku and
Dodicha during September to December 2007.
3.1 Selection of irrigation schemes
A reconnaissance survey was carried out with Social workers of Rift Valley Children and
Women Development (RCWDA) to get an overview of the different irrigation schemes in
ATJK. Results of the survey were discussed with the RCWDA irrigation department
staff, Woreda agricultural office irrigation experts and staff of IDE to identify the
irrigation schemes to be included in the study. Among the 31 small-scale irrigation
schemes in ATJK two modern schemes in the Kebeles Haleku and Dodicha were selected
based on accessibility, available time and management differences. These two irrigation
schemes are representative for modern small-scale irrigation schemes in ATJK. The total
number of households in the two irrigation schemes is 222, i.e. 72 in Haleku and 150 in
Dodicha. Based on the proportion of the members in each irrigation scheme a total of 80
households, i.e. 26 and 54 households in Haleku and Dodicha, respectively, were selected
for the household survey. Purposive sampling method was used for the selection of
farmers, key informants, and focus group discussion members. The WUA member’s
registries were used as a sampling frame.
3.2 Irrigation schemes
3.2.1 Haleku Melaka Teso
Haleku irrigation scheme is 173 and 10 km from Addis Ababa and Ziway town,
respectively, along the Bulbula River at an elevation of 1640 masl. The irrigation site is
characterized by plain to very gentle sloping land, which is suitable for irrigation. The
soil type of the project site is sandy loam. Prior to the development of Haleku irrigation
scheme, local farmers relied on the production of rain fed crops and livestock. The
agricultural production was low due to the low and erratic rainfall. Following the
government strategy to expand irrigated crop production, the government aimed at
leasing the land to large private investors. In response, local people organized themselves
10
and requested financial support from the RCWDA for a pump and construction of
irrigation infrastructure. In 2001, RCWDA started to support the local farmers because of
the food security problem in the area and the number of interested farmers. After
establishment of the scheme, the local farmers organized themselves in a Water Users
Association (WUA). The WUA administrative committees were formed to organize and
monitor the performance of the scheme. The WUA was registered as a cooperative
society by Cooperative Society of Oromia on July 20, 2005. The scheme comprises an
area of 36 ha and 72 beneficiary households. The irrigation scheme withdraws water from
the Bulbula River that flows throughout the year to the terminal Lake Abijata. The
amount of the water in the river depends on the rain fall which means that the amount of
water decreases during the dry season. The scheme has two pumps (one electric and one
diesel) to abstract water from the river. These pumps are used alternately as one pump
has sufficient capacity for providing water to the entire scheme. The water from the river
is pumped to a higher elevation over a distance of 400 meters and then distributed by
gravity over the plots. The main canal has a length of 500 meters.
3.2.2 Dodicha
The Dodicha scheme is located 170 and 7 km from Addis Ababa and Ziway town,
respectively, near the outlet of Bulbula River from Lake Ziway. This area is also
characterized by uneven distribution of rainfall and frequent droughts. This scheme has
fertile soils and abstracts water from the Bulbula River. Farmers requested the Oromia
Social Rehabilitation Development Fund (OSRDF) for financial support to develop the
scheme. This resulted in a project aimed at improving family income and livelihood
through the production of high value vegetable crops. After farmers obtained funds from
OSRDF a pre-feasibility study and construction of the canal systems were done by
Oromia Irrigation Development Authority (OIDA). The construction of the scheme
started in 1999 and crop production in 2001. Although the design aimed at three pumps,
OSRDF financed only two pumps. The WUA covered 10 % of the total construction
costs of the project. The scheme is legally registered by the Cooperative Society of
Oromia in 2005. Based on the capacity of two pumps 153 farmers were registered with in
total 69 ha irrigated land. Land size of individual farmers varies from 0.25 to 0.5 ha and
11
no effort was made to redistribute the land equally among farmers. Currently, the scheme
has a total area of 75 ha and 150 household beneficiaries.
3.3 Data collection methods
3.3.1 Primary data
Primary data collection was started with a reconnaissance survey of scheme sites and
discussions with relevant governmental and non-governmental organizations (RCWDA,
IDE and Woreda agricultural office). Primary data collection consisted of key informant
interviews, semi-structured interviews, focus group discussions, direct observations and
structured questionnaires for household surveys. Key informant interviews have been
made with RCWDA irrigation experts, development agents, scheme committee members,
WUA members and experts from Woreda agricultural offices to improve understanding
of the institutional functioning of the scheme, water management within the scheme,
input use, resource use conflict resolution mechanisms, and to gain insight in their
perception on the importance of irrigation for local food security and other issues like
market conditions.
Semi-structured interviews were made with RCWDA irrigation experts, district irrigation
officer, Oromia Irrigation Development Authority (OIDA), managers of private farms
(Ethio Flora, Sher Flower Complex and Segel Farm), irrigation and agronomy experts of
the state farm and the manager of Adami Tullu Pesticide factory. Structured
questionnaires were used for collecting quantitative and qualitative data from selected
households. The household survey covered demographic characteristics, household socio-
economic factors, plot characteristics, water management practices, yields at plot level,
and labor requirements. Focus group discussions were conducted in both irrigation
schemes with selected elder community WUA members, executive, and PA leader. Six
and eight people participated in the focus group discussion in Haleku and Dodicha,
respectively. The prices of inputs were from the WUAs office. Qualitative observations
were made on soil conditions of irrigated plots, water use and deforestation.
12
3.3.2 Secondary data
Literature on socio-economic impact of small-scale irrigation, irrigation scheme
management, institutional arrangements for irrigation schemes, environmental regulation
policies, development plans of the Woreda and other studies were collected from
Table 5. Mean livestock holding in Haleku and Dodicha before (2001) and after (2007) implementation of the irrigation schemes.
Haleku Dodicha Type of livestock 2001 2007 Change 2001 2007 Change
Cow 3.31 3.85 0.54 4.07 2.74 -1.33
Oxen 1.81 2.35 0.54 2.11 1.67 -0.44
Heifer
&bulls
2.85 2.85 0.00 2.69 2.30 -0.39
Sheep 0.73 1.08 0.35 1.50 0.94 -0.56
Goat 2.88 3.96 1.08 4.81 3.30 -1.51
Donkey 0.85 0.96 0.11 1.03 0.95 -0.8
Hen 4.54 4.31 -0.23 3.41 2.94 -0.47
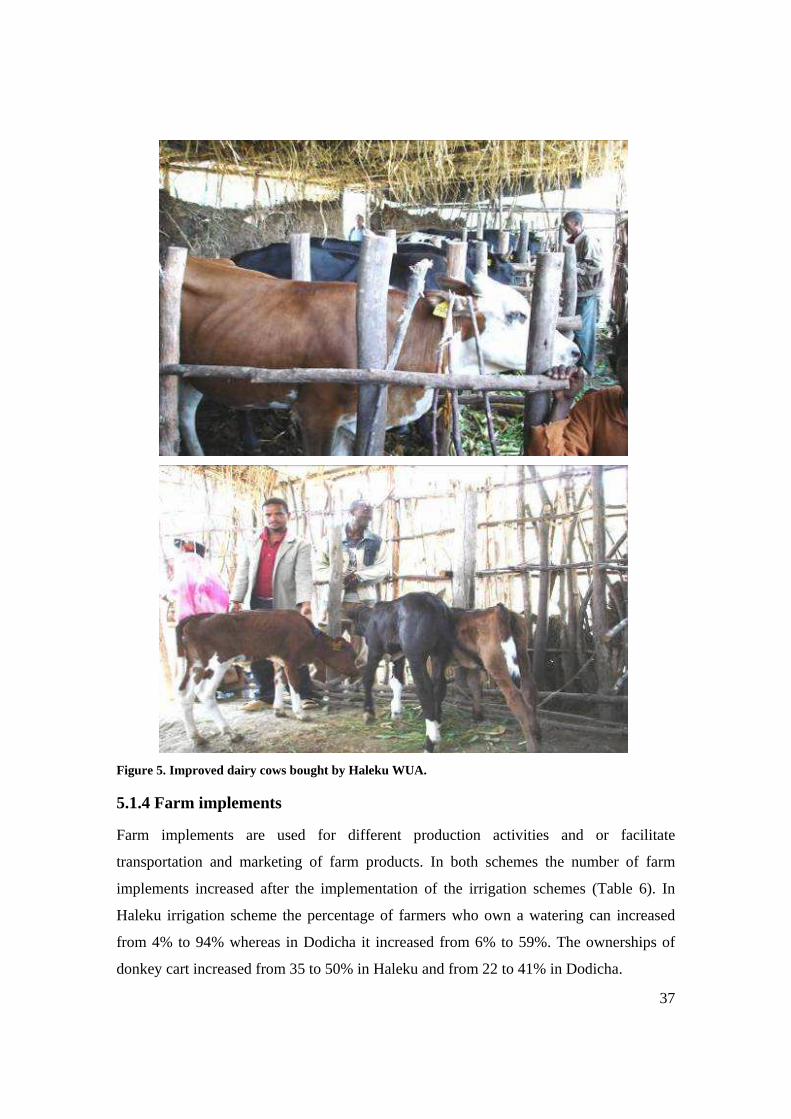
Recently, the WUA of Haleku bought eleven improved dairy cows from Adami Tullu
Oromia Agricultural Research Centre, a total investment of 24,000 EB II(Figure 5). The
WUA distributed these dairy cows over eleven members on the basis of a lottery with
binding rules to transfer newly born female heifers to the other members of the
association. Those who won the improved dairy cows paid the initial costs to buy these
cows. Now these farmers are getting 4-6 litters of milk per day per cow.
II EB=Ethiopian Birr (during the survey 1EURO= 12.45EB )
37
Figure 5. Improved dairy cows bought by Haleku WUA.
5.1.4 Farm implements
Farm implements are used for different production activities and or facilitate
transportation and marketing of farm products. In both schemes the number of farm
implements increased after the implementation of the irrigation schemes (Table 6). In
Haleku irrigation scheme the percentage of farmers who own a watering can increased
from 4% to 94% whereas in Dodicha it increased from 6% to 59%. The ownerships of
donkey cart increased from 35 to 50% in Haleku and from 22 to 41% in Dodicha.
38
Table 6. Mean farm implements per household in Haleku and Dodicha before (2001) and after (2007) implementation of the irrigation schemes.
Haleku Dodicha Type of farm
implements 2001 2007 Change 2001 2007 Change
Shovel 0.58 1.62 1.04 0.41 1.46 1.05
Folk 0.12 0.58 0.46 0.28 0.91 0.63
Cart 0.35 0.88 0.53 0.23 0.46 0.23
Watering can 0.04 1.35 1.31 0.07 0.76 0.69
Sprayer 0 0.04 0.04 0.04 0.09 0.05
Sickle 1.31 1.85 0.54 1.39 1.43 0.04
Donkey carts are very important farm implements to transport inputs to the field and
products from the field to home stead or market place. During market days the cart is also
used as a source of income for the households as it is used to transport products and
people from Adami Tullu to Ziway and vice versa.
5.1.5 Labor input
Labor is one of the major inputs used in small-scale irrigation schemes. Trained and
experienced labor is an essential production factor. Family labor is the major source of
labor for both irrigation schemes except during peak production period, i.e. transplanting,
weeding and harvesting when farmers hire additional labor. The wage rate in the area
ranges from 10-15 birr per day depending of the production period. During peak periods
wage rate increases due to shortage of labor. Both male and female laborers are involved
in the production activities. Male labors are involved in all production activities whereas
females are mostly involved in planting, weeding, and harvesting. Labor data for
different production activities are indicated in Table 7.
39
Table 7. Amount of labor used for different field operations in onion, tomato, maize and green bean in Haleku and Dodicha (in man days per 0.25 ha).
Labor requirements Scheme Production activities
Onion Tomato Maize Green bean
Land preparation 5 4 4 4
Planting 9 5 4 7
Weeding 18 11 8 11
Crop protection * 4 4 1 4
Irrigation/watering* 17 15 14 12
Cultivation 24 16 8 17
Haleku
Harvesting 17 33 5 61
Land preparation 4 4 3 4
Planting 12 6 4 8
Weeding 17 17 10 7
Crop protection * 4 4 1 4
Irrigation/watering* 17 15 11 11
Cultivation 21 15 7 15
Dodicha
Harvesting 16 36 5 57
*Labor requirements for crop protection and watering corresponds directly to the number
of spray and irrigation operations per cropping season.
40
Labor requirements for onion, tomato, and maize and green bean production are
statistically the same in both irrigation schemes (Table 8)
Table 8. Mean total labor used for production of different crops in Haleku and Dodicha (in man days per 0.25 ha).
Scheme Type of crop
Haleku Dodicha
Significance
Onion 94 93 NS
Tomato 96 93 NS
Maize 45 42 NS
Green bean 117 109 NS
NS= non significant, * significant at P< 0.05 ** significant at P< 0.01
5.1.6 Average costs and returns
The net production cost for the different crops in the irrigation schemes are summarized
in Table 9 and indicates no significant differences in individual crop production costs
between both schemes at 5% probability level.
Table 9. Mean total production costs of different crops in Haleku and Dodicha (in birr/0.25 ha). Scheme Type of crop
Haleku Dodicha
Significance
Onion 2368 2341 NS
Tomato 2305 2270 NS
Maize 986 981 NS
Green bean 2264 2187 NS
NS= non significant, * significant at P< 0.05 ** significant at P< 0.01
41
Mean yields of onion, maize and green beans are significantly higher at 1% probability
level in Haleku (Table 10).
Table 10. Average productivity of different crops in Haleku and Dodicha (in kg/0.25 ha). Scheme
Haleku Dodicha
Type of crop
Yield range Net yield Yield range Net yield
Significance
Onion 1000-6400 3462 500-6000 2379 **
Tomato 600-4200 2796 500-5000 2483 NS
Maize 200-4000 1416 200-2000 729 **
Green bean 1200-4900 2227 500-4200 1596 **
NS= non significant, * significant at P< 0.05 ** significant at P< 0.01
The net revenues obtained from onion, maize and green bean are significantly higher in
Haleku at 1% probability level but not significant for tomato (Table 11). Although net
revenues of most households are positive some farmers produced with loss. In Haleku
irrigation schemes 4% and 9% of the farmers produced tomato and green bean with
financial losses, respectively, whereas 4, 29 and 17% of the farmers produced onion,
maize and green bean with losses in Dodicha, respectively. In Haleku, 16% of farmers
produced maize with losses. The loss range and average loss per crop in the schemes are
indicated in Table 12. The standard deviation in net revenue is very high within and
between both irrigation schemes.
42
Table 11. Net revenues, range of net revenues and percentage of farmers with positive revenue for different crops in Haleku and Dodicha irrigation schemes (in birr per 0.25 ha).
Percent of farmers with
positive revenue
Revenue range Net revenue Crop type
Haleku Dodicha Haleku Dodicha Haleku Dodicha
Onion 100 96.3 1932-17246 59-17089 8155 5286
Tomato 88.5 88.9 535-10525 79-11591 5941 4789
Maize 80.8 59.3 485-6497 43-2510 1662 649
Green bean 100 79.6 176-8180 6-2849 2273 1383
Table 12. Loss ranges and net loss from production of different crops in Haleku and Dodicha (birr per 0.25 ha).
Percent of farmers with
loss
Loss range Average loss Crop type
Haleku Dodicha Haleku Dodicha Haleku Dodicha
Onion 0 3.7 - 254-398 - 376
Tomato 3.8 9.3 883 229-516 883 404
Maize 15.4 24.1 5-517 4-697 178 325
Green bean 0 16.7 - 168-828 - 472
5.1.7 Households' food security
The development of small-scale irrigation schemes in the survey areas has increased
cropping intensity and crop income. According to the survey results and group
discussions with farmers their income has increased as compared to the situation before
implementation of both irrigation schemes. Before implementation of the irrigation
schemes, farmers used rain fed production both for home consumption and to cover other
household expenses (school, cloth, health care) together with income from livestock. The
farmers indicated that the income from crop sale and livestock was not sufficient for
home consumption to cover these household expenses. As a result they faced shortages in
food, seeds for the next season and cash to buy inputs. Implementation of the irrigation
schemes helped them to diversify crops and income sources. The majority of the
households currently use rain fed staple production for home consumption and income
43
from irrigation to cover the household expenses and for saving. In Haleku, 39 and 61% of
the respondents uses irrigated products for market and both for market and home
consumption purposes, respectively (Figure 6). In Dodicha 6% of the households use
irrigated products only for home consumption, 20% for market purpose and 74% for both
purposes.
Figure 6. Production goals of irrigated crops. The major area of concern among the rural farming community is the availability of food
at household level. In Haleku, 35% of the respondents have secured their family food
consumption year round, 61% has a surplus for market purpose and 4% indicated a
worsening of their family food security after the implementation of the irrigation scheme
(Figure 7). In Dodicha, 19% of the respondents produced sufficiently to secure their
family food consumption, 38% produced a surplus for market purposes, 17% had no
change in family food security level as compared to implementation of the irrigation
scheme and 26% faced a decrease in food security.
0
10
20
30
40
50
60
70
80
% of farmers
Home consumption
Market purpose
For both
Goals of crop production
HalekuDodicha
44
Figure 7. Perception of household’s food security after implementation of the irrigation schemes.
5.1.8 Linkages of irrigation
Access to and reliable supply of water can enable farmers to adopt new technologies and
intensify cultivation, leading to increased productivity, overall higher production, and
greater returns from farming (Hussain and Bhattarai, 2003). This may open up new
employment opportunities, both on-farm and off-farm, and can improve incomes, and the
quality of life in rural areas. The farmers were interviewed about the different linkagesIII
to identify spill-over effects of small-scale irrigation schemes.
Hussain and Hanjira (2004) identified five key dimensions of how access to good
irrigation water contributes to socioeconomic uplift of rural communities and alleviate
poverty: production, consumption, employment, food security, and other social impacts
contributing to overall improved welfare. There are various linkages that connect
different fields of activities in the form of backward and forward linkages (Ray, 1998)
Forward linkages are essentially facilitators and they increase the viability of other
economic activities from the supply side. Backward linkages increase the demand for the
product of another sector. In the study area four types of linkages have been identified
although the levels of linkages are low. These are production linkages, consumption
linkages, investment linkages and employment linkages.
III In this discussion the concept of linkages refers to the development of different aspects of production activities and services created/and/or facilitated as a result of small-scale irrigation development in the area
0
10
20
30
40
50
60
70
% of farmers
Food self sufficient
Surplus for market
No change in food self sufficiency
Reduced food self sufficiency
Household food security level
Haleku Dodicha
45
Production linkages can be either backward or forward. Forward linkages relate to
marketing and processing industries while the backward linkage to input and resource
suppliers. Implementation of the irrigation schemes in the study area facilitated the
intensification and diversification of crop production and allowed the farmers to grow
several crops per year on the same plot of land (Table 3). Implementation of the irrigation
schemes also enabled to diversify from low yielding and low profitable crops to new high
yielding and more profitable crops. Before implementation of the irrigation schemes the
farmers grew maize, haricot bean, sorghum and teff. Now the production has shifted to
high value and high yielding maize variety, green bean and vegetable crops (onion,
tomato, green bean and cabbage). The intensification and diversification of crop
production also facilitated the linkages between farmers and input suppliers. The increase
in farm income created high demand for modern agricultural farm inputs such as
improved seeds, fertilizers and pesticides. Thus, irrigation development has lead to higher
production, which implies increased consumption of inputs, as well as higher production
receipts for the farmer.
Apart from production linkages there are also consumption linkages because of the higher
income from irrigation agriculture (Kirsten and Van Zyl, 1990). Crop intensification,
diversification, and market-oriented production provide food to producers as well as to
consumers. The forward consumption linkage is the increased supply of products for the
local and national markets. In the study areas maize is produced for home consumption
and local market in Adami Tullu and Ziway town. Onion and tomato are mostly produced
for markets such as Addis Ababa and Adama. Only the low grade products are used for
home consumption and local markets. Green bean is produced for export markets (mostly
Netherlands and Italy). In most case farmers sell tomato and onion before the harvest.
Green bean is sold to the private farms (Ethio-Flora) found in the locality of the irrigation
schemes that export it to European market. As a backward linkage, irrigation has
increased the household’s income and as a result increased the consumption of industrial
products like cloths, food oil, kerosene, sugar, etc.
46
The benefits of higher yields and income increased the savings of households in the study
area. At the end of each cropping season the farmers save 5-10% of their total sales.
Hirschman (1958) in Ray (1998) explained the relationship between saving rate and
investment: the higher the saving rate the greater the investment potential and the higher
the growth rate. Various investments by farmers were observed in the schemes. About
31% of the sample respondents in Haleku built a house in nearby Adami Tullu Kebele
after implementation of the scheme. Some farmers opened a kiosk in Adami Tullu. The
Haleku irrigation scheme also has started investing in improved dairy cattle. Donkeys’
carts ownership has increased after implementation of the schemes. The price of a cart
ranges from 1500-3000 birr depending on the type of cart. The establishment of the
irrigation schemes in the study areas showed more positive implication on the backward
investment linkage through investment in small businesses. The investment expenditure
in local hotels, kiosks, local drink houses, shops etc. increased in nearby Adami Tullu.
According to owners of local hotels, kiosks and shops the development of irrigation
schemes created favorable conditions for the expansion of their businesses.
The labor-intensive nature (increased cropping intensity, cropping area and crop
diversification) of irrigation development has increased the employment opportunity both
on-farm and off-farm. The irrigation farmers cultivate both rain fed and irrigated land. As
a result, family labor is not sufficient to support all production activities. This has created
employment opportunities for local landless poor and others. Irrigation development has
also created additional employment opportunities outside the irrigation sector through
increased demand for inputs and increased supply of outputs.. Off-farm employment
opportunities created due to the irrigation schemes include local traders, brokers, whole
sellers, and loaders of products. The irrigation schemes employ treasures, guards and
storehouse keepers.
47
5.1.9 Commercial aspects
Input source and utilization
Proper utilization of modern inputs such as improved seeds, chemical fertilizers,
pesticides and fungicides are basic and essential to any farm enterprise especially in the
production of high value horticultural crops.
However, the efforts to develop efficient and effective technologies have achieved
limited success in the case of small-scale farmers who are often regarded as resistant to
changes (Sands, 1986). According to him some researchers have attributed small-scale
farmers' failure to adopt improved technologies partly to the inadequacy of support
systems, such as extension services, credit, and input supplies. All farmers apply
fertilizers and pesticides
DAP and urea are the major fertilizers used. Depending on the availability of fertilizer
farmers apply 25-50 kg/0.25 ha DAP and 25 kg/0.25 ha urea (Table 13). The types of
insecticide used in both irrigation schemes are Selecron, Karate and Mitga. Fungicides
used in the schemes are Kocide, Bayleten, Pencozeb, Ridomil and Bumper. Among these
chemicals Selecron, Kocide, Pencozeb and Ridomil are mostly used chemicals in the
irrigation schemes. Often two or more chemicals are applied together depending on pest
and disease pressure. Farmers use the same type of insecticides and pesticides for tomato
and onion. Apart from lack of cash or credit services, high prices of these input and
timely availability of inputs are reasons for underutilization of farm inputs. The amount
of inputs distributed by the association does not meet the demand of farmers resulting in
yield reduction. Some farmers also apply manure to increase soil fertility of their plot
Table 13.
48
Table 13. The average amount of inputs used in both schemes (per 0.25 ha). Insecticide/fungicide Seed Crop
variety
Am
ount
(kg
)
DA
P (
kg)
Ure
a in
(kg
)
Sel
ecr
on (
lt)
Koc
ide
in (
kg)
Pen
coze
b (lt
)
Rid
omil
(kg.
)
Onion Bombe.red, Adam red 2 25-50 25 1 1 1.5 0.5
Tomato Roma B 0.1 25-50 25 1 1 1.5 0.5
Green bean
Zera 6 25 25 1 1 1 0.5
Maize BH660, PHB-2553 and Pioner
6 25 25 0.5
The mean chemical application frequency per growing season is the same for tomato and
onion (Table 14). The application frequency depends on the growing season, i.e.
frequency of application is high during the main growing season (rainy season) due to
higher pests and disease pressure. Green bean needs only sixty five days for harvesting
while tomato and onion needs 90-150 days depending on the variety used. Although
green bean has a shorter growing season, it needs frequent pesticide applications since it
is produced for export markets which require strict disease control to guarantee product
quality.
Table 14. Mean pesticide application frequency in different crops in Haleku and Dodicha. Crop Minimum Maximum Mean Std. Deviation
Onion 3 6 4.09 1.05
Tomato 2 9 4.09 1.61
Green bean 2 8 3.73 1.36
Maize 0 2 0.84 0.77
49
High yielding seed varieties are another important input that contributes to high output,
but access in the study area is very low. The sources of seeds are private shops, individual
seed producers and local open markets. Due to the high price of seeds in private shops as
compared to open markets and individual seed producers most of the farmers buy seeds
from local open markets and local seed producers. The quality of seeds from local open
markets is often low which affects yield negatively. Seeds from local open markets is of
unknown purity and usually susceptible to disease, pests and low yielding (Lemma,
2004). There is no government institution responsible for multiplication and distribution
of vegetable seeds in the Woreda. Therefore, farmers use mainly low yielding local crop
varieties. Recently, the number of private farmers producing vegetable seeds is increasing
in the CRV. In 1996 about 13 % of onion and tomato seeds were produced by small
private vegetable growers in the CRV (Dawit et al., 2004), in 2002 it was 50%. However,
the sample irrigation schemes have no experience in vegetable seed production. The
sources of other agro-chemical inputs (fertilizer, pesticides and fungicides) are unions
(mostly Meki Batu vegetable union) and private shops. The sale committee of the WUAs
is responsible for buying inputs (seeds, fertilizers, and chemicals) and distributes them to
the members on credit bases. Depending on the availability, these inputs are distributed
for the farmers on fixed quota bases.
Out put marketing
As horticultural crops have a short shelf-life marketing is a central issue in their
production process. Household decisions and responses are governed by markets and
related institutions (FAO, 1989). The price of horticultural crops fluctuate from year to
year, season to season, from day to day and from market to market (
Table 15). Therefore, profitability of horticultural crops depends on marketing skills and
getting good market information rather than production expertise (FAO, 1989). The great
variation in prices makes horticultural crop production potentially very profitable but also
very risky. The study areas are found near the main highway from Addis Ababa to
Awassa via Shashemene and are easily accessible to whole traders from Awassa,
Shashemene, Ziway, Adama and Addis Ababa. Although, marketing is one of the crucial
components of agricultural development, it is not well addressed by extension agents. For
50
example agricultural extension does not deliver market information to farmers as it is
outside its mandate. The SMSs and DAs have not received training on facilitating market
services. The lack of full market information reduces bargaining power of the farmers
and forces them to accept prices given by traders. The WUAs have their own sale
committee which is responsible for marketing of the products. Generally, the WUAs sell
their products to traders or brokers except for low quality products which are sold on
local markets.
Table 15. Crop prices during the study period (2007 cropping season) in different market places. Market out let Onion
Big super market (Shoa Super market) 5.70 6.00 - 5.50
Credit and saving services
Credit service is very important for capital intensive farming like horticulture. In the
study areas, there are no well-established credit services for farmers. Particularly, in
Dodicha, production activities are highly constrained by the lack of credit services.
Haleku irrigation scheme receives credits from RCWDA to buy the necessary inputs for
crop production. Both irrigation schemes save 5-10% of their total sale at the end of each
cropping season and use these savings for pump maintenance and buying inputs.
Agricultural extension services
Extension is the mechanism by which information and technologies are delivered to
farmers (Moris, 1991). A more comprehensive definition of extension service is given by
the World Bank as a ‘process that helps farmers to become aware of improved
technologies and adopt them in order to improve their efficiency, income and welfare’
Purcell and Anderson (1997) in Gebremedihn and Pedon (2006). Extension services in
51
Ethiopia until 2002 focused on increasing production and productivity in view of
achieving food security Mathewos and Chandargi (2005) in Gebremedihn and Pedon
(2006). Most farmers are illiterate and can not read information in printed form. Thus,
DAs need to disseminate agricultural information to farmers through other means.
Adami Tullu Jido Kombolcha Woreda agricultural office has a shortage of Subject Matter
Specialists (SMS) and DAs to support farmers. The number of DAs in both peasant
associations is very low. In Dodicha there are two DAs of which one works on animal
sciences and the other on crop production and natural resources. The latter works on
horticultural crops without any special training on these crops. The WUA had employed a
skilled specialist on vegetable production with a salary of Birr 500 per month, but a
nearby private investor paid a better salary and he left the WUA. In Haleku there is no
DA but there is one social worker employed by RCWDA to assist farmers. The absence
of DAs and little experience of farmers with horticultural crop production hamper
improvement. The limited numbers of DAs are assigned with a lot of work
(administration and political committees, tax collection, aid distribution, etc.) in addition
to extension services. The involvement of DAs in administration and political issues
could reduce the trusts between farmers and DAs. In addition, there is a serious shortage
of trained personnel in agricultural economics, agribusiness and related disciplines in the
Woreda agriculture office. Facilitation of linkages between producers and market parties
and between farmers and credit and input suppliers is lacking in the study areas.
The farmers in the study area have no training on horticultural crop production and are
practicing irrigation without much know-how on agronomy, water application and crop
protection. For example, the farmers in both irrigation schemes do not use sticks in
tomato to tie up the plants. Instead tomato fruits are laid down on the ground reducing the
quality due to rotting, insect damage and sun bleaching.
52
5.2 Institutional arrangement
5.2.1 Organization of the irrigation schemes
Poven (2004) pointed out that WUAs are the most frequently recommended
organizational form for management of irrigation schemes. WUAs are legal entities
which are supposed to have full control over the irrigation infrastructure in their scheme.
Establishing a strong irrigation organization is one of the major aspects for a successful
and sustainable irrigation management (Boelens, 1998). Sustainable management of
farmers-managed irrigation systems requires well established rules that ensure the interest
of all farmers. The two irrigation schemes studied have a legal certificate from the
Cooperative Society of Oromia and turned to cooperative society. The organizational
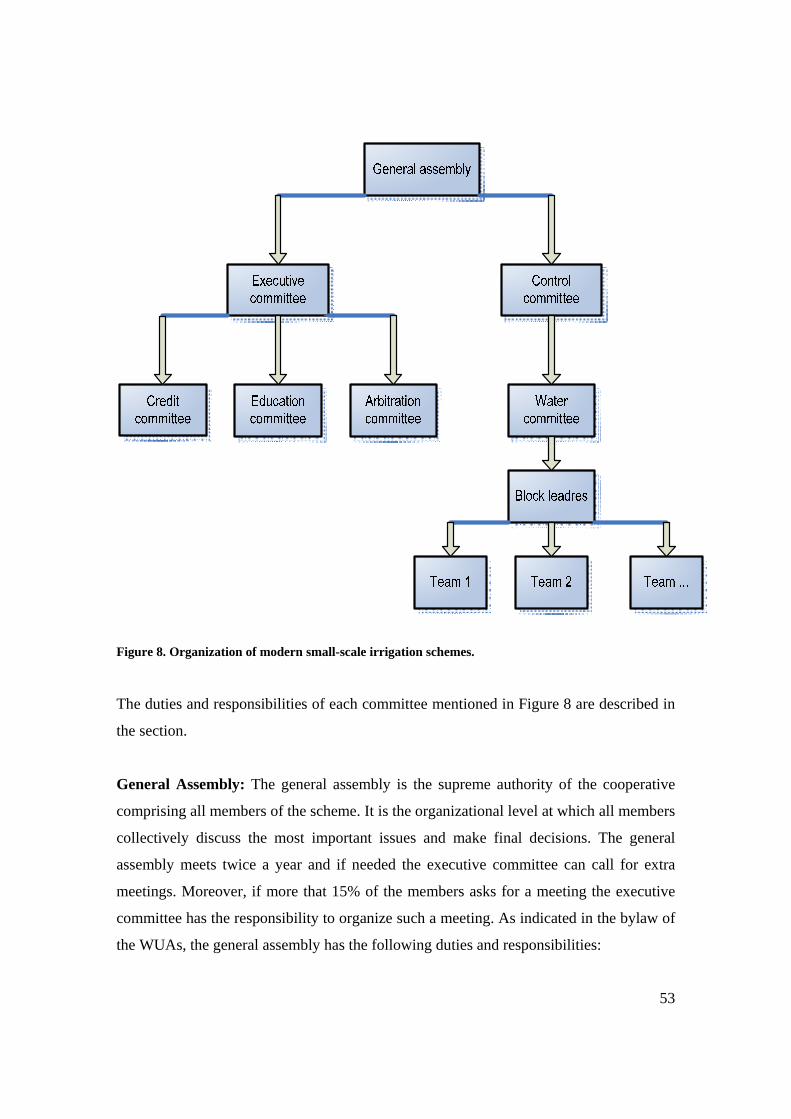
structure of Cooperative Society (Certified WUAs) is indicated in the Figure 8. This
structure is developed by OIDA for modern small-scale irrigation schemes in Oromia.
Certification is important to get legal access to credit services from governmental and
non-governmental organizations. They can also legally enter into different agreements
with different unions, governmental and non-governmental organizations. Uncertified
WUAs have not such legal rights.
53
Figure 8. Organization of modern small-scale irrigation schemes. The duties and responsibilities of each committee mentioned in Figure 8 are described in
the section.
General Assembly: The general assembly is the supreme authority of the cooperative
comprising all members of the scheme. It is the organizational level at which all members
collectively discuss the most important issues and make final decisions. The general
assembly meets twice a year and if needed the executive committee can call for extra
meetings. Moreover, if more that 15% of the members asks for a meeting the executive
committee has the responsibility to organize such a meeting. As indicated in the bylaw of
the WUAs, the general assembly has the following duties and responsibilities:
54
� Elect all committee members.
� Approve annual plan and budget.
� Discuss annual reports and the audit report and pass the needed decision.
� Consider applications against the exclusion of members and refusal of
membership by the management committee.
� Approve and amend the bylaw and internal regulation.
� Assign internal auditor and or also assign the external audit with the approval of
appropriate authority.
� Decide on the employment of workers.
� Settle all disputes that may arise among the committee.
� Approve regulation regarding staff employment promotion and maximum
payment and carry out other necessary activities.
Executive Committee: The executive committee is the governing authority elected by
the general assembly and subject to any decision from the general assembly and
responsible to undertake day-to-day management of the scheme. The five committee
members are elected from the members of the association. The term of office of the
management committee is three years and one member can not be elected more than two
consecutive terms. They are responsible for all losses and shortages incurred because of
actions contrary to the proclamation, bylaw and decision of the general assembly. In
general this committee performs the following duties and responsibilities:
� Prepare annual production plan and budget and implement it upon approval by the
members.
� Prepare draft bylaw and internal regulations and implement them upon approval.
� Ensure that the proper accounting records are kept in the office.
� Collect regulation fee, sale share and saving.
� Prepare guidelines on employment of staff and implement same upon approval by
the general assembly.
� Settle disputes that may arise among the members and the cooperative before it is
sent to general assembly.
� Facilitate the approval of employment of workers by the general assembly
55
� Perform or authorize any action consistent with the proclamation regulation and
bylaw unless specifically reserved for general assembly.
� Delegate in writing an officer or employee of the society such of its duties as it
deem necessary.
� Ensures that the employees of the societies have carried out their duties and
responsibilities.
� Prepare schedule for water distribution.
� Takes care of physical structures such as water gates, canals and other properties
of the association.
� Monitoring pump operation.
Control Committee: The control committee is also elected by the general assembly and
accountable to it. The committee consists of three members and they are elected every
three year. The general responsibility of this committee is to monitor the activities of the
different committees and individuals of the association whether they are operating
according the bylaws. In particular the control committee is responsible for the following
activities:
� Prepare monthly audit report and make repot for the members on general meeting
of WUA.
� Monitor whether the executive committee accomplished their responsibility.
� Monitor the proper use of money and other resources of the WUA.
� Monitor the implementation of decisions passed at general meeting.
� Monitor credit and saving activity of the WUAs, etc.
Water committee is established under the control committee and accountable to it. To
decentralize the scheme management and make the operation of the scheme more
effective different teams are organized under the water committee. For that reason the
irrigation land has been divided into blocks that comprise a team and all members of the
association are grouped in one of the teams. At Haleku there are six teams and each team
has 12 members. Every team has a team leader for water and input distribution. The team
leaders are responsible to inform the members about the water distribution schedule
56
prepared by the executive committee. The team leaders also record the amount of lt/kilo
watt power that the group has used for pumping irrigation water. The most important
function is the timely distribution of irrigation water to the team members. Some of the
responsibilities of this committee are:
� Coordinate activities of team members (canal maintenance, cleaning, etc.).
� Implement water distribution plan prepared by the executive committee and
monitor proper application of water at plot level.
� Monitor implementation of production plan prepared by the executive committee
� Coordinate sale activities.
� Distribute input to members of the team and assure proper use of inputs.
� Solve disputes among the different team leaders.
Arbitration or conflict management committee is elected by the general assembly and
consists of three elder people who are respected by the community and it is their
responsibility to solve any disputes among the beneficiaries, between different
committees and between the committees and beneficiaries. This committee is accountable
for executive committee and makes a report of their accomplishment to executive
committee once every three months.
Education committee: Education committee is another committee organized under the
executive committee consisting of three members elected by the general assembly. The
responsibilities of this committee are the following:
� Organize training for WUA members, committee members and new employees.
� Advice members on the use of available credit.
� Explain the association bylaw and internal regulations.
� Buy, collect and prepare different posters and educational materials which are
important to transfer information.
� Give advice to different committee members.
� Collect information which is important for the development of the association.
57
Saving and credit committee: The saving and credit committee arranges credit facility
for the members and collects savings after the product is sold. The association can only
give credit to its members and for similar types of associations. Before credit is provided
the executive committee insures that the requested credit is for reasonable purpose and
will be paid back. The credit committee submits the credit applications from users to the
executive committee for approval. The credit needs to be paid back at the end of each
production season after the product is sold. If the user is not able to pay back the credit at
the end of the production season the executive committee can extend the payment period
with four months.
The interest rate depends on source of credit. If it is from own WUA sources the interest
rate is 7.5% whereas it is 10% for money from other organizations. According to the
WUAs bylaw if members use credit for other purposes than the intended purpose he/she
is obliged to repay the credit and the full interest before the intended period. The saving
and credit committee encourage members and facilitate conditions to open an own bank
account to save money. The users can save money within the association bank account
and get the interest rate paid by the bank. This committee also negotiates with traders or
brokers about the product price of individual water users/growers or of the WUA. The
committee informs the producers about the price agreement with the traders. The
producers receive the amount of money which is left after all input costs given on credit
and association savings are deducted from the gross sale. At the end of each production
season the users save 5-10% of their total sale. To become member of the WUA one has
to fulfill the following criteria:
� The livelihood is based on agriculture.
� A plot of land in the irrigation command area.
� Willing to exchange land that he/she may own more than the maximum (0.5 ha)
holding allowed in smallholder irrigation schemes.
� Dweller of the peasant association where the project is operating.
� His/her age must be 18 or older.
� He/she agrees with the objectives and bylaw of the cooperative.
� In good physical well-being
58
� Not member of another irrigation cooperative
5.2.2 Irrigation scheme management
All management activities in the schemes are carried out by the WUAs. The main
activities include repair, maintenance of canals, supervision of water distribution, settling
any conflicts and raising internal resources to sustain the WUA. Where farmers cultivate
on adjacent plots using common pumps, certain tasks and activities should be properly
coordinated to smoothly run the irrigation scheme and avoid possible conflicts (Stern,
1988). In the following the management performance of the irrigation schemes is
described based on the qualitative survey, interviews and group discussions.
5.2.3 Irrigation infrastructure
Both irrigation schemes provide water using a motor pump that discharges water to a
concrete canal at the top of a raised embankment. Through well-constructed secondary
and tertiary canals water is applied using furrow irrigation. Haleku has two motor pumps
(diesel and electric pump) which are alternatively used depending on the availability of
fuel and electricity. The electricity costs are lower than fuel costs but sometimes farmers
pay for higher electricity costs since the rate of electricity per kilo watt is not fixed.
Dodicha has two diesel pumps of which one is working. The pump capacity is too small
for the irrigated area and there is no standby pump when the pump fails which happens
frequently. Rodents are a major problem along the main canals and causing water losses
in both irrigation schemes.
5.2.4 Water distribution and management
There are two major water distribution systems, i.e. free irrigation and scheduled
distribution. The choice between both distribution systems depends on the availability of
water. The former distribution system is used when there is sufficient water available
whereas the later is used when water is scarce. In both Haleku and Dodicha pumps are
owned by the groups, which need scheduled water distribution to avoid potential water
conflicts. In Haleku the scheme is divided into three blocks to facilitate the distribution of
water and to rotate crops. Every WUA member has a plot of land in each block. Crops
planted in each block are the same and determined by the executive committee. Members
59
are imposed to follow the production plan approved by the general assembly. The failure
to follow the production plan results in penalty. In Haleku, there are four teams which are
organized according to the nearness of plots. The team leaders are responsible for the
proper distribution and allocation of water according to the schedule of the water
committee. Major problems in Haleku (in decreasing level of importance) are the lack of
strict water distribution schedule, poor punishment of farmers break the association
bylaws, water theft and poor coordination by water committee (Figure 10). In Dodicha
major problems relate to poor coordination by water committee, lack of strict water
rotation, water theft and poor imposition of punishment against illegal water users.
Figure 9. Water distribution problems in Haleku and Dodicha irrigation schemes. Based on the interviews and group discussions it became clear that there are no major
problems with respect to field water management. The shortage of water in Dodicha and
high pumping costs in both irrigation schemes are an incentive to use water carefully.
However, water losses occur due to rodents and lack of proper clearing of weeds and
other grasses in the canal lines. About 85% of the respondents in Haleku indicated to
0
5
10
15
20
25
30
35
40
45
Poor coordination
Lack of punishment
Water distribution is not strict
Water theft No problem
problems in water distribution
% of farmers
Haleku Dodicha
60
receive enough irrigation water (Figure 10). In contrast, 80% of the households in
Dodicha receive to little irrigation water.
Figure 10. Percentage of households facing irrigation water shortages in Haleku and Dodicha Due to the lack of coordination, pump failure and or low pumping capacity and lack of
fuel and oil, water is not received when it is needed by the farmers. The severity of these
problems is less in Haleku since it has two pumps and the management of the scheme is
better organized. In Haleku, 73% of the households receive sufficient irrigation water
(Figure 11). In Dodicha 85% of the respondents pointed out that they do not receive
enough water when needed for irrigation (Figure 11).
Figure 11. Availability of irrigation water at the time when needed by farmers in Haleku and Dodicha
0
10
20
30
40
50
60
70
80
90
% of farmers
Haleku Dodicha
schemes
yes no
0
10
20
30
40
50
60
70
80
90
% of farmers
Haleku Dodicha Schemes
yes no
61
Farmers also indicated unequal water distribution, i.e. 27% and 65% in Haleku and
Dodicha, respectively mentioned this issue. Some of the members use more water than
the others. This problem seems more severe in Dodicha where farmers associate unequal
distribution to head-end farmers, committee members, and farmers with a good relation
with the water committee (Figure 12). In Haleku about 60% of the respondents think that
water distribution in the scheme is fair, in contrast with Dodicha where only 22% of the
respondents are convinced of equal water distribution.
Figure 12. Opinion of farmers on the equal distribution of irrigation water in Haleku and Dodicha scheme In both irrigation schemes the use of water from irrigation canals for other purposes than
irrigation is forbidden. Only 5% of the respondents use irrigation water illegally for other
purposes (house hold and watering of cattle). Violation of this rule may lead to
punishment and charges which are sufficient incentives to use irrigation water only for
agriculture.
In general, leasing out of irrigation land is not allowed according to WUA regulations
and only possible when a member is unable to work on his/her plot due to health-related
and financial problems. Approval is needed from the executive committee. According to
the bylaws of the WUAs every member is allowed to leave the association but s/he has to
0
10
20
30
40
50
60
% of farmers
Committee members
Head end farmers
Members having Good relation with head end farmers
All have equal access
Farmer’s opinion on water distribution issues
Haleku Dodicha
62
leave the irrigated land to the association. The association allows another interested
individual from the same PA and the new member exchange the same plot size with the
out going member. Animals are not permitted to graze in the irrigation command area.
The enforcement of the organizational bylaw is higher at Haleku compared to Dodicha.
Poor coordination of the committee and corruption results in less enforcement in
Dodicha.
There are also conflicts in the irrigation schemes, i.e. among committee members, among
members, and between committee and members. There are various sources of conflicts in
both irrigation schemes, i.e. water theft; unfair water distribution, product marketing,
corruption, untimely revenue distribution and free riding of members. The conflicts seem
more severe in Dodicha and associated with poor scheme coordination, water shortages
and corruption. About 75% of the respondents in Dodicha mentioned conflicts with
neighboring farmers or committee members against about 25% of the respondents in
Haleku (Figure 13).
Figure 13. Farmers facing conflicts in Haleku and Dodicha
0
10
20
30
40
50
60
70
80
% of farmers
Haleku Dodicha Schemes
yes no
63
5.2.5 Maintenance
Maintenance of the irrigation infrastructure is done by the WUA members. The Water
committee is responsible for the mobilization of resources required for maintenance
activities and for the scheduling of maintenance of the primary, secondary and tertiary
canals. Maintenance activities within a block covering small areas are done by the block
or team members and coordinated by the team leaders. In general , WUAs are effective in
the management of water allocation and distribution but often maintenance and especially
investment activities are not regularly performed (Agarwal, 2000; Vermillion, 1999).
The maintenance costs for motor pumps and irrigation infrastructure are covered by the
WUAs in both irrigation schemes. The pump O&M costs during the growing season are
equally distributed among the water users and the money is paid back to the WUAs at the
end of the growing season after the product is sold. The team covers the expenses for fuel
and motor oil that can be paid after the product is sold. Team leaders withdraw fuel and
oil from the WUAs store and keep records of the amount of fuel and oil. The store keeper
also keeps records of all inputs used by each team.
In Dodicha, the intensive use of the one pump available and the low technical knowledge
leads to frequent pump failures and high repair costs, i.e. 45,000 EB in 2007. Major
concern of the farmers is pump failure when they need water for their crops. The high
pump maintenance costs, other costs like the per diems of committee members and
corruption discouraged farmers in Dodicha to contribute to scheme maintenance. There is
no big problem with labor mobilization and enforcement of bylaws in Haleku irrigation
scheme. In Haleku 69 and 30% of the respondents indicated that their scheme is well
organized and fairly well organized, respectively (Figure 14). In contrast, in Dodicha
only 15% of the respondents are satisfied with the scheme organization.
64
Figure 14. Opinion of farmers about their scheme organization in Haleku and Dodicha In Haleku, high maintenance cost (50%), poor enforcement of sanctions (18%), low level
of members participation (17%) and poor scheme coordination (15%) are the major
problems in Haleku (Figure 15). Poor scheme coordination (40%), low level of member’s
participation (31%), high maintenance costs (15%) and poor enforcement of sanctions
(13%) are the major problem in Dodicha (Figure 15).
Figure 15. Problems in scheme maintenance according farmers in Haleku and Dodicha Both schemes have some common problems, i.e. marketing, lack of extension services,
absence of cold post-harvest storage and lack of credit facility. Poor scheme coordination
0
10
20
30
40
50
60
70
% of farmers
Well organized Fairy well organized Poorly organized
Level of organization
HalekuDodicha
0
5
10
15
20
25
30
35
40
45
50
% of farmers
Poor coordination
Poor imposition of sanction
Low members participation
High maintenance cost
Major problems in scheme maintenance
HalekuDodicha
65
and lack of motor pump are the main problems in Dodicha irrigation scheme. 61.11% of
the respondents in Dodicha irrigation scheme have shown that shortage of motor pump is
the major problem in the irrigation scheme. The marketing problem is less relevant in
Dodicha since most farmers do not produce for the market. Sufficient irrigation water and
good scheme coordination in Haleku is associated with higher yields (Table 10) and a
higher surplus which is marketed. Therefore, marketing is more a problem in Haleku, i.e.
it is mentioned by 77% of the respondents as major problem in Haleku.
5.2.6 Transaction costs in irrigation scheme management
The net revenue differences between Haleku and Dodicha for onion, tomato, maize and
green bean are 2560, 655, 1266 and 1210 birr/0.25 ha, respectively. These differences can
be considered the transaction costs associated with poor scheme organization and
management, lack of credit facilities, lack or absence of supervision and corruption in
Dodicha.
5.3 Environmental impacts small-scale irrigation
Although irrigated agriculture in the study area has contributed to increased food
production and to over all socio-economic development, irrigation in general has been
subject to increased criticism over the past decades, including the concern on socio-
economic inequality, social disruption and environmental degradation. During the field
survey physical observation on soil erosion and deforestation was made. Also
information was collected concerning land use change, plot fertility and human and
animal disease occurrences due to implementation of irrigation schemes in the area.
According to the information from farmers, the pressure on the surrounding acacia trees
has been slightly decreased because most WUAs members produce enough food for their
families. Therefore, the dependency on income from charcoal and fuel wood during bad
years has decreased. About 69 and 78 % of the respondents indicated that there is no land
use change at Haleku and Dodicha irrigation scheme, respectively. The current irrigation
command area was under rain fed crop production in the past. On the other hand, 31 and
22% of the respondents indicated land use changes, i.e. increased deforestation at Haleku
and Dodicha peasant association mainly associated with deforestation activities of non-
66
members living in the area. In both irrigation schemes no soil erosion observed due to the
implementation of the irrigation schemes.
However, the increase in the irrigated area especially around Lake Ziway has a
considerable effect on the Lake water level (Jansen et al., 2007): the minimum, maximum
and average levels of Lake Ziway have significantly decreased since 2002, which is
associated with an increase in the number of pumps along Lake Ziway and along the
Meki River, upstream of Lake Ziway. The other effect of irrigation development around
Lake Ziway is the increase of siltation. According to information from the Woreda
Agricultural Office, small-scale farmers cultivate the shore around the lake during the dry
season when the water body shrinks and this increases siltation during the rainy season.
The sample households have different opinions regarding fertility of their plots, i.e. 65,
24 and 11% of the respondents in Haleku and 54, 23 and 23% in Dodicha stated that it
increased, decreased and showed no change after the implementation of the irrigation
schemes, respectively. The use of manure and chemical fertilizers were mentioned as
reason for increased soil fertility while the continuous cultivation is mentioned as a
reason for decreasing soil fertility. Sample respondents did not indicate an increase of
human or animal diseases after implementation of the irrigation schemes.
67
6. Discussion
This chapter discusses the main findings presented in Chapter 5 and my personal
observations during the interviews, group discussions and field visit.
Main findings
Households’ income situation and food security condition
This study shows that small-scale irrigation schemes increased average households’
income compared to before implementation of these schemes. Irrigation increased crop
diversification, cropping intensity from one crop to two or three crops per year,
production volume, households’ income and consumption and employment. Access to
irrigation water created the opportunity for the households to diversify their income base
and reduced their dependency on rain fed agriculture and livestock. This reduced their
vulnerability to the seasonality of agricultural production and external socks. About 70%
(96% in Haleku and 57% in Dodicha) of the household respondents secured their family
food consumption through increased income from irrigation.
Institutional arrangement
All O&M activities in both irrigation schemes are coordinated by WUAs committees.
There are some important issues identified in this study that constrain the coordination in
the schemes, especially in Dodicha. After establishment of this scheme land was
reallocated among farmers. Those who owned more than 0.5 ha in the scheme site gave
land use ownership right to their children and wives and not to others without land in the
irrigation command area. Therefore, the land remained within the families. However,
scheme expenses such as salary for guards, committee per diem, pump maintenance and
service charges are equally shared and paid by WUA members without taking in to
account the land holding size. Some households find this unfair and it was a reason for
low participation in contribution for O&M, canal cleaning and maintenances.
In both irrigation schemes the annual production plan is prepared by the executive
committee and individual farmers are obliged to follow it. Some farmers in both
68
irrigation schemes mentioned this as constraint for crop diversification. One farmer said
“I know that hot pepper requires less water, less chemical input while it is less perishable
and more profitable than tomato and onion, but I am not allowed to plant the crop”.
Although the production plan at WUA level facilitates water distribution and marketing
of products, it is important to assess the market potential of other crops and explore ways
to incorporate alternative crops in the production plan.
Supervision and monitoring of WUAs by Woreda agricultural offices hardly happens
contributing to low economic performances of both irrigation schemes, especially of
Dodicha. The transaction costs for supervision and monitoring of schemes by the Woreda
agricultural office is higher than by RCWDA supervising Haleku. Since there are many
small-scale irrigation schemes requiring supervision from the Woreda agricultural office,
Dodicha gets little supervision and monitoring. CTA (2003) in its study on small-scale
irrigation schemes in Sub-Saharan Africa concluded that government-supported projects
consistently ranked last in the effectiveness of their support to small-scale irrigation after
NGOs, donors and commercial farmers. Moreover, NGO-supported schemes were more
successful in integrating diverse activities associated with irrigation development than
government-supported schemes.
According to farmers in Dodicha lack of monitoring from the Woreda agricultural office
opened a way for corruption. Most farmers indicated a lack of transparency of financial
scheme management. Since there is no external auditing, committees prepare fake
receipts for different expenses, which increased transaction costs of the scheme. For
example, one farmer said “my product was sold at 17,280 birr and I only received 7,000
birr form WUA. Most of the costs included in the production costs were unknown to me
and now I really hate to work in the association”. Another farmer said in Oromo language
“Haala maallaqa qabiinsaa irratti iftoominni fi to’annaan waan hin jirreef koreen
nyaattee nufixxe” which means that because of a lack of transparency in financial book
keeping the committees are taking away a large share of the revenues.
69
Limited pump capacity, high cost of pump maintenance and lack of transparency
(corruption), poor scheme organization are main problems in Dodicha. The WUA has
only one functioning pump and therefore, part of the scheme was not in production.
Limited pump capacity led to competition for water and created conflicts and water theft.
The variation in crop yields within and between both schemes is very high. The reason
for the high variation is not addressed in this study but the water distribution problems in
Dodicha due to limited pump capacity could be related to these high yield variations.
However, variation in yields is also very high between adjacent farmers due to
differences in crop management (timely weeding, tillage and use of agrochemicals, etc.).
Extension service provision
Horticultural crop production is knowledge intensive and requires careful crop
management starting from nursery to post-harvest handling and marketing. Therefore,
education and training of farmers is extremely important. Educated and trained farmers
can use information from different sources i.e. folders, posters and information on input
packages. In Haleku most farmers have attended primary and secondary education and
this might have contributed to the better field management observed and to higher profits.
Moreover, education is an important factor for WUAs since the entire management is
done by the committees elected by its members. In particular financial management
(book keeping of input prices, input use, yields and revenue distribution) needs good
book keeping procedures to guarantee transparency and to avoid possible conflicts within
WUAs. The provision of agricultural extension services in both irrigation schemes is very
low. There are no DAs trained in horticulture to advice farmers, while farmers in both
schemes have little experience in horticulture. For example, farmers had problems with
identification of various crop pests and diseases which is required for the proper
application of agro-chemicals.
During field visits it was also observed that many agronomic practices are not according
to the recommendations. Plant spacing, threshold level for applying agrochemicals and
the amount of irrigation water are based on farmers’ knowledge. In both irrigation
70
schemes farmers do not use sticks in tomato production to tie up plants. Unavailability of
the sticks and high cost were mentioned as reasons for not using sticks. Instead tomato
fruits are laid down on the ground reducing the quality due to rotting, insect damage and
sun bleaching. Consequently, yield losses may be greater than the cost of using sticks.
The other problem, especially in Haleku is product marketing. Most of horticultural
growers follow a similar cropping calendar and the seasonality of production results in a
high supply of the same product and consequently low prices. The WUAs have no
planning system to match production and demand better. Moreover, there are no active
unions in the area that coordinate the WUAs to increase their bargaining power in
marketing of their product. About 81% and 77% of tomato and onion around Ziway are
traded at farm get level, respectively (Jaleta, 2006). Since the WUAs have little market
information their bargaining power is low and makes them price-takers instead of price-
setters (Cartom, 1994 in Jaleta, 2006).
Transaction costs
According to Ostrom (1992) in Poven (2004) free riding, rent seeking, and corruption are
the major problems (opportunistic behavior) in many irrigation systems. These problems
were also observed in Haleku and especially in Dodicha. According to Easter and Zekri
(2003), if power imbalances prevail at the community level, more decentralized
approaches to irrigation management may lead to rent-seeking and corruption and thus
may be socially undesirable. Lack of training and skills make farmers more dependent on
WUA staff and encourages informal arrangements and corruption (Neubert et al., 2002).
The lack of auditing and monitoring system and little experience of farmers in irrigation
created opportunity for corruption. In irrigation systems corruption is prevalent in the
assessment and collection of revenues, construction and maintenance works, and water
allocation and distribution (Theesfeld, 2001). According to UNDP (2004) in (Tropp and
Stålgren, 2005), corruption is a function of monopoly and discretion minus
accountability, integrity and transparency. The presence of corruption and other related
problems in Dodicha increased transaction costs of coordination and management.
71
Milligrom and Roberts (1992) in Pevon (2004) explain transaction costs as the costs for
operating the system, i.e. the costs for coordination and motivation. In Dodicha, the poor
performance in coordinating and managing the scheme created many other interlinked
problems increasing the transaction costs and low participation of members in canal
maintenances and contribution to fees for pump maintenance. Haleku and Dodicha are
close to each other (about 7 km) so that most conditions (climate, market access and
water sources) are the same. However, the differences in mean crop net revenues between
both schemes are considerable and can be considered the transaction costs due to poor
coordination and management in Dodicha.
Environmental impacts of irrigation
Compared to large and medium scale irrigation projects small-scale irrigation scheme are
promoted because of their potentially lower negative environmental impacts, low
investment cost, ease in maintenance, and low management requirements (CTA, 2003).
During the study field visits were made to WUA fields, state and private farms. In both
state and private farms soil salinity was observed although most schemes are quite recent.
Environmental problems associated with small-scale irrigation schemes appear low.
However, further study is needed to identify the impacts of small-scale irrigation schemes
on soil quality and ground water quantity and quality.
72
7. Conclusions and recommendations
To enhance the productivity of the agricultural sector and to improve food security, the
Ethiopian Government designed the Agricultural Development Led Industrialization
strategy and one of the policies within this strategy is to stimulate and/or support the
development of small-scale irrigation. Small-scale irrigation schemes aim to increase
agricultural production and to contribute to improved food security through improving
income of participating farmers. Based on this study, various lessons can be learned for
improving the sustainability of small scale irrigation schemes:
The analysis of the costs and revenues of various production activities in both irrigation
schemes indicates positive crop revenue. The net revenue of four different crops (per 0.25
ha) ranged from 7040 to 33298 in Haleku and from 609 to 31040 birr in Dodicha. Except
for tomato the net revenues from three different crops (onion, maize and green bean) are
statistically significantly higher in Haleku at 1% probability level. Although mainly
assessed qualitatively, irrigated farmers perceived their food security condition better
than compared to the situation before implementation of the irrigation schemes. In
Dodicha, land holding size and number of animals decreased whereas the number of farm
implements increased.
In both irrigation schemes there are no location-specific recommendations for input use
and, therefore the farmers apply different rates based on the availability of inputs.
Improved management recommendations and better skills of farmers to apply inputs can
improve the yield performance in both schemes considerably.
WUAs committees are in charge of the coordination and management in both irrigation
schemes. The institutional performance has a great impact on the profitability of schemes.
In Haleku committees and farmers cooperate well and WUA committees are transparent
creating trust between farmers and committee members. Members are actively
participating in the management of their scheme. The organization (for maintenance,
water distribution, marketing, input and revenue distribution) in Haleku is better than in
73
Dodicha. The low level of transparency in financial issues and poor coordination in
Dodicha results in a lower economic performance and farmers may loose interests in
community-based management if this situation does not improve. The lack of supervision
and monitoring from the Woreda agricultural office contributed to mismanagement and
corruption. As a result, transaction costs are higher in the Dodicha scheme.
Among others, one of the benefits of small-scale irrigation schemes is their potentially
lower environmental impacts compared to large scale schemes. Soil erosion was not
observed in both schemes and according to farmers little water is wasted as high costs of
fuel are a strong incentive for efficient water use.
Lack or absence of DAs trained in horticulture and crop protections are the main
production constraints in both irrigation schemes. Low crop yields are associated with
poor agronomic practices. Marketing of product is another major constraint faced in both
irrigation schemes. Due to incomplete market information and the perishable nature of
most vegetables bargaining power of WUAs is low and usually the product price is set by
traders or brokers. Provision of extension services from the Woreda agricultural office
hardly exists in both irrigation schemes. In general, in most aspects considered in this
study Haleku (NGO-supported) performed better than Dodicha (Government-supported).
Based on this study, the following recommendations may contribute to a sustainable
development of smallholder irrigation schemes:
� Better training of farmers on improved agronomic practices, crop protection
aspects, book keeping, irrigation practices, and product marketing is required to
increase crop productivity, price bargaining power and profitability of small-scale
irrigation schemes.
� The Woreda agricultural office/NGOs could support the previous
recommendation through setting up farmers training center.
� Strengthening or establishing institutions for input supply, output marketing and
credit service to allow rapid progress in the introduction and adoption of
productivity improving technologies and farming practices.
74
� The WUAs should find ways to better match the production plan with market
demand.
� The WUAs should form producer unions and focus on the production of high
quality products so as to compete with other producers and to increase their
bargaining power.
� The WUAs should be involved in seed multiplication programs to reduce seed
costs and to improve access to high quality seed.
� The WUAs should be supported and encouraged to strengthen their own credit
systems to reduce dependency on other institutions. Until this has been realized
Woreda agricultural office and NGOs should facilitate access to credit.
� Training, capacity building and encouraging development agents and WUAs
committee members are essential to build the local understanding and
management capabilities to effectively support farmers.
� Regular supervision and monitoring is needed, for example, from Woreda
agricultural office and NGOs to improve transparency of WUAs and prevent
corruption.
75
References AGARWAL, B. (2000) Conceptualising Environmental Collective Action: Why Gender
Matters. Cambridge Journal of Economics 24: 283-310. AWULACHEW, S. B. (2006) Improved Agricultural Water Management: Assessment of
Constraints and Opportunities for Agricultural Development in Ethiopia. Symposium and Exhgibition on Best Practices and Technologies for small Scale Agricultural Water Management in Ethiopia. Addis Ababa, Ethiopia.
AWULACHEW, S. B., MERRY, D. J., KAMARA, A. B., KOPPEN, B. V., VRIES, F. P. D. & AND BOELEE, E. (2005) Expriences and opportunities for promoting smale-scale /Micro irrigation and rain water harvesting for food security in Ethiopia. Colombo:IWMI.
BOELENS, R. (1998) Design as an organization process. CRS (1999) Programmatic Environmental Assessment of smallscale irrigation in
Ethiopia. Cooperating Sponsors. Baltimore, Maryland, USA. CTA (2003) Small-scale irrigation for food security in sub-Saharan Africa. Organised by
CTA with the support of Tigray Water Resources Development Bureau, Ethiopia DAWIT, A., ABERRA, D., LEMMA, D. & CHOMDO, A. (2004) Domestic vegetable
seed production and marketing. Addis Ababa, Ethiopian Agricultural Research Organization.
DIAO, X. & NIN PRATT, A. (2007) Growth options and poverty reduction in Ethiopia –An economy-wide model analysis. Food Policy 32: 205–228.
EASTER, K. W. & ZEKRI, S. (2003) Reform of irrigation management and investment and investment policy in African development. Pre-IAAE-Conference on African Agricultural Economics. Bloemfontein, South Africa.
EPA (1997) Environmental Policy In: Environmental Protection Authority in collaboration with the Ministry of Economic Development and Cooperation. Addis Ababa.
EPA (2004) Environmental Impact Assesment Guidlines. The Federal Environmental Protection Authority. Addis Ababa,Ethiopia.
FALCONERA, K. & SAUNDERS, C. (2002) Transaction costs for SSSIs and policy design. Land Use Policy 19: 157-166.
FAO (1986) Irrigation in Africa South of the Sahara. FAO Investment Center Technical paper No. 5. FAO Rome.
FAO (1989) Horticultural Marketing. A resource and Training manual for Extension Officers. Rome, Italy.
FAO (2000) Socioeconomic impacts of Smallholders Irrigation Development in Zimbabwe. Safr, Harare.
GEBREMEDHIN, B. & PEDON, D. (2002) Policies and institutions to enhance the impact of irrigation development in mixed crop-livestock systems, In: Integrated water and land management research and capacity building priorities for Ethiopia. Proceedings of MoWR/EARO/IMWI/ILRI international workshop. Addis Ababa, Ethiopia, ILRI.
HABTAMU, G. (1990) Problems and Constraints in the Study, Construction and Management of Small-Scale Irrigation Projects. Presented at the National Irrigation Policy and Strategy Workshop. Addis Ababa.
76
HENGSDIJK, H. & JANSEN, H. (2006) Ecosystems for water, food and economic development in Ethiopian Central Rift Valley (BO-10-006-22). Report of inception mission to Ethiopia and work plan 2006. Wageningen, Plant Research International. The Netherlands.
HUSSAIN, I. & BHATTARAI, M. (2003) Comprehensive Assessment of Socio-Economic impacts of Agricultural Water Uses: Concepts, Approaches and Analytical Tools. International Water management Institute, Colombo.
HUSSAIN, I. & HANJRA, M. (2004) Irrigation poverty alleviation: review of the empirical evidence. International Water Management Institute, Colombo, Sri Lanka.
HUYLENBROECK, G., D’HAESE, M. & VERSPECHT, A. (2005) Integrated tools to design and implement Agro Environmental Sciences: Methodology for analyzing private transaction costs. Ghent University, Belgium.
JALETA, M. (2006) Econometric analyses of horticultural production and marketing in Central and Eastern Ethiopia. PhD Thesis Wageningen University.
JAMES, K. & IAN, S. (2000) Knowledge, power and politics: the environmental policy-making process in Ethiopia. The Journal of Modern African Studies 38: 89-120. JANSEN, H., HENGSDIJK, H., LEGGESSE, D., AYELE, T., HELLEGERS, & SPLIETHOFF, P. (2007) Land and water resources assessment in the Ethiopian Central Rift Valley; Project ecosystems for water, food and economic development in Ethiopian Central Rift Valley. Wageningen, Alterra, Alterra report 1587.
KAMARA, A. B., VAN KOPPEN, B. & MAGINGXA, L. (2002) Economic Viability of Small Scale Irrigation Systems in the Context of State Withdrawal.The Arabie Scheme in the Northern Province of South Africa. Physics and Chemistry of the Earth 27: 815-823.
KHERALLAH, M. & KIRSTEN, J.T. (2001) The new institutional economics: Application for Agricultural Policy Research in Developing Countries. Washington, D.C., Markets and Structural Studies Division International Food Policy Research Institute,U.S.A.
KIRSTEN, J.F. & VAN ZYL, J. (1990) The economic impact of irrigation agriculture: methodological aspects and an empirical application. Development Southern Africa. Research Articles 7: 209-224.
LEGESSE, D., WOLDU, Z., MEBRATE, A., MENGISTU, S. & AYENEW, T. (2005) A Review of the Current Status and an Outline of a Future Management Plan for Lakes Abiyata and Ziway. The Federal Government of Ethiopia; Oromia Environmental Protection Office.
LEMMA, D. (2004) Tomatoes: Research Experiences and Production Prospects. Research Report No.43. The Ethiopian Agricultural research Organization, Addis Ababa, Ethiopia.
MAKOMBE, G., KELEMEWORK, D. & AREDO, D. (2007) A comparative analysis of rainfed and irrigated agricultural production in Ethiopia. Irrigation and Drainage Systems 21: 35–44.
MCCORNICK, P.G., KAMARA, A.B. & GIRMA, T. (2003) Integrated water and land management research and capacity building priorities for Ethiopia. Proceedings of a MoWR/EARO/IWMI/ILRI international workshop held at ILRI, Addis Ababa,
77
Ethiopia 2–4 December 2002. IWMI (International Water Management Institute). Colombo, Sri Lanka, and ILRI (International Livestock Research Institute), Nairobi, Kenya.
MORIS, J. (1991) Extension alternatives in tropical Africa. Overseas Development Institute, London, UK.
MOWR (2001) Data collected from different river basin development master plan studies. Planning and Projects Department, Ministry of Water Resources. Addis Ababa, Ethiopia.
MOWR (2002) Ethiopian water sector Development program 2002-2016. NEPAD & FAO (2005) Water Harvesting and Small-Scale Irrigation. GOVERNMENT
OF THE FEDERAL DEMOCRATIC REPUBLIC OF ETHIOPIA:SUPPORT TO NEPAD-CAADP IMPLEMENTATION,Volume II of VI.
NEUBERT, S., SCHEUMANN, W. & EDIG, A.V. (2002) Reforming Institutions for Sustainable Water Mangement. GERMAN DEVELOPMENT INSTITUTE.
NORTH, D. (1990) Institutions, institutional change and economic performance. Cambridge University Press, Cambridge.
ODI (1995) Recent Trends in Irrigation Managemnt: Changing Directions for the public Sector, Natural resource Perspective. London: UK.
OESPO (2003) Regional Government of Oromia; Oromia Economic Study Project Office.Adami Tullu-Jido Kombolcha Woreda Based Development Programme.
PENOV, I. (2004) Institutional option for sustainable irrigation: An evidence from Bulgaria. Paper for the tenth biennial conference of IASCP. Oaxaca, Mexico.
RAHEMETO, D. (1999) Water Resource Development in Ethiopia: Issues of sustainability and participation. FSS Discussion paper. Addis Ababa Ethiopia.
RAY, D. (1998) Development Economics USA. Princeton University Press. RODRIGUEZ DE FRANCISCO, J.C. (2008) Institutional environment, identification of
water users and preconditions for establishing payments for environmental services in the Central Rift Valley, Ethiopia. Msc thesis Wageningen University.
SANDS (1986) Technology Adoption by Small-Scale Farmers in Ghana. The International Development Reseach Centre.
SCHOLTEN, W. (2007) Agricultural development and water use in the Central Rift Valley of Ethiopia: A rapid appraisal. Internship Reporta. University of Twete
SHAWKI, B. & GUY LE, M. (1990) Irrigation in Sub-Saharan Africa: The Development of Public and private Systems. W.B Technical paper No. 123. Washington D.C.
SMITH, M. (1998) The Role of Small-Scale Irrigation in Food Security :Institutional and Technical Options in the Development and Management of Small-Scale Irrigation. Proceedings of the Third Session of the Multilateral Cooperation Workshops for Sustainable Agriculture, Forestry and Fisheries Development. Tokyo, Japan.
STERN, P.H. (1988) Operation and maintenance of small irrigation Schemes. International Technology Publications Ltd. UK.
TAHAL CONSULTING ENGINEERS (1988) Traditional organizational forms in small-scale irrigation schemes in Ethiopia (prepared for Ministry of Agriculture, Addis Ababa, Ethiopia). Tahal Consulting Engineers, Tel Aviv, Israel.
TESFAYE, Z., BEDESSA, T. & SHIFERWA (2001) Determination of adoption of im[proved maize technoliogies i maize growing regions of Ethiopia. In: Mandefro
78
Nigusse, D.Tanner S. Twmasi-Afriyie (eds.) 2002. Enhancing the contribution of maize to food security in Ethiopia. Proceeding of the second national maize workshop. Addis Ababa, Ethiopia.
TESHOME, A. (2006) Irrigation Policies, Strategies and Institutional Support Conditions in Ethiopia. Proceedings of Symposium on Best Practices and Technologies for Agricultural Water Management in Ethiopia. Addis Ababa Ethiopia.
TESHOME, W. (2003) Irrigation Practices, State intervention and Farmers Life-worlds in Drought Prone Tigray. Ph.D Dissertation,2003 Addis AbabaUniversity.
THEESFELD, I. (2001) CONSTRAINTS FOR COLLECTIVE ACTION IN BULGARIA’S IRRIGATION SECTOR. Central and Eastern European Sustainable Agriculture (CEESA)
TILAHUN, H. & PAULOS, D. (2004) Results to date and future plan of research on irrigation and its impact. Workshop on impact of irrigation on poverty and environment.
TROPP, H. & STÅLGREN, P. (2005) The Dynamics of Corruption: Putting limitations to water development, Can International Water Targets Be Met without Fighting Corruption? Stockholm World Water Week Seminar. Stockholm International Water Institute.
VAN DEN BURG, M. & RUBEN, R. (2006) Small-Scale Irrigation and Income Distribution in Ethiopia. Journal of Development Studies: Wageningen University, The Netherlands, 42, No. 5, 868-880.
WALLIS, J. & NOTH, D.S. (1986) Measuring the transaction sector in the American economy, 1870-1970.
WEBB, P. (1991) When projects collapse: Irrigation failure in the Gambia from a household perspective. Journal of International development Vol. 3, No. 4. July Institute, Washington D.C.
WERFRING, A., LEMPÉRIÈRE, P. & BOELEE, E. (2004) Typology of irrigation in Ethiopia. Proceedings of inception workshop on IWMI-BOKU-Siebersdorf-EARO-Arbaminch University collaborative study on the impact of irrigation development on poverty and the environment. Addis Ababa, Ethiopia.
WILLIAMSON, O. (2000) The New Institutional Economics: Taking stock, looking ahead. Journal of Economic Literature 38: 595-613.
WORLD BANK (1986) The Challenge of Hunger in Africa: A Call to Action. World Bank, Washington D.C.
79
Appendices
Appendix 1: Household survey questionnaires
Wageningen University
Environmental Economics and Natural Resources Group
Socio-economic assessment of two small scale irrigation schemes in the Central Rift Valley of Ethiopia
Dear respondent, This household survey questionnaire is planned to assess the socio-economic of two
small scale irrigation schemes in the Central Rift Valley of Ethiopia. The study focuses
on the investigation and quantification of agricultural input uses at plot level, constraints
that limit smallholders’ access to these inputs and assessing comparison of costs and
revenues of different far crops in two irrigation schemes .The over all goal of the study is
to understand socio-economic performances of the two schemes and propose alternative
options in order to improve their performance.
Therefore, your active participation and genuine responses is very curtail in meeting the
intended objectives of the study. I kindly request your active cooperation in responding to
the questionnaires. The questionnaires are fully for the academic research purpose and so
that any information you provide will be kept confidential.
Thank you!
80
1. General Information
Date of interview: Day Month Year______Enumerator’s name: ___________
14. For what purpose you use the crop you produced under irrigation?
1. Home consumption only 2. Market purpose 3. Both
15. In your opinion how do you judge the contribution of irrigated crop production for
your family food security?
1. It secured my family home consumption
2. I got surplus for market
3. No change in food security
4. It reduced my food security
16. For what other purpose you use irrigation water?
1. For home consumption
2. For cattle drinking
3. Only for irrigation
17. Do you make any payment for using water for irrigation 1=yes 2= No 18. Do you have adequate knowledge on irrigation practices?
1= Yes 2= No
19. Do you get extension services from Woreda Agricultural offices?
1. Yes 2. No
20. Do you get sufficient credit services?
1. yes 2. No
21.Do you need additional training on irrigation practices?
1= yes 2= No
22. What are the different linkages created due to the implementation of the irrigation
schemes in the
86
area? In circle if there are multiple responses
1. Production linkage
2. Employment linkage
3. Consumption linkage
4. Investment linkage
4. Institutional arrangement
1. How are the committees for scheme coordination elected?
1. Nominated by the kebele leaders
2. Elected by the water users in the scheme
3. No coordinator
2. Who makes a decision on the sequence of irrigation water use?
1. Executive committee
2. Water committee
3. based on the agreements between the water users
4. others (specify)______________________
3. How do you rank the internal organization of the irrigation system (the canal clearing,
canal maintenance, water distribution, etc) of your scheme?
1. Well organized
2. Fairly organized
3. Poorly organized
4. If the maintenance of canals is poor in your irrigation scheme what do you think the
causes?
(Circle multiple responses if any)
1. Poor coordination of maintenance activities by WUA committee?
2. Poor imposition of sanctions on reluctant users?
3. Low level of members participation in maintenance activities?
4. Cost of maintenance is high and not affordable by members
5. Other (specify) ___________
5. What are the major problems in the irrigation scheme?
1. Poor scheme management
2. market
87
3. Shortage of pump
4. Flooding
5. Poor drainage system
6. Do you receive enough water? 1. Yes 2. No
7. Do you receive water when needed? 1. Yes 2. No
8. Is water distribution fair? 1. Yes 2. No
9. If you answer for Qn 10 is no, which socio-economic groups consume or use more
water? (Circle multiple responses if any)
1. Committee members
2. head end farmers
3. Association member having good relations with committee members
4. All WUA have equal access to irrigation water
10. What are the major management problems related to water distribution in the
irrigation system (if applicable) (Circle multiple responses if any)
1. poor coordination by water committee
2. Lack of punishment against illegal water users
3. Rotations are not strictly implemented
4. Water theft
5. We have no problem
11. Have you ever faced any conflict with neighboring farmers because of using irrigation water? 1= Yes 2= no 12. If yes, what were the problems or sources of the conflict? Rank 1st____________________________________________________________ 2nd____________________________________________________________ 3rd_____________________________________ 13. what measures were taken to resolve the conflict? 1 ______________________________ 2 ______________________________ 3_____________________________
5. Environmental impacts of irrigation
1. Is there a land use change associated with the expansion of irrigated crop production?
1= yes 2= no
88
2. If your answer is yes, do you think the change had negative effects on the local
environment
(deforestation, erosion, water level of the lake, water pollution etc)
1= yes 2= no
3. If your answer is yes, mention the impacts according to their severity.
1st_________________________________
2nd________________________________
3rd_________________________________
4. How did you judge the fertility level of your land after you started using irrigation
water?
1. Increased
2. Decreased
3. No change
5. Have you ever faced any human health problem due to irrigation water use? 1 = yes 2 = N0 6 If yes, rank the problems according to importance 1 ______________________________ 2 ______________________________ 3_____________________________
7. Do you have ever faced animal disease problem due to using irrigation? 1 = yes 2=no 8. If yes, list all animal diseases you faced? ___________ _________ _________ _____________
89
Appendix 2: Checklists I) Checklist for focus group discussion
1. When did your Woreda start irrigated crop cultivation?
2. What is your source of water for irrigation?
3. Who owns the irrigation water in your scheme (encircle the response)?
4. How do you manage your irrigation system ( construction, maintenance, operation