Indecon International Economic Consultants Independent Socio-Economic Impact Assessment of the National Lottery A Executive Summary Socio-Economic Impact of the National Lottery An Independent Assessment Prepared by Indecon Research Economists www.indecon.ie December 2018
Transcript
Indecon International Economic ConsultantsIndependent Socio-Economic Impact Assessment of the National Lottery
AExecutive Summary
Socio-Economic Impact of the National Lottery An Independent Assessment
Prepared by Indecon Research Economists www.indecon.ie
December 2018
Contents
Tables, Figures & Boxes ii
Glossary of Terms and Abbreviations viii
Executive Summary ix
1 Introduction and Methodology 11.1 Introduction 21.2 Methodological Approach 21.3 Report Structure 61.4 Acknowledgements and Disclaimer 6
2 Development of National Lottery in Ireland 72.1 Trends in Lottery Sales 82.2 Innovation and Product Development 92.3 Summary of Key Findings 16
3 Assessment of Micro-Economic and Social Impacts 173.1 Introduction 183.2 Funds raised for Good Causes all over Ireland 183.3 Impact of Funding to Good Causes 213.4 Funds Returned to the Community – Prize Winnings 253.5 Impact on National Lottery Retail Agents 343.6 Summary of Key Findings 44
4 Assessment of Macro-Economic Impacts 454.1 Introduction 464.2 Expenditure/GDP Impacts 484.3 Expenditure Impacts on Suppliers 534.4 Employment and Incomes Supported by National Lottery 544.5 Exchequer Taxation Impacts 624.6 Summary of Key Findings 64
5 Wider Market Developments 655.1 Introduction 665.2 The Gambling Sector in Ireland 665.3 Lottery and Other Forms of Betting 675.4 Comparative International Analysis 765.5 Summary of Key Findings 79
Table 2.1 National Lottery Sales Revenue by Game – Total over Period 1987-2017
10
Table 2.2 National Lottery Sales Revenue by Game – 2017 11
Table 2.3 Main National Lottery Games – 2017 12
Table 2.4 National Lottery Games Available to Play Online 14
Table 2.5 National Lottery Online Sales (€m) – 2009-2017 14
Table 3.1 Total National Lottery Beneficiary Funding – 2006-2017 19
Table 3.2 Expenditure part-funded by the National Lottery by Category, 2017
20
Table 3.3 Impact of National Lottery Funding on Beneficiary Organisations 22
Table 3.4 National Lottery Retail Agents – Importance of Economic and Social Contributions of the National Lottery in Ireland Over the Past 15 Years
24
Table 3.5 Total National Lottery Prizes (€m) – 2007-2017 27
Table 3.6 Breakdown of National Lottery Prize Winnings by Game (%) – 2011-2017
28
Table 3.7 Lotto Prize Winnings over €1m (2015-2017) 30
Table 3.8 EuroMillions Prize Winnings over €1m (2016-2017) 30
Table 3.9 Breakdown of National Lottery Prize Winners by Prize Category and Game – 2017 (Number of Winners)
31
Table 3.10 Comparative Demographic Analysis – National Lottery Players v Population – 2017
32
Table 3.11 Comparative Demographic Analysis – Share of Spend on National Lottery Products
33
Tables, Figures & Boxes Page
ii
Table 3.12 National Lottery Participation by Social Class Indicator 33
Table 3.13 Number of National Lottery Retail Agents – 2006-2017 36
Table 3.14 National Lottery Commissions Paid to Retailers/Agents – 2006-2017 37
Table 3.15 Estimated Total Sales (Lottery and Non-Lottery) of National Lottery Retail Agents – 2017
37
Table 3.16 Estimated Impact on Retail Agents from Non-Lottery Related Retail Sales – 2017
38
Table 3.17 Estimated Employment and Incomes Supported Through Non-Lottery Related Retail Sales – 2017
38
Table 3.18 Summary of Estimated Impacts of National Lottery on Retail Agents – 2017
39
Table 3.19 National Lottery Retail Agents by Region – 2017 39
Table 3.20 National Lottery Revenue at Retail Agents by Region – 2017 40
Table 3.21 National Lottery Retail Agents – Estimated Total Retail Sales at National Lottery Retail Agents
41
Table 3.22 National Lottery Retail Agents – Perceived Estimate of the Extent to Which the Availability Of National Lottery Products Contributes To Additional, Non-Lottery Related Sales
42
Table 3.23 Direct Employment Supported by Non-Lottery Related Sales at Retail Agents (FTEs) – 2017
43
Table 3.24 Direct Incomes Supported by Non-Lottery Related Sales at Retail Agents (FTEs) – 2017
44
Table 4.1 Consumer Expenditure on National Lottery Products (€m) – 2012-2017
48
Table 4.2 Economy-Wide Impacts of Consumer Expenditure on Lottery Products (€m) – 2012-2017
49
Tables, Figures & Boxes Page
Indecon International Economic ConsultantsIndependent Socio-Economic Impact Assessment of the National Lottery
iii
Table 4.3 Scenarios for Consumer Spending Impact of National Lottery Prize Winnings – Indicative Assumptions re % of Prizes Spent by Size Category of Winnings – Estimated 2017 Impact
50
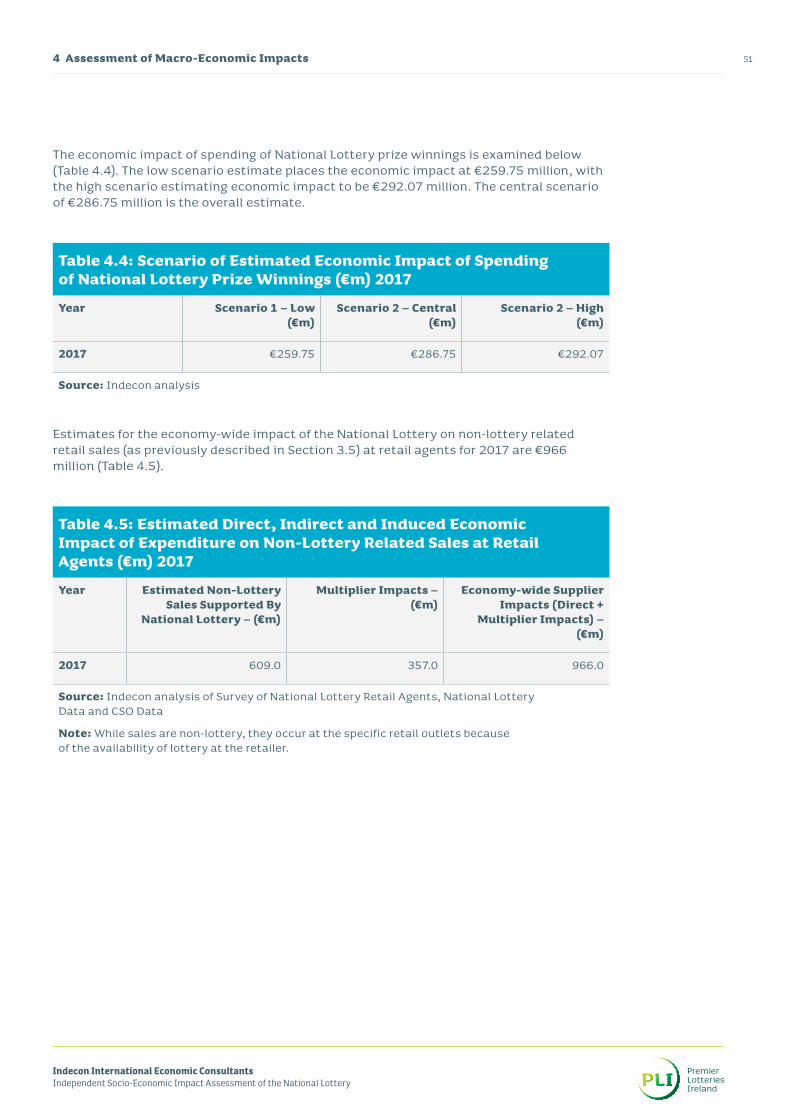
Table 4.4 Scenario of Estimated Economic Impact of Spending of National Lottery Prize Winnings (€m) – 2017
51
Table 4.5 Estimated Direct, Indirect and Induced Economic Impact of Expenditure on Non-Lottery Related Retail Sales at Retail Agents (€m) – 2017
51
Table 4.6 Overall Direct, Indirect and Induced Impact of Consumer Spending on Lottery and Non-Lottery Products (€m) – 2017
52
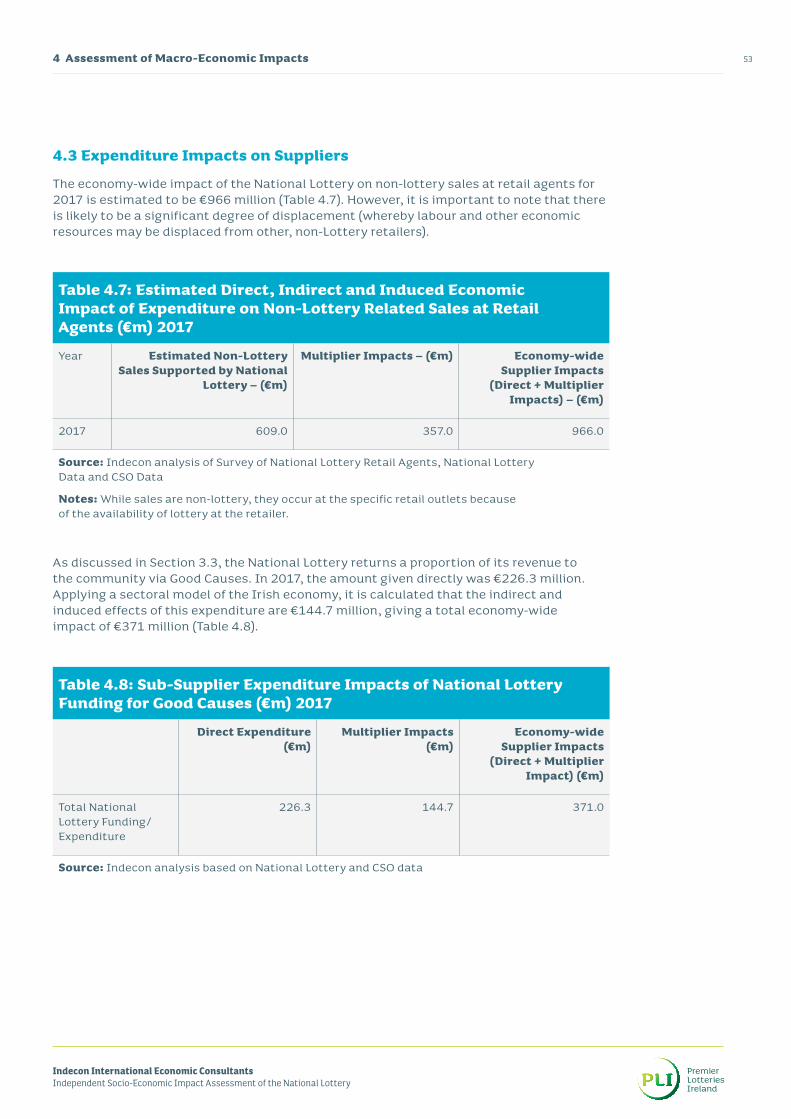
Table 4.7 Estimated Direct, Indirect and Induced Economic Impact of Expenditure on Non-Lottery Related Retail Sales at Retail Agents (€m) – 2017
53
Table 4.8 Sub-Supplier Expenditure Impacts of National Lottery Beneficiary Funding (€m) – 2017
53
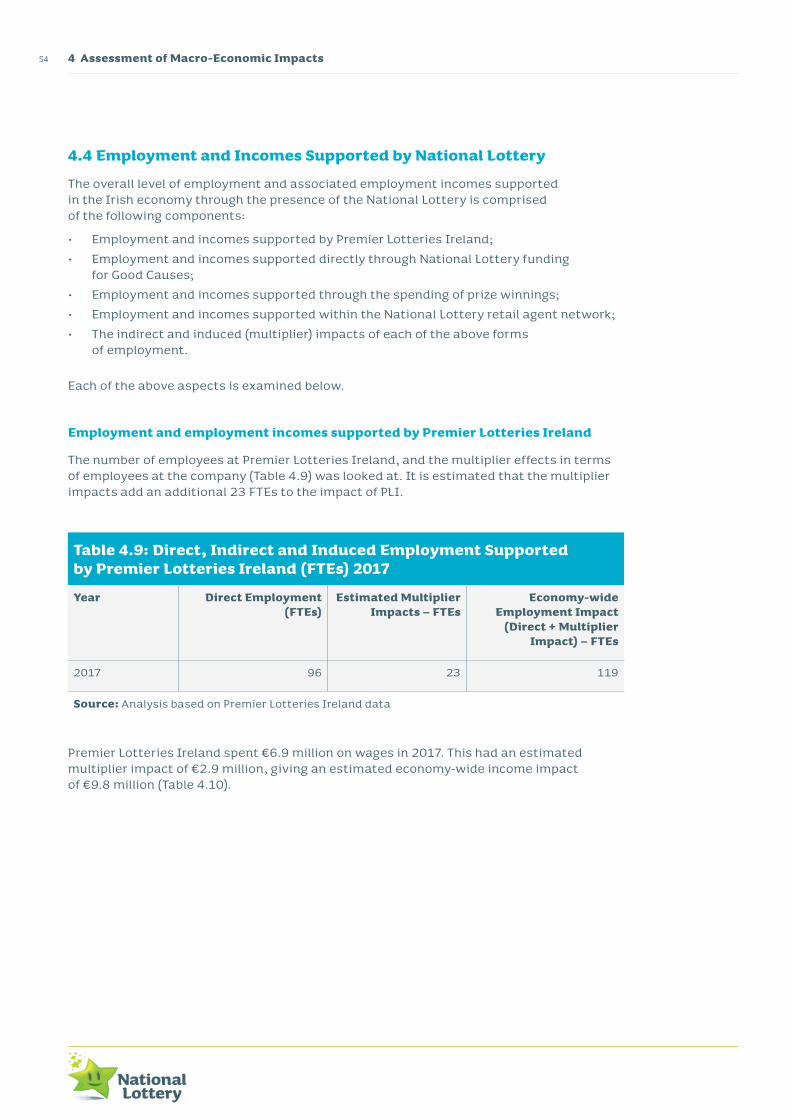
Table 4.9 Direct, Indirect and Induced Employment Supported by Premier Lotteries Ireland (FTEs) – 2017
54
Table 4.10 Direct, Indirect and Induced Impact of Premier Lotteries Ireland Expenditure on Incomes (€m) – 2017
55
Table 4.11 Direct, Indirect and Induced Employment Supported by National Lottery Retail Agents’ Commissions (FTEs) – 2017
55
Table 4.12 Direct, Indirect and Induced Employment Supported by Non-Lottery Related Sales at Retail Agents (FTEs) – 2017
56
Table 4.13 Direct, Indirect and Induced Employment Incomes Supported by National Lottery Sales at Retail Agents (€m) – 2017
56
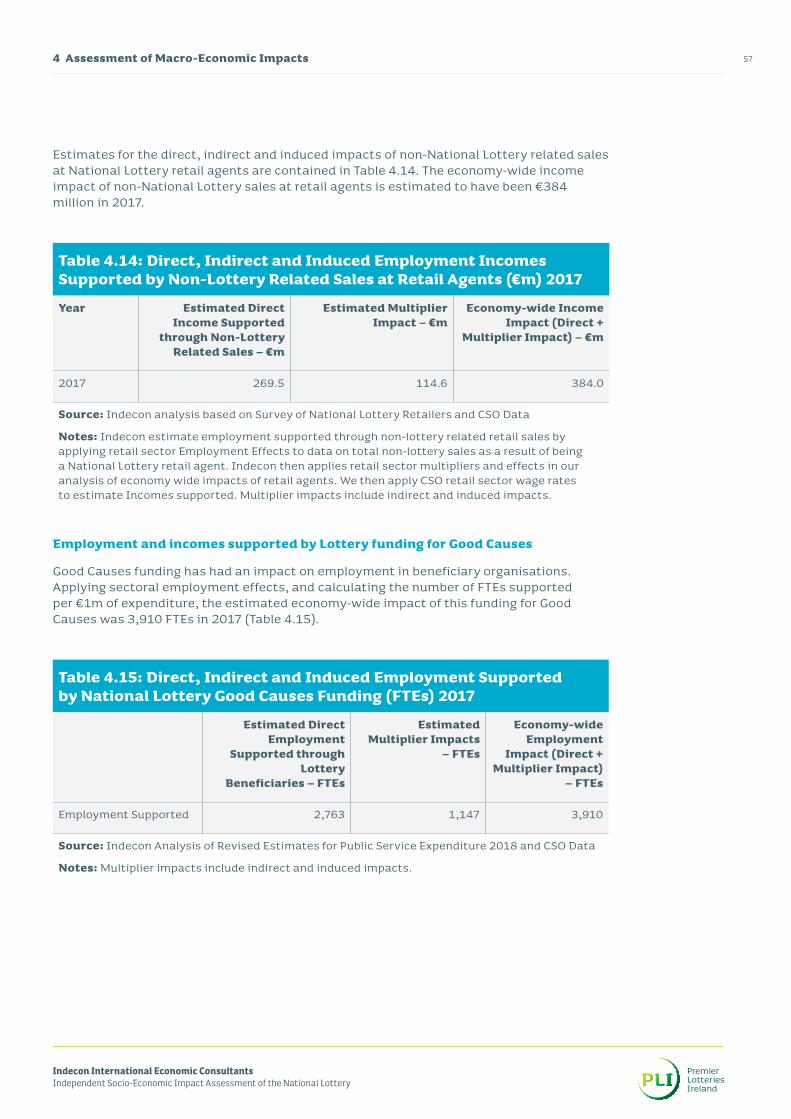
Table 4.14 Direct, Indirect and Induced Employment Incomes Supported by Non-Lottery Related Sales at Retail Agents (€m) – 2017
57
Table 4.15 Direct, Indirect and Induced Employment Supported by National Lottery Beneficiary Funding (FTEs) – 2017
57
Tables, Figures & Boxes Page
iv
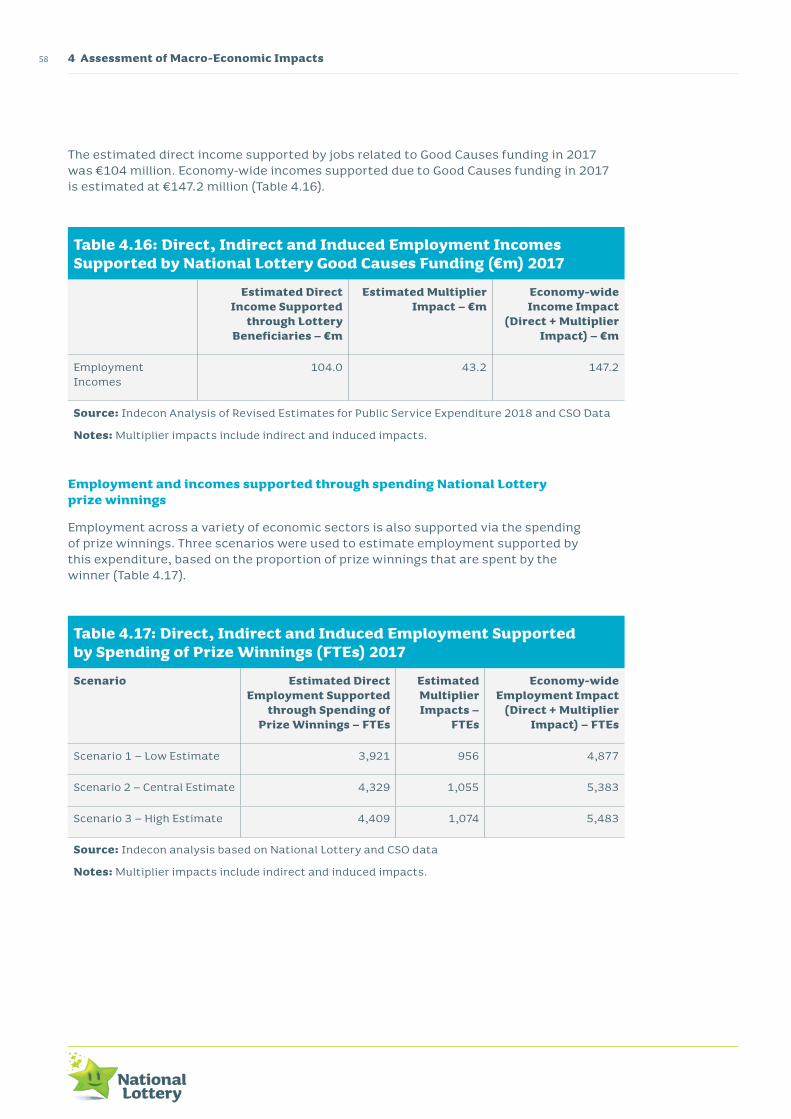
Table 4.16 Direct, Indirect and Induced Employment Incomes Supported by National Lottery Beneficiary Funding (€m) – 2017
58
Table 4.17 Direct, Indirect and Induced Employment Supported by Spending of Prize Winnings (FTEs) – 2017
58
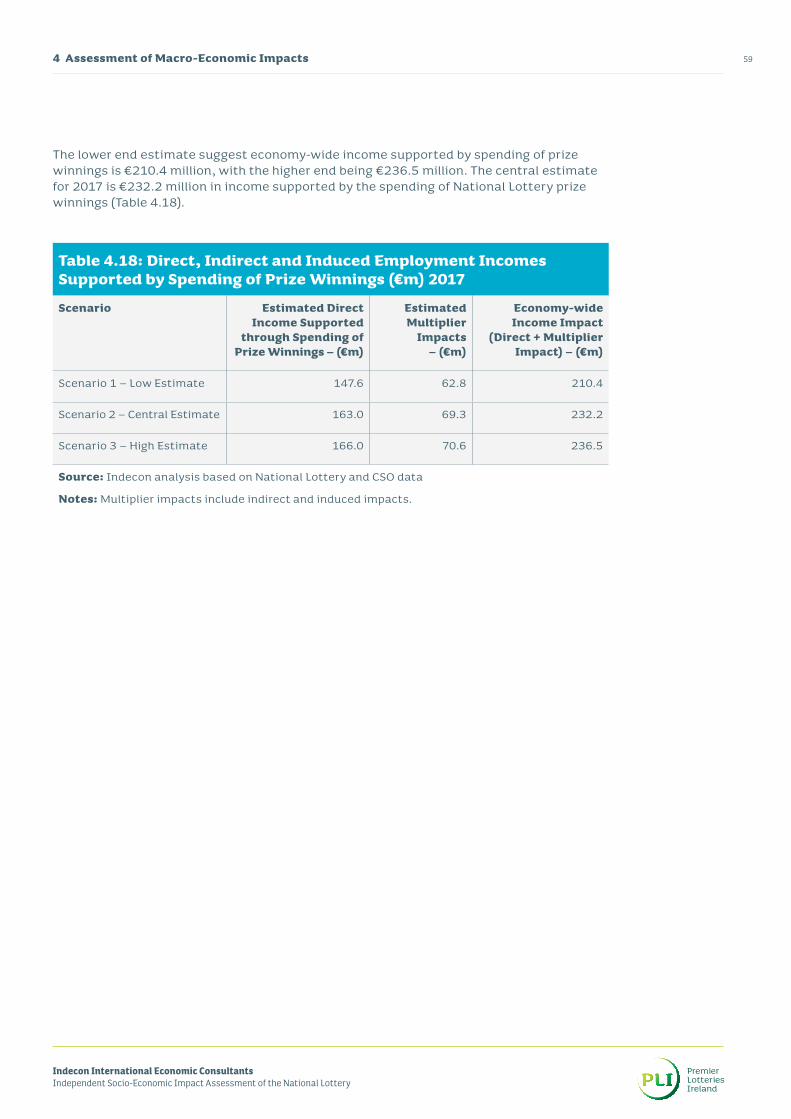
Table 4.18 Direct, Indirect and Induced Employment Incomes Supported by Spending of Prize Winnings (€m) – 2017
59
Table 4.19 Breakdown of Overall Employment Supported by the National Lottery (FTEs) – 2017
60
Table 4.20 Estimated Direct, Indirect and Induced Income Impacts Supported by National Lottery (€m) – 2017
61
Table 4.21 Estimated Taxation Paid to the Exchequer by National Lottery Employees 2017 – (€)
62
Table 4.22 Estimated Taxation Paid to the Exchequer by National Lottery Beneficiary Funding 2017 – (€)
62
Table 4.23 Estimated Taxation Paid to the Exchequer by Retail Agent Employees 2017 – (€)
63
Table 4.24 Estimated Taxation Paid to the Exchequer by Retail Agent Employees Supported by Non-National Lottery Sales in 2017 – (€)
63
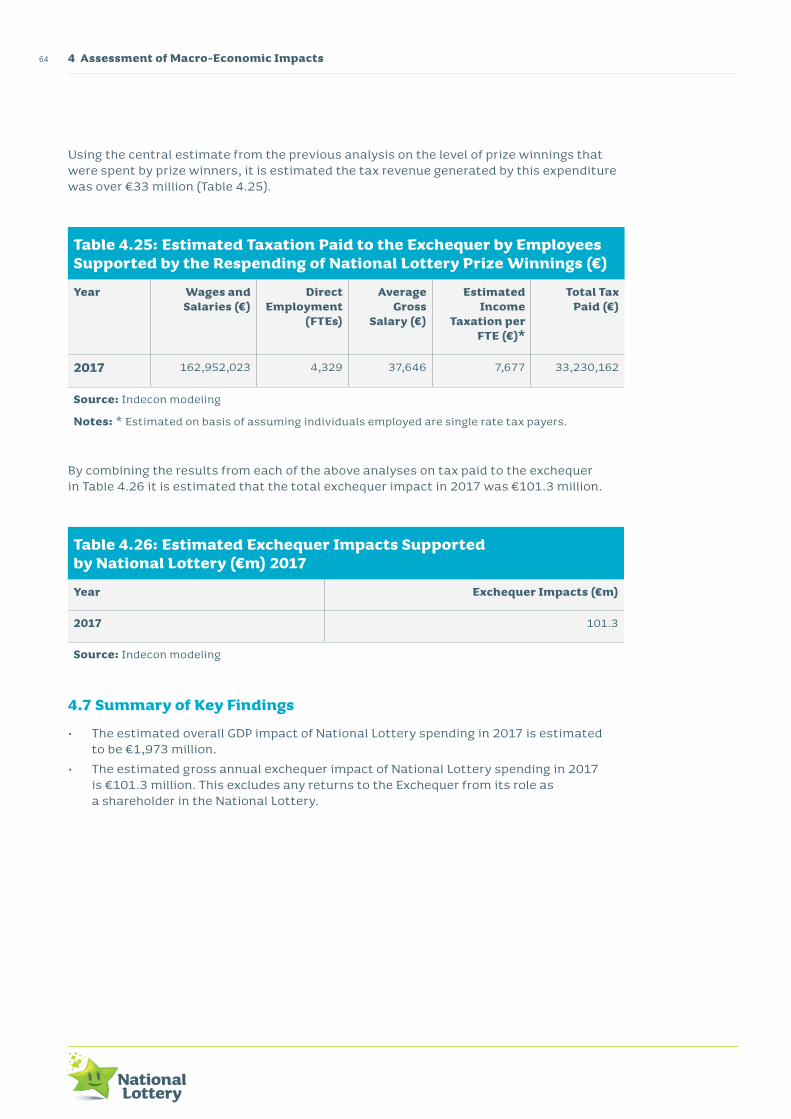
Table 4.25 Estimated Taxation Paid to the Exchequer by Employees Supported by the Respending of National Lottery Prize Winnings – (€)
64
Table 4.26 Estimated Exchequer Impacts Supported by National Lottery (€m) – 2017
64
Table 5.1 Revenue Commissioner Data on Betting Receipts (€ Million) – 2011-2016
66
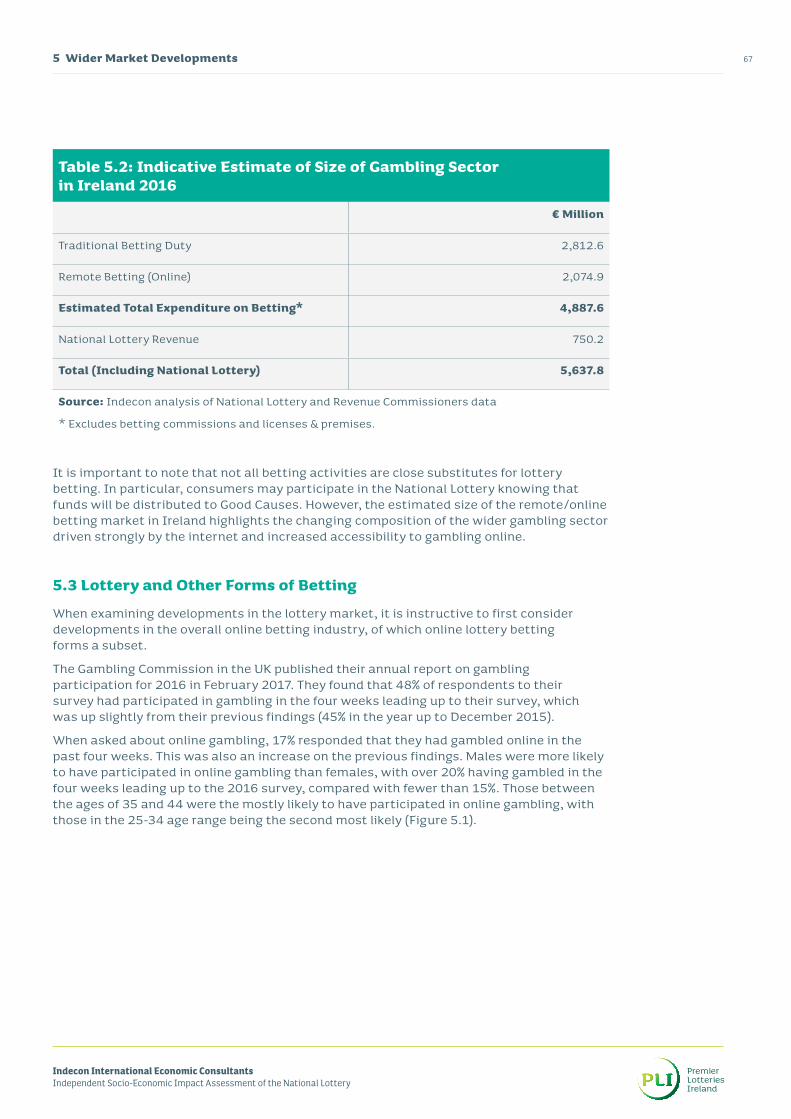
Table 5.2 Indicative Estimate of Size of Gambling Sector in Ireland – 2016 67
Table 5.3 Awareness of the Concept of Bet-On-Lottery Websites 71
Tables, Figures & Boxes Page
Indecon International Economic ConsultantsIndependent Socio-Economic Impact Assessment of the National Lottery
v
Table 5.4 Awareness of Bet-On-Lottery Websites in Ireland 71
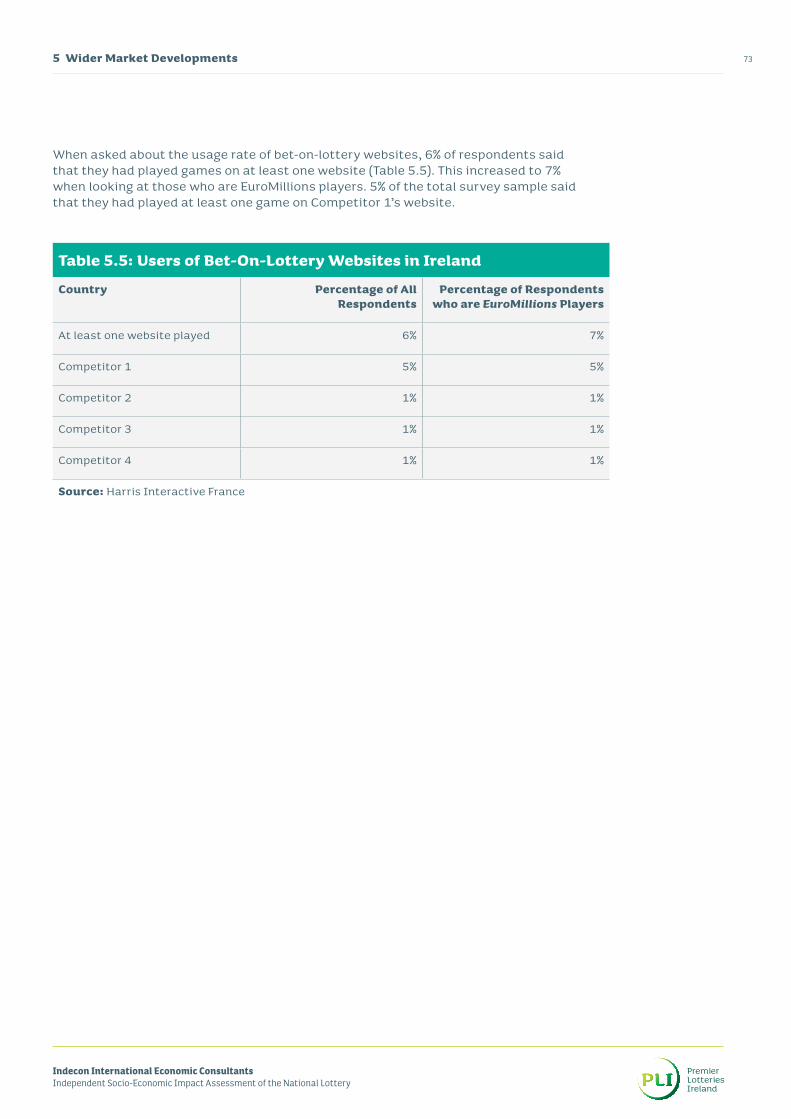
Table 5.5 Users of Bet-On-Lottery Websites in Ireland 73
Table 5.6 EuroMillions Sales Per Capita – € (2015-2016) 76
Table 5.7 Number of Residents per Retailer 77
Table 5.8 Per Capita Total Sales 77
Table 5.9 Per Capita Lottery Sales 78
Table 5.10 Per Capita Scratch Card Sales 78
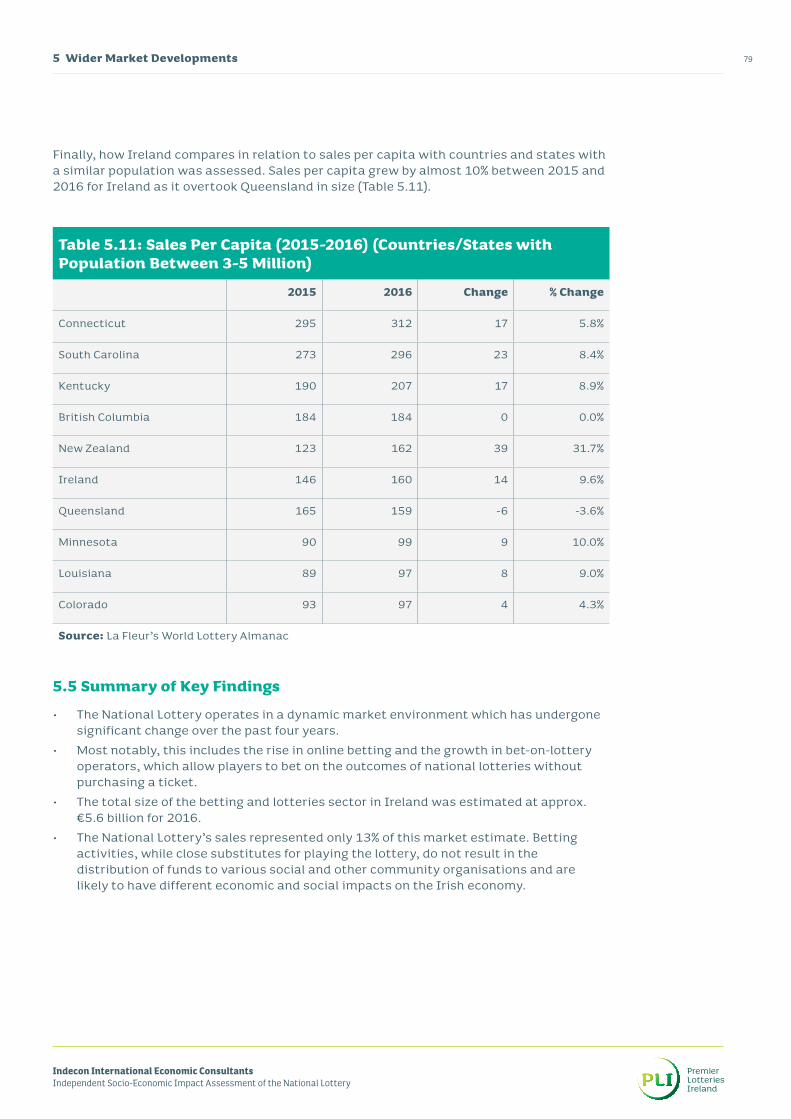
Table 5.11 Sales Per Capita (2015-2016) (Countries/States with Pop Between 3-5 Million)
79
Figure 1.1 Overview of Indecon’s Methodological Approach to Assessment 03
Figure 1.2 Framework Used to Assess Economic and Social Impacts of National Lottery
05
Figure 2.1 Development of National Lottery Sales – Overall Sales, € Million 08
Figure 2.2 Timeline of National Lottery Products 09
Figure 2.3 National Lottery Products – % of Sales by Game – 1990 vs. 2017 13
Figure 3.1 Breakdown of Total Public Expenditure on Activities which are Part-funded by the National Lottery – 2017 – %
21
Figure 3.2 National Lottery Funding Beneficiaries – Perceived Significance of Economic and Social Contribution of the National Lottery in Ireland over the Past 15 Years
23
Figure 3.3 Historical Development of National Lottery Prize Winnings (1987-2017)
25
Tables, Figures & Boxes Page
vi
Figure 3.4 Prize Winnings as % National Lottery Sales – 1987-2017 26
Figure 3.5 Breakdown of National Lottery Prize Pay-Out by Game – 2017 – % 29
Figure 3.6 Weekly Retail Sales (DBC & SC) and Number of Authorised Agents, 2014-2017
34
Figure 3.7 National Lottery Sales Per Retail Agent Excl. Select Agents (Draw Based Games v Scratch Cards)
35
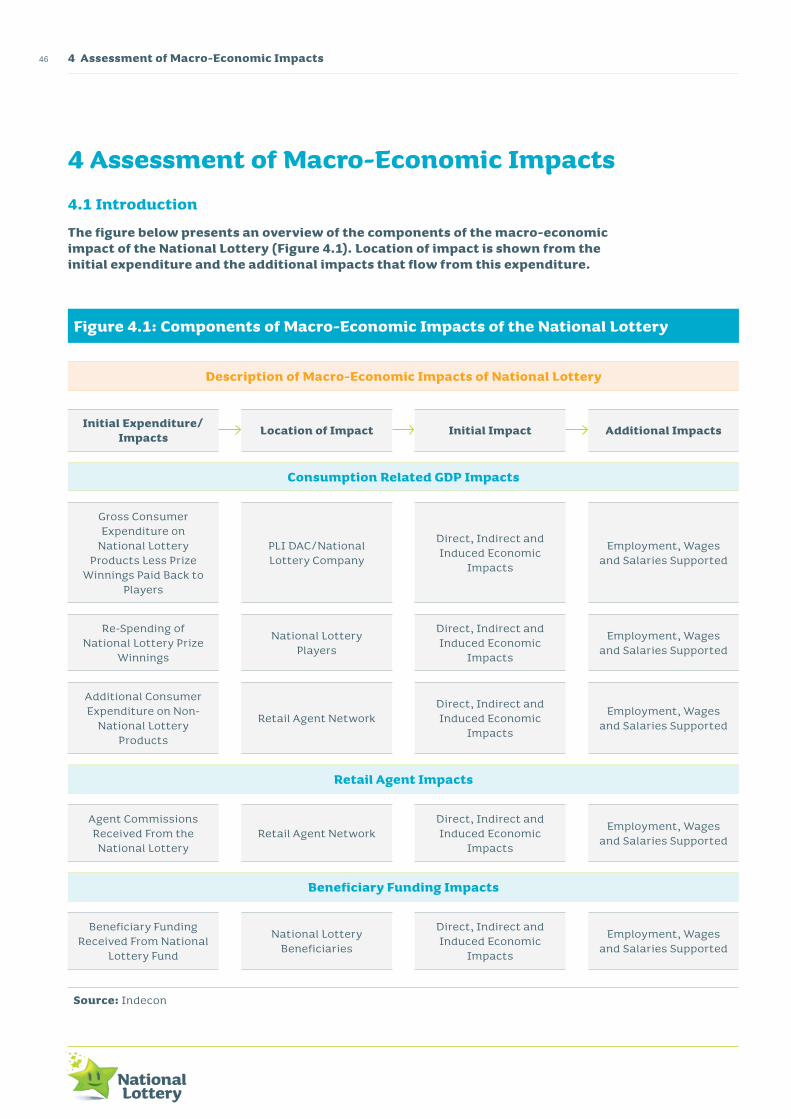
Figure 4.1 Components of Macro-Economic Impacts of the National Lottery 46
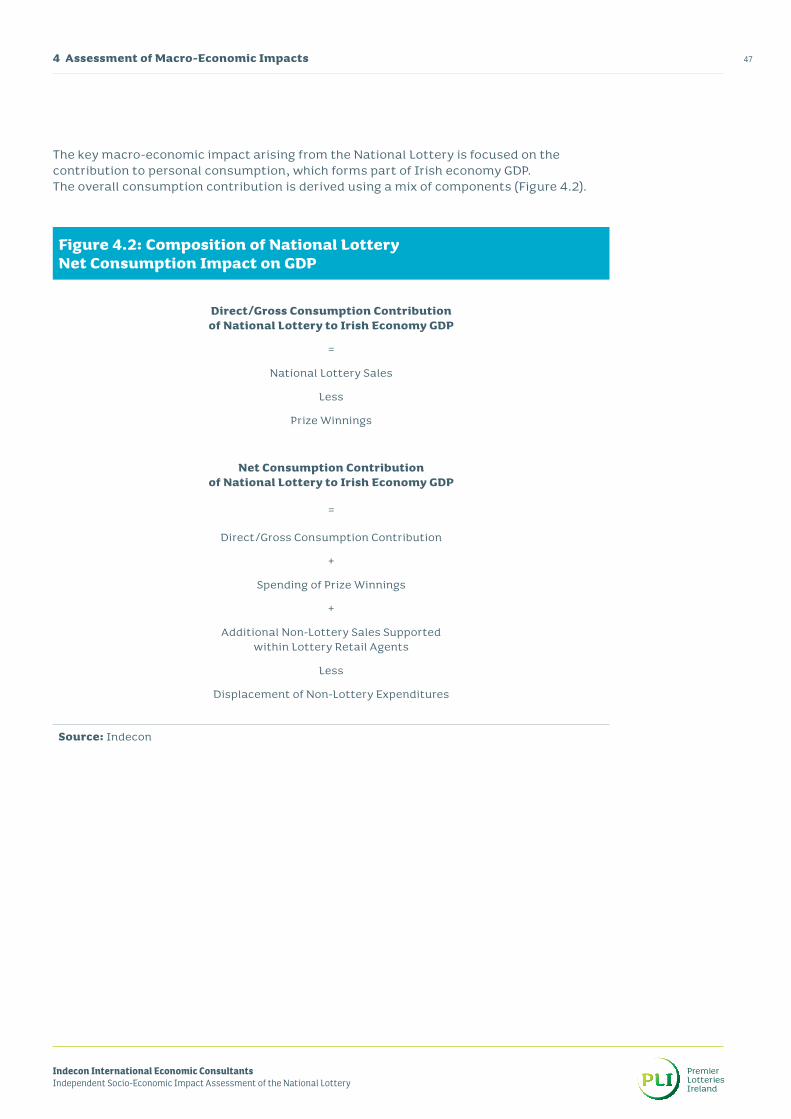
Figure 4.2 Composition of National Lottery Net Consumption Impact on GDP 47
Figure 5.1 Frequency of Gambling (UK) – 2013-2016 68
Figure 5.2 Type of Gambling Activity (UK – In Person) – 2016 69
Figure 5.3 Type of Gambling Activity (UK – Online) – 2016 70
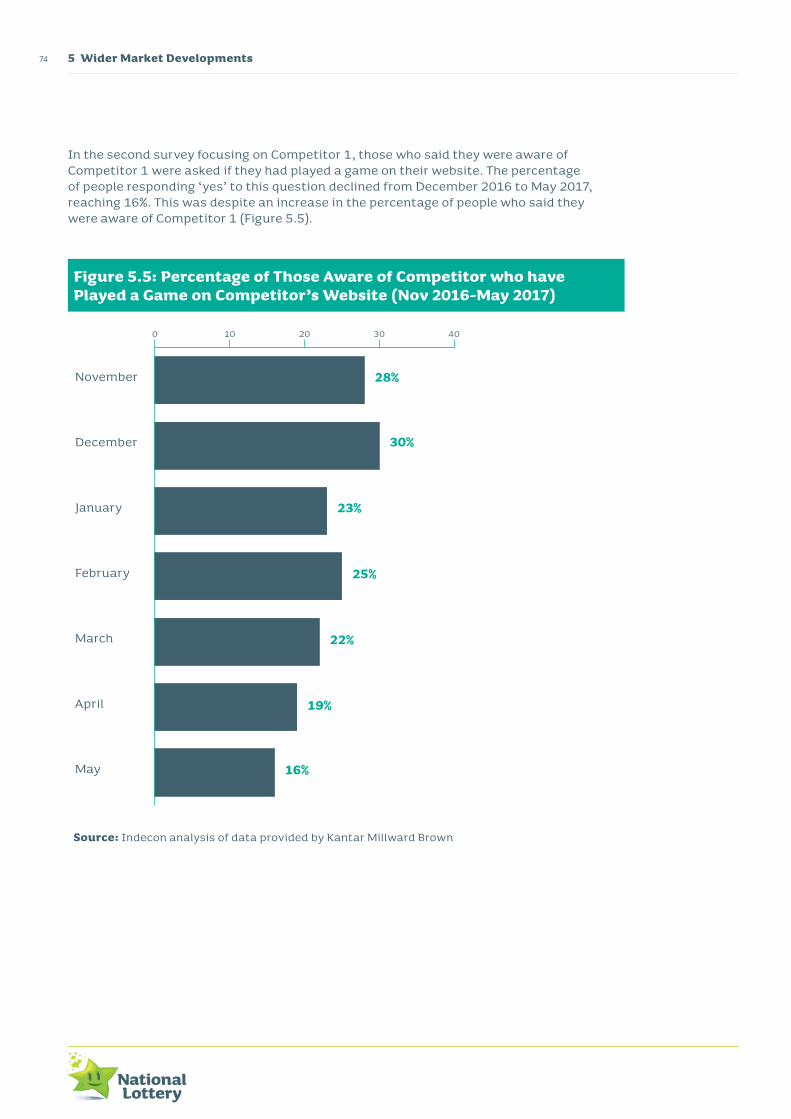
Figure 5.4 Awareness of National Lottery Competitor 1 (Aug 2016-May 2017) 72
Figure 5.5 Percentage of Those Aware of Competitor who have Played a Game on Competitor’s Website (Nov 2016-May 2017)
74
Tables, Figures & Boxes Page
Indecon International Economic ConsultantsIndependent Socio-Economic Impact Assessment of the National Lottery
vii
Executive Summaryviii
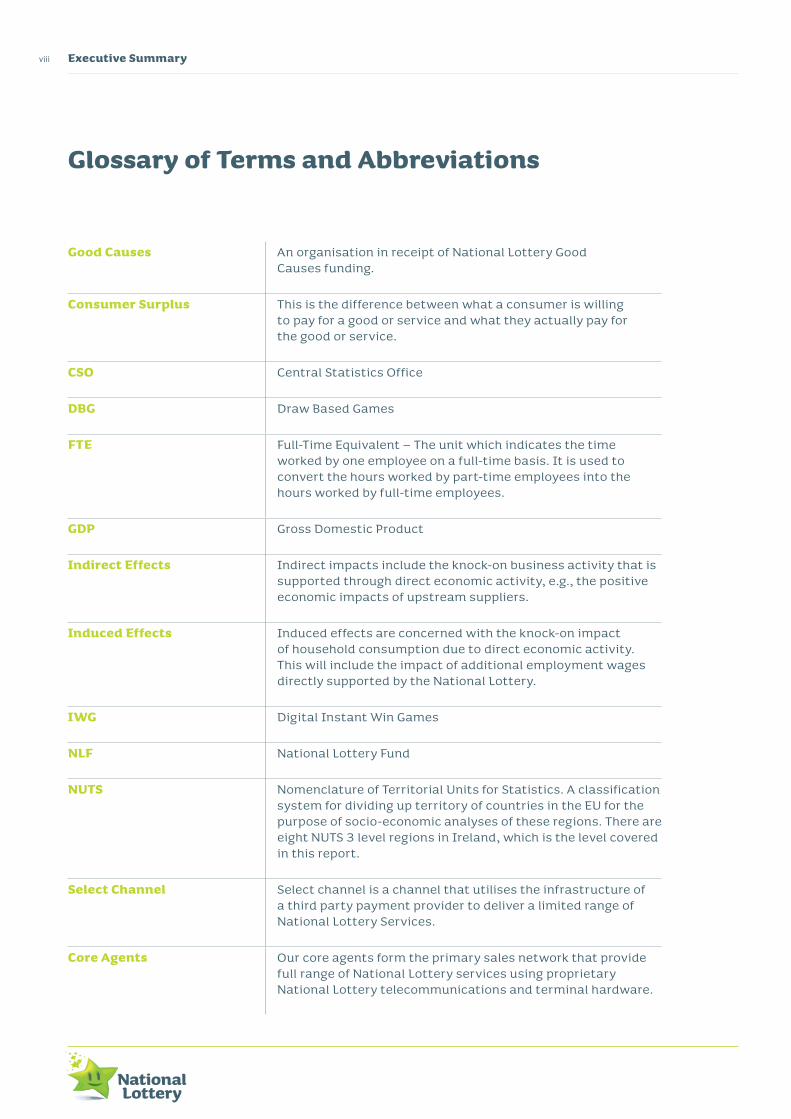
Glossary of Terms and Abbreviations
Good Causes An organisation in receipt of National Lottery Good Causes funding.
Consumer Surplus This is the difference between what a consumer is willing to pay for a good or service and what they actually pay for the good or service.
CSO Central Statistics Office
DBG Draw Based Games
FTE Full-Time Equivalent – The unit which indicates the time worked by one employee on a full-time basis. It is used to convert the hours worked by part-time employees into the hours worked by full-time employees.
GDP Gross Domestic Product
Indirect Effects Indirect impacts include the knock-on business activity that is supported through direct economic activity, e.g., the positive economic impacts of upstream suppliers.
Induced Effects Induced effects are concerned with the knock-on impact of household consumption due to direct economic activity. This will include the impact of additional employment wages directly supported by the National Lottery.
IWG Digital Instant Win Games
NLF National Lottery Fund
NUTS Nomenclature of Territorial Units for Statistics. A classification system for dividing up territory of countries in the EU for the purpose of socio-economic analyses of these regions. There are eight NUTS 3 level regions in Ireland, which is the level covered in this report.
Select Channel Select channel is a channel that utilises the infrastructure of a third party payment provider to deliver a limited range of National Lottery Services.
Core Agents Our core agents form the primary sales network that provide full range of National Lottery services using proprietary National Lottery telecommunications and terminal hardware.
Executive Summary
Introduction and key findingsThis independent assessment of the socio-economic impact and contribution of the National Lottery in Ireland was undertaken by Indecon International Research Economists on behalf of Premier Lotteries Ireland, operator of the National Lottery. The National Lottery was established in 1987 under the National Lottery Act 1986 with the purpose of raising funds to support Good Causes in the areas of youth, sports, recreation, health, arts, culture, national heritage and the Irish language.
The report examines the National Lottery’s impact in its contribution to GDP, employment and to Good Causes. A rigorous and empirical approach was used to assess the evidence based on Irish and international datasets; new primary research and econometric modelling.
Indecon International Economic ConsultantsIndependent Socio-Economic Impact Assessment of the National Lottery
ixExecutive Summary
Executive Summaryx
Macro-Economic Impacts
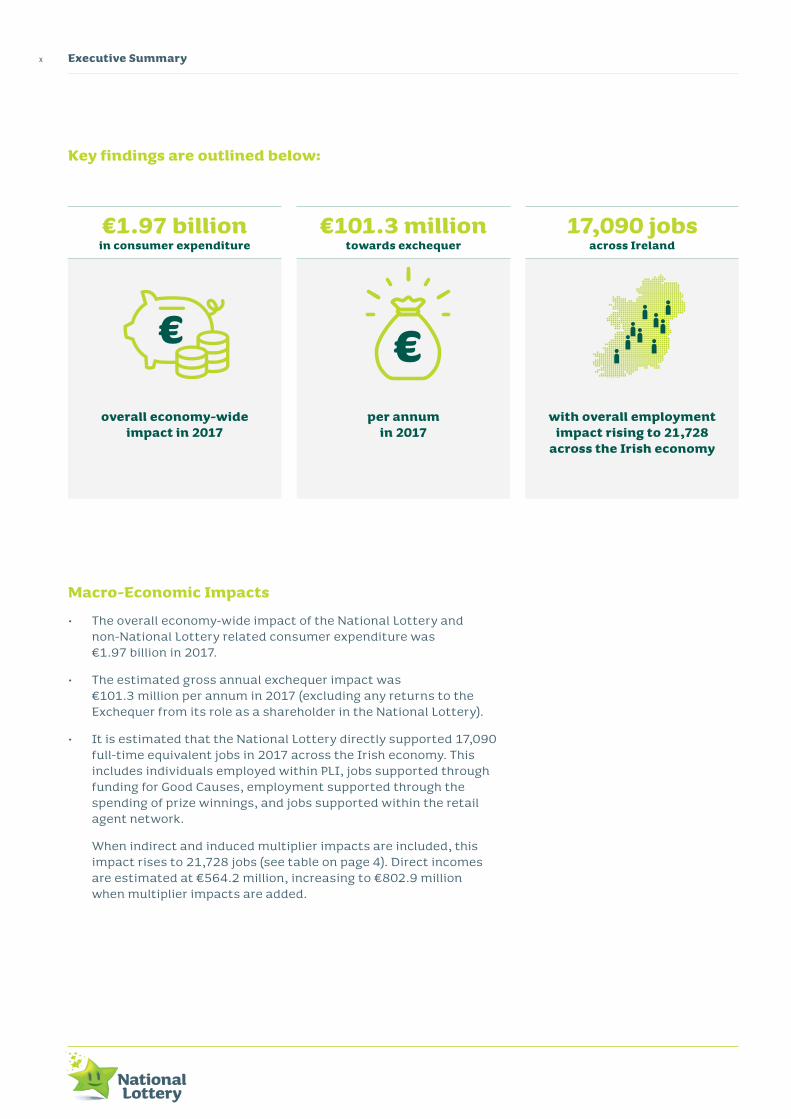
• The overall economy-wide impact of the National Lottery and non-National Lottery related consumer expenditure was €1.97 billion in 2017.
• The estimated gross annual exchequer impact was €101.3 million per annum in 2017 (excluding any returns to the Exchequer from its role as a shareholder in the National Lottery).
• It is estimated that the National Lottery directly supported 17,090 full-time equivalent jobs in 2017 across the Irish economy. This includes individuals employed within PLI, jobs supported through funding for Good Causes, employment supported through the spending of prize winnings, and jobs supported within the retail agent network.
When indirect and induced multiplier impacts are included, this impact rises to 21,728 jobs (see table on page 4). Direct incomes are estimated at €564.2 million, increasing to €802.9 million when multiplier impacts are added.
Key findings are outlined below:
overall economy-wide impact in 2017
per annum in 2017
with overall employment impact rising to 21,728
across the Irish economy
€1.97 billion in consumer expenditure
€101.3 million towards exchequer
17,090 jobs across Ireland
xi
Indecon International Economic ConsultantsIndependent Socio-Economic Impact Assessment of the National Lottery
Executive Summary
Breakdown of Overall Employment Supported by the National Lottery (FTEs) – 2017
Direct Employment Supported – FTEs
Indirect and Induced Employment*
Total Employment**
Employment in PLI/National Lottery
96 23 119
Employment supported by non-Lottery sales in retail agent network
9,192 2,240 11,433
Employment supported by retail agent commissions
709 173 882
Employment supported by National Lottery funding to Good Causes organisations
2,763 1,147 3,910
Employment supported by spending of National Lottery prize winnings
4,329 1,055 5,383
Total Employment Impact 17,090 4,638 21,728
Source: Indecon analysis* Indirect and Induced Employment: Multiplier Impacts – Additional Indirect and Induced Employment
Supported across Irish Economy – FTEs** Total Employment: Supported Across Irish Economy (incl. Multiplier Impacts) – FTEs
Executive Summaryxii
from 1987 to the end of 2017
€5.1 billion raised for Good Causes
by National Lottery participants in 2017
an estimated €620,000 was raised every day
Impact of National Lottery Funding on Good Causes organisations
• More than €5.1 billion has been raised for Good Causes between the establishment of the National Lottery in 1987 and the end of 2017. The total sum raised for Good Causes in 2017 was €226.3 million.
• It is estimated that 2,763 full-time equivalent jobs were supported in Good Causes beneficiary organisations in 2017. This increases to 3,910 jobs when multiplier impacts are included.
• The number of volunteers in organisations supported by National Lottery funding is estimated at 177,000. Total number of hours volunteered in 2017 is estimated to have an economic value amounting to €79.7 million.
• A high percentage of Good Causes state that the National Lottery has made a “very significant” or “significant” contribution to youth and recreation activities and organisations.
¤The estimated number of
volunteers in organisations supported by National Lottery
Good Causes funding
177,000 volunteers in organisations
xiii
Indecon International Economic ConsultantsIndependent Socio-Economic Impact Assessment of the National Lottery
Executive Summary
Impact of National Lottery on Retailers
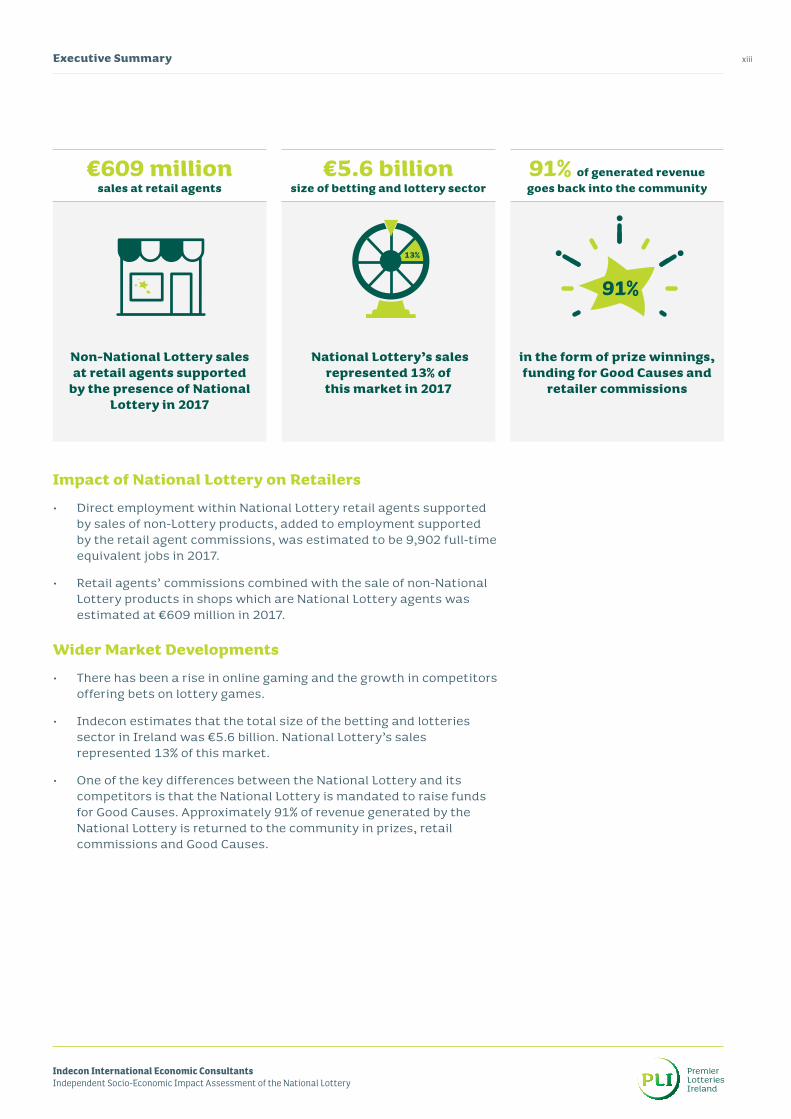
• Direct employment within National Lottery retail agents supported by sales of non-Lottery products, added to employment supported by the retail agent commissions, was estimated to be 9,902 full-time equivalent jobs in 2017.
• Retail agents’ commissions combined with the sale of non-National Lottery products in shops which are National Lottery agents was estimated at €609 million in 2017.
Wider Market Developments
• There has been a rise in online gaming and the growth in competitors offering bets on lottery games.
• Indecon estimates that the total size of the betting and lotteries sector in Ireland was €5.6 billion. National Lottery’s sales represented 13% of this market.
• One of the key differences between the National Lottery and its competitors is that the National Lottery is mandated to raise funds for Good Causes. Approximately 91% of revenue generated by the National Lottery is returned to the community in prizes, retail commissions and Good Causes.
Non-National Lottery sales at retail agents supported
by the presence of National Lottery in 2017
National Lottery’s sales represented 13% of this market in 2017
€5.6 billion size of betting and lottery sector
in the form of prize winnings, funding for Good Causes and
retailer commissions
91% of generated revenue goes back into the community
€609 million sales at retail agents
13%
91%
Executive Summaryxiv
€53
€47
€69
€98
€104 €1
13 €122
€128
€128 €1
36
€141 €1
59
€163 €1
76
€173 €1
91
€187 €2
03 €218
€245
€268
€263
€244
€232
€226
€188
€213
€206
Micro-economic and social impacts
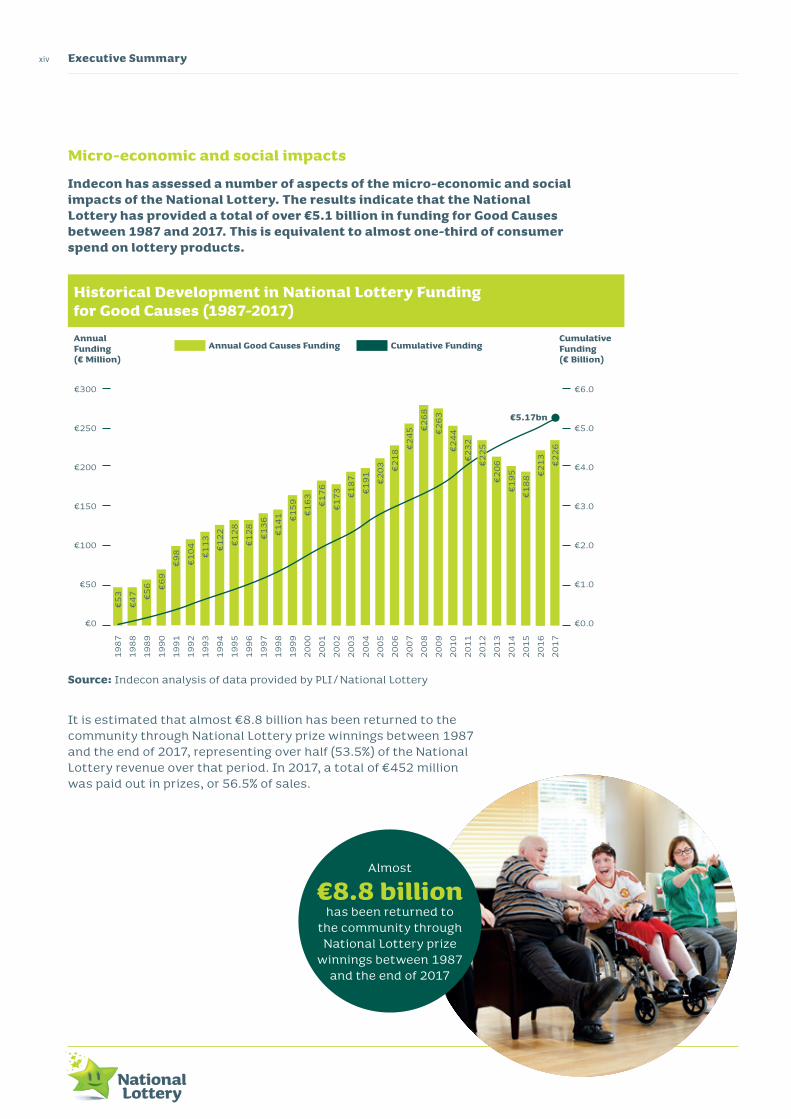
Indecon has assessed a number of aspects of the micro-economic and social impacts of the National Lottery. The results indicate that the National Lottery has provided a total of over €5.1 billion in funding for Good Causes between 1987 and 2017. This is equivalent to almost one-third of consumer spend on lottery products.
It is estimated that almost €8.8 billion has been returned to the community through National Lottery prize winnings between 1987 and the end of 2017, representing over half (53.5%) of the National Lottery revenue over that period. In 2017, a total of €452 million was paid out in prizes, or 56.5% of sales.
Almost
€8.8 billionhas been returned to
the community through National Lottery prize
winnings between 1987 and the end of 2017
Source: Indecon analysis of data provided by PLI/National Lottery
Historical Development in National Lottery Funding for Good Causes (1987-2017)Annual Funding (€ Million)
€5.17bn
Cumulative Funding (€ Billion)
€300
€250
€200
€150
€100
€50
€0
€6.0
€5.0
€4.0
€3.0
€2.0
€1.0
€0.0
1987
1988
1989
1990
1991
1992
1993
1994
1995
1996
1997
1998
1999
2000
2001
2002
2003
2004
2005
2006
2007
2008
2009
2010
2011
2012
2013
2014
2015
2016
2017
€56
Annual Good Causes Funding Cumulative Funding
€225
€195
xv
Indecon International Economic ConsultantsIndependent Socio-Economic Impact Assessment of the National Lottery
Executive Summary
Estimated Economic Impacts of National Lottery on Retail Agent Network
2017
Retail Agent Commissions (€m) €47.0 m
Non-lottery sales supported by presence of National Lottery agency (€m)
€609.0 m
Employment supported within National Lottery retail agent network*
9,902 FTEs
Source: Indecon analysis and modelling
* Includes Direct employment within National Lottery retail agents supported by sales of non-Lottery products, in addition to employment supported by the retail agent commissions
The income of National Lottery retail agents around the country is boosted with retail commissions and non-lottery sales. Because of high opportunity and displacement costs, these gains are likely to be at a cost to non-Lottery retailers. National Lottery funding may, however, help smaller retailers and post offices to remain economically viable.
Executive Summaryxvi
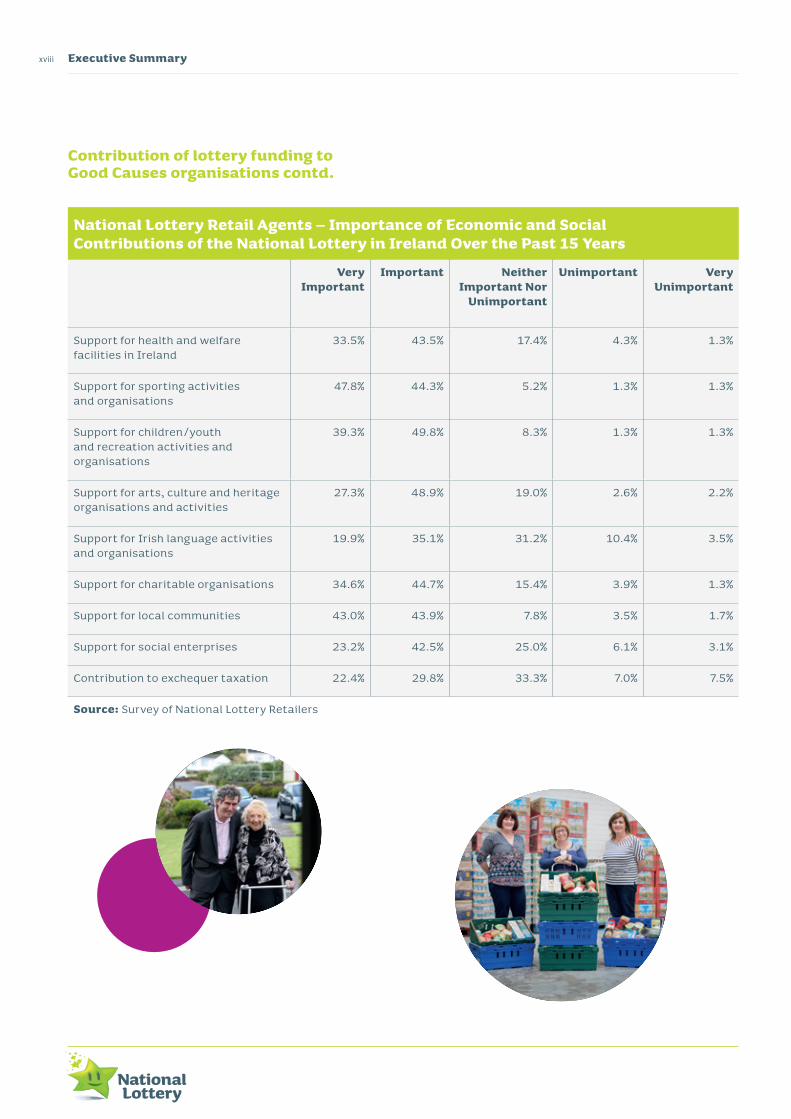
Contribution of lottery funding to Good CausesOur survey of Good Causes organisations demonstrates that recipients of National Lottery funding believe it has made a very significant or significant economic and social contribution to youth and recreation activities, sporting activities, local communities, and arts, culture and heritage (see table below).
Provision of funding for social enterprises
Support for Irish language activities and organisations
Provision for funding for charitable organisations
Provision for funding for community health and welfare facilities in Ireland
Contribution to exchequer taxation
42.1%
44.4%
48.6%
55%
68.9%
75%
76.3%
78%
82.1%
Support for local Communities
Support for arts, culture and heritage organisations and activites
Provision for funding for sporting activities and organisations
Provision for funding for youth and recreation activities and organisations
Source: Indecon analysis
0% 10% 20% 30% 40% 50% 60% 70% 80% 90% 100%
xvii
Indecon International Economic ConsultantsIndependent Socio-Economic Impact Assessment of the National Lottery
Executive Summary
The economic value of volunteering activity
in Good Causes beneficiary organisations is estimated
at over
€79.7 million
per annum
Research shows that Good Causes beneficiaries considered that National Lottery funding has made a “very significant” or “significant” economic and social contribution, especially in the areas of youth and recreation, sport, local communities, arts, culture and heritage.
Empirical evidence from the survey of Good Causes organisations and published accounts suggests that on average 13% of overall funding came from the National Lottery Good Causes Fund, up to 90% in some cases. 2,763 full-time equivalent jobs are supported in Good Causes beneficiary organisations which have over 177,000 volunteers. The economic value is estimated at over €79.7 million per annum.
Employment and volunteering activity in Good Causes organisations indicate that 2,763 full-time equivalent jobs are supported by National Lottery funding. These organisations have over 177,000 volunteers and the economic value is estimated at over €79.7 million per annum.
Impact of National Lottery Funding on Good Causes organisations
Lottery funding as % of total organisation funding base 13.05%
Estimated Total Employment in Good Causes organisations which is directly supported by National Lottery Funding (FTEs)
2,763
Estimated Total Number of Volunteers in Good Causes organisations (Persons)
177,293
Estimated Total Annual Volunteer Hours 8,615,273
Estimated Total Economic Value of Volunteering in Good Causes organisations
€79.7 million
Source: Indecon analysis based on research among selected National Lottery funding Good Causes organisations, survey of Good Causes organisations and data from CSO
On average
13% of overall Good Causes
beneficiaries funding was provided by the National
Lottery
Executive Summaryxviii
National Lottery Retail Agents – Importance of Economic and Social Contributions of the National Lottery in Ireland Over the Past 15 Years
Very Important
Important Neither Important Nor
Unimportant
Unimportant Very Unimportant
Support for health and welfare facilities in Ireland
33.5% 43.5% 17.4% 4.3% 1.3%
Support for sporting activities and organisations
47.8% 44.3% 5.2% 1.3% 1.3%
Support for children/youth and recreation activities and organisations
39.3% 49.8% 8.3% 1.3% 1.3%
Support for arts, culture and heritage organisations and activities
27.3% 48.9% 19.0% 2.6% 2.2%
Support for Irish language activities and organisations
19.9% 35.1% 31.2% 10.4% 3.5%
Support for charitable organisations 34.6% 44.7% 15.4% 3.9% 1.3%
Support for local communities 43.0% 43.9% 7.8% 3.5% 1.7%
Support for social enterprises 23.2% 42.5% 25.0% 6.1% 3.1%
Contribution to exchequer taxation 22.4% 29.8% 33.3% 7.0% 7.5%
Source: Survey of National Lottery Retailers
Contribution of lottery funding to Good Causes organisations contd.
xix
Indecon International Economic ConsultantsIndependent Socio-Economic Impact Assessment of the National Lottery
Executive Summary
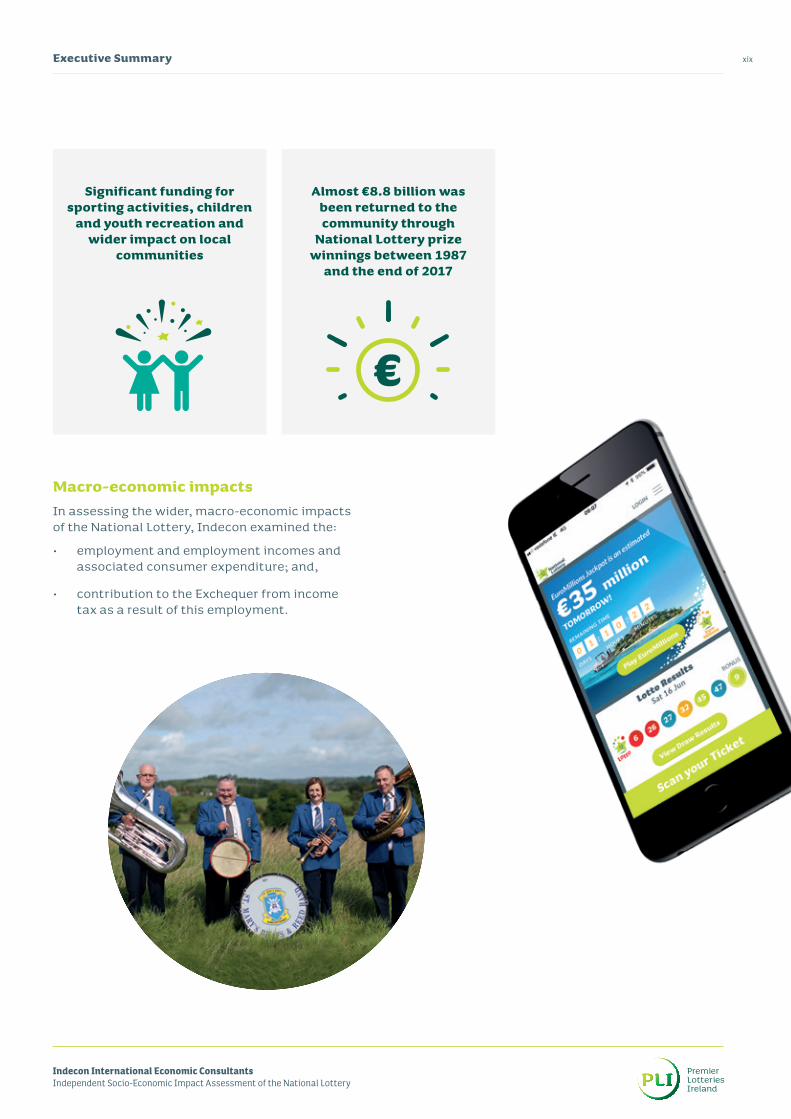
Macro-economic impactsIn assessing the wider, macro-economic impacts of the National Lottery, Indecon examined the:
• employment and employment incomes and associated consumer expenditure; and,
• contribution to the Exchequer from income tax as a result of this employment.
Significant funding for sporting activities, children
and youth recreation and wider impact on local
communities
Almost €8.8 billion was been returned to the community through
National Lottery prize winnings between 1987
and the end of 2017
¤
Executive Summaryxx
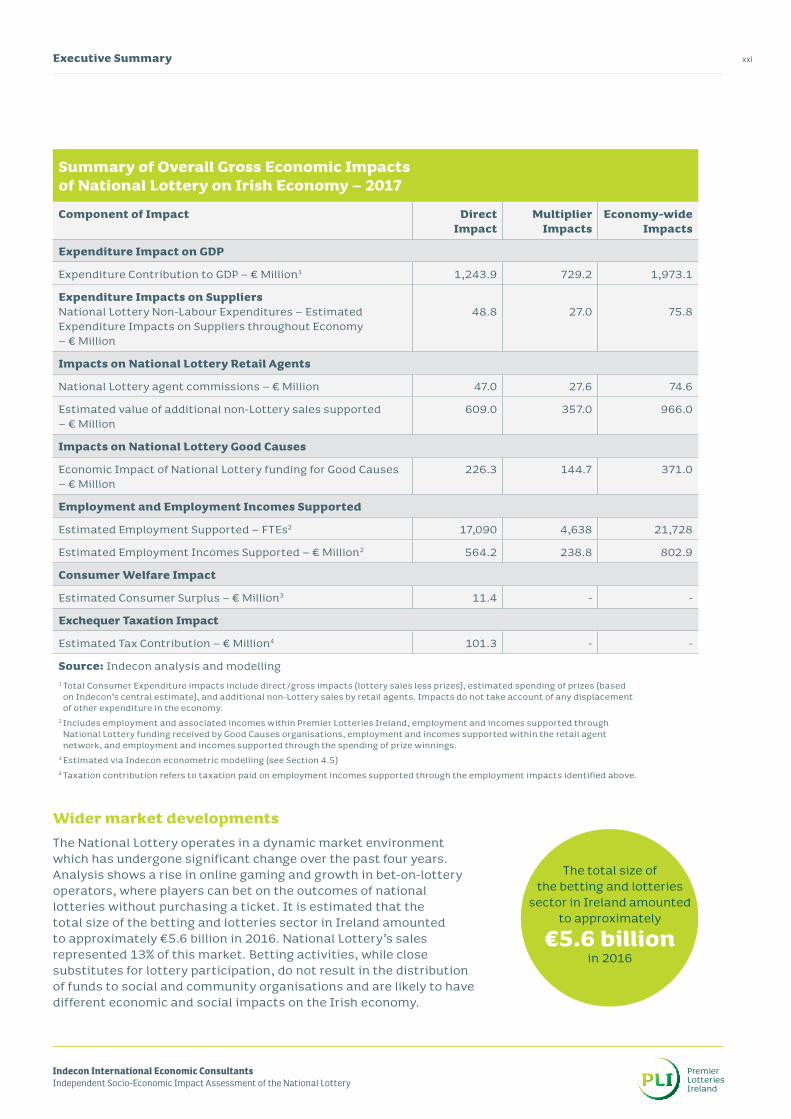
Summary of Components of Overall Economic Impact of National LotteryThe overall economic impact of the National Lottery in 2017 are summarised in the table on page 14. Overall GDP impact of lottery spending is estimated to be €1.973 billion, and tax to the exchequer of €101.3 million (excluding any returns to the Exchequer from its role as a shareholder in the National Lottery). Estimates are based on conservative assumptions and recognise that all economic sectors have inter-relationships with other parts of the economy.
overall GDP impact of lottery spending in 2017
estimated
€1.973 billion
per annum in 2017
€101.3 million towards exchequer
National Lottery funding for Good Causes in 2017
€226.3 million
¤
xxi
Indecon International Economic ConsultantsIndependent Socio-Economic Impact Assessment of the National Lottery
Executive Summary
Wider market developmentsThe National Lottery operates in a dynamic market environment which has undergone significant change over the past four years. Analysis shows a rise in online gaming and growth in bet-on-lottery operators, where players can bet on the outcomes of national lotteries without purchasing a ticket. It is estimated that the total size of the betting and lotteries sector in Ireland amounted to approximately €5.6 billion in 2016. National Lottery’s sales represented 13% of this market. Betting activities, while close substitutes for lottery participation, do not result in the distribution of funds to social and community organisations and are likely to have different economic and social impacts on the Irish economy.
Summary of Overall Gross Economic Impacts of National Lottery on Irish Economy – 2017
Component of Impact Direct Impact
Multiplier Impacts
Economy-wide Impacts
Expenditure Impact on GDP
Expenditure Contribution to GDP – € Million1 1,243.9 729.2 1,973.1
Expenditure Impacts on Suppliers National Lottery Non-Labour Expenditures – Estimated Expenditure Impacts on Suppliers throughout Economy – € Million
48.8
27.0
75.8
Impacts on National Lottery Retail Agents
National Lottery agent commissions – € Million 47.0 27.6 74.6
Estimated value of additional non-Lottery sales supported – € Million
609.0 357.0 966.0
Impacts on National Lottery Good Causes
Economic Impact of National Lottery funding for Good Causes – € Million
Source: Indecon analysis and modelling1 Total Consumer Expenditure impacts include direct/gross impacts (lottery sales less prizes), estimated spending of prizes (based
on Indecon’s central estimate), and additional non-Lottery sales by retail agents. Impacts do not take account of any displacement of other expenditure in the economy.
2 Includes employment and associated incomes within Premier Lotteries Ireland, employment and incomes supported through National Lottery funding received by Good Causes organisations, employment and incomes supported within the retail agent network, and employment and incomes supported through the spending of prize winnings.
3 Estimated via Indecon econometric modelling (see Section 4.5)4 Taxation contribution refers to taxation paid on employment incomes supported through the employment impacts identified above.
The total size of the betting and lotteries
sector in Ireland amounted to approximately
€5.6 billion in 2016
Executive Summaryxxii
Conclusion
This report shows that the National Lottery has had a significant impact on the Irish economy, including contributing to GDP and employment. This is evident from the independent estimates presented. In addition a key social impact of the National Lottery has been the provision of funds.
1 Introduction and Methodology
Indecon International Economic ConsultantsIndependent Socio-Economic Impact Assessment of the National Lottery
1 Introduction and Methodology2
1 Introduction and Methodology1.1 Introduction
This independent assessment of the socio-economic impact and contribution of the National Lottery in Ireland was undertaken by Indecon Research Economists on behalf of Premier Lotteries Ireland DAC (operators of the National Lottery). The National Lottery was established in 1987 under the National Lottery Act 1986 for the benefit of Good Causes. Since its launch 31 years ago (in 1987), the National Lottery has raised more than €5.3 billion for Good Causes in the areas of youth, sport, recreation, amenities, health, welfare, arts, culture, national heritage and the Irish language.
Initially operated by An Post, the Government (under the National Lottery Act 2013) launched a competitive tender process to operate the National Lottery. In November 2014 a 20-year licence to run the National Lottery was awarded to Premier Lotteries Ireland (PLI).
This report examines a number of key aspects of the National Lottery including:
• The micro-economic and social impacts; • The macro-economic impacts of the lottery on the Irish economy, including
its contribution to Gross Domestic Product (GDP), employment and its impacts on suppliers;
• Exchequer impacts from additional taxation and the estimated value of consumer surplus.
1.2 Methodological Approach
A schematic description of the rigorous methodology used is presented below (Figure 1.1)
3
Indecon International Economic ConsultantsIndependent Socio-Economic Impact Assessment of the National Lottery
1 Introduction and Methodology
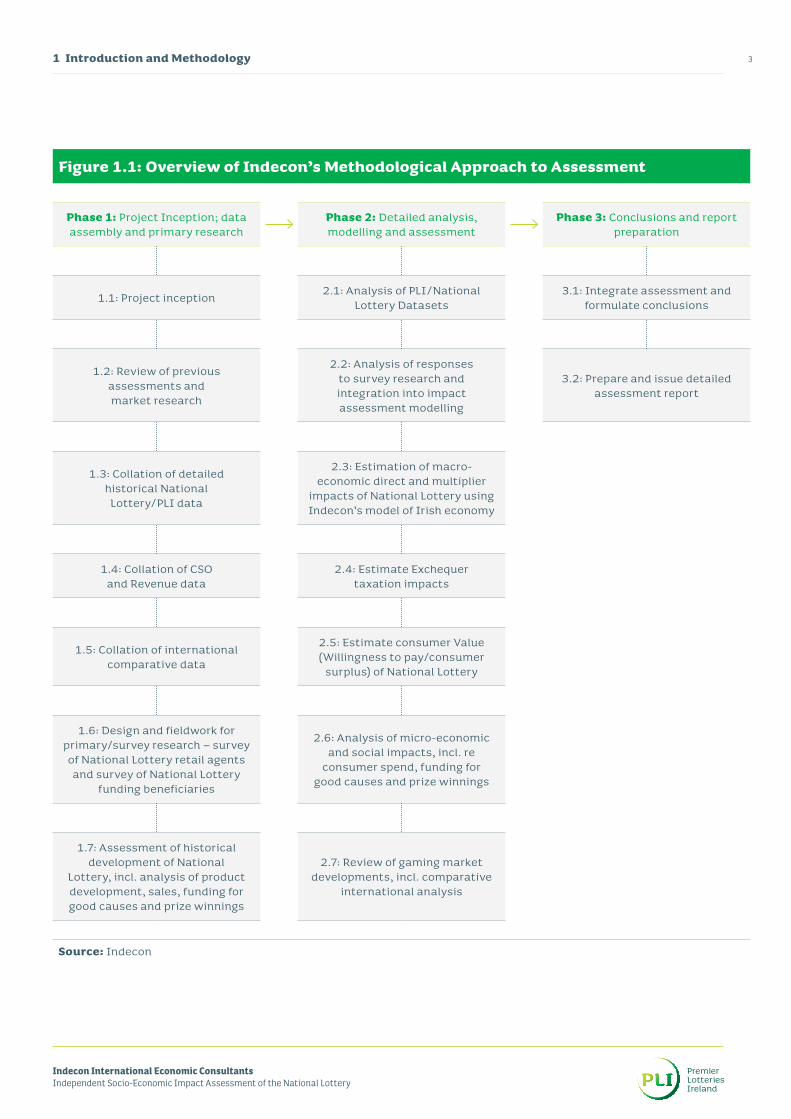
Figure 1.1: Overview of Indecon’s Methodological Approach to Assessment
Phase 1: Project Inception; data assembly and primary research
Phase 2: Detailed analysis, modelling and assessment
Phase 3: Conclusions and report preparation
1.1: Project inception 2.1: Analysis of PLI/National Lottery Datasets
3.1: Integrate assessment and formulate conclusions
1.2: Review of previous assessments and market research
2.2: Analysis of responses to survey research and integration into impact assessment modelling
3.2: Prepare and issue detailed assessment report
1.3: Collation of detailed historical National Lottery/PLI data
2.3: Estimation of macro-economic direct and multiplier
impacts of National Lottery using Indecon’s model of Irish economy
1.4: Collation of CSO and Revenue data
2.4: Estimate Exchequer taxation impacts
1.5: Collation of international comparative data
2.5: Estimate consumer Value (Willingness to pay/consumer
surplus) of National Lottery
1.6: Design and fieldwork for primary/survey research – survey of National Lottery retail agents and survey of National Lottery
funding beneficiaries
2.6: Analysis of micro-economic and social impacts, incl. re
consumer spend, funding for good causes and prize winnings
1.7: Assessment of historical development of National
Lottery, incl. analysis of product development, sales, funding for good causes and prize winnings
2.7: Review of gaming market developments, incl. comparative
international analysis
Source: Indecon
1 Introduction and Methodology4
1.2.1 Framework for assessment of impacts
This assessment builds on Indecon’s previous research into the impact of the National Lottery and examines a diverse set of economic and social impacts associated with the National Lottery. A schematic description of the conceptual framework was applied in completing the assessment is set out in the figure below (Figure 1.2).
5
Indecon International Economic ConsultantsIndependent Socio-Economic Impact Assessment of the National Lottery
1 Introduction and Methodology
Figure 1.2: Framework Used to Assess Economic and Social Impacts of National Lottery
National Lottery Company
Direct Consumer Expenditure Impact
(Lottery Sales less Prizes Paid Out
Lottery Consumer Expenditure
Impact on GDPPrize Winners Prize Winnings
Impact of Re-Expenditure
of Prize Winnings
Lottery Retail AgentsAdditional
Non-Lottery Sales within Retail Agents
National Lottery Company
National Lottery Company Expenditures
Expenditures on Sub-Supply Inputs
Expenditure Impacts on Sub-SuppliersRetail Agents
Lottery Funding Beneficiaries
Funding for Good Causes Prize Winnings
National Lottery Company
Employment and Incomes Supported
and Exchequer Taxation Contribution
Employment and Incomes Supported
and Taxation ImpactsRetail Agents
Lottery Funding Beneficiaries
Multiplier Impacts
(a) Consumer Expenditure (b) Expenditure on Sub-Suppliers
(c) Employment and Incomes
Consumer Value/Consumer Surplus Economy-wide Impacts of National Lottery
Source: Indecon
1 Introduction and Methodology6
This detailed assessment uses data from a wide range of sources:
• Detailed financial data on National Lottery provided by Premier Lotteries Ireland, including: • Lottery sales data by product/game by County;• Good Causes funding data;• Prize winnings by game and amount;• National Lottery retail agents, number by County;• Lottery online sales;• Product development and innovations.
• Market research, including tracking surveys on National Lottery players;• Comparative international data, including data from La Fleurs World Lottery Almanac,
the UK Gambling Commission, and Company Service aux Lotteries en Europe (SLE); • Department of Public Expenditure and Reform, Revised Estimates (various years);• Revenue Commissioners data on receipts from betting taxation;• Central Statistics Office (CSO) datasets, including Quarterly National Household
Survey (QNHS) and Household Budget Survey.
This assessment was supported by extensive new primary research, including:
• Survey of National Lottery retail agents; • Survey of National Lottery Good Causes beneficiary organisations.
This research was used to achieve a deeper understanding of the economic and social impacts of the National Lottery and to inform the analysis. Qualitative inputs were obtained from organisations in receipt of funding for Good Causes, and the implications for National lottery retailers was assessed.
1.3 Report Structure
The remainder of this report is structured as follows:
• Section 2 contains a discussion of the development of the National Lottery;• Section 3 assesses the micro-economic and social impacts of the National Lottery;• Section 4 examines the macro-economic impacts of the lottery on Irish economy
as a whole; • Section 5 presents an overview of under market developments.
1.4 Acknowledgements and Disclaimer
Indecon would like to express our gratitude to management and staff at Premier Lotteries Ireland, including Dermot Griffin, Miriam Donohoe, Carol-Anne Bergin, Dorothy Donohoe, Robert Magee, George Canavan, Sile Rooney, Jenny Fisher and Maurice Nolan, for their valuable assistance throughout the process of completing this study.
Particular thanks are due to organisations that received National Lottery funding and National Lottery retail agents who provided valuable inputs.
The usual disclaimer applies and the analysis and findings in this independent report are the sole responsibility of Indecon Research Economists.
2 Development of National Lottery in Ireland
Indecon International Economic ConsultantsIndependent Socio-Economic Impact Assessment of the National Lottery
2 Development of National Lottery in Ireland8
2 Development of National Lottery in Ireland
This section contains an overview of the National Lottery, focusing on developments since its establishment in 1987.
2.1 Trends in Lottery Sales
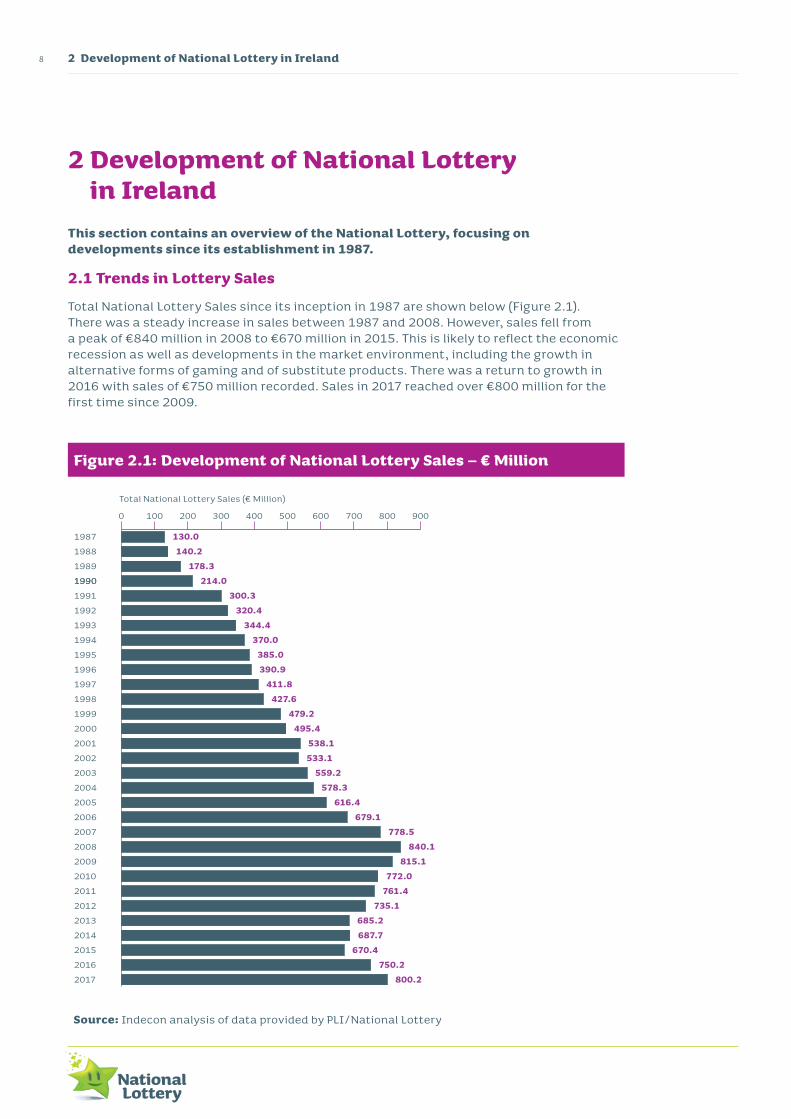
Total National Lottery Sales since its inception in 1987 are shown below (Figure 2.1). There was a steady increase in sales between 1987 and 2008. However, sales fell from a peak of €840 million in 2008 to €670 million in 2015. This is likely to reflect the economic recession as well as developments in the market environment, including the growth in alternative forms of gaming and of substitute products. There was a return to growth in 2016 with sales of €750 million recorded. Sales in 2017 reached over €800 million for the first time since 2009.
Figure 2.1: Development of National Lottery Sales – € Million
130.0140.2
178.3214.0
300.3320.4
344.4370.0
385.0390.9
411.8427.6
479.2495.4
538.1533.1
559.2578.3
616.4679.1
778.5840.1
815.1772.0
761.4735.1
685.2687.7
670.4750.2
800.2
0 100 200 300 400 500 600 700 800 900
Total National Lottery Sales (€ Million)
1987
1988
1989
1990
2017
1990
1991
1992
1993
1994
1995
1996
1997
1998
1999
2000
2001
2002
2003
2004
2005
2006
2007
2008
2009
2010
2011
2012
2013
2014
2015
2016
Source: Indecon analysis of data provided by PLI/National Lottery
Indecon International Economic ConsultantsIndependent Socio-Economic Impact Assessment of the National Lottery
92 Development of National Lottery in Ireland
2.2 Innovation and Product Development
The chart below shows how the product offering of the National Lottery has developed since its establishment in 1987 (Figure 2.2). The first products offered were scratch cards, followed by the Lotto in 1988. The next game launched in 1997 was Lotto 5-4-3-2-1, with Telly Bingo and Lotto Plus introduced over the following years. Phone Play (which was part of Winning Streak) started in 2003 but was discontinued in 2007. EuroMillions was introduced in 2004, followed by EuroMillions Plus in 2007. New games offered in 2008 and 2009 were: Monday Million, the Millionaire Raffle, All or Nothing. Online play was also introduced in 2009. Monday Million (as well as Monday Million Plus) and All or Nothing were discontinued after 2012. Daily Millions and Daily Millions Plus commenced in 2012 and remain part of the National Lottery’s offering. The development of these games over the last two decades highlights the product innovation implemented by the National Lottery.
Figure 2.2: Timeline of National Lottery Products
1987
1988
1989
199
019
9119
9219
9319
9419
9519
9619
9719
9819
9920
00
2001
2002
2003
200
420
0520
06
2007
2008
2009
2010
2011
2012
2013
2014
2015
2016
2017
Daily Millions Plus
Daily Millions
Monday Million Plus
Digital Channel
All or Nothing
Millionaire Raffle
Monday Million
EuroMillions Plus
EuroMillions
Phone Play
Lotto Plus
Telly Bingo
Lotto 5-4-3-2-1
Lotto
Scratch Cards (Instant Win)
Source: Indecon analysis of data provided by PLI/National Lottery
2 Development of National Lottery in Ireland10
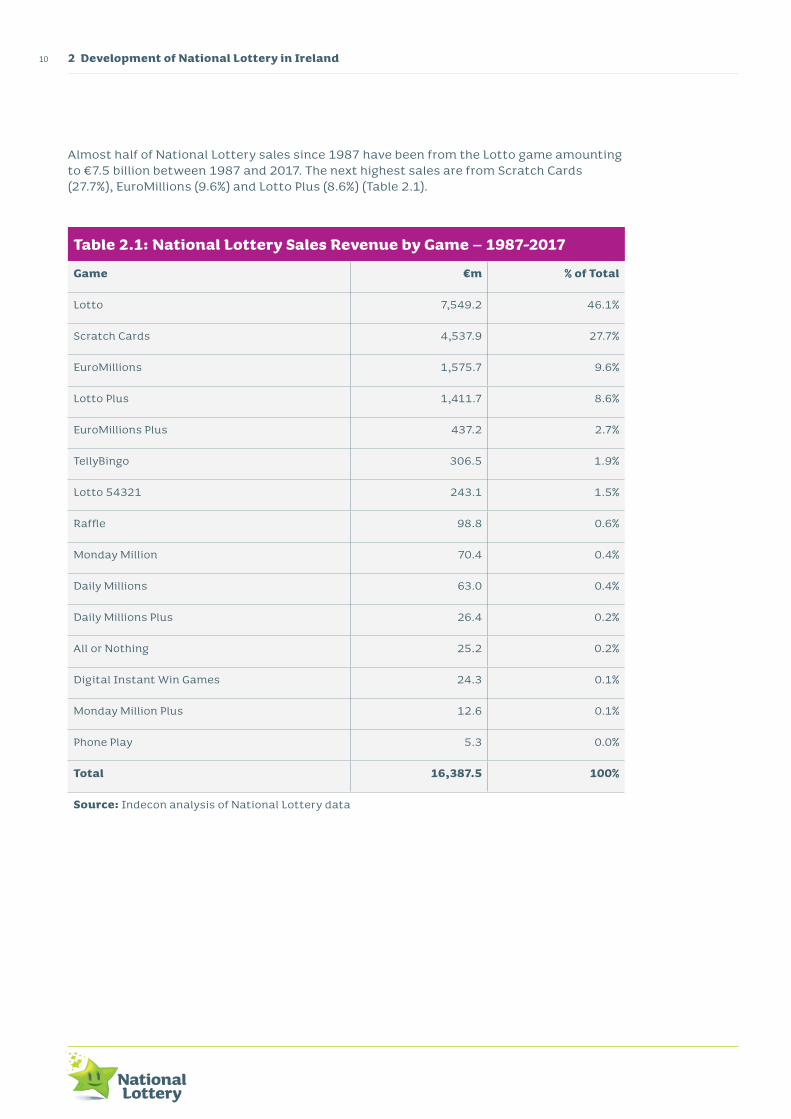
Almost half of National Lottery sales since 1987 have been from the Lotto game amounting to €7.5 billion between 1987 and 2017. The next highest sales are from Scratch Cards (27.7%), EuroMillions (9.6%) and Lotto Plus (8.6%) (Table 2.1).
Table 2.1: National Lottery Sales Revenue by Game – 1987-2017
Game €m % of Total
Lotto 7,549.2 46.1%
Scratch Cards 4,537.9 27.7%
EuroMillions 1,575.7 9.6%
Lotto Plus 1,411.7 8.6%
EuroMillions Plus 437.2 2.7%
TellyBingo 306.5 1.9%
Lotto 54321 243.1 1.5%
Raffle 98.8 0.6%
Monday Million 70.4 0.4%
Daily Millions 63.0 0.4%
Daily Millions Plus 26.4 0.2%
All or Nothing 25.2 0.2%
Digital Instant Win Games 24.3 0.1%
Monday Million Plus 12.6 0.1%
Phone Play 5.3 0.0%
Total 16,387.5 100%
Source: Indecon analysis of National Lottery data
Indecon International Economic ConsultantsIndependent Socio-Economic Impact Assessment of the National Lottery
112 Development of National Lottery in Ireland
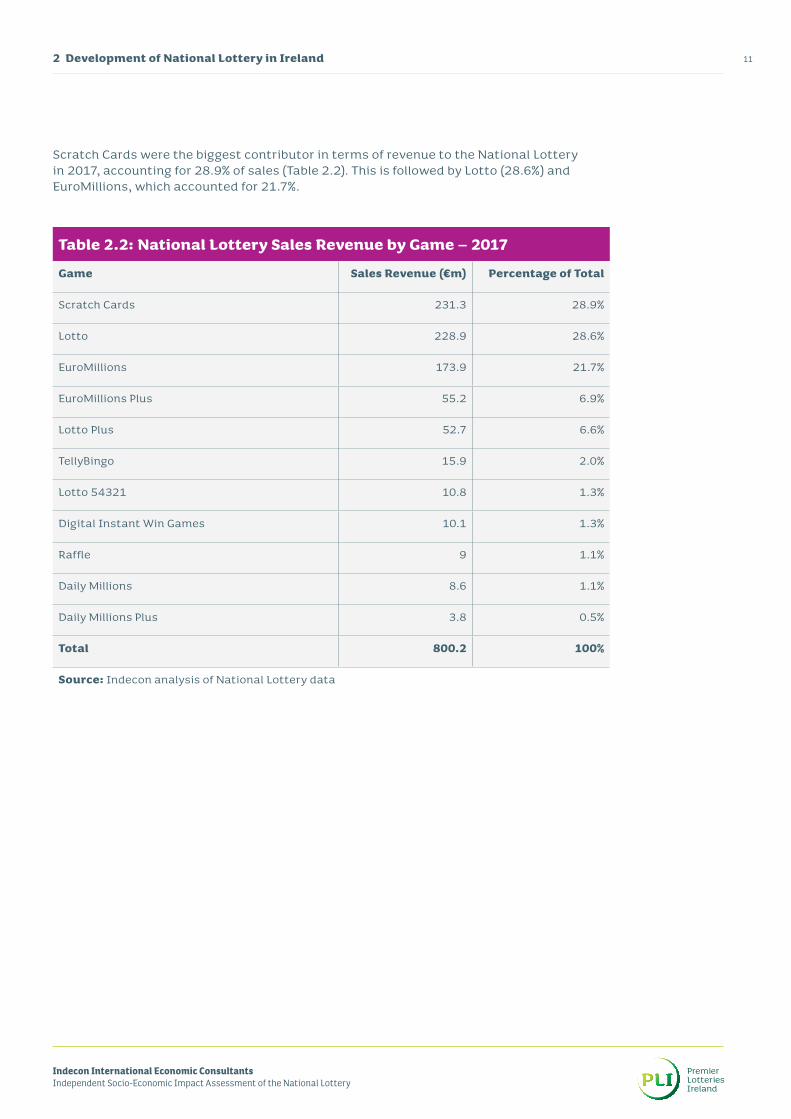
Scratch Cards were the biggest contributor in terms of revenue to the National Lottery in 2017, accounting for 28.9% of sales (Table 2.2). This is followed by Lotto (28.6%) and EuroMillions, which accounted for 21.7%.
Table 2.2: National Lottery Sales Revenue by Game – 2017
Game Sales Revenue (€m) Percentage of Total
Scratch Cards 231.3 28.9%
Lotto 228.9 28.6%
EuroMillions 173.9 21.7%
EuroMillions Plus 55.2 6.9%
Lotto Plus 52.7 6.6%
TellyBingo 15.9 2.0%
Lotto 54321 10.8 1.3%
Digital Instant Win Games 10.1 1.3%
Raffle 9 1.1%
Daily Millions 8.6 1.1%
Daily Millions Plus 3.8 0.5%
Total 800.2 100%
Source: Indecon analysis of National Lottery data
2 Development of National Lottery in Ireland12
The main games in the National Lottery's portfolio, as of 2017 are as follow:
Table 2.3: Main National Lottery Games – 2017
Games
Scratch Cards
Lotto
Lotto Plus
Lotto 5-4-3-2-1
Telly Bingo
EuroMillions
EuroMillions Plus
Millionaire Raffle
Digital Instant Win Games
Daily Millions
Daily Millions Plus
Source: Indecon analysis of data provided by PLI/National Lottery
Indecon International Economic ConsultantsIndependent Socio-Economic Impact Assessment of the National Lottery
132 Development of National Lottery in Ireland
The significance of product innovation can be seen by comparing the percentage of sales by game in 2017 compared to 1990. Scratch Cards and Lotto accounted for under 30% of sales in 2017.
Figure 2.3: % of Sales by Game – 1990 vs. 2017
Lotto65%
EuroMillions22%
2.3
EuroMillions Plus7%
Raffle 1%
Source: Indecon analysis of data provided by PLI/National Lottery
Daily Million Plus0%
Daily Million 1%
Digital IWG1%
Lotto29%
Lotto Plus7%
Lotto 543211%
TellyBingo2%
Scratch Cards35%
Instant WinScratch Cards29%
1990 2017
Source: Indecon analysis of data provided by PLI/National Lottery
2 Development of National Lottery in Ireland14
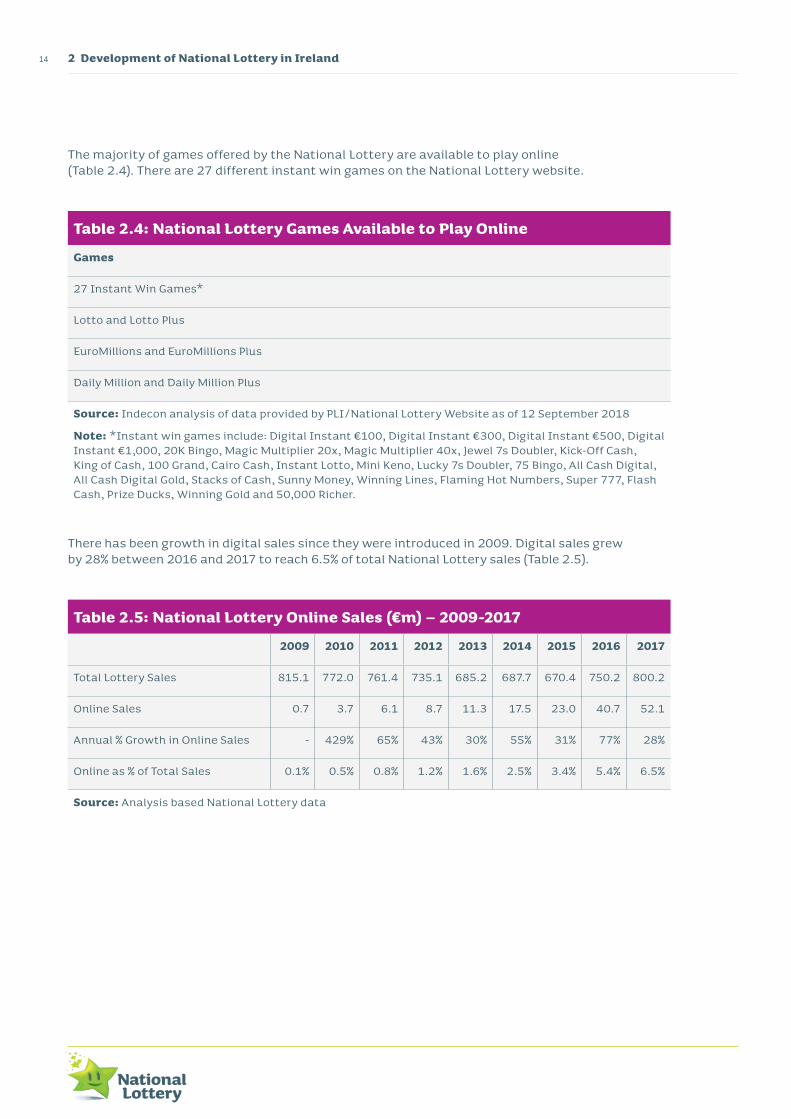
The majority of games offered by the National Lottery are available to play online (Table 2.4). There are 27 different instant win games on the National Lottery website.
Table 2.4: National Lottery Games Available to Play Online
Games
27 Instant Win Games*
Lotto and Lotto Plus
EuroMillions and EuroMillions Plus
Daily Million and Daily Million Plus
Source: Indecon analysis of data provided by PLI/National Lottery Website as of 12 September 2018
Note: *Instant win games include: Digital Instant €100, Digital Instant €300, Digital Instant €500, Digital Instant €1,000, 20K Bingo, Magic Multiplier 20x, Magic Multiplier 40x, Jewel 7s Doubler, Kick-Off Cash, King of Cash, 100 Grand, Cairo Cash, Instant Lotto, Mini Keno, Lucky 7s Doubler, 75 Bingo, All Cash Digital, All Cash Digital Gold, Stacks of Cash, Sunny Money, Winning Lines, Flaming Hot Numbers, Super 777, Flash Cash, Prize Ducks, Winning Gold and 50,000 Richer.
There has been growth in digital sales since they were introduced in 2009. Digital sales grew by 28% between 2016 and 2017 to reach 6.5% of total National Lottery sales (Table 2.5).
Table 2.5: National Lottery Online Sales (€m) – 2009-2017
Online as % of Total Sales 0.1% 0.5% 0.8% 1.2% 1.6% 2.5% 3.4% 5.4% 6.5%
Source: Analysis based National Lottery data
Indecon International Economic ConsultantsIndependent Socio-Economic Impact Assessment of the National Lottery
152 Development of National Lottery in Ireland
The growth in online sales reached €52.1 million in 2017, compared to €0.7 million in 2009 (Figure 2.4). Most of the sales were from draw-based games such as Lotto or EuroMillions.
Figure 2.4: National Lottery Digital Sales (€m) – 2009-2017
0 10 20 30 40 50 60
0.72009
3.72010
6.12011
8.72012
11.32013
17.52014
23.02015
40.72016
52.12017
Internet Sales (€ Million)
Source: Analysis based PLI/National Lottery data
2 Development of National Lottery in Ireland16
2.3 Summary of Key Findings
The key findings of this section are summarized below:
• There was a steady increase in sales between 1987 and 2008. However, sales fell from a peak of €840 million in 2008 to €670 million in 2015. This in part is likely to reflect the economic recession as well as developments in the market environment, including the growth in alternative forms of gaming and of substitute products. National Lottery sales returned to growth in 2016 to €750 million, before reaching over €800 million in 2017.
• Since Premier Lotteries Ireland began operating the National Lottery in 2014 there have been a number of developments in the games available.
• The significance of product innovation can be seen by comparing the percentage of sales by game in 2017 compared to 1990. Scratch Cards/Instant Win Games and Lotto accounted for under 30% of sales in 2017.
3 Assessment of Micro-Economic and Social Impacts
Indecon International Economic ConsultantsIndependent Socio-Economic Impact Assessment of the National Lottery
3 Assessment of Micro-Economic and Social Impacts18
3 Assessment of Micro-Economic and Social Impacts
3.1 Introduction
This section examines three key areas:
• Funds for Good Causes beneficiaries;• Funds returned to the community via prize winnings; • The impact on National Lottery retail agents.
3.2 Funds for Good Causes beneficiaries
The National Lottery Fund (NLF) was set up under the National Lottery Act, with a portion of the revenue from the sales of National Lottery products being paid into the NLF. This fund supports activities in the following:1
• Sport and recreation;• National culture and heritage (including the Irish language);• The Arts (within the meaning of the Arts Act 2003);• Health of the community;• Youth, welfare and amenities;• Natural environment; and,• Such other objectives (if any) as the Government may determine from time to time.
The amount given in funding to beneficiaries is outlined in Table 3.1. Beneficiary funding in 2017 amounted to over €226 million.
1 National Lottery Act 2013, Op. Cit.
193 Assessment of Micro-Economic and Social Impacts
Indecon International Economic ConsultantsIndependent Socio-Economic Impact Assessment of the National Lottery
Table 3.1: Total National Lottery Funding for Good Causes – 2006-2017
Year € Million
2006 218.0
2007 245.5
2008 267.8
2009 263.5
2010 243.7
2011 231.9
2012 225.3
2013 205.9
2014 194.6
2015 188.0
2016 213.0
2017 226.3
Source: Analysis based on National Lottery data
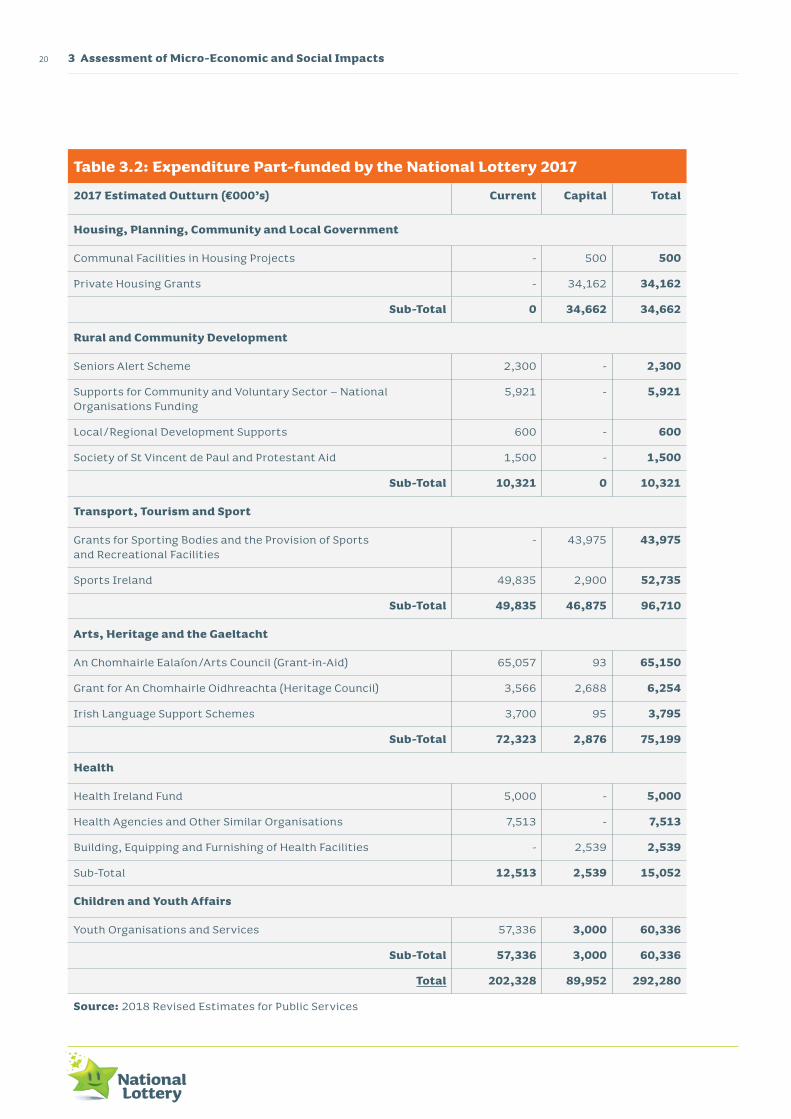
Table 3.2 shows the estimated expenditure supported by National Lottery Good Causes funds.
3 Assessment of Micro-Economic and Social Impacts20
Table 3.2: Expenditure Part-funded by the National Lottery 2017
2017 Estimated Outturn (€000’s) Current Capital Total
Housing, Planning, Community and Local Government
Communal Facilities in Housing Projects - 500 500
Private Housing Grants - 34,162 34,162
Sub-Total 0 34,662 34,662
Rural and Community Development
Seniors Alert Scheme 2,300 - 2,300
Supports for Community and Voluntary Sector – National Organisations Funding
5,921 - 5,921
Local/Regional Development Supports 600 - 600
Society of St Vincent de Paul and Protestant Aid 1,500 - 1,500
Sub-Total 10,321 0 10,321
Transport, Tourism and Sport
Grants for Sporting Bodies and the Provision of Sports and Recreational Facilities
- 43,975 43,975
Sports Ireland 49,835 2,900 52,735
Sub-Total 49,835 46,875 96,710
Arts, Heritage and the Gaeltacht
An Chomhairle Ealaíon/Arts Council (Grant-in-Aid) 65,057 93 65,150
Grant for An Chomhairle Oidhreachta (Heritage Council) 3,566 2,688 6,254
Irish Language Support Schemes 3,700 95 3,795
Sub-Total 72,323 2,876 75,199
Health
Health Ireland Fund 5,000 - 5,000
Health Agencies and Other Similar Organisations 7,513 - 7,513
Building, Equipping and Furnishing of Health Facilities - 2,539 2,539
Sub-Total 12,513 2,539 15,052
Children and Youth Affairs
Youth Organisations and Services 57,336 3,000 60,336
Sub-Total 57,336 3,000 60,336
Total 202,328 89,952 292,280
Source: 2018 Revised Estimates for Public Services
213 Assessment of Micro-Economic and Social Impacts
Indecon International Economic ConsultantsIndependent Socio-Economic Impact Assessment of the National Lottery
Funding for Transport, Tourism and Sport was one of the most important expenditure areas, part funded by the National Lottery by 33%. This is followed by Arts, Heritage and the Gaeltacht (26%), and Children and Youth Affairs (Figure 3.1).
Figure 3.1: Breakdown of Total Public Expenditure on Activities which are Part-funded by the National Lottery – 2017 – %
Housing, Planning,Community and LocalGovernment 12%
Rural and CommunityDevelopment 3%Health 5%
Children and Youth Affairs 21%
Arts, Heritage and the Gaeltacht 26%
Transport, Tourismand Sport 33%
Source: Indecon analysis of 2018 Revised Estimates for Public Service Expenditure
3.3 Impact of Good Causes funding
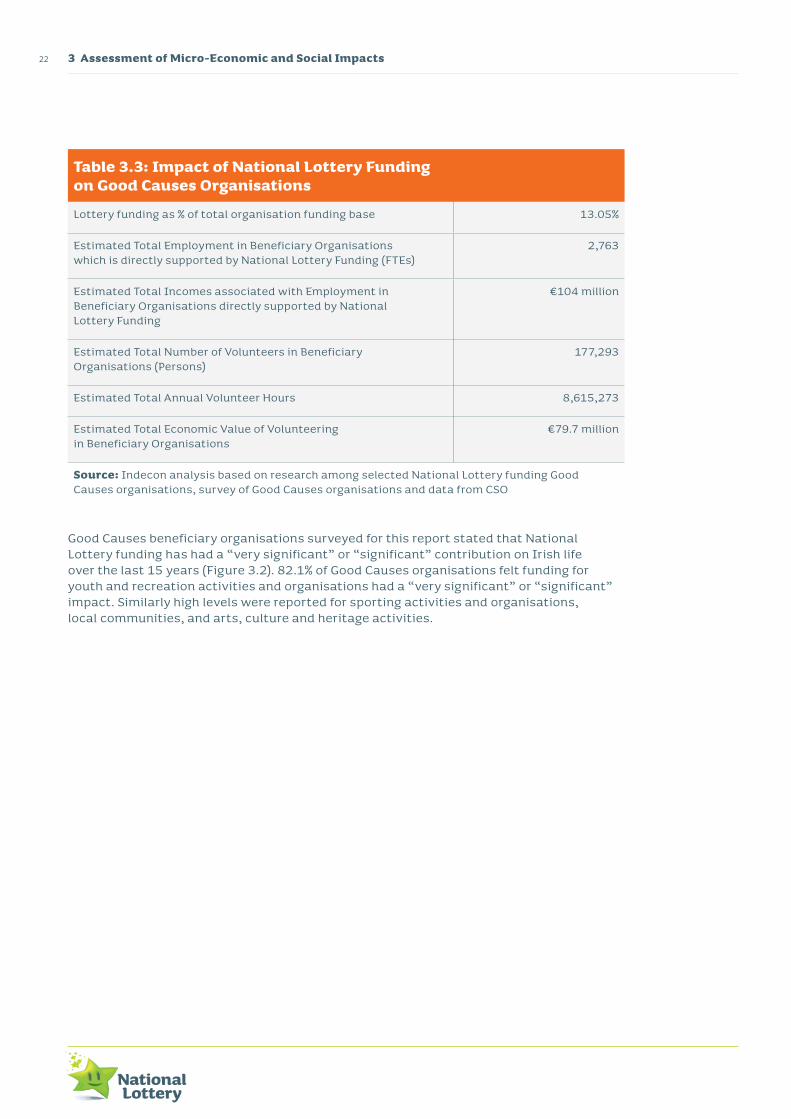
An important impact of National Lottery Good Causes funding is the employment it supports directly in beneficiary organisations. Estimates suggest that 2,763 full-time equivalent jobs (FTEs) were supported directly through National Lottery funding in 2017. (These organisations are estimated to have 15,285 full-time equivalent employees in total). Estimates based on this report’s modelling indicate that approximately €104 million in employment incomes are supported directly through the contribution made by National Lottery funding to these organisations. In addition, there are over 177,000 volunteers working in Good Causes organisations. The value to the economy of this volunteering is estimated at over €79.7 million per annum (Table 3.3).
3 Assessment of Micro-Economic and Social Impacts22
Table 3.3: Impact of National Lottery Funding on Good Causes Organisations
Lottery funding as % of total organisation funding base 13.05%
Estimated Total Employment in Beneficiary Organisations which is directly supported by National Lottery Funding (FTEs)
2,763
Estimated Total Incomes associated with Employment in Beneficiary Organisations directly supported by National Lottery Funding
€104 million
Estimated Total Number of Volunteers in Beneficiary Organisations (Persons)
177,293
Estimated Total Annual Volunteer Hours 8,615,273
Estimated Total Economic Value of Volunteering in Beneficiary Organisations
€79.7 million
Source: Indecon analysis based on research among selected National Lottery funding Good Causes organisations, survey of Good Causes organisations and data from CSO
Good Causes beneficiary organisations surveyed for this report stated that National Lottery funding has had a “very significant” or “significant” contribution on Irish life over the last 15 years (Figure 3.2). 82.1% of Good Causes organisations felt funding for youth and recreation activities and organisations had a “very significant” or “significant” impact. Similarly high levels were reported for sporting activities and organisations, local communities, and arts, culture and heritage activities.
233 Assessment of Micro-Economic and Social Impacts
Indecon International Economic ConsultantsIndependent Socio-Economic Impact Assessment of the National Lottery
Figure 3.2: National Lottery Good Causes Beneficiaries – Perceived Socio-economic Impact of the National Lottery in Ireland over the Past 15 Years
0 10 20 30 40 50 60 70 80 90 100
Provision of funding for Youth and Recreation Activities and Organisations
Provision of funding for Sporting Activities and Organisations
Support for Arts, Culture and Heritage Organisations and Activities
Support for Local Communities
Provision for funding for Community Health and Welfare facilities in Ireland
Provision for funding for Charitable Organisations
Support for Irish Language Activities and Organisations
Contribution to Exchequer Taxation
Provision of funding for Social Enterprises
82.1%
78.0%
76.3%
75.0%
68.9%
55.0%
48.6%
44.4%
42.1%
Source: Indecon Confidential Survey of National Lottery Funding Beneficiaries
3 Assessment of Micro-Economic and Social Impacts24
A surveys of retail agents found:
• 92.1% believed National Lottery funding had a “very” or “important” impact on support for sporting activities and organisations.
• Support for children/youth organisations was also viewed as important.• 86.9% suggested National Lottery funding had a very important or important
impact on local communities.
Table 3.4: National Lottery Retail Agents – Importance of Socio-Economic Impact of the National Lottery in Ireland Over the Past 15 Years
Very Important
Important Neither Important
Nor Unimportant
Unimportant Very Unimportant
Support for Health and Welfare facilities in Ireland
33.5% 43.5% 17.4% 4.3% 1.3%
Support for Sporting Activities and Organisations
47.8% 44.3% 5.2% 1.3% 1.3%
Support for Children/Youth and Recreation Activities and Organisations
39.3% 49.8% 8.3% 1.3% 1.3%
Support for Arts, Culture and Heritage Organisations and Activities
27.3% 48.9% 19.0% 2.6% 2.2%
Support for Irish Language Activities and Organisations
19.9% 35.1% 31.2% 10.4% 3.5%
Support for Charitable organisations
34.6% 44.7% 15.4% 3.9% 1.3%
Support for Local Communities
43.0% 43.9% 7.8% 3.5% 1.7%
Support for Social Enterprises
23.2% 42.5% 25.0% 6.1% 3.1%
Contribution to Exchequer Taxation
22.4% 29.8% 33.3% 7.0% 7.5%
Source: Confidential Survey of National Lottery Retailers
253 Assessment of Micro-Economic and Social Impacts
Indecon International Economic ConsultantsIndependent Socio-Economic Impact Assessment of the National Lottery
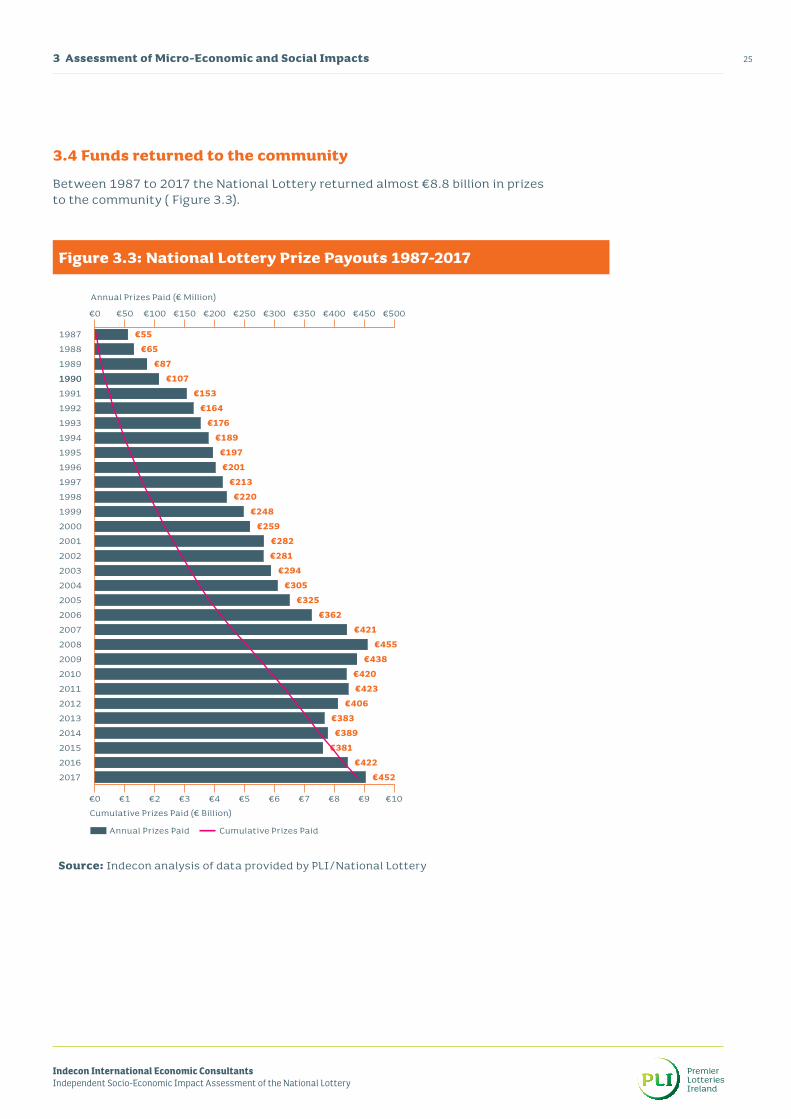
3.4 Funds returned to the community
Between 1987 to 2017 the National Lottery returned almost €8.8 billion in prizes to the community ( Figure 3.3).
Figure 3.3: National Lottery Prize Payouts 1987-2017
Source: Indecon analysis of data provided by PLI/National Lottery
3 Assessment of Micro-Economic and Social Impacts26
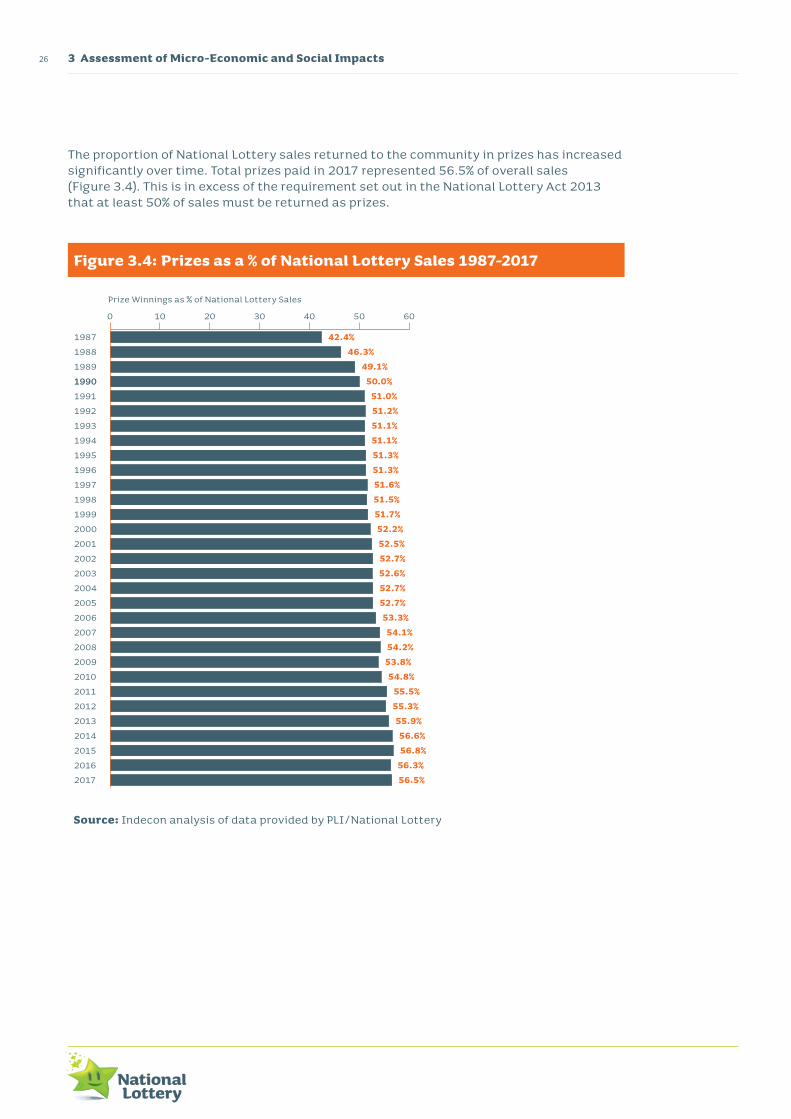
The proportion of National Lottery sales returned to the community in prizes has increased significantly over time. Total prizes paid in 2017 represented 56.5% of overall sales (Figure 3.4). This is in excess of the requirement set out in the National Lottery Act 2013 that at least 50% of sales must be returned as prizes.
Figure 3.4: Prizes as a % of National Lottery Sales 1987-2017
Source: Indecon analysis of data provided by PLI/National Lottery
273 Assessment of Micro-Economic and Social Impacts
Indecon International Economic ConsultantsIndependent Socio-Economic Impact Assessment of the National Lottery
The amount paid in prizes in 2017 was €452 million, its highest level since 2008 (Table 3.5).
Table 3.5: Total National Lottery Prizes (€m) 2007-2017
Year Prize Winnings (€ Million) Prizes as a % Total Sales
2007 420.9 54.1
2008 455.0 54.2
2009 438.3 53.8
2010 419.9 54.4
2011 422.5 55.5
2012 406.4 55.3
2013 382.7 55.9
2014 389.4 56.4
2015 381.1 56.8
2016 422.0 56.3
2017 452.0 56.5
Total 2007-2017 4,590.3 55.3
Source: Indecon analysis of National Lottery data
3 Assessment of Micro-Economic and Social Impacts28
In 2017 the three games that paid out most in prizes were Scratch Cards (34.3%), Lotto (26.3%) and EuroMillions (19.2%). Scratch Cards paid out most in prizes in 2014, compared to the previous three years when Lotto paid the most in prizes (Table 3.6).
Table 3.6: Breakdown of National Lottery Prizes by Game (%) 2011-2017
EuroMillions Plus 5.5% 6.0% 5.8% 6.3% 6.1% 6.2% 6.6%
Lotto Plus 9.4% 8.7% 8.5% 8.0% 7.4% 6.0% 5.5%
TellyBingo 3.1% 3.2% 3.5% 3.5% 3.1% 2.8% 2.6%
Instant Win Games 0.1% 0.2% 0.2% 0.4% 0.1% 1.2% 1.5%
Lotto 54321 2.2% 2.1% 2.3% 2.1% 2.0% 1.6% 1.5%
Daily Million 0.0% 1.0% 2.2% 2.3% 1.4% 1.3% 1.0%
Raffle 1.1% 1.6% 1.3% 0.5% 0.8% 0.8% 1.0%
Daily Million Plus 0.0% 0.4% 1.0% 0.0% 0.6% 0.6% 0.5%
Monday Million 1.8% 1.1% 0.0% 0.0% 0.0% 0.0% 0.0%
All or Nothing 1.1% 0.6% 0.0% 0.0% 0.0% 0.0% 0.0%
Monday Million Plus 0.8% 0.5% 0.0% 0.0% 0.0% 0.0% 0.0%
Source: Indecon analysis of National Lottery data
293 Assessment of Micro-Economic and Social Impacts
Indecon International Economic ConsultantsIndependent Socio-Economic Impact Assessment of the National Lottery
In 2017 over 79% of prizes were paid in Scratch Cards, Lotto and EuroMillions (Figure 3.5). EuroMillions Plus accounted for 6.6%.
Figure 3.5: Breakdown of National Lottery Prizes by Game 2017
EuroMillions Plus6.6%
Lotto Plus5.5%
TellyBingo2.6%
IWGs1.5%
Lotto 543211.5%
Daily Million Plus0.5%
Daily Million 1.0%
Raffle1.0%
EuroMillions19.2%
Lotto26.3%
Scratch Cards34.3%
Source: Indecon analysis of data provided by PLI/National Lottery
3 Assessment of Micro-Economic and Social Impacts30
There were 12-15 Lotto prize winners of over €1 million 2015, 2016 and 2017. The average size of these prizes was around €6m in 2017.
Table 3.7: Lotto Prizes over €1m (2015-2017)
Year Winners Amount Won
(€ Million)
% of Total Amount
Won
Average win size
(€ Million)
Jackpots Hit
Average Jackpot Size
When Hit (€ Million)
2015 15 70.0 63.3% 4.7 13 5.4
2016 13 80.2 62.8% 6.2 11 7.3
2017 12 71.8 61.4% 6.0 11 6.5
Total 40 222.0 62.5% 5.6 35 6.3
Source: Indecon analysis of National Lottery data
There were four winners of over €1 million in 2017 for the EuroMillions and the average size win was almost €40 million (Table 3.8).
Table 3.8: EuroMillions Prizes over €1m (2016-2017)
Year Winners Amount Won (€ Million)
% of Total Amount Won in that Year
Average win size (€ Million)
2016 3 91.1 70.4% 30.4
2017 4 157.5 80.0% 39.4
Source: Indecon analysis of National Lottery data
313 Assessment of Micro-Economic and Social Impacts
Indecon International Economic ConsultantsIndependent Socio-Economic Impact Assessment of the National Lottery
The majority of winners won prizes of less than €1,000 (Table 3.9). There was one prize worth between €500,000 and €999,999, whilst there were 18 winners of prizes of €1 million or above. The majority were won on Lotto, with the others winning on EuroMillions, Daily Million and the Millionaire Raffle.
Table 3.9: Breakdown of Non-Digital National Lottery Prizes 2017 (Number of Winners)
Up to €1,000
€1,001-€10,000
€10,001-€50,000
€50,001-€100,000
€100,001-€500,000
€500,001-€999,999
€1m and over
Total
EuroMillions 5,405,029 117 14 2 9 0 4 5,405,175
Lotto 3,979,158 2,114 23 20 19 1 12 3,981,347
Lotto Plus 2,531,707 119 0 0 23 0 0 2,531,849
TV Bingo 1,310,704 205 14 9 0 0 0 1,310,932
EuroMillions Plus
261,299 5,999 0 0 31 0 0 267,329
Daily Million 74,837 3 0 0 0 0 1 74,841
Daily Million Plus
65,732 9 0 0 1 0 0 65,742
L54321 58,437 65 0 0 0 0 0 58,502
L54321 Plus 1
29,893 39 0 0 0 0 0 29,932
L54321 Plus 2
27,622 32 0 0 0 0 0 27,654
Millionaire Raffle
5,015 35 0 4 1 0 1 5,056
EuroMillions Ireland Only Raffle
0 1,040 0 0 0 0 0 1,040
Total 13,749,433 9,777 51 35 84 1 18 13,759,399
Source: Indecon analysis of National Lottery data
3 Assessment of Micro-Economic and Social Impacts32
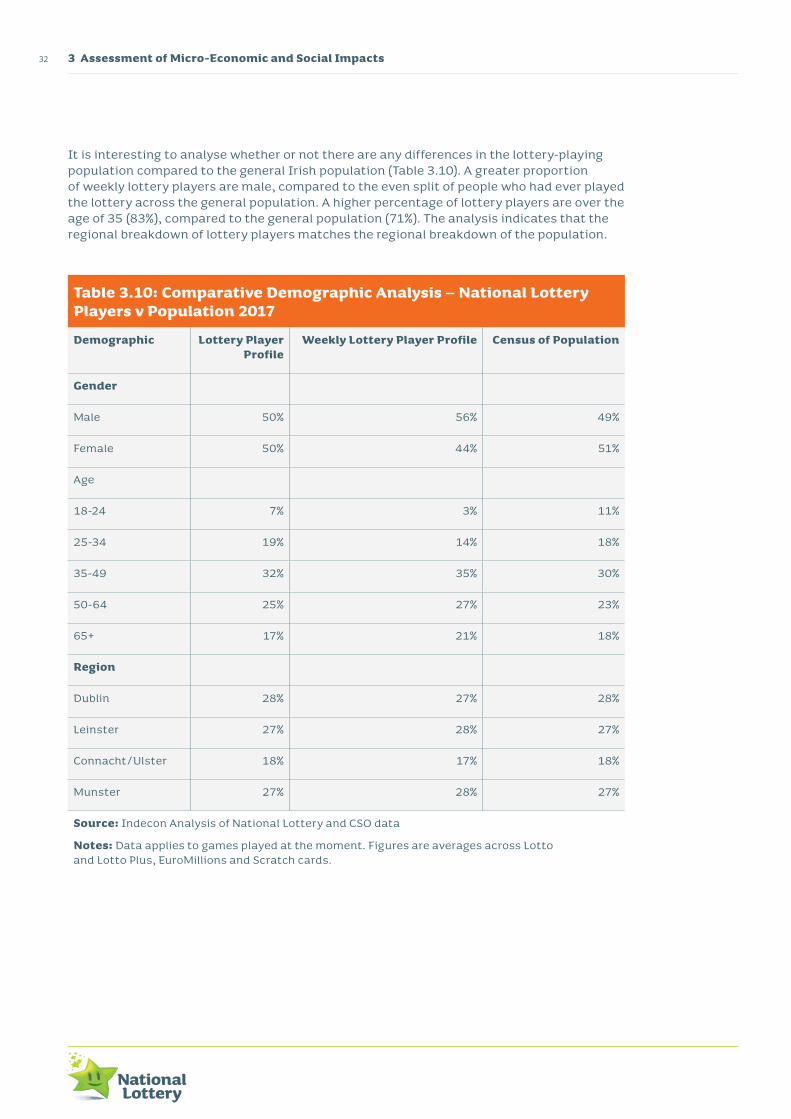
It is interesting to analyse whether or not there are any differences in the lottery-playing population compared to the general Irish population (Table 3.10). A greater proportion of weekly lottery players are male, compared to the even split of people who had ever played the lottery across the general population. A higher percentage of lottery players are over the age of 35 (83%), compared to the general population (71%). The analysis indicates that the regional breakdown of lottery players matches the regional breakdown of the population.
Table 3.10: Comparative Demographic Analysis – National Lottery Players v Population 2017
Demographic Lottery Player Profile
Weekly Lottery Player Profile Census of Population
Gender
Male 50% 56% 49%
Female 50% 44% 51%
Age
18-24 7% 3% 11%
25-34 19% 14% 18%
35-49 32% 35% 30%
50-64 25% 27% 23%
65+ 17% 21% 18%
Region
Dublin 28% 27% 28%
Leinster 27% 28% 27%
Connacht/Ulster 18% 17% 18%
Munster 27% 28% 27%
Source: Indecon Analysis of National Lottery and CSO data
Notes: Data applies to games played at the moment. Figures are averages across Lotto and Lotto Plus, EuroMillions and Scratch cards.
333 Assessment of Micro-Economic and Social Impacts
Indecon International Economic ConsultantsIndependent Socio-Economic Impact Assessment of the National Lottery
The survey into spend on different Lottery games shows that older men spend more on Lotto and EuroMillions (Table 3.11). When it comes to online Instant Win Games young men have the highest percentage of spend (27%). Spending on Scratch Cards is more evenly split.
Table 3.11: Share of Spend on National Lottery Products
Lotto EuroMillions Scratch Cards Online Instant Win Games
Young Men 8% 11% 19% 27%
Young Women 7% 9% 17% 20%
Middle Men 19% 21% 15% 21%
Middle Women 13% 14% 15% 15%
Older Men 30% 28% 16% 7%
Older Women 23% 17% 19% 11%
Total 100% 100% 100% 100%
Source: Indecon analysis of data provided by PLI/National Lottery data
The social class breakdown of National Lottery players is similar to that of the overall population (Table 3.12). While there are some variations it is, however, clear that all socio-economic groups actively play the lottery.
Table 3.12: National Lottery Participation by Social Class
Social Class Indicator Population Ever Played the Lottery Weekly Lottery Player
AB 13% 13% 12%
C1 28% 27% 27%
C2 20% 21% 23%
DE 32% 32% 32%
F 6% 7% 7%
Source: Indecon analysis of data provided by PLI/National Lottery data
Notes: Data applies to games currently offered, AB includes: Upper Middle Class and Middle Class, C1 includes Lower Middle Class, C2 includes: Skilled Working Class, DE includes: Working Class and Casual or Lower Grade Workers, F applies to Agricultural workers
3 Assessment of Micro-Economic and Social Impacts34
3.5 Impact of National Lottery on retail agents
The sales data for the National Lottery’s core retail network is broken down by draw based games and Scratch Cards on a per agent basis (Figure 3.6). Average draw based game sales per agent have remained constant despite the increase in core agencies from 2014 to 2017. When analysed organically, sales have increased slightly over the period. Scratch Card sales have seen a steady increase on a per agent weekly average basis over the same period. Larger fluctuations are due to larger jackpots in some weeks. This is also the case for ‘select’ agents, following their introduction in 2016.
Figure 3.6: Weekly Retail Sales (DBC & SC) and Number of Authorised Agents 2014-2017
€0 €5m €10m €15m €20m €25m
#Retail ex Select Agents (LHS) Retail ex Select Sales (RHS)# Linear (Retail ex Select Agents (RHS) )
Source: Indecon analysis of data provided by PLI/National Lottery Data
353 Assessment of Micro-Economic and Social Impacts
Indecon International Economic ConsultantsIndependent Socio-Economic Impact Assessment of the National Lottery
The significant increase in the number of retail agents in 2016/17 is largely due to the introduction of the Select Channel to complement the Lottery’s existing core network (Figure 3.7). Weekly sales figures fluctuated between €10 million to €15 million between 2014 and 2017.
Figure 3.7: National Lottery Sales Per Retail Agent Excl. Select Agents (Draw Based Games v Scratch Cards)
0 1000 2000 3000 4000 5000
0 1000 2000 3000 4000 5000
2017 Wk 52
2017 Wk 45
2017 Wk 38
2017 Wk 31
2017 Wk 24
2017 Wk 17
2017 Wk 10
2017 Wk 3
2016 Wk 49
2016 Wk 42
2016 Wk 35
2016 Wk 28
2016 Wk 21
2016 Wk 14
2016 Wk 7
2015 Wk 53
2015 Wk 46
2015 Wk 39
2015 Wk 32
2015 Wk 25
2015 Wk 18
2015 Wk 11
2015 Wk 4
2014 Wk 50
2014 Wk 43
2014 Wk 36
2014 Wk 29
2014 Wk 22
2014 Wk 15
2014 Wk 8
2014 Wk 1
Sales per Agent (DBG - Retail ex Select) Sales per Agent (SC - Retail ex Select)Linear (Sales per Agent (SC - Retail ex Select))Linear (Sales per Agent (DBG - Retail ex Select))
DBG SCLinear (SC) Linear (DBG)
€0 €2m €4m €6m €8m €10m €12m €14m €16m
€0 €2m €4m €6m €8m €10m €12m €14m €16m
2016_38
2016_32
2016_26
2016_20
2016_14
2017_9
2017_3
2016_50
2017_27
2017_30
2017_33
2017_42
2017_51
2017_48
2017_21
2017_15
2016_44
2016_8
2016_2
2015_49
2015_43
2015_37
2015_31
2015_25
2015_19
2015_13
2015_7
2015_1
Source: Indecon analysis of data provided by PLI/National Lottery Data
3 Assessment of Micro-Economic and Social Impacts36
The National Lottery supports a large network of retail agents, totalling 5,780 in 2017. This has expanded by over 50% since 2006 with the greatest increase in 2016/17 because of Select Channel. This saw the retail estate grow from 4002 at the end of 2015 to 5,780 by 2017. Lottery Select allowed for the sale of a limited range of Lottery products through Payzone & PostPoint agents and all Post Offices nationwide using an integrated point of sale solution.
Table 3.13: Number of National Lottery Retail Agents 2006-2017
Year No. Of Agents (Core Network) No. of Agents (Select Channel) Total Agents
2006 3,489 0 3,489
2007 3,623 0 3,623
2008 3,675 0 3,675
2009 3,794 0 3,794
2010 3,813 0 3,813
2011 3,780 0 3,780
2012 3,744 0 3,744
2013 3,745 0 3,745
2014 3,700 0 3,700
2015 4,002 0 4,002
2016 4,008 1,282 5,290
2017 3,969 1,811 5,780
Source: Indecon analysis of data provided by PLI/National Lottery data
Commission paid to retail agents increased between 2016 and 2017 from €40.6 million to €47 million, reversing a decline between 2014 and 2015 (Table 3.14).
373 Assessment of Micro-Economic and Social Impacts
Indecon International Economic ConsultantsIndependent Socio-Economic Impact Assessment of the National Lottery
Table 3.14: National Lottery Commissions Paid to Retailers 2006-2017
Year Retail Agent Commissions Paid by National Lottery – € Million
2006 42.1
2007 49.0
2008 52.3
2009 50.9
2010 47.9
2011 47.1
2012 45.4
2013 42.1
2014 42.2
2015 40.6
2016 44.5
2017 47.0
Source: Indecon analysis of data provided by PLI/National Lottery data
Using the level of National Lottery sales through retail agents, and responses from our survey of retailers, it is estimated that, on average, National Lottery sales amount to 6.44% of total sales (Table 3.15).
Table 3.15: Estimated Total Sales (Lottery and Non-Lottery) of National Lottery Retail Agents 2017
Metric Details
Total National Lottery Sales through Retail Agents (€m) (A) €748.1 m
% of Total Retail Agent Sales from Lottery Products (B) 6.44%
Total Sales (Lottery and Non-Lottery) of National Lottery Retail Agents (€m) (A/B) €11,610.8 m
Source: Indecon analysis
Notes: Sales through retail agents equates to total sales less online sales. (A) is taken from analysis based on data provided to Indecon by the National Lottery. (B) is derived from Indecon’s Confidential Survey of National Lottery Retail Agents.
3 Assessment of Micro-Economic and Social Impacts38
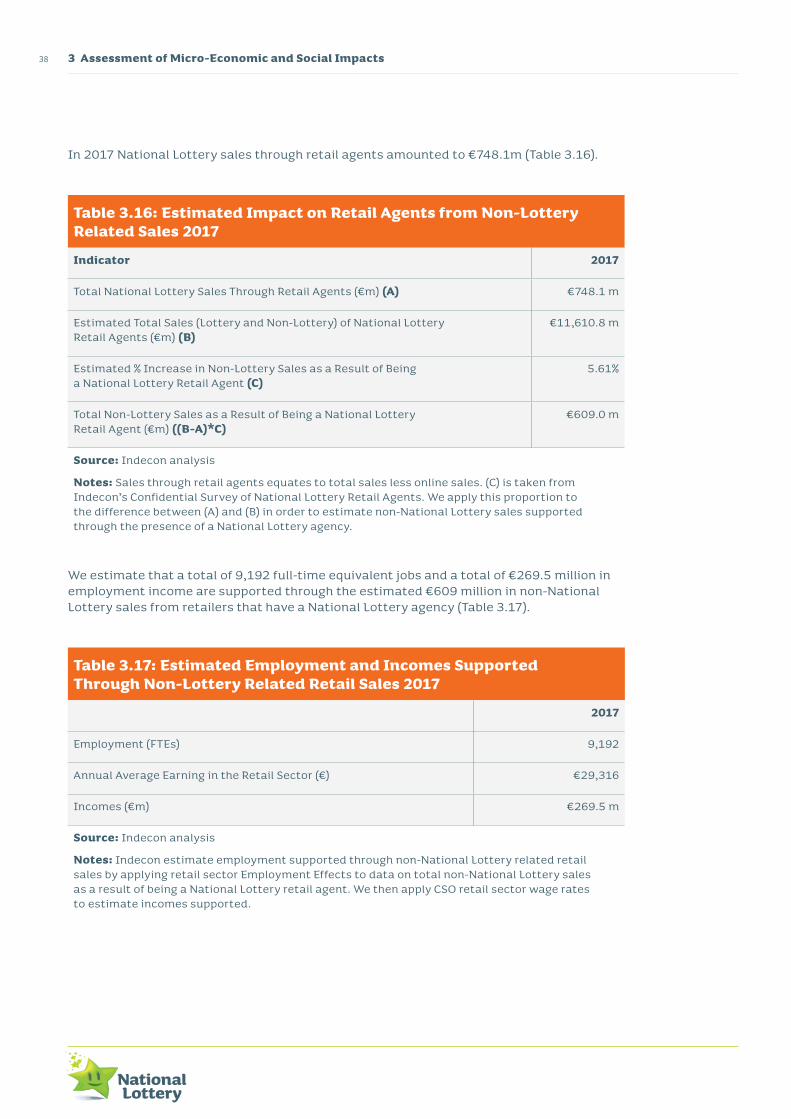
In 2017 National Lottery sales through retail agents amounted to €748.1m (Table 3.16).
Table 3.16: Estimated Impact on Retail Agents from Non-Lottery Related Sales 2017
Indicator 2017
Total National Lottery Sales Through Retail Agents (€m) (A) €748.1 m
Estimated Total Sales (Lottery and Non-Lottery) of National Lottery Retail Agents (€m) (B)
€11,610.8 m
Estimated % Increase in Non-Lottery Sales as a Result of Being a National Lottery Retail Agent (C)
5.61%
Total Non-Lottery Sales as a Result of Being a National Lottery Retail Agent (€m) ((B-A)*C)
€609.0 m
Source: Indecon analysis
Notes: Sales through retail agents equates to total sales less online sales. (C) is taken from Indecon’s Confidential Survey of National Lottery Retail Agents. We apply this proportion to the difference between (A) and (B) in order to estimate non-National Lottery sales supported through the presence of a National Lottery agency.
We estimate that a total of 9,192 full-time equivalent jobs and a total of €269.5 million in employment income are supported through the estimated €609 million in non-National Lottery sales from retailers that have a National Lottery agency (Table 3.17).
Table 3.17: Estimated Employment and Incomes Supported Through Non-Lottery Related Retail Sales 2017
2017
Employment (FTEs) 9,192
Annual Average Earning in the Retail Sector (€) €29,316
Incomes (€m) €269.5 m
Source: Indecon analysis
Notes: Indecon estimate employment supported through non-National Lottery related retail sales by applying retail sector Employment Effects to data on total non-National Lottery sales as a result of being a National Lottery retail agent. We then apply CSO retail sector wage rates to estimate incomes supported.
393 Assessment of Micro-Economic and Social Impacts
Indecon International Economic ConsultantsIndependent Socio-Economic Impact Assessment of the National Lottery
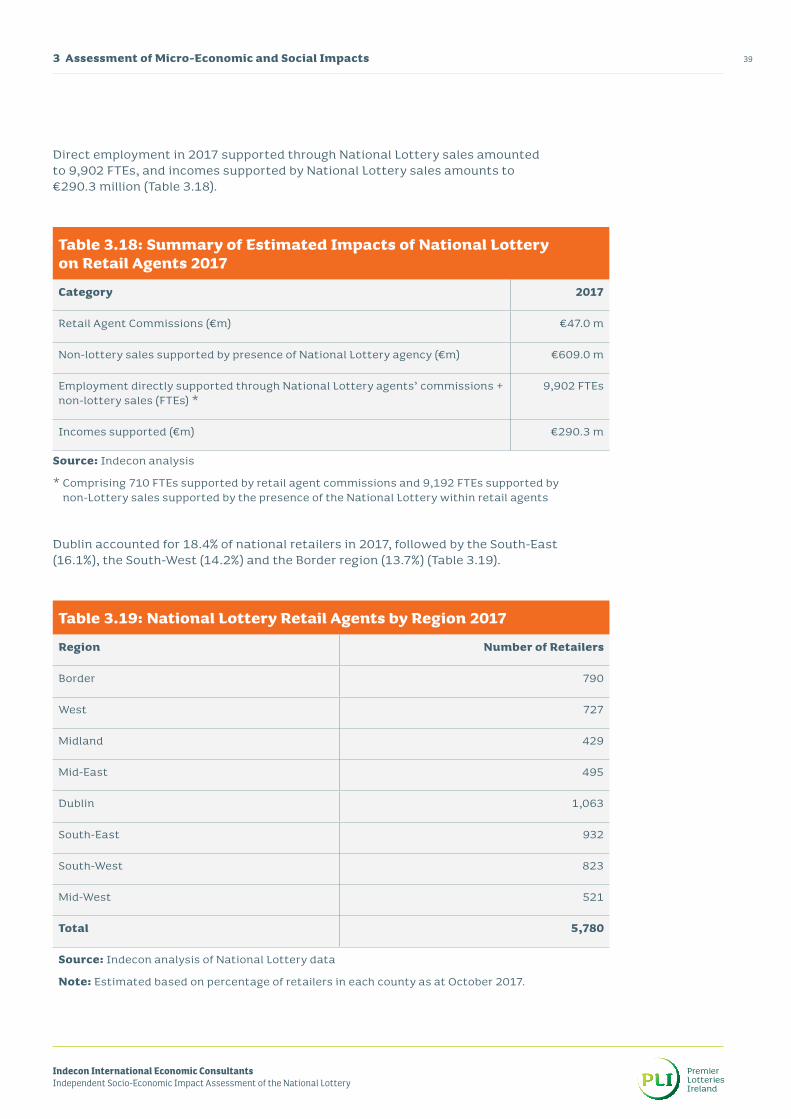
Direct employment in 2017 supported through National Lottery sales amounted to 9,902 FTEs, and incomes supported by National Lottery sales amounts to €290.3 million (Table 3.18).
Table 3.18: Summary of Estimated Impacts of National Lottery on Retail Agents 2017
Category 2017
Retail Agent Commissions (€m) €47.0 m
Non-lottery sales supported by presence of National Lottery agency (€m) €609.0 m
Employment directly supported through National Lottery agents’ commissions + non-lottery sales (FTEs) *
9,902 FTEs
Incomes supported (€m) €290.3 m
Source: Indecon analysis
* Comprising 710 FTEs supported by retail agent commissions and 9,192 FTEs supported by non-Lottery sales supported by the presence of the National Lottery within retail agents
Dublin accounted for 18.4% of national retailers in 2017, followed by the South-East (16.1%), the South-West (14.2%) and the Border region (13.7%) (Table 3.19).
Table 3.19: National Lottery Retail Agents by Region 2017
Region Number of Retailers
Border 790
West 727
Midland 429
Mid-East 495
Dublin 1,063
South-East 932
South-West 823
Mid-West 521
Total 5,780
Source: Indecon analysis of National Lottery data
Note: Estimated based on percentage of retailers in each county as at October 2017.
3 Assessment of Micro-Economic and Social Impacts40
Dublin accounted for a quarter of total National Lottery revenue through retail agents in 2017 (Table 3.20). The South-West region had National Lottery sales of €101.1 million in 2017, making the second highest contribution to the national total.
Table 3.20: National Lottery Revenue at Retail Agents by Region 2017
Region National Lottery Revenue (€ Million)
Border 93.9
West 75.7
Midland 51.6
Mid-East 76.2
Dublin 190.0
South-East 96.9
South-West 101.1
Mid-West 62.7
Total 748.1
Source: Indecon analysis of National Lottery data
Note: Estimated based on percentage of retailers in each county as at October 2017.
413 Assessment of Micro-Economic and Social Impacts
Indecon International Economic ConsultantsIndependent Socio-Economic Impact Assessment of the National Lottery
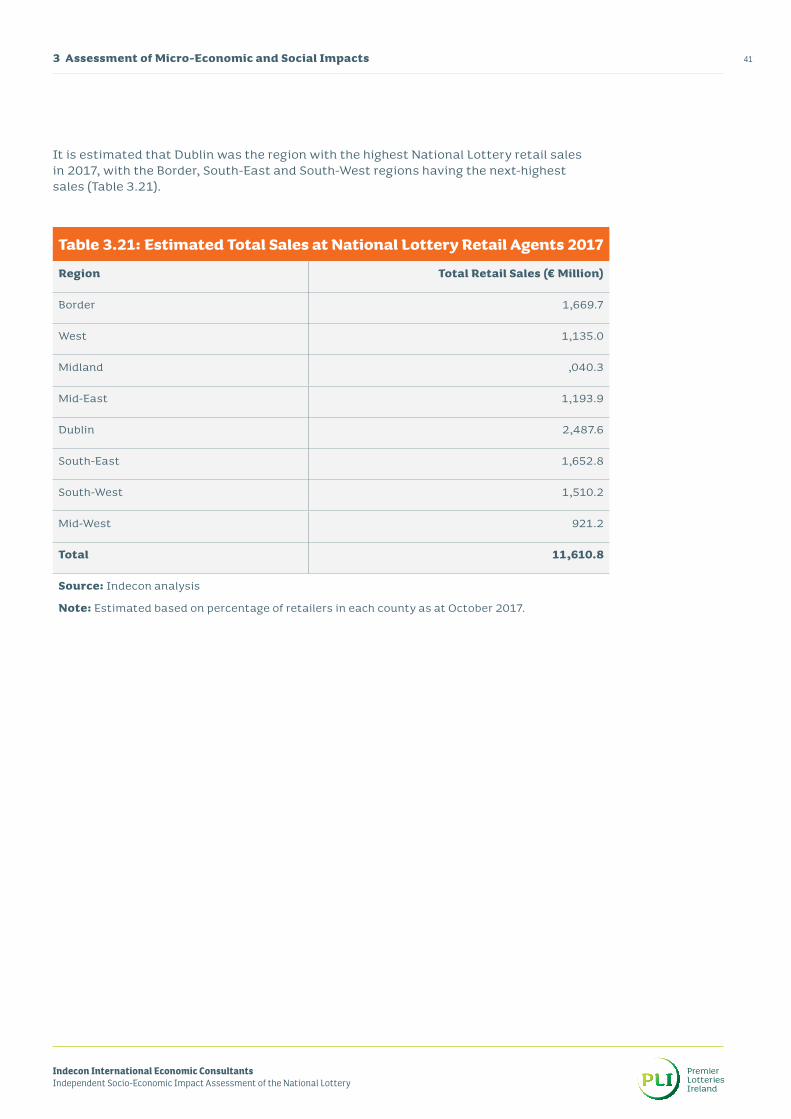
It is estimated that Dublin was the region with the highest National Lottery retail sales in 2017, with the Border, South-East and South-West regions having the next-highest sales (Table 3.21).
Table 3.21: Estimated Total Sales at National Lottery Retail Agents 2017
Region Total Retail Sales (€ Million)
Border 1,669.7
West 1,135.0
Midland ,040.3
Mid-East 1,193.9
Dublin 2,487.6
South-East 1,652.8
South-West 1,510.2
Mid-West 921.2
Total 11,610.8
Source: Indecon analysis
Note: Estimated based on percentage of retailers in each county as at October 2017.
3 Assessment of Micro-Economic and Social Impacts42
An estimated €131 million of non-National Lottery sales in Dublin in 2017 were due to retailers having National Lottery games. The South-East has the next highest figure, €96.7 million, followed by the Mid-East, €79.4 million, and the Border region, €75 million (Table 3.22).
Table 3.22: Perceived Estimate of Impact of Availability of National Lottery Games to Non-Lottery Sales
Region Non-Lottery Sales as a Result of Being a National Lottery Retail Agent (€ Million)
Border 75.0
West 48.1
Midland 55.8
Mid-East 79.4
Dublin 131.4
South-East 96.7
South-West 70.1
Mid-West 52.6
Total 609.0
Source: Indecon analysis
Note: Estimated based on percentage of retailers in each county as at October 2017.
433 Assessment of Micro-Economic and Social Impacts
Indecon International Economic ConsultantsIndependent Socio-Economic Impact Assessment of the National Lottery
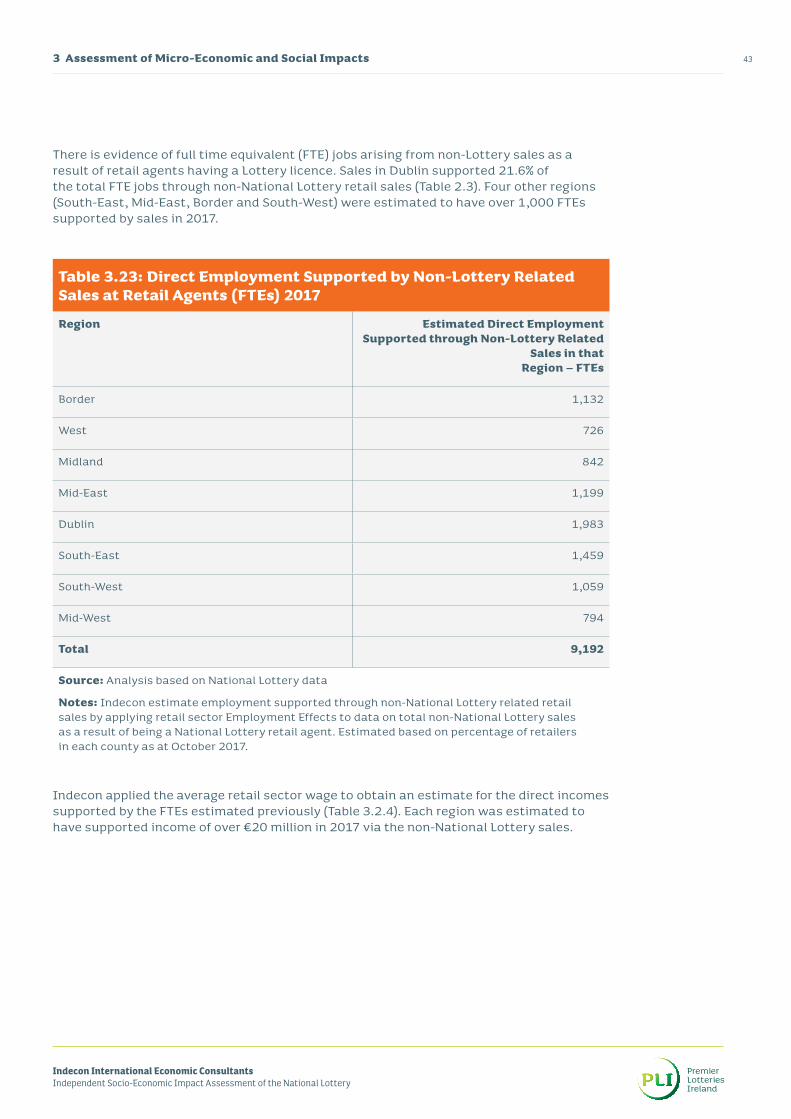
There is evidence of full time equivalent (FTE) jobs arising from non-Lottery sales as a result of retail agents having a Lottery licence. Sales in Dublin supported 21.6% of the total FTE jobs through non-National Lottery retail sales (Table 2.3). Four other regions (South-East, Mid-East, Border and South-West) were estimated to have over 1,000 FTEs supported by sales in 2017.
Table 3.23: Direct Employment Supported by Non-Lottery Related Sales at Retail Agents (FTEs) 2017
Region Estimated Direct Employment Supported through Non-Lottery Related
Sales in that Region – FTEs
Border 1,132
West 726
Midland 842
Mid-East 1,199
Dublin 1,983
South-East 1,459
South-West 1,059
Mid-West 794
Total 9,192
Source: Analysis based on National Lottery data
Notes: Indecon estimate employment supported through non-National Lottery related retail sales by applying retail sector Employment Effects to data on total non-National Lottery sales as a result of being a National Lottery retail agent. Estimated based on percentage of retailers in each county as at October 2017.
Indecon applied the average retail sector wage to obtain an estimate for the direct incomes supported by the FTEs estimated previously (Table 3.2.4). Each region was estimated to have supported income of over €20 million in 2017 via the non-National Lottery sales.
2 Development of National Lottery in Ireland44
Table 3.24: Direct Incomes Supported by Non-Lottery Related Sales at Retail Agents (FTEs) 2017
Region Estimated Direct Income Supported through Non-Lottery Related Sales in that Region (€m)
Border 33.2
West 21.3
Midland 24.7
Mid-East 35.1
Dublin 58.1
South-East 42.8
South-West 31.0
Mid-West 23.3
Total 269.5
Source: Analysis based on National Lottery data
Notes: Indecon estimate employment supported through non-lottery related retail sales by applying retail sector Employment Effects to data on total non-lottery sales as a result of being a National Lottery retail agent. We then apply CSO retail sector wage rates to estimate Incomes supported. Estimated based on percentage of retailers in each county as at October 2017.
3.6 Summary of Key Findings
• More than €5.1 billion was raised for Good Causes from National Lottery sales between 1987 and the end of 2017.
• This funding was used for housing, community development, tourism and sport, arts, heritage, the Gaeltacht, health and children, and youth affairs.
• Almost €8.8 billion has been returned to the community through National Lottery prize winnings since 1987, representing over half (53.5%) of the National Lottery revenue over that period. In 2017, a total of €452 million was paid out in prizes, which equated to 56.5% of sales.
• 2,763 Full-Time Equivalent (FTE) jobs and €104 million in employment incomes are estimated to have been supported through the contribution of National Lottery funding to Good Causes organisations. Lottery funding also supports significant volunteering activity across the country.
• The National Lottery supports its network of retail agents around the country in sales commissions, and supporting non-lottery sales, employment and incomes. It should however be noted that expenditure in the retail sector is likely to be subject to high opportunity and displacement costs (whereby labour and other economic resources are likely to be displaced from other, non-National Lottery retailers). National Lottery commission may however assist in supporting the viability of smaller retailer in regional areas.
4 Assessment of Macro-Economic Impacts
Indecon International Economic ConsultantsIndependent Socio-Economic Impact Assessment of the National Lottery
4 Assessment of Macro-Economic Impacts46
4 Assessment of Macro-Economic Impacts4.1 Introduction
The figure below presents an overview of the components of the macro-economic impact of the National Lottery (Figure 4.1). Location of impact is shown from the initial expenditure and the additional impacts that flow from this expenditure.
Figure 4.1: Components of Macro-Economic Impacts of the National Lottery
Description of Macro-Economic Impacts of National Lottery
Initial Expenditure/Impacts Location of Impact Initial Impact Additional Impacts
Consumption Related GDP Impacts
Gross Consumer Expenditure on
National Lottery Products Less Prize
Winnings Paid Back to Players
PLI DAC/National Lottery Company
Direct, Indirect and Induced Economic
Impacts
Employment, Wages and Salaries Supported
Re-Spending of National Lottery Prize
Winnings
National Lottery Players
Direct, Indirect and Induced Economic
Impacts
Employment, Wages and Salaries Supported
Additional Consumer Expenditure on Non-
National Lottery Products
Retail Agent NetworkDirect, Indirect and Induced Economic
Impacts
Employment, Wages and Salaries Supported
Retail Agent Impacts
Agent Commissions Received From the National Lottery
Retail Agent NetworkDirect, Indirect and Induced Economic
Impacts
Employment, Wages and Salaries Supported
Beneficiary Funding Impacts
Beneficiary Funding Received From National
Lottery Fund
National Lottery Beneficiaries
Direct, Indirect and Induced Economic
Impacts
Employment, Wages and Salaries Supported
Source: Indecon
474 Assessment of Macro-Economic Impacts
Indecon International Economic ConsultantsIndependent Socio-Economic Impact Assessment of the National Lottery
The key macro-economic impact arising from the National Lottery is focused on the contribution to personal consumption, which forms part of Irish economy GDP. The overall consumption contribution is derived using a mix of components (Figure 4.2).
Figure 4.2: Composition of National Lottery Net Consumption Impact on GDP
Direct/Gross Consumption Contribution of National Lottery to Irish Economy GDP
=
National Lottery Sales
Less
Prize Winnings
Net Consumption Contribution of National Lottery to Irish Economy GDP
=
Direct/Gross Consumption Contribution
+
Spending of Prize Winnings
+
Additional Non-Lottery Sales Supported within Lottery Retail Agents
Less
Displacement of Non-Lottery Expenditures
Source: Indecon
4 Assessment of Macro-Economic Impacts48
4.2 Expenditure/GDP Impacts
In this section the overall contribution of the National Lottery to Gross Domestic Product (GDP) is estimated. This has been achieved by combining a number of consumption and expenditure-related impacts, including:
• Expenditure on National Lottery products less prizes paid back to players;• Non-National Lottery related expenditure at National Lottery retail agents; • Consumer expenditure of prize winnings.The direct/gross consumer expenditure impact is calculated by subtracting prize winnings from expenditure on National Lottery products. In 2017 the direct/gross consumer expenditure impact was €348 million, an increase of 6% from the previous year (Table 4.1)
Table 4.1: Consumer Expenditure on National Lottery Products (€m) 2012-2017
Year Total Consumer Expenditure on National
Lottery Products (A) – (€m)
Total Prizes Winnings of National Lottery Players
(B) – (€m)
Direct/Gross Consumer Expenditure Impact
(A-B) – (€m)
2012 735 406 329
2013 685 383 303
2014 688 388 300
2015 670 381 289
2016 750 422 328
2017 800 452 348
Source: Analysis based on National Lottery data
Notes: Direct Consumer impact relates to sales of lottery products less prizes paid back to the consumer. (A) relates to total National Lottery Sales. (B) relates to National Lottery Prizes paid back to consumers.
494 Assessment of Macro-Economic Impacts
Indecon International Economic ConsultantsIndependent Socio-Economic Impact Assessment of the National Lottery
Using our sectoral input-output model of the Irish economy, the estimate for the multiplier impact in 2017 is €204 million, which brings the economy-wide estimated impact of consumer expenditure on National Lottery products to €552 million.
Table 4.2: Economy-Wide Impacts of Consumer Expenditure on Lottery Products (€m) 2012-2017
Notes: Direct Consumer impact relates to sales of lottery products less prizes paid back to the consumer. Indecon apply ‘retail sector’ multipliers as this is where the point of sale/expenditure is located. Multiplier Impacts include indirect and induced impacts.
The impact on the economy of expenditure from prize winnings was examined. Prize data was used to segment these winnings into size categories. Given the absence of available research on the proportion of prize winnings that are spent high, low and central scenarios were estimated in each category. The percentage of winnings spent in 2017 for each prize tier and scenario are estimated in the next table (Table 4.3).
4 Assessment of Macro-Economic Impacts50
Table 4.3: Estimated Consumer Spending Impact of Percentage of Winnings in 2017 for Each Prize Tier and Scenario
Size category of Prizes
Up to €1,000
€1,001- €10,000
€10,001- €50,000
€50,001- €100,000
€100,001- €500,000
€500,001- €999,999
€1 Million
and Over
Total
Winnings – € Million
Prize Winnings in 2017 – Products excl. Scratchcards/Instant
Note: * Breakdown of Scratch card/Instant Winnings in 2017 estimated by Indecon.
514 Assessment of Macro-Economic Impacts
Indecon International Economic ConsultantsIndependent Socio-Economic Impact Assessment of the National Lottery
The economic impact of spending of National Lottery prize winnings is examined below (Table 4.4). The low scenario estimate places the economic impact at €259.75 million, with the high scenario estimating economic impact to be €292.07 million. The central scenario of €286.75 million is the overall estimate.
Table 4.4: Scenario of Estimated Economic Impact of Spending of National Lottery Prize Winnings (€m) 2017
Year Scenario 1 – Low (€m)
Scenario 2 – Central (€m)
Scenario 2 – High (€m)
2017 €259.75 €286.75 €292.07
Source: Indecon analysis
Estimates for the economy-wide impact of the National Lottery on non-lottery related retail sales (as previously described in Section 3.5) at retail agents for 2017 are €966 million (Table 4.5).
Table 4.5: Estimated Direct, Indirect and Induced Economic Impact of Expenditure on Non-Lottery Related Sales at Retail Agents (€m) 2017
Year Estimated Non-Lottery Sales Supported By
National Lottery – (€m)
Multiplier Impacts – (€m)
Economy-wide Supplier Impacts (Direct +
Multiplier Impacts) – (€m)
2017 609.0 357.0 966.0
Source: Indecon analysis of Survey of National Lottery Retail Agents, National Lottery Data and CSO Data
Note: While sales are non-lottery, they occur at the specific retail outlets because of the availability of lottery at the retailer.
4 Assessment of Macro-Economic Impacts52
The combined direct/gross consumer expenditure on lottery products, the consumer expenditure impact of the spend of National Lottery prizes and the estimated Impact of lottery agency on non-lottery sales was estimated (Table 4.6).
Each of the three scenarios for the overall economic impact of consumer spending on National Lottery and non-National Lottery products in 2017 are outlined below:
• Low Estimate – €1,930.3 million• Central Estimate – €1,973.1 million• High Estimate – €1,981.6 million
These estimates include direct, indirect and induced impacts from consumer expenditure on National Lottery and non-National Lottery products at National Lottery retail agents.
Table 4.6: Overall Direct, Indirect and Induced Impact of Consumer Spending on Lottery and Non-Lottery Products (€m) 2017
Category of Expenditure Direct Consumption
Impact (€m)
Multiplier Consumption
Impact (€m)
Economy-wide Consumption
Impact (Direct + Multiplier Impact)
– (€m)
(A) Consumer Spending on Lottery Products – Direct/Gross Impact
(C) Lottery Retailer Agents – Estimated Impact of Lottery Agency on Non-Lottery Sales
609.0 357.0 966.0
Estimated Overall Consumer Expenditure Impact of National Lottery (A + B + C)
Low Estimate 1,216.9 713.4 1,930.3
Central Estimate 1,243.9 729.2 1,973.1
High Estimate 1,249.2 732.3 1,981.6
Source: Indecon analysis
Notes: Multiplier impacts include indirect and induced impacts.
534 Assessment of Macro-Economic Impacts
Indecon International Economic ConsultantsIndependent Socio-Economic Impact Assessment of the National Lottery
4.3 Expenditure Impacts on Suppliers
The economy-wide impact of the National Lottery on non-lottery sales at retail agents for 2017 is estimated to be €966 million (Table 4.7). However, it is important to note that there is likely to be a significant degree of displacement (whereby labour and other economic resources may be displaced from other, non-Lottery retailers).
Table 4.7: Estimated Direct, Indirect and Induced Economic Impact of Expenditure on Non-Lottery Related Sales at Retail Agents (€m) 2017
Year Estimated Non-Lottery Sales Supported by National
Source: Indecon analysis of Survey of National Lottery Retail Agents, National Lottery Data and CSO Data
Notes: While sales are non-lottery, they occur at the specific retail outlets because of the availability of lottery at the retailer.
As discussed in Section 3.3, the National Lottery returns a proportion of its revenue to the community via Good Causes. In 2017, the amount given directly was €226.3 million. Applying a sectoral model of the Irish economy, it is calculated that the indirect and induced effects of this expenditure are €144.7 million, giving a total economy-wide impact of €371 million (Table 4.8).
Table 4.8: Sub-Supplier Expenditure Impacts of National Lottery Funding for Good Causes (€m) 2017
Direct Expenditure (€m)
Multiplier Impacts (€m)
Economy-wide Supplier Impacts
(Direct + Multiplier Impact) (€m)
Total National Lottery Funding/ Expenditure
226.3 144.7 371.0
Source: Indecon analysis based on National Lottery and CSO data
4 Assessment of Macro-Economic Impacts54
4.4 Employment and Incomes Supported by National Lottery
The overall level of employment and associated employment incomes supported in the Irish economy through the presence of the National Lottery is comprised of the following components:
• Employment and incomes supported by Premier Lotteries Ireland;• Employment and incomes supported directly through National Lottery funding
for Good Causes;• Employment and incomes supported through the spending of prize winnings;• Employment and incomes supported within the National Lottery retail agent network; • The indirect and induced (multiplier) impacts of each of the above forms
of employment.
Each of the above aspects is examined below.
Employment and employment incomes supported by Premier Lotteries Ireland
The number of employees at Premier Lotteries Ireland, and the multiplier effects in terms of employees at the company (Table 4.9) was looked at. It is estimated that the multiplier impacts add an additional 23 FTEs to the impact of PLI.
Table 4.9: Direct, Indirect and Induced Employment Supported by Premier Lotteries Ireland (FTEs) 2017
Year Direct Employment (FTEs)
Estimated Multiplier Impacts – FTEs
Economy-wide Employment Impact
(Direct + Multiplier Impact) – FTEs
2017 96 23 119
Source: Analysis based on Premier Lotteries Ireland data
Premier Lotteries Ireland spent €6.9 million on wages in 2017. This had an estimated multiplier impact of €2.9 million, giving an estimated economy-wide income impact of €9.8 million (Table 4.10).
554 Assessment of Macro-Economic Impacts
Indecon International Economic ConsultantsIndependent Socio-Economic Impact Assessment of the National Lottery
Table 4.10: Direct, Indirect and Induced Impact of Premier Lotteries Ireland Expenditure on Incomes (€m) 2017
Year Estimated Direct Incomes – (€m)
Estimated Multiplier Impacts – (€m)
Economy-wide Income Impact (Direct + Multiplier
Impact) – (€m)
2017 6.9 2.9 9.8
Source: Analysis based on Premier Lotteries Ireland data
Employment and incomes supported within the National Lottery retail agent network
There are two aspects of employment and associated incomes supported within the National Lottery retail agent network:
• Employment and incomes related to the commissions received by agents from PLI;• Employment and associated incomes supported through the impact of the National
Lottery on non-Lottery sales within retailers.
The level of direct employment estimated to be supported by retail agent commissions in 2017 was 709 FTEs. Using our model of the Irish economy, it is estimated that the indirect and induced employment supported by these commissions is 173 FTEs, leading to an economy-wide level of 882 FTEs (Table 4.11).
Table 4.11: Direct, Indirect and Induced Employment Supported by National Lottery Retail Agents’ Commissions (FTEs) 2017
Year Estimated Direct Employment Supported
through Lottery Agent Commissions – FTEs
Estimated Multiplier Impact – FTEs
Economy-wide Employment Impact
(Direct + Multiplier Impact) – FTEs
2017 709 173 882
Source: Indecon analysis based on National Lottery and CSO data
Notes: Indecon applies retail sector multipliers and effects in our analysis of economy wide impacts of retail agents. The impacts measured in this data consist of employment supported through retail agent commissions received from the National Lottery. Multiplier impacts include indirect and induced impacts.
4 Assessment of Macro-Economic Impacts56
It is estimated that direct full-time equivalent employment supported by non-National Lottery related sales at retail agents is 9,192. For indirect and induced employment there are an additional 2,240 FTEs (Table 4.12). Thus the total economy-wide employment supported by non-National Lottery related sales at retail agents is estimated at 11,433 in 2017.
Table 4.12: Direct, Indirect and Induced Employment Supported by Non-Lottery Related Sales at Retail Agents (FTEs) 2017
Source: Indecon analysis based on National Lottery and CSO data
Notes: Indecon estimated employment supported through non-National Lottery related retail sales by applying retail sector Employment Effects to data on total non-National Lottery sales as a result of being a National Lottery retail agent. Indecon then applied retail sector multipliers and effects in our analysis of economy wide impacts of retail agents. Multiplier impacts include indirect and induced impacts.
Incomes earned through the employment supported by retail agent commissions from the National Lottery are outlined in Table 4.13. The direct incomes supported were estimated to be €20.8m in 2017, with indirect and induced impacts estimated to add a further €8.8m to reach an economy-wide impact of €29.6m in 2017.
Table 4.13: Direct, Indirect and Induced Employment Incomes Supported by National Lottery Sales at Retail Agents (€m) 2017
Year Estimated Direct Incomes Supported
through Lottery Agent Commissions – €m
Estimated Multiplier Impact – €m
Economy-wide Employment Impact
(Direct + Multiplier Impact) – €m
2017 20.8 8.8 29.6
Source: Indecon analysis based on National Lottery and CSO data
Notes: Indecon applies retail sector multipliers and effects in our analysis of economy wide impacts of retail agents. The impacts measured in this data consist of Incomes supported through retail agent commissions received from the National Lottery. Multiplier impacts include indirect and induced impacts. We then apply CSO retail sector wage rates to estimate Incomes supported. Multiplier impacts include indirect and induced impacts.
574 Assessment of Macro-Economic Impacts
Indecon International Economic ConsultantsIndependent Socio-Economic Impact Assessment of the National Lottery
Estimates for the direct, indirect and induced impacts of non-National Lottery related sales at National Lottery retail agents are contained in Table 4.14. The economy-wide income impact of non-National Lottery sales at retail agents is estimated to have been €384 million in 2017.
Table 4.14: Direct, Indirect and Induced Employment Incomes Supported by Non-Lottery Related Sales at Retail Agents (€m) 2017
Year Estimated Direct Income Supported
through Non-Lottery Related Sales – €m
Estimated Multiplier Impact – €m
Economy-wide Income Impact (Direct +
Multiplier Impact) – €m
2017 269.5 114.6 384.0
Source: Indecon analysis based on Survey of National Lottery Retailers and CSO Data
Notes: Indecon estimate employment supported through non-lottery related retail sales by applying retail sector Employment Effects to data on total non-lottery sales as a result of being a National Lottery retail agent. Indecon then applies retail sector multipliers and effects in our analysis of economy wide impacts of retail agents. We then apply CSO retail sector wage rates to estimate Incomes supported. Multiplier impacts include indirect and induced impacts.
Employment and incomes supported by Lottery funding for Good Causes
Good Causes funding has had an impact on employment in beneficiary organisations. Applying sectoral employment effects, and calculating the number of FTEs supported per €1m of expenditure, the estimated economy-wide impact of this funding for Good Causes was 3,910 FTEs in 2017 (Table 4.15).
Table 4.15: Direct, Indirect and Induced Employment Supported by National Lottery Good Causes Funding (FTEs) 2017
Estimated Direct Employment
Supported through Lottery
Beneficiaries – FTEs
Estimated Multiplier Impacts
– FTEs
Economy-wide Employment
Impact (Direct + Multiplier Impact)
– FTEs
Employment Supported 2,763 1,147 3,910
Source: Indecon Analysis of Revised Estimates for Public Service Expenditure 2018 and CSO Data
Notes: Multiplier impacts include indirect and induced impacts.
4 Assessment of Macro-Economic Impacts58
The estimated direct income supported by jobs related to Good Causes funding in 2017 was €104 million. Economy-wide incomes supported due to Good Causes funding in 2017 is estimated at €147.2 million (Table 4.16).
Table 4.16: Direct, Indirect and Induced Employment Incomes Supported by National Lottery Good Causes Funding (€m) 2017
Estimated Direct Income Supported
through Lottery Beneficiaries – €m
Estimated Multiplier Impact – €m
Economy-wide Income Impact
(Direct + Multiplier Impact) – €m
Employment Incomes
104.0 43.2 147.2
Source: Indecon Analysis of Revised Estimates for Public Service Expenditure 2018 and CSO Data
Notes: Multiplier impacts include indirect and induced impacts.
Employment and incomes supported through spending National Lottery prize winnings
Employment across a variety of economic sectors is also supported via the spending of prize winnings. Three scenarios were used to estimate employment supported by this expenditure, based on the proportion of prize winnings that are spent by the winner (Table 4.17).
Table 4.17: Direct, Indirect and Induced Employment Supported by Spending of Prize Winnings (FTEs) 2017
Scenario Estimated Direct Employment Supported
through Spending of Prize Winnings – FTEs
Estimated Multiplier Impacts –
FTEs
Economy-wide Employment Impact
(Direct + Multiplier Impact) – FTEs
Scenario 1 – Low Estimate 3,921 956 4,877
Scenario 2 – Central Estimate 4,329 1,055 5,383
Scenario 3 – High Estimate 4,409 1,074 5,483
Source: Indecon analysis based on National Lottery and CSO data
Notes: Multiplier impacts include indirect and induced impacts.
594 Assessment of Macro-Economic Impacts
Indecon International Economic ConsultantsIndependent Socio-Economic Impact Assessment of the National Lottery
The lower end estimate suggest economy-wide income supported by spending of prize winnings is €210.4 million, with the higher end being €236.5 million. The central estimate for 2017 is €232.2 million in income supported by the spending of National Lottery prize winnings (Table 4.18).
Table 4.18: Direct, Indirect and Induced Employment Incomes Supported by Spending of Prize Winnings (€m) 2017
Scenario Estimated Direct Income Supported
through Spending of Prize Winnings – (€m)
Estimated Multiplier
Impacts – (€m)
Economy-wide Income Impact
(Direct + Multiplier Impact) – (€m)
Scenario 1 – Low Estimate 147.6 62.8 210.4
Scenario 2 – Central Estimate 163.0 69.3 232.2
Scenario 3 – High Estimate 166.0 70.6 236.5
Source: Indecon analysis based on National Lottery and CSO data
Notes: Multiplier impacts include indirect and induced impacts.
4 Assessment of Macro-Economic Impacts60
Breakdown of overall employment supported by National Lottery
It is estimated that the National Lottery directly supported a total of 17,090 full-time equivalent jobs in 2017. This includes individuals employed within PLI, jobs supported within Good Causes beneficiary organisations, employment supported through the spending of prize winnings, and jobs supported within the National Lottery retail agent network. When indirect and induced multiplier impacts are included, this employment impact rises to 21,728 jobs across the Irish economy.
Table 4.19: Breakdown of Overall Employment Supported by the National Lottery (FTEs) 2017
Direct Employment Supported –
FTEs
Multiplier Impacts – Additional Indirect
and Induced Employment
Supported across Irish Economy –
FTEs
Total Employment Supported Across
Irish Economy (incl. Multiplier
Impacts) – FTEs
Employment in PLI/National Lottery 96 23 119
Employment supported by non-Lottery sales in retail agent network
9,192 2,240 11,433
Employment supported by retail agent commissions
709 173 882
Employment supported by National Lottery funding to beneficiary organisations
2,763 1,147 3,910
Employment supported by spending of National Lottery prize winnings
4,329 1,055 5,383
Total Employment Impact 17,090 4,638 21,728
Source: Indecon analysis
Notes: Direct employment supported includes employment within the National Lottery, estimated employment supported within the retail agent network, estimated employment created by the spending of prize winnings in the economy and estimated employment supported within organisations in receipt of funding for Good Causes. Multiplier impacts include indirect and induced impacts.
614 Assessment of Macro-Economic Impacts
Indecon International Economic ConsultantsIndependent Socio-Economic Impact Assessment of the National Lottery
The estimated overall employment incomes supported by the National Lottery are summarised in Table 4.20 below. Direct incomes supported are estimated at €564.2 million, increasing to €802.9 million when multiplier impacts are taken into consideration.
Table 4.20: Estimated Direct, Indirect and Induced Income Impacts Supported by National Lottery (€m) 2017
Direct Income Supported –
FTEs
Multiplier Impacts – Additional Indirect
and Induced Income Supported
across Irish Economy – FTEs
Total Income Supported Across
Irish Economy (incl. Multiplier
Impacts) – FTEs
Income supported by PLI/National Lottery
6.9 2.9 9.8
Income supported by non-Lottery sales in retail agent network
269.5 114.6 384.0
Income supported by retail agent commissions
20.8 8.8 29.6
Income supported by National Lottery funding to beneficiary organisations
104.0 43.2 147.2
Income supported by spending of National Lottery prize winnings
163.0 69.3 232.2
Total Income Impact 564.2 238.8 802.9
Source: Indecon analysis
Notes: Figures consist of incomes supported by the National Lottery, two categories of income across the retail agent network, estimated incomes created by the spending of prize winnings in the economy and incomes supported by beneficiaries. Multiplier impacts include indirect and induced impacts.
4 Assessment of Macro-Economic Impacts62
4.5 Exchequer Taxation Impacts
As outlined in previous sections, the National Lottery supports employment and incomes throughout the Irish economy. In this section, the proportion of these incomes that is returned to the Exchequer in the form of taxation is estimated. In order to compute these estimates, the 2017 tax calculators for the Irish economy is used, assuming that employees are single rate tax payers.
The National Lottery also supports the Exchequer in terms of its tax contribution. It is estimated that the exchequer received €2.35 million in tax from National Lottery employees in 2017.
Table 4.21: Estimated Taxation Paid to the Exchequer by National Lottery Employees 2017 (€)
Year Wages and Salaries (€)
Direct Employment
(FTEs)
Average Gross Salary (€)
Estimated Income Taxation per FTE
(€)*
Total Tax Paid (€)
2017 6,900,000 96 71,875 24,457 2,347,905
Source: Indecon modeling
Notes: * Estimated on basis of assuming individuals employed are single rate tax payers.
The taxation from employment directly supported by Good Causes beneficiaries is estimated in Table 4.22. Just over €21 million is estimated to have been paid to the Exchequer in 2017.
Table 4.22: Estimated Taxation Paid to the Exchequer Due to National Lottery Good Causes Funding 2017 (€)
Year Wages and Salaries (€)
Direct Employment
(FTEs)
Average Gross Salary (€)
Estimated Income Taxation per FTE
(€)*
Total Tax Paid (€)
2017 104,033,739 2,763 37,646 7,677 21,215,189
Source: Indecon modeling
Notes: * Estimated on basis of assuming individuals employed are single rate tax payers.
634 Assessment of Macro-Economic Impacts
Indecon International Economic ConsultantsIndependent Socio-Economic Impact Assessment of the National Lottery
It is estimated that 709 FTEs were directly supported by retail agents’ commission from the National Lottery. They paid over €3 million in tax to the Exchequer in 2017 (Table 4.23).
Table 4.23: Estimated Taxation Paid to the Exchequer by Retail Agent Employees 2017 (€)
Year Wages and Salaries (€)
Direct Employment
(FTEs)
Average Gross Salary (€)
Estimated Income
Taxation per FTE (€)*
Total Tax Paid (€)
2017 20,798,556 709 29,316 4,492 3,186,969
Source: Indecon modeling
Notes: * Estimated on basis of assuming individuals employed are single rate tax payers.
Jobs supported by non-National Lottery related sales from retail agents contributed just over an estimated €41 million in tax to the exchequer (Table 4.24). The average employee is estimated to have paid almost €4,500 in tax in 2017.
Table 4.24: Estimated Taxation Paid to the Exchequer by Retail Agent Employees Supported by Non-National Lottery Sales in 2017 (€)
Year Wages and Salaries (€)
Direct Employment
(FTEs)
Average Gross Salary (€)
Estimated Income
Taxation per FTE (€)*
Total Tax Paid (€)
2017 269,482,484 9,192 29,316 4,492 41,292,887
Source: Indecon modeling
Notes: * Estimated on basis of assuming individuals employed are single rate tax payers.
4 Assessment of Macro-Economic Impacts64
Using the central estimate from the previous analysis on the level of prize winnings that were spent by prize winners, it is estimated the tax revenue generated by this expenditure was over €33 million (Table 4.25).
Table 4.25: Estimated Taxation Paid to the Exchequer by Employees Supported by the Respending of National Lottery Prize Winnings (€)
Year Wages and Salaries (€)
Direct Employment
(FTEs)
Average Gross
Salary (€)
Estimated Income
Taxation per FTE (€)*
Total Tax Paid (€)
2017 162,952,023 4,329 37,646 7,677 33,230,162
Source: Indecon modeling
Notes: * Estimated on basis of assuming individuals employed are single rate tax payers.
By combining the results from each of the above analyses on tax paid to the exchequer in Table 4.26 it is estimated that the total exchequer impact in 2017 was €101.3 million.
Table 4.26: Estimated Exchequer Impacts Supported by National Lottery (€m) 2017
Year Exchequer Impacts (€m)
2017 101.3
Source: Indecon modeling
4.7 Summary of Key Findings
• The estimated overall GDP impact of National Lottery spending in 2017 is estimated to be €1,973 million.
• The estimated gross annual exchequer impact of National Lottery spending in 2017 is €101.3 million. This excludes any returns to the Exchequer from its role as a shareholder in the National Lottery.
5 Wider Market Developments
Indecon International Economic ConsultantsIndependent Socio-Economic Impact Assessment of the National Lottery
5 Wider Market Developments66
5 Wider Market Developments5.1 Introduction
In this section the market environment in which the National Lottery operates is examined.
5.2 The Gambling Sector in Ireland
Using data from the Revenue Commissioners for betting duty receipts from 2011 to 2015 (Table 5.1) the size of the gambling sector is estimated, including all taxable betting activity, plus National Lottery sales.
Of particular note is the sharp increase in remote/online betting duty receipts after 2015. This reflects the Betting (Amendment) Act 2015, which brought betting intermediaries and remote bookmakers under the same 1% turnover betting duty umbrella. It meant that online and mobile bookmakers would pay the same duty as land-based bookmakers.
Table 5.1: Revenue Commissioner Data on Betting Receipts (€ Million) 2011-2016
2011 2012 2013 2014 2015 2016
Traditional Betting Duty 27.1 27.1 25.4 26.2 27.7 28.1
Remote Betting 0.1 0.1 0.1 0.1 3.0 20.7
Betting Commissions 0.4 0.4 0.4 0.4 0.3 1.9
Bookmakers Licences 0.1 0.1
Bookmaking Premises 0.1 0.6
Remote Betting Intermediaries 0.1 0.0
Remote Bookmakers 0.3 0.2
Total 27.6 27.6 25.9 26.7 31.6 51.7
Source: Revenue data
The rate of betting duty (1%) for bets ‘entered into by a bookmaker or remote bookmaker with persons in the State’, and the Betting Intermediary Duty (15%) for the ‘commission charged by a remote betting intermediary to persons in the State for using the facilities of that intermediary to make bets’, were applied to the receipts presented in the previous table to arrive at an estimate for the overall level of consumer spending on betting, including traditional and remote/online betting. This amounts to approximately €4.9 billion in 2016. Adding the sales of the National Lottery gives an overall estimate of expenditure on betting and on the Lottery of approximately €5.6 billion in 2016. Of this estimate, National Lottery sales represented approximately 13% (Table 5.2).
675 Wider Market Developments
Indecon International Economic ConsultantsIndependent Socio-Economic Impact Assessment of the National Lottery
Table 5.2: Indicative Estimate of Size of Gambling Sector in Ireland 2016
€ Million
Traditional Betting Duty 2,812.6
Remote Betting (Online) 2,074.9
Estimated Total Expenditure on Betting* 4,887.6
National Lottery Revenue 750.2
Total (Including National Lottery) 5,637.8
Source: Indecon analysis of National Lottery and Revenue Commissioners data
* Excludes betting commissions and licenses & premises.
It is important to note that not all betting activities are close substitutes for lottery betting. In particular, consumers may participate in the National Lottery knowing that funds will be distributed to Good Causes. However, the estimated size of the remote/online betting market in Ireland highlights the changing composition of the wider gambling sector driven strongly by the internet and increased accessibility to gambling online.
5.3 Lottery and Other Forms of Betting
When examining developments in the lottery market, it is instructive to first consider developments in the overall online betting industry, of which online lottery betting forms a subset.
The Gambling Commission in the UK published their annual report on gambling participation for 2016 in February 2017. They found that 48% of respondents to their survey had participated in gambling in the four weeks leading up to their survey, which was up slightly from their previous findings (45% in the year up to December 2015).
When asked about online gambling, 17% responded that they had gambled online in the past four weeks. This was also an increase on the previous findings. Males were more likely to have participated in online gambling than females, with over 20% having gambled in the four weeks leading up to the 2016 survey, compared with fewer than 15%. Those between the ages of 35 and 44 were the mostly likely to have participated in online gambling, with those in the 25-34 age range being the second most likely (Figure 5.1).
5 Wider Market Developments68
Figure 5.1: Frequency of Gambling (UK) 2013-2016
0 10 20 30 40 50
2+ days a week
Once a week
Once a month, less than once a week
Less than once a month
Year to Dec 2013 Year to Dec 2014 Year to Dec 2015 Year to Dec 2016
Source: Gambling Commission UK
Based on available data in the UK, playing the UK National Lottery in person has become less popular over time. Whilst still one of the most popular forms of gambling activity, there was a decline of five percentage points between 2013 and 2016. In person participation in other UK lotteries fell dramatically between 2013 and 2016 (Figure 5.2).
695 Wider Market Developments
Indecon International Economic ConsultantsIndependent Socio-Economic Impact Assessment of the National Lottery
Figure 5.2: Type of Gambling Activity (UK – In Person) 2016
National Lottery draws
Other lotteries
Bingo
Football pools
Horse races
Dog races
Sport betting
Betting on other events
Virtual dog or horse races
Spread betting
Casino games
Year to Dec 2013 Year to Dec 2014 Year to Dec 2015 Year to Dec 2016
0 10 20 30 40 50 60 70 80 90 100
Source: Gambling Commission UK
While in person participation in the UK National Lottery has declined, there has been a slight increase in online UK National Lottery participation. Almost 30% of respondents played online. There was strong growth in participation in other lotteries online, with 38% participation in other lotteries in 2016, compared to 16% in 2013 (Figure 5.3).
5 Wider Market Developments70
Figure 5.3: Type of Gambling Activity (UK – Online) 2016
0 10 20 30 40 50 60 70 80 90 100
National Lottery draws
Other lotteries
Bingo
Football pools
Horse races
Dog races
Sport betting
Betting on other events
Virtual dog or horse races
Spread betting
Casino games
Year to Dec 2013 Year to Dec 2014 Year to Dec 2015 Year to Dec 2016
Source: Gambling Commission UK
Ireland has one of the highest rates of awareness of bet-on-lottery websites across Europe (Table 5.3), ranking below Spain, Portugal and Switzerland (French speaking).
715 Wider Market Developments
Indecon International Economic ConsultantsIndependent Socio-Economic Impact Assessment of the National Lottery
Table 5.3: Awareness of Bet-On-Lottery Websites
Country Percentage of Respondents
Spain 66%
Portugal 59%
French Switzerland 53%
Ireland 50%
Belgium 47%
France 42%
German Switzerland 40%
Austria 39%
UK 32%
Luxembourg 25%
Source: Harris Interactive France
Those surveyed were asked if they knew any specific bet-on-lottery websites, with 31% of Irish respondents stating that they knew at least one. 27% of respondents said that they knew one company (Competitor 1), which had the highest recognition across the various bet-on-lottery websites. When looking purely at those who are EuroMillions players, the percentage of people aware of bet-on-lottery websites increased across the board, with 38% knowing at least one website and 34% knowing Competitor 1 (Table 5.4).
Table 5.4: Awareness of Bet-On-Lottery Websites in Ireland
Country Percentage of All Respondents
Percentage of Respondents who are
EuroMillions Players
At least one website known 31% 38%
Competitor 1 27% 34%
Competitor 2 5% 6%
Competitor 3 9% 10%
Competitor 4 5% 5%
Source: Harris Interactive France
5 Wider Market Developments72
In a different survey conducted on behalf of the National Lottery, awareness of Competitor 1 has been steadily increasing since August 2016 and reached 32% of respondents in May of 2017, which is in keeping with the above findings (Figure 5.4).
Figure 5.4: Awareness of National Lottery Competitor 1 (Aug 2016-May 2017)
19%
21%
24%
25%
27%
31%
31%
27%
30%
32%
0 5 10 15 20 25 30 35 40
August
September
October
November
December
January
February
March
April
May
Source: Indecon analysis of data provided by Kantar Millward Brown
735 Wider Market Developments
Indecon International Economic ConsultantsIndependent Socio-Economic Impact Assessment of the National Lottery
When asked about the usage rate of bet-on-lottery websites, 6% of respondents said that they had played games on at least one website (Table 5.5). This increased to 7% when looking at those who are EuroMillions players. 5% of the total survey sample said that they had played at least one game on Competitor 1’s website.
Table 5.5: Users of Bet-On-Lottery Websites in Ireland
Country Percentage of All Respondents
Percentage of Respondents who are EuroMillions Players
At least one website played 6% 7%
Competitor 1 5% 5%
Competitor 2 1% 1%
Competitor 3 1% 1%
Competitor 4 1% 1%
Source: Harris Interactive France
5 Wider Market Developments74
In the second survey focusing on Competitor 1, those who said they were aware of Competitor 1 were asked if they had played a game on their website. The percentage of people responding ‘yes’ to this question declined from December 2016 to May 2017, reaching 16%. This was despite an increase in the percentage of people who said they were aware of Competitor 1 (Figure 5.5).
Figure 5.5: Percentage of Those Aware of Competitor who have Played a Game on Competitor’s Website (Nov 2016-May 2017)
28%
30%
23%
25%
22%
19%
16%
0 10 20 30 40
November
December
January
February
March
April
May
Source: Indecon analysis of data provided by Kantar Millward Brown
755 Wider Market Developments
Indecon International Economic ConsultantsIndependent Socio-Economic Impact Assessment of the National Lottery
There are a number of differentiators within the market for lotteries and bet-on-lottery operators including:
• Availability of international lotteries;• Legislatively mandated funds for Good Causes;• Account offer/Loyalty schemes; and,• Game-specific differentiators.
These are considered below.
The National Lottery offers draw based games, scratch cards and IWGs. Whilst the National Lottery offers a European lottery game, EuroMillions, some of the National Lottery’s competitors offer participation in multiple lotteries around the world, including the US Powerball, the French lottery and the US MegaMillions. These bet-on-lottery operators have introduced an offering that until recently was not available to players of the National Lottery in Ireland.
Whilst there is no national lottery in Australia, there are similar state lotteries in operation. There is evidence of the demand for international lotteries when an online bet-on-lottery service was launched in Australia, to coincide with a rollover on the US Powerball of $1.6 billion. A quarter of a million sign-ups were reported in the days leading up to the draw. This is in line with the findings of consumers’ willingness-to-pay for National Lottery tickets. A positive relationship between the jackpot amount and the demand for tickets is observable. Thus, it seems there is demand in Ireland for large jackpots such as those offered in the US.
One of the key differences in relation to the National Lottery and other competitors is that the National Lottery is mandated to provide funding to Good Causes, and to return at least 50% of its revenue as prizes to winners of its games. There is no such requirement for other operators in the market. This means approximately 85% of revenue generated by the National Lottery will be returned to the community in the form of prize winnings and Good Causes funding; the sum returned to the community rises to 91% when commission to retailers is included.
There are also differentiators within certain games, for example, in some bookmakers, customers can bet on certain numbers coming up in a National Lottery draw. Thus, rather than choosing six numbers for a Lotto ticket, the customer is enabled to bet on a single number being drawn. Customers are offered odds on their chosen number appearing, or customers could also place a bet on multiple numbers being drawn out as part of the National Lottery draw. This marks a key differentiator, as the customer has the ability to choose their own stake and the combination of numbers they would like to select.
Other companies offer the ability to protect a jackpot, which means that if the customer chooses this option (paying a premium to do so) where they win the jackpot; the customer will be paid over the entire jackpot amount. In the case of the National Lottery, where two or more people win the jackpot prize; customers would share the jackpot. However, if two customers paid for this jackpot protection with the same company they bet on the National Lottery with; then they would each win the jackpot amount.
5 Wider Market Developments76
5.4 Comparative International Analysis
The level of EuroMillions sales per capita for each of the nine countries involved in EuroMillions was examined(Table 5.6). Whilst per capita sales fell slightly in Portugal between 2015 and 2016, it remained the country with the highest sales per capita of any of the nine countries. Ireland experienced the highest growth in sales per capita, with sales per capita reaching €28.3 in 2016 for EuroMillions draws.
Table 5.6: EuroMillions Sales Per Capita € (2015-2016)
2015 2016 Change % Change
Portugal 79.4 75.5 -3.9 -4.9%
Luxembourg 67.6 64.1 -3.5 -5.2%
Switzerland 42.8 43.2 0.4 0.9%
Austria 35.1 36.6 1.5 4.3%
Belgium 36.7 36.3 -0.4 -1.1%
Ireland 25.1 28.3 3.2 12.7%
Spain 25.2 25.5 0.3 1.2%
UK 23.3 21.0 -2.3 -9.9%
France 17.6 17.0 -0.6 -3.4%
Source: Company Service aux Lotteries en Europe
In a wider survey, (Table 5.7) of four countries Ireland, the US, Canada and the UK Ireland was found to have the lowest number of residents per retailer, with 888 residents per draw in 2016. This compared to 1,154 for the United States, 1,227 for Canada and 1,406 for the UK.
775 Wider Market Developments
Indecon International Economic ConsultantsIndependent Socio-Economic Impact Assessment of the National Lottery
Table 5.7: Number of Residents Per Retailer
2015 2016
No. Retailers Pop (million)
Per Capita No. Retailers Pop (million)
Per Capita
Ireland 4,002 4.6 1,149 5,290 4.7 888
US 237,911 305.5 1,284 264,833 305.5 1,154
Canada 26,491 33.5 1,265 29,585 36.3 1,227
UK 45,000 63.7 1,416 45,296 63.7 1,406
Source: La Fleur’s World Lottery Almanac and Camelot UK
Of 100 countries Ireland’s overall lottery sales per capita grew from €146 in 2015 to €160 in 2016, moving from 56th to 50th place in the rankings (Table 5.8).
Table 5.8: Per Capita Total Sales
2015 2016
Per Capita Sales (€)
Rank Per Capita Sales (€)
Rank
Massachusetts 683 1 732 1
New York 345 7 377 8
France 211 26 220 27
Portugal 211 25 211 29
Ireland 146 56 160 50
UK 155 52 141 62
Belgium 105 74 105 71
Source: La Fleur’s World Lottery Almanac
When focusing on lottery sales, Ireland’s per capita sales grew from €99 to €107 between 2015 and 2016. Notably, lottery sales per capita in Ireland have been higher than in countries such as Portugal, the UK, Belgium and France (Table 5.9).
5 Wider Market Developments78
Table 5.9: Per Capita Lottery Sales
2015 2016
Per Capita Sales (€)
Rank Per Capita Sales (€)
Rank
Lotterywest* 190 1 175 1
Ireland 99 21 107 19
Portugal 92 24 92 21
UK 95 20 83 27
Belgium 81 31 80 28
France 48 51 47 56
Source: La Fleur’s World Lottery Almanac
* ‘Lotterywest’, which operates in Western Australia, is included for reference purposes.
Ireland’s per capita Scratch Card sales are lower than many other countries and regions, with Italy, France, Portugal and the UK all having higher levels in 2016. Ireland ranked 49th out of the 100 regions, with per capita sales on Scratch Cards growing from €41 in 2015 to €45 in 2016 (Table 5.10).
Table 5.10: Per Capita Scratch Card Sales
2015 2016
Per Capita Sales (€)
Rank Per Capita Sales (€)
Rank
Massachusetts 481 1 505 1
New York 178 7 189 7
Italy 147 10 146 14
France 98 27 104 27
Portugal 103 24 103 25
UK 60 38 58 46
Ireland 41 51 45 49
Belgium 20 69 20 67
Source: La Fleur’s World Lottery Almanac
795 Wider Market Developments
Indecon International Economic ConsultantsIndependent Socio-Economic Impact Assessment of the National Lottery
Finally, how Ireland compares in relation to sales per capita with countries and states with a similar population was assessed. Sales per capita grew by almost 10% between 2015 and 2016 for Ireland as it overtook Queensland in size (Table 5.11).
Table 5.11: Sales Per Capita (2015-2016) (Countries/States with Population Between 3-5 Million)
2015 2016 Change % Change
Connecticut 295 312 17 5.8%
South Carolina 273 296 23 8.4%
Kentucky 190 207 17 8.9%
British Columbia 184 184 0 0.0%
New Zealand 123 162 39 31.7%
Ireland 146 160 14 9.6%
Queensland 165 159 -6 -3.6%
Minnesota 90 99 9 10.0%
Louisiana 89 97 8 9.0%
Colorado 93 97 4 4.3%
Source: La Fleur’s World Lottery Almanac
5.5 Summary of Key Findings
• The National Lottery operates in a dynamic market environment which has undergone significant change over the past four years.
• Most notably, this includes the rise in online betting and the growth in bet-on-lottery operators, which allow players to bet on the outcomes of national lotteries without purchasing a ticket.
• The total size of the betting and lotteries sector in Ireland was estimated at approx. €5.6 billion for 2016.
• The National Lottery’s sales represented only 13% of this market estimate. Betting activities, while close substitutes for playing the lottery, do not result in the distribution of funds to various social and other community organisations and are likely to have different economic and social impacts on the Irish economy.
80 Notes
81
Indecon International Economic ConsultantsIndependent Socio-Economic Impact Assessment of the National Lottery
Notes
82 Notes
835 Wider Market Developments
Indecon International Economic ConsultantsIndependent Socio-Economic Impact Assessment of the National Lottery
5 Wider Market Developments84
Premier Lotteries Ireland, Abbey Street Lower, Dublin 1