Page 1
SOCIODEMOGRAPHIC CHARACTERISTICS AND SPATIAL
DISTRIBUTION OF MALARIA IN NIGERIAN CHILDREN
By
Lovelyn Uzoma Ozougwu
(1226801)
A research report submitted to the Faculty of Health Sciences, University of the
Witwatersrand, Johannesburg, in partial fulfilment of the requirements for the degree of Master
of Science in Epidemiology in the field of Epidemiology and Infectious Diseases
March 2018
Page 2
[Type text] Page ii
Declaration
I declare that this research report is my work. It is being submitted in partial fulfilment of the
requirements for the degree of Master of Science in Epidemiology in the field of Epidemiology
and Infectious Disease at the University of the Witwatersrand, Johannesburg. The contents of
this research report are original and have not been submitted for any other degree or
qualification in this or any other university.
Lovelyn Uzoma Ozougwu
Page 3
[Type text] Page iii
Dedication
Firstly, I want to thank the God Almighty for giving me life and strength to complete my study.
Secondly, my profound gratitude goes to my husband Pastor Obed Mondale Nnaji for believing
in me and for all his support during this course, God bless you.
Page 4
[Type text] Page iv
Abstract
Background
Malaria is a significant public health concern in the world. It causes mortality and morbidity
especially in children under five years of age and pregnant women. Nigeria contributes about
25% to the malaria burden in Africa, with one million lives lost annually. Several factors
including poverty, ownership of bed nets, socioeconomic status are associated with malaria
morbidity. This study aimed to determine the factors associated with malaria morbidity and its
spatial distribution in Nigerian regions among children under five years in 2010.
Methods
This study used cross-sectional data from the 2010 Nigeria Malaria Indicator Survey (NMIS)
which was downloaded from DHS website. The primary sampling unit (PSU) which was
referred as the cluster for the 2010 NMIS was defined based on the enumeration areas (EAs)
from the 2006 EA census frame. The 2010 NMIS sample was selected using a stratified, two -
stage cluster design consisting of 240 clusters, 83 clusters in the urban areas and 157 in the
rural areas. The research was restricted to children under five years (6-59 months). The
outcome variable was defined as the presence or absence of malaria. It was measured using
rapid diagnostic test and microscopic examination of blood smear. Clustered adjusted
Pearson’s chi-square test was used to show associations between explanatory variables and
malaria. A clustered t-test was used to determine differences in the mean for continuous
variables. Multilevel logistic regression models, taking into account random effects were fitted.
Choropleth maps were used to display the distribution of malaria by geopolitical zones.
Page 5
[Type text] Page v
Results
There were 5137 children aged 6-59 months for this study out of 5612 children that were
selected for the survey, 41.97% had malaria, and there was no difference in prevalence between
males and females. The mean age was 34.96±0.33 months. There was a higher prevalence
(60.19%) of malaria in the areas where there was no LLIN campaign coverage compared to
areas with LLIN coverage (39.81%) (OR 0.65, 95% CI 0.43-0.97). Children from rural areas
were three times more likely to have malaria than those from urban areas (OR 3.13,95%CI
2.18-4.49). The odds of malaria increased significantly with increasing age in months (OR
1.02, 95% CI 1.02-1.03, P-value<0.0001). The richest household children were less likely to
have high prevalence of malaria compared to children from the poorest households (OR 0.23,
95%CI 0.15-0.37). Choropleth maps showed a high prevalence in the North-West and North-
Central regions and lowest prevalence in the South-East region.
Conclusion
Although efforts have been made to control malaria in Nigeria, its elimination is not
forthcoming. The prevalence in children under five years was high. Those who live in the rural
areas, wealth index, geopolitical region and child’s age were the determining factors associated
with the high prevalence of malaria in those children. There was a regional variation of malaria
prevalence among the children. Children from the North-Central and North-West regions had
the highest prevalence of malaria. All these factors could be as a result of policy issues, policy
formulations, management, implementation, compliance and sustenance issues. However, a lot
can be done in the malaria control and prevention programme in Nigeria towards vaccine
development, policy formulation and implementation based on evidence, increased public
health and environmental education, incorporation of the communities in activities towards
Page 6
[Type text] Page vi
malaria control, mapping of the spatial distribution of malaria as well as stepping up of ongoing
control programmes.
Keywords: children under five years, spatial analysis, Nigeria.
Page 7
[Type text] Page vii
Acknowledgements
I would like to extend my profound gratitude to my supervisors Mrs Zodwa Ndlovu &
Professor Eustasius Musenge for their unconditional support, guidance and encouragement
during this study. You people were so determined to see me through even when I had lost hope
and felt lost. This research project could not have been a success if not for you. Also to Measure
DHS for giving me the opportunity to use your data, I say thank you.
I would like to thank the Enugu State Government for giving me the opportunity to embark on
this journey. Special thanks to my colleagues Mrs Cecilia Aneke, Mrs Ada Chineke, Dr Oge
Amadi, Dr Emeka Neboh, Johnson Ogbu and Mr Gabriel Ezea and my foster father Apostle
Mike Ugwu.
Special thanks to my lovely mother Mrs Beatrice Ozougwu and my siblings Samuel,
Ifeanyichukwu, Henrietta, Promise, Chielozonam, Chigoziem and Ginika, I love you all.
I also want to thank my uncle and his wife Barr Ricky & Dr Ndidi Agu for their guidance and
financial support.
I am grateful to all my lecturers at the School of Public Health for their encouragement.
Lastly to my classmates who have contributed in one way or the other throughout this work.
Page 8
[Type text] Page viii
Table of Contents
Declaration .............................................................................................................................................. ii
Dedication .............................................................................................................................................. iii
Abstract .................................................................................................................................................. iv
Acknowledgements ............................................................................................................................... vii
Table of Contents ................................................................................................................................. viii
List of figures ........................................................................................................................................... x
List of tables ........................................................................................................................................... xi
Abbreviations ........................................................................................................................................ xii
Chapter 1 ................................................................................................................................................. 1
1.1 Background ................................................................................................................................... 1
1.2 Literature Review .......................................................................................................................... 3
1.2.1 Malaria life cycle .................................................................................................................... 3
1.2.2 Malaria Transmission in Nigeria ............................................................................................. 4
1.2.4 Burden of malaria .................................................................................................................. 5
1.2.2 Change in the burden of malaria ........................................................................................... 7
1.2.3 Factors associated with malaria ............................................................................................. 8
1.2.4 Spatial distribution of malaria .............................................................................................. 11
1.2.5 Malaria control measures in Nigeria .................................................................................... 11
1.3 Problem Statement ..................................................................................................................... 13
1.4 Justification ................................................................................................................................. 13
1.5 Research Question ...................................................................................................................... 13
1.6 Study Aim .................................................................................................................................... 13
1.7 Study Objectives ......................................................................................................................... 14
CHAPTER 2 ............................................................................................................................................ 15
2.1 Primary study .............................................................................................................................. 15
2.1.1 Primary study area ............................................................................................................... 15
2.1.2 Primary study design/ sampling method ............................................................................. 17
2.1.3 Primary data collection ........................................................................................................ 17
Page 9
[Type text] Page ix
2.2 Secondary analysis methods ....................................................................................................... 18
2.2.1 Study design/study population ............................................................................................ 18
2.2.2 Power computation ............................................................................................................. 18
2.2.3 Inclusion criteria ................................................................................................................... 19
2.2.4 Study participants ................................................................................................................ 19
2.3 Data management and analysis .................................................................................................. 21
2.3.1 Data management ............................................................................................................... 21
2.3.2 Measurement of variables ................................................................................................... 21
2.3.3 Statistical Analysis ................................................................................................................ 24
2.4 Ethical consideration ................................................................................................................... 26
CHAPTER 3 ............................................................................................................................................ 27
3.1 Description of children and households analysis of malaria among children under five years in Nigeria in 2010 .................................................................................................................................. 27
3.2 Univariable analyses of the explanatory variables from survey weights adjustment. ............... 31
Table 3.3 Multivariable analyses of factors associated with malaria from survey weights adjustment and random effects. ...................................................................................................... 33
3.4: Spatial distribution of malaria in the geopolitical regions of Nigeria ........................................ 35
CHAPTER 4 ............................................................................................................................................ 37
4.1 Discussion .................................................................................................................................... 37
4.1.1 Children’s variables .............................................................................................................. 37
4.1.2 Household variables ............................................................................................................. 38
4.2 Limitations ................................................................................................................................... 40
4.3 Strengths ..................................................................................................................................... 41
4.4 Conclusions ................................................................................................................................. 41
4.5 Recommendations ...................................................................................................................... 41
References ............................................................................................................................................ 43
Appendix 1: Plagiarism Declaration form ............................................................................................. 49
Appendix 2: Ethics Clearance Certificate .............................................................................................. 50
Appendix 3: Change of Title Approval .................................................................................................. 51
Page 10
[Type text] Page x
List of figures
Figure 1: Malaria life cycle (15) ................................................................................................ 4
Figure 2: Conceptual framework of important risk factors affecting malaria prevalence in the
African Highlands (26) .............................................................................................................. 8
Figure 3: Map of Nigeria showing the six geopolitical regions and states .............................. 16
Figure 4: Flow diagram of households and children participants in 2010 NMIS .................... 20
Figure 5: Prevalence (Observed), Predicted Probability and Standard error mean of Malaria in
Children under five years in Nigeria, 2010 .............................................................................. 36
Page 11
[Type text] Page xi
List of tables
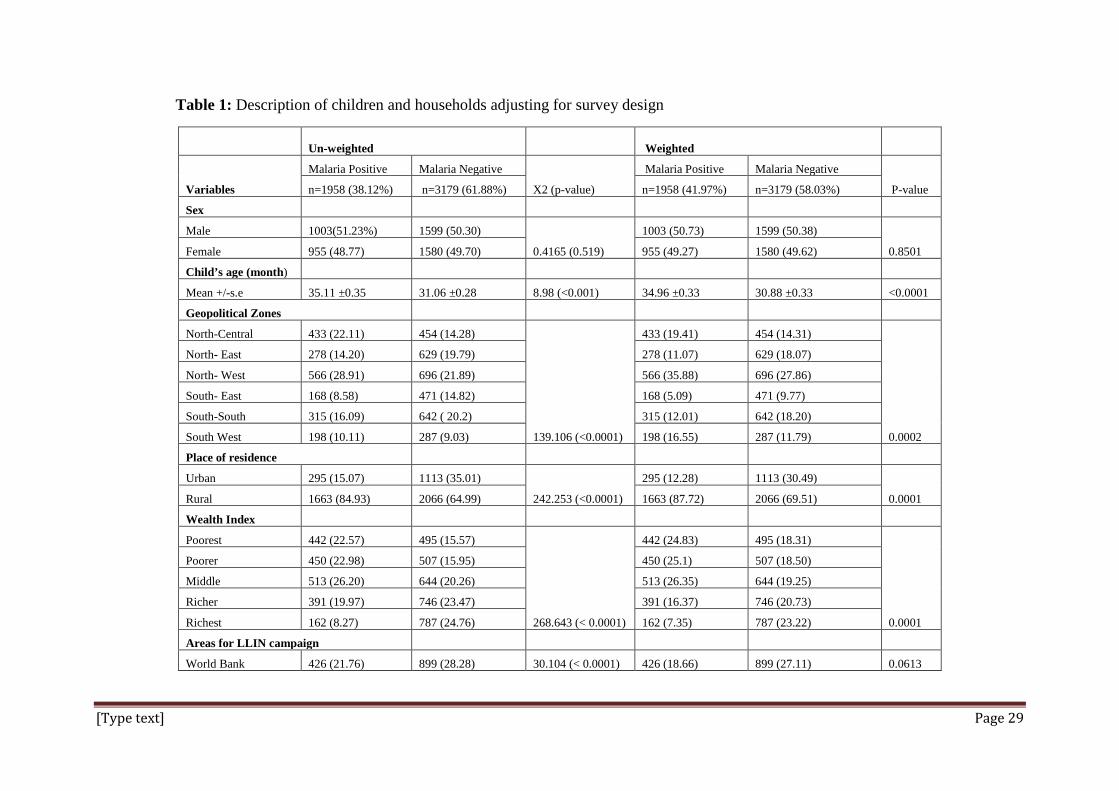
Table 1: Description of children and households adjusting for survey design ........................ 29
Table 2: Univariable analyses of the explanatory variables with malaria ............................... 32
Table 3: Multivariable analyses of factors associated with malaria ........................................ 34
Page 12
[Type text] Page xii
Abbreviations
ACT- Artemisinin-based Therapy
AIDS- Acquired Immunodeficiency Syndrome
DHS- Demographic and Health Survey
FCT- Federal Capital Territory
GIS- Geographic Information System
HIV- Human Immunodeficiency Virus
IPT- Intermittent Preventive Treatment
IRS- Indoor Residual Spray
LLIN- Long Lasting Insecticide Treated Nets
MDGs- Millennium Development Goals
NMCP- National Malaria Control Programme
NMIS- Nigeria Malaria Indicator Survey
NSPMC- National Strategic Plans for Malaria Control in Nigeria
RBI- Roll Back Malaria Initiative
WHO- World Health Organisation
Page 13
[Type text] Page 1
Chapter 1
1.1 Background
Malaria is one of the most significant parasitic infections of public health importance (1). This
concern is because it causes a high level of morbidity and mortality in endemic areas. The
parasite that causes malaria belongs to the Plasmodium genus, and its vector of transmission is
the female Anopheles mosquito. There four types of malaria species that infect humans (P.
falciparum, P. malariae, P. Vivax and P.ovale.), of which P. falciparum and P. vivax are the
most common ones in the endemic areas globally. The prevalence of malaria depends on
various factors which include an abundance of female Anopheles mosquitoes, the tendency of
mosquitoes to bite, the rate at which mosquitoes bite, the longevity and also the rate at which
the Plasmodium parasites develop inside mosquitoes (2).
In 2014, the World Health Organisation (WHO) reported malaria as the second important cause
of mortality in Africa after HIV/AIDS (3). It has been said globally that approximately 214
million cases of malaria occurred in 2015 which ranges from 148-305 million (4,5). The
majority (90%) of all malaria cases occur in African region followed by the South-East Asian
region (7%) and the Eastern Mediterranean region (2%). Nigeria contributes about 25% of the
malaria burden in African region. Approximately, 429000 malaria deaths (range 235000-
639000) occurred worldwide in 2015 where children under five years contributed 303000
deaths which claims the life of one child every 30 seconds (6). Majority of the malaria deaths
approximately 292000 occurred in the African region.
In Nigeria, the prevalence of malaria is high and ranges between 80%-85% (7). Malaria is
endemic in Nigeria which form a major public health problem despite the curable nature of the
disease(8). Malaria-related deaths accounts for about 11% maternal mortality, 25% infant
Page 14
[Type text] Page 2
mortality and 30% under five mortality resulting to 300,000 childhood deaths annually (5,9).
It contributes up to 30% of admission to the healthcare facilities and 60% of outpatient visits
(5). Fifty percent of the Nigerian population suffers at least one episode of malaria yearly (10).
The heightened risk could be due to increased resistance to cost-effective antimalarial drugs,
treatment failure, global warming, climatic change, conflicts, insurgency and internal
displacement of persons (11).
Despite the fact that malaria is preventable and treatable, it still has an overwhelming impact
on health and livelihood globally (6). Children under five years and pregnant women are mostly
affected in malaria-endemic countries (12). In the most endemic countries, the disease affects
the underprivileged people, who have inadequate access to health facilities and who cannot pay
for the treatment. The disease is one of the most important cause of low birth weight, foetal
and maternal mortality (12).
Geographic Information System (GIS) is a powerful tool that is used to monitor public health
in various geographical locations because it gives accurate mapping (13). It has been
continuously used for the analysis of spatial health-related data and analysing the spread of
diseases in both the developing and developed countries (14). The spatial distribution enables
efficient resource allocation through identification of most affected regions.
Page 15
[Type text] Page 3
1.2 Literature Review
1.2.1 Malaria life cycle
Malaria is caused is caused by Plasmodium spp, a genus of unicellular parasite. The most
prevalent species of malaria parasite in Nigeria is the Plasmodium falciparum (>95%) which
is responsible for the most severe forms of the disease (8). Plasmodium ovale and Plasmodium
malariae are the other types of malaria species found in the country but they play a minor role.
The malaria parasite life cycle is divided into two hosts as shown in fig 1 below. During a blood
meal, a malaria-infected female Anopheles mosquito inoculates sporozoites into the human
host. The sporozoites infect the liver cells and then mature into schizonts, which rupture and
release merozoites. After the initial replication in the liver (exo-erythrocytic schizogony), the
parasites undergo asexual multiplication in the erythrocytes (erythrocytic schizogony ). The
ring stage trophozoites mature into schizonts, which ruptures and releases merozoites. The
blood stage parasites are responsible for the clinical manifestations of the disease.
The gametocytes, male (microgametocytes) and female (macrogametocytes), are ingested by
an Anopheles mosquito during a blood meal. The multiplication of the parasite in the mosquito
is known as the sporogonic cycle. While in the mosquito's body, the microgametes penetrates
the macrogametes generating zygotes. The zygotes in turn become motile and elongated
(ookinetes) which invade the midgut wall of the mosquito where they develop into oocysts.
The oocysts grow, rupture, and release sporozoites, which make their way to the mosquito's
salivary glands. Inoculation of the sporozoites into a new human host perpetuates the malaria
life cycle.
Page 16
[Type text] Page 4
Figure 1: Malaria life cycle (15)
1.2.2 Malaria Transmission in Nigeria
The geographic location of Nigeria makes the climate suitable for malaria transmission
throughout the country (8). Nigeria has a tropical climate. The dry and wet seasons are
associated with the movement of two dominant winds – the rain which bears the south westerly
winds and the cold, dry and dusty North easterly winds which is commonly referred to as the
Harmattan. The dry season occurs from October to March while the wet season occurs from
April to September with temperatures ranging from 25oC to 40oC (8).
During the 2010 NMIS, it was estimated that 97% of Nigerian population are at risk of getting
malaria (8). The remaining 3% of the population who live in the mountains in Southern Jos
Page 17
[Type text] Page 5
(Plateau State) at an altitude ranging from 1,200-1,400 metres are at relatively low risk for
malaria.
1.2.3 Malaria diagnosis and treatment
Rapid diagnosis and effective treatment are the important components of malaria control and
elimination strategies (16). Parasitological tests which include microscopy or the use of Rapid
Diagnostic Test (RDT) should be conducted in all cases of suspected malaria to confirm
diagnosis. Malaria parasites can be identified by examining under the microscope a drop of
patient’s blood, spread out as a blood smear on a microscope slide. The slide is most often
stained with Geimsa stain prior to the examination to give the parasite a distinctive appearance
(16). Antimalarial treatment should be used to ensure that only confirmed malaria cases receive
antimalarial drugs and that the use of combination therapy in prevention or delayed
development of drug resistance.
1.2.4 Burden of malaria
Malaria burden can be estimated based on the number of clinical cases and number of deaths
(17). The approaches for the estimation of number of clinical cases can be categorised into two
groups;
1. Case report based where reported cases are adjusted for health facility attendance, level of
diagnostic efforts and underreporting in the health sector.
2. Risk based where geographic areas are categorised by level of malaria risk. The risk is then
converted to malaria incidence based on relationships derived from longitudinal studies and
adjusted for the estimated deployment of preventive measures e.g. bed-nets. The malaria
incidence is multiplied by the relevant population to obtain the number of malaria cases.
Page 18
[Type text] Page 6
Malaria death estimates fall into three categories, two of the categories are similar to case
estimates (17). There is a risk based approach in which the level of malaria risk is linked to
malaria mortality rates and population through mapping. In the case report based, the adjusted
case counts are multiplied by a fixed case fatality rate (CFR) to get the number of malaria
deaths. The last approach which is the vital registration (VR) based approach is used to provide
direct estimate from recorded deaths.
There is a high prevalence of malaria in Nigeria especially among children under five years
which depict the country’s declining health outcome (18). More than one in every ten children
born in Nigeria on average does not survive to their fifth birthday. The evidence was based on
a study conducted in Nigeria on exploring variations in children under five malaria mortality
using control chart, league table and spatial analysis (19). The result also showed a vast
difference in the under-five mortality rate among the 36 states including the federal capital.
Children spend days away from school and adult too loose work days as a result of malaria (2).
A study has shown that severe malaria is the reason for hospital admission with children in
Nigeria especially those less than five years of age (20). Malaria greatly contributes to anaemia
in pregnancy which increases the occurrence of low birth weights (21). It is also associated
with preterm deliveries, stillbirth and perinatal mortality (21).
The problem of malaria has caused a significant challenge in both the human capital and
economic development in Nigeria (18). It was found that there is a substantial cost on the
country’s economy through government and individuals spending on malaria programmes and
drugs. Nigeria lost about Ν132 billion annually in the form of malaria treatment costs,
prevention and loss of person-hours (22). The result of a study that was done on cost-
Page 19
[Type text] Page 7
effectiveness and resource allocation in Nigeria stated that on average, every household spends
Ν1112 ($9.3) per month on malaria treatment (23).
1.2.2 Change in the burden of malaria
In Africa, a substantial decrease in malaria transmission has been achieved between 2000 and
2010 in malaria endemic countries (24). The incidence of malaria was reduced by 15% between
2010-2015 (6). There was also estimated decrease in the mortality rate of 29% from 2010-2015
(6). In the hyperendemic or holoendemic areas, the transmission was reduced from 218.6
million (34.4%) to 183.5 million (25.5%) across 44 malaria endemic countries.
These observed changes and decline in malaria burden are as a result of scaling up of
prevention, diagnosis and treatment of malaria (25). This was made possible by significant
growths in funding for malaria control programs. This led to improvement in procuring and
distributing effective control measures such as LLINs and medication (25). In spite of the
reduction in the transmission intensity, 57% of the population still lives in areas where malaria
risk remains high (24).
Page 20
[Type text] Page 8
1.2.3 Factors associated with malaria
Figure 2: Conceptual framework of important risk factors affecting malaria prevalence in the African Highlands (26)
The factors associated with malaria are grouped into three main categories as shown in figure
one above. They include; the human-related factors, the biological factors and the
environmental factors (26).
1.2.3.1 Human-related factors
The human-related risk factors of malaria are gender, migration, treatment, socioeconomic
status, health access, insecticide-treated nets, intermittent preventive treatment, indoor residual
spraying, livestock and land use (26). Sex is not an important risk factor of malaria according
to a study that was done in Uganda (27). However, People’s migration and inaccessibility of
health systems can create enabling conditions for malaria outbreaks (28).
Page 21
[Type text] Page 9
Studies have shown that households and socioeconomic factors have effect in the malaria
transmission by influencing the human-vector contact (1,28,29). Socioeconomic factors like
availability of electricity , main floor material and main wall material in the households were
associated with malaria from a study that was done in Uganda (27). There were more
mosquitoes in the poor constructed houses compared to good quality ones. Children that reside
in the households that had sand as their main floor material has shown high prevalence of
malaria when they are compared to households with a complete floor surface (27,30). The study
also showed that ownership of television, bicycle and radio were not associated with malaria.
Poverty is a significant risk factor in determining the high incidence of malaria according to a
study that was conducted on malaria risk assessment in Koton Karfe watershed catchment in
Nigeria in 2009 (31).
The use of mosquito bed nets is a protecting factor against the risk of malaria in children less
than five years. The finding was reported from a study on socio-demographic determinants of
malaria among children less than five years of age in Ghana (32). In other similar studies, the
households that reported having mosquito bed nets had fewer malaria cases among children
less than five years compared to those households that do not have bed nets (33,34).
1.2.3.2 Biological factors
The biological factors are the age, immunity, health status, drug resistance, insecticide
resistance and breeding site. The likelihood of malaria increases as the child increases with age
(27,32). The prevalence of malaria is similar in all age groups in low transmission areas, (28).
A study has shown that the capacity to suppress malaria illness depends on the immunity and
that acquired immunity depends on age and exposure (28). Immunity develops with increasing
transmission but becomes independent of transmission intensity as child reaches age three
Page 22
[Type text] Page 10
years.
The healthiness of the population may have impact on malaria infection (28). Malnutrition can
weaken the children’s immunity which could result to high level of malaria morbidity and
mortality (28,35). A study that was done in South Africa has shown that there is a relationship
between HIV and increased level of malaria transmission in South Africa (28).
The treatment failure of malaria with sulphadoxine-pyrimethamine and chloroquine
contributes to the enhanced transmission of malaria in the human reservoir (26,36). In other
words, it causes the resurgence of malaria in several countries which leads to the emergence
and spread of drug-resistant parasites (37).
1.2.3.3 Environmental factors
The environmental factors are temperature, altitude and precipitation. An altitude of around
1800 and 2000 are the upper limit at which malaria transmission occur (38). However, a study
has shown that as the cluster altitude increases, the likelihood of malaria for a child decreases
(27). This finding means that the odds of malaria in a child reduced by approximately 10% for
every 100m increase of the cluster altitude.
The most favourable conditions for the extrinsic growth of malaria parasite are between 25ºc
and 30ºc, below 16-19 ºc only some vectors will live before the completion of the sporogonic
cycle. This temperature is considered as the threshold for steady malaria spread (28).
Temperature influences the longevity and the feeding occurrence of a mosquito, however, a
small temperature rise through seasonal variability will increase malaria transmission and
distribution (26). This is the reason why malaria is found in the temperate regions (27).
Page 23
[Type text] Page 11
1.2.4 Spatial distribution of malaria
In a high malaria prevalence country like Nigeria, the prevalence varies across space. The
distribution and transmission also differ from place to place (13). The distribution ranges
between 0.4% to 90% with the southern-most and the South-Eastern part of the country having
relatively low prevalence (5). Studies have shown that rain is an essential driver of malaria
because it provides breeding sites for the aquatic stages of mosquito’s life cycle (5,26).
The risk was higher in the South-Western region (~48%) (5). The highest burden was found in
the North-Central and South-West region which is as a result of shallow rainfall which provides
suitable breeding conditions for the vector (5). In contrast, the increase in rainfall and
temperature increases the development of mosquitoes and also improves breeding sites which
determines the corresponding increase in malaria prevalence (39)
A study that was carried out in Warri in the South-South region of Nigeria on the spatial
distribution of malaria showed that rainfall was a driver of malaria (40). The results showed a
high prevalence of malaria during the heavy rainfall month (June) with a significant difference
in the distribution of malaria in the metropolis. This finding agrees with another study which
showed a spatial variation of malaria incidence among children in different villages (41).
Malaria incidence decreased with increasing distance from the forest outside the village to the
centre of the village.
1.2.5 Malaria control measures in Nigeria
In Nigeria, the malaria control has attained several milestones with the help of the National
Malaria Control Program (NMCP) since the beginning of the Roll Back Malaria (RBM)
Initiative (42). The initiatives were focused on three main interventions which consist of case
Page 24
[Type text] Page 12
management, use of insecticide-treated nets (ITNs) and promotion of intermittent preventive
treatment (IPT). The plan is to achieve 80% coverage LLINs, to expand indoor residual
spraying (IRS) to 20% of houses in targeted areas and the expansion of distribution of
intermittent preventive therapy (IPT) coverage to about 100% of pregnant women that attend
antenatal clinics.
There are ABCD measures for prevention of malaria (43). This includes;
1. Awareness of risk of malaria.
2. Bite prevention: This is through the use of insect repellent creams, insecticide-treated
nets, wearing trousers and long sleeves.
3. Antimalarial medication- Taken Chemoprophylaxis (Artemisinin-based combination
therapies).
4. Prompt Diagnosis and treatment.
The antimalaria treatment that is recommended for the treatment of malaria in Nigeria is the
intravenous or the intramuscular Artesunate (43). In the case where it is not available,
intravenous or intramuscular Quinine or Artemether can be used as an alternative.
Despite the improvements in malaria control, the burden of the disease is still high especially
among children under five years and pregnant women. Bureaucracy, poor resource
management in the healthcare system, Boko-Haram insurgency in the northern part of Nigeria
and kidnappings in the southern region could be the reason while the plan has not been achieved
(44).
Page 25
[Type text] Page 13
1.3 Problem Statement
There is a high burden of malaria in Nigeria especially in children under five years. This
subsequently affects the economic growth of the country (23). The nation spends about 880,801
million Naira (USD 5,866667) on malaria treatment every year which represents approximately
12.0% of gross domestic product (GDP) (23). Malaria was the primary reason Nigeria did not
attain the health-related Millennium Development Goals (MDGs) that ended in May 2015 (9).
This is because in a year, at least half of Nigerian’s population get infected with malaria.
Malaria in pregnancy has been reported to have a link with intra-uterine growth retardation (9).
Malaria illness has shown adverse effects on the economic development of the country which
subsequently affects the health of the people (23).
1.4 Justification
Understanding the determinants of malaria is essential in reducing disease morbidity. There is
a need to identify the risk factors or determinants to have a targeted interventions aimed at the
susceptible groups. Geographic location can be considered a risk factor; it is crucial to
determine the spatial distribution of malaria in the regions.
1.5 Research Question
What are the sociodemographic characteristics and spatial distribution of malaria in Nigerian
children?
1.6 Study Aim
To determine the sociodemographic characteristics and spatial distribution of malaria in
Nigerian children
Page 26
[Type text] Page 14
1.7 Study Objectives
1. To describe the prevalence of malaria in children under five years in Nigeria in 2010
2. To identify the socio-demographic and household determinants of malaria in children under
five years in Nigeria in 2010
3. To determine the spatial distribution of malaria in children under five years within the
geopolitical zones and their respective states in Nigeria in 2010
Page 27
[Type text] Page 15
CHAPTER 2
This study was a secondary data analysis. The section explains the process of primary sample
collection, the methods and the statistical analysis including mapping that was carried out in
this study.
2.1 Primary study
The primary study was the 2010 Nigeria Malaria Indicator Survey (NMIS). The main aim of
the study was to measure progress towards achieving the goals and targets of 2009-2013
National Strategic Plan for Malaria Control in Nigeria (NSPMC). The plan was to provide data
on key malaria indicators, diagnosis and prompt treatment of malaria using artemisinin-based
therapy (ACT), ownership and use of bed nets, indoor residual spraying (IRS) and behaviour
change communication.
2.1.1 Primary study area
The study was conducted in Nigeria, a West African sub-region. It has a tropical climate with
a surface area of about 923,768 square kilometres and is the fourteenth largest country in Africa
(8). Nigeria is divided into six geopolitical regions. Each region is made up of at least six states
as shown in Fig 1 below. There are 36 states and a Federal Capital Territory (FCT). The
population of Nigeria is approximately 140 million according to the 2006 census report (45).
Page 28
[Type text] Page 16
Figure 3: Map of Nigeria showing the six geopolitical regions and states
Page 29
[Type text] Page 17
2.1.2 Primary study design/ sampling method
The cross-sectional study was carried out from October to December 2010 on a nationally
representative sample of more than 6000 households. The primary sampling unit (PSU) which
was referred as the cluster for the 2010 NMIS was defined based on the enumeration areas
(EAs) from the 2006 EA census frame. The 2010 NMIS sample was selected using a stratified,
two -stage cluster design consisting of 240 clusters, 83 clusters in the urban areas and 157 in
the rural areas (8). The final sample included 239 clusters due to lack of access to the cluster
because of communal clash. A complete listing of households was conducted and a mapping
exercise was carried out from August to September 2010. The lists of the households served as
the sampling frame for the selection of households in the second stage.
In the second stage of the selection process, an average number of 26 households were selected
from each cluster by equal probability systematic sampling. All women who were either
permanent resident of the households in 2010 NMIS sample or visitors present in the
households on the night before the survey were eligible to be interviewed. In addition, all
children age 6-59 months were eligible to be tested for malaria and anaemia (8).
2.1.3 Primary data collection
The data was collected by the trained field workers which includes the field interviewers nurses
and the laboratory scientist.(8). The questionnaires were administered by the quality control
interviewers. All children aged 6 to 59 months in each household who met inclusion criteria
and for whom consent was obtained were enrolled for malaria and anaemia testing. Approval
was obtained from the parents or guardian of the children before blood was collected. Children
were pricked either on the finger or the heel with the use of a microcuvette to collect a drop of
blood. Two methods were used in the diagnosis; the Paracheck Pf rapid diagnostic test and
Page 30
[Type text] Page 18
microscopic examination using blood smear (thin and thick film) (8). The blood smears were
transported to the Department of Medical Microbiology and Parasitology Laboratory at the
University of Lagos to determine the presence of malaria parasiteamia. The result of the blood
smear from microscopic examination was considered for this study because it was the gold
standard for detection of malaria parasites and its species in the survey (8).
Information on mother’s education, geopolitical region, place of residence (urban or rural),
wealth quintile, child’s sex, child’s age, use of LLINs, the number of household members, and
whether mother took antimalarial drug during pregnancy were obtained using a researcher-
administered questionnaire.
2.2 Secondary analysis methods
2.2.1 Study design/study population
The study design was a cross-sectional survey of children 6 to 59 months who lived in Nigeria
in 2010.The dataset used was from the 2010 Nigeria Malaria Indicator Survey (NMIS) through
the DHS website.
2.2.2 Power computation
There was no sampling for this study, that is, all the data provided was analysed. A power
computation was performed using clustersampsi ado file (46). A sample prevalence of 42%
was obtained from positive microscopy results from the 2010 NMIS (8) and assuming a 47%
population prevalence at an alpha level of 0.05.
Page 31
[Type text] Page 19
The following were used in the calculation: a design effect of 4, inter-cluster correlation (ICC)
of 0.12, a total of 239 clusters and 26 households per cluster. Power was calculated to be at
least 80%.
2.2.3 Inclusion criteria
The inclusion criteria were children whose mothers were consented to be interviewed and had
also given consent for collection of blood samples from their children.
2.2.4 Study participants
A total of 6197 households were selected during the 2010 NMIS. Out of the selected
households, 5,986 households were occupied. Of the occupied households 5,895 had occupants
who were successfully interviewed. Of the 5,895 households that were successfully
interviewed, 5,612 children under five years were tested for malaria using microscopy and
5,137 of them were used for this study as shown in Fig 2 below.
Page 32
[Type text] Page 20
Figure 4: Flow diagram of households and children participants in 2010 NMIS
6197 households identified
5986 households
occupied
211 households not occupied
5895 households
interviewed
91 households not interviewed
5612 children <5years tested for malaria microscopy
5137 children under 5years
analysed
475 no microscopy result
Page 33
[Type text] Page 21
2.3 Data management and analysis
2.3.1 Data management
The dataset provided by Measure DHS was in a format compatible for analysis using Stata
(StataCorp LP, Texas USA). Data was reshaped from wide to long form to store the data in
multiple rows so that each individual will have a unique identification with the variables
measured for each. The reshaped data was cleaned by checking for missing values, deleting
duplicate observations, recoding and generating new variables.
The data was survey set before using it for analysis to take into account the characteristics of
survey design which include sampling or probability weighting, cluster sampling and
stratification (47). The sample weight was calculated by dividing the household sample weight
by 1000000.
2.3.2 Measurement of variables
2.3.2.1 Outcome variable
Malaria as the outcome variable was defined as presence of the malaria parasite. Malaria
parasites were detected using Giemsa staining and microscopy.
2.3.2.2 Explanatory variables:
The explanatory variables were grouped into two categories (A and B) and discussed below;
A. Children’s variables (characteristics)
• Age in months: age of a child was calculated from the date of birth to the date of survey.
It was categorised into five groups as follows; <12 months, 12-23 months, 24-35
months, 36-47 months and 48-59 months.
• Sex: male and female.
Page 34
[Type text] Page 22
• Does a child have a fever in the last two weeks before the survey? Yes and no.
• Does a child under five years sleep under bed net a night before the survey? No net in
the household, no children, all children, some children and missing.
B. Household variables (characteristics)
• Place of residence: rural or urban.
• Geopolitical region: They are classified into six;
North-Central: Benue States, Kogi State, Abuja-FCT, Kwara State, Niger State,
Nassarawa State and Plateau State
North-East: Adamawa State, Bauchi State, Borno State, Gombe State, Taraba State and
Yobe State
North-West: Jigawa State, Kaduna State, Kano State, Katsina State, Kebbi State, Sokoto
State and Zamfara State
South-East: Abia State, Anambra State, Ebonyi State, Enugu State and Imo State
South-South: Akwa-Ibom State, Bayelsa State, Cross-River State, Delta State, Edo
State and Rivers State
South-West: Ekiti State, Lagos State, Ogun State, Ondo State, Osun State and Oyo State
• Wealth index: This was used as an indicator to determine the economic status of
households that is consistent with income and expenditure. It was calculated using
household data on ownership of consumer goods, the source of drinking water,
sanitation facilities, dwelling characteristics, and other characteristics that relate to
socio-economic status of households. A factor score was assigned to each of the assets
to construct the index through principal component analysis. Scores for each asset of
the entire households were summed. Ranking of individuals were done according to the
Page 35
[Type text] Page 23
total score of the household in which they reside and were then divided into quintiles
representing poorest, poorer, middle, richer and richest (48).
• Whether the dwelling has been sprayed against mosquitoes in the last 12 months. It was
categorised as “yes” if the interior walls of the dwelling were sprayed in the last 12
months, “no” if it not and “missing” if not known.
• Areas with long-lasting insecticide-treated bed net campaign: The LLIN campaign was
supported by the Global Fund, World Bank, Support for the National Malaria Control
Programme (SuNMaP), Department for International Development (DFID) and
Millennium Development Goals (MDG) funds through the government of Nigeria to
distribute over 63 million LLINs to the population by the end of 2010 (8). The variable
was categorised into areas with World Bank campaigns, other campaigns and no
campaigns.
• Has a television was a measure of household assets? It was categorised into yes
(presence of television in good working order) and no (absence of television in good
working order).
• The main source of drinking water was categorised into improved source (tube well or
borehole , piped water into dwelling/yard, public tap, protected dug well, protected
spring, rainwater, sachet water and bottled water) which means that by nature of its
construction it adequately protects the water from outside contamination especially
faecal contamination (49) and non-improved source (unprotected spring , unprotected
dug well, surface water and tanker truck with small tank) which is contaminated from
the source.
Page 36
[Type text] Page 24
2.3.3 Statistical Analysis
2.3.3.1 Analysis of Objective 1: To describe the prevalence of malaria in children under
five years in Nigeria in 2010
The prevalence of malaria in children was calculated as the number of positive malaria cases
divided by the number of children tested in the 2010 NMIS. Contingency and frequency
distribution tables were created for categorical variables (such as sex, place of residence etc.)
with malaria as the outcome of interest. Pearson’s chi-square test and clustered adjusted
Pearson’s chi-square test were used to check for associations between malaria and the
categorical variables. Stratified by malaria (present or absent), age (in months) as a continuous
variable was described using mean and standard deviation. The histogram was used to check
for normality. The difference in means was calculated using Student’s t-test. Clustered t-test
was also used while taking care of clustering (clttest in Stata) (50).
2.3.3.2 Analysis of Objective 2: To identify the socio-demographic and household
determinants of malaria in children under five years in Nigeria in 2010
Univariate analysis using logistic regression methods was performed to determine the
association between each independent variables and the outcome malaria. The backward
elimination selection method was used to select variables for inclusion in the multivariate
logistic regression models. Variables with alpha level ≥ 0.20 were automatically dropped by
Stata and not included in the model. The explanatory variables that were included in the logistic
regression models were sex, age, place of residence, region, wealth index, did a child have a
fever in the past two weeks, possession of television and children less than five years that slept
under a mosquito net in the previous night. A multilevel logistic regression model was fitted to
take into account the random effects. The multilevel model is the most satisfactory approach
to the analysis of clustered data because it allows for clustering thereby giving an efficient
Page 37
[Type text] Page 25
statistical efficient estimate of the regression coefficients. It helps to model the manner in which
children are nested within the clusters and the clusters within the regions. The model was built
using the cluster number.
2.3.3.3 Model goodness of fit test
The wald test was used to check for the significance of each variable before removal from the
model. The likelihood ratio test was used to compare between two models and the model with
a significant p-value (p-value ≤ 0.05) was considered. The post-estimation approach using the
estat icc was used to estimate intra-class correlation among children within each household.
The Akaike Information Criterion (AIC) and Bayesian Information Criterion (BIC) were also
performed using the ‘estat ic’ command to check for the model goodness of fit. The model with
the lower AIC and BIC was considered for this study.
2.3.3.4 Analysis of Objective 3: To determine the spatial distribution of malaria in
children under five years within the geopolitical regions and their respective states in
Nigeria in 2010
The shapefile of Nigeria was obtained from the Global Administrative Areas (GADM)
database (51) and was converted into Stata format. The maps were produced using the Spmap
ado file in Stata (StataCorp LP, Texas, USA) (52). The Spmap is aimed at visualising several
kinds of spatial data, and it is appropriate for drawing thematic maps and displaying the results
of spatial data analysis (52). The results were presented in the form of choropleth maps with
colour coded hot spots and cold spots to show the distribution of malaria in the six regions of
Nigeria.
Page 38
[Type text] Page 26
2.4 Ethical consideration
For the primary study, the National Population Commission (NPC) obtained approval from the
Federal Ministry of Health (FMH) in collaboration with its Roll Back Malaria Partners to
conduct the survey. Verbal informed consent for testing of children less than five years was
obtained from the child’s parent or guardian at the end of the household interview (8). For the
secondary data analysis, approval to use NMIS data was obtained from the Measure DHS
website. Ethics approval was obtained from the University of the Witwatersrand Human
Research Ethics Committee (M170154) (APPENDIX 2).
Page 39
[Type text] Page 27
CHAPTER 3
This chapter presents the results of the comparison of the socio-demographic and other malaria-
related characteristics of children and households in children with and without malaria. This is
followed by results of the univariable and multivariable analyses. Finally, the maps showing
the spatial distribution of malaria in Nigeria from the final multivariable model will be
presented.
3.1 Description of children and households analysis of malaria among children under five
years in Nigeria in 2010
There were 5137 children less than five years in this study. Of these, (41.97%) had malaria.
The characteristics of the study population are summarised in Table 1. Here, the weighted and
un-weighted results were shown, but the discussion will only be on the population weight
adjusted results. There was no difference in prevalence of malaria between males and females.
Children with malaria were older (34.96±0.33 months) than those without malaria (30.88±0.33
months).
Children from the most affluent households (richest and richer) had significantly lower
prevalence of malaria (23.72%) compared to those from the least affluent (poorest and poorer)
households (49.93%). Prevalence in children from middle-income households was 26.35%.
Prevalence was also lower in households that had a television and in those with non-improved
drinking water sources.
Most of the children lived in rural areas (72.6%). Of those with malaria, 87.72% lived in rural
areas. The highest prevalence of malaria was observed in the North-West and the North-Central
regions (35.88% and 19.41%, respectively). There were more cases of malaria (60.19%) in
Page 40
[Type text] Page 28
areas where there were no LLIN campaigns compared to areas where there were campaigns
(39.81%). There was significantly low prevalence of malaria in children living in households
that had been sprayed against mosquitoes in the last 12 months (0.72%).
Taking into account the clustering that is the weighted, the test statistics were slightly lower
and had higher p-values. However, the overall conclusions are similar. Children from the
households with no television had a significantly high prevalence of malaria (26.34%). There
was a decrease in the mean age in months of children with positive malaria. About (51.14%)
children under five years who reported no net in the household had the highest prevalence of
malaria in 2010. Areas for LLIN campaign were highly significant (p<0.0001) during the
normal chi-squared test, but when clustered adjusted chi-square test was used, it became non-
significant (p<0.0613). Source of drinking water and whether children under five slept under
mosquito bed net last night were not significant when adjusted for survey design effects
(p=0.1977) and (p=0.1880) respectively.
Page 41
[Type text] Page 29
Table 1: Description of children and households adjusting for survey design
Un-weighted Weighted
Variables
Malaria Positive Malaria Negative
X2 (p-value)
Malaria Positive Malaria Negative
P-value n=1958 (38.12%) n=3179 (61.88%) n=1958 (41.97%) n=3179 (58.03%)
Sex Male 1003(51.23%) 1599 (50.30)
0.4165 (0.519)
1003 (50.73) 1599 (50.38)
0.8501 Female 955 (48.77) 1580 (49.70) 955 (49.27) 1580 (49.62)
Child’s age (month) Mean +/-s.e 35.11 ±0.35 31.06 ±0.28 8.98 (<0.001) 34.96 ±0.33 30.88 ±0.33 <0.0001
Geopolitical Zones North-Central 433 (22.11) 454 (14.28)
139.106 (<0.0001)
433 (19.41) 454 (14.31)
0.0002
North- East 278 (14.20) 629 (19.79) 278 (11.07) 629 (18.07)
North- West 566 (28.91) 696 (21.89) 566 (35.88) 696 (27.86)
South- East 168 (8.58) 471 (14.82) 168 (5.09) 471 (9.77)
South-South 315 (16.09) 642 ( 20.2) 315 (12.01) 642 (18.20)
South West 198 (10.11) 287 (9.03) 198 (16.55) 287 (11.79)
Place of residence Urban 295 (15.07) 1113 (35.01)
242.253 (<0.0001)
295 (12.28) 1113 (30.49)
0.0001 Rural 1663 (84.93) 2066 (64.99) 1663 (87.72) 2066 (69.51)
Wealth Index Poorest 442 (22.57) 495 (15.57)
268.643 (< 0.0001)
442 (24.83) 495 (18.31)
0.0001
Poorer 450 (22.98) 507 (15.95) 450 (25.1) 507 (18.50)
Middle 513 (26.20) 644 (20.26) 513 (26.35) 644 (19.25)
Richer 391 (19.97) 746 (23.47) 391 (16.37) 746 (20.73)
Richest 162 (8.27) 787 (24.76) 162 (7.35) 787 (23.22)
Areas for LLIN campaign World Bank 426 (21.76) 899 (28.28) 30.104 (< 0.0001) 426 (18.66) 899 (27.11) 0.0613
Page 42
[Type text] Page 30
Un-weighted Weighted Areas with another campaign 393 (20.07) 528 (16.61) 393 (21.15) 528 (16.27) Areas with no campaign 1139 (58.17) 1752 (55.11) 1139 (60.19) 1752 (56.62)
Does child had fever last 2 weeks before survey No 1098 (56.08) 1971 (62)
22.7045 ( <0.0001)
1098 (54.84) 1971 (60.18)
0.0384
Yes 793 (40.50) 1079 (33.94) 793 (41.25) 1079 (35.54)
Missing 67 (3.42) 129 (4.06) 67 (3.91) 129 (4.28)
Dwelling sprayed against mosquito last 12 months. No 1928 (98.47) 3131 (98.49)
0.3138 (0.855)
1928 (98.72) 3131 (98.80)
0.6892
Yes 20 (1.02) 29 (0.91) 20 (0.72) 29 (0.80)
Missing 10 (0.51) 19 (0.6) 10 (0.57) 19 (0.40)
Children < 5 that slept under mosquito net last night No children 301 (15.37) 561 (17.65)
16.3833 (0.003)
301 (14.82) 561 (17.35)
0.188
All children 462 (23.60) 841 (26.45) 462 (22.21) 841 (25.54)
Some children 245 (12.51) 338 (10.63) 245 (11.36) 338 (10.29)
No net in household 942 (48.11) 1417 (44.57) 942 (51.14) 1417 (46.14)
Missing 8 (0.41) 22 (0.69) 8 (0.48) 22 (0.68)
Source of drinking water Improved 1374 (70.17) 2323 (73.07)
7.7345 (0.021)
1374 (67.88) 2323 (71.86)
0.1977
Non-improved 583 (29.78) 849 (26.71) 583 (32.06) 849 (27.86)
Missing 1 (0.05) 7 (0.22) 1 (1.00) 7 (0.27)
Television No 1377 (70.33) 1638 (51.53)
176.869 (< 0.0001)
1377 (73.43) 1638 (54.11)
0.0001
Yes 576 (29.42) 1524 (47.94) 576 (26.34) 1524 (45.39)
Missing 5 (0.26) 17 (0.53) 5 (0.23) 17 (0.50) Key: SE = Standard Error, X2= Chi-square
Page 43
[Type text] Page 31
3.2 Univariable analyses of the explanatory variables from survey weights adjustment.
The association between malaria and independent unadjusted variables were analysed, and the
results were shown in Table 2. The result showed that child’s age, place of residence,
geopolitical region, wealth index, areas for LLIN campaign, whether a child had a fever for
two weeks and possession of television had significant p-values. However, sex, dwelling
sprayed against mosquito in the last 12 months, children below 5years who slept under
mosquito a night before the survey and source of drinking water showed no association with
malaria.
Compared to children <12months, there was significantly increased odds of malaria as children
grow from month to month. Children from the older age group (48-59 months) had the highest
odds of malaria compared to children in age group <12months (OR 2.35, 95% CI 1.84-3.01)
while children from age group 12-23months had the lowest odds ratio (OR 1.39, 95% CI 1.13-
1.72).
The result also showed that the females had almost the same odds of malaria compared to males
(OR 0.99, 95% 0.85-1.14). Children who had a fever last two weeks before the survey were
more likely to have malaria compared to those children who did not have a fever last two weeks
before the study (OR 1.27, 95% CI 1.06-1.53).
The children who live in the rural area were three times more likely to have malaria compared
to those children that live in the urban area (OR 3.13, 95% CI 2.18-4.49). Compare to children
from the North-West, the odds of malaria were low among children from the South-East and
the North-East. The richest household children were less likely to have malaria compared to
children from the poorest households (OR 0.23, 95% CI 0.15-0.37).
Page 44
[Type text] Page 32
Table 2: Univariable analyses of the explanatory variables from survey weights adjustment
Categories and variables OR (95% CI) P-value Sex Male ref Female 0.99 (0.85,1.14) 0.850 Child’s age (months) <12 ref 12-23 1.39 (1.13, 1.72) 0.002 24-35 1.70 (1.36, 2.13) <0.0001 36-47 2.09 (1.68, 2.61) <0.0001 48-59 2.35 (1.84, 3.01) <0.0001 Geopolitical Zone North- West ref North- Central 1.05 (0.63,1.75) 0.841 North- East 0.48 (0.29,0.79) 0.004 South- East 0.40 (0.26,0.63) <0.0001 South -South 0.51 (0.32,0.83) 0.007 South West 1.09 (0.63,1.90) 0.761 Place of residence Urban ref Rural 3.13(2.18,4.49) <0.0001 Wealth Index Poorest ref Poorer 1.00 (0.71,1.42) 0.999 Middle 1.00 (0.67,1.51) 0.965 Richer 0.58 (0.39,0.85) 0.006 Richest 0.23 (0.15,0.37) <0.0001 Areas for LLIN campaign Areas with no campaign ref World Bank campaign 0.65 (0.43,0.97) 0.034 Does child had fever last 2 weeks before survey No ref Yes 1.27 (1.06,1.53) 0.009 Dwelling sprayed against mosquito last 12 months No ref Yes 0.89 (0.47,1.72) 0.741 Children < 5 that slept under mosquito net last night No children ref All children 1.02 (0.78,1.34) 0.897 Some children 1.29 (0.92,1.81) 0.132 No net in household 1.29 (0.96,1.75) 0.089 Source of drinking water Improved ref Non-improved 1.22(0.89-1.68) 0.220 Television No ref Yes 0.42 (0.33,0.54) <0.0001
Key: OR (Odds Ratio)
Page 45
[Type text] Page 33
Table 3.3 Multivariable analyses of factors associated with malaria from survey weights
adjustment and random effects.
The variables such as the age of a child, geopolitical zones, place of residence, wealth index
etc. that showed significant bivariate association with malaria were selected and included in
the multivariate analysis. Non-random effects models were fitted as well as the random effects
model to take into account the intercluster correlation among children within the clusters as
shown in Table 3. The result of the random effects model was discussed.
The results showed that child’s age, regions, place of residence, wealth index, television, had
fever two weeks and children <5years slept in the net a night before significantly increased the
odds ratio. The odds ratio for a place of residence was significantly decreased from 3.13 to
2.04. Children who live in the rural area had 2.04 odds of malaria compared to children who
live in the urban area (95% CI 1.49-2.79). The results also showed that possession of television
and children under five years that slept in bed net last night were not significantly associated
with malaria.
Page 46
[Type text] Page 34
Table 3: Multivariable analyses of factors associated with malaria
Category and variables Multivariable (non-random effects) Multivariable (random-effects)
AOR (95% CI) p-value AOR (95%CI) p-value
Sex Male ref ref
Female 0.97 (0.84,1.12) 0.672 0.91 (0.80,1.04) 0.162
Child’s age (months) <12 ref ref
12 23 1.40 (1.10,1.78) 0.007 1.27 (0.98,1.66) 0.073
24-35 1.86 (1.45,2.37) <0.0001 2.01(1.55,2.60) <0.0001
36-47 2.20 (1.73,2.81) <0.0001 2.27(1.76,2.94) <0.0001
48-59 2.49 (1.91,3.25) <0.0001 2.64(2.05,3.41) <0.0001
Geopolitical Zones North- West ref ref
North- Central 1.01 (0.60,1.70) 0.959 1.38 (0.82,2.35) 0.228
North- East 0.46 (0.29,0.75) 0.002 0.49 (0.29,0.84) 0.009
South- East 0.62 (0.38,1.02) 0.057 0.63 (0.36,1.10) 0.105
South –South 0.79 (0.49,1.29) 0.359 0.79 (0.47,1.37) 0.413
South- West 1.82 (1.08,3.08) 0.025 1.38 (0.77,2.50) 0.281
Place of Residence Urban ref ref
Rural 2.04 (1.49,2.79) <0.0001 3.05(2.09,4.44) <0.0001
Wealth Index Poorest ref ref
Poorer 0.84 (0.60,1.18) 0.315 1.04 (0.82,1.33) 0.730
Middle 0.89 (0.61,1.29) 0.537 1.08 (0.81,1.43) 0.596
Richer 0.69 (0.44,1.09) 0.112 0.91 (0.63,1.31) 0.622
Richest 0.30 (0.17,0.50) <0.0001 0.44(0.28,0.69) <0.0001
Does child had fever last 2 weeks No ref ref
Yes 1.37 (1.16,1.60) <0.0001 1.34(1.16,1.56) <0.0001 Children < 5years that slept under mosquito net last night No children ref All children 1.03 (0.78,1.36) 0.847 n/s
Some children 1.39 (1.03,1.89) 0.032 No net in household 1.17 (0.90,1.51) 0.233 Television No ref Yes 0.73 (0.58,0.92) 0.007 n/s AOR (Adjusted Odds Ratio), ref (Reference), n/s (Not Significant), CI (Confidence Interval)
ICC= 0.25 (95%CI 0.21-0.32)
Page 47
[Type text] Page 35
3.4: Spatial distribution of malaria in the geopolitical regions of Nigeria
The maps shown in figure 3 are choropleth maps showing the observed prevalence of malaria,
predicted prevalence and standard error of the mean of malaria in children less than five years
in different regions including their states in Nigeria in 2010. Adjusting for the states in the
geopolitical regions, the regions in red colours represent the hot spots which indicate that they
had the highest prevalence of malaria ranging from 0.42 to 0.72 in 2010. The regions in blue
colours had prevalences ranging between 0.10 and 0.31 represent the cold spots which are the
low malaria prevalence regions. There were also regions which showed moderate prevalence
(0.32-0.41). The observed map showed that the highest prevalence of malaria (0.42 to 0.72)
was found in the North-Central and North-West region of the country. The map showed low
prevalence for all the states in the South-East region. Most of the states in the South-West
region showed moderate case of malaria. The map of the predicted prevalence of malaria
showed overall similarity to the observed map. The difference was seen in Sokoto state where
the predicted prevalence was higher than the unadjusted.
The map of the standard error of mean showed in figure 3 shows the variability in the results
of unadjusted and adjusted maps. The map showed a low standard error in most of the states in
the North-West region which implies reduced variability. There was a high variability in the
results that were found in the North-Central region and some parts of the South-West region.
Page 48
[Type text] Page 36
Figure 5: Prevalence (Observed), Predicted Probability and Standard error mean of Malaria in Children under five years in Nigeria, 2010
(0.57,0.72](0.42,0.57](0.40,0.42](0.32,0.40](0.24,0.32][0.10,0.24]Missing
region levelmalaria prevalence in Nigeria in 2010
(0.56,0.70](0.42,0.56](0.38,0.42](0.31,0.38](0.24,0.31][0.15,0.24]Missing
region level
predicted probability of malaria in Nigeria in 2010
(0.02,0.04](0.02,0.02](0.01,0.02](0.01,0.01](0.01,0.01][0.01,0.01]Missing
regionstandard error mean of malaria in Nigeria in 2010
Nigeria,2010Malaria Morbidity
Page 49
[Type text] Page 37
CHAPTER 4
This chapter includes the discussion, the limitations and the strengths of this study. It also
includes the conclusion and the recommendations that were made based on the findings.
4.1 Discussion
This study estimated the prevalence, factors associated with malaria and the spatial distribution
of malaria in children less than five years in Nigeria in 2010. Malaria has been found as one of
the public health problems among children less than five years in Nigeria (33). It is important
to determine the factors associated with malaria and its spatial distribution at geopolitical zones
and also at the state level to help the policymakers to carry out proper interventions. The
findings of this study show that malaria is associated with the place of residence, geopolitical
zones, wealth, the age of a child and children with fever two weeks before the survey. The
study will be discussed under children’s variables and household variables as follows;
4.1.1 Children’s variables
The likelihood of malaria was less among younger children (age group <12 and 12-23 months)
and higher among the older age group (36-47 and 48-59 months) as was shown in this study.
The low likelihood in the younger age group may be as a result of the antibodies that children
acquire from their mothers during pregnancy and during exclusive breastfeeding which protects
them from diseases (32). It could also be due to use of LLINs because younger children tend
to sleep under bed nets. The study has also shown that the high risk in the older age group could
also be attributed to a nutrient deficiency which makes them vulnerable to malaria and other
communicable diseases (32). Malnutrition can increase the level of malaria morbidity and
mortality in children by weakening their immunity (28).
Page 50
[Type text] Page 38
Male children were found to have a high prevalence of malaria than their female counterpart
although the difference was not statistically significant. This agrees with the findings from
previous studies that were done in Nigeria and Ghana (5,32), which suggested biological
susceptibility to infectious diseases as the reason males have high prevalence of malaria.
Another study that was conducted in Nigeria also states that parental gender preference still
exists in some Nigeria communities which result in discriminatory practices against children
of less desired sex (53). Preference is giving to female children because of the supposed dowry
that the parents will get when they are getting married.
4.1.2 Household variables
Children from the households that were sprayed against mosquitoes were at lower risk of
malaria. This is as a result of indoor residual spray pilot project which was initiated by the
National Malaria Elimination Programme of Nigeria to combat malaria in 2006 and 2007 (8).
Areas that were covered during the LLIN campaign in Nigeria in 2010 have shown a protective
effect against malaria in this study. The campaigns were adopted during the 2009-2013
National Strategic Plan for Malaria Control (NSPMC) in Nigeria (8).
There were two phases of the campaign, the catch-up phase and the keep up phase. In the catch-
up phase, there were scaling up ownership of bed nets through the LLIN campaigns for
universal coverage while the keep-up phase is to maintain the coverage through the routine
distribution of LLINs. Households that had no net in the household showed a high prevalence
of malaria; this means that having LLINs and sleeping under it was protective against malaria.
The result agreed with other findings which reported that areas with high proportion of children
sleeping under bed nets had fewer cases of malaria (32,54).
Page 51
[Type text] Page 39
The children from the rural areas had more malaria cases compared to their urban counterpart.
This study showed that there was greater proportion of children in the rural areas than in the
urban areas. This study agrees with the evidence of informal settlement in Nigeria. The result
showed that almost three-quarters of the people live in the rural areas (53). The high risk in
rural area was associated with poor knowledge and perception of malaria control among people
living in the rural areas compared to those from the urban areas (55). The high risk of malaria
could also be related to poor access to treatment as well as poor access to IRS and LLINs in
hard to reach areas for distribution (42). Also, a similar study in Ghana also showed a high
prevalence of malaria in rural areas compared to the urban areas (32).
Other studies have shown malaria as a disease of the poor (29,33), the findings of this study
complement with their findings. The risk of malaria was high among children from the poor
households. In other words, it is believed that there is a correlation between poverty and place
of residence; mostly poor people live in the rural areas. Ownership of television and source of
drinking water were not associated with malaria in this study. Other risk factors like education
level, availability of electricity, main floor material and main wall material which could not be
included in this study were found to be associated with a child’s malaria status (27).
A greater proportion of children from the Northern Nigeria live in the rural areas where the
risk of malaria is high. This is an evidence of geographical variation in the malaria distribution
in Nigeria. The high prevalence of malaria in the North-Central and North-West regions has
been linked to shallow rainfall in those regions which provide suitable breeding conditions for
the mosquitoes (5). Heavy rainfall flushes away and kills the parasite larva (28). In a similar
study that was conducted in Nigeria on regional analyses of fever, the study showed that fever
is more prevalent in the North Central Nigeria and fever is associated with malaria (33). This
Page 52
[Type text] Page 40
agrees with the findings of this study which shows that children that had fever had a high
prevalence of malaria. A study also shows that children from the Northern part of the country
were found to be associated with low haemoglobin as the study has shown a strong correlation
between low haemoglobin and malaria (53). However, there is a low prevalence of malaria in
the South-East region and some states in the North-West region. The low prevalence could be
attributable to LLINs coverage in those regions during LLIN campaign (8). This study,
therefore, confirms the variation in the geographical distribution of malaria in under five
children.
4.2 Limitations
This study has several limitations. There are limitations that are related to the use of secondary
data. The available data were not collected to address the research question of this study or to
test the hypothesis. For example, the data for the spatial aspect of the study was sourced from
a different website. It is common that some important third variables such as mothers education
were not available for the analysis which could have explained the relationship between
mothers illiteracy and malaria (56). There may have been measurement errors during the survey
which include- error from the questionnaire, data collection mode, the interviewer and the
respondent (57). For the fact that household characteristics such as wealth index and other
information were self-reported, there is a tendency of incorrect recall which could result in
misclassification bias. There is a possibility that not all malaria cases were confirmed by either
microscopy or RDT. The two tests microscopy and RDT have limited sensitivity and specificity
because they cannot detect sub patent malaria parasite threshold in the blood sample (58). There
is a possibility of underestimation of malaria prevalence because of lack of accessibility to
some clusters due to the insurgency in some parts of the Northern Nigeria during the survey.
Page 53
[Type text] Page 41
4.3 Strengths
Despite the study limitations, it also has some strength. The 2010 NMIS was the first of its kind
in Nigeria. It provides the malaria prevalence baseline rate that can be compared to subsequent
zonal and national prevalence estimates which are used to measure the progress aimed at
reducing the malaria prevalence in Nigeria. Multiple regression models taking into account
non-spatial (cluster) random effects were used to control for confounding variables. After
adjusting for the random effects, the narrower confidence intervals were obtained.
4.4 Conclusions
Although efforts have been made towards the control of malaria in Nigeria, the prevalence is
still high. Rural settlements have contributed immensely to the heightened risk of malaria
among the Nigerian children. It was also found that LLINs campaign was a good measure in
the malaria control programme and it should be expanded to the rural communities. The study
shows that there is a variation in the spatial distribution of malaria in Nigerian regions and the
prevalence was high in the North-West, North-Central and the South-West regions. It was also
found that poverty is a major determinant factor that is associated with malaria; effort should
be made to alleviate poverty in the country to eliminate malaria prevalence.
4.5 Recommendations
There must be targeted interventions in disease prevention programs and more concentration
on the areas with higher prevalence. It will help to maximise the use of limited or available
resources in the fight against the elimination of malaria. There is also need for the policymakers
to increase the awareness of LLINs use and IRS as they have shown a protective effect against
malaria. In designing malaria control and intervention strategy, efforts should be made to reach
the communities and at individual levels to empower the target population so to improve their
Page 54
[Type text] Page 42
socioeconomic status; this will help to reduce the prevalence of malaria. The government
should also explore dimension which includes vaccine development through increased research
funding, evidence based policy formulation and implementation, increased environmental and
public health education, integration of the communities towards malaria control and primary
health care activities. Mapping the distribution of malaria is a good approach in identifying
areas with high risk which will guide the policymakers to target the interventions to where they
are most needed. More risk factors like mother’s education level, availability of electricity,
main floor material and main wall material, altitude and rainfall should be included in other
studies.
Page 55
[Type text] Page 43
References
1. Krefis AC, Schwarz NG, Nkrumah B, Acquah S, Loag W, Sarpong N, et al. Principal
component analysis of socioeconomic factors and their association with malaria in
children from the Ashanti Region, Ghana. Malar J. 2010;9(201):1–7.
2. Carrington A. Malaria: Its Human Impact, Challenges, and Control Strategies in
Nigeria. Harvard Heal Policy Rev. 2001;2(2).
3. BM. G. Malaria. Lancet. 2014;365(9469):1487–98.
4. Dawaki S, Mekhlafi H, Ithoi I, Ibrahim J, Atroosh WM, Abdulsalam AM, et al. Is
Nigeria winning the battle against malaria ? Prevalence , risk factors and KAP
assessment among Hausa communities in Kano State. Malar J. 2016;15(351):1–14.
5. Adigun AB, Gajere EN, Oresanya O, Vounatsou P. Malaria risk in Nigeria: Bayesian
geostatistical modelling of 2010 malaria indicator survey data. Malar J.
2015;14(156):1–8.
6. World Malaria Report. World Heal Organ [Internet]. 2008 [cited 2016 Nov 20];3.
Available from:
www.who.int/malaria/publications/atoz/9789241563697/en/index.html
7. Andrew O. An assesment of the spatial pattern of malaria infection in Nigeria. Int J
Med Med Sci. 2014;6(2):80–6.
8. Malaria Indicator Survey. National Population Commission (NPC) [Nigeria], National
Malaria Control Programme (NMCP) [Nigeria], and ICF International. 2012. Nigeria
Malaria Indicator Survey 2010. Abuja, Nigeria: NPC, NMCP, and ICF. Abuja,
Nigeria;
9. Onyeneho NG, Idemili-aronu N, Igwe I, Iremeka FU. Perception and attitudes towards
preventives of malaria infection during pregnancy in Enugu State , Nigeria. J Heal
Popul Nutr. 2015;33(22):1–10.
Page 56
[Type text] Page 44
10. Dan Dan E. Modelling and Forecasting Malaria Mortality Rate using SARIMA
Models (A Case Study of Aboh Mbaise General Hospital, Imo State Nigeria). Sci J
Appl Math Stat. 2014;2(1):31.
11. Onyiri N. Estimating malaria burden in Nigeria: A geostatistical modelling approach.
Geospat Health. 2015;10(306):163–70.
12. Alemu K, Worku A, Berhane Y. Malaria infection has spatial, temporal, and
spatiotemporal heterogeneity in unstable malaria transmission areas in northwest
ethiopia. PLoS One. 2013;8(11):1–10.
13. Oluwafem OA, Babatimehin OI, Oluwadare TS, MahmudUM. Mapping malaria case
event and factors of vulnerability to malaria in Ile- ife, southwestern Nigeria: using
GIS . Ethiop J Environ Stud Manag. 2013;6(4):365–75.
14. Hanafi-Bojd AA, Vatandoost H, Oshaghi MA, Charrahy Z, Haghdoost AA, Zamani G,
et al. Spatial analysis and mapping of malaria risk in an endemic area, south of Iran: A
GIS based decision making for planning of control. Acta Trop. 2012;122(1):132–7.
15. Centers for Disease, Control and prevention. Malaria [Internet]. Available from:
https://www.cdc.gov/malaria/about/biology/index.html
16. WHO. Guidelines for the Treatment of Malaria. [Internet]. Available from:
who.int/iris/bitstream/10665/162441/1/9789241549127_eng.pdf?ua=1&ua=1
17. Meeting S, Headquarters WHO, Introduction C. WHO Evidence Review Group :
Malaria Burden Estimation. 2013;(January):22–4.
18. Ikpeze I, Ugbor I. Investigation of Malaria Prevalence and Health Outcome in Nigeria.
IOSR J Humanit Soc Sci. 2015;20(1):79–84.
19. Uthman OA, Aiyedun V, Yahaya I. Exploring variations in under-5 mortality in
Nigeria using league table , control chart and spatial analysis. J Public Health
(Bangkok). 2011;34(1):125–30.
Page 57
[Type text] Page 45
20. Steketee RW, Campbell CC. Impact of national malaria control scale-up programmes
in Africa: magnitude and attribution of effects. Malar J. 2010;9(1):299.
21. Federal Ministry of Health. (2008). Malaria situation analysis. Nigeria Strategic Plan
2009-2013: A Road Map for Malaria Control in Nigeria, (June 2008), 12. Retrieved
from. Malar Situat Anal. 2013;(June 2008):1–39.
22. Efunshile M, Amoo AOJ, Akintunde GB, Ojelekan OD, König W, König B. Use and
Effects of Malaria Control Measures in Pregnancy in Lagos , Nigeria. 2011;49(4):365–
71.
23. Jimoh A, Sofola O, Petu A, Okorosobo T. Quantifying the economic burden of malaria
in Nigeria using the willingness to pay approach. Cost Eff Resour Alloc. 2007;5:1–8.
24. Noor AM, Kinyoki DK, Mundia CW, Kabaria CW, Mutua JW, Alegana VA, et al. The
changing risk of Plasmodium falciparum malaria infection in Africa: 2000-10: A
spatial and temporal analysis of transmission intensity. Lancet. 2014;383(9930):1739–
47.
25. Meara WPO, Mangeni JN, Steketee R, Greenwood B. Changes in the burden of
malaria in sub-Saharan Africa. Lancet Infect Dis. 2010;10(8):545–55.
26. Protopopoff N, Van Bortel W, Speybroeck N, Van Geertruyden JP, Baza D,
D’Alessandro U, et al. Ranking malaria risk factors to guide malaria control efforts in
African highlands. PLoS One. 2009;4(11):1–10.
27. Roberts D, Matthews G. Risk factors of malaria in children under the age of five years
old in Uganda. Malar J [Internet]. 2016;15(1):246. Available from:
http://malariajournal.biomedcentral.com/articles/10.1186/s12936-016-1290-x
28. Protopopoff N, Van Bortel W, Speybroeck N, Van Geertruyden JP, Baza D,
D’Alessandro U, et al. Ranking malaria risk factors to guide malaria control efforts in
African highlands. PLoS One. 2009;4(11):1–10.
Page 58
[Type text] Page 46
29. Chitunhu S, Musenge E. Spatial and socio-economic effects on malaria morbidity in
children under 5 years in Malawi in 2012. Spat Spatiotemporal Epidemiol.
2016;16:21–33.
30. Zgambo M, Mbakaya BC, Kalembo FW. Prevalence and factors associated with
malaria parasitaemia in children under the age of five years in Malawi: A comparison
study of the 2012 and 2014 Malaria Indicator Surveys (MISs). PLoS One.
2017;12(4):1–13.
31. Length F. An assessment of malaria risk in Koton Karfe watershed catchment ,
Nigeria. J Geogr Reg Plan. 2009;2(3):55–61.
32. Nyarko SH, Cobblah A. Sociodemographic Determinants of Malaria among Under-
Five Children in Ghana. Malar Res Treat. 2014;2014.
33. Yusuf OB, Adeoye BW, Oladepo OO, Peters DH, Bishai D. Poverty and fever
vulnerability in Nigeria : a multilevel analysis. Malar J. 2010;9(235):2–7.
34. Somi MF, Butler JRG, Vahid F, Njau J, Kachur SP, Abdulla S. Is There Evidence for
Dual Causation Between Malaria and Socioeconomic Status ? Findings From Rural
Tanzania. Am J Trop Med Hyg. 2007;77(6):1020–7.
35. Tadesse F, Fogarty AW, Deressa W. Prevalence and associated risk factors of malaria
among adults in East Shewa Zone of Oromia Regional State, Ethiopia: a cross-
sectional study. BMC Public Health. 2018 Dec 17;18(1):25.
36. Sowunmi A FB. Plasmodium falciparum gametocytaemia in Nigerian children: before,
during and after treatment with antimalarial drugs. Trop Med Int Heal. 2003;8(9):783–
92.
37. Trape JF. The public health impact of chloroquine resistance in Africa. Am J Trop
Med Hyg. 2001;64:1–2.
38. Lindsay SW, Martens WJM. Malaria in the African highlands: Past, present and future.
Page 59
[Type text] Page 47
Bull World Health Organ. 1998;76(1):33–45.
39. Weli V. Climate and Epidemiology of Malaria in Port. Am J Clim Chang. 2015;4:40–
7.
40. Efe SI, Ojoh CO. Spatial distribution of malaria in Warri metropolis. Open J
Epidemiol. 2013;(3):118–24.
41. Kreuels B, Kobbe R, Adjei S, Kreuzberg C, von Reden C, Bäter K, et al. Spatial
Variation of Malaria Incidence in Young Children from a Geographically
Homogeneous Area with High Endemicity. J Infect Dis. 2008;197(1):85–93.
42. Chukwuocha UM. Malaria Control in Nigeria. Prim Heal Care Open Access.
2012;2(3):1–4.
43. Federal Ministry of Health. National Guideline for Diagnosis and Treatment of
Malaria. 2011.
44. Oleribe, OS, Taylor-Robinson S. Before Sustainable Development Goals (SDG): why
Nigeria failed to achieve the Millennium Development Goals (MDGs). Pan Afr Med J.
2016;8688(24):1–4.
45. Whitehead Adewale Maja-Pearce and Eleanor. FACTSHEET: Nigeria’s Population
Figures. 2014.
46. Hemming K and Marsh J. Stata ado-file st02862: A menu-driven facility for sample-
size calculations in cluster randomized controlled trials. Stata J. 14AD;701(3):114–35.
47. Survey S RD. Stata Survey Data Reference Manual. Stata Press Publication. 2007;
48. Rutstein SO. Steps to construct new DHS Wealth Index. USAID, Demography. 2015;
49. Water sanitation hygiene. WHO/UNICEF joint monitoring report. 2012.
50. Flynn TN. Design and Analysis of Cluster Randomization Trials in Health Research.
Int J Epidemiol. 2001 Apr;30(2):407–8.
51. GADM database of Global Administrative Areas [Internet]. [cited 2017 Jul 1].
Page 60
[Type text] Page 48
Available from: http://www.gadm.org
52. Pisati M. SPMAP. Stata module to visualize spatial data. 2008.
53. Gayawan E, Arogundade ED, Adebayo SB. Possible determinants and spatial patterns
of anaemia among young children in Nigeria : a Bayesian semi-parametric modelling.
Int Health. 2014;6(January):35–45.
54. Lengeler C, Snow RW. Reviews / Analyses From efficacy to effectiveness :
insecticide-treated bednets in Africa. Bull World Heal Organ. 1996;74(5):325–32.
55. Gayawan E, Arogundade ED, Adebayo SB. A Bayesian multinomial modeling of
spatial pattern of co-morbidity of malaria and non-malarial febrile illness among
young children in Nigeria. Trans R Soc Trop Med Hyg. 2014;108(May):415–24.
56. Cheng HG, Phillips MR. Secondary analysis of existing data: opportunities and
implementation. Shanghai Arch Psychiatry. 2014;26(6):371–5.
57. Kasprzyk D. Ch. Household Sample Surveys in Developing and Transition Countries.
2005.
58. Kamuliwo M, Kirk KE, Chanda E, Elbadry MA, Lubinda J. Spatial patterns and
determinants of malaria infection during pregnancy in Zambia. Trans R Soc Trop Med
Hyg. 2015;109(July):514–21.
Page 61
[Type text] Page 49
Appendix 1: Plagiarism Declaration form
PLAGIARISM DECLARATION TO BE SIGNED BY ALL HIGHER DEGREE STUDENTS
SENATE PLAGIARISM POLICY: APPENDIX ONE
I LOVELYN UZOMA OZOUGWU (Student number: 1226801) am a student
Registered for the degree of MSC EPIDEMIOLOGY AND INFECTIOUS DISEASES in the academic year 2016.
I hereby declare the following:
I am aware that plagiarism (the use of someone else’s work without their permission
and/or without acknowledging the original source) is wrong.
I confirm that the work submitted for assessment for the above degree is my own unaided
work except where I have explicitly indicated otherwise.
I have followed the required conventions in referencing the thoughts and ideas of others. I understand that the University of the Witwatersrand may take disciplinary action against
me if there is a belief that this is not my own unaided work or that I have failed to
acknowledge the source of the ideas or words in my writing.
Signature: _________________________ Date: March 2018
Page 62
[Type text] Page 50
Appendix 2: Ethics Clearance Certificate
Page 63
[Type text] Page 51
Appendix 3: Change of Title Approval
Private Bag 3 Wits, 2050 Fax: 027117172119 Tel: 02711 7172076
Reference: Mrs Sandra Benn E-mail: [email protected]
23 August 2017 Ms LU Ozougwu Person No: 1226801 C/O Engr Jude Okafor TAA Department of Town& reginal Planning University of Johannesburg 2028 South Africa
Dear Ms Ozougwu
Master of Science in Epidemiology: Change of title of research I am pleased to inform you that the following change in the title of your Research Report for the degree of Master of Science in Epidemiology has been approved: From: Spatial analysis of Malaria in Nigeria in 2010
To: Sociodemographic charecteristics and spatial distribution of
Malaria in Nigerian children Yours sincerely Mrs Sandra Benn Faculty Registrar Faculty of Health Sciences