111
Socioeconomic Analysis of RRR Business Models, Hanoi City Report Resource Recovery and Reuse (RRR) Project 2015

Socioeconomic Analysis
of RRR Business Models,
Hanoi City Report
Resource Recovery and Reuse (RRR)
Project
2015

i
Authors: Taron, A. a,b and K. Basuc Correspondence: M. Otooa
a International Water Management Institute b Tata Institute of Social Science c Independent consultant
Supported by:

ii
Contents
LIST OF TABLES ..................................................................................................................................................... IV
LIST OF FIGURES ..................................................................................................................................................... V
INTRODUCTION ..................................................................................................................................................... 7
METHODOLOGY ............................................................................................................................................................. 8 OVERALL APPROACH OF THE SOCIOECONOMIC ASSESSMENT: DEFINING THE SYSTEM BOUNDARY OF THE MODELS .............................. 9 SYNOPSIS OF THE SOCIOECONOMIC ASSESSMENT OF THE RRR BUSINESS MODELS ...................................................................... 12 SUMMARY ASSESSMENT OF FINANCIAL FEASIBILITY OF RRR BUSINESS MODELS ........................................................................ 14
SOCIO-ECONOMIC IMPACT ASSESSMENT OF DRY FUEL MANUFACTURING (AGRO-INDUSTRIAL WASTE TO
BRIQUETTES) BUSINESS MODEL IN VIETNAM ...................................................................................................... 18
INTRODUCTION ............................................................................................................................................................ 18 TECHNOLOGICAL OPTIONS FOR BRIQUETTE BUSINESS ........................................................................................................... 18 OVERALL APPROACH TO SOCIOECONOMIC IMPACT ASSESSMENT............................................................................................. 20 ENVIRONMENTAL IMPACT ASSESSMENT ............................................................................................................................ 21 SOCIAL IMPACTS ........................................................................................................................................................... 25 FINANCIAL ANALYSIS ..................................................................................................................................................... 27 SOCIO-ECONOMIC RESULTS ............................................................................................................................................ 29 SENSITIVITY ANALYSIS ................................................................................................................................................... 29 CONCLUSION ............................................................................................................................................................... 30
SOCIO-ECONOMIC IMPACT ASSESSMENT OF ENERGY SERVICE COMPANIES AT SCALE (AGRO-WASTE TO ENERGY -
ELECTRICITY) BUSINESS MODEL IN VIETNAM ....................................................................................................... 32
INTRODUCTION ............................................................................................................................................................ 32 TECHNOLOGY DESCRIPTION ............................................................................................................................................ 32 OVERALL APPROACH TO SOCIOECONOMIC ANALYSIS ............................................................................................................ 34 ENVIRONMENTAL IMPACT ASSESSMENT ............................................................................................................................ 34 SOCIAL IMPACTS ........................................................................................................................................................... 38 FINANCIAL ANALYSIS ..................................................................................................................................................... 39 SOCIOECONOMIC RESULTS.............................................................................................................................................. 42 SENSITIVITY ANALYSIS .................................................................................................................................................... 42 CONCLUSION ............................................................................................................................................................... 43
SOCIO-ECONOMIC IMPACT ASSESSMENT OF MANURE TO POWER BUSINESS MODEL IN HANOI ......................... 45
INTRODUCTION ............................................................................................................................................................ 45 TECHNOLOGY .............................................................................................................................................................. 45 OVERALL APPROACH TO SOCIOECONOMIC IMPACT ASSESSMENT............................................................................................. 46 ENVIRONMENTAL IMPACT ASSESSMENT ............................................................................................................................ 47 SOCIAL IMPACTS ........................................................................................................................................................... 49 FINANCIAL ANALYSIS ..................................................................................................................................................... 49 SOCIO-ECONOMIC RESULTS ............................................................................................................................................ 52 SENSITIVITY ANALYSIS ................................................................................................................................................... 52 CONCLUSION ............................................................................................................................................................... 53

iii
SOCIO-ECONOMIC ANALYSIS FOR BEYOND COST RECOVERY – AN AQUACULTURE EXAMPLE BUSINESSES IN
HANOI ................................................................................................................................................................. 55
INTRODUCTION ............................................................................................................................................................ 55 TECHNOLOGICAL DESCRIPTION OF TREATING WASTEWATER ................................................................................................... 55 OVERALL APPROACH TO SOCIO-ECONOMIC IMPACT ASSESSMENT ........................................................................................... 55 ENVIRONMENTAL IMPACT ASSESSMENT ............................................................................................................................ 56 SOCIAL IMPACT ASSESSMENT .......................................................................................................................................... 56 FINANCIAL ANALYSIS ..................................................................................................................................................... 58 SOCIO-ECONOMIC RESULTS ............................................................................................................................................ 60 SENSITIVITY ANALYSIS ................................................................................................................................................... 60 CONCLUSION ............................................................................................................................................................... 61
SOCIO-ECONOMIC IMPACT ASSESSMENT OF COST SAVINGS AND RECOVERY BUSINESSES IN HANOI .................. 63
INTRODUCTION ............................................................................................................................................................ 63 TECHNOLOGY DESCRIPTION ............................................................................................................................................ 64 OVERALL APPROACH TO SOCIOECONOMIC ANALYSIS ............................................................................................................ 64 ENVIRONMENTAL IMPACT ASSESSMENT ............................................................................................................................ 65 SOCIAL IMPACTS ........................................................................................................................................................... 66 FINANCIAL ANALYSIS ..................................................................................................................................................... 67 SOCIOECONOMIC RESULTS.............................................................................................................................................. 70 SENSITIVITY ANALYSIS .................................................................................................................................................... 70 CONCLUSION ............................................................................................................................................................... 71
SOCIO-ECONOMIC IMPACT ASSESSMENT OF LARGE SCALE COMPOSTING FOR REVENUE GENERATION IN HANOI
............................................................................................................................................................................ 73
INTRODUCTION ............................................................................................................................................................ 73 TECHNOLOGICAL DESCRIPTION FOR LARGE SCALE COMPOSTING FROM MSW .......................................................................... 73 OVERALL APPROACH TO SOCIO-ECONOMIC IMPACT ASSESSMENT ........................................................................................... 74 ENVIRONMENTAL IMPACT ASSESSMENT ............................................................................................................................ 74 SOCIAL IMPACT ASSESSMENT .......................................................................................................................................... 75 FINANCIAL ANALYSIS ..................................................................................................................................................... 77 SOCIOECONOMIC ASSESSMENT OF THE BUSINESS MODEL ..................................................................................................... 79 SENSITIVITY ANALYSIS ................................................................................................................................................... 79 CONCLUSION ............................................................................................................................................................... 80
SOCIO-ECONOMIC IMPACT ASSESSMENT OF SUBSIDY-FREE COMMUNITY BASED COMPOSTING BUSINESS MODEL
IN HANOI ............................................................................................................................................................. 82
INTRODUCTION ............................................................................................................................................................ 82 TECHNOLOGICAL DESCRIPTION FOR DECENTRALIZED COMPOSTING FROM MSW ...................................................................... 82 OVERALL APPROACH TO SOCIO-ECONOMIC IMPACT ASSESSMENT ........................................................................................... 83 FINANCIAL ANALYSIS ..................................................................................................................................................... 87 SOCIOECONOMIC ANALYSIS ............................................................................................................................................ 90 SENSITIVITY ANALYSIS ................................................................................................................................................... 90 CONCLUSION ............................................................................................................................................................... 91
SOCIO-ECONOMIC IMPACT ASSESSMENT OF HIGH VALUE FERTILIZER PRODUCTION FOR PROFIT ....................... 93
INTRODUCTION ............................................................................................................................................................ 93 TECHNOLOGICAL DESCRIPTION OF FORTIFIER PRODUCTION USING MUNICIPAL SOLID WASTE AND FAECAL SLUDGE............................. 93 OVERALL APPROACH TO SOCIO-ECONOMIC IMPACT ASSESSMENT ........................................................................................... 94

iv
ENVIRONMENTAL IMPACT .............................................................................................................................................. 94 ECONOMIC IMPACT ...................................................................................................................................................... 96 SOCIAL IMPACT ASSESSMENT .......................................................................................................................................... 98 SOCIOECONOMIC ANALYSIS ............................................................................................................................................ 99 SENSITIVITY ANALYSIS .................................................................................................................................................... 99 CONCLUSION ............................................................................................................................................................. 101
REFERENCES ....................................................................................................................................................... 102
WEBSITES ACCESSED AND OTHER RESOURCES:.................................................................................................. 109
List of Tables
Table 1: Selected RRR Business Models for Hanoi ........................................................................................ 7
Table 2: Baseline and Alternative Scenarios used for the Socioeconomic Assessment for the different
Business Models.......................................................................................................................................... 10
Table 3 Energy Business Models ................................................................................................................. 12
Table 4 Wastewater Reuse Business Models ............................................................................................. 13
Table 5 Nutrient Business Model ................................................................................................................ 13
Table 6: Feasibility Ranking Methodology .................................................................................................. 14
Table 7: Synopsis of Socioeconomic Feasibility RRR Business Models ....................................................... 15
Table 8: Agricultural residues available and their ash content in Hanoi .................................................... 18
Table 9: Emission factors for open burning of agricultural residue under baseline ................................... 22
Table 10: CO2 emissions from transportation of agro-residue to briquette plant..................................... 22
Table 11: Emission factors from combustion of firewood and briquette................................................... 23
Table 12: Emission savings from avoided firewood use and agro-residue burning per 1 kg of briquette . 24
Table 13: Environmental emissions from the production and use of 1 kg of briquette ............................. 24
Table 14: Annual value of GHG emission reduction from briquette business (4,000 tons) ....................... 25
Table 15: Savings to end users from using briquettes ................................................................................ 26
Table 16: Financial results of briquette business (USD) ............................................................................. 28
Table 17: Net socio-economic results of dry fuel manufacturing business ................................................ 29
Table 18: Variables used in the stochastic analysis of the Briquette business model ................................ 30
Table 19: GHG emissions associated with kerosene use and diesel generators under baseline ............... 35
Table 20: Emission factors for open burning of agricultural residue under baseline ................................. 36
Table 21: CO2 emissions from gasification plant (transportation of agro-waste and gasification) ............ 36
Table 22: Emission savings per kWh of electricity generated by ESCO model ........................................... 37
Table 23: GHG emissions per kwh of electricity generated under ESCO model (kg CO2-eq/kwh) ............ 38
Table 24: Annual value of GHG emission reduction from ESCO model (120 KW) ...................................... 38
Table 25: General information on alternative energy use .......................................................................... 39
Table 26: Financial results of ESCO model (USD) ........................................................................................ 41
Table 27: Net socio-economic results of ESCO model ................................................................................ 42
Table 28: Table indicating the stochastic variables for the ESCO model .................................................... 43
Table 29: Major companies rearing animals in per-urban Hanoi ............................................................... 46
Table 30: Chemical composition of Pig slurry ............................................................................................. 47
Table 31: Components of ground and Surface water pollution in pig slurry .............................................. 48

v
Table 32: GHG emissions avoided due to production of electricity from pig slurry ................................... 48
Table 33: Net social gain under alternative scenario.................................................................................. 49
Table 34: Financial results of power capturing from pig slurry (USD) ........................................................ 51
Table 35: Net socio-economic results of power capturing from pig slurry ................................................ 52
Table 36: Variables selected for the stochastic model - Livestock waste to electricity.............................. 52
Table 37: Surface water pollution due to wastewater - environmental value of pollution ....................... 56
Table 38: Capacity of the treatment plant in different places of Hanoi ..................................................... 56
Table 39: Required number of ponds of different size at different places................................................. 57
Table 40: Employment Generated .............................................................................................................. 57
Table 41: Consolidated Financial Analysis of Phyto-remediative wastewater treatment ponds ............... 59
Table 42: Net socio-economic results ......................................................................................................... 60
Table 43: Selected variables for the stochastic analysis of the business model ........................................ 60
Table 44: Environmental costs of the undesirable outputs ........................................................................ 65
Table 45: Estimation of the potential environmental impacts ................................................................... 66
Table 46: Capital cost of reuse components in Wastewater treatment plant ........................................... 67
Table 47: Financial results of Wastewater Treatment and cost savings model (USD) ............................... 69
Table 48: Net socio-economic results of Wastewater treatment plant model .......................................... 70
Table 49: Selected variables for the stochastic analysis ............................................................................. 70
Table 50: Estimation of the net Environmental Impacts of large scale composting .................................. 75
Table 51: Financial results of Large Scale Centralized Compost Business Model (USD)............................. 78
Table 52: Net socio-economic results of Large-Scale Compost model ...................................................... 79
Table 53: Selected variables for stochastic analysis ................................................................................... 79
Table 54: Value of Net GHG emissions in introducing decentralized collection and composting of MSW 84
Table 55: Estimation of the environmental benefits due to utilization of MSW for producing compost .. 85
Table 56: Calculations showing the labour requirement for collection of waste ....................................... 86
Table 57: Financial of the co-operative for decentralized composting ...................................................... 88
Table 58: Financial of the business entity linked with the co-operatives for decentralized composting .. 89
Table 59: Socio-economic analysis of the decentralized business model .................................................. 90
Table 60: Selected variables for the stochastic analysis of the decentralized model ................................ 90
Table 61: Environmental costs of the undesirable outputs ........................................................................ 95
Table 62: Financial Analysis of the Fortifier business ................................................................................. 97
Table 63: Societal benefits of the fortifer business .................................................................................... 98
Table 64: Socio-economic analysis of the fortifier business ....................................................................... 99
Table 65: Selected variables for the stochastic model ............................................................................. 100
List of Figures
Figure 1: Process diagram of briquetting .................................................................................................... 19
Figure 2: Probability Density of NPV of briquette business in Hanoi ......................................................... 30
Figure 3: Process diagram of gasification ................................................................................................... 34
Figure 4: Probability density function of the NPV for ESCO model ............................................................ 43
Figure 5: Probability Density function of the NPV for net benefits derived from the electricity generation
form Livestock manure ............................................................................................................................... 53

vi
Figure 6: The probability distribution of the NPV of the net benefits derived from wastewater
aquaculture ................................................................................................................................................. 61
Figure 7: Probability Density Function of the NPV derived for Wastewater treatment and cost savings
business model ........................................................................................................................................... 71
Figure 8: Probability density function of the NPV of large scale composting ............................................ 80
Figure 9: Probability density function of the NPV derived for the decentralized model ........................... 91
Figure 10: Probability density function of the NPV for the fortifer model ............................................... 100
Data used in the analysis is from 2013 and 2014.
Denomination: 1 USD = 1 USD (2014);
1 USD = 21,400 Vietnamese Dong
VND: Vietnamese Dong

7
Introduction
The report presents the socioeconomic assessment of the selected RRR business models. The socioeconomic assessment acts as a decision making tool for determining the feasibility of the business model from a societal perspective. It incorporates all the costs and benefits of the potential impacts accruing from the economic, social, health and environmental considerations. Therefore this primarily involves the derivation of the monetary values of the direct and indirect, positive and negative effects from the implementation of the business model. A comprehensive socioeconomic assessment determines whether the all the benefits of a particular business model outweigh its costs and thus supports in making decision. In this report the following business models had been assessed as shown in Table 1. Table 1: Selected RRR Business Models for Hanoi
RRR Business Models Brief Description
ENERGY
Model 1A:Dry Fuel Manufacturing - Agro-industrial Waste to Briquettes
The business processes crop residues like wheat stalk, rice husk, maize stalk, groundnut shells, coffee husks, saw dust etc. and convert them into briquettes as fuel to be used in households, large institutions and small and medium energy intensive industries.
Model 2A:Energy Service Companies at Scale - Agro-Waste to Energy (Electricity)
The business processes crop residues like wheat stalk, rice husk, maize stalk, groundnut shells, coffee husks, saw dust etc. to generate electricity which is be sold to households, business or local electricity authority.
Model 6:Manure to Power
This business model can be initiated either by livestock processing factories such as meat or diary processing factories or by small, medium and commercial-sized livestock farms to utilize livestock waste to produce off-grid power for rural electrification with the support of regional government and NGOs. The business model can be commissioned by regional government in villages where there is no access or limited access to the national electricity grid and where the community’s primary economic activity is livestock farming.
WASTEWATER REUSE
Model 8: Beyond cost Recovery: the Aquaculture example
The business concept is to cultivate aquaculture while treating wastewater generated from the city. The process of treating wastewater is through cultivation of duckweed. The treated wastewater and duckweed as fish feed is used to cultivate fish
Model 9: On Cost Savings and Recovery
The business concept is to treat wastewater for safe reuse in agriculture, forestry, golf courses, plantations, energy crops, and industrial applications such as cooling plant. The sludge from the treatment plant could be used as compost and soil ameliorant and energy generated can be used for internal purpose resulting in energy savings.
NUTRIENTS
Model 15: Large-Scale Composting for Revenue Generation
The business concept is to better manage Municipal Solid Waste (MSW) (service) and recover valuable nutrients (products) from the waste that would otherwise be unmanaged and disposed on streets and landfills without reuse. Compost from MSW is sold to farmers, landscaping, and plantations and so on.

8
Model 16: Subsidy-free community based composting
The business concept is similar to Large-Scale composting for revenue generation except that the operation of the business model is at smaller scale and requires subsidy to make it viable.
Model 17:High value Fertilizer Production for Profit
Similar to Model 15 in concept but in addition to MSW, the business uses fecal sludge from onsite sanitation which is rich in nutrients as input. The business also develops enriched compost and pelletized compost which has higher nutrient content with improved and efficient delivery of nutrient to crops.
Methodology
The first important footstep towards a socioeconomic assessment is defining of the system boundary. This is an integration of two aspects –
Determination of the baseline condition which becomes the benchmark for comparison of the alternative (i.e. establishment of the business model); and
Identification of the input resources (from different waste streams) for the business models at the city level based on the availability. These constraints govern the scales of operation of the business, potential impacts and beneficiaries. Regarding the scale of operation of the businesses, the socioeconomic assessment utilized the scales of the financial models developed previously. However, it was up-scaled based on the waste resources available at the city context.
After having demarcated the system boundary the socioeconomic assessment conducted the following guided steps to evaluate the benefits and the costs.
- Step 1: Identification ofsocioeconomic impacts of similar business cases in Hanoi - Step 2: Scoping of the potential impacts (social, environmental and health) based on the system
boundary. This step leads to the defining of the parameters to be used in the socioeconomic assessment.
- Step 3: Description of the technology for the RRR business models based on the technical assessment report and as observed from the business cases in the region.
- Step 4: Identification of key input data points based on scenarios developed, type of technology used. The financial models served as the base data source for the economic data as well as some of the social data. Investments and production costs were obtained from the financial models. Data on economic indicators such as wage rates, interest rates, inflation, tax, escalation, annual write off, insurance, depreciation and debt-equity ratios were obtained from published data reports by Bank of Vietnam and industrial benchmarks for the region. The environmental and health data were collected from secondary sources based on the scale of the operation and assumption made under the system boundary which delineates the level of stakeholders for a particular model. For environmental data, emission rates, carbon equivalents, cost of pollution (and abatement costs) were collected from the secondary sources and likewise for the health related parameters after having scoped the potential impact and the targeted population that can be impacted, DALYs were used to measure the impact in value terms. The economic values of the DALYs were obtained from secondary data sources for Vietnam. In this step the parameters are also categorized as deterministic and stochastic based on literature survey and expert opinions.
- Step 5: The socioeconomic viability of an RRR business model was analyzed based on the NPV of the benefits and costs, Benefit to Cost Ratio (BCR) and the Rate of return on Investments (RoI). For each of the economic, social, health and environmental aspects, the benefits and costs were measured (in monetary terms) separately, and the cumulative figure was used to look into the
9
NPV, BCR and RoI. Subsequently, a Monte Carlo risk analysis method was performed for the NPV calculations using an Excel add-in, @Risk. The Monte Carlo risk analysis involved the following steps:
- Selection of valuation criteria: The NPV of each of the business model was selected to study the stochastic variations under conditions of uncertainty of the parameters.
- Identification of sources of uncertainty and key stochastic variables. Similar sources of uncertainty as considered in the financial models were also assumed in the socioeconomic assessment. However, in addition to technical development, change in government policy, inflation, variation in input and output prices, competitors’ actions and other various factors, other health and environmental parameters (like economic value of DALY and abatement costs) were also treated stochastic.
- Definition of the probability distributions of stochastic variables: Probability distributions for all risky variables were defined and parameterized.
- Running of the simulation model: Determination of the NPV for each year and the criteria (social, economic, health and environment) using sampled values from the probability distributions for project life. This process was repeated a large number of times (larger than 5000) to obtain a frequency distribution for NPV.
- Determination of the probability distribution of the simulation output (NPV): The simulation model generated empirical estimates of probability distributions for NPV which was further used for the feasibility study.
Data limitations: As had been mentioned previously in the synopsis of the financial assessment that since the RRR sector is nascent in Vietnam, data access and availability were limited. This was even more critical for the socio economic assessment which relied heavily on the secondary databases and the financial models. The financial models developed for the business cases served as the data source for the economic data used in the socioeconomic assessment. The data for the environmental and health costs and benefits were obtained from secondary sources and the literature survey contextualized for Vietnam. However, in certain cases where data was not available, data from certain reports showing global figures or assessments were utilized and actualized for the context of Hanoi. Since the financial model is the base for the economic model, it needs to be mentioned here that economic data not available for the businesses were mined from the different business sources operating in Asia, Africa and Latin America and were verified before their use. However, as explained before in the financial assessment, data sources for wastewater is weak and this produces a cascading effect in the socioeconomic assessment as well.
Overall approach of the socioeconomic assessment: Defining the system boundary of the models
The following matrix defines the system boundary of the socioeconomic models used in the assessment for the RRR business models. In all of these cases, the scale of the business model is so adjusted such that the entire waste can be utilized by the particular business. The socioeconomic assessment of the business models is performed taking into consideration two contrasting situations where the baseline condition refers to the present situation in Hanoi and the alternative scenario proposes the introduction of the business. The scale of operation for each of the businesses is based on two aspects –
The availability of different waste streams in the perspective of Hanoi as derived from other reference literature, reports and documents; and
10
The scale of operation is based on the scale assumed in the financial analysis. This is primarily assumed to keep a parity in the analysis performed since one of the important component of the socioeconomic assessment includes the financial analysis of the operation. However, to achieve the entire consumption of the waste streams for the respective businesses, a linear extrapolation of the scale of the business model assumed in financial analysis is utilized.
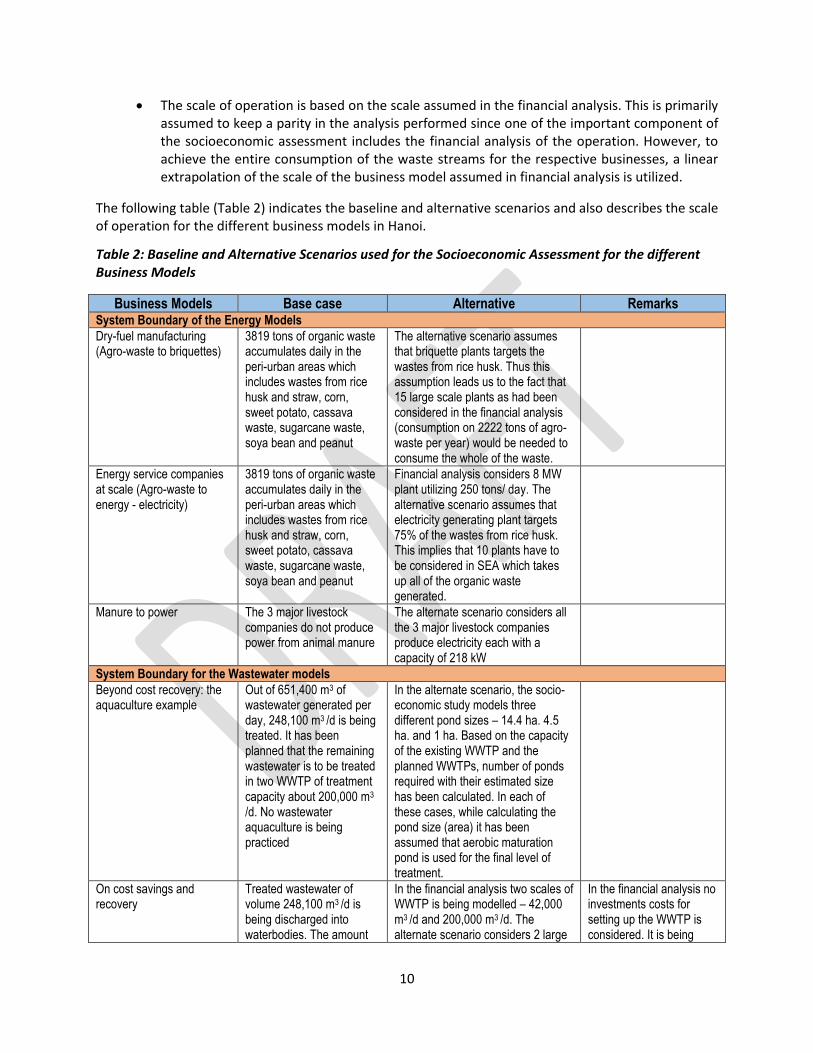
The following table (Table 2) indicates the baseline and alternative scenarios and also describes the scale of operation for the different business models in Hanoi.
Table 2: Baseline and Alternative Scenarios used for the Socioeconomic Assessment for the different Business Models
Business Models Base case Alternative Remarks System Boundary of the Energy Models
Dry-fuel manufacturing (Agro-waste to briquettes)
3819 tons of organic waste accumulates daily in the peri-urban areas which includes wastes from rice husk and straw, corn, sweet potato, cassava waste, sugarcane waste, soya bean and peanut
The alternative scenario assumes that briquette plants targets the wastes from rice husk. Thus this assumption leads us to the fact that 15 large scale plants as had been considered in the financial analysis (consumption on 2222 tons of agro-waste per year) would be needed to consume the whole of the waste.
Energy service companies at scale (Agro-waste to energy - electricity)
3819 tons of organic waste accumulates daily in the peri-urban areas which includes wastes from rice husk and straw, corn, sweet potato, cassava waste, sugarcane waste, soya bean and peanut
Financial analysis considers 8 MW plant utilizing 250 tons/ day. The alternative scenario assumes that electricity generating plant targets 75% of the wastes from rice husk. This implies that 10 plants have to be considered in SEA which takes up all of the organic waste generated.
Manure to power The 3 major livestock companies do not produce power from animal manure
The alternate scenario considers all the 3 major livestock companies produce electricity each with a capacity of 218 kW
System Boundary for the Wastewater models
Beyond cost recovery: the aquaculture example
Out of 651,400 m3 of wastewater generated per day, 248,100 m3 /d is being treated. It has been planned that the remaining wastewater is to be treated in two WWTP of treatment capacity about 200,000 m3
/d. No wastewater aquaculture is being practiced
In the alternate scenario, the socio-economic study models three different pond sizes – 14.4 ha. 4.5 ha. and 1 ha. Based on the capacity of the existing WWTP and the planned WWTPs, number of ponds required with their estimated size has been calculated. In each of these cases, while calculating the pond size (area) it has been assumed that aerobic maturation pond is used for the final level of treatment.
On cost savings and recovery
Treated wastewater of volume 248,100 m3 /d is being discharged into waterbodies. The amount
In the financial analysis two scales of WWTP is being modelled – 42,000 m3 /d and 200,000 m3 /d. The alternate scenario considers 2 large
In the financial analysis no investments costs for setting up the WWTP is considered. It is being

11
Business Models Base case Alternative Remarks of wastewater treated and planned to be treated is 651,400 m3 /d.
size and 3 medium sized treatment plant (following the financial analysis), treating 596,100 m3 /d.
assumed that the WWTP already exists and additional investments for electricity generation, water treatment and compost recovery is analyzed. Similarly in the socioeconomic assessment, the same assumption of existence of WWTP is maintained. In the socio-economic assessment the existing smaller plants of 13,000 m3 /d, 2,300 m3 /d & 3,700 m3 /d are not being considered since it is not technically feasible to produce electricity from these pilot small plants.
System Boundary for the Nutrient Models
Large-scale composting for revenue generation
The municipal waste that is being collected is open-dumped and landfilled. In Hanoi, The total waste generated per day is 6500 tons of which 55-60% of the total generated amount of MSW (about 3600 tons) is actually collected and transported to landfill. The rest is open-dumped along banks and embankments of the rivers.
6 Compost plants of 600 tons is assume which would handle all the MSW generated.
In the financial analysis compost plants of 600 tons has been assessed. The data from these models will be incorporated in the Socio-economic Assessment (SEA)
Subsidy-free community based composting
The municipal waste that is being collected is open-dumped and landfilled. In Hanoi, The total waste generated per day is 6500 tons of which 55-60% of the total generated amount of MSW (about 3600 tons) is actually collected and transported to landfill. The rest is open-dumped along banks and embankments of the rivers.
The amount of waste targeted to be collected and composted through de-centralized operation is about 4500 tons per day. The alternate scenario assumes formation of 104 co-operatives at the ward levels and 7 such co-operatives are linked with a business entity responsible for collection of waste.
It is assumed that decentralized system of waste collection is more efficient and hence a greater amount of waste is being targeted.
High value fertilizer production for profit
Fecal sludge is dumped or being partially treated
The scale of operation for the fortifier is 9 plants which generates 1000 tons of fortifier yearly. This can accommodate 16 tons of fecal sludge per day since each of the plant will handle around 2 tons of dewatered fecal sludge per day.
12
Synopsis of the socioeconomic assessment of the RRR business models
The following section presents key highlights of the RRR business models in terms of the Net Present Value (NPVs) of the different components assessed under this study and for detailed assessment please refer to respective RRR business models presented in subsequent sections. The respective business models were evaluated based on the monetization of the costs and benefits pertaining to the financial/economic, environmental and social consequences of the potential impacts from the business model. The financials for the RRR business models are classified according to Energy, Wastewater and Nutrient models.
Energy Business Models
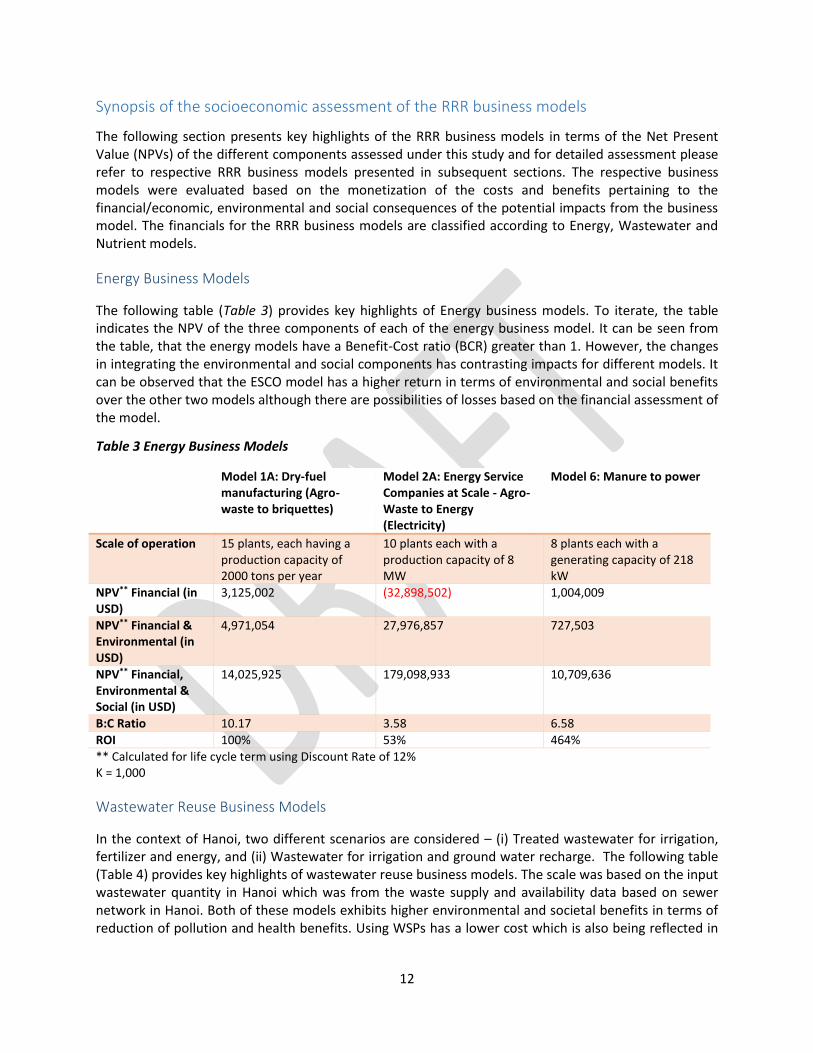
The following table (Table 3) provides key highlights of Energy business models. To iterate, the table indicates the NPV of the three components of each of the energy business model. It can be seen from the table, that the energy models have a Benefit-Cost ratio (BCR) greater than 1. However, the changes in integrating the environmental and social components has contrasting impacts for different models. It can be observed that the ESCO model has a higher return in terms of environmental and social benefits over the other two models although there are possibilities of losses based on the financial assessment of the model.
Table 3 Energy Business Models
Model 1A: Dry-fuel manufacturing (Agro-waste to briquettes)
Model 2A: Energy Service Companies at Scale - Agro-Waste to Energy (Electricity)
Model 6: Manure to power
Scale of operation 15 plants, each having a production capacity of 2000 tons per year
10 plants each with a production capacity of 8 MW
8 plants each with a generating capacity of 218 kW
NPV** Financial (in USD)
3,125,002 (32,898,502) 1,004,009
NPV** Financial & Environmental (in USD)
4,971,054 27,976,857 727,503
NPV** Financial, Environmental & Social (in USD)
14,025,925 179,098,933 10,709,636
B:C Ratio 10.17 3.58 6.58
ROI 100% 53% 464%
** Calculated for life cycle term using Discount Rate of 12% K = 1,000
Wastewater Reuse Business Models
In the context of Hanoi, two different scenarios are considered – (i) Treated wastewater for irrigation, fertilizer and energy, and (ii) Wastewater for irrigation and ground water recharge. The following table (Table 4) provides key highlights of wastewater reuse business models. The scale was based on the input wastewater quantity in Hanoi which was from the waste supply and availability data based on sewer network in Hanoi. Both of these models exhibits higher environmental and societal benefits in terms of reduction of pollution and health benefits. Using WSPs has a lower cost which is also being reflected in

13
the NPV of the financial benefits from the introduction of wastewater for recharge and utilization in agriculture.
Table 4 Wastewater Reuse Business Models
Model 8: Beyond cost recovery: the aquaculture example
Model 9: On cost savings and recovery
Scale of operation An estimated 63 aerobic ponds of 14.4 ha. 4 ponds of 4.5 ha and 3 ponds of 1 ha. is being used for aquaculture within the existing and planned WWTPs.
The capacity of the wastewater treatment plant is considered to be 42,000 m3 and 200,000 m3. 2 large size plants and 3 medium sized plants are used for evaluation
NPV** Financial (in USD) 6,088,209 (14,848,445)
NPV** Financial & Environmental (in USD)
8,486,791 491,047,520
NPV** Financial, Environmental & Social (in USD)
53,232,036 679,337,423
B:C Ratio 8.8 27.63
ROI 155% 443%
** Calculated for life cycle term using discount rate of 12% K = 1,000
Nutrient Business Models
The nutrient business models have been compared in the following table (Table 5). This table provides key highlights of Nutrient business models in terms of the NPVs for the financial, environmental and societal net benefits. It can be seen from the table that High value Fertilizer production and compost derived from Sanitation Service Delivery have higher increase in societal benefits compared to the compost production from MSW. This is primarily due to the fact that sanitation infrastructure either in terms of better service delivery or treatment of faecal sludge have pertinent health benefits as well as positive environmental impacts for the society.
Table 5 Nutrient Business Model
Model 15: Large-Scale Composting for Revenue Generation
Model 16: Subsidy-free community based composting
Model 17: High value Fertilizer Production for Profit
Scale of operation 6 plants each with a handling capacity of 600 tons of MSW is assumed. Total compost production capacity in each plant is 96 tons per day
104 co-operatives with 15 business entities is said to serve about 70% of the population in Hanoi
9 plants are assumed to consume the entire faecal sludge produced and each with a production capacity of 1000 tons in a year
NPV** Financial (in USD)
(43,45,607) (783,795) (2,75,9413)
NPV** Financial & Environmental (in USD)
9,815,107 14,010,280 2,533,644
NPV** Financial, Environmental & Social (in USD)
60,789,713 74,502,891 21,770,187
B:C Ratio 4.81 14 7.77

14
ROI 31% 200% 74%
** Calculated for life cycle term using Discount Rate of 12% K = 1,000
Summary assessment of financial feasibility of RRR Business Models
Table 6provides a summary overview of the criteria used for feasibility of RRR business models for Hanoi based on the socioeconomic assessment. Three main criteria were used to assess the feasibility of the business model - (i) Benefit-Cost Ratio (BCR), (ii) Rate of Investment; and (iii) Probability distribution of the Net Present Value (NPV). The BCR was derived as a ratio of economic, social, health and environmental benefits to the costs in monetary terms. Any project or business with a BCR greater than 1 is termed to be generating more societal benefits compared to the costs for implementing the project and therefore the BCR was used as the governing criterion for the feasibility assessment. The Rate of Investment (RoI) was determined based on all the benefits that accumulated from the business with respect to the initial investments made for the business. Along with these criteria, the probability distribution of the NPV based on the uncertainty of different parameters used in the model was used.
As mentioned earlier in the methodology, a Monte Carlo risk analysis was performed on the Net Present Value (NPV) derived from the costs and benefits from the different parameters of the socioeconomic models. These parameters which were considered as stochastic in the model were defined by a suitable probability distribution to represent uncertainty in the values used for the models. For the Monte Carlo analysis a large number of iterations were performed to obtain empirical estimates of the NPV and also derive a probability distribution of the NPV. The probability distribution obtained for the NPV was used as one of the criterion for assessing the feasibility of the business model. The mean value obtained from the probability distribution of the NPV was taken as a benchmark for determining the feasibility. The probability distribution thus generated was utilized to find out the probability of the NPV value below the benchmark (mean). The methodology used to define the feasibility is as described in Table 14 below.
Table 6: Feasibility Ranking Methodology
P (NPV < NPVmean) B:C Ratio Rate of Investment (RoI) Feasibility
0 < P (NPV < NPVmean) < 30% > 1 > 100% High
30% < P (NPV < NPVmean) < 50% > 1 > 100% Medium
50% and above > 1 > 100%
0 < P (NPV < NPVmean) < 30% < 1 > 100% Low
30% < P (NPV < NPVmean) < 50% < 1 > 100%
50% and above < 1 > 100%
0 < P (NPV < NPVmean) < 30% > 1 < 100%
30% < P (NPV < NPVmean) < 50% > 1 < 100%
50% and above > 1 < 100%
0 < P (NPV < NPVmean) < 30% < 1 < 100%
Not Feasible 30% < P (NPV < NPVmean) < 50% < 1 < 100%
50% and above < 1 < 100%

15
Using the methodology defined in Table 6, the RRR business models were assessed for their viability in the context of the Hanoi city (shown in Table 7). Based on the criteria of assessment, it is found that the energy models have a lower feasibility compared to that of the wastewater and the nutrient models. All the energy models have a BCR greater than 1 however, the ROI is lower than 100% indicating that the business model would not be able to reap benefits larger than the investments. Along with these observations, it was also estimated that the probability of NVP dipping down from the mean value is more than 50% or close to it. In comparison to these scenario, although the models for wastewater and nutrients had probability values close to 50%, the other criteria of BCR to be greater than 1 and RoI of more than 100% make the business models to be feasible at a medium range. It has been mentioned previously that economic costs and benefits utilize the database from the financial analysis. At the same time the financial models had been scaled up linearly to meet the waste resources from different waste streams produced in Hanoi. Therefore, it becomes imperative to check the convergent validity of the financial and socioeconomic model in which further we assess the social, environmental and health aspects. The results of the socioeconomic assessment for the wastewater and nutrient models conforms to that of the financial analysis while that of the energy models (excepting the Energy Service Companies) differ in the results.
Table 7: Synopsis of Socioeconomic Feasibility RRR Business Models
RRR Business Models P (NPV<NPVmean) B:C Ratio Rate of Investment
(ROI)
Feasibility
ENERGY
Model 1A: Dry Fuel Manufacturing - Agro-industrial Waste to Briquettes
49.4% 10.17 100% High
Model 2A: Energy Service Companies at Scale - Agro-Waste to Energy (Electricity) – 8MW Profit Maximization Model
55.1% 3.58 53% Low
Model 6: Manure to power 53.9% 6.58 464% Medium
WASTEWATER REUSE
Model 8: Beyond cost recovery: the Aquaculture exampled
52.27% 8.8 155% Medium
Model 9: On Cost Savings and Recovery 48.8% 27.63 443% High
NUTRIENTS
Model 15: Large-Scale Composting for Revenue Generation - 600 tons
50.1% 4.81 31% Low
Model 16: Subsidy-free community based composting
53.8% 14 200% Medium
Model 17: High value Fertilizer Production for Profit
48.4% 7.77 74% Low
Below is brief on key aspects that determine the feasibility of each of the business models in Hanoi:
Model 1 A – Dry fuel Manufacturing – Agro-industrial waste to briquettes: The business model is economically and financially viable. Dry fuel manufacturing in Hanoi is economically more feasible compared to the other business models. There is a significant increase in the economic feasibility of the business due to social and environmental benefits associated with the business. However, price of the inputs highly fluctuate which pose a significant threat to the business. In addition, health impacts can only be mitigated if there is use of efficient cook stoves among the households, the switching costs of

16
which poses a threat to the business from societal benefits since emissions which lead to indoor air pollution cannot be abated. Model 2 – Energy Service Companies at scale (Agro-waste to energy - electricity): This business model has a lot of potential when we consider electricity generation which Vietnam imports from China. The total potential for all agrowaste being utilized for electricity generation in Hanoi is about 32 MW. Associated with this there is net GHG emissions saved per kWh of electricity generated is 2.724 kg CO2eq. The highest savings in GHG emissions are mainly from avoided burning of agro-waste while the highest emissions from the business model is from the gasifier. In the present situation most of the agrowaste finds its way to the landfills and open dumpsites. However, as the financial analysis indicates that larger scale plants are very sensitive to price of electricity for feed-in-tariffs which are currently on the lower side in Vietnam (the price of the feed-in-tariff for renewable energy particularly agrowaste is yet to be decided in Vietnam), this model faces a stiff challenge financially. The next challenge for the business model is the accessibility of the agrowaste as mentioned previously. Model 6 – Manure to power: This business model has a medium feasibility based on the socio-economic assessment of the model. The societal benefits are particularly high for the model boosting the benefit-cost ratio for the business. The primary benefits accruing to the business arises from savings in the import of electricity from China and also reduction in the wastewater run-off with a high BOD content from the farms. Model 8– Beyond cost recovery: the aquaculture example: In the Phyto-remediative process it is assumed that the wastewater treatment plants already exists and the ponds used for aquaculture are aerobic maturation ponds. The business model has medium feasibility, but has a high potential of employment generation particularly among the fishing communities as it provides opportunity for them to rear fish in these ponds. At the same time, the potential undesirable outputs from wastewater can be flushed off during natural treatment. Model 9 – On Cost savings and recovery: It is being assumed that the wastewater treatment plant exists and additional investments are made to retrieve water for irrigation, sludge for compost and electricity for use in the plant. The feasibility of the business model is governed by the fact that there is lower initial investments compared and practically no operation costs, while the benefits like irrigation and groundwater recharge are more favorable. In Hanoi with the newly planned WWTPs coming up there is a lot of potential for electricity generation. Consideration of the health and environmental aspects shows that there is substantial amount of reduction in surface and groundwater which has indirect costs associated inter-temporally. In addition there is also a potential of earning benefits due to reduced GHG emissions and savings incurred in using compost as a soil ameliorant which reduced the fiscal burden. The socioeconomic feasibility shows that health issues among farmers which might arise due to use of wastewater is overweighed by the benefits incurred. However, application of the business model should be subjected to the research on health effects both on consumers and farmers consuming food irrigated by wastewater and producing food irrigated by wastewater respectively. Model 15 – Large scale composting for revenue generation: The financial analysis shows that large sized compost plants of 600 tons/day is not feasible. The socioeconomic assessment considered the 6 plants of same scale for absorbing the waste of the city. The economic feasibility of the model is similarly low in spite of the fact that there are savings in terms of GHG emissions. In fact the amount of GHG emissions are quite low to ensure the feasibility of the business.
17
Model 16 – Subsidy free community based composting: This is a similar model to that of Model 15 excepting for the fact that the collection is done in a decentralized system according to wards. The financial viability depends primarily on the user fees which in Hanoi is quite low. This business model although medium feasible socio-economically has a lot of potential with appropriate user fees among the communities for collection of waste. This business model increases the collection potential of the MSW and would also help in producing better quality of compost with segregation of the waste at the source. Model 17 – High value fertilizer production for profit: This product is relatively unknown and due to the nature of raw material used (faecal sludge), there is inherent risks of acceptability among farmers. The economic viability of the business model closely follows that of the compost obtained from municipal solid wastes. In similar lines as explained in the previous model, there are opportunities of reduction of GHG emissions, foreign exchange savings. In addition, the products are priced higher and can be fortified with inorganic fertilizers which are close substitutes to fertilizers and utilizing the faecal sludge reduces the risks from water pollution. However, the primary challenges of the business being the adaptability among farmers which needs a lot of trainings and communications.

18
Socio-economic impact assessment of Dry Fuel Manufacturing (Agro-industrial waste to briquettes) Business model in Vietnam
Introduction
The opportunity to utilize more efficiently agricultural residues, with a reduction in pollution levels, has in recent years aroused the interest of developing countries in dry fuel manufacturing technologies (Grover and Mirsha, 1996). Waste processing technologies such as briquetting have the potential to counteract many adverse health and environmental impacts associated with traditional biomass energy. To improve the waste management, to reduce the rate of deforestation and to increase access to modern energy technologies, recycling agricultural waste to manufacture briquettes is a simple and low cost technology. Briquettes are densified biomass fuels used for heating in different systems. They are affordable source of energy and can be used in cooking instead of the traditional charcoal and firewood. The main purpose of briquetting a raw material is to reduce the volume and thereby increase the energy density. This also improves the handling characteristics of the materials for transporting, storing and usage (Grover and Mishra, 1996).
The potential economic, environmental and social impacts of the dry fuel manufacturing business model need to be assessed to ensure its sustainable development. In this study, we evaluated the socio-economic impacts of dry fuel manufacturing business with annual capacity of 2,000 tons of briquettes in Kampala. The socio-economic analysis is conducted based on the valuation of financial, environmental and health benefits and costs associated with the business model.
Technological options for briquette business
Raw materials used for briquette production
Briquettes can be produced from various raw materials such as agricultural residues, organic municipal solid waste, sawdust from timber mills and other woody biomass. However, the quality of the briquette which is measured by its energy content, depends on the raw materials used. The selection of suitable input materials, in addition to availability, is based on the input’s desirable characteristics such as low moisture content (10-15%), low ash content (4%) and uniform or granular flow characteristics of the raw material (Tripathi et al., 1998). The main sources of input for briquette production in Hanoi include agricultural residues (such as maize cobs, rice husks, groundnut husks etc.), wood processing waste (such as sawdust) and organic municipal solid waste. Table 8 shows the characteristics of agricultural residue and the available amount in Hanoi.
Table 8: Agricultural residues available and their ash content in Hanoi
Agricultural residue Ash contenta (%) Annual production (tons/year)
Bagasse 1.8 2,900 Rice husks 22.4 1,200,000 Maize cobs 1.2 234 Ground nut shells 6.0 9,700
Source: EAWAG, 2014; aGrover and Mishra, 1996

19
Technology description
The process of making briquettes depends on whether the briquettes are carbonized or non-carbonized (Figure 1). Carbonized briquettes are made from raw materials that have been carbonized through partial pyrolysis to produce char which is then compacted into a briquette. Carbonized briquettes are used as a replacement to charcoal for domestic and institutional cooking and heating. The traditional charcoal making techniques such as carbonization of raw materials using earth pit or steel kilns with conversion efficiencies of less than 10% are the dominant methods of carbonization in developing countries (Ferguson, 2012). However some improved processes have been developed for small scale char production, with improved efficiencies of up to 30% (Ferguson, 2012). Eco-Fuel Africa, a non-carbonized briquette making enterprise in Vietnam, for example invented a low-cost kiln made out of old oil drums to carbonize its agricultural waste to produce charcoal powder. Non-carbonized briquettes on the other hand are made directly by solidifying/compacting the raw material. They are used by industrial and commercial processes such as brick manufacturing, lime production, fish smoking, tobacco curing, beer brewing, coffee and tea drying which rely on charcoal and firewood for cooking and heating purposes. They can also be used as a replacement fuel among rural populations where firewood is still dominant (Ferguson, 2012).
Figure 1: Process diagram of briquetting
Pre-processing
Depending on the characteristics of the raw material used and depending on the type of briquette to be produced, the raw materials need to go through a pre-processing stage before briquetting. This primarily involves shredding of raw materials, sieving, pulverizing and drying. This pre-processing step can be done manually by crushing and chopping or by using mechanized milling machines and can potentially be labour and energy intensive depending on the type of raw material used. For example, residues such as rice husks and sawdust require no drying, minimum chopping and crushing to break them down, and thus considerably reduce the energy and labour required to prepare the raw materials (Chaney, 2010). Thus careful consideration should be taken when selecting appropriate raw materials for briquetting to minimize cost of production.
Binding materials
Binding materials are needed in order to ensure that the final product remains in a compact form and has the required strength to be able to withstand handling, transportation and storage. Examples of briquette binders include starch (rice flour, cassava flour, sweet potato paste), natural resins, tar, molasses, algae and gum Arabic (EEP, 2013). Starch is the most commonly used in East Africa. When selecting a binder, careful consideration should be taken to ensure that it is non-toxic for laborers working in briquette making. Furthermore, the effect of the binder on briquette’s combustion, emission occurring during burning and the residue after combustion need to be considered during selection of binding materials.
Agricultural
residue& MSW
Sorting MSW
(organic fraction) Pre-processing Carbonizing
Agricultural
residue Briquetting Drying and
packaging Non-carbonized
Carbonized

20
Briquetting/densification
Briquetting essentially involves two parts; the compaction under pressure of loose material to reduce its volume and to agglomerate the material so that the product remains in the compressed state (http://www.fao.org/docrep/t0275e/t0275e04.htm). There are different methods of briquetting which can be grouped into high pressure, medium pressure and low pressure compaction. For these methods, a wide range of technologies have been developed. These can be grouped into low pressure presses, piston presses, screw presses and roller presses (Maninder, 2012; FAO, 1990). Each of the technologies are described below.
- Low pressure or manual presses are simple low-capital cost options which require low skill levels and no electricity to operate and are used for producing both carbonized and non-carbonized briquettes. These are suitable in areas where there is no access to electricity. A number of manual technologies exist in low income countries that have been developed as low-cost options especially in the rural context. However, the briquettes produced through this process may not have the desired quality as they are known to crush easily especially when mishandled or exposed to water.
- Piston presses are large machines whereby a heavy piston forces biomass material through a tapered die, which compacts the biomass as a result of a reduction of the diameter, using high pressure. Depending on the operating method, piston extruders can produce between 200 and 750 kg of briquettes per hour (Ferguson, 2012). Briquettes are extruded as a continuous cylinder. These machines are used to produce non-carbonized briquettes.
- Screw presses extrude a briquette through a die and produce briquettes with a homogenous structure which are often cylindrical. They can be operated continuously, which is the main advantage compared to piston extruders. The main disadvantage is the wear of the screw, which needs relatively high investment costs compared to the costs of the extruder itself. A screw press typically has the capacity to produce150 kg of briquettes per hour (Ferguson, 2012).
- Roller presses are mainly used to produce carbonized briquettes and are also widely applied for the production of charcoal briquettes. Roller presses involve two rollers continuously rotating in the opposite direction, converging at point of compaction where the processed raw materials are transformed in to the shape of the desired briquette (EEP, 2013). As this technology does not provide enough pressure to compact the raw materials, water and binders such as cassava or wheat flour are added to hold the material together. A roller press has the capacity to produce 1,500 kg of briquettes per hour which is high compared to other briquetting technologies (Ferguson, 2012).
Overall approach to socioeconomic impact assessment
The socio-economic analysis of a project is concerned with its viability from a societal perspective and answers the questions of whether it is economically rational to proceed with the project (De Souza et al., 2011). In contrast to a financial analysis, socio-economic analysis provides a more comprehensive investigation on the effects of a proposed project, takes a broader perspective and determines the project’s overall value to society. The analysis, therefore, includes benefits and costs that directly affect the business entity running the project and the effects of the project on households, governments and other businesses outside of the business. The analysis also includes the benefits and costs that cannot be readily measured using observable market prices and costs (De Souza et al., 2011). In this study, the
21
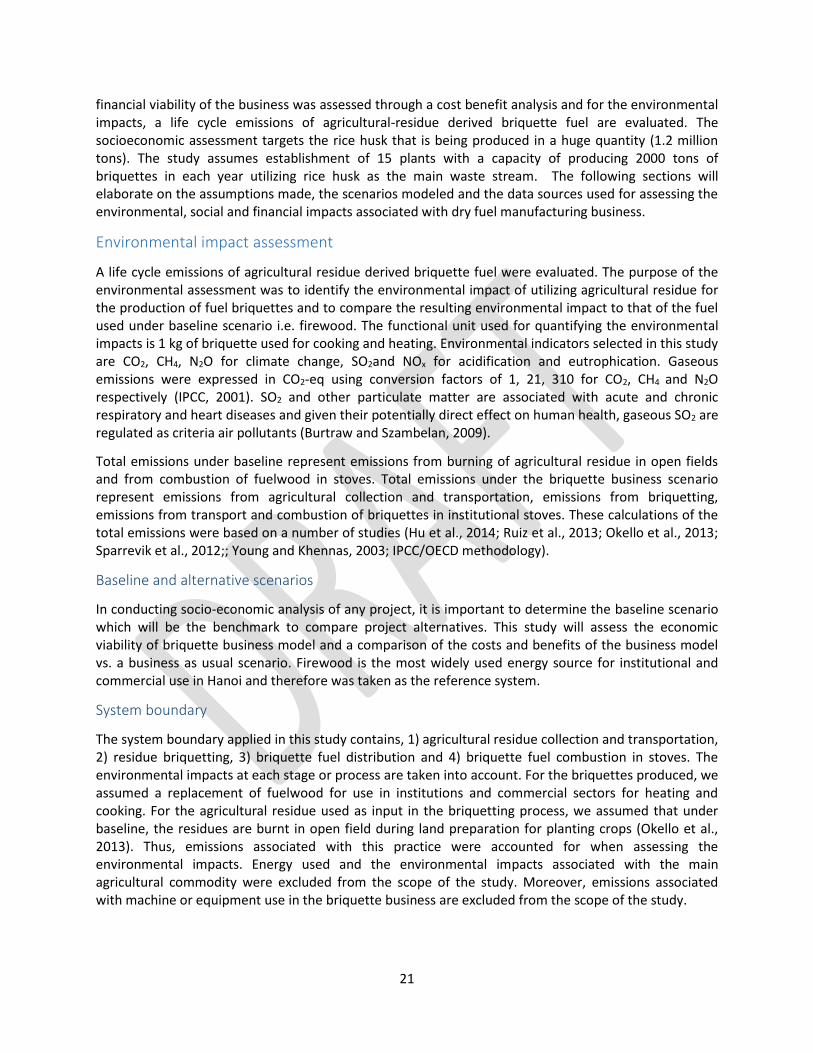
financial viability of the business was assessed through a cost benefit analysis and for the environmental impacts, a life cycle emissions of agricultural-residue derived briquette fuel are evaluated. The socioeconomic assessment targets the rice husk that is being produced in a huge quantity (1.2 million tons). The study assumes establishment of 15 plants with a capacity of producing 2000 tons of briquettes in each year utilizing rice husk as the main waste stream. The following sections will elaborate on the assumptions made, the scenarios modeled and the data sources used for assessing the environmental, social and financial impacts associated with dry fuel manufacturing business.
Environmental impact assessment
A life cycle emissions of agricultural residue derived briquette fuel were evaluated. The purpose of the environmental assessment was to identify the environmental impact of utilizing agricultural residue for the production of fuel briquettes and to compare the resulting environmental impact to that of the fuel used under baseline scenario i.e. firewood. The functional unit used for quantifying the environmental impacts is 1 kg of briquette used for cooking and heating. Environmental indicators selected in this study are CO2, CH4, N2O for climate change, SO2and NOx for acidification and eutrophication. Gaseous emissions were expressed in CO2-eq using conversion factors of 1, 21, 310 for CO2, CH4 and N2O respectively (IPCC, 2001). SO2 and other particulate matter are associated with acute and chronic respiratory and heart diseases and given their potentially direct effect on human health, gaseous SO2 are regulated as criteria air pollutants (Burtraw and Szambelan, 2009).
Total emissions under baseline represent emissions from burning of agricultural residue in open fields and from combustion of fuelwood in stoves. Total emissions under the briquette business scenario represent emissions from agricultural collection and transportation, emissions from briquetting, emissions from transport and combustion of briquettes in institutional stoves. These calculations of the total emissions were based on a number of studies (Hu et al., 2014; Ruiz et al., 2013; Okello et al., 2013; Sparrevik et al., 2012;; Young and Khennas, 2003; IPCC/OECD methodology).
Baseline and alternative scenarios
In conducting socio-economic analysis of any project, it is important to determine the baseline scenario which will be the benchmark to compare project alternatives. This study will assess the economic viability of briquette business model and a comparison of the costs and benefits of the business model vs. a business as usual scenario. Firewood is the most widely used energy source for institutional and commercial use in Hanoi and therefore was taken as the reference system.
System boundary
The system boundary applied in this study contains, 1) agricultural residue collection and transportation, 2) residue briquetting, 3) briquette fuel distribution and 4) briquette fuel combustion in stoves. The environmental impacts at each stage or process are taken into account. For the briquettes produced, we assumed a replacement of fuelwood for use in institutions and commercial sectors for heating and cooking. For the agricultural residue used as input in the briquetting process, we assumed that under baseline, the residues are burnt in open field during land preparation for planting crops (Okello et al., 2013). Thus, emissions associated with this practice were accounted for when assessing the environmental impacts. Energy used and the environmental impacts associated with the main agricultural commodity were excluded from the scope of the study. Moreover, emissions associated with machine or equipment use in the briquette business are excluded from the scope of the study.
22
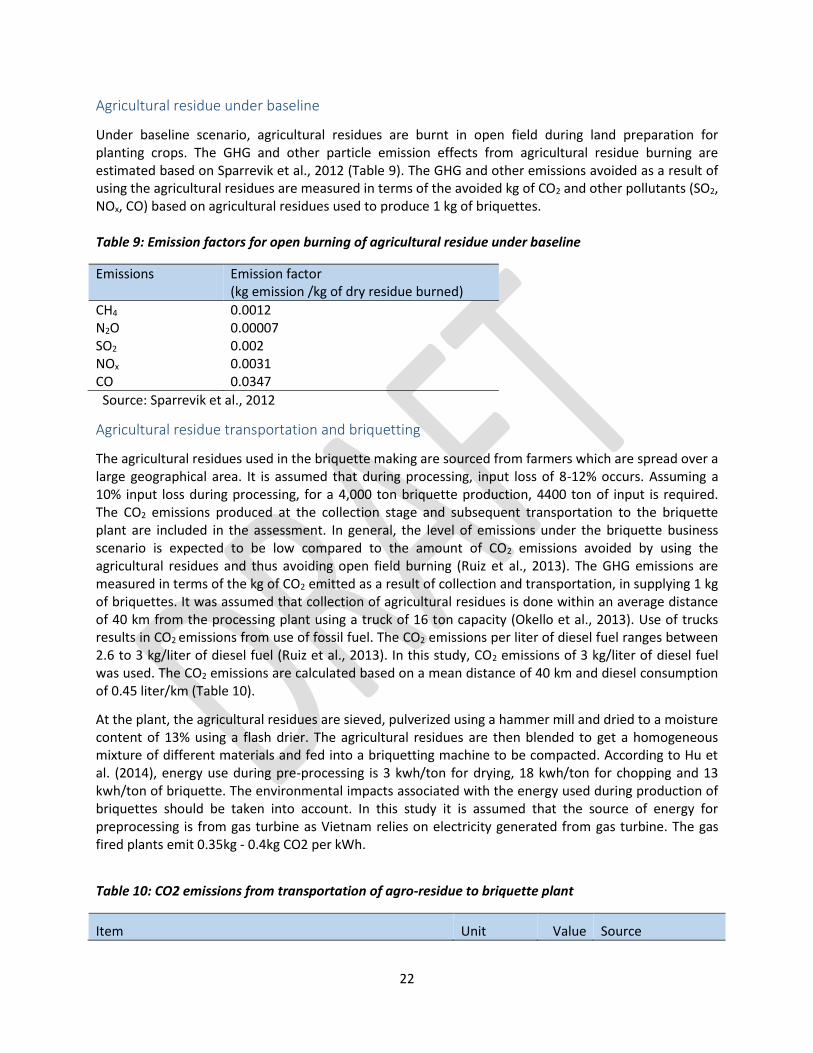
Agricultural residue under baseline
Under baseline scenario, agricultural residues are burnt in open field during land preparation for planting crops. The GHG and other particle emission effects from agricultural residue burning are estimated based on Sparrevik et al., 2012 (Table 9). The GHG and other emissions avoided as a result of using the agricultural residues are measured in terms of the avoided kg of CO2 and other pollutants (SO2, NOx, CO) based on agricultural residues used to produce 1 kg of briquettes. Table 9: Emission factors for open burning of agricultural residue under baseline
Emissions Emission factor (kg emission /kg of dry residue burned)
CH4 0.0012 N2O 0.00007 SO2 0.002 NOx 0.0031 CO 0.0347
Source: Sparrevik et al., 2012
Agricultural residue transportation and briquetting
The agricultural residues used in the briquette making are sourced from farmers which are spread over a large geographical area. It is assumed that during processing, input loss of 8-12% occurs. Assuming a 10% input loss during processing, for a 4,000 ton briquette production, 4400 ton of input is required. The CO2 emissions produced at the collection stage and subsequent transportation to the briquette plant are included in the assessment. In general, the level of emissions under the briquette business scenario is expected to be low compared to the amount of CO2 emissions avoided by using the agricultural residues and thus avoiding open field burning (Ruiz et al., 2013). The GHG emissions are measured in terms of the kg of CO2 emitted as a result of collection and transportation, in supplying 1 kg of briquettes. It was assumed that collection of agricultural residues is done within an average distance of 40 km from the processing plant using a truck of 16 ton capacity (Okello et al., 2013). Use of trucks results in CO2 emissions from use of fossil fuel. The CO2 emissions per liter of diesel fuel ranges between 2.6 to 3 kg/liter of diesel fuel (Ruiz et al., 2013). In this study, CO2 emissions of 3 kg/liter of diesel fuel was used. The CO2 emissions are calculated based on a mean distance of 40 km and diesel consumption of 0.45 liter/km (Table 10).
At the plant, the agricultural residues are sieved, pulverized using a hammer mill and dried to a moisture content of 13% using a flash drier. The agricultural residues are then blended to get a homogeneous mixture of different materials and fed into a briquetting machine to be compacted. According to Hu et al. (2014), energy use during pre-processing is 3 kwh/ton for drying, 18 kwh/ton for chopping and 13 kwh/ton of briquette. The environmental impacts associated with the energy used during production of briquettes should be taken into account. In this study it is assumed that the source of energy for preprocessing is from gas turbine as Vietnam relies on electricity generated from gas turbine. The gas fired plants emit 0.35kg - 0.4kg CO2 per kWh.
Table 10: CO2 emissions from transportation of agro-residue to briquette plant
Item Unit Value Source

23
Average return trip distance -agro-waste to briquette plant km 40 Okello, 2014
Average return trip distance briquette plant to final users km 20 Assumed
Capacity of truck agro-waste (per load) ton 16 Okello, 2014
Diesel consumption lt/km 0.45 Ruiz et al., 2013
CO2 emission per liter of diesel kg CO2/lt 3 Ruiz et al., 2013
CO2 emissions from electricity plant Kg/kwh 0.4
Briquette transportation and combustion
The same truck with a capacity of 16 ton is assumed to be used to transport the briquettes to end users within an average distance of 20 km. The briquettes are substitute for fuelwood and can be used for cooking without stove modifications. It is estimated that the energy content in 1 Kg of briquette is 16.8 MJ and 13.8 MJ in 1 kg of fuelwood (IPCC/OECD methodology; Hu et al., 2014). This implies that 0.82 kg of briquette can replace 1 kg of fuelwood. Other studies have assumed that 1 kg of fuelwood can be replaced by 0.7 kg of briquettes (Young and Khennas, 2003). Thus, the use of 1 Kg of briquette would conserve 1.22 Kg of fuelwood. The combustion efficiency of and the resulting emissions from briquettes greatly depend on the combustion equipment used (Roy and Corscadden, 2012). The institutional wood stoves used in most East African countries have an efficiency of 30% when wood is used and 50% when wood is replaced by briquettes (Young and Khennas, 2003). The emissions associated with combustion of fuelwood under baseline and briquettes under the briquette business scenario are presented in Table 11.
Table 11: Emission factors from combustion of firewood and briquette
Emissions
Fuelwood use (Kg emission/kg of
fuelwood)
Briquette use (Kg emission/kg of
briquette)
CO2 emission 1.513 0.7604
CH4 emission 4.14E-03 2.98E-03
N2O emission 5.52E-05 9.68E-06
SO2 emission - -
NOX 1.38E-03 4.84E-06
CO 6.9E-02 1.48E-02
Source: IPCC/OECD methodology; Okello, 2014
Environmental impact results
This section presents the GHG and other criteria emissions under baseline and alternative scenario. The total emissions under baseline scenario are the total of emissions associated with fuelwood use and burning of agro-residues in open field. These emissions are the emissions avoided as a result of utilizing agricultural residue for the production of fuel briquettes thereby replacing fuelwood. The emissions from the briquette business are the total of emissions associated with agro-residue transportation, briquette transportation and combustion in stoves. Total emission savings is the total avoided emissions net of the emissions from the briquette business.

24
Emissions under baseline scenario
The emissions avoided per kg of briquette produced is shown in Table 5. These are emissions under the baseline scenario. The highest contribution to GHG emission savings is from avoided burning of firewood. Reduced use of firewood also implies that environmental degradation through deforestation is minimized. The overall savings in GHG emissions from avoided use of firewood and agro-residue burning is 2.021 kg CO2eq/kg of briquette. Considering the other criteria emissions, the highest contribution to reduction of acidification and eutrophication expressed respectively, in kg of SO2 and NOx is from avoided burning of agro-residues. Given the assumption made in this study, savings of 0.0022 kg of SO2, 0.0051 kg of NOx and 0.1225 kg of CO are avoided per kg of briquette.
Table 12: Emission savings from avoided firewood use and agro-residue burning per 1 kg of briquette
Savings from GHG emissions Other criteria emissions
CO2 SO2 NOx CO
Firewood conservation 1.969 0 0.0017 0.0840 Burning agro-residue 0.052 0.0022 0.0034 0.0386
Total savings 2.021 0.0022 0.0051 0.1226
Emissions under briquette scenario
Processing of agro-residues to produce briquettes results in GHG and other criteria emissions. These emissions are from transporting of agro-residue to the plant, briquetting of agro-residue, transporting and combustion of briquettes. The environmental emissions from the production and combustion of 1 kg of briquette fuel are shown in Table 6. The highest contribution to GHG emissions and other criteria emissions is from combustion of briquettes showing total GHG emission of 0.8312 kg CO2eq, 4.84E-06 kg of NOx and 1.48E-02 kg of CO per kg of briquettes.
Table 13: Environmental emissions from the production and use of 1 kg of briquette
Emissions from GHG emissions Other criteria emissions
CO2 SO2 NOx CO
Agro-residue transportation 0.0038 - - - Briquette transportation 0.0017 - - - Briquette combustion 0.8260 - 4.84E-06 1.48E-02
Total emissions 0.8314 - 4.84E-06 1.48E-02
Net emissions
The overall GHG emission from the production and use of 4,000 tons of agro-residue briquette fuel is shown in Figure 2. GHG emissions avoided by reducing firewood combustion and burning of agro-waste are 7874 ton and 206 ton respectively. The savings are mainly from avoided fuelwood use. Under the briquette business scenario, the highest GHG impact is from briquette combustion which is around 3304 ton. GHG emission from transport and electricity use during production of briquette is around 22 tons. Although, the briquette business results in environmental impacts, the impacts are far less than the baseline scenario. The GHG emission savings are more than the emissions from the briquette business thus resulting in net GHG emission savings of 4755 ton CO2eq per annum.

25
Figure 3 shows other criteria emissions, SO2, NOx and CO under baseline and briquette business scenario (4000 tons of briquettes). The untreated or burning of agro-residue under the baseline scenario contributes the highest SO2 and NOx emissions which respectively cause acidification and eutrophication. In the briquette scenario the agro-residue is processed to briquette resulting in a small eutrophication impact. The highest CO emission is from firewood use. The combustion of briquette also contributes to CO emissions but less impact than the baseline scenario thus resulting in net emission savings. The net emission savings from 4,000 tons of briquette are respectively 8.8 tons of SO2, 13.06 tons of NOx and 152 tons CO per annum.
Value of Carbon credits and other emissions
Carbon credits are traded on either the regulatory CDM market or on the voluntary carbon market depending on their eligibility. The Certified Emission Reduction (CER) is the credit generated under CDM while the Voluntary Emission Reduction (VER) is generated under the voluntary carbon market. Since the VER is suited for small scale projects and are typically sold in volumes that appeal to clients seeking small reductions to offset their footprints, in this study the VER unit is considered. The VER unit is equivalent to a reduction of 1 ton of CO2equivalent emissions (Reuster 2010). Based on the World Bank (2014), carbon credit prices in the EU ETS range about USD 5-9 ((€4-7) in 2014 while prices were USD 18 ((€13) in 2011. In this study it is assumed that carbon credits are worth on average USD 7 per ton of CO2 equivalent (Table 14). However value of the other emission savings that have acidification potential (NOx and SO2) were not included in the analysis.
Table 14: Annual value of GHG emission reduction from briquette business (4,000 tons)
Item Amount
Total GHG emission savings (ton CO2eq) 8,080 Total GHG emissions from briquette business (ton CO2 eq) 3,325 Net emission savings (ton CO2eq/year) 4,755 Price of VER (USD/ton CO2eq) 7
Total value of Carbon credit (USD/year) 33,286
Social impacts
Additional income from agricultural residue waste
As a predominantly agricultural country, Vietnam generates large quantities of agricultural residues. The major agricultural residues include rice husks. Data provided by the government indicated that annual agricultural wastes available is 2.2 million tonnes (Vietnam Environmental Monitor, 2004). While these agricultural residues are important sources of energy, currently they are burned in open field wasting valuable energy resources and also leading to serious environmental pollution. In areas where there are large agricultural residues, briquetting fuel plants can be established using local agricultural residue as input to their system. This will benefit farmers and local residents. Farmers will benefit from sales of agricultural residues and thus earning additional income. Farmers get 8 USD/ton by selling agricultural residue to briquette plant. Thus, on average, the briquette plant contributes to providing additional income to the farmer of 9.44 USD/ton of briquette produced, resulting in total annual additional income of 35,200 USD from 4,000 tons of briquettes.

26
In addition to providing additional income to farmers, briquette plant contributes to creating of employment for the local community. However, the briquette business is likely to also impact the livelihood of charcoal or fuelwood traders. The briquette business has 15 full time workers earning a total annual salary of USD 39,360.
Savings for end-users
A study by WHO and UNDP (2009) shows that 70% of the urban population in Vietnam uses Kerosene for cooking purposes. Replacing kerosene with briquette fuels for cooking has the potential to contribute to reducing the costs incurred by end users for cooking fuel. In this study end users are institutional and commercial users. Table 8 shows the potential savings for end users from using briquettes. The energy content in 1 Kg of briquette is 16.8 MJ while the energy content in 1 kg of kerosene is 43.1 MJ (IPCC/OECD methodology; Hu et al., 2014). In addition to the calorific value of the energy sources, the replacement value of briquettes depends on the efficiency of cook stoves used in institutions. Based on calorific value only, the use of 1 Kg of briquette would conserve 0.52 lts of kerosene. Assuming efficiency of stoves of 30% and 50% respectively when kerosene and briquettes are used for cooking, the actual price per MJ of useful energy is 0.055 USD in fuelwood equivalent and 0.034 USD in briquette equivalent. At the current price of fuelwood (0.24 USD/kg), using kerosene priced at 1.07 USD/lts has the potential cost saving of 13% as compared to fuelwood used in institutional stoves. Total annual cost savings for end users from utilizing 4,000 tons of briquettes is estimated to be USD 460,868 annually.
Table 15: Savings to end users from using briquettes
Item Fuelwood Briquette
Kerosene replaced by briquettes (lts) (A) 2,079,814 4,000,000
Heating value (MJ/kg) (B) 43.1 16.8
Price (USD/ton) (C) 1.07 0.282
Efficiency of stoves (%) (D) 30% 50%
Actual price per useful energy (USD/MJ) (E= C/(B*D) 0.055 0.034
Total energy value of kerosene replaced (1000 MJ) (F=A*B*D) 40,338,000 Savings from briquette use (%) (G= [E (Fuelwood)-E(Briquette)]/E(Fuelwood) 42%
Total savings from shifting to briquettes (USD/year) (E*F*G) 460,868
Health impacts
Use of fuelwood and other biomass in stoves with low-efficiency and inadequate venting leads to indoor air pollution exposing people working in kitchens to a major public health hazard (WHO, 2002). Biomass smoke contains a large number of pollutants that pose substantial risks to human health. Harmful pollutants include particulate matter, CO, NO2 and SO2 emissions. Exposure to biomass smoke increases the risk of diseases such as chronic bronchitis, chronic obstructive pulmonary diseases and lung cancer (Lim et al., 2013; Norma, 2011; WHO, 2002). Briquettes are direct replacement to fuelwood used in institutions which have a combustion efficiency of 30%. The fact that complete combustion of biomass is not achieved in the institutional cook stoves

27
results in production of toxic gases such CO and other toxic emissions. The combustion of briquettes in existing institutional stoves will also result in emissions of toxic gases. However, briquettes have advantages over fuelwood as they have low moisture content compared to fuelwood and thus less smoke and toxic emissions are produced during briquette combustion. This will lower gaseous emissions in the kitchen and exposure of people working in kitchens to health hazards. In addition to health impacts associated with combustion of briquette, health impacts on workers’ exposure to emission pollutants during briquette manufacturing should also be taken in to consideration. For example, communication with existing briquette plant in Kampala have revealed that the dust from most of the agricultural residue is hazardous when inhaled by the workers. Thus there is a need to provide workers with protective gears. Health impacts associated with fuelwood and briquette use are not quantified in this study.
Financial analysis
In this section, the financial analysis of the briquette is presented. The financial viability is analyzed based on Return on Investment (ROI), Net Present Value (NPV) and Internal Rate of Return (IRR) valuation criteria. The costs of the briquette business primarily include capital investment and operating costs which include input cost, labour cost, O & M costs, utilities, marketing and packaging costs. The useful life of the briquette plant is assumed to be 15 years. Total investment cost is USD 186,700. The production capacity of the plant is 4,000 tons/year and 4,400 tons of agricultural residue will be purchased at a price of 29 USD/ton as feedstock. The selling price of briquettes is 150 USD/ton. It is assumed that in the first year, 75% of the total briquette production is sold, the second year, 85% and in the third year and the rest of the period, 95%.The total number of full time workers is 50 and total monthly labor cost is 3,200 USD. Other costs include marketing and distribution (9 USD/ton), packaging cost (4 USD/ton) and utilities (6 USD/ton). Operating and maintenance costs are assumed to be 5% for machine and equipment and 2% for building. A discount rate of 12% is assumed. Selling price of briquette and other input costs are subjected to an escalation of 3%. A straight line method of depreciation is used for depreciable capital costs assuming a useful life of 15 years with a salvage value of 10% of total depreciable cost. Current tax for similar businesses in Vietnam is 24% comprising of 18% VAT and 6% withholding tax (Refer to financial analysis document for details). The financial analysis of a briquette business is presented in Table 16. Results show that the business model resulted in a positive net profit. In the first year where it is assumed that 75% of production is sold, net profit is USD 2,70,327 while for second year where 85% of production is assumed to be sold, it is USD 50,998 and for the rest of the period mean net profit increases as proportion of sales to production increases to 95%. Assuming a discount rate of 12% and useful life of 15 years, the business model resulted in a mean NPV of USD 605,185 and IRR of 57% indicating that the business model is financially viable.

28
Table 16: Financial results of briquette business (USD)
Year 0 Year 1 Year 2 Year 3 Year 4 Year 5 Year 6 Year 7 Year 8 Year 9 Year 10 Year 11 Year12 Year 13 Year 14 Year 15
Total capital cost 1867000
Total revenue
2482521 2833384 3410685 3649433 3904894 4178236 4470713 4783663 5118519 5476815 5860193 6270406 6709334 7178988 7681517
Total production and other cost
2341495 2513312 2707249 2895813 3097577 3313465 3544464 3791634 4056106 4339090 4641883 4965872 5312541 5683475 6080376
Depreciation
88920 88920 88920 88920 88920 88920 88920 88920 88920 88920 88920 88920 88920 88920 88920
Profit before interest and tax
52105 231152 614517 664700 718396 775852 837328 903109 973494 1048805 1129389 1215614 1307874 1406592 1512221
Interest payment
126023 121523 99023 54023 - - - - - - - - - - -
Profit before tax
(73917) 109629 515494 610678 718396 775852 837328 903109 973494 1048805 1129389 1215614 1307874 1406592 1512221
Income tax
21926 103099 122136 143679 155170 167466 180622 194699 209761 225878 243123 261575 281318 302444
Net profit
(73917) 87704 412395 488542 574717 620681 669863 722487 778795 839044 903511 972491 1046299 1125274 1209777
Cash flow (1867000) 15003 176624 501315 577462 663637 709601 758783 811407 867715 927964 992431 1061411 1135219 1214194 1298697
Discount rate
Discounted value of cash flows
15002.65 176624 501315 577462 663637 709601 758783 811407 867715 927964 992431 1061411 1135219 1214194 1298697
Present value of cash flows 11711463
NPV $2083335
ROI (Financial)
-4% 5% 22% 26% 31% 33% 36% 39% 42% 45% 48% 52% 56% 60% 65%
ROI-average (Financial) 37%
BCR-Financial 6.27

29
Socio-economic results
The consolidated socio-economic results are shown in Table 10. The analysis looked at the potential impact of dry fuel manufacturing at three levels where the levels range from including the direct benefits and costs that affect the business entity to including indirect benefits and costs to other sectors. The annual social and environmental benefits and costs from the business were discounted at a rate of 12% to obtain the present value of social and environmental impacts.
The briquette business results in cost benefit ratio (CBR) of 10.17, NPV of USD 14,025,925 and ROI of 100% when only direct benefits from the briquette production are taken into account1. The ROI increases from 37% to 51% when environmental benefits are taken into account and to more than 99% when the environmental and social impacts are taken into account. The ROI taking all externalities into account is 99% showing about 100% increase compared to when only direct benefits are considered. The major contribution to the economic feasibility of the business is from the social benefits. The total value of the social benefits of the business is USD 9,054,925 with major benefits coming from the savings in energy costs to end users accounting. Thus from a socio-economic perspective, the dry fuel manufacturing business model is highly attractive.
Table 17: Net socio-economic results of dry fuel manufacturing business
Socio-economic result (USD/year) Financial
value Financial and
environmental
Social, environmental and financial
Financial result:
NPV 3,125,002 3,125,002 3,125,002
Environmental benefit: Value of net GHG emission saving
1,846,051 1,846,051 Social benefit:
Savings in energy costs for end users
1,437,601
Additional income to farmers
3,596,136 Value of employment
4,021,134
Total social benefit
9,054,871
NPV
3,125,002 4,971,054 14,025,925 ROI 37% 51% 100% BCR
6.27 6.93 10.17
Sensitivity Analysis
Sensitivity analysis was performed to identify variables which have important effects on the socio-economic impacts of the business model. The discount factor, carbon credit price, and economic value of a per capita losses due to diarrheal diseases were varied to assess the resulting effect on the overall socioeconomic feasibility of the business model. The following table elaborates the assumptions made on the stochastic variables.
1The NPV was calculated for the total capacity of 2,000 tons as the aim is to estimate the potential benefits and costs. In the financial analysis section (Table 9), the NPV was calculated assuming 75-90% of the total capacity are sold.

30
Table 18: Variables used in the stochastic analysis of the Briquette business model
Variable Unit Distribution specified Source
Price of briquette USD/Kg Triangular: (0.25 , 0.282, 0.35) Based on existing business
Discount rate % Triangular: (10%, 12%, 15%) Assumed
Carbon Credit price USD/t CO2 eq. Triangular Distribution (5,7,10) Assumed
The below Figure (Figure 1) shows the probability distribution obtained for the NPV based on the stochastic variables described above. The probability distribution obtained shows that the mean NPV of the net societal benefits (benefits over and above costs) for such business operating at a scale which takes up all the agrowaste of the city is USD 13.6 million. The 90% confidence interval indicates values between USD 12.45 and USD 14.75 million. The above figure also shows that the probability that the net benefits will fall below the mean NPV is 49.4% which projects a higher variability of the NPV.
Figure 2: Probability Density of NPV of briquette business in Hanoi
Conclusion
This study assessed the socio-economic impact of a dry fuel manufacturing business model in Hanoi, Vietnam. The socio-economic analysis is conducted based on the valuation of financial, environmental and health benefits and costs associated with the business model. The following conclusions can be drawn from the study:
- The environmental impacts associated with the business model were estimated based on emissions avoided from kerosene combustion and open burning of agricultural residues net of emissions from the briquette business which included agricultural residue transportation, briquetting and transportation and combustion of briquettes. The major contribution to GHG emission savings is from avoided use of fuelwood. For other criteria emissions, major savings are from avoided burning of agricultural residue in the open field. The combustion of briquettes in stoves contributes the highest GHG and other criteria emissions. Using efficient cook stoves for

31
combustion of the briquettes and improving the combustion efficiency of the briquettes could reduce the life cycle emissions of the briquette fuels. Compared to the baseline scenario, the briquette business results in net GHG and other criteria emission savings.
- The dry fuel manufacturing business model, in addition to combating deforestation and climate change, generates additional income for farmers, creates jobs for local residents, and enables end users to save on energy costs as well as improving the cooking environment.
- Looking at the overall socio-economic impacts, the business model is both financially and economically feasible. There is a significant increase in the economic feasibility of the business due to social and environmental benefits associated with the business.
- The major contribution to the economic feasibility of the business is from the social benefits with major benefits coming from the savings in energy costs to end users. Thus from a socio-economic perspective, the dry fuel manufacturing business model is highly attractive.

32
Socio-economic impact assessment of Energy Service Companies at scale (Agro-waste to energy - electricity) business model in Vietnam
Introduction
The access to modern form of energy is a challenge to most countries in Sub-Saharan Africa, where the majority of people still depend on raw biomass source for their energy needs. This prevailing situation stifles developmental efforts and encourages the prevalence of poverty. It is generally accepted fact that the access to reliable and affordable energy is imperative for the economic and social development of a country. The economic prosperity and quality of life of a country are closely linked to the level of its per capita energy consumption (Singh and Sooch, 2004). The provision of reliable, secure and affordable energy services is a key factor in providing basic human needs that improve the quality of life and that ensure sustainable development (Amigun et al., 2010). Consequently, initiatives to improve the availability of and reliable access to energy for the poorest communities around the globe has been central to developmental efforts. In such instances the use of small scale sustainable energy sources such as biomass gasification is often preferred over the extension of existing national grid infrastructure, which in most developing countries is already struggling to cope with existing demand (Hazelton et al., 2013). The majority of the population in Vietnam are rural dwellers with 84% of the population living in rural communities, however, connection to the nation’s electrification grid is centered on the major cities leaving only 1% of the national electrification grid available to rural dwellers (Buchholz and Volk, 2012). Most Vietnamese rely on kerosene for energy and about 90% of the total energy needs of Vietnamese are supplied by fuelwood (Bingh, 2004). It is well accepted that this fuelwood consumption is not sustainable and is also an inefficient source of energy with its associated adverse social, health and environmental consequences. Low levels of development emanating from inadequate access to energy is therefore a major issue in Vietnam where the majority of people depend on biomass use for their energy sources. In order to reduce the over dependence on the already overstretched energy infrastructure, Vietnam’s decentralized energy sources are being encouraged including the use of local biomass resources in energy generation which forms the focus of the country’s renewable energy policy. It is a generally held view that small scale, decentralized, wood-based bio power systems could be more efficient in meeting the energy needs of rural households as well as enable the achievement of their development objective where rural Vietnam is no exception. This therefore makes such systems a potentially viable alternative off-grid electricity and energy solution to rural Vietnam.
This study sets out to conduct a socioeconomic impact assessment of a small scale energy service company in Vietnam that uses the process of biomass gasification to process residue from agricultural production (mainly corncobs) to generate electricity, which is then sold to surrounding communities through a mini grid. The socio-economic analysis is conducted based on the valuation of financial, environmental and health benefits and costs associated with the business model.
Technology description
Biomass gasification enable the conversion of biomass waste including agricultural residues into producer gas, which can then be burned in simple or combined-cycle gas turbines to produce energy or
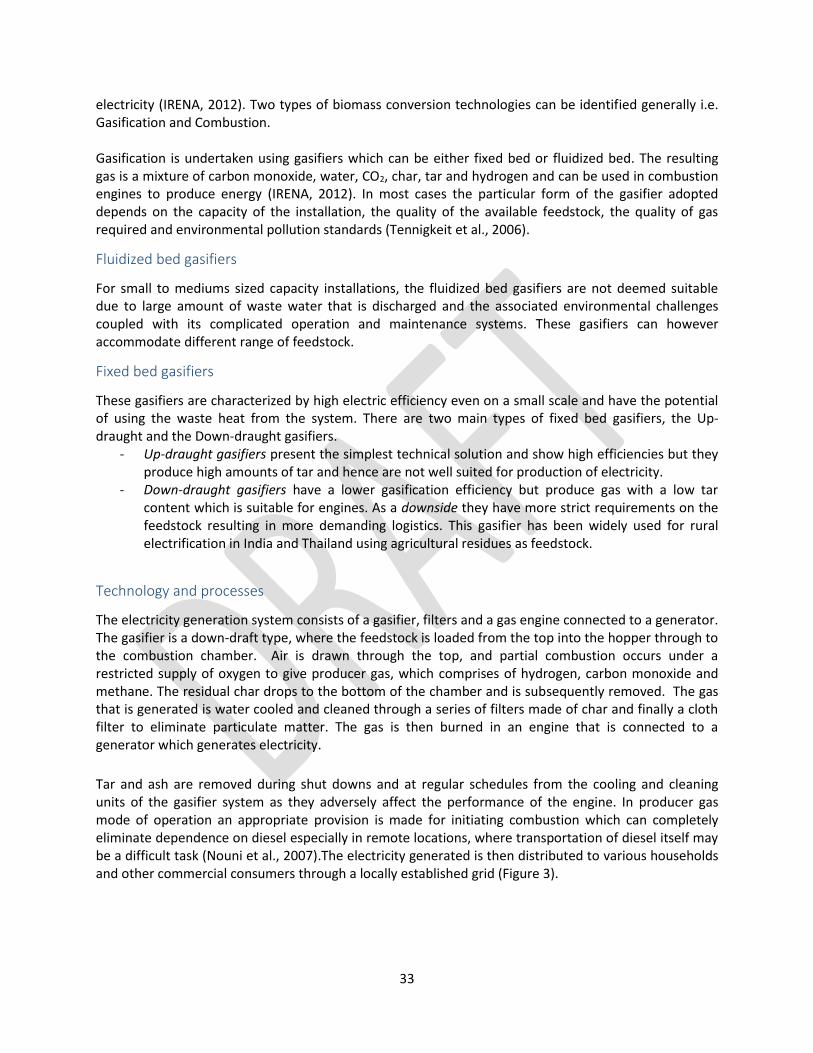
33
electricity (IRENA, 2012). Two types of biomass conversion technologies can be identified generally i.e. Gasification and Combustion. Gasification is undertaken using gasifiers which can be either fixed bed or fluidized bed. The resulting gas is a mixture of carbon monoxide, water, CO2, char, tar and hydrogen and can be used in combustion engines to produce energy (IRENA, 2012). In most cases the particular form of the gasifier adopted depends on the capacity of the installation, the quality of the available feedstock, the quality of gas required and environmental pollution standards (Tennigkeit et al., 2006).
Fluidized bed gasifiers
For small to mediums sized capacity installations, the fluidized bed gasifiers are not deemed suitable due to large amount of waste water that is discharged and the associated environmental challenges coupled with its complicated operation and maintenance systems. These gasifiers can however accommodate different range of feedstock.
Fixed bed gasifiers
These gasifiers are characterized by high electric efficiency even on a small scale and have the potential of using the waste heat from the system. There are two main types of fixed bed gasifiers, the Up-draught and the Down-draught gasifiers.
- Up-draught gasifiers present the simplest technical solution and show high efficiencies but they produce high amounts of tar and hence are not well suited for production of electricity.
- Down-draught gasifiers have a lower gasification efficiency but produce gas with a low tar content which is suitable for engines. As a downside they have more strict requirements on the feedstock resulting in more demanding logistics. This gasifier has been widely used for rural electrification in India and Thailand using agricultural residues as feedstock.
Technology and processes
The electricity generation system consists of a gasifier, filters and a gas engine connected to a generator. The gasifier is a down-draft type, where the feedstock is loaded from the top into the hopper through to the combustion chamber. Air is drawn through the top, and partial combustion occurs under a restricted supply of oxygen to give producer gas, which comprises of hydrogen, carbon monoxide and methane. The residual char drops to the bottom of the chamber and is subsequently removed. The gas that is generated is water cooled and cleaned through a series of filters made of char and finally a cloth filter to eliminate particulate matter. The gas is then burned in an engine that is connected to a generator which generates electricity.
Tar and ash are removed during shut downs and at regular schedules from the cooling and cleaning units of the gasifier system as they adversely affect the performance of the engine. In producer gas mode of operation an appropriate provision is made for initiating combustion which can completely eliminate dependence on diesel especially in remote locations, where transportation of diesel itself may be a difficult task (Nouni et al., 2007).The electricity generated is then distributed to various households and other commercial consumers through a locally established grid (Figure 3).

34
Figure 3: Process diagram of gasification
Overall approach to socioeconomic analysis
In this study the economic analysis of agro- waste to electricity – ESCO business model is conducted based on the valuation of socio-economic, environmental and health benefits and costs associated with
the business model. Our analysis is based on an 8 MW generation capacity plant. The economic analysis of a project is concerned with its viability from a societal perspective and answers the questions of whether it is economically rational to proceed with the project (De Souza et al., 2011). In contrast to a financial analysis, economic analysis provides a more comprehensive investigation on the effects of a proposed project, takes a broader perspective and determines the project’s overall value to society (Raucher et al., 2006). The analysis, therefore, includes benefits and costs that directly affect the business entity running the project and the effects of the project on households, businesses and industries, and governments. The analysis also includes the benefits and costs that cannot be readily measured using observable market prices and costs (De Souza et al., 2011).
Environmental impact assessment
The environmental impact assessment of an 8 MW capacity biomass gasification plant is carried out to identify the impact on the environment of using agricultural residues in biomass gasification based electricity generation systems to produce electricity and also compare these impacts with those created through the existing mode of disposal of these agricultural residues. The impacts considered under this study include climate change and acidification as shown in the following table (Table ).
Table 18: Environmental impact categories
Environmental impact categories Assessment criteria unit
Climate change Carbon dioxide CO2 Methane CH4 Nitrous Oxide N2O
Kg CO2-equivalent
Acidification Sulphur dioxide SO2 Nitrogen Oxide NOx
Kg SO2 Kg NOx
Climate change impacts (GHG) emissions are expressed in a common unit of CO2-equivalent. For each emission, the characterization factor with global warming potential (GWP) employed is given as: Carbon dioxide 1 CO2-equivalent, methane (CH4) 21 CO2-equivalent and Nitrous Oxide (N2O) 310 CO2-equivalent (IPCC, 2001). The emissions with acidification potential are given the following characterization factors: Sulphur dioxide (SO2) 1 S02-equivalent and Nitrous Oxides (NOx) 0.7 SO2-equivalent (Kimming et al., 2011). The GHG emissions balance is estimated based on the baseline scenario i.e. the open burning of agricultural residue on farms and the use of fossil fuel based electricity generator by non-households or commercial and institutional users for their electricity needs. The climate change mitigation benefits of
Gasifier Biomass
Storage
Gas clean up Blower
Engine Generator Households &
Businesses
Electricity
Transmission &
Distribution

35
the agricultural residue gasification system is assessed based on the findings of a number of life cycle assessment studies (Shafie et al., 2014; Ruiz et al., 2013; Zanchi et al., 2013).
Baseline scenario
The situation under baseline scenario is that agricultural residues mainly corncobs are burnt in the open field after processing of the harvest by removing the seed from the cobs. Households derive energy for their lighting needs from kerosene. Electricity supply for commercial centers and other public centers are derived from fossil fuel (diesel generators).The GHG and other particle emission effects from agricultural residue burning are estimated based on Shafie et al. 2014. Emissions from fossil fuels (diesel and kerosene) are calculated based on Sparrevik et al., 2012. The GHG and other emissions avoided as a result of using the agricultural residues and the generation and use of electricity are measured in terms of the avoided kg of CO2 and other pollutants (SO2 and NOx).
System boundary
The system boundary for this study starts with agricultural residue collection and transportation and ends with the electricity generation process. The total agro-waste generation in Hanoi and the peri-urban areas are estimated to be 1000 tons per day (Sabiiti, 2011). The financial analysis looked into the viability of an 8MW electricity generating plant which consumed 250 tons of agrowaste per day. Given this condition, it has been assumed that 4 such plants need to operate in Hanoi and the peri-urban areas. The environmental impact at each stage is accounted for by calculating the GHG and other criteria emissions. However, there are two constraints of the socioeconomic model. First, although the emissions from agrowaste was calculated in the baseline condition, the economic value averted from acidification was partly assessed by the health benefits achieved by generation of the electricity from the agrowaste. The primary reason for the partial assessment was due to paucity of data on economic value of acidification averted in the context of Hanoi. Secondly, energy used and the environmental impacts associated with the main agricultural crop production and equipment employed in the gasification process were not included within the scope of this study.
Source of energy for end users under baseline
Under baseline it was assumed that households derive energy for their lighting needs from kerosene. Electricity supply for commercial centers and other public centers are derived from fossil fuel (diesel generators). In Vietnam, about 84% of the electricity comes from hydropower and the rest from coal based power plants. The environmental emissions associated with the use of kerosene lamps by households, diesel generators and coal based thermal power plants are shown in Error! Reference ource not found.. Table 19: GHG emissions associated with kerosene use and diesel generators under baseline
Source of emissions Unit Value
Kerosene: CO2 emissions Kg CO2/lit 2.520 CH4 emissions Kg CH4/lit 0.00035 N2O emissions Kg N2O/lit 0.000021
Diesel generators: GHG emissions (CO2& CH4)
Kg CO2-eq/kwh 1.227
Coal based electricity

36
GHG emissions (CO2& CH4)
Kg CO2-eq/kwh 0.9
Source: Zanchi et al., 2012; World Resource Institute http://www.ghgprotocol.org/calculation-tools/all-tools http://www.epa.gov/ttnchie1/conference/ei20/session5/mmittal.pdf; http://publications.jrc.ec.europa.eu/repository/bitstream/JRC21207/EUR%2019754%20EN.pdf
Agricultural residue under baseline
Agricultural residues are burnt in open field after processing of the harvest by removing the seed from the cobs. The GHG and other emission effects from open burning were estimated based on Shafie et al., 2014 and Sparrevik et al., 2012 (Table 20). Table 20: Emission factors for open burning of agricultural residue under baseline
Emissions Emission factor (kg emission /kg of dry residue burned)
CO2 1.522a CH4 0.0012b N2O 0.00007 b SO2 0.002 b NOx 0.0031 b CO 0.0347 b
Source: aShafie et al., 2014; Sparrevik et al., 2012
Agricultural residue transportation and gasification
The agricultural residue to be used in the biomass gasification process is corncobs sourced from maize farmers spread across the communities. For an 8MW capacity plant a total of 250 tons of biomass is required per day. The GHG emissions are calculated in terms of CO2-equivalent of all emissions as a result of agro- residue collection and transportation to the gasifier per kwh of electricity generated. Emissions associated with transportation of agro-residue are calculated assuming a maximum distance of 30km radius from the gasifier to the various collection points using a truck of 25 tons load capacity. The effective load carried on each trip is 15 ton (Ruiz et al., 2013). The use of truck results in CO2
emissions from use of fossil fuels (Ruiz et al. 2013). Following Ruiz et al., (2013) this study assumes CO2 emissions of 3 kg/liter of diesel used on the average distance of 30 km and mean diesel consumption of 0.45 liters/km. The table below shows the parameters and assumptions made in the residue transportation model for a plant capacity of 8 MW. The total GHG emissions from transportation of the agro-waste utilizing the parameters mentioned above was calculated to be 175.5 tons of CO2 eq. for each plant annually. Similarly, the GHG emissions from the gasifier was estimated to be 18,614.45 tons of CO2 eq. for each plant annually. Therefore, the total emissions from each of the plant from transportation and gasification is around 18790 tons of CO2 eq. annually. Table 21: CO2 emissions from gasification plant (transportation of agro-waste and gasification)
Transportation parameter unit value reference
Average distance of travel by agro-waste to gasifier km 30
Ruiz et al., (2013)
Capacity of truck for transporting agro-waste Kg 25,000 Ruiz et al., (2013) Max biomass weight in truck based on truck volume kg 15,000
Ruiz et al., (2013)

37
Diesel consumption rate of truck liters/km 0.45 Ruiz et al., (2013) Number of trips per annum # 4333 Calculated CO2 emissions per liter of diesel Kg CO2/lt 3 Ruiz et al., 2013 CO2 emissions- Gasification Kg CO2eq/kwh 0.612 Zanchi et al.,2013
Environmental impact results
This section presents the GHG and other criteria emissions under baseline and alternative scenario. The
emissions under baseline are the emissions avoided as a result of utilizing agricultural residue for
electricity generation thereby replacing kerosene used by households and diesel generators by non-
household users. The emissions from the business are the total of emissions associated with agro-
residue transportation and emission during gasification process. Total emission savings is the total
avoided emissions net of the emissions from the gasification plant.
Emissions under baseline scenario
This section presents the GHG and other emissions under baseline and under the ESCO social enterprise model. Under the baseline scenario the total emissions are those attributed to emission from open burning of agro residue, emissions from the use of kerosene lamps for lighting by households and emissions from the use of diesel generators. A sum of all these emission levels gives total avoided emissions due to electricity use from the ESCO model. The business model also results in environmental emissions which are generated from the transportation of feedstock and the gasification process itself. Total GHG emissions savings is the difference between total avoided emissions and total emissions from the gasification process. Table 22 shows the emissions avoided as a result of electricity from the gasification of agro-residue. Net GHG emissions avoided per unit of electricity generated is 3.6 kg CO2-equivalent/KWh. Avoided emissions from diesel generators are the most significant sources of saving in GHG emissions accounting for 78% of the total savings followed by open agro-residue burning 16%. Savings from kerosene use and thermal power used by the industries accounted for 3% each of the total savings in GHG emissions. Considering other emissions, all emission savings originate from avoided burning of agro-residue in the open field and coal based thermal power plants. Table 22: Emission savings per kWh of electricity generated by ESCO model
Savings from GHG emissions Other criteria emissions
CO2 SO2 NOx CO
Open burning of agro-residue 0.675 0.0009 0.0014 0.0154
Diesel generators 3.316 - - -
Kerosene use 0.115 - - -
Thermal power 0.136 0.007 0.004 -
Total savings 4.241 0.0079 0.0054 0.0347
Emissions under ESCO model
The gasification of agricultural residue to generate electricity is not without emission of GHGs. These emissions are from transportation of agro-residue to the gasification plant and emissions from the gasifier. Table 23 shows GHG emissions from the business model in CO2-equivalent. The highest

38
contribution to GHG emissions is from the gasification process. The GHG emissions per unit of electricity generated is 0.642 kg CO2-equivalent for all the four plants together annually. Table 23: GHG emissions per kwh of electricity generated under ESCO model (kg CO2-eq/kwh)
Emissions from GHG emissions
CO2
Agro-residue transportation 0.006 Gasification process 0.6536
Total emissions 0.642
Net emissions
The process of gasification produces the lower GHG emissions in terms of CO2–equivalent per KWh of electricity compared to the emissions under the baseline. Considering the scope and system boundary for this study, the net GHG emissions savings is 3.6 kg CO2-equivalent/KWh. This indicates that the total emissions savings far outweigh the emissions generated. The overall net GHG emissions from an 8 MW capacity biomass gasification plant is shown in Figure 9. GHG emissions associated with burning of agro-waste, use of diesel generator and kerosene lamps for lighting for households are negative representing GHG emission savings from use of electricity generated from gasification of agro-waste. The highest savings in GHG emissions are mainly from avoided burning of agro-waste while the highest emissions from the business model is from the gasifier. The GHG emissions from the gasification are far less than the emissions avoided under the baseline and thus resulting in net GHG emission savings of 1,139 ton CO2eq per annum.
Value of Carbon credits and other emissions
In this study it is assumed that carbon credits will be traded in Carbon Emission Reduction (CER) units as CER is suited for large scale projects and are sold in volumes that are targeted to clients seeking small reductions to offset their footprints. The CER unit is equivalent to a reduction of 1 ton of CO2equivalent emissions (Reuster 2010). Based on the World Bank (2014), carbon credit prices in 2013 is about USD 0.51 (€ 0.37) (Table 24). The total annual value of carbon credit is USD 4,355,359. However value of the other emission savings that have acidification potential (NOx and SO2) were not included in the analysis.
Table 24: Annual value of GHG emission reduction from ESCO model (120 KW)
Item Amount Total GHG emission savings (ton CO2eq) 8,727,818 Total GHG emissions from business (ton CO2 eq) 187,899 Net emission savings (ton CO2eq/year) 8,539,918 Price of VER (USD/ton CO2eq) 0.51
Total value of Carbon credit (USD/year) 4,355,359
Social impacts
Savings for end-users
Using electricity from the gasifier in Vietnam can save electricity import from China. The cost of buying electricity from China is 0.0608 USD/kwh. The gasifier has a capacity of 8 MW which is equivalent to a

39
total of 292,864,000 KWh electricity generated at the 10 plants. Assuming energy efficiency of 88% and 12% captive power, the net available electricity is assumed to be consumed by the household, commercial and the industrial sector based on the present demand for electricity. The annual savings from lesser import from China is 17,806,131 USD.
Table 25: General information on alternative energy use
Unit Value Reference
Import reduction from China
Amount of import reduced Kwh/year 29,2864,000 Calculated
Price of buying electricity from China USD/kwh 0.0608
Total Savings USD/year 17,806,131 Calculated
Additional income to farmers and job creation
The gasification plant contributes to improving the local economy through job creation and providing of additional income to farmers. Agricultural waste and are currently burned in open field. However in order to have a sustainable supply of feedstock for the gasification plant, it requires the setting up of linkages and if possible purchase deals with both small and large scale farmers. This provides extra revenue stream to local farmers who will sell agricultural waste for extra income. The value of additional income to farmers from the gasification plant is USD 9,750,000 per annum. The gasification plant on average contributes to providing additional income to the farmer of 15 USD/ton of agricultural residue. The gasification plant contributes to job creation for the local community. The single plant of 8 MW employs about 11 workers earning a total annual salary of USD 22,000 and hence the total employment generated is 110 with an annual income generation of USD 222,000. In addition to providing additional income and job creation, the plant is likely to have indirect impacts to local economy as new businesses might thrive due to availability of electricity generated by the gasification plant. However, other indirect impacts to the local economy are not accounted for in this study.
Health impacts
Biomass smoke contains a large number of pollutants that pose substantial risks to human health. Harmful pollutants include particulate matter, CO, NO2 and SO2 emissions. Exposure to biomass smoke increases the risk of diseases such as chronic bronchitis, chronic obstructive pulmonary diseases and lung cancer (Lim et al., 2013; Norma, 2011; WHO, 2002). Burning of agro-waste in the open field can cause health hazard and the whole population of Hanoi which is 6562000 is exposed. The DALY/1000 capita/year for outdoor air pollution as provided by WHO is 0.5. The population which is exposed to kerosene use is 135,373. The DALY/1000 capita/year for indoor air pollution is 2.8. The DALY value for Vietnam is 500 USD and we also assume that only 5 percent of the total health expenditure can be saved. Therefore, total health cost avoided due to production of electricity is 91,501 USD annually.In addition to health impacts associated with combustion of briquette, health impacts on workers’ exposure to emission pollutants during briquette manufacturing should also be taken in to consideration. Thus there is a need to provide workers with protective gears. Health impacts associated with power plant workers are not quantified in this study.
Financial Analysis
This section presents the financial feasibility analysis and results of business model generating 8 MW from agrowaste. The financial viability is analyzed based on Return on Investment (ROI),Net

40
Present Value (NPV) and Internal Rate of Return (IRR) valuation criteria. The capital cost for the gasifier plant per installed capacity is 2,087 US$ per kW installed (Buchholz and Volk 2007; IFAD, 2010; Buchholz and Da Silva, 2010). Total investment cost for each of the plant is USD 6,530,735. The project life of the plant is assumed to be 15 years. The financial assessment of the 10 plants operating in the city shows positive net profit, however there is a negative NPV from the business. The rate of investment (ROI) is 3% implying that revenues are not high enough to recover all costs of the business. This is also observed that the benefit-cost ratio is less than 1 (0.415) indicating that financially the model is not viable.

41
Table 26: Financial results of ESCO model (USD)
Years
0 1 2 3 4 5 6 7 8 9 10 11
Total investment cost: 6,53,07,350
Total revenues 3,07,30,050 1,22,92,020 1,22,92,020 1,22,92,020 1,22,92,020 1,35,21,222 1,35,21,222 1,35,21,222 1,35,21,222 1,35,21,222 ….
Total production and other costs 1,64,29,600 67,61,430 69,56,707 71,57,843 73,65,013 75,78,398 77,98,185 80,24,565 82,57,736 84,97,903 ….
Depreciation 43,53,000 17,41,200 17,41,200 17,41,200 17,41,200 17,41,200 17,41,200 17,41,200 17,41,200 17,41,200 ….
Interest Payments 71,83,809 21,69,523 12,89,523 3,21,523 - - - - - - -
Profit before tax 27,63,642 16,19,867 23,04,589 30,71,453 31,85,807 42,01,624 39,81,837 37,55,457 35,22,286 32,82,119 ….
Income tax 8,29,092 4,85,960 6,91,377 9,21,436 9,55,742 12,60,487 11,94,551 11,26,637 10,56,686 9,84,636 ….
Net profit 19,34,549 11,33,907 16,13,213 21,50,017 22,30,065 29,41,137 27,87,286 26,28,820 24,65,600 22,97,483 ….
Cash flow (6,53,07,350) 62,87,549 28,75,107 33,54,413 38,91,217 39,71,265 46,82,337 45,28,486 43,70,020 42,06,800 40,38,683 ….
Discount rate 12%
Discounted cash flow 56,13,883 22,92,018 23,87,605 24,72,939 22,53,402 23,72,218 20,48,457 17,64,978 15,17,014 13,00,348 ….
Present value of cash flow 2,71,02,997
NPV (3,28,98,502)
IRR -1%
ROI (Financial) ….
ROI (Financial average) 3%
BCR 0.415

42
Socioeconomic results
The socioeconomic analysis of ESCO business model is performed by putting monetary value on all quantifiable cost and benefits in order to calculate the NPV, benefit cost ratio (BCR) and ROI for the business model. The consolidated socio-economic results are presented in Table 27. The analysis looked at the potential impact of ESCO model at three levels where the levels range from including the direct benefits and costs that affect the business entity to including indirect benefits and costs to other sectors. The annual social and environmental benefits and costs from the business were discounted at a rate of 12% to obtain the present value of social and environmental impacts. The ESCO model, when only the direct benefits are accounted for results in negative NPV and BCR of less
than 1 implying that the business model is not financially feasible. The business model performs better
when the financial and environmental costs and benefits are taken into account. However, the net
positive incremental benefits from the environmental impacts are not high enough to make the business
model feasible as the NPV is still negative and the BCR is less than 1. The business model becomes
economically feasible when all externalities are included in the analysis. The NPV when all externalities
are considered is USD 174,098, 966 and the BCR is 3.58. Thus, major contribution to the economic
feasibility of the business is from the social benefits. The total value of the social benefits of the business
is USD 179 million with major benefits coming from the additional income to farmers and jobs created
for the local community. Thus the ESCO business model is economically feasible but not financially
feasible.
Table 27: Net socio-economic results of ESCO model
Socio-economic result (USD/year) Financial value
Financial and environmental value
Social, environmental and financial value
Financial result:
NPV (32,898,502) (32,898,502) (32,898,502)
Environmental benefit: Value of net GHG emission saving 27,976,857 27,976,857
Social benefit: Savings in energy costs for end users 114,378,546
Additional income to farmers and employment 64,055,625 Health Benefits 587,762
Total Social Benefits 179,098,933
NPV (32,898,502) (4,921,645) 174,098,372 ROI (average) 3% 12% 53% BCR 0.42 0.84 3.58
Sensitivity analysis
The estimated figures shown above represent the deterministic model and hence to understand the sensitivity of the model, some select variable were treated as stochastic and the probability distribution function of the NPV was derived. The following table (Table 28) shows the different variables selected for the stochastic analysis. The variables that were selected for the analysis are as follows – (i) capital cost of the gasifier – this was based on the unit investment cost made on the gasifier; (ii) Discount rate

43
for the estimation of NPV; (iii) Carbon credit price which is assumed to vary between 0.51 – 3.8 USD/ tons of CO2 equivalent; (iv) economic value of DALY2.
Table 28: Table indicating the stochastic variables for the ESCO model
Variable Unit Distribution specified Source
Capital cost of the gasifier USD/KW Triangular: (2010, 2087,2890) for the smaller plant
Buchholz and Volk, 2007; IFAD, 2010
Discount rate % Triangular: (10%, 12%, 15%)
Assumed
Carbon Credit price USD/t CO2 eq. Triangular: (0.51, 1, 3.8) Assumed
Distance travelled for transportation of agrowaste
Kms Triangular: (25, 40, 50) Assumed – distance increases with passage of time
Economic value of a DALY USD Triangular Distribution (250, 500,1300 )
The lower range corresponds to estimates for cancer and higher range to gross national per capital income.
Figure 4: Probability density function of the NPV for ESCO model
The above figure (Fig.4) shows the probability density function of the NPV for the societal benefits. The mean NPV derived is 241.05 million which is higher than the deterministic model. The density function shows that to achieve the mean NPV the success rate is 45%.
Conclusion
This study assessed the socio-economic impact of energy service company (ESCO) business model in Kampala, Uganda. The socio-economic analysis is conducted based on the valuation of financial, environmental and health benefits and costs associated with the business model. The following conclusions can be drawn from the study:
2 In some studies a percentage value of DALY is also considered for the socio-economic analysis.

44
- From the socioeconomic perspective, findings from the study indicate that the use of
agricultural residue as a feedstock in a small scale biomass gasification to electricity business
model is viable in Uganda and has the potential of impacting positively the health,
environmental and social life of the rural dwellers. The business model resulted in a BCR of 3.58
and ROI of 54% indicating that (although not all environmental and social impacts have been
factored in the analysis) the business provides positive environmental and social impacts that
offsets it costs.
- Net GHG emissions saved per kwh of electricity generated is 3.6 kg CO2eq. The highest savings
in GHG emissions would be mainly from substituting diesel generators for the commercial
establishments while the highest emissions from the business model is from the gasifier.
- Major contribution to the economic feasibility of the business is from the social benefits. The total value of the social benefits of the business is USD 118 million with major benefits coming from the additional income to farmers and jobs created for the local community.

45
Socio-economic impact assessment of Manure to Power business model in Hanoi
Introduction
This business model is initiated by agro industries such as piggeries, cattle farms, poultry, sugar processing factories, cassava or palm oil industrial factories and slaughter houses to generate energy from their by-products. The waste generated by these industries is used to generate electricity which is used in house for their own energy requirements. The technologies applied and the resulting energy products vary depending on the type of waste processed. These include co-generation unit to produce electricity, distillery unit to produce ethanol/alcohol and biogas unit to produce electricity and heat. Production technologies such as Covered Lagoon Bio-Reactor are also suitable for processing wastewater discharged from industrial factories such as starch and palm oil factories to produce biogas. The electricity produced by the cogeneration unit or by the covered lagoon bio-reactor is sold to the state utility on a long term power purchase agreement. The alcohol/ethanol produced from the distillery unit of sugar processing factory is sold to petroleum and pharmaceutical companies while the energy produced by the biogas unit is used onsite as input fuel to the cogeneration unit. The discharge from the biogas unit, which is high in organic matter can be distributed to farmers to be used as fertilizer. The ownership and operation of the energy producing units take different forms. The energy production technologies are either designed, constructed, owned and operated by the agro-industrial processing factory or; are installed by an external private entity on a Build, Own, Operate, Transfer (BOOT) model. In the latter case, the private entity brings investment to set up the energy production technology while the concessionaries i.e. the agro-industrial factories provide land and inputs. The private entity designs, constructs and maintains the energy production unit until BOOT period is expired after which it assists the host company to operate the unit. The business model tested for financial feasibility targets piggeries where the pig manure is used to generate biogas and the energy from biogas is used for internal energy requirement for running piggeries.
Technology
The technology comprises of a bio-digester and an electricity generation system. The biodigester is an
anaerobic reactor which captures methane gas produced by fermentation of organic material from
swine production. Within the bio-digester, the manure is transformed through a process called
methanogenesis, in which the methanogenic bacteria transform organic particles into methane (CH4).
From this process, biogas is produced which is subsequently captured and directed to electricity
generation or CHP (combined heat and power) unit. A biogas-cleaning unit will be incorporated before
the generation unit if necessary.
Equipment and infrastructure required are:
Bio-digesters
Substrate mixing equipment and/or machinery

46
Biogas storage and cleaning equipment
Electricity generation or CHP unit
Complementary equipment and facilities for the modular units
Overall approach to socioeconomic impact assessment
The socio-economic analysis of a project is concerned with its viability from a societal perspective and answers the questions of whether it is economically rational to proceed with the project (De Souza et al., 2011). In contrast to a financial analysis, socio-economic analysis provides a more comprehensive investigation on the effects of a proposed project, takes a broader perspective and determines the project’s overall value to society. The analysis, therefore, includes benefits and costs that directly affect the business entity running the project and the effects of the project on households, governments and other businesses outside of the business. The analysis also includes the benefits and costs that cannot be readily measured using observable market prices and costs (De Souza et al., 2011). In this study, the financial viability of the business was assessed through a cost benefit analysis and for the environmental impacts, a life cycle emissions of agricultural-residue derived briquette fuel are evaluated. The following sections will elaborate on the assumptions made, the scenarios modeled and the data sources used for assessing the environmental, social and financial impacts associated with power capturing from pig slurry business model.
Baseline and alternative scenarios
In conducting socio-economic analysis of any project, it is important to determine the baseline scenario which will be the benchmark to compare project alternatives. This study will assess the economic viability of power generation from pig slurry model and a comparison of the costs and benefits of the business model vs. a business as usual scenario. Pig slurry from herd is often seen to be open dumped or thrown into water bodies in Hanoi and therefore, we have taken this as a baseline scenario for the cost-benefit analysis.
System boundary
The system boundary applied in this study contains establishment of biogas plant at the pig herd and production of electricity to self-consumption at herd and selling to households and business in rural areas. Since pig slurry is used as input in the power generation process, we assumed that under baseline, the pig slurry is open dumped or thrown into water bodies. Thus, emissions associated with this practice were accounted for when assessing the environmental impacts. There, is risk of emissions of methane in the production of electricity generation, but we ignore this aspect in this study. In per-urban areas of Hanoi presently there are 3 major livestock factories. The present study considers electricity generation from these 3 major plants given the plant size of rearing a herd size of 1,500 animals as done in the financial analysis of power capture from animal manure. The following table (Table 1) illustrates the plant capacity for the respective animal rearing companies (EAWAG, 2014).
Table 29: Major companies rearing animals in per-urban Hanoi
Company Number of animals Power plants that can be installed
National pig research and Type of animal: Pig (feeding and 5 plants of 218 kWh capacity

47
development center multiplication). 7,000-8,000 pig head/year
Hanoi domestic animal breeding Center
Type of animal: Pig 2,500 pig head/year
2 plants of 218 kWh capacity
Co Dong service and livestock co-operative
Type of animal: Pig, 1,600 pig head/year
1 plants of 218 kWh capacity
Environmental impact assessment
Pig Slurry in the baseline scenario
In the base line scenario we evaluate the environmental impact of a pig herd consisting of 1500 pigs. Usually the pig slurry is either used as manure in the field or dumped into the water bodies indiscriminately which leads to surface and ground water pollution. Pig slurry contains pollutants like Nitrogen, Methane, Phosphorous, copper, copper, zinc, manganese, and calcium (See Table 1). Each pig produces slurry of 6.12 m3 annually. Therefore, 1500 pigs produce pig slurry of 9180 m3 per year. We assume solid portion of pig slurry is 6 percent and density of pig slurry is 1010 kg/m3. Hence, solid pig slurry produced annually is 556,308 kg/year. Given this one can easily estimate the emissions of pollutants from pig slurry and which is given in the last column of the Table 1. Open dumping of pig slurry produces 151,360 kg of methane.
Table 30: Chemical composition of Pig slurry
Parameter Unit Growing-finishing Total Emissions (kg)
Ammonium nitrogen mg/kg 2846 1583 Phosphorous mg/kg 1690 940 Potassium mg/kg 3405 1894 Copper mg/kg 49.9 28 zinc mg/kg 82.9 46 Manganese mg/kg 29.85 17 calcium mg/kg 1700 946 Magnesium mg/kg 674 375 Methane m3/kg 0.243 151360
Surface and ground water Pollution under baseline
Only 6 percent of pig slurry is solid and therefore, 94 percent is liquid in nature. The pollutants contained in the liquid of pig slurry for ground water pollution are Ammonium Nitrate and Nitrate-N. Amounts of Ammonium Nitrate and Nitrate-N in pig slurry liquid are 4.25 mg/ltr and 0.33 mg/ltr respectively. Therefore, total ammonium nitrate and nitrate-N discharged by one pig heard are 37 kg and 3 kg annually. Similarly, components of surface water pollution are pH, DO, BOD, COD, NH4, NO3, PO4 are 7.31, 2.72, 90, 124, 5.09, 1.85, 1.86 mg/ltr. Hence total amount of discharge of pH, DO, BOD, COD, NH4, NO3, PO4 in surface water by a pig heard are 63, 23, 777, 1070, 44, 16, 16 kg annually. In the absence of abatement cost of these pollutants, the present study uses the pollution from common pollutants like nitrogen, phosphate, suspended solids, COD and BOD. It is assumed that for each of the animals 20 liters of wastewater is being generated which entails that 240 lts. of water is being produced. Based on the environmental pollution costs of the undesirable outputs as cited above (UNEP, 2010) the costs for groundwater and surface water pollution is estimated to be USD 712,587 annually.

48
Table 31: Components of ground and Surface water pollution in pig slurry
Ground water pollution Unit Unit
NH4-N (Ammonium Nitrate) Kg 37 mg/ltr 4.25
NO3-N (Nitrate-N) Kg 3 mg/ltr 0.33
Surface water pollution
DO Kg 23 mg/ltr 2.72
BOD Kg 777 mg/ltr 90
COD Kg 1070 mg/ltr 124
NH4 Kg 44 mg/ltr 5.09
NO3 Kg 16 mg/ltr 1.85
PO4 Kg 16 mg/ltr 1.86
Environmental Benefits of Electricity generation from pig slurry under alternative
In the alternate scenario solid pig slurry produced by a pig heard i.e., 556,308 kg is being used to produce electricity. The quantity of methane produced by solid pig slurry is 0.4 m3/kg. Hence, methane produced out of solid pig slurry is 222,523 m3/year. Biogas constitutes 65 percent methane. Hence, total biogas produced is 342,343 m3/year. Assuming 365 operating days, the biogas yield per day is 938 m3/day. Energy yield from biogas is 5700 Kcal/m3, and conversion factor from KCal to kWh is 0.001163. Hence, we get electricity production of 6218 kWh. We also assume that the power plant operates for 10 hrs in a day, therefore, in an hour 622 kW power is being generated. It is also assumed that efficiency of engine generator is 35 percent and therefore, the capacity of the power plant is 218 kWh. Therefore, total electricity which can be supplied annually in the market is 795,700 kW. The average requirement of electricity per household is 120 kWh/month. Therefore, with the produced electricity only 522 households can be served. 522 households can replace the use of kerosene by electricity and thus reduces the CO2 emissions from kerosene by 94 tons annually. By producing electricity from pig slurry we can avoid the methane emissions and therefore CO2. Power plant helps to reduce the CO2 emissions by 3179 ton of CO2 annually. In total through electricity production from pig slurry of one heard of 1500 pigs, 3273 tons of CO2 emissions can be avoided annually. As there is a need for 8 plants to handle the problem of pig slurry in Hanoi, so 8 plants will help avoid emission and monetary value of that emission is 52,360 USD.
Table 32: GHG emissions avoided due to production of electricity from pig slurry
Emission saved from production of electricity Unit
Emissions from CH4 Tons of CO2/year 25,429
Emissions from Kerosene Tons of CO2/year 94 Total Emissions Tons of CO2/year 25,522 Price of carbon credit USD/ton CO 0.51
Value of emission from a plant USD 13,016

49
Social impacts
Wage income earned under alternative
The socioeconomic evaluation of the introduction of the power generation from the large pig farms assumes only the direct effects on the employment in terms of the employed staff (both shilled and semi-skilled) for the benefits. The indirect effects of power generation and effects within the economy for households and commercial purposes are not considered within the system boundary of the study. The power plant of 218 kWh can generate 3 additional employment. The monthly wage income of an employee of power plant is 168 USD. Therefore, total monthly wage income generated is 504 and annual income of 6048 USD. Hence, total income generated by 8 plants is 48,384 USD per annum.
Expenditure saved from importing electricity from China
Hanoi is a major imported of electricity from China. Therefore, another primary effect of generating renewable energy for resources with the economy provides a trade-off of substituting imported electricity and becoming self-dependent in power. Production of electricity from pig slurry replaces the need for importing electricity from China. One plant can produce 218 kwh/day. Therefore, 8 plants can produce 49,741 kwh/day. The number of operational days in a year is 300 and the importing price of electricity is 0.0628 USD/kwh. Therefore, total import bill saved stands out to be 937,119 USD.
Table 33: Net social gain under alternative scenario
Social Impact: Unit USD
Wage income for employees USD/year 48,384
Expenditure saved from Importing of electricity from China USD/year 937,119
Total money saved USD/year 985,503
Net Gain USD/year 985,503
Health impacts
Open dumping of pig slurry and run-off to water bodies may result in surface and ground water pollution which can cause serious health hazard to the population. Current population of Hanoi is 7,067,000 and according to the estimates given by WHO DALY /1000 capita/year for Indoor air pollution is 2.8 and economic value per DALY is 500. We assume that only 5 percent of total health cost calculated will be incurred. Therefore, under the alternative scenario health cost avoided annually is 494,690 USD.
Financial analysis
In this section, the financial analysis of the briquette is presented. The financial viability is analyzed based on Return on Investment (ROI), Net Present Value (NPV) and Internal Rate of Return (IRR) valuation criteria. The costs of the power plant primarily include capital investment and operating costs which include input cost, labour cost, O&M costs. The useful life of the power plant is assumed to be 15 years. Total investment cost is USD 390,259. The production capacity of the plant is 218 kwh.The selling price of electricity is 0.06kWh. The total number of full time workers is 3 and total monthly labor cost is 508 USD. Operating and maintenance costs are assumed to be 5% for machine and equipment and 2% for building. A discount rate of 12% is assumed. Selling price of briquette and other input costs are subjected to an escalation of 3%. A straight line method of depreciation is used for depreciable capital costs assuming a useful life of 15 years with a salvage value of 10% of total depreciable cost. Current tax for similar businesses in Uganda is 24% comprising of 18% VAT and 6% withholding tax (Refer to

50
financial analysis document for details). The financial analysis of a power capturing from pig slurry is presented in Table 5. Results show that the business model resulted in a positive net profit. Assuming a discount rate of 12% and useful life of 15 years, the business model resulted in a mean NPV of USD 4,593,313 indicating that the business model is financially viable. The benefit-cost ratio for the business model is 2.69.

51
Table 34: Financial results of power capturing from pig slurry (USD)
Year 0 1 2 3 4 5 6 7 8 9
Total capital cost 2722072
Total revenue 652574 694992 740166 788277 839515 894083 952199 1014092 …
Total production and other cost 258382 275177 289104 303937 319734 336558 354475 373557 …
Profit before interest and tax 394192 419815 451062 484340 519781 557526 597724 640535 …
Depreciation 68052 68052 68052 68052 68052 68052 68052 68052 …
Profit before tax 326141 351763 383010 416288 451729 489474 529672 572483 …
Income tax 65228 70353 76602 83258 90346 97895 105934 114497 …
Net profit
260913 281411 306408 333030 361383 391579 423738 457986 …
Cash flow (2722072) 269419 289917 314915 341537 369890 400086 432244 466493 …
Discount rate 12%
Discounted value of cash flows 269419 289917 314915 341537 369890 400086 432244 466493 …
Present value of cash flows 7315385
NPV 1,004,009
ROI (Financial) 10% 10% 11% 12% 13% 14% 16% 17% …
ROI-average (Financial) 18%
BCR-Financial 2.69

52
Socio-economic results
The consolidated socio-economic results are shown in Table 6. The analysis looked at the potential
impact of power capturing from pig slurry at three levels where the levels range from including the
direct benefits and costs that affect the business entity to including indirect benefits and costs to
other sectors. The annual social and environmental benefits and costs from the business were
discounted at a rate of 12% to obtain the present value of social and environmental impacts.
Table 35: Net socio-economic results of power capturing from pig slurry
Socio-economic result (USD/year) Financial
value Financial &
Environmental
Social, Environmental &
financial
Financial result: NPV 1,004,009 1,004,009 1,004,009
Environmental benefit:
Value of net GHG emission saving& Water pollution costs averted
727,503 727,503
Social & Health benefit:
Total social (employment)& Health impact
9,878,124
Total social benefit
9,878,124
NPV 1,004,009 831,512 10,709,636
ROI 18% 20% 464%
BCR 2.69 2.95 6.58
The financial model generates a positive NPV and a benefit-cost ratio of 2.69. It becomes more profitable when environmental benefits are added with financial benefits and the benefit-cost ratio becomes 2.87. The largest contribution comes from social component when it was added together with financial and environment benefits. Taking into account all the components the BCR turns out to be 6.08. Thus from a socio-economic perspective, the power capturing from pig slurry model is very attractive.
Sensitivity Analysis
The primary variables selected for the stochastic model are explained in the following table (Table 8). The different variables that were identified to be stochastic are – (i) discount rate, (ii) price of electricity imported from China, (iii) price of the carbon credit and (iv) economic value of the DALY. Different values of these variables were used to assess the resulting effect on the overall socioeconomic feasibility of the business model. This was obtained through several iterations of the stochastic variables and derivation of the probability distribution of the NPV of the net benefits of introducing power generating plants within the animal rearing farms in the peri-urban areas of Hanoi.
Table 36: Variables selected for the stochastic model - Livestock waste to electricity
Variable Unit Distribution specified Source
Discount rate % Triangular: (10%, 12%, 15%) Assumed
Price of electricity imported from China USD/kWh
Uniform: (0.0602, 0.0628) Assumed as varying

53
Carbon Credit price USD/t CO2 eq.
Triangular: (0.51, 1, 3.8) Assumed
Economic value of a DALY USD
Triangular Distribution (250, 500,1300 )
The lower range corresponds to estimates for cancer and higher range to gross national per capital income.
The following figure (figure 1) shows the probability distribution derived from the iterations of the different values of the stochastic variables and their respective distributions. The mean value estimated is 11.71 million USD and the distribution shows that 54% chance of failure exists to reach the mean value of the societal benefit. Considering the NPV and its mean, the chance of achieving the mean and the ROI, the economic feasibility is at medium level.
Figure 5: Probability Density function of the NPV for net benefits derived from the electricity generation form Livestock manure
Conclusion
This study assessed the socio-economic impact of a power capturing model from pig slurry in Hanoi, Vietnam. The socio-economic analysis is conducted based on the valuation of financial, environmental and health benefits and costs associated with the business model. The following conclusions can be drawn from the study:
- The environmental impacts associated with the business model were estimated based on
avoided surface and ground water pollution, methane emission from pig slurry. The major
contribution to GHG emission savings is from avoided methane emission from open
dumping of pig slurry. Compared to the baseline scenario, the power generation business
results in net GHG and other criteria emission savings.
- The power generation business model, increases the rural electrification, creates additional
jobs for local residents, and enables end users to save on energy costs as well as improves
the indoor environment.

54
- Looking at the overall socio-economic impacts, the business model is financially and
economically feasible. Given the huge environmental benefit associated with it, one can
safely recommend to take up this project although the project is feasible in the medium
range.

55
Socio-economic analysis for Beyond cost recovery – An aquaculture example businesses in Hanoi
Introduction
Wastewater management is a major challenge in many developing countries and policy makers are constantly exploring cost effective measures to mitigate both the direct and indirect negative impact. This is important for individuals who are living below the poverty line. The social costs of poor wastewater management is high, thus innovative approaches which aimed at reducing health risks and improving the environmental conditions are imminently needed. Vietnam is not different from any developing country. Policy makers are engaging relevant stakeholders to explore effective and efficient options for wastewater management.
This report seeks to investigate the viability of a phyto-remediative wastewater treatment model in Hanoi. It is known that Hanoi generates 615,400 m3 of wastewater daily (EAWAG, 2014). 40 percent of the waste water generated is being treated and the rest remains untreated and flows to waterbodies in Hanoi (EAWAG, 2014). The amount of waste water generated in Hanoi can be used for aquaculture and subsequently treated wastewater can be used for irrigation purpose.
Given the context of Hanoi this report investigates the socio-economic impacts of phyto-remediative waste water treatment model in which waste water stream will be used primarily for aquaculture. The potential economic, environmental, Social and health impacts of phyto-remediative waste water treatment model needs to be assessed to ensure its sustainable development. In this study, we evaluated the socio-economic impacts of treating wastewater with pond capacity of 14.4 ha, 4.5 ha, and 1 ha. The socio-economic analysis is conducted based on the valuation of economic, Social, environmental and health benefits and costs associated with the business model.
Technological description of treating wastewater
Wastewater-fed aquaculture is increasingly being recognized as an innovative business-oriented reuse system. The business concept build on a public-private partnership that can be established between municipal wastewater management bodies or other public organizations with a need for wastewater treatment, and private entities proving the expertise, setting up an aquaculture business. While public entity/entities provide(s) wastewater and wastewater stabilization ponds, business entities can cultivate fish under specified safety procedures in the ponds. In this model wastewater is being treated to an advanced tertiary state and during that process produce fish for human consumption, using the same water flows. Duckweed is used to purify the wastewater. The duckweed is subsequently harvested and fed to fish fingerlings. Mature fish are caught and then sold both at pond side and to whole sellers. The advanced tertiary state treated water can be released safely in the environment, or, in areas where water is scarce and thus has value, can be sold for agricultural and other reuse. The business model has a very basic value chain in case of localized and small scale operations where fish and co-crops are sold in the local market.
The fish can be sold locally and in the export market. Profits will be divided amongst the partners depending on the partnership contracts. Usually the public entity will be responsible for maintaining, which typically is improved due to the business activity. The key players in the business set-up are the aquaculture business entity itself, local municipality and/or local public organization in need of wastewater treatment, duckweed-fish expertise provider, and of course produce buyers and consumers in the market.
Overall approach to socio-economic impact assessment
The socio-economic analysis of a project is concerned with its viability from a societal perspective and answers the questions of whether it is economically rational to proceed with the project (De

56
Souza et al., 2011). In contrast to a financial analysis, socio-economic analysis provides a more comprehensive investigation on the effects of a proposed project takes a broader perspective and determines the project’s overall value to society. The analysis, therefore, includes benefits and costs that directly affect the business entity running the project and the effects of the project on households, governments and other businesses outside of the business.
First, we have evaluated the current scenario in Hanoi which is denoted as baseline scenario with the help of cost-benefits analysis. The wastewater in Hanoi mainly comes through industrial zones. Total wastewater generated in Hanoi is 615,400 m3 daily and out of which only 40 percent is being treated and 60 percent remains untreated which goes to open environment.
Second, in the alternative scenario we have considered aquaculture business with different pond sizes such as 14.4 ha, 4.5 ha, and 1 ha to treat the waste water and produce fish for consumption.
Third, we have increased the number of ponds to such an extent so that all wastewater generated in Hanoi can be handled. The cost-benefit analysis of this scenario is also being analyzed and compared with the baseline scenario.
Environmental Impact Assessment
Waste water generally flows directly to waterbodies without any treatment and therefore, creates a possibility of surface water pollution. The surface water pollution happens due to pollutants like Nitrogen, Phosphorous, Suspended Solids (SS), BOD, COD etc. The cost of pollution from Nitrogen, Phosphorous, Suspended Solids (SS), BOD, COD are 0.606, 0.3087, 0.00252, 0.0164, 0.083 USD/m3
(Table 1). Hence, total surface water pollution caused by wastewater stream in Hanoi is 373,405 USD annually in the baseline scenario which can be avoided in the alternative scenario. Considering 12 percent discount rate, the present value of the environmental benefits stands around 2,398,582 USD.
Table 37: Surface water pollution due to wastewater - environmental value of pollution
Value for N USD/m3 0.606 UNEP, 2010
Value for P USD/m3 0.3087 UNEP, 2010
Value for Suspended Solids USD/m3 0.00252 UNEP, 2010
Value for BOD USD/m3 0.0164 UNEP, 2010
Value for COD USD/m3 0.083 UNEP, 2010
Total value of pollution due to undesired outputs USD/year 373,405
Social Impact Assessment
The amount of wastewater generated in Hanoi is 615,400 m3 each day. Presently about 248,100 m3 of water is treated while there has been a plan to set up three WWTPs which would further treat 367,300 m3 per day. The existing and operational WWTPs are situated at North Thang Long, Kim Lien, Truc Bach, Hoang Mai, while the 3 WWTPs planned are at Hai Ba Trung, Tu Liem, and Thanh Tri. The capacity of treatment of waste water in different places are 42,000, 3,700, 2,300, 200,000, 13,300, 84,000, 270,000 m3 daily (Table 2). In order to treat these amount of waste water at different places of Hanoi, one can construct ponds of 14.4 ha (large), 4.5 ha (medium), and 1 (small) ha for aquaculture which will produce fish that can be sold in the local as well as global market. Assuming that a large, medium, and small pond can handle on an average 9300 m3, 3700 m3, and 700 m3 daily, the number of ponds required is calculated which is being provided in Table 3.
Table 38: Capacity of the treatment plant in different places of Hanoi
Amount of wastewater treated at North Thang Long, Van Tri m3/day 42000 Existing and operating since 2009
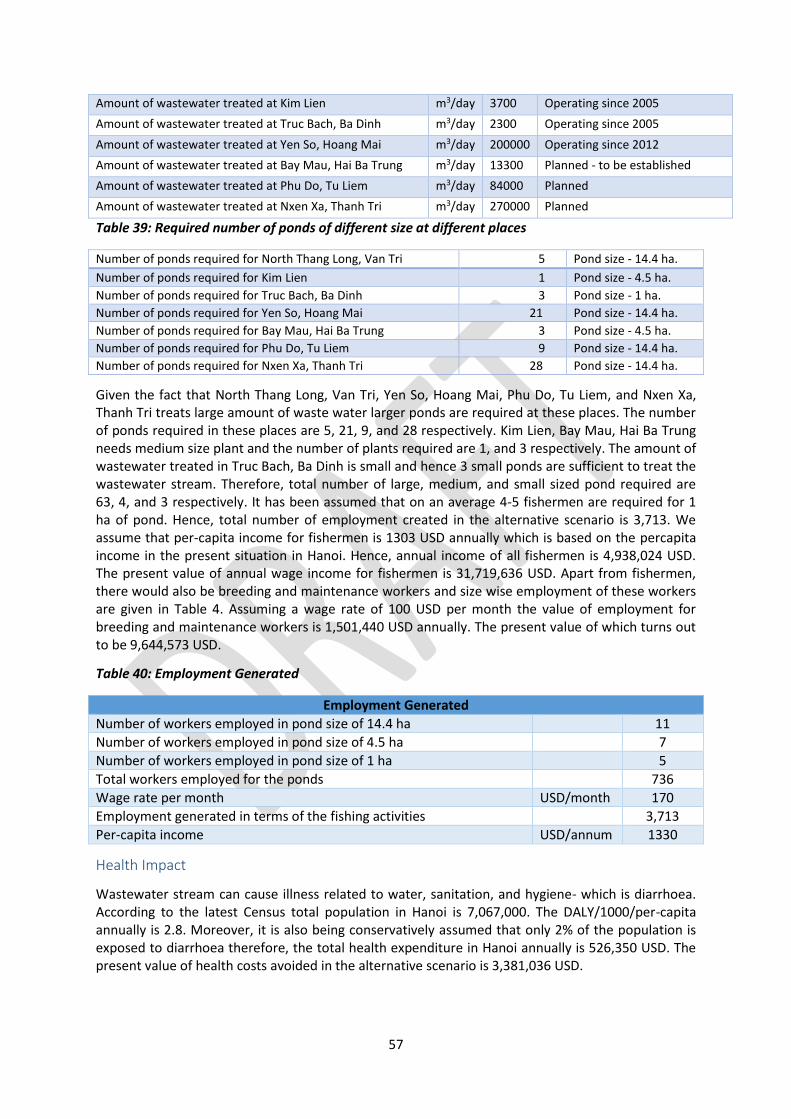
57
Amount of wastewater treated at Kim Lien m3/day 3700 Operating since 2005
Amount of wastewater treated at Truc Bach, Ba Dinh m3/day 2300 Operating since 2005
Amount of wastewater treated at Yen So, Hoang Mai m3/day 200000 Operating since 2012
Amount of wastewater treated at Bay Mau, Hai Ba Trung m3/day 13300 Planned - to be established
Amount of wastewater treated at Phu Do, Tu Liem m3/day 84000 Planned
Amount of wastewater treated at Nxen Xa, Thanh Tri m3/day 270000 Planned
Table 39: Required number of ponds of different size at different places
Number of ponds required for North Thang Long, Van Tri 5 Pond size - 14.4 ha.
Number of ponds required for Kim Lien 1 Pond size - 4.5 ha.
Number of ponds required for Truc Bach, Ba Dinh 3 Pond size - 1 ha.
Number of ponds required for Yen So, Hoang Mai 21 Pond size - 14.4 ha.
Number of ponds required for Bay Mau, Hai Ba Trung 3 Pond size - 4.5 ha.
Number of ponds required for Phu Do, Tu Liem 9 Pond size - 14.4 ha.
Number of ponds required for Nxen Xa, Thanh Tri 28 Pond size - 14.4 ha.
Given the fact that North Thang Long, Van Tri, Yen So, Hoang Mai, Phu Do, Tu Liem, and Nxen Xa, Thanh Tri treats large amount of waste water larger ponds are required at these places. The number of ponds required in these places are 5, 21, 9, and 28 respectively. Kim Lien, Bay Mau, Hai Ba Trung needs medium size plant and the number of plants required are 1, and 3 respectively. The amount of wastewater treated in Truc Bach, Ba Dinh is small and hence 3 small ponds are sufficient to treat the wastewater stream. Therefore, total number of large, medium, and small sized pond required are 63, 4, and 3 respectively. It has been assumed that on an average 4-5 fishermen are required for 1 ha of pond. Hence, total number of employment created in the alternative scenario is 3,713. We assume that per-capita income for fishermen is 1303 USD annually which is based on the percapita income in the present situation in Hanoi. Hence, annual income of all fishermen is 4,938,024 USD. The present value of annual wage income for fishermen is 31,719,636 USD. Apart from fishermen, there would also be breeding and maintenance workers and size wise employment of these workers are given in Table 4. Assuming a wage rate of 100 USD per month the value of employment for breeding and maintenance workers is 1,501,440 USD annually. The present value of which turns out to be 9,644,573 USD.
Table 40: Employment Generated
Employment Generated
Number of workers employed in pond size of 14.4 ha 11
Number of workers employed in pond size of 4.5 ha 7
Number of workers employed in pond size of 1 ha 5
Total workers employed for the ponds 736
Wage rate per month USD/month 170
Employment generated in terms of the fishing activities 3,713
Per-capita income USD/annum 1330
Health Impact
Wastewater stream can cause illness related to water, sanitation, and hygiene- which is diarrhoea. According to the latest Census total population in Hanoi is 7,067,000. The DALY/1000/per-capita annually is 2.8. Moreover, it is also being conservatively assumed that only 2% of the population is exposed to diarrhoea therefore, the total health expenditure in Hanoi annually is 526,350 USD. The present value of health costs avoided in the alternative scenario is 3,381,036 USD.

58
Financial Analysis
In this section, the financial analysis of the phyto-remediative wastewater treatment is presented. The financial viability is analyzed based on Return on Investment (ROI), Net Present Value (NPV) and Internal Rate of Return (IRR) valuation criteria. Initially we have done financial viability analysis for large, medium, and small sized ponds and then consolidated the financial analysis of three different sized firms by considering the number of plants. The initial investment costs of a large, medium, and small sized firms are 95,988, 45,812, and 22,901 USD. The revenue for large, medium, and small sized ponds are 127,334, 57,874, and 18,081 USD respectively. Total production and other costs are 105,688, 45,378, and 24,051 USD respectively. The net profits for large, and medium sized ponds are 10,982, 6,404. We observe loss of 7,044 USD for the first year of business in case of small sized firms, but second year onwards we observe it starts making profit of 6526 USD. Adding back the depreciations to the net profit we arrive at the cash-flow which are 12,421, and 7,802 USD for large and medium sized business. Cashflow for small sized business second year onward is 7,600 USD. A straight line method of depreciation is used for depreciable capital costs assuming a useful life of 15 years with a salvage value of 5% of total depreciable cost. Current tax for similar businesses in Hanoi is 20%. Table 5 presents the results of financial analysis. Since there are 63 large number of firms, 4 medium sized firms, and 3 small sized firms we have scaled up the cashflows by considering these facts and the consolidated cashflow for the business is 8,00,050 USD and thus considering discount rate of 12 percent we obtain present value of cash-flow as 2,76,44,548 USD. The Net Present Value of cash-flows is 60, 88,209 USD. The internal rate of return is 24 percent, ROI is 34 percent and BCR is 1.01. Therefore, the financial analysis of phyto-remediative wastewater treatment indicates that the business model is financially viable.
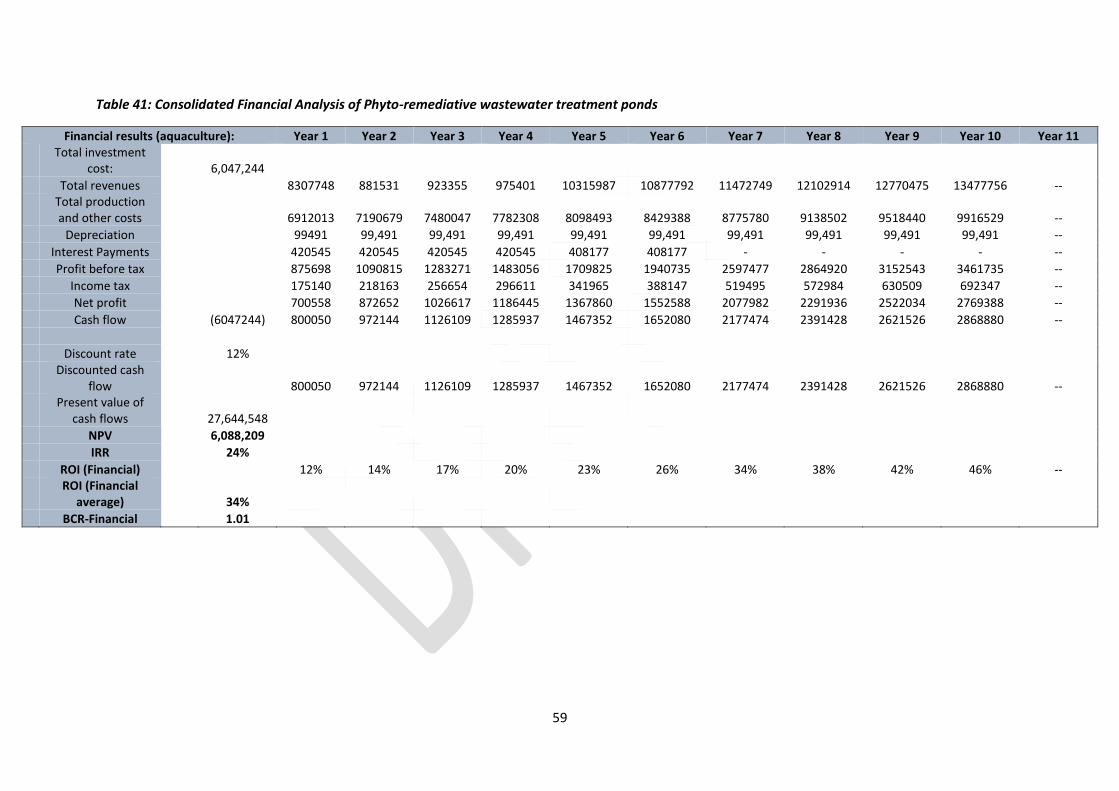
59
Table 41: Consolidated Financial Analysis of Phyto-remediative wastewater treatment ponds
Financial results (aquaculture): Year 1 Year 2 Year 3 Year 4 Year 5 Year 6 Year 7 Year 8 Year 9 Year 10 Year 11
Total investment cost:
6,047,244
Total revenues
8307748 881531 923355 975401 10315987 10877792 11472749 12102914 12770475 13477756 --
Total production and other costs
6912013 7190679 7480047 7782308 8098493 8429388 8775780 9138502 9518440 9916529 --
Depreciation
99491 99,491 99,491 99,491 99,491 99,491 99,491 99,491 99,491 99,491 --
Interest Payments
420545 420545 420545 420545 408177 408177 - - - - --
Profit before tax
875698 1090815 1283271 1483056 1709825 1940735 2597477 2864920 3152543 3461735 --
Income tax
175140 218163 256654 296611 341965 388147 519495 572984 630509 692347 --
Net profit
700558 872652 1026617 1186445 1367860 1552588 2077982 2291936 2522034 2769388 --
Cash flow
(6047244) 800050 972144 1126109 1285937 1467352 1652080 2177474 2391428 2621526 2868880 --
Discount rate
12%
Discounted cash flow
800050 972144 1126109 1285937 1467352 1652080 2177474 2391428 2621526 2868880 --
Present value of cash flows
27,644,548
NPV
6,088,209
IRR
24%
ROI (Financial)
12% 14% 17% 20% 23% 26% 34% 38% 42% 46% --
ROI (Financial average)
34%
BCR-Financial
1.01

60
Socio-economic Results
The consolidated socio-economic results are shown in Table 5. The analysis looked at the potential impact of aquaculture at three levels where the levels range from including the direct benefits and costs that affect the business entity to including indirect benefits and costs to other sectors. The annual social and environmental benefits and costs from the business were discounted at a rate of 12% to obtain the present value of social and environmental impacts.
Table 42: Net socio-economic results
Socio-economic result (USD/year) Financial value
Financial & Environmental
Social, Environmental & Financial
Financial result: NPV 6,088,209 6,088,209 6,088,209
Environmental benefit:
Value of net GHG emission saving
2,398,582 2,398,582
Social benefit:
Direct Employment generated in terms of the fishermen communities
31,719,636
Value of jobs created (workers in the breeding and maintenance)
9,644,573
Savings in health expenditure
3,381,036
Total social benefit
44,745,245
NPV 6,088,209 8,486,791 53,232,036
ROI 32% 44% 155%
BCR 1.01 1.40 8.80
The aquaculture business results in cost benefit ratio (CBR) of 1.01, NPV of USD 6,088,209 and ROI of 32% when only direct benefits from the briquette production are taken into account. The NPV increases to 8,486,791 USDwhen environmental benefits are taken into account and to 53,232,036 USD when the environmental and social impacts are taken into account. The ROI taking all externalities into account is 155%. The major contribution to the economic feasibility of the business is from the social benefits. Thus from a socio-economic perspective, the aquaculture business model is highly attractive.
Sensitivity Analysis
The following variables shown in the following table has been considered for the stochastic analysis. The following figure (Figure 1) shows the probability distribution of the NPV of the net benefits from introducing the business model.
Table 43: Selected variables for the stochastic analysis of the business model
Variable Unit Distribution specified
Source
Discount rate % Triangular: (10%, 12%, 15%)
Assumed
Carbon Credit price USD/t CO2 eq.
Uniform distribution (0.51-1.5)
Assumed
Economic value of per capita loss due to
USD Uniform Distribution (4.49 –
The lower range corresponds to estimates for cancer and higher range to gross national per

61
diseases 9.5) capital income.
Figure 6: The probability distribution of the NPV of the net benefits derived from wastewater aquaculture
The above figure shows that the mean NPV is 52.27 million with a certainty of achieving it at 50%. Based on the ROI and the Benefit-Cost Ratio, it can be assessed that the business model of treated wastewater for aquaculture is feasible in the medium range.
Conclusion
This study assessed the socio-economic impact of phyto-remediative wastewater treatment business model in Hanoi, Vietnam. The socio-economic analysis is conducted based on the valuation of financial, environmental and health benefits and costs associated with the business model. The following conclusions can be drawn from the study:
- The environmental impacts associated with the business model were estimated based on surface water pollution from pollutants like N, P, SS, BOD, COD etc. We have seen that by treating wastewater stream in this model we can avoid the surface water pollution caused by wastewater stream in Hanoi.
- It helps in generating large number of employment and thus adds to the social benefits.
- Through this model we can save a large chunk of health expenditure made by residents of Hanoi.
- Looking at the overall socio-economic impacts, the business model is both financially and economically feasible. There is a significant increase in the economic feasibility of the business due to social and environmental benefits associated with the business.

62
- The major contribution to the economic feasibility of the business is from the social benefits with major benefits coming from employment generation of fishermen and breeding persons in the business process. Thus from a socio-economic perspective, the phyto-remediative wastewater treatment business model is highly attractive.

63
Socio-economic impact assessment of Cost savings and Recovery businesses in Hanoi
Introduction
The developing countries are facing a steep challenge of wastewater management and policy makers are constantly exploring cost effective measures to mitigate the impacts. Wastewater treatment interventions can generate significant benefits for public health, and the economic sectors such as fisheries, tourism and property markets. In developing countries with growing population and need for industrialization to cater to the economic growth the need for such interventions become more demanding. This is particularly true for individuals living below the poverty line who need provisions of safe water supply, sanitation and wastewater services. Several studies indicate that benefit-to-cost ratios for basic water and sanitation services are as high as 7 to 1 for developing countries. Thus benefits derived from such interventions are substantial in the long run for the economy.
The situation in Vietnam is not different from any developing country. Policy makers are engaging relevant stakeholders to explore effective and efficient options for wastewater management. Vietnam’s urban population currently stands at 32% and is growing, due to rural urban migration. This trend has led to an increase in the production of wastewater from households and the growing manufacturing industry. Wastewater in Vietnam is mainly generated from domestic and municipal waste. It is estimated that about 224 million m3 of wastewater is generated in Hanoi every year. In addition to this on average only about 2% of the people in 22 towns have access to sewerage systems. The dominant wastewater treatment facility existing is restricted to primary treatment and is discharged into wetlands.
One of the emerging key interventions towards wastewater management is diversion of the treated wastewater towards peri-urban agriculture and using the sludge retrieved as compost/manure for agriculture. In Vietnam despite a remarkable economic growth being registered in the recent years, one key set back remains the persistent food shortages and critical nutritional deficiencies often experienced in many parts of the country. This situation is partly attributed to occasional poor harvests attributed to erratic rain seasons, which have a very significant impact on the largely rain-fed subsistence farming being practiced by over 80% of the population (UN-WATER, 2006). Given the context of Hanoi this report investigates the socio-economic impacts of treating waste water for reuse in terms of treated wastewater for irrigation, conversion of biogas to electricity, and use of sludge as soil conditioner. This business model addresses cost recovery through three different mechanisms – (i) water sales and (ii) compost or manure sales to farming and additionally a cost saving mechanism (iii) using the treatment process to capture the biogas generated by anaerobic digestion and converting to electricity that is subsequently used to power the plant. These business interventions are pertinent for Vietnam given the context of lower sanitation facilities and also related scarcity of water for agriculture in the peri-urban areas.
The potential economic, environmental, and social impacts of treatment plant needs to be assessed to ensure its sustainable development. In this study, it is assumed that the Wastewater Treatment Plant (WWTP) already exists and additional investments are being made to install recovery of electricity and sludge and diverting the water to the peri-urban agricultural farm lands. The socio-economic impacts of treating wastewater for cost recovery is evaluated assuming a daily flow of 0.61million m3. In order to treat these amount of waste water 2 large sized plant and 3 medium sized plants are required. The
64
socio-economic analysis is conducted based on the valuation of economic, social and health benefits and costs associated with the business model.
Technology description
In this assessment, three different technologies are being considered. Overall, wastewater is transported to the treatment plant by gravity through a conveyor pipeline. The wastewater then undergoes through secondary treatment in an activated sludge process. Sludge from the primary settling tanks and aerated tanks are covered in dissolved air flotation units. These two sludges are then pumped into anaerobic disgesters. Biogas is produced, but converted to electricty to be used on site. Also, compost is produced from the sludge. Biogas produced can be used for cooking, lighting or powering the plant. The treated wastewater and sludge are used for farming. Canal is constructed to distribute the water to the farmers. It is assumed that farmers are in the vicinty of the treatment plant. For treated sludge for farming, it is assumed that facluative ponds or the treatment plant already exisits and we only care about the additional costs of dewatering and obtaining the biosolids. Anaerobic digestion is commonly used in treatment plant for treating the sludge and to produce biogas. It stabilizes the organic matter in the sludge, reduces pathogens and odors, and reduces the total sludge quantity (EPA, 2006).The composition of biogas depends on the quality of the treatment plant, temperature and the flow of the wastewater or sludge. Typically, methane (CH4) constitutes about 60% while 40% belongs to carbon dioxide (CO2) (Rasi et al. 2007). Also, the efficiency of the process will be influenced by the temperature; as higher temperatures are more suitable for bacterial growth and the retention time, which is the time the process is allowed to take place. The hydraulic retention time (HRT) ranges from 15 to 25 days depending on the climatic conditions. Average HRT is 20 days at an ambient average temperature of 25 °C (Metcalf and Eddy, 2003; Degrémont, 2005). Various types of organic waste can be used to produce biogas. There are different types of biogas systems in use in developing countries. The technology employed is based on a biological activated sludge process with sludge anaerobic digestion, and includes equipment such as biogas combined heat and power engines (CHP), gas flare, standby diesel generators, biogas boilers, heat exchangers, and aeration turbo blowers for biological tanks aeration and mixing. However, only the facilities that use anaerobic digestion as part of their biosolids treatment process will be considered as the cost of building an anaerobic digester is unknown. These facilities already have an anaerobic digester onsite and are producing biogas. Capital costs and the potential electricity generation capacity will be estimated using data from existing wastewater case studies and existing literature.
Technology and processes
The electricity generation system consists of an anaerobic heated sludge digester, biogas holding tank and a gas engine connected to a generator. The compost/manure system consists of mechanical sludge thickening tanks, sludge storage tanks, mechanical sludge dewatering and drying beds. The treated water is diverted through canals or nearby waterbodies for aiding irrigation outside the urban areas.
Overall approach to socioeconomic analysis
As explained above the main focus of the study was to carry out a socioeconomic analysis of cost recovery from wastewater treatment plants in Hanoi. The motivation behind the socioeconomic analysis was to evaluate the net societal benefits (including the environmental and health costs and benefits) over and above the net economic benefits (which have been evaluated in the financial analysis). The economic analysis of a project is concerned with its viability from a societal perspective and answers the questions of whether it is economically rational to proceed with the project (De Souza et al., 2011). In contrast to a financial analysis, economic analysis provides a more comprehensive investigation on the

65
effects of a proposed project, takes a broader perspective and determines the project’s overall value to society (Raucher et al., 2006). The analysis, therefore, includes benefits and costs that directly affect the business entity running the project and the effects of the project on households, businesses and industries, and governments. The analysis also includes the benefits and costs that cannot be readily measured using observable market prices and costs (De Souza et al., 2011).
The estimated quantity of treated wastewater in Hanoi in 2013 was approximately 248,100 m3/day of which 42,000 m3/day is being treated - at North Thang Long, Van Tri, 3,700 m3 is being treated at Kim Lien, 2,300 m3 is being treated at Truc Bach, Bah Din, and 200,000 m3 is being treated at Yen So, Hoang Mai. Thus 363,700 m3/day flows to the nearby waterbodies, streams and polluting these water sources. For the financial analysis, 2 large size and 3 medium sized treatment plant is being considered, the socioeconomics analysis similarly considers the same capacity of the wastewater treated. Therefore, the environmental, health and social costs and benefits considered for the society is restricted to the wastewater treated and not for the entire wastewater generated.
Environmental impact assessment
Reduced pollution of the surface sources
The environmental impact assessment of the cost recovery from wastewater treatment was carried out for the baseline scenario where the entire wastewater flows to the water courses. In the baseline scenario about 248,100 m3 wastewater is being treated in four WWTPs around Hanoi of while the rest of the untreated water is drained off towards the nearby waterbodies, streams. The alternate scenario however considers that the wastewater generated in Hanoi (651,400 m3) is entirely treated before being discharged into the nearby water courses (primarily the four main rivers of Hanoi). In other words, in addition to the existing WWTPs, there are other 3 WWTPs which have been planned to treat about 367,300 m3 of water daily. The primary environmental impact of the wastewater is the surface water pollution of the nearby water courses as well as chances of groundwater getting contaminated. In the present study the costs of surface water pollution and ground water contamination is estimated indirectly using the shadow prices for undesirable outputs of wastewater treatment. The following table shows the environmental value of the damage avoided (surface and groundwater contamination) based on the figures provided by Hernandez-Shancho et.al. 2010.
Table 44: Environmental costs of the undesirable outputs
Parameters Shadow prices for undesirable outputs (USD/m3)
N 0.606 BOD 0.0164 COD 0.083
Total Pollution load from undesirable outputs (USD/Year) 77,728,026
The table illustrates the reference price of water treated from different sources and also the prices of the undesirable outputs which have a potential environmental damage when wastewater is drained off to different destinations. To calculate the environmental costs averted due to wastewater treatment, the average shadow prices of the pollutants had been utilized since the baseline scenario considers the nearby water courses as the primary destination of the untreated wastewater. At the same time the table indicates the values to be mentioned at 2010 euros, hence for the final valuation these values had been inflation adjusted to the present value. The results shows that discharge of 363,700 m3 of

66
wastewater per day have environmental costs amounting to USD 77.72 million per year. The treatment of the wastewater in the alternate scenario for generating of electricity, irrigation water and compost leads to net environmental benefits associated with the removal of the different pollutants as estimated above.
Reduced GHG emissions
The alternate considers that in total 596,100 m3 of waste water is being treated which is greater than the baseline scenario. It has been calculated that 1 m3 of wastewater generates 0.853 ton CO2 equivalent i.e., 508,388 ton CO2 equivalent. The basis of this calculation that the wastewater treatment system employs an aerated active sludge unit and an anaerobic digester to reduce the quantity of sludge requiring disposal. The activated sludge unit has an average flow rate of 1 million gallons per day and an inlet BOD5 of 500 mg/L (=g/m3) and also that the unit achieves a 95%BOD5 reduction. Given the price of CER at 0.51 USD/ton we calculated the total averted emission in the alternative scenario is of value of 259,278 USD annually.
Soil Amelioration
We assume that a medium sized plant can produce compost of 445 ton/day and a large sized plant can produce compost of 2199 ton/day. Therefore, total compost production annually is 769,161 ton. Moreover, we assume that compost is being applied on the field as 10 ton/ha and as result of application of compost the income of the farmer will increase by 10 USD/ha. Therefore, the area covered by the compost produced is 76,916.1 ha. Thus total increase in income which can be considered as the proxy of soil amelioration stands valued at 769,916 USD annually.
The total environmental impact of 2 large and 3 medium sized treatment plants can be summarized in the table below.
Table 45: Estimation of the potential environmental impacts
Indicators Value (USD)
Surface water Pollution 77,728,026 Reduced GHG gas emissions 259,278 Soil improvement 7,69,916
Social impacts
Additional income through job creation
The co-generation plant contributes to improving the local economy through job creation and hence providing additional income to workers. The financial analysis shows that the medium sized plant employs 8 workers and large sized plant employs 20 workers. Thus 2 large sized plants will employ 40 workers and 3 medium sized plants will employ 24 workers. Therefore, total number of additional jobs created by wastewater treatment plants is 64. Given a wager rate of 170 USD/month, value of additional jobs created annually is 130,560 USD. However, other indirect impacts to the local economy in terms of employment are not accounted for in this study.
Increase in income in agricultural households
With increase in area under cultivation, it is expected that income of the households engaged in agriculture would rise. It is assumed that in Hanoi net income from rice production per ha 49.5 USD. The wastewater treated can bring 10,836 ha under rice cultivation assuming the water requirement per ha is

67
16,500 m3/ha. We assume that yield per ha is 5.34 ton. Hence, the additional income accrued to the farmers is 2,864,376 USD.
Health impacts
The primary health impacts in the current situation due to partial wastewater treatment and discharge in the nearby waterbodies is diarrheal diseases make up over four per cent of the global disease burden (UNEP, 2010). The current population of Hanoi is 7,067,000. WHO (2009) provides an estimate of 2.8 DALYs per 1000 population in terms of burden of diseases from environmental pollution (particularly water, health and hygiene) for Vietnam and economic values of DALY per-capita is 1330 USD. The total health cost arises due to diarrhea is 26,317,508 USD annually.
Financial Analysis
The financial analysis is based on three different additional costs for an existing wastewater treatment plant. In this context, there is an NPV and IRR for (a) wastewater reuse for irrigation, (b) biogas converted to electricity for onsite consumption, and (c) sludge production as soil conditioner. Finally, the combined NPV and IRR for these three values are being estimated. It is assumed that the plant will obtain a combined heat and power technology (CHP). The total cost of this technology is estimated to be $493,931. It is assumed that wastewater is treated and supplied to farmers. For simplicity, it is further assumed that the distance between farmers and the plant is 15km. It is important to stress that the total costs used in this analysis is subject to the location of the farmers. The unit cost of canal construction is estimated as $2.5 per m3. The total treated water from the plant for reuse is assumed to be 363,700m3/day. It is assumed that the wastewater plant is operating already and our concern in this assessment is to estimate the additional cost of manure production or removal from the plant for farmers or other premium customers. Thus, we only considered investment cost of primary and secondary sludge treatment without the costs of facultative ponds or any exiting treatment technology. It is estimated that the additional cost of the sludge removal will be $170,000. This cost includes construction, materials, and installation costs. The cost of sludge removal for farmers or other premium customers are not included. It is also assumed that there are 3 medium and 2 large sized treatment plants.
Table 46: Capital cost of reuse components in Wastewater treatment plant
Investment type Costs (in USD)
Cost of combined heat and power 493,931
Cost of treated water supply(canal) 15,000,000
Cost of sludge removal/production 170,000
Typically, wastewater treatment plant consumes between 0.5-2kWh per m3 of energy (Gude, 2015). It is assumed that about 0.7kWh per m3 of electricity will be consumed for this additional technology. The corresponding cost of electricity generation is 0.04$ per kWh (ERG (2011)). The operation and maintenance cost for the additional items is 5% of the capital costs and an escalation of 3% (based on current inflation rate in Vietnam). This is applied annually to inflate the price of labor, electricity and the operation and maintenance costs used to estimate the net income over the life span of the investment. It is assumed that the project has a life span of 15 years. Also, it is assumed that farmers are in the vicinity of the treatment plant. The construction of the canal will require additional 3 people. The associated labor cost is $7 per day. Now, the water must be treated to avoid any health implications for the farmers. This will cost about 0.01$ per m3 (FAO, 1997). Finally, it will cost $0.23 per m3 to pump the water to the canals. This cost also includes the electricity cost of pumping. The operation and

68
maintenance cost for the additional items is 5% with an escalation of 3%. It is assumed that project has a life span of 15 years. It is assumed that there will be 2 people to ensure the day-to-day operation of the sludge production. The corresponding cost is $7 per day. The largest cost is the additional labor necessary to remove the sludge to the appropriate area for the farmers. The associated labor cost is $6 per day. There is also a minor costs associated with sampling and monitoring. This cost also includes the electricity cost of pumping. The operation and maintenance cost for the additional items is 3% with an escalation of 3%. It is assumed that the total quantity of wastewater treated and reuse is about 363,700 m3 per day. This quantity of water will be transported through the canals to the farmers. Based on extensive literature review, it costs $0.05 per m3 to supply water to the farmers ((Khouri (1992); Abu-Madi (2004)). Typically, about 2-10% of the wastewater flow is retained as sludge. In this assessment, we use 2% to obtain the sludge produced from this plant.
The financial estimates and an assumption of 12% discount rate the NPV of the investment is negative and IRR is 12 percent. BCR for this financial model is less than 1 (0.60). Hence, the financial analysis suggests that model is not financially feasible.

69
Table 47: Financial results of Wastewater Treatment and cost savings model (USD)
Year 0 Year 1 Year2 Year 3 Year 4 Year 5 Year 6 Year 7 Year 8 Year 9
Total investment cost: 24590741
Total revenues
10416576 11027389 11089997 11156988 11228669 11305367 11387434 11475245 11569204 …
Total production and other costs
6845274 7283746 7752910 8254916 8792062 9366809 9981788 10639815 11343904 …
Profit before tax
3571302 3743643 3337087 2902072 2436606 1938558 1405646 835430 225299 …
Income tax
714260 748729 667417 580414 487321 387712 281129 167086 45060 …
Net profit
2857042 2994915 2669670 2321658 1949285 1550846 1124517 668344 180239 …
Cash flow (24590741) 2857042 2994915 2669670 2321658 1949285 1550846 1124517 668344 180239 …
Discount rate
Discounted cash flow
2550930 2387528 1900218 1475456 1106077 785707 508674 269933 64996 …
Present value of cash flows 9494610
NPV (14848445)
ROI (Financial)
12% 12% 11% 9% 8% 6% 5% 3% 1%
ROI (Financial average) 3%
BCR-Financial 0.60

70
Socioeconomic results
The socioeconomic analysis of the business model is performed by putting monetary value on all quantifiable cost and benefits in order to calculate the NPV, benefit cost ratio (BCR) and ROI for the business model. The consolidated socio-economic results are presented in Table 12. The analysis looked at the potential impact of model at three levels – (i) financial, (ii) financial and environmental and (iii) financial, environmental and social where the levels range from including the direct benefits and costs that affect the business entity to including indirect benefits and costs to other sectors. The annual social and environmental benefits and costs from the business were discounted at a rate of 12% to obtain the present value of social and environmental impacts.
The business model, when only the direct benefits are accounted for results in negative NPV and BCR of less than 1 implying that the business model is not financially feasible. The business model performs better when the financial and environmental costs and benefits are taken into account. The net positive incremental benefits from the environmental impacts are very high enough to make the business model feasible as the NPV is positive and the BCR is substantially high 19.97. This implies that per dollar invested gives a return of USD 20. The business model becomes economically more feasible when all externalities are included in the analysis. The NPV when all externalities are considered is USD 679,337,423 and the BCR is 27.63. Thus, major contribution to the economic feasibility of the business is from the environmental benefits. The total value of the social benefits (NPV over a period of 15 years) of the business is USD 27 million with major benefits coming from the additional income from jobs created for the local community, health benefits and savings in expenses for alternate forms of energy.
Table 48: Net socio-economic results of Wastewater treatment plant model
Socio-economic result (USD/year) Financial value Financial and
environmental Social, environmental
and financial
Financial result: NPV (14,848,445) (14,848,445) (14,848,445)
Environmental benefit:
Value of net GHG emission saving
505,895,965 505,895,965
Social benefit:
Direct Employment generated
838,658
Increase in farmer income
18,399,458
Savings in health expenditure
169,051,787
Total social benefit
188,289,203
Net NPV (14,848,445) 491,047,520 679,337,423
ROI 5% 321% 443%
BCR 0.60 19.97 27.63
Sensitivity analysis
The stochastic analysis helps in determining the uncertainty of the socioeconomic model based on deterministic assumption. For the present study the following variables have been considered as stochastic with the respective distributions as described in the following table.
Table 49: Selected variables for the stochastic analysis

71
Variable Unit Distribution specified
Source
Discount rate % Triangular: (10%, 12%, 15%)
Assumed
Carbon Credit price USD/t CO2 eq.
Uniform (0.51- 3.8)
Assumed
Yield per hectare of rice tons/ha. Uniform : (5.34, 6.5) Present scenario in Hanoi, upper limit is the amount produced from hybrid rice
Net income from per hectare of land in paddy cultivation
USD/ha. Uniform: (40, 49.5) The lower range is the conservative estimate, the upper range is base case scenario
Increase in income due to application of compost
USD/ha. Uniform: (5, 10) The lower range is the conservative estimate, the upper range is base case scenario
Economic value of per capita loss due to diseases
USD Uniform Distribution (4.49 – 9.5)
The lower range corresponds to estimates for cancer and higher range to gross national per capital income.
The following figure (figure 1) shows the probability distribution of the NPV estimated through numerous iterations of the stochastic variables. The derived stochastic mean is 673.7 million which can be achieved with a success rate of 49%.
Figure 7: Probability Density Function of the NPV derived for Wastewater treatment and cost savings business model
Conclusion
The efficient implementation of policies to prevent the degradation and depletion of water resources requires determining their value in social and economic terms and incorporating this information into

72
the decision-making process. A process of wastewater treatment has many associated environmental benefits. However, these benefits are often not calculated because they are not set by the market, due to inadequate property rights, the presence of externalities, and the lack of perfect information. Nevertheless, the valuation of these benefits is necessary to justify a suitable investment policy and a limited number of studies exist on the subject of the economic valuation of environmental benefits. In this paper, we propose a methodology based on the estimation of shadow prices for the pollutants removed in a treatment process. This value represents the environmental benefit (avoided cost) associated with undischarged pollution. This is a pioneering approach to the economic valuation of wastewater treatment. The comparison of these benefits with the internal costs of the treatment process will provide a useful indicator for the feasibility of wastewater treatment projects. This study assessed the socio-economic impact of cost savings from wastewater treatment in Hanoi, Vietnam. The model includes the water for irrigation and digester sludge for compost. The socio-economic analysis is conducted based on the valuation of financial, environmental and health benefits and costs associated with the business model. The following conclusions can be drawn from the study:
- From the socioeconomic perspective, findings from the study indicate that the most pertinent
benefits accrues from treatment of water reducing the environmental burdens. The benefits
from wastewater treatment offsets the marginal financial benefits and the net returns amount
to USD 21 from per dollar invested. The business model resulted in a BCR of 27.63 and ROI of
443% indicating that (although not all environmental and social impacts have been factored in
the analysis) the business provides positive environmental and social impacts that offsets it
costs and is highly feasible.
- Net GHG emissions saved per kwh of electricity generated is 1.4 kg CO2eq. The highest savings
in GHG emissions would be mainly from substituting diesel generators for the commercial
establishments while the highest emissions from the business model is from the gasifier.

73
Socio-economic impact assessment of Large Scale Composting for revenue generation in Hanoi
Introduction
The increasing quantity of urban waste in urban towns of developing nations coupled with inadequate sanitation services is of a growing concern to the deteriorating urban environment (Oyoo, 2010). In Hanoi6500 tons of Municipal Solid waste is generated daily and out of this about 55 percent is collected and the remaining uncollected waste is normally burnt and/or dumped in unauthorised sites, causing health and environmental problems. However, the organic fraction of domestic waste can provide an opportunity to improve livelihoods and incomes through fertilizer and energy production (Komakech, 2014). The potential economic, environmental, social and health impacts of composting plant needs to be assessed to ensure its sustainable development. In this study, we evaluated the socio-economic impacts of composting of MSW business with plant capacity of handling 600 tons of MSW in Hanoi daily. The socio-economic analysis is conducted based on the valuation of financial, environmental and health benefits and costs associated with the business model.
Technological description for Large Scale Composting from MSW
There are two fundamental types of composting techniques – open or windrow composting and enclosed or in-vessel composting method (Dulac, 2001). Open composting processes are simpler, require less capital, and use less energy. This generally rely more on land and labour and less on machinery. In comparison enclosed or in-vessel composting is more technology driven and require complex equipment and also utilizing substantial amounts of energy. The aerobic process or the windrow composting is arguably the most suitable technology for developing countries. While operating costs usually start at US $ 40 per ton, for the least expensive variant; more expensive systems can cost up to US $ 100 per ton, operational costs for windrow composting is comparatively lower around US $ 5 to US $ 20 per ton.
Windrow composting comprises of – (i) Pre-processing (segregation/sorting), (ii) Shredding, (iii) Piling of the waste, (iv) Turning of the windrows, (v) Maturing, (vi) Sieving, and (vii) Storage and Bagging. MSW comprises of different wastes from different sources and sorting is important since left over inorganic materials might contaminate the final product. The segregation and sorting can be done manually or using a conveyor belt. Manual sorting is labour intensive but can achieve a good result if done carefully while conveyor sorting is subject to maintenance and requires power supply to operate. Shredding primarily involves shredding of the raw materials (organic waste) and can be done manually by crushing or chopping or by using mechanized milling machine. However, this depends on the source of waste. Wastes generated from the horticulture and agriculture as well as the agro-industries requires shredding before they are composted. The shredded raw material is then loosely heaped (called windrow) to an appropriate height of about 2 meters. However, it should be noted that the size of the heap should be suitable to build up the heat and also retain it to achieve pathogen inactivation. Windrow composting involves aerobic decomposition and hence passive diffusion of oxygen into the centre of the heap is a prerequisite.
This aerobic degradation is exothermic in nature which generates heat within the pile. To ensure that aerobic degradation can continue a sufficient supply of oxygen must be ensured. Turning of the

74
windrows also enhances oxygen supply. In the first weeks of the process it is recommended that the heap be turned 3 times weekly as temperatures such that higher temperatures are avoided as it will inhibit microbial activity. In such cases, turning can be an appropriate measure to cool the heap. After the first 2 weeks the turning frequency can be reduced to weekly turning and the pile can then be turned once every ten days. High temperatures and microbial activity during the thermophilic phase will lead to moisture losses. When moisture levels fall below 40 % additional water must be added to the heap with each turning. The moisture content should be maintained ideally between 40 and 60%. It takes about 5-6 weeks from the day piling takes place for the temperature of the pile to fall below 50°C and the maturation phase to set in. The material is characterized by a soil like colour. Mesophilic microorganisms become active and further stabilize the immature compost within approximately 15 days. Turning is no longer necessary and only little watering is required if the piles are very dry. After a total of about 8 weeks the mature compost material is characterized by a dark brown colour, an earthy smell and a crumbly texture. The final mature compost can then be sieved to obtain the required particle size which depends on the customer requirements. Sieving can help remove still remaining inorganic particles in the compost. The coarse rejects form sieving can be added to the fresh incoming waste. Sieving can be performed using a flat frame sieve operated with manual labour or using mechanical rotating drum sieves. Depending on the marketing and sales strategy, the final compost product can be either stored or sold in bulk or else be packaged in bags of different volumes. The moisture content should be below 40% before bagging and the final product should be stored in a dry and sheltered location.
Overall approach to socio-economic impact assessment
The socio-economic analysis of a project is concerned with its viability from a societal perspective and answers the questions of whether it is economically rational to proceed with the project (De Souza et al., 2011). In contrast to a financial analysis, socio-economic analysis provides a more comprehensive investigation on the effects of a proposed project, takes a broader perspective and determines the project’s overall value to society. The analysis, therefore, includes benefits and costs that directly affect the business entity running the project and the effects of the project on households, governments and other businesses outside of the business.
In the baseline scenario it is assumed that about 55% of the municipal solid waste is collected and landfilled. This assumption is used to make the calculations simplistic and would help in providing an idea about the waste that is being open-dumped without landfilled further or burned. The alternative scenario in contrast considers establishment of composting plant which can handle 600 tons of MSW and can produce compost up to 50 tons daily. It has been assumed that the entire waste in the baseline scenario which is being presently landfilled can be utilized for composting. Therefore in the alternate situation 3575 tons of waste is utilized which is accommodated in 6 composting plants since each has a capacity of 600 tons. Thus the socioeconomic assessment of the centralized compost business model considers upscaling of the project for the entire city based on providing an alternative solution to the bassline situation.
Environmental Impact Assessment
The alternate situation considered in the case of centralized large scale composting is contrasting to the baseline scenario since the entire waste which is being landfilled in the baseline scenario is being composted in the alternate scenario the main environmental impacts of which are as follows –
Avoided GHG emissions due to open dumping in the landfills,
Cost of leachate treatment that can be averted, and

75
Increase in soil fertility since compost acts as a soil conditioner
Avoided GHG emissions
In the baseline scenario (business as usual), the waste generated in the city is usually open dumped or burned which had been explained in the system boundary previously. This leads to GHG emissions from landfilling and open-dumping as well as burning. In the situation where the entire waste is send to the landfill site, segregated and the organic fraction of the waste is used for composting and the recyclables sold back, the chances for GHG emissions are averted. The price for Carbon Emission Reductions (CERs) following the CDM mechanism is USD 0.51 (ton Co2 equivalent). Utilising the above procedure and also considering the emissions from open-dumping of waste as 0.152 tons Co2-eq/ton, the annual savings in terms of GHG savings is calculated to be 202,168 ton Co2 equivalent which implies a monetary benefits ofUSD 120,086 annually.
Cost of leachate treatment
The leachate potential from a MSW landfill primarily depends on the precipitation and thus is influenced by the climatic conditions such as rainfall and evaporation. On an average leachate produced per tons of MSW is considered to be 87.2 - 100 lts which depends on the climatic factors and the characteristics of the waste. Therefore, the total amount of leachate produced annually can be calculated to be 111,828 lts. Considering the treatment cost of leachate to be USD 20 per litre (Johannessen, 1999; which on average ranges between 9 -30 USD/m3), the annual cost of leachate treatment can be estimated to be USD 2,236,555. In the alternate scenario, the entire amount of waste is bereft of the organic fraction and the recyclables which constitute the major fraction of the waste (more than 96%). The remaining inert material is considered to be landfill which also reduces the chances for production of leachate in the landfill.
Increase in soil fertility/amelioration
To provide a value for the increase in soil fertility the increase in yield due to application of the compost in the context of Vietnam had been considered. The application of compost at the rate of 5 ton per ha will increase the income of the farmers by 10 USD/ha. The area which can be covered by applying compost is 31,317 ha. Therefore, the increase in income due to increase in productivity is 313,170 USD.
The following tables provide the net benefits obtained in terms of averting environmental costs for composting the organic fraction of the MSW and utilizing them for agricultural production enhancement –
Table 50: Estimation of the net Environmental Impacts of large scale composting
Environmental Benefits Valuation (USD/annually) Avoided GHG emissions 102,086 Cost of leachate treatment averted 1,789,245 Soil amelioration 313,170 Total environmental benefits 2,204,500
Social Impact assessment
Employment
The total amount of MSW generated in Hanoi is about 6500 tons daily and only 55 percent of it being collected i.e., 3575 tons (Waste Supply Report, 2014). The entire waste collected is being sent to landfill.

76
In the baseline condition where a part of the waste is being landfilled, the number of labours engaged is 10. Based on an average wage rate ofUSD. 170 per month for labour in the unskilled category the annual wage income is USD 20,258.
The alternative situation considers that the whole of the MSW would be utilised for the compost business. This implies that 80% of the waste which comprises the organic fraction would be required for the compost and the rest landfilled (about 715 tons). In the alternative scenario thus the labour employment by each plant is 47 which is quite high as compared to the baseline scenario as it adds 37 additional labourers. Thus, as there are 6 plants the total amount of employment that will be created is 282. The average wage rate per worker is 217 USD/month. Therefore, income generation from additional employment is 733,211 USD annually.
Saving of Landfill area & disposal cost
The other costs related to the landfill which can be saved is by increasing the life of the landfill since there would be a restricted use of the landfill. In the baseline scenario since the entire waste is being landfill, there is a greater requirement of land compared to the alternate scenario where about 60% of the organic fraction of the waste is utilized for compost production and additionally 20% is being recycled. It is being assumed here that the recycling business which is quite a dominant informal sector engagement is being kept intact and the same amount of waste which can be recycled in the baseline scenario is being recycled in the alternate scenario. Therefore, the remaining 20% of the MSW find its way to the landfill in the alternate scenario reducing the amount of land required. In other words, while 3575 tons of waste is landfilled every day in the baseline scenario, in the alternate scenario only 20% of the waste is being landfilled (about 715 tons per day).
The land required for landfilling 1 ton of waste per day for a period of one year ranges from 0.01 – 0.03 hectares (Rawat and Ramanathan, 2011). The cost of landfill operations as estimated by Johannessen 1999 is around 10-15 USD per ton annually. Given these figures it is easy to estimate the amount of costs that are being averted by reducing the amount of waste that is being landfilled.The amount of land saved due to reduced landfilling is about 7.2 ha. the estimated savings of which is around USD 664,950 based on the fact that land prices in Hanoi is USD 9.3 per m2. However, this is considered as savings on initial investment and is not discounted annually. The additional costs of operation and maintenance costs saved due to reduced amount of waste being landfilled amount of USD 11,172 per day assuming USD 12.5 is spend per day on waste disposal and landfilling. Thus the amount of landfill and disposal costs saved is estimated to be around USD 4,077,734 over and above the land savings as mentioned above.
Reduction in externalities
The health cost per ton of MSW is estimated to be 11 USD. It has been assumed that in the alternative scenario externality can only be reduced to 25 percent of the MSW landfilled. Therefore, the amount of health expenditure avoided in the alternative scenario is 3,588,406 USD.
Other Social & Environmental costs which are not considered in the Social Impact
In the socioeconomic assessment the following costs and benefits are not being considered for the assessment –
Investments in the transportation vehicles for the MSW
GHG emissions from transportation

77
The unit costs of transportation of the MSW in Hanoi can be estimates using the following assumptions – (i) trucks owned by URENCO - there are 178 trucks employed by URENCO to collect municipal solid waste, (ii) price of each truck - the price of a truck is 40,000 USD and therefore, total investment needed is 7,120,000, (iii) total investment for the period of 5 years, considering the high depreciation of the vehicles used for MSW collection and transportation. This investment is five years and in five years amount of waste produced is 6,656,174 ton. Therefore, unit cost of handling MSW by truck is 1.07 USD. The number of households in Hanoi is 1,812,051 and one handcart can serve 56 households. Assuming handcarts collects waste twice, the number of handcarts required in Hanoi is 16,179. The cost of a handcart is 400 USD. Thus total cost needed to be incurred to buy handcart is 6,471,612 USD.To collect 3575 tons of MSW daily 238 trips are required. The average distance travelled by a truck is 50 km and millage of truck is 5 km/ltr. Hence, amount of diesel required daily is 2383 ltr and the cost of diesel is 1.05 per ltr. Total cost of transportation incurred annually is 913,413 USD.
The alternate scenario provides an alternate in the sense that the waste of 3275 tons produced per day which is being collected and landfilled is being collected in the alternate scenario and is send to the 6 compost plants instead of the landfill. Only about 15-20% of the inert waste which cannot be composted is send to the landfill. In the socio-economic assessment a simplistic assumption is being made that compost plants and the landfill used for disposal are at the same distance from the primary/secondary transfer stations in the city and hence the disposal cost and the GHG emissions from transportation in the baseline and alternate scenario does not vary much. This serves as the rationale for not considering the benefits in the social assessment of introducing large scale composting for Hanoi.
Financial Analysis
This section presents the financial feasibility analysis and results of business model considering production of from large scale centralized compost plant. As explained previously, to utilize the whole waste of the city, 6 large scale plants of 600 tons each had been considered. The financial analysis incorporated in the socioeconomic analysis escalates linearly the economic and financial costs presented in the financial analysis of the 600 tons plant in the financial report. The financial viability of the 6 compost plants is analyzed simultaneously based on Return on Investment (ROI),Net Present Value (NPV) and Internal Rate of Return (IRR) valuation criteria. The capital cost for each of the compost plantconsidered is taken to be USD 6141 per ton. The capital costs includes the following entities –
construction and building,
machine and equipment,
Environment Impact Assessment,
Investments for CDM
The project life of the plant is assumed to be 15 years. The financial assessment of the 6 plants operating in the city shows positive net profit excepting for the first year. The IRR of the proposed business is 8% which is below the discount rate and the Rate of Investment (ROI) is 6% implying that revenues are not high enough to recover all costs of the business. This is also observed that the benefit-cost ratio is less than 1 (0.78) indicating that financially the model is unviable.

78
Table 51: Financial results of Large Scale Centralized Compost Business Model (USD)
Year 0 Year 1 Year 2 Year 3 Year 4 Year 5 Year 6 Year 7 Year 8 Year 9 Year 10 Year 11 Year 12 Year 13 Year 14 Year 15
Total investment cost: 22106400
Total revenues
5202656 6816901 7282057 7674498 8013751 8699566 8977787 9233965 9473413
9700101
9917045
10126570
10330500
10530287
10727105
Total production and other costs
35,88,896 38,07,105 39,74,048 41,43,821 43,17,691 45,15,950 47,01,208 48,93,074 5092161
5,299,031
5514,212
5,738,218
5,971,553
6,214,721
6468235
Depreciation
14,73,760 14,73,760 14,73,760 14,73,760 14,73,760 14,73,760 14,73,760 14,73,760 1473760
1,473,760
1473760
1,473,760
1,473,760
1,473,760
1473760
Interest Payments
13,92,703 12,57,703 11,22,703 8,52,703 - - - - - -
-
-
-
-
-
Profit before tax
(1252703) 278333 7,11,546 12,04,214 22,22,300 27,09,856 28,02,820 28,67,131 2907492
2,927,310
2929073
2,914,592
2,885,187
2,841,805
2785111
Income tax
- 83,500 2,13,464 3,61,264 6,66,690 8,12,957 8,40,846 8,60,139 8,72,248
878,193
878722
874,378
865,556
852,542
835533
Net profit
(12,52,703) 1,94,833 4,98,082 8,42,950 15,55,610 18,96,899 19,61,974 20,06,992 2035244
2,049,117
2050351
2,040,214
2,019,631
1,989,264
1949578
Cash flow (2,21,06,400) 2,21,057 16,68,593 19,71,842 23,16,710 30,29,370 33,70,659 34,35,734 34,80,752 3509004
3,522,877
3524111
3,513,974
3,493,391
3,463,024
3423338
Discount rate 12%
Discounted cash flow
1,97,373 13,30,192 14,03,518 14,72,311 17,18,946 17,07,681 15,54,151 14,05,817 1265382
1,134,272
1013098
901,950
800,595
708,603
625431
Present value of cash flows 1,72,39,321
NPV (43,45,607)
IRR 8%
ROI (Financial)
-6% 1% 2% 4% 7% 9% 9% 9% 9% 9% 9% 9% 9% 9% 9%
ROI (Financial average) 6%

79
Socioeconomic Assessment of the business model
The socioeconomic analysis of large scale compost business model is performed by putting monetary value on all quantifiable cost and benefits in order to calculate the NPV, benefit cost ratio (BCR) and ROI for the business model. The previous sections have estimated the net benefits from the different impact assessments considering both the costs and benefits associated with the business at a city scale (the entire waste is consumed by the 6 large scale plants of 600 tons to produce compost). The consolidated socio-economic results are presented in Table 12. The analysis looked at the potential impact of compost business model at three levels where the levels range from including the direct benefits and costs that affect the business entity to including indirect benefits and costs to other sectors. The annual social and environmental benefits and costs from the business were discounted at a rate of 12% to obtain the present value of social and environmental impacts.
The large-scale compost model, has a negative NPV when only the direct economic/financial benefits are accounted and also has BCR is less than 1 implying that the business model is financially infeasible. The business model additionally performs better when the social and environmental costs and benefits are taken into account. The business model becomes economically feasible when all externalities are included in the analysis. The NPV when all externalities are considered is USD 60,789,734 and the BCR is 4.81. Thus, major contribution to the economic feasibility of the business is from the social benefits - employment generation, and health expenditure saved. Thus the large scale compost business model is socially feasible though it is financially infeasible.
Investment for the land made by the local body to ensure operations of the compost plants has also been included in the costs to derive the benefit-cost ratio for the socio-economic assessment.
Table 52: Net socio-economic results of Large-Scale Compost model
Socio-economic result (USD/year) Financial
value Financial &
environmental
Social, Environmental
&Financial
Financial result: NPV (43,45,607) (43,45,607) (43,45,607)
Environmental benefit: NPV of environmental benefits
14,160,714 14,160,714
Social benefit: Employment generation
4,709,818
Reduction in externalities
46,264,809
Reduction in Landfill O&M costs 27,772,896
Increase in Landfill life 664,950
Total social benefit
79,412,474
NPV (43,45,607) 9,815,107 60,789,734
ROI 6% 17% 31%
BCR 0.78 1.36 4.81
Sensitivity Analysis
The following table shows the stochastic variables with their respective distribution used for determining the probability distribution of the NPV derived from benefits in introducing the compost model. The variables used for the analysis includes – (i) discount rate, (ii) application rate of the compost, (iii) leachate production, (iii) treatment costs of the leachate, (iv) average increase in income due to application of compost, (v) investments and operational costs of the landfill.
Table 53: Selected variables for stochastic analysis

80
Variable Unit Distribution specified Source
Discount rate % Triangular: (10%, 12%, 15%)
Assumed
Application of compost ton/ha Uniform Distribution: (5, 10)
Assumed
Leachate production m3/ton Triangular distribution: (80, 85, 100)
Safari and Baronian (undated)
Cost of leachate treatment USD Triangular: (9, 20, 30) Johannessen 1999
Average increase in income due to application of compost
USD/ha Uniform: (5, 10) Conservative estimate based on
Landfill area saved per unit ha/ton Uniform: (0.01 – 0.03) Johanssen , World Bank
Investments and operational costs of landfill
USD/ton Triangular: (10, 12.5, 15) Johanssen , World Bank
http://www.worldbank.org/urban/solid_wm/erm/CWG%20folder/uwp5.pdf
The figure below shows the probability distribution of the NPV with a mean of 60.29 million and a certainty of 50% to achieve the mean NPV. The combination of certainty of the NPV, benefit-cost ratio and a lower ROI makes the feasibility of the business low socioeconomically.
Figure 8: Probability density function of the NPV of large scale composting
Conclusion
This study assessed the socio-economic impact of a composting business model in Hanoi, Vietnam. The socio-economic analysis is conducted based on the valuation of financial, environmental and health benefits and costs associated with the business model. The following conclusions can be drawn from the study:
- Composting plant can reduce the GHG gas emissions and leachate production and thus reduces the chances of air pollution, water pollution and soil pollution.
- Composting plant can produce sufficient revenue from collection of MSW and selling of compost.
- Use of compost may increase the soil productivity. - Composting of MSW can reduce the health risks sufficiently as we increase the amount of
composting. - Composting can reduce the import of inorganic fertilizer and thus save foreign exchange.

81
- Composting plant can also raise the price of land in the adjacent area to landfill site or open dumping space.
However, even with a greater than 1 benefit-cost ratio, the certainty of achieving the mean level of NPV is lower which makes the business less feasible for Hanoi.

82
Socio-economic impact assessment of subsidy-free community based composting business model in Hanoi
Introduction
The increasing quantity of urban waste in urban towns of developing nations coupled with inadequate sanitation services is of a growing concern to the deteriorating urban environment (Oyoo, 2010). In Hanoi 2500 tons of Municipal Solid waste is generated daily and out of this about 40 percent is collected and the remaining uncollected waste is normally burnt and/or dumped in unauthorised sites, causing health and environmental problems. However, the organic fraction of domestic waste can provide an opportunity to improve livelihoods and incomes through fertilizer and energy production (Komakech, 2014).
The potential economic, environmental, social and health impacts of composting plant needs to be assessed to ensure its sustainable development. In this study, we evaluated the socio-economic impacts of decentralised composting of MSW business with plant capacity of 10 tons MSW each daily i.e., 3650 tons MSW annually. Through decentralised composting 18 communities with 300 households in each community i,e., 5400 persons will be served. The socio-economic analysis is conducted based on the valuation of financial, environmental and health benefits and costs associated with the business model.
Technological description for Decentralized Composting from MSW
There are two fundamental types of composting techniques – open or windrow composting and enclosed or in-vessel composting method (Dulac, 2001). Open composting processes are simpler, require less capital, and use less energy. This generally rely more on land and labour and less on machinery. In comparison enclosed or in-vessel composting is more technology driven and require complex equipment and also utilizing substantial amounts of energy. The aerobic process or the windrow composting is arguably the most suitable technology for developing countries like Uganda based on operation costs. While operating costs usually start at US $ 40 per ton, for the least expensive variant; more expensive systems can cost up to US $ 100 per ton, operational costs for windrow composting is comparatively lower around US $ 5 to US $ 20 per ton.
Windrow composting comprises of – (i) Pre-processing (segregation/sorting), (ii) Shredding, (iii) Piling of the waste, (iv) Turning of the windrows, (v) Maturing, (vi) Sieving, and (vii) Storage and Bagging. MSW comprises of different wastes from different sources and sorting is important since left over inorganic materials might contaminate the final product. The segregation and sorting can be done manually or using a conveyor belt. Manual sorting is labour intensive but can achieve a good result if done carefully while conveyor sorting is subject to maintenance and requires power supply to operate. Shredding primarily involves shredding of the raw materials (organic waste) and can be done manually by crushing or chopping or by using mechanized milling machine. However, this depends on the source of waste. Wastes generated from the horticulture and agriculture as well as the agro-industries requires shredding before they are composted. The shredded raw material is then loosely heaped (called windrow) to an appropriate height of about 2 meters. However, it should be noted that the size of the heap should be suitable to build up the heat and also retain it to achieve pathogen inactivation. Windrow composting involves aerobic decomposition and hence passive diffusion of oxygen into the centre of the heap is a prerequisite.
This aerobic degradation is exothermic in nature which generates heat within the pile. To ensure that aerobic degradation can continue a sufficient supply of oxygen must be ensured. Turning of the windrows also enhances oxygen supply. In the first weeks of the process it is recommended that the heap be turned 3 times weekly as temperatures such that higher temperatures are avoided as it will inhibit microbial activity. In such cases, turning can be an appropriate measure to cool the heap.

83
After the first 2 weeks the turning frequency can be reduced to weekly turning and the pile can then be turned once every ten days. High temperatures and microbial activity during the thermophilic phase will lead to moisture losses. When moisture levels fall below 40 % additional water must be added to the heap with each turning. The moisture content should be maintained ideally between 40 and 60%.
It takes about 5-6 weeks from the day piling takes place for the temperature of the pile to fall below 50°C and the maturation phase to set in. The material is characterized by a soil like colour. Mesophilic microorganisms become active and further stabilize the immature compost within approximately 15 days. Turning is no longer necessary and only little watering is required if the piles are very dry. After a total of about 8 weeks the mature compost material is characterized by a dark brown colour, an earthy smell and a crumbly texture. The final mature compost can then be sieved to obtain the required particle size which depends on the customer requirements. Sieving can help remove still remaining inorganic particles in the compost. The coarse rejects form sieving can be added to the fresh incoming waste. Sieving can be performed using a flat frame sieve operated with manual labour or using mechanical rotating drum sieves. Depending on the marketing and sales strategy, the final compost product can be either stored or sold in bulk or else be packaged in bags of different volumes. The moisture content should be below 40% before bagging and the final product should be stored in a dry and sheltered location.
Overall approach to socio-economic impact assessment
The socio-economic analysis of a project is concerned with its viability from a societal perspective and answers the questions of whether it is economically rational to proceed with the project (De Souza et al., 2011). In contrast to a financial analysis, socio-economic analysis provides a more comprehensive investigation on the effects of a proposed project, takes a broader perspective and determines the project’s overall value to society. The analysis, therefore, includes benefits and costs that directly affect the business entity running the project and the effects of the project on households, governments and other businesses outside of the business.
In many developing countries large centralized and highly mechanizedcomposting plants have often failed to produce good qualitycompost. In Hanoi of the 6500 tons of waste generated per day, about 3625 tons of waste is landfilled and the rest is open-dumped without being disposed in the landfill. The present chapter discusses the socioeconomic feasibility of decentralized composting in Hanoi. The alternative situation of setting up decentralized collection of the organic waste and composting is being evaluated against the baseline scenario. In the alternative situation, the targeted waste collection is 50% of the waste disposed in the landfilled and the entire waste of 2875 tons which is not disposed in the landfills. Decentralized composting is thought of as a remedy where waste generation is relatively higher and there exists a financial burden in terms of collection of the waste for disposal and treatment. Considering the situation in Hanoi where some of the landfills are approaching their lifetime, it has been assumed that 50% of the waste presently collected can be suitably collected and composted through decentralized approach. The areas away from the landfill sites (or are away from newly planned landfill sites) are assumed to be brought under decentralized collection and compost stations. However, this study does no delve into the demarcation of the zone which would come under the ambit of the decentralized collection and compost production. The present study is more oriented to evaluate whether an extensive decentralized composting is socio-economically feasible in the context of Hanoi such that it reduces the budgetary pressure of the local body in terms of waste collection and disposal delivery.
The objective of the alternative scenario is to set up community based smaller compost plants of 3 tons. It is being calculated based on waste generation and characteristics that collection of the organic fraction of the waste from 2000 households would lead to a collection of 3 tons of waste. It is assumed that these households would form a co-operative among themselves for collection and
84
composting of the organic fraction of the waste. The business models also assumes that each of these co-operatives is linked to a business entity which takes up the compost and plays an important role in marketing the compost. For simplicity the business entity related to the co-operatives are homogenous in sense that each of the business entity is linked with 7 of such co-operatives from which the compost is procured for further sell either in wholesale or retail. Thus for Hanoi the number of business entities engaged for decentralized composting is 15. Based on the waste collection of 4600 tons per day in Hanoi, it has been calculated that there is a requirement of 104 co-operatives for collection of the waste. The chapter evaluates the socioeconomic costs and benefits of all the co-operatives and the associated business together. The following section describes the assumptions made, scenarios modelled and data sources used for assessing the social, economic, environment and health impacts of the large scale composting model from MSW.
Environmental Impact assessment
As mentioned in the previous section the baseline scenario considers that the total Municipal Solid Waste generated in Hanoi is 6500 tons daily. In contrast the alternative scenario considers that 4600 tons of waste is collected and composted through decentralized co-operatives based at the community level. Decentralized composting helps in local collection of the waste and provides savings in terms of the transportation cost of the waste. At the same time with 60% of the organic fraction of the waste being diverted to the compost plant, the environmental effects of landfills are also restricted. The potential effects on environment which are estimated for the impact assessment in case of decentralized composting are as follows -
Avoided GHG emissions,
Cost of leachate treatment that can be averted, and
Increase in soil fertility since compost acts as a soil conditioner
Avoided GHG emissions
In the baseline scenario (business as usual), the waste generated in the city is collected and transported to the landfill while part of it remain uncollected and is usually open dumped. In the alternative scenario 50% of the waste presently collected from sites away from landfills are brought under decentralized co-operatives. This has implications in reduction of the present level of the GHG emissions resulting from the transportation of the waste. The GHG emission savings has been estimated based on calculation of the number of trips required annually and the diesel consumption by a truck on average. The main assumption used while modelling the transport emissions are – (i) the fact that the carrying capacity of a truck is 15 tons, (ii) that it can transport waste 5 km per litre on an average, (iii) average distance travelled for waste disposal by each of the truck is 50 kms., and (iv) GHG emissions from the automobile diesel is about 2.67 kg Co2/lt. (World Resource Institute). The amount of GHG emissions from transportation of 3625 tons of waste daily is estimated to be 2,086,700 tons of CO2 equivalent. Thus the conservative of the transportation of 50% of the waste is around 1,043,350 tons of CO2 equivalent.
However, there are GHG emissions from the transportation of the compost from each of the respective 104 co-operatives to the main packaging unit. Based on the assumptions mentioned, the GHG emissions were calculated which amounts to 465,888 tons of CO2 equivalent. Further, open dumping also leads to GHG emissions of about 0.1523 tons of CO2 equivalent per ton of MSW in a year. In the alternative scenario where open-dumping of 4600 tons of waste is averted, the net GHG savings would amount to 261,058 tons of CO2 equivalent. The net savings in terms of the GHG emissions saved by introducing decentralized collection and composting in Hanoi amounts to 838,520 tons of CO2 equivalent (Table 1).
Table 54: Value of Net GHG emissions in introducing decentralized collection and composting of MSW

85
Unit Value
Avoided GHG emissions from open dumping tons of CO2 equivalent 261,058
Net GHG emissions from transportation tons of CO2 equivalent 577,462
Value of CERs USD/ tons of CO2 equivalent 0.51
Value of GHG emissions averted USD/annum 427,645
To estimate the total value of the GHG emissions the CER values per tons of CO2 equivalent has been used. The conservative estimates of CERs through CDM has been considered as 0.51 USD/ton CO2 eq. The above table (Table 1) shows the estimated value of the GHG emissions that can be averted.
Cost of leachate treatment
The leachate potential form a MSW landfill primarily depends on the precipitation and thus is influenced by the climatic conditions such as rainfall and evaporation. In tropical conditions like that of Vietnam, the average leachate produced per tons of MSW is considered to be 87.2 - 100 lts. Whereas in the baseline scenario the entire daily waste of 3625 tons is being landfilled, the alternate scenario considers the landfilling of the 20% of the 4600 tons waste that is being collected. The basis of the assumption is based on the fact that 60% of the waste which is organic is taken up for composting while 20% of it is being recycled. Recycling is an important source of livelihood in Hanoi where it employs many wageworkers. It is assumed in the model that since waste segregation takes place at source (the household level), the informal recycling industry can be kept intact without any social impacts of loss of livelihood. The only change is that, in the baseline scenario they are based at the landfills whereas in the alternate scenario they are able to collect it from the household level. Therefore, considering the lower range, the net amount of leachate production which can be averted annually can be calculated to be 82658.7 m3 annually. Considering the treatment cost of leachate to be USD 20 per m3 (Johannessen, 1999; ranges between 9 – 30 USD/m3), the annual cost of leachate treatment can be estimated to be USD 1,653,174 per annum.
Increase in soil fertility/amelioration
To provide a value for the increase in soil fertility the increase in yield due to application of the compost in the context of Hanoi has been considered. Application of compost in tomato farms increase the net income by USD 10/ha of application. In Hanoi vegetable production is the main source of income for farmers engaged in peri-urban agriculture. The value provided by the above study is used for measuring the shadow price of increase in soil fertility. However, conservative estimates are obtained for the deterministic model since there might be variances in the net farm income from vegetable production in different areas. The conservative estimates of USD 5/ha. is thus assumed to take care of difference in farm gate prices for different vegetables across different regions and also the present condition of the soil characteristics. The increase in the net farm income is also based on the application rate of compost between a range of 5-10 tons/ha. The estimated increase in the value of the soil fertility is estimated as USD 666,841 per annum with about 66,000 hectares where compost is being applied.
The following table (Table 55) provide the net benefits obtained in terms of averting environmental costs for composting the organic fraction of the MSW and utilizing them for agricultural production enhancement –
Table 55: Estimation of the environmental benefits due to utilization of MSW for producing compost
Environmental Benefits Valuation (USD/annually) Avoided GHG emissions 427,654
Cost of leachate treatment averted 1,653,174 Soil amelioration 668,841

86
Total environmental benefits 2,747,661
Employment
Decentralized collection of household waste is more labour intensive compared to centralized composting. The amount of labour required for collection of the organic fraction of waste of 3 tons from a particular ward of 2000 households is based on the following assumption presented in the following table (Table 3). The other assumptions with regards to the trips made each day is based on time of work for each team. Each team comprised of the 2 members collects waste for 6 hours a day where collection time from 60 households is completed in 10 minutes. This is achieved as the collectors would generally wait for the households in a common collection point to dump their household waste in the collection vehicle for 10 minutes. The collection point would be identified such that it is accessible to the households and reachable within the waiting period of the collection team.
Table 56: Calculations showing the labour requirement for collection of waste
Unit Value
Volume of the collection vehicle m3 1
Density of waste kg / m3 350
Number of trips by the collection van 2
Number of vans required 4
Number of labours per van 2
Total labours for a particular ward 8
In each of the ward level composting station, 3 semi-skilled labours sort the entire waste collected each day and are responsible for compost production. Each of business entity linked with 15 such co-operatives employs 2 labours for collection and transportation of the compost, 2 labour to collect and store the compost and package it, and one plant manager. The total of employment generated in each of the ward is 11 amounting to 1144 labours getting employed. Likewise in the 15 businesses the total employment generated is 75 resulting in 1219 number of skilled and semi-skilled workers for the entire city. The average monthly wage rate for workers in Hanoi is around USD 170. Therefore the amount of monetary benefits generated in terms of the monthly income of the workers is estimated to be USD 2478,033 per annum.
Saving of Landfill area & disposal cost
The other costs that can be saved from composting the MSW are cost of landfilling area that is saved due to reduction in the amount of waste that is collected and disposed. Similarly, reduction in disposal cost from reduced collection and landfilling also accrues as benefits for the municipalities. The land required for landfilling 1 ton of waste per day for a period of one year ranges from 0.01 – 0.03 hectares (Rawat and Ramanathan, 2011). The cost of landfill operations as estimated by Johannessen 1999 is around 10-15 USD per ton annually. The alternate scenario considers reduces waste disposed off to the landfill. The amount of land saved due to reduced landfilling is about 9.3 ha. the estimated savings of which is around USD 867,225 based on the fact that land prices in Hanoi is USD 9.3 per m2. However, this is considered as savings on initial investment and is not discounted annually. The costs saved on reduced operations on the landfill amount to USD 3,262,188 annually. The disposal costs per ton of MSW collected was calculated to be 0.67 USD. Hence the amount of savings in terms of waste disposal amounts to USD 437,133 annually.
Costs on sensitizing households for segregation of waste
The pertinent benefit obtained from decentralized composting is that of tapping the organic fraction ready for use from the households. However, to obtain such benefits, the households especially in

87
the lower income areas needs to be sensitized about the utility of segregating waste at source such that it can be easily available for composting. However, such Information, Education and Communication (IEC) or Behavioral Change Communication (BCC) Programs need to run over a period of time such that changes in Knowledge, Attitude and Practice of the individuals change over time. For the present study a five year period of such campaigns among the households is assumed with an initial higher investment in the first year followed by reduction in those costs. The investment made in the first year includes both the campaigning costs and the costs of providing households with the bins such that they are able to segregate the waste at source. The conservative estimate used for the socio-economic analysis is that primarily USD 10 per household is budgeted which is substantially reduced over the years to USD 2.5 per household from year 2 to year 5.
Profit for the co-operatives
The financial analysis shows that the decentralized collection and composting of the organic fraction at the ward level is sustainable financial and each of the co-operative earns a positive Net Present Value (NPV) of USD 28,278 with an Internal Rate of Return (IRR) higher than the discount rate 35%. The revenue of these co-operatives come from two sources – (i) sell of compost and (ii) user fees from the households. In fact the user fees from the households helps in the financial sustenance of the co-operatives. Thus for the entire city where 104 co-operatives are assumed to be operating, the profit accrues as societal benefits for collection, disposal and treatment of the household wastes. The figures for a representative co-operative is being shown in the financial, however the financial analysis of the business mainly revolves around the business entity procuring compost and marketing it. The investments made by the co-operatives are however used to determine the final benefits and costs along with the investments made from business entity.
Other externalities from the landfilling and composting
A report by the European Commission (2000) on externalities arising from the landfills estimates the value of the negative externalities incurred by the households. The reports estimates the value of the negative externalities as valued by individuals is around 11 USD/ton which implies that the total burden of externalities averted due to reduced landfilling is around USD 3,588,406 per year.
In the social assessment, health aspects has not been considered. Health impacts from landfills or open MSW dumping is primarily associated with skin diseases (for workers) or vector borne diseases (to nearby households). However, direct one-to-one causal relationship is hard to obtain more so in terms of data. In the financial analysis, protective gear for the workers had been considered which values the health expenditure (for averting diseases). At the same time the valuation of the negative externalities take into account different menaces associated with residing near the landfill sites. These estimates as mentioned above provide a conservative approximations of health impacts with landfill and composting operations at a large scale.
Financial Analysis

88
Table 57: Financial of the co-operative for decentralized composting
Year 0 Year 1 Year 2 Year 3 Year 4 Year 5 Year 6 Year 7 Year 8 Year 9 Year 10 Year 11 Year 12 Year 13 Year 14 Year 15
Total Investment 21,382
Revenue
Total Revenue
30,435 32,115 33,913 35,836 37,894 40,096 42,453 44,974 47,671 50,558 53,647 56,951 60,488 64,271 68,320
Expense
Labour and Input costs
20829 22287 23847 25516 27302 29213 31258 33446 35787 38292 40973 43841 46910 50194 53707
Supplies, Utilities &Other costs
500 535 572 613 655 701 750 803 859 919 984 1052 1126 1205 1289
O & M costs
404 432 463 495 530 567 607 649 694 743 795 851 910 974 1042
Total Expense
21733 23254 24882 26624 28487 30481 32615 34898 37341 39955 42752 45744 48946 52372 56039
Profit before tax
8702 8861 9031 9213 9407 9615 9838 10076 10331 10603 10895 11207 11541 11899 12281
Income tax 1740 1772 1806 1843 1881 1923 1968 2015 2066 2121 2179 2241 2308 2380 2456
Net Profit
6962 7089 7225 7370 7526 7692 7870 8061 8265 8483 8716 8966 9233 9519 9825
Cash Flow (21,382) 6962 7089 7225 7370 7526 7692 7870 8061 8265 8483 8716 8966 9233 9519 9825
Discounted Cash Flow
6,216
5,651
5,142
4,684
4,270
3,897
3,560
3,256
2,980
2,731
2,506
2,301
2,116
1,948
1,795
NPV 28,278
IRR 34%
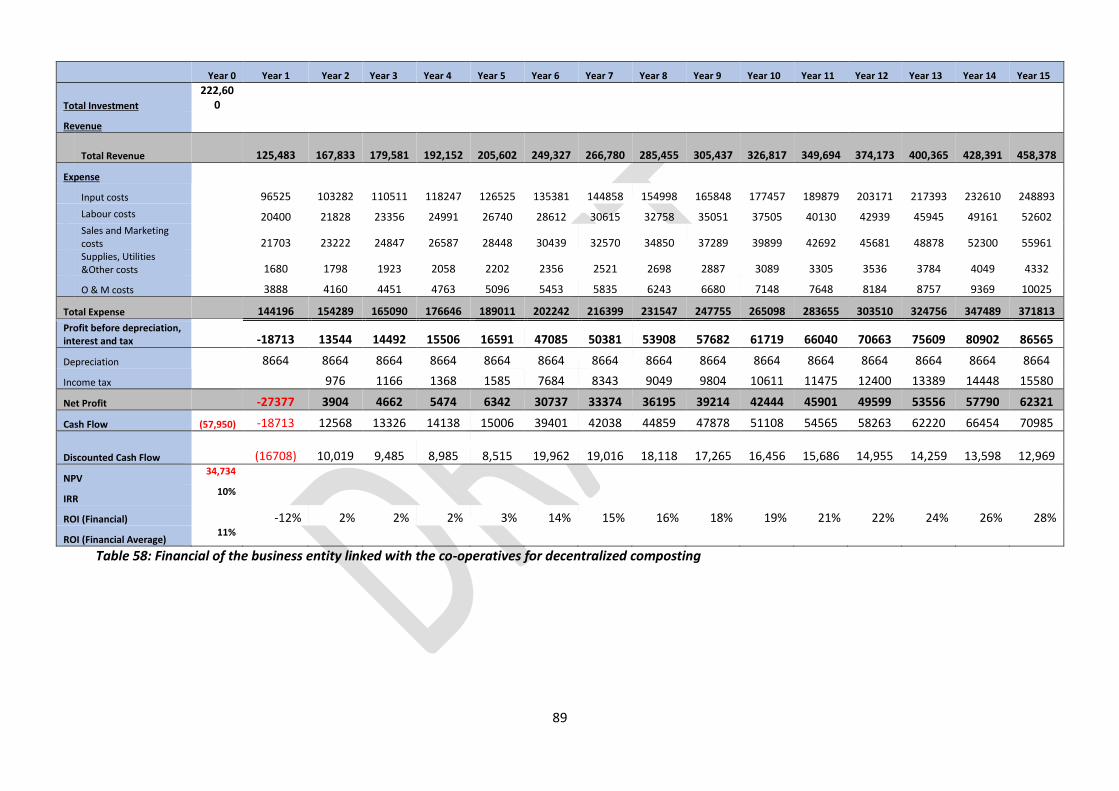
89
Table 58: Financial of the business entity linked with the co-operatives for decentralized composting
Year 0 Year 1 Year 2 Year 3 Year 4 Year 5 Year 6 Year 7 Year 8 Year 9 Year 10 Year 11 Year 12 Year 13 Year 14 Year 15
Total Investment
222,600
Revenue
Total Revenue
125,483
167,833
179,581
192,152
205,602
249,327
266,780
285,455
305,437
326,817
349,694
374,173
400,365
428,391
458,378
Expense
Input costs
96525 103282 110511 118247 126525 135381 144858 154998 165848 177457 189879 203171 217393 232610 248893
Labour costs 20400 21828 23356 24991 26740 28612 30615 32758 35051 37505 40130 42939 45945 49161 52602
Sales and Marketing costs
21703 23222 24847 26587 28448 30439 32570 34850 37289 39899 42692 45681 48878 52300 55961
Supplies, Utilities &Other costs
1680 1798 1923 2058 2202 2356 2521 2698 2887 3089 3305 3536 3784 4049 4332
O & M costs
3888 4160 4451 4763 5096 5453 5835 6243 6680 7148 7648 8184 8757 9369 10025
Total Expense
144196 154289 165090 176646 189011 202242 216399 231547 247755 265098 283655 303510 324756 347489 371813
Profit before depreciation, interest and tax
-18713 13544 14492 15506 16591 47085 50381 53908 57682 61719 66040 70663 75609 80902 86565
Depreciation
8664 8664 8664 8664 8664 8664 8664 8664 8664 8664 8664 8664 8664 8664 8664
Income tax 976 1166 1368 1585 7684 8343 9049 9804 10611 11475 12400 13389 14448 15580
Net Profit
-27377 3904 4662 5474 6342 30737 33374 36195 39214 42444 45901 49599 53556 57790 62321
Cash Flow (57,950) -18713 12568 13326 14138 15006 39401 42038 44859 47878 51108 54565 58263 62220 66454 70985
Discounted Cash Flow
(16708)
10,019
9,485
8,985
8,515
19,962
19,016
18,118
17,265
16,456
15,686
14,955
14,259
13,598
12,969
NPV 34,734
IRR 10%
ROI (Financial)
-12% 2% 2% 2% 3% 14% 15% 16% 18% 19% 21% 22% 24% 26% 28%
ROI (Financial Average) 11%

90
Socioeconomic Analysis
The following section discusses about the socio-economic evaluation in a nutshell. The following table indicates that there is low financial viability without subsidy for the business. However, inclusion of environmental and societal benefits enhances the net positive earnings of the business. The ROI for the business is 200% with a benefit-cost ratio of 14 and a net NPV of 74,502,891. Apparently, from the deterministic model the business seems economically feasible although not financially.
Table 59: Socio-economic analysis of the decentralized business model
Socio-economic result (USD/year) Financial value
Financial and environmental value
Social, environmental and financial value
Financial result:
NPV (783,795) (783,795) (783,795)
Environmental benefit: Value of net GHG emission saving 14,794,075 14,794,075
Social benefit: Savings in landfill operational costs 22,218,317 Profit of the co-operatives 2,929,900 Reduction of externalities 46,204,809 Value of employment 15,917,767 Savings in disposal costs 2,977,254
Benefit:Cost ratio (BCR) 0.74 3.11 14 NPV (783,795) 14,010,279 74,502,891 ROI (average) 10% 81% 200%
Sensitivity Analysis
To evaluate the uncertainty associated with the business particularly the environmental and social aspects, some of the selected variables were treated to be stochastic. These variables had their own distribution such that it might vary across different ranges and hence help in the iterations of determining the NPV. The different NPV along with their frequencies forms the probability distribution of the NPV derivable from the business as a whole.
Table 60: Selected variables for the stochastic analysis of the decentralized model
Variable Unit Distribution assumed Reference
Discount rate % Triangular (10, 12, 15%)
Assumed ranges between 10% to 15%
Application of compost ton/ha Uniform Distribution: (5, 10) Assumed
Leachate production m3/ton Triangular distribution: (80, 85, 100)
Safari and Baronian (undated)
Cost of leachate treatment USD Triangular: (9, 20, 30) Johannessen 1999
Average increase in income due to application of compost
USD/ha Uniform: (5, 10) Conservative estimate based on
Landfill area saved per unit ha/ton Uniform: (0.01 – 0.03) Johanssen , World Bank
Price of CERs USD/ton CO2 eq.
Triangular: (1, 3.8, 5) Assumed considering the volatility of the market

91
Figure 9: Probability density function of the NPV derived for the decentralized model
The figure above shows the probability density function of the NPV for introducing the decentralized business in Hanoi. The higher ROI and benefit-cost ratio shows that the business is feasible in a medium range of uncertainty. In fact the chances of attaining the mean level of NPV is 54%. However, it is to be noted that decentralized model fares better than the centralized model for Hanoi.
Conclusion
This study assessed the socio-economic impact of decentralized composting business model in Hanoi, Vietnam. The socio-economic analysis is conducted based on the valuation of financial, environmental and health benefits and costs associated with the business model. The following conclusions can be drawn from the study:
- Composting plant can reduce the GHG gas emissions and leachate production and thus reduces the chances of air pollution, water pollution and soil pollution.
- Composting plant can produce sufficient revenue from collection of MSW and selling of compost.
- Use of compost may increase the soil productivity.
- Composting of MSW can reduce the health risks sufficiently as we increase the amount of composting.
- Composting can reduce the import of inorganic fertilizer and thus save foreign exchange.
- Composting plant can also raise the price of land in the adjacent area to landfill site or open dumping space.
Therefore, composting of MSW from perspective of socio-economic analysis is attractive.

92

93
Socio-economic impact assessment of High Value fertilizer production for profit
Introduction
This business model focusses on processing urban waste that contains valuables such as nutrients and solid materials that can be recycled. The business can be set up either by a private or a public entity or even jointly as a public-private-partnership (PPP). Large scale recovery and reuse of nutrients from MSW as compost and night soil as super compost could generate revenue for the public entity from the waste that had would otherwise have to be disposed of at cost and make available partially subsidized compost to farmers for reuse as nutrients and soil conditioner. The entity benefits from cost savings, new revenue generation, and public satisfaction which is one of the primary motive of the public bodies. Public benefits from reduced indiscriminate disposal and improved environment through proper waste management practices and local jobs. Farmers benefit from availability of compost and higher agricultural productivity and incomes. Environment benefits from sustainable solid waste management practices and less waste disposal to landfills. Municipality could generate significant income from its several revenue streams – sale of regular compost and super compost to farmers and bulk sale for landscaping, and re-selling non-degradables to recycling firms at higher prices. This nevertheless requires capital investment in composting plant and ongoing costs for its operation and maintenance, which could potentially also come from central government subsidy and direct capital investments. The municipality has the in-built incentive to undertake those investments to help save costs and generate new revenue. The enabling environment for such investments is also ripe as municipality has the mandate to adopt sustainable waste management solutions, and almost unlimited supply of free waste feedstock and often does not require a permit from others for composting but must provide for monitoring of compost quality and quality assurance for safety of public health and environment and gain market penetration for compost. Most municipalities have access to such services for ensuring compliance with quality safeguards or can partner with a local university for quality analysis at cost. Sale of non-degradable such as plastics and metals to recycling firms can generate additional revenue, minimizing dependence on subsidies, and to may move the model from recovering costs to generating profits. Opportunities for making profits could entice private entities to partner with the public entity and bring win-win outcomes for the stakeholders.
Given the context of Hanoi this report investigates the socio-economic impacts of producing compost using municipal solid waste and faecal sludge. The potential economic, environmental, Social and health impacts of composting plant needs to be assessed to ensure its sustainable development. In this study, we evaluated the socio-economic impacts of fortifier production using municipal solid waste and faecal sludge with annual production capacity of 1000 tons of fortifiers annually. The socio-economic analysis is conducted based on the valuation of economic, Social, environmental and health benefits and costs associated with the business model.
Technological description of fortifier production using municipal solid waste and faecal sludge
The technological process of producing fortified compost includes two phases (Nikiema et. al., 2013). The first phase consists of – (i) drying, (ii) sorting, (ii) second sorting and shredding, (iii) co-composting and (iv) grinding. The second phase consists of – (i) enrichment, (ii) pelletizing, (iii) drying and (iv) packaging. Drying includes emptying of fecal sludge from public latrines and domestic septic tanks in the drying bed to get solid fecal sludge (main raw material). Usually 3 Drying beds of 240 m2 each can produce 2tonnes of solid fecal sludge each in 2 weeks. While the fecal sludge is dried, the

94
Municipal Solid Waste (MSW) is initially sorted and carried out off - site at the refuse dumps (markets) to remove plastics and other non-degradable materials. The second sorting of the MSW takes place onsite followed by shredding. Subsequently the organic market waste is added to the solid fecal sludge in the ratio 3:1 and co-composted using windrow composting (150 m2 platform carries 3 tons of co-compost). This is followed by drying the matured compost and it takes about 60 days to produce a matured compost. The matured co-compost is further grinded into smaller particles using grinder.
The initial step towards second phase starts with enrichment of the co-compost. The finely grinded co-compost is mixed with starch (which acts as a binder), ammonium sulphate (to enrich it with nitrogen) and water. The composition of starch, ammonium sulphate and water are 3%, 7% and 26% respectively. The mixer from the enrichment stage are put into the pelletizer to form pellets. The pelletized compost are then sun dried on a platform which takes about 2-3 days. The dried pelletized composts are sieved, weighted and packaged in size according to suitability.
Overall approach to socio-economic impact assessment
The socio-economic analysis of a project is concerned with its viability from a societal perspective and answers the questions of whether it is economically rational to proceed with the project (De Souza et al., 2011). In contrast to a financial analysis, socio-economic analysis provides a more comprehensive investigation on the effects of a proposed project, takes a broader perspective and determines the project’s overall value to society. The analysis, therefore, includes benefits and costs that directly affect the business entity running the project and the effects of the project on households, governments and other businesses outside of the business.
First, we have evaluated the current scenario in Hanoi which is denoted as baseline scenario with the help of cost-benefits analysis. Total Municipal Solid Waste generated in Hanoi is 6500 tons daily. It is assumed that 55 percent of solid waste generated is collected i.e., 3575 tons are collected. Out of these 3575 tons 100 percent of this MSW generated goes to landfill. In Hanoi city the amount of faecal sludge generated daily is about 1600 m3 daily and 388 m3 is collected which produces dewatered faecal sludge of 7.76 tons daily. Second, we have assumed that a composting plant produces 1000 tons of fortifiers annually using municipal solid waste and faecal sludge will be established. Then the cost benefit analysis of this plant is being done and compared with the baseline scenario.Third, we have increased the number of plants to such an extent so that all of the municipal solid waste and faecal sludge generated in Hanoi can be handled. The cost-benefit analysis of this scenario is also being analysed and compared with the baseline scenario.
In the following section we describe the assumptions made, scenarios modelled and data sources used for assessing the Social, economic, environment and health impacts of the faecal sludge composting model.
Environmental Impact
Environmental Costs in the Baseline Scenario
Green House Gas Emissions
The baseline condition considers that 55% of the MSW is being collected and landfilled. The rest of the MSW about 2925 tons of waste in open dumped without being disposed off in the landfill. In contrast, the alternative scenario where high value is being produced, the organic fraction of the MSW is being diverted to 9 plants each producing 1000 tons of high valued fertilizer. This entails a requirement of 11,640 tons of MSW along with 2328 tons of dewatered faecal sludge annually. The waste which can otherwise be utilized, stay in the open dumps and one of the primary cause for emission of greenhouse gases. The amount of GHG gas emissions from MSW is calculated to be

95
0.1534 tons Co2-equivalent/ton in the context of Hanoi. This is derived from the first order decomposition equation as recommended by UNFCC.
Similarly, estimation of the GHG emissions from faecal sludge which is presently directly discharged has also been estimated based on the following assumptions. Based on the study by Bond and Templeton, 2011 it is assumed that biogas production per capita is 0.04 m3/person/day. Therefore the amount of biogas produced is 107,178,200 m3 per annum. The methane content in biogas is 65% while carbon-dioxide percentage is 30%. The density of methane and that of carbon dioxide is 0.71 kg/m3 and 1.98 kg/m3. This implies that the amount of methane and carbon dioxide generated is respectively 49,462,739 Kg and 63,663,850 kg respectively. However, 90% of Hanoi’s population is connected to septic tanks and there are also leakages during the co-composting. To make the estimations more realistic the study assumed that 50% GHG emissions cannot be averted by introduction of high value fertilizer business. Thus this implies the total GHG emissions (converting the methane generated into carbon dioxide equivalent) 530,620 tons of CO2 equivalent.
In this study it is assumed that carbon credits will be traded in Carbon Emission Reduction (CER) units as CER is suited for large scale projects and are sold in volumes that are targeted to clients seeking small reductions to offset their footprints. The CER unit is equivalent to a reduction of 1 ton of CO2 equivalent emissions (Reuster 2010). Based on the World Bank (2014), carbon credit prices in 2013 is about USD 0.51 per kgCO2 - equivalent. Therefore, the amount of greenhouse gases which can be averted by co-composting MSW as well as fortifying from each plant is estimated to be USD 271,527 annually.
Cost of leachate treatment
The leachate potential from a MSW landfill primarily depends on the precipitation and thus is influenced by the climatic conditions such as rainfall and evaporation. On an average, leachate produced per tons of MSW is considered to be 87.2 lts. Therefore, the total amount of leachate production avoided annually can be calculated to be 200 lts from each plant. Considering the treatment cost of leachate to be USD 20 per litre (Johannessen, 1999; the range provided by the study varies between 9 – 20 USD/ton of waste), the annual cost of leachate treatment can be estimated to be USD 3990 annually.
Surface water pollution
In the baseline scenario open dumped MSW and faecal sludge have higher chances to run into surface water and discharge Nitrogen (N), Phosphorous (P), suspended solids (SS), biological (BOD) and the chemical demand (COD). The environmental value of pollutions for pollutants like N, P, SS, BOD and COD is provided by a study by UNEP (2010). The following table illustrates the calculation of the benefits derived by the introduction of fortifier business with reference to reduced surface water pollution. The environmental values express the damage the pollutant causes to the environment expressed in the monetary terms.
Table 61: Environmental costs of the undesirable outputs
Pollutants Environmental value of pollution (USD/m3)3
Environmental value of pollution (USD/year)
N 0.6060 70,538.40
P 0.3087 35,932.68
SS 0.00252 293.33
BOD 0.0164 1,908.96
COD 0.0832 9,684.48
3The values obtained from the report were actualized to the present value since they were expressed in terms of 2010 euros.

96
Total 1.107 1,18,357
In the baseline condition, a part of the FS is being treated in the WWTP only partially and the rest is being discharged. In the alternative scenario, the FS in entirety is being utilized by the fortifier plant and hence the pollution of water (both surface and to certain extent groundwater) can be averted. The estimated benefits from each plant is shown in the above table (USD 118,357 per annum).
Reclamation of soil properties
The reclamation of soil properties is estimated by calculating the increase in agricultural productivity. In the alternate scenario, co-compost and fertilizer is being produced and utilized. Thus the net benefits accrue only to the alternate situation. The amount of co-compost/fortifier applied per hectare of land is assumed to 5 tons. Use of compost increases income by USD 10 per ha. Therefore, area that can be covered by compost application is 1800 ha. The net benefits estimated for applying co-compost was thus calculated to be USD 18,000 per annum.
Economic Impact
This section presents the financial analysis of the introducing the business model in Hanoi. In the financial assessment, a representative plant was assumed to produce 1000 tons of co-compost and fortifier (powdered and pelletized). The socioeconomic model however considers that the entire FS collected would be utilized for producing compost along with organic fraction of the municipal solid waste. It was estimated that given the capacity of the representative plant modelled for the financial assessment, 9 plants of similar capacity would be required in Hanoi which would consume the entire collected FS of the city and part of the organic fraction of the MSW. The socioeconomic model assumes constant returns to scale to escalate the financial figures of a representative plant for that of 9 plants. The rationale behind such constant returns to scale is suitable particularly when the representative plant is earning profit such that it ensures a condition whereby at least as profitability as the representative plant is maintained. Assumption of constant returns to scale implies that inputs and outputs are scale up or down proportionately. Usually with increase in plant size, there are possibilities of increasing returns to scale. However, there also exists an optimal plant size for businesses after which decreasing returns set in. Therefore, if there is increasing returns to scale, and the representative plant is earning profit, when the plant size increases, the profitability increases given similar conditions of market conditions. Thus, constant returns ensures at least as profitability as the representative plant.
The following table provides the income statement for the 9 plants taken together. The production in the 9 plants would yield 9,000 tons of co-compost and fortifier which includes – (i) 5,400 tons of co-compost, (ii) 1,800 tons of fortifier (powdered form), and (iii) 1,800 tons of pelletized fortifier. In the socioeconomic model the market conditions used in the financial assessment have been retained. It is assumed that in the first year of production the firm would be able to create a demand for only about 50% of the market which would pick up in the later years but never reach 100%. Following the financial assessment of the representative firm it can be seen that excepting the first four years, the business model earns a net profit. The table also illustrates that the financial assessment of the business model yields a negative NPV (USD 2,753,941) and an IRR of -8 %. The Benefit-cost ratio of the business model is less than 1 (0.144) implying that per dollar invested fetches 0.144 cents. The inference from observing the results for these parameters leads to the judgement that the business model operating at the city level at a higher scale is financially infeasible.

97
Table 62: Financial Analysis of the Fortifier business
Year 0 Year 1 Year 2 Year 3 Year 4 Year 5 Year 6 Year 7 Year 8 Year 9 Year 10 Year 11 Year 12 Year 13 Year 14 Year 15
Total Investment 2,940,750
Revenue
Total Revenue 360450 440573 530146 721887 772419 826489 884343 946247 1012484 1083358 1159193 1240337 1327160 1420061 1519466
Expense
Total Expense
501774 538879 578773 626255 669329 715418 764733 817501 873962 934375 999018 1068185 1142194 1221384 1306117
Depreciation
129717 129717 129717 129717 129717 129717 129717 129717 129717 129717 129717 129717 129717 129717 129717
Interest payments
1,98,501 1,82,301 1,41,801 81,051 1,98,501
-
-
-
-
-
-
-
-
-
-
Profit before tax
(469,541)
(410,324)
(320,145)
(115,135)
(26,626)
(18,646)
(10,107)
(971)
8,805
19,266
30,459
42,435
55,249
68,961
83,632
Income tax
-
-
-
-
-
-
-
-
2,642
5,780
9,138
12,730
16,575
20,688
25,090
Net Profit
(469,541)
(410,324)
(320,145)
(115,135)
(26,626)
(18,646)
(10,107)
(971)
6,164
13,486
21,321
29,704
38,674
48,273
58,542
Cash Flow (2940750)
(339,824)
(280,607)
(190,428)
14,582
103,091
111,071
119,610
128,746
135,881
143,203
151,038
159,421
168,391
177,990
188,259
Discounted Cash Flow
(339,824)
(280,607)
(190,428)
14,582
103,091
111,071
119,610
128,746
135,881
143,203
151,038
159,421
168,391
177,990
188,259
NPV 2,753,941
IRR -8%
ROI (Financial) -16% -14% -11% -4% -1% -1% 0% 0% 0% 0% 1% 1% 1% 2% 2%
ROI (Financial Average) -3%

98
Social Impact assessment
Impact on Employment
The business model involves utilization of two different waste streams – municipal solid waste and the faecal sludge. The collection rate of MSW is constrained to only 55% of the entire city waste. The number of workers engaged in a composting plant is 8 and monthly wage rate is USD 206. Thus, additional income generated in the alternative scenario is USD 14,805 monthly i.e., 177,660 USD annually.
Health benefits
The most common disease burden with poor FS management is diarrhea. For the socioeconomic analysis, it was assumed that the disease burden which is incurred in the baseline condition due to partial and no treatment could be averted. To estimate the economic value, DALYs was used along with the economic value of each DALY. The DALY values were used since the use of the cost-of-illness approach is not recommended (WHO, 2009) for macroeconomic studies. Traditional cost-of-illness studies employ a static, partial and inconsistent approach to estimating the macroeconomic impact of disease and injury at the societal level. The population in the Hanoi city is 7,067,000. The DALY for the selected risk factor is 2.8 for Hanoi and economic value of DALY is USD 1330. Assuming only 5 percent of the population will be affected by diarrhea the net health benefit that can be averted by treatment of FS is estimated to be USD 1,315,875 annually for Hanoi.
Other Social benefits in alternative scenario
Saving of foreign exchange
Apart from employment, other social benefits of composting could be reduction in use of inorganic fertilizer and hence savings of foreign exchange due to reduction of import bill through reduced import of fertilizer. Import of inorganic fertilizer in Vietnam is around 431,000 tons annually. We have assumed that use of 10 tons of co-compost (derived from organic fraction of MSW and FS) would substitute 1 ton of inorganic fertilizer, while fortifier would substitute 5 tons of inorganic fertilizer. Due to differential prices, the average price of imported fertilizers is assumed for the analysis and that importing price of one ton of fertilizer is USD. 688. The reduction in import bill for fertilizer is estimated to be USD. 378,180.
The net social benefits derived from – (i) employment generation, (ii) aversion of health costs, and (iii) savings from foreign exchange are provided in the following table.
Table 63: Societal benefits of the fortifer business
Parameters considered for societal benefits Net Benefits (USD/annum)
Employment generation 177,660
Aversion of health costs 1,315,875
Savings from foreign exchange 378,180
Total 1,871,715

99
Socioeconomic Analysis
The socioeconomic analysis of Co-compost and fortifier business model is performed by putting monetary value on all quantifiable cost and benefits in order to calculate the NPV, benefit cost ratio (BCR) and ROI for the business model. The consolidated socio-economic results are presented in Table below. The analysis looked at the potential impact of the business model including the direct and indirect benefits and costs that affect the business entity with respect to other sectors. The annual social and environmental benefits and costs from the business were discounted at a rate of 12% to obtain the present value of social and environmental impacts.
The socioeconomic assessment of the compost and fortifier business model shows a gradual increase when only the direct benefits are accounted for results in negative NPV and BCR of less than 1 implying that the business model is not financially feasible. The business model performs better when the financial and environmental costs and benefits are taken into account. However, the net positive incremental benefits from the environmental impacts are not high enough to make the business model feasible as the NPV is still negative and the BCR is less than 1. The business model becomes economically feasible when all externalities are included in the analysis. The NPV when all externalities are considered is USD 21,770,187 and the BCR is 7.77. Thus, major contribution to the economic feasibility of the business is from the social benefits. The total value of the social benefits of the business is USD 21,685,196 with major benefits coming from the health expenditure averted and foreign exchange saved due to lower import of inorganic fertilizer. Thus, the fortifier business model is economically feasible but not financially feasible.
Table 64: Socio-economic analysis of the fortifier business
Socio-economic result (USD/year) Financial Financial &
Environmental Social, Environmental
& Financial
Financial result: NPV (2,753,941) (2,753,941) (2,753,941)
Environmental benefit:
Value of net GHG emission saving
2,838,932 2,838,932
Social benefit:
Reduced use of inorganic fertilizer
2,429,258
Value of jobs and additional income to workers
2,290,545
Savings in health expenditure
16,965,394
Total social benefit
21,685,196
NPV (2,753,941) 2,533,644 21,770,187
ROI -3% 12% 74%
BCR 0.14 1.11 7.77
Sensitivity analysis
The selected variables for the stochastic models are shown below in the following table. The variables have respective distribution functions depending on the values in the baseline or futuristic and are

100
based on literature survey. The variables which are considered as stochastic are similar to that of the compost models.
Table 65: Selected variables for the stochastic model
Variable Unit Distribution assumed Reference
Discount rate % Triangular (10, 12, 15%)
Assumed ranges between 10% to 15%
Amount of dewatered faecal sludge obtained from faecal sludge ton/m3
Triangular (0.017, 0.02, 0.028)
Application of compost ton/ha Uniform Distribution: (5, 10) Assumed
Leachate production m3/ton Triangular distribution: (80, 85, 100) Safari and Baronian (undated)
Cost of leachate treatment USD Triangular: (9, 20, 30) Johannessen 1999
Average increase in income due to application of compost
USD/ha Uniform: (5, 10) Conservative estimate based on
Landfill area saved per unit ha/ton Uniform: (0.01 – 0.03) Johanssen , World Bank
Price of CERs USD/ton CO2 eq.
Triangular: (1, 3.8, 5) Assumed considering the volatility of the market
The probability density function of the net benefits of the NPV is derived from the iterations of each of the stochastic variables in determining the NPV. The distribution shows that there is a certainty of 48% to achieve the mean NPV level, however, the ROI is less than 100% which makes the business less attractive for the city.
Figure 10: Probability density function of the NPV for the fortifer model

101
Conclusion
This study assessed the socio-economic impact of introducing a compost business which not only produces co-compost utilizing faecal sludge and municipal solid waste, but also earns revenue by producing high value branded fertilizer by fortification of the compost produced with inorganic minerals. The socio-economic analysis is conducted based on the valuation of net social and environmental benefits and also accommodating for the financial assessment of the business at a scale which assumed that the whole faecal sludge generated and accessible is utilized by the business. Given the capacity elaborated in the financial analysis, the socioeconomic model assumes a linear extension of 9 such fortifier plants established across the city to cater to the whole of FS generated and collected presently. The following conclusions can be drawn from the study:
- Composting plant can reduce the GHG gas emissions and leachate production and thus reduces the chances of air pollution, water pollution and soil pollution. All of these monetary values accruing as net benefits have been calculated and utilized for the final estimation of the net environmental benefit.
- Composting plant can produce sufficient revenue from collection of MSW and selling of compost.
- Use of compost may increase the soil productivity. - Composting of MSW can reduce the health risks sufficiently as we increase the amount of
composting. - Composting can reduce the import of inorganic fertilizer and thus save foreign exchange. - Composting plant can also raise the price of land in the adjacent area to landfill site or open
dumping space.

102
References
Aboah J, 2014. Financial feasibility analysis of the fortifer business model in cape coast metropolitan
assembly in Ghana; MSc. Thesis Business Economics Wageningen University; Accessed from
http://edepot.wur.nl/298273 on 15.01.2015.
Abu-Madi, M. 2004. Incentive systems for wastewater treatment and reuse in irrigated agriculture in the
MENA region: Evidence from Jordan and Tunisia. PhD Dissertation, Delft University of Technology, Delft,
the Netherlands
Agence Française de Développement (AFD) and Athi Water Services Board (AWSB), 2010. Evaluation report: Assessment of impacts of ablution blocks project in informal settlements of Nairobi.
Agence Française de Développement (AFD) and Athi Water Services Board (AWSB), 2010. Evaluation
report: Assessment of impacts of ablution blocks project in informal settlements of Nairobi.
Amiguna, B., Musango, J K., and Stafford, W. 2010. Biofuels and sustainability in Africa. Renewable and Sustainable Energy Reviews xxx (2010) xxx–xxx – Article in pressdoi:10.1016/j.rser.2010.10.015 Arthur R., Baidoo M.F., Antwi E., 2011. Biogas as a potential renewable energy source: A Ghanaian case study. Renewable Energy 36:1510-1516.
Arthur R., Baidoo M.F., Antwi E., 2011. Biogas as a potential renewable energy source: A Ghanaian case
study. Renewable Energy 36:1510-1516.
Bates, L. (2007). Biogas. Rugby: Practical Action.
Bingh LP. (2004) Opportunities for utilizing waste biomass for energy in Vietnam. Masters’ thesis. Norway: Norwegian University of Science and Technology.
Bruce, N., Rehfuess, E., Mehta, S., Hutton, G., and Smith, K.R., 2006. “Indoor air pollution”, in Jamison, D.T., Breman, J.G., Measham, A.R., Alleyne, G., Claeson, M., Evans, D.B., Jha, P., Mills, A., and Musgrove, P., (eds.), Disease Control Priorities in Developing Countries, (2nd ed.), World Bank and Oxford University Press, Oxford
Buchholz and Da Silva (2010) Potential of distributed wood-based biopower systems serving basic electricity needs in rural Vietnam
Buchholz T and Volk T. (2007) Designing short-rotation coppice based BIOenergy Systems for Rural Communities in east Africa BIOSYRCA project (Final report)
Buchholz T, and Da Silva I, 2010. Potential of wood-based bio-power systems serving basic electricity
needs in rural Vietnam; Energy for Sustainable Development, Vol 10, pp 56-61.
Buchholz T, Volk TD. (2012) Considerations of project scale and sustainability of modern bioenergy systems in Vietnam. J Sustain Forest; 31(1 - 2):154 - 73.
Burtraw D., Szambelan J.S., 2009. U.S. emissions trading markets for SO2 and NOx. Resource for the
future, Washington DC.

103
Buxton D. and Reed B., 2010. Disposal of latrine waste: Is biogas the answer? A review of literature. In EWB-UK National Research Conference, 19 Feb, 2010, UK.
Cairncross, S., Hunt, C., Boisson, S., Bostoen, K., Curtis, V., Fung, I C H., and Schmidt, W P. (2010): Water, sanitation and hygiene for the prevention of diarrhea. International Journal of Epidemiology; 39:193–205doi:10.1093/ije/dyq035
Chaney J., 2010. Combustion characteristics of biomass briquettes Accessed at
http://core.kmi.open.ac.uk/download/pdf/18159.pdf on Oct 21, 2014
Christensen S, 2012. Comparing the Sustainability of Biomass Fuel Supply Options for a Small Scale
Gasification Project in Rural Vietnam; MSc Thesis submitted to Department of Energy and the
Environment, Division of Energy Technology, CHALMERS UNIVERSITY OF TECHNOLOGY Göteborg,
Sweden.
Collingwood Public Utilities 2013. Collingwood wastewater treatment plant cogeneration plant
feasibility study. #080988-10 Report number 2.
Co-composting faecal sludge & organic solid waste Kumasi, Ghana: Case study of sustainable sanitation projects obtained from: http://www.sswm.info/sites/default/files/reference_attachments/OLUFUNKE%20and%20KONE%202009%20CoComposting%20of%20faecal%20sludge%20and%20organic%20solid%20waste%20Kumasi%20Ghana.pdf
Corcoran, E., C. Nellemann, E. Baker, R. Bos, D. Osborn, H. Savelli (eds). 2010. Sick Water? The central role of wastewater management in sustainable development. A Rapid Response Assessment. United Nations Environment Programme, UN-HABITAT, GRID-Arendal. www.grida.no
De Souza S., Madellin-Azuara J., Burley N., Lund J.R., and Howitt R.E., (2011) Guidelines for preparing
economic analysis for water recycling projects. University of California, Davis.
E. Gӧrgun, G. Insel “Cost evaluation of sludge treatment options and energy recovery from wastewater
treatment plant sludge treating leather tanning wastewater”
EEP (Energy and Environment Partnership), 2013. Analyzing briquette markets in Tanzania, Kenya and
Vietnam.
EPA, 2006. Biosolids technology fact sheet: Multi-Stage Anaerobic Digestion. Accessed on September 12,
2012. Retrieved from: http://water.epa.gov/scitech/wastetech/upload/2006_10_16_mtb_multi-
stage.pdf
ERG (2011), Eastern Research Group, Inc. (ERG) and Resource Dynamics Corporation (RDC) for the U.S.
Environment Protection Agency, Combined Heat and Power Partnership.
FAO, 1990. The briquetting of agricultural waste for fuel. Rome: Food and Agriculture Organization of
the United Nations; Environment and Energy Series.
FAO. 1997. Proceedings of the Second Expert Consultation on National Water Policy Reform in the Near
East, Cairo, Egypt.

104
Ferguson H., 2012. Briquette Businesses in Vietnam. The potential for briquette enterprises to address
the sustainability of the Vietnam biomass market.
Ferguson H., 2012. Briquette Businesses in Vietnam. The potential for briquette enterprises to address
the sustainability of the Vietnam biomass market.
Fewtrell L, Kaufmann RB, Kay D, Enanoria W, Haller L, Colford JM Jr. Water, sanitation, and hygiene
interventions to reduce diarrhea in less developed countries: a systematic review and meta-analysis.
Lancet Infect Dis 2005; 5: 42–52.
GIZ (2011): Solar lamps field test Vietnam final report
Grover P.D. and Mishra S.K., 1996. Biomass briquetting. Technology and practices. FAO regional wood
energy development programme in Asia, Bangkok Thailand.https://www.pik-
potsdam.de/members/reuster/Masterthesis_LenaReuster.pdf
Gude, V.G. 2015. Energy and water autarky of wastewater treatment and power generation systems.
Renewable and Sustainable Energy Reviews 45:52-68.
GVEP International, 2010. Kenya briquette industry study. Accessed at
http://www.gvepinternational.org/sites/default/files/kenya_briquettereport_2010.pdf on Oct 12, 2014.
Habermahl (2008) Economic evaluation of the component "Promotion of efficient institutional cook stoves" of the Programme for Biomass Energy Conservation (ProBEC) in Malawi in the years 2004 to 2007
Habermehl, H (2007): Economic evaluation of the improved household cooking stove dissemination
programme in Vietnam. Dissemination of the Rocket Lorena stove in the districts of Bushenyi and Rakai
and dissemination of the improved charcoal stove in Hanoi in the years 2005 and 2006.
https://www.pik-potsdam.de/members/reuster/Masterthesis_LenaReuster.pdf
Hazelton J A., Windhorst K and Amezaga J M. (2013) Forest based biomass for energy in Vietnam: Stakeholder dynamics in feedstock production; biomass and bioenergy. 59pp 1 0 0 - 1 1 5. https://www.pik-potsdam.de/members/reuster/Masterthesis_LenaReuster.pdf
Hazelton J A., Windhorst K and Amezaga J M., 2013. Forest based biomass for energy in Vietnam:
Stakeholder dynamics in feedstock production; biomass and bioenergy 59: 100-
115.http://www.economywatch.com/economic-statistics/Vietnam/Corporate_Tax_Rate/ accessed on
4/01/2015.
Hu J., Lei Z., Wang Z., Yan X., Shi X., Li Z., He X., Zhang Q., 2014. Economic, environmental and social
assessment of briquette fuel from agricultural residues in China–A study on flat die briquetting using
corn stalk. Energy 64:557-566.
Hutton G and Haller L (2004): Evaluation of the Costs and Benefits of Water and Sanitation
Improvements at the Global Level. Water, Sanitation and Health Protection of the Human Environment
World Health Organization Geneva

105
Hutton G, Haller L, Bartram J. (2007) Global cost–benefit analysis of water supply and sanitation interventions. Journal of Water and Health, 5(4):481–502.
IDS (Integrated Development Society) Nepal, 2008. Bio-briquette in Nepal: Lessons learned. Accessed at
http://rbmsystems.net/cms/wp-content/uploads/2011/06/IDS_Annual_Report_2007_08.pdf on Oct 21,
2014.
IEA, 2006. Energy for cooking in developing countries. World Energy Outlook 2006. IEA: Paris, France.
IFAD, 2010. The Regional Cassava Processing and Marketing Initiative (RCPMI). The use of cassava wastes to produce energy: outcomes of a feasibility study implemented in Ghana.
International Water and Sanitation Centre (IRC), 1999. Small scale independent providers of water and
sanitation to the urban poor. The case of Hanoi, Vietnam.
IPCC (2001). Climate change 2001, the scientific basis. Cambridge: Cambridge University Press.
IPCC/OECD methodology. Accessed at http://www.fao.org/docrep/x2740e/x2740e60.pdf accessed on
March 5, 2015.
IRENA, 2012. Renewable Power Generation Costs in 2012: An Overviewhttp://costing.irena.org/media/2769/Overview_Renewable-Power-Generation-Costs-in-2012.pdf (accessed 03/31/2015).
Izrail S. Turovskiy, D. Sc. and Jeffrey D. Westbrook, P.E. (2002), Recent Advancements in Wastewater Sludge Composting obtained from http://www.wwdmag.com/waste-treatment-disposal-services/recent-advancements-wastewater-sludge-composting
JC Agunwamba, Analysis of Socioeconomic and Environmental Impacts of Waste Stabilization Pond and Unrestricted Wastewater Irrigation: Interface with Maintenance: Environmental Management [Environ. Manage.]. Vol. 27, no. 3, pp. 463-476. Mar 2001.
Katusiimeh, Mesharch W, (2012), Public and private service provision of solid waste management in Hanoi, Vietnam, Habitat International, Vol. 36, Issue. 2, Page 247-252.
Kayombo, Sixtus, and Jorgensen E. S (2006), Lake Victoria: Experience and lesson learned brief obtained from http://www.worldlakes.org/uploads/27_Lake_Victoria_27February2006.pdf
Kfouri, C. Mantovanic, P. and Jeuland, M. 2009. Water Reuse in the MNA Region: Constraints,
Experiences, and Policy Recommendations. In Water in the Arab World. Management Perspectives and
Innovations. Middle East and North Africa Region. The World Bank.
Kimming et al. (2011) Biomass from agriculture in small scale combined heat and power plants – a comparative life cycle assessment
Kinobe, J.R., Gebresenbet, G., Vinnerås, B., Niwagaba, C. B., Komakech, A. (2013), Mapping out the
current waste collection system in Hanoi City. Manuscript submitted for publication.
KIST (Kigali Institute of Science and Technology), 2006. Impact assessment of the CITT disseminated
technologies in Rwanda. Kigali, Rwanda.
106
Lam, N L., Smith, K R., Gauthier, A and Bates, M N. 2012. Kerosene: A Review of Household Uses and Their Hazards in Low- And Middle-Income Countries. J Toxicol Environ Health B Crit Rev. 15(6): 396–432. doi:10.1080/10937404.2012.710134.
Lena Reuster (2010) Regulation of Markets for Privately Provided Public Goods: The Case of Voluntary
Carbon Offsets - Master Thesis. Technische Universitat Berlin School VII Economics and Management
M.Sc. Program Industrial and Network Economics & Potsdam Institute for Climate Impact Research (PIK)
Lim SS, Vos T, Flaxman AD, Danaei G, Shibuya K, Adair-Rohani H, et al. A comparative risk assessment of
burden of disease and injury attributable to 67 risk factors and risk factor clusters in 21 regions, 1990–
2010: a systematic analysis for the Global Burden of Disease Study 2010. The Lancet.
2012;380(9859):2224-60. doi: 10.1016/S0140-6736(12)61766-8.
Maninder, Kathuria R.S., Grover S., 2012. Using agricultural residue as a biomass briquetting: An
alternative source of energy. Journal of Electrical and Electronics Engineering, 5: 11-15.
Masiga, Moses, (2013), Proposal for: Nationally Appropriate Mitigation Action NAMA Seeking Support
for Implementation Integrated Bio-Wastewater Treatment for agro-process wastewater.
MEMD (2008) Vietnam energy balance for 2008. Hanoi Vietnam: Ministry of Energy and Mineral
Development
Metcalf and Eddy Inc, Wastewater Engineering, Treatment and Reuse, 4th Edition, McGraw-Hill,
2003.Degrémont, 2005 Degrémont SA, Mémento Technique de L’Eau, 10ème Edition, 2005
Modi V, MCDade S, Lallement D and Saghir J., 2006. Energy and the Millennium Development Goals,
New York; Energy Sector Management Assistance Programme, United Nations Development
Programme, UN Millennium Project and World Bank.
Murungi, C, and Dijk P V, Meine (2013), Emptying, Transportation and Disposal of faecal sludge in
informal settlements of Hanoi Vietnam: The economics of sanitation, Habitat International, Volume 42,
April 2014, Pages 69–75
NETWASS-U (Network for water and sanitation Vietnam), 2011. Ecological sanitation in Vietnam.
Inspirational success stories from the field. Accessed at
http://www.wsscc.org/sites/default/files/publications/ecosan_node_case_study_booklet_final.pdf on
Oct 21, 2014.
Nikiema, J., Olufunke, C., Impraim, R., & Adamtey, N. 2013. Processing of faecal sludge to fertilizer
pellets using a low cost technology in Ghana. Environment and Pollution, 2(4)
Nounia M.R., Mullickb M.R. and Kandpalb T.C. (2007) Biomass gasifier projects for decentralized power supply in India: A financial evaluation; Energy Policy; 35 pp1373–1385
Okello C, Pindozzi S, Faugno S, Boccia L. (2013) Development of bioenergy technologies in Vietnam: a
review of progress. Renew Sust Energy Rev 18:55 - 63.

107
Okello C., 2014. Assessing sustainability of bioenergy systems in developing countries: Methodological
development and application. University of Naples Federico II. Accessed at
http://www.fedoa.unina.it/10041/1/C_Okello_2014.pdf on March 2, 2015.
Pangare G & Pangare V (2008), Informal water Vendors and service providers in Vietnam: The ground reality; The Water Dialogues available and accessed (on 15/4/2015) from: Pathak H., Jain N., Bhatia A., 2009. Global warming mititation potential of biogas plants in India. Environ Monit Assess 157: 407-418. Raucher, R., K. Darr, J. Henderson, et al. 2006. An Economic Framework for Evaluating the Benefits and
Costs of Water Reuse. Alexandria, VA: WaterReuse Foundation.
Renwick M., Subedi P.S. and Hutton G., 2007. Cost Benefits Analysis of National and Regional Integrated
Biogas and Sanitation Program in Sub-Saharan-Africa. WINROCK International Draft Final report. Dutch
ministry of foreign affairs.
Reuster L, (2010) Regulation of Markets for Privately Provided Public Goods: The Case of Voluntary Carbon Offsets - Master Thesis. Technische Universitat Berlin School VII Economics and Management M.Sc. Program Industrial and Network Economics & Potsdam Institute for Climate Impact Research (PIK)
Roy M.M., Corscadden K.W., 2012. An experimental study of combustion and emissions of biomass
briquettes in a domestic wood stove. Applied Energy 99: 206-212.
Ruiz J.A., Juarez M.C., Morales M.P., Munoz P, Mendıvil M.A., 2013. Biomass logistics: Financial &
environmental costs. Case study: 2 MW electrical power plants. Biomass and Bioenergy 56: 260-267.
Schirnding Y.V., N. Bruce, K. Smith, Berkeley, G. Ballard-Tremeer, M. Ezzati, K. Lvovsky, (2002):
Addressing the Impact of Household Energy and Indoor Air Pollution on the Health of the Poor:
Implications for Policy Action and Intervention Measures (Working group 5: Improving Health Outcomes
of the Poor)
Schubeler P., Wehrle K., Christen J., 1996. Conceptual Framework for Municipal Solid Waste
Management in Low-Income Countries. UNDP/UNCHS (Habitat)/World Bank/SDC, Working paper 9.
Shafie, S M., Masjuki, H H., and Mahlia, T M I. (2014) Life cycle assessment of rice straw-based power generation in Malaysia
Singh K.J. and Sooch S.S., 2004. Comparative study of economics of different model of family size biogas
plants for state of Punjab, India. Energy conservation and management 45: 1329-1341.
Smith, K.R., Mehta, S., and Maeusezahl-Feuz, M., 2004. “Indoor air pollution from household use of solid
fuels”, in Ezzati, M., Lopez, A.D., Rodgers, A.D., and Murray, C.J.L., (eds.), Comparative Quantification of
Health Risks: Global and Regional Burden of Disease Due to Selected Major Risk Factors, Vol. 2, pp.
1435-1493, World Health Organization, Geneva.
Sparrevik M, Lindhjem H., Andria V., Magerholm AF, Cornelissen G., 2014. Environmental and
socioeconomic impacts of utilizing waste for biochar in rural areas in Indonesia−A systems perspective.
Environmental Science and Technology 48: 4664-4671.

108
Sparrevik M., Field J.L., Martinsen V., Breedveld G. D., Cornelissen G., 2012. Life cycle assessment to
evaluate the environmental impact of biochar implementation in conservation agriculture in Zambia.
Environ. Sci. Technol. 47: 1206−1215.
Stillwell, A.S., Hoppock, D.C. and Webber, M.E. 2010. Energy recovery from wastewater treatment
plants in the United States: A case Study of the Energy-Water Nexus. Sustainability 2010.
Sustainable Sanitation Alliance, 2010. Public toilet with biogas plant and water kiosk Naivasha, Kenya.
Accessedat:
http://www.sswm.info/sites/default/files/reference_attachments/RIECK%202010%20Public%20toilet%
20with%20biogas%20plant%20and%20water%20kiosk%20Naivashsa%20Kenya.pdf on Oct 21, 2014.
Sustainable Solutions for the Environment (EVI), 2013. Technologies for energy recovery from feacal
sludge: Technical and financial analysis- Anaerobic digestion. Bill and Melinda Gates Foundation.
Tennigkeit T, Kallweit K and Buchholz T. (2006) Decentralised rural electricity production from energy forests — investigating the feasibility of business models for a demonstration project. Report to the Sawlog Production Grant Scheme (SPGS), EU Forest Resource Management and Conservation Programme Vietnam. Hanoi, Vietnam.
Stefan Diener, Swaib Semiyaga, Charles B. Niwagaba, Ashley Murray Muspratt, Jean Birane Gning, Mbaye Mbéguéré, Joseph Effah Ennin, Christian Zurbrugg, Linda Strande, (2014), A value proposition: Resource recovery from faecal sludge—Can it bethe driver for improved sanitation?, Resources, Conservation and Recycling, Volume 88, July 2014, Pages 32–38
Todd, B., Patrick, L., Stephen, B., Tewodaj, M., Julian, N., (2012), The supply of inorganic fertilizers to smallholder farmers in Vietnam: Evidence for fertilizer policy development, IFPRI Discussion Paper-1228.
Tripathi A.K., Iyer PVR, Kandpal T.C., 1998. A techno-economic evaluation of biomass briquetting in
India. Biomass and Bioenergy 14: 479-488.
Winrock international India (2008) Feasibility study for developing proposal under clean development
mechanism (CDM) for claiming carbon credit for leach pit toilets and toilet linked bio gas plants. Final
report
World Bank, 2008. The welfare impact of rural electrification: a reassessment of the costs and benefits. An IEG impact evaluation 2008. The World Bank Washington, D.C. http://www.worldbank.org/ieg
World Bank, 2014. State and trends of carbon pricing. Washington DC. Doi: 10.1596/978-1-4648-0268-3
World Resources Institute. Greenhouse gas protocol. <http://www.ghgprotocol.org/calculation-tools/all-tools accessed (03/16/2015)
Young P., Khennas S., 2003. Feasibility and impact assessment of a proposed project to briquette
municipal solid waste for use as a Cooking Fuel in Rwanda. Accessed at
http://cleancookstoves.org/resources_files/feasibillity-and-impact.pdf on March 10, 2015.
Zanchi, G., Frieden, D., Pucker, J., Bird, D N., Buchholz, T., and Windhorst, K. 2012. Climate benefits from
alternative energy uses of biomass plantations in Vietnam - Article in press. Biomass and bioenergy xxx
(2012) 1-9
109
Zhang L and Wang C, 2014. Energy and GHG Analysis of Rural Household Biogas Systems in China
Zhu, Tingju, Ringler Claudia, Cai Ximing, (not-dated) Energy Price and Groundwater Extraction for Agriculture: Exploring the Energy-Water-Food Nexus at the Global and Basin Levels; accessed from http://www.iwmi.cgiar.org/EWMA/files/papers/Energyprice_GW.pdf; on 15/03/2015.
Websites accessed and other resources:
http://www.iwmi.cgiar.org/Publications/Books/PDF/groundwater_availability_and_use_in_sub-saharan_africa_a_review_of_15_countries.pdf
http://www.ajol.info/index.php/wsa/article/viewFile/91097/80532
http://www.iwmi.cgiar.org/EWMA/files/papers/Energyprice_GW.pdf
https://rwsnforum.files.wordpress.com/2011/11/91-xenarios-long-paper.pdf
http://metameta.nl/wp-content/uploads/2012/09/Managed_Groundwater_Development_in_Vietnam.pdf
http://www.wageindicator.org/documents/publicationslist/publications-2012/AIAS_WI_countryreports_f2f_report_Vietnam_final_20121211.pdf
http://www.fao.org/nr/water/cropinfo_maize.html
http://www.wastewaterinfo.asia/sites/default/files/tech-sheets/waste-stabilization-ponds.pdf
http://www.sswm.info/category/implementation-tools/wastewater-treatment/hardware/semi-centralised-wastewater-treatments/w
Vietnam Investment Authority, 2010. http://www.Vietnaminvest.go.ug/
Vietnam Renewable Energy Policy, 2007. http://eneken.ieej.or.jp/data/3963.pdf
http://www.sswm.info/sites/default/files/reference_attachments/RIECK%202010%20Public%20toilet%
20with%20biogas%20plant%20and%20water%20kiosk%20Naivashsa%20Kenya.pdf on Oct 21, 2014.
http://www.waterdialogues.org/documents/InformalWaterVendorsandServiceProvidersinVietnam.pdf
Sanitation updates accessed at https://sanitationupdates.wordpress.com/tag/pay-per-use-public-toilets/ on Oct 21, 2014.
World Bank, (2013), About the second economic update.http://www.tradingeconomics.com/Vietnam/employment-in-agriculture-percent-of-total-employment-wb-data.html accessed on 27.03.2015.
World Bank, (2012), Vietnam Tourism Sector Situational Assessment: Tourism Reawakening.
UNEP, Chapter 5: Economic aspects of eutrophication obtained from
http://www.unep.or.jp/ietc/publications/techpublications/techpub-11/5-6.asp
http://en.wikipedia.org/wiki/National_Water_and_Sewerage_Corporation accessed on 15.03.2015.

110
Wastewater characteristics and effluent quality parameters accessed from
http://www.fao.org/docrep/t0551e/t0551e03.htm.


