Full Terms & Conditions of access and use can be found at https://www.tandfonline.com/action/journalInformation?journalCode=uacn20 Journal of the American College of Nutrition ISSN: 0731-5724 (Print) 1541-1087 (Online) Journal homepage: https://www.tandfonline.com/loi/uacn20 Socioeconomic Disparities in the Community Food Environment of a Medium-Sized City of Brazil Luciene Fátima Fernandes Almeida, Taiane Gonçalves Novaes, Milene Cristine Pessoa, Ariene Silva do Carmo, Larissa Loures Mendes & Andréia Queiroz Ribeiro To cite this article: Luciene Fátima Fernandes Almeida, Taiane Gonçalves Novaes, Milene Cristine Pessoa, Ariene Silva do Carmo, Larissa Loures Mendes & Andréia Queiroz Ribeiro (2020): Socioeconomic Disparities in the Community Food Environment of a Medium-Sized City of Brazil, Journal of the American College of Nutrition, DOI: 10.1080/07315724.2020.1755911 To link to this article: https://doi.org/10.1080/07315724.2020.1755911 Published online: 27 May 2020. Submit your article to this journal Article views: 17 View related articles View Crossmark data
Transcript
Full Terms & Conditions of access and use can be found athttps://www.tandfonline.com/action/journalInformation?journalCode=uacn20
To cite this article: Luciene Fátima Fernandes Almeida, Taiane Gonçalves Novaes, MileneCristine Pessoa, Ariene Silva do Carmo, Larissa Loures Mendes & Andréia Queiroz Ribeiro (2020):Socioeconomic Disparities in the Community Food Environment of a Medium-Sized City of Brazil,Journal of the American College of Nutrition, DOI: 10.1080/07315724.2020.1755911
To link to this article: https://doi.org/10.1080/07315724.2020.1755911
aDepartment of Preventive and Social Medicine, Federal University of Minas Gerais, Belo Horizonte, Minas Gerais, Brazil; bFaculty ofTechnology and Sciences, Jequi�e, Bahia, Brazil; cDepartment of Nutrition, Nursing School, Federal University of Minas Gerais, Belo Horizonte,Minas Gerais, Brazil; dDepartment of Nutrition and Health, Federal University of Vicosa, Vicosa, Minas Gerais, Brazil
ABSTRACTObjective: The purpose of this ecological study was to characterize the community food environ-ment according to the socioeconomic condition of census tracts (CTs) in the urban area of amedium-sized city of southeastern Brazil in 2016.Method: Food establishments were identified on the streets covered by raters and informationabout type was collected through objective assessment. Geocoding was carried out from addressobserved by raters. Food establishments were categorized into establishments with predominantsale of natural or minimally processed foods, mixed establishments, and establishments with pre-dominant sale of ultra-processed foods. The distribution of the number of establishments, by cat-egory, was evaluated according to tertiles of per capita income of the CT. The kernel estimationwas used to analyze the density of establishments by category. The spatial pattern of the catego-ries of establishments was investigated using the univariate Ripley’s K-function.Results: A total of 656 establishments were evaluated. In all, 11.1% had predominant sale of nat-ural or minimally processed foods, 44.5% were mixed, and 44.4% had predominant sale of ultra-processed foods. The average of establishments with predominant sale of natural or minimallyprocessed foods, of ultra-processed foods, and all categories increased according to the income ofthe CT. There was a clustering of all categories of establishments in high-income CTs downtown.However, peripheral and low-income CTs were composed of a higher number of mixed establish-ments or those with predominant sale of ultra-processed foods than establishments with predom-inant sale of natural or minimally processed foods.Conclusions: On average, the number of all categories of establishments increased according tothe per capita income of the CT and were clustered in central and higher-income regions of thecity. These findings may have practical implications for the development of public policies toincrease the availability of healthy foods and to reduce the sale of unhealthy foods.
ARTICLE HISTORYReceived 24 January 2020Accepted 9 April 2020
Over the last four decades, the prevalence of obesity hasincreased in all regions of the world and is currently consid-ered a pandemic (1). In 2016, the worldwide prevalence ofoverweight and obesity between adults were 38% and 13%,respectively (2). Brazil presents a worse scenario, as it is esti-mated a prevalence of 54% of overweight and 18.9% ofobesity among adults from Brazilian capitals in 2017 (3).
There is evidence that increased consumption or acquisi-tion of ultra-processed foods is associated with a greaterchance or risk of obesity developing (4). In turn, studiesindicate that food consumption and obesity have been asso-ciated with the characteristics of the food environment(5–7). In Brazil, a larger variety of sugar-sweetened bever-ages in food stores around the adults’ residence was associ-ated with the higher consumption of this product (8).Furthermore, a higher intake of ready-to-consume foods,
such as ultra-processed ones, was associated with greateravailability of establishments with predominant sale of thesefoods around children’s residences (9). In addition, there issome evidence that the availability of supermarkets, whichare hypothesized to increase the consumption of fruits andvegetables, is inversely associated with obesity, while fastfood restaurants are directly associated with this outcome(7). These findings corroborate the role of the food environ-ment as a component of the obesogenic environment, whichis defined as “the sum of influences that the surroundings,opportunities, or conditions of life have on promoting obes-ity in individuals or populations” (10).
The food environment is defined as the “collective phys-ical, economic, policy and sociocultural surroundings,opportunities and conditions that influence people’s foodand beverage choices and nutritional status” (11). It can bedivided into community food environment, consumer food
CONTACT Andr�eia Queiroz Ribeiro [email protected] Department of Nutrition and Health, Federal University of Vicosa, Avenida Peter Henry Rolfs s/n,Campus Universit�ario, Vicosa, MG 36570-000, Brasil.� 2020 American College of Nutrition
JOURNAL OF THE AMERICAN COLLEGE OF NUTRITIONhttps://doi.org/10.1080/07315724.2020.1755911
environment, and organizational food environment. Thecommunity food environment covers the type, quantity,density, location, and access to food establishments. Theconsumer food environment includes information aboutprice, availability, discounts, and nutritional information offoods offered within these establishments. The organiza-tional food environment encompasses other food sourcessuch as cafeterias in schools, workplaces, churches, andhealth facilities that serve specific groups (12).
There is evidence of socioeconomic disparities in thecommunity and consumer food environment in high-incomecountries (13). In general, residents of low-income or ethnicminority neighborhoods have less access to healthy foodwhen compared to residents of less deprived neighborhoods(13). These disparities in the food environment, with indi-vidual socioeconomic restriction, may contribute to thegreater risk of obesity in populations of ethnic minoritiesand worse socioeconomic status (14).
However, studies about the food environment involvingthe analysis of socioeconomic disparities in low- and mid-dle-income countries are scarce (15). In Latin America, theevaluation of the availability of food stores according to thesocioeconomic condition of the neighborhood has been con-ducted mainly in large cities (15), not showing a well-estab-lished pattern between the spatial distribution of food storesaccording to the socioeconomic status of the neighborhood.
In Brazil, there are few studies about food environmentand socioeconomic disparities. In the largest city in thecountry, S~ao Paulo (SP), a better quality of consumer foodenvironment was found in census tracts (CTs) with highereducation levels (16). On the other hand, it was not possibleto verify a spatial distribution pattern between the low avail-ability of health food stores and the extreme poverty rate inthe metropolitan region of Manaus (AM) and in four smallcities around this region (17). Therefore, there is a lack ofevidence about the socioeconomic disparities in the foodenvironment in Brazilian cities. Thus, the objective of thisstudy was to analyze the community food environmentaccording to socioeconomic status of CTs of a medium-sizedcity of Brazil. We hypothesized that neighborhoods with bet-ter socioeconomic status are suggested to have greater avail-ability of establishments that provide healthy food whencompared to CT with poorer socioeconomic status.
Methods
Study setting
This was an ecological study of the community food envir-onment conducted in 2016 in the city of Vicosa, located in
the Zona da Mata region of the state of Minas Gerais(MG) (Brazil).
The urban CT was considered as the territorial unit ofanalysis. The study coverage area was all urban CT of thecity of Vicosa. In 2016, Vicosa had an estimated populationof 77.863 inhabitants (18) and Municipal HumanDevelopment Index of 0.775 (19). According to the lastBrazilian Census, Vicosa had 99 CTs in the urban area, 11in the rural area (20), a territory of 299 km2, and a popula-tion density of approximately 241 inhabitants/km2 (19).
Food environment assessment
A pilot study was conducted in the central region of Vicosa(MG) to evaluate the dynamics of data collection and thefeasibility of applying the instruments. Data collection wasperformed in all food stores in the urban area between 8 AM
and 6 PM.The team of raters (11 undergraduate and graduate stu-
dents) was properly trained prior to data collection, and allthem carried street maps with urban CT and guidance man-uals for data collection.
The raters walked, in pairs, on all the streets of each CT.During this path, all food establishments with daytime oper-ation were identified and information of complete addressand type of establishment was collected through observation.When the raters found a closed establishment at the time oftheir passage, information about the opening hours wasraised with local residents. In case of a store with daytimeoperation, raters came back to this location a few days laterto check the operation and to obtain accurate informationabout the establishment. Formal and informal establishmentswere assessed. Also, information about street vendors with asame fixed place on street were assessed. Due to staff safetyreasons, the survey of food establishments was not con-ducted in one of the CTs (0.28% of the total urban area),and 98 CTs were effectively studied.
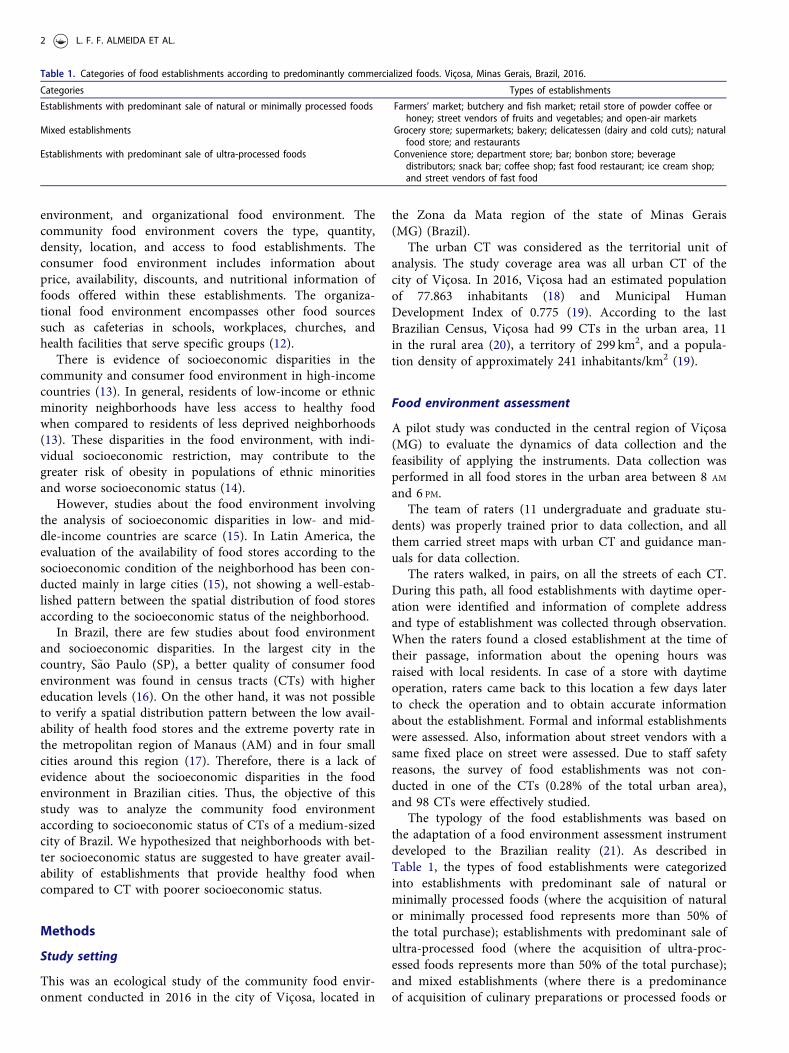
The typology of the food establishments was based onthe adaptation of a food environment assessment instrumentdeveloped to the Brazilian reality (21). As described inTable 1, the types of food establishments were categorizedinto establishments with predominant sale of natural orminimally processed foods (where the acquisition of naturalor minimally processed food represents more than 50% ofthe total purchase); establishments with predominant sale ofultra-processed food (where the acquisition of ultra-proc-essed foods represents more than 50% of the total purchase);and mixed establishments (where there is a predominanceof acquisition of culinary preparations or processed foods or
Table 1. Categories of food establishments according to predominantly commercialized foods. Vicosa, Minas Gerais, Brazil, 2016.
Categories Types of establishments
Establishments with predominant sale of natural or minimally processed foods Farmers’ market; butchery and fish market; retail store of powder coffee orhoney; street vendors of fruits and vegetables; and open-air markets
Mixed establishments Grocery store; supermarkets; bakery; delicatessen (dairy and cold cuts); naturalfood store; and restaurants
Establishments with predominant sale of ultra-processed foods Convenience store; department store; bar; bonbon store; beveragedistributors; snack bar; coffee shop; fast food restaurant; ice cream shop;and street vendors of fast food
2 L. F. F. ALMEIDA ET AL.
where there is predominance of acquisition of neither nat-ural/minimally processed foods nor ultra-processed foods).This grouping followed the methodology developed for themapping of food deserts in Brazil (22), with adaptations tosuit the reality of the studied city. According to this meth-odology, the categories of the establishments were createdbased on data from the Household Budget Survey (2008/2009), in which respondents provide information about thetype of establishment used to purchase food (22).
All objective assessment questionnaires of food establish-ments were checked by field supervisors (graduate students).Independent double data entry was performed, followed byconsistency analysis.
Georeferencing was performed through the geocodingprocess, where the geographic coordinates of food establish-ments were obtained from addresses using the Google Mapsonline search service (https://www.google.com/maps?hl=en).These coordinates were collected in WGS 84 GeographicCoordinate System and later transformed to the ProjectedCoordinate System, Universal Transverse Mercator System,23S spindle, SIRGAS 2000, using ArcGIS 10.7 software.
Social environment
Information from the 2010 Brazilian census was used tocharacterize the social environment of Vicosa. Data wereobtained about the geographical limits of urban CTs inVicosa (23), income (total monthly nominal income of per-manent households), and population (residents in perman-ent households or population living in permanent privatehouseholds) by CT (20).
Analyses
The average per capita income of each CT was obtained bydividing the total nominal monthly income of permanentprivate households by the resident population of permanentprivate households and then categorized into tertiles.
Measures of central tendency and dispersion were pre-sented for all variables. Mean and standard deviation valuesof the number of establishments were also presented accord-ing to tertile of average per capita income of the CT. Sincewe did not work with sample data, it was not necessary andappropriate to perform hypothesis tests to verify the exist-ence of differences in the number of establishments accord-ing to the tertile of average per capita income of theCT (24).
For the spatial analyses, choropleth maps were elaboratedto visualize the spatial distribution of the absolute numberof establishments with predominantly natural or minimallyprocessed foods, mixed establishments, and establishmentswith predominant sale of ultra-processed foods according totertiles of average per capita income of the CT.
The kernel density estimation was used for the pointdensity analysis of establishments by category. This interpol-ation technique estimates the intensity of points in a terri-torial unit of analysis, identifying regions of greateraggregation (25). The length of the influence radius was 500
meters, and this distance is walkable, as well as providingaccess to services and infrastructure (26). Five categorieswere established (low; medium to low; medium; medium tohigh; and high) to express the results, and the intervals ofeach category were defined by the natural break method.The map resolution was set to a pixel size of 5 meters.
The randomness of the point patterns of food establish-ments was assessed using univariate Ripley’s K-function(25). Monte Carlo simulations, with a significance level of99%, were conducted to assess the statistical significance ofthe analyses. The radius value was 150 meters, with a max-imum distance or area of influence of 1500 meters, which isthe average radius of the neighborhoods of the city ofVicosa, calculated based on the area of urban census tractsand the number of urban neighborhoods surveyed by theresearch team.
ArcGIS 10.7 software was used for spatial analyses andStata 14.0 for other statistical analyses.
Ethical aspects
The research was approved by the Research EthicsCommittee of the Federal University of Vicosa (Number:61511216.4.0000.5153).
Results
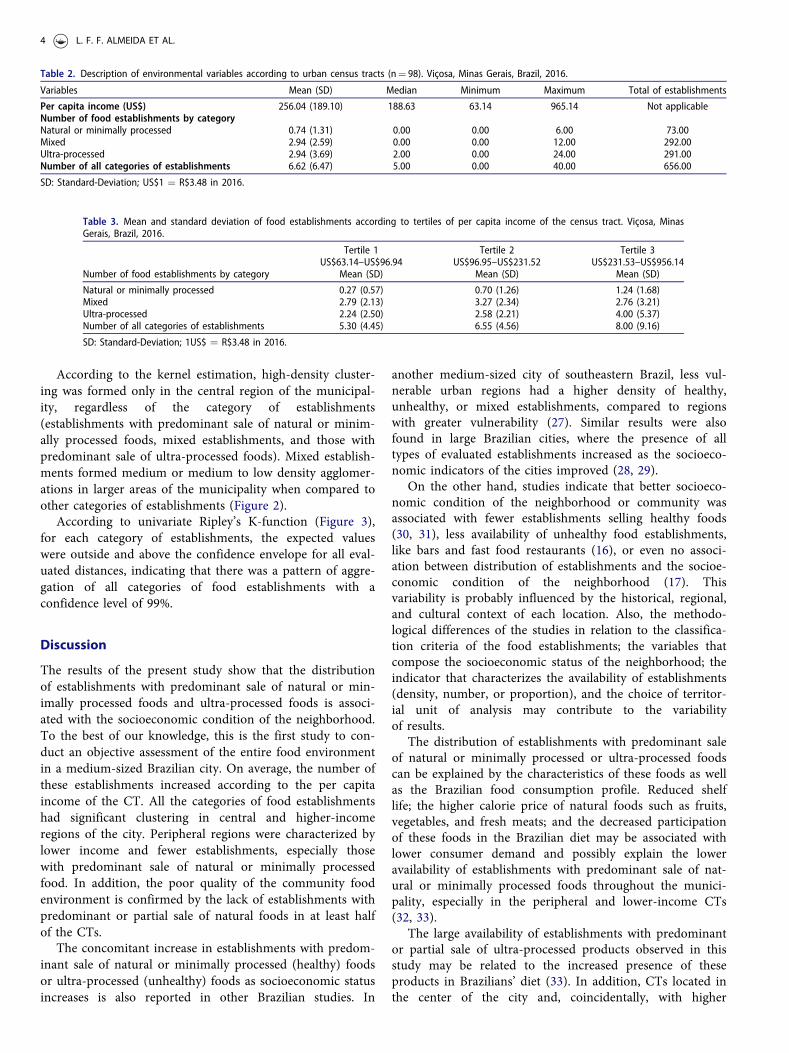
In 2016, 656 formal and informal food establishments wereevaluated. Of these, only 11.1% (n¼ 73) were establishmentswith predominant sale of natural or minimally processedfoods. Mixed establishments (44.5%; n¼ 292) and establish-ments with predominant sale of ultra-processed foods hadsimilar quantities (44.4%; n¼ 291). This distribution wassimilar among the CTs, where there were, on average, fewerestablishments with predominant sale of natural or minim-ally processed foods and similar quantities of mixed estab-lishments and establishments with predominant sale ofultra-processed foods. In addition, there were no establish-ments with predominant sale of natural or minimally proc-essed foods or mixed establishments in at least half of theCTs (Table 2).
The mean of the number of establishments was associatedwith the average per capita income of the CT. The averageof establishments with predominant sale of natural or min-imally processed foods or ultra-processed foods and allgroups increased according to the average per capita incomeof the CT. In contrast, on average, there were more mixedestablishments in the CTs within the first and second tertilesof per capita income (Table 3).
Regardless of the category, there was a higher number ofestablishments downtown, which was also characterized bythe highest income tertile. Establishments with predominantsale of natural or minimally processed foods were absent orin small number in peripheral CTs within the lower per cap-ita income tertile. However, mixed establishments and estab-lishments with predominant sale of ultra-processed foodswere present in a greater number of CTs (Figure 1).
According to the kernel estimation, high-density cluster-ing was formed only in the central region of the municipal-ity, regardless of the category of establishments(establishments with predominant sale of natural or minim-ally processed foods, mixed establishments, and those withpredominant sale of ultra-processed foods). Mixed establish-ments formed medium or medium to low density agglomer-ations in larger areas of the municipality when compared toother categories of establishments (Figure 2).
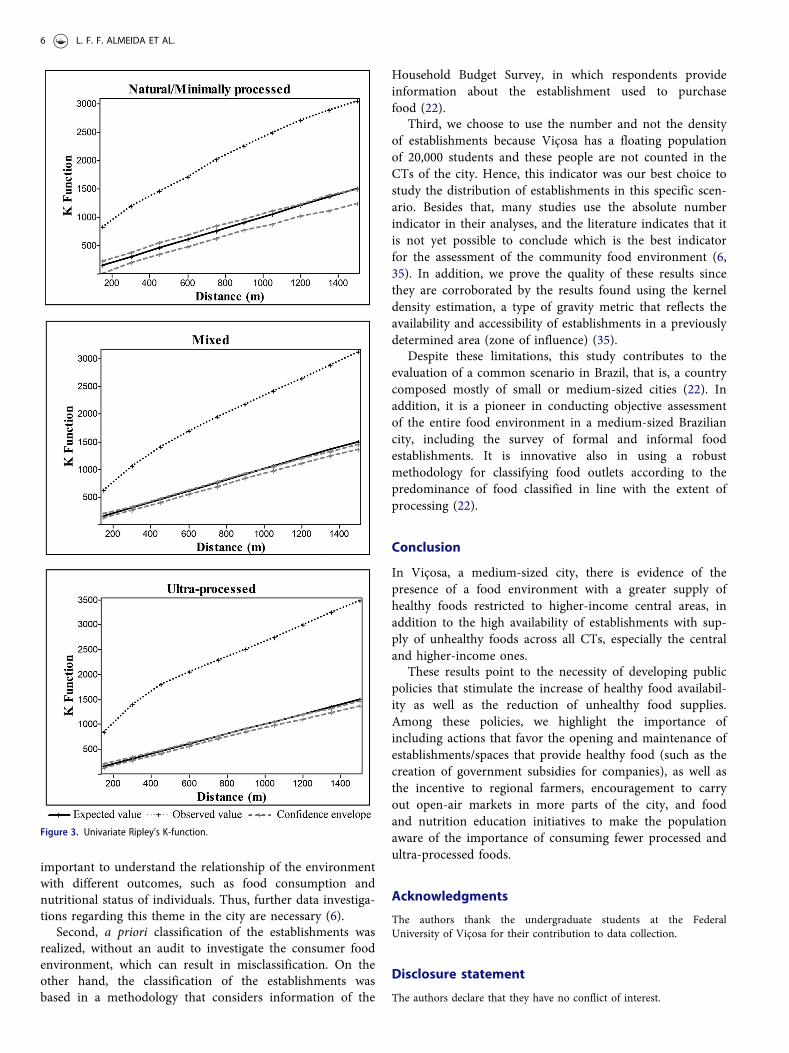
According to univariate Ripley’s K-function (Figure 3),for each category of establishments, the expected valueswere outside and above the confidence envelope for all eval-uated distances, indicating that there was a pattern of aggre-gation of all categories of food establishments with aconfidence level of 99%.
Discussion
The results of the present study show that the distributionof establishments with predominant sale of natural or min-imally processed foods and ultra-processed foods is associ-ated with the socioeconomic condition of the neighborhood.To the best of our knowledge, this is the first study to con-duct an objective assessment of the entire food environmentin a medium-sized Brazilian city. On average, the number ofthese establishments increased according to the per capitaincome of the CT. All the categories of food establishmentshad significant clustering in central and higher-incomeregions of the city. Peripheral regions were characterized bylower income and fewer establishments, especially thosewith predominant sale of natural or minimally processedfood. In addition, the poor quality of the community foodenvironment is confirmed by the lack of establishments withpredominant or partial sale of natural foods in at least halfof the CTs.
The concomitant increase in establishments with predom-inant sale of natural or minimally processed (healthy) foodsor ultra-processed (unhealthy) foods as socioeconomic statusincreases is also reported in other Brazilian studies. In
another medium-sized city of southeastern Brazil, less vul-nerable urban regions had a higher density of healthy,unhealthy, or mixed establishments, compared to regionswith greater vulnerability (27). Similar results were alsofound in large Brazilian cities, where the presence of alltypes of evaluated establishments increased as the socioeco-nomic indicators of the cities improved (28, 29).
On the other hand, studies indicate that better socioeco-nomic condition of the neighborhood or community wasassociated with fewer establishments selling healthy foods(30, 31), less availability of unhealthy food establishments,like bars and fast food restaurants (16), or even no associ-ation between distribution of establishments and the socioe-conomic condition of the neighborhood (17). Thisvariability is probably influenced by the historical, regional,and cultural context of each location. Also, the methodo-logical differences of the studies in relation to the classifica-tion criteria of the food establishments; the variables thatcompose the socioeconomic status of the neighborhood; theindicator that characterizes the availability of establishments(density, number, or proportion), and the choice of territor-ial unit of analysis may contribute to the variabilityof results.
The distribution of establishments with predominant saleof natural or minimally processed or ultra-processed foodscan be explained by the characteristics of these foods as wellas the Brazilian food consumption profile. Reduced shelflife; the higher calorie price of natural foods such as fruits,vegetables, and fresh meats; and the decreased participationof these foods in the Brazilian diet may be associated withlower consumer demand and possibly explain the loweravailability of establishments with predominant sale of nat-ural or minimally processed foods throughout the munici-pality, especially in the peripheral and lower-income CTs(32, 33).
The large availability of establishments with predominantor partial sale of ultra-processed products observed in thisstudy may be related to the increased presence of theseproducts in Brazilians’ diet (33). In addition, CTs located inthe center of the city and, coincidentally, with higher
Table 3. Mean and standard deviation of food establishments according to tertiles of per capita income of the census tract. Vicosa, MinasGerais, Brazil, 2016.
Natural or minimally processed 0.27 (0.57) 0.70 (1.26) 1.24 (1.68)Mixed 2.79 (2.13) 3.27 (2.34) 2.76 (3.21)Ultra-processed 2.24 (2.50) 2.58 (2.21) 4.00 (5.37)Number of all categories of establishments 5.30 (4.45) 6.55 (4.56) 8.00 (9.16)
SD: Standard-Deviation; 1US$ ¼ R$3.48 in 2016.
Table 2. Description of environmental variables according to urban census tracts (n¼ 98). Vicosa, Minas Gerais, Brazil, 2016.
Variables Mean (SD) Median Minimum Maximum Total of establishments
Per capita income (US$) 256.04 (189.10) 188.63 63.14 965.14 Not applicableNumber of food establishments by categoryNatural or minimally processed 0.74 (1.31) 0.00 0.00 6.00 73.00Mixed 2.94 (2.59) 0.00 0.00 12.00 292.00Ultra-processed 2.94 (3.69) 2.00 0.00 24.00 291.00Number of all categories of establishments 6.62 (6.47) 5.00 0.00 40.00 656.00
SD: Standard-Deviation; US$1 ¼ R$3.48 in 2016.
4 L. F. F. ALMEIDA ET AL.
income, represent the commercial center, with the largestflow of people moving to study and work, who are potentialconsumers of ready-to-consume foods and food with a lon-ger shelf life, possibly explaining the greater number ofestablishments with predominant sale of ultra-processedfoods in this region.
The low availability of establishments with predominantsale of natural or minimally processed foods, associated withthe greater availability of establishments with predominantsale of ultra-processed foods throughout the city, shows thecharacterization of this place as an obesogenic environment.This scenario contributes to the increased availability ofcheap, palatable, and high-calorie-density foods, which areconsidered to be one of the factors associated with obes-ity (34).
The largest number of mixed establishments in the ter-tiles 1 and 2 of the CTs may have been due to food salestrategies by Vicosa business owners. In low- and middle-income CTs (tertiles 1 and 2), there is a predominance ofsmall establishments designed to quickly serve their nearestneighborhood and, thus, there is a considerable diversity offood within them. On the other hand, there are large super-markets and farmers’ markets, restaurants, and especiallysmall and large fast food establishments to serve the publicwho eat out in higher-income central CTs.
This study presents some limitations. First, the collectionof data related to the community food environment wasimportant to verify the distribution of categories of foodestablishments in the city. However, variables related to theconsumer food environment, such as variety, availability,price, and quality of food sold inside establishments are also
Figure 1. Distribution of (a) establishments with predominant sale of natural orminimally processed foods, (b) mixed establishments, and (c) establishmentswith predominant sale of ultra-processed foods according to tertiles of per cap-ita income of the urban census tracts. Vicosa, Minas Gerais, Brazil, 2016.
Figure 2. Kernel density estimation of (a) establishments with predominantsale of natural or minimally processed foods, (b) mixed establishments, and (c)establishments with predominant sale of ultra-processed foods in urban censustracts. Vicosa, Minas Gerais, Brazil, 2016.
JOURNAL OF THE AMERICAN COLLEGE OF NUTRITION 5
important to understand the relationship of the environmentwith different outcomes, such as food consumption andnutritional status of individuals. Thus, further data investiga-tions regarding this theme in the city are necessary (6).
Second, a priori classification of the establishments wasrealized, without an audit to investigate the consumer foodenvironment, which can result in misclassification. On theother hand, the classification of the establishments wasbased in a methodology that considers information of the
Household Budget Survey, in which respondents provideinformation about the establishment used to purchasefood (22).
Third, we choose to use the number and not the densityof establishments because Vicosa has a floating populationof 20,000 students and these people are not counted in theCTs of the city. Hence, this indicator was our best choice tostudy the distribution of establishments in this specific scen-ario. Besides that, many studies use the absolute numberindicator in their analyses, and the literature indicates that itis not yet possible to conclude which is the best indicatorfor the assessment of the community food environment (6,35). In addition, we prove the quality of these results sincethey are corroborated by the results found using the kerneldensity estimation, a type of gravity metric that reflects theavailability and accessibility of establishments in a previouslydetermined area (zone of influence) (35).
Despite these limitations, this study contributes to theevaluation of a common scenario in Brazil, that is, a countrycomposed mostly of small or medium-sized cities (22). Inaddition, it is a pioneer in conducting objective assessmentof the entire food environment in a medium-sized Braziliancity, including the survey of formal and informal foodestablishments. It is innovative also in using a robustmethodology for classifying food outlets according to thepredominance of food classified in line with the extent ofprocessing (22).
Conclusion
In Vicosa, a medium-sized city, there is evidence of thepresence of a food environment with a greater supply ofhealthy foods restricted to higher-income central areas, inaddition to the high availability of establishments with sup-ply of unhealthy foods across all CTs, especially the centraland higher-income ones.
These results point to the necessity of developing publicpolicies that stimulate the increase of healthy food availabil-ity as well as the reduction of unhealthy food supplies.Among these policies, we highlight the importance ofincluding actions that favor the opening and maintenance ofestablishments/spaces that provide healthy food (such as thecreation of government subsidies for companies), as well asthe incentive to regional farmers, encouragement to carryout open-air markets in more parts of the city, and foodand nutrition education initiatives to make the populationaware of the importance of consuming fewer processed andultra-processed foods.
Acknowledgments
The authors thank the undergraduate students at the FederalUniversity of Vicosa for their contribution to data collection.
Disclosure statement
The authors declare that they have no conflict of interest.
Figure 3. Univariate Ripley’s K-function.
6 L. F. F. ALMEIDA ET AL.
Funding
This study was supported by the National Council for Scientific andTechnological Development under grant number 458523/2014-3.
1. Swinburn BA, Kraak VI, Allender S, Atkins VJ, Baker PI, BogardJR, Brinsden H, Calvillo A, De Schutter O, Devarajan R, et al.The global syndemic of obesity, undernutrition, and climatechange. The lancet commission report. Lancet. 2019;393(10173):791–846. doi:10.1016/S0140-6736(18)32822-8.
2. World Health Organization. Keys facts. Obesity and overweight.2018 [accessed 2019 July 16]. https://www.who.int/en/news-room/fact-sheets/detail/obesity-and-overweight.
3. Brazil Ministry of Health. Health Surveillance Secretariat.Department of Surveillance of Noncommunicable Diseases andHealth Promotion. Estimativas Sobre Frequencia e Distribuic~aoS�ocio-Demogr�afica de Fatores de Risco e Protec~ao Para DoencasCronicas Nas Capitais Dos 26 Estados Brasileiros e No DistritoFederal em 2017. Vol. 10, Vigitel-Brasil 2017. 2018 [accessed2019 July 16]. doi:10.1166/jnn.2010.2952.
4. Poti JM, Braga B, Qin B. Ultra-processed food intake andobesity: what really matters for health-processing or nutrientcontent? Curr Obes Rep. 2017;6(4):420–31. doi:10.1007/s13679-017-0285-4.
5. Giskes K, Van Lenthe F, Avendano-Pabon M, Brug J. A system-atic review of environmental factors and obesogenic dietaryintakes among adults: are we getting closer to understandingobesogenic environments? Obes Rev. 2011;12(5):e95–e106. doi:10.1111/j.1467-789X.2010.00769.x.
6. Caspi CE, Sorensen G, Subramanian SV, Kawachi I. The localfood environment and diet: a systematic review. Health Place.2012;18(5):1172–87. doi:10.1016/j.healthplace.2012.05.006.
7. Gamba RJ, Schuchter J, Rutt C, Seto E. Measuring the foodenvironment and its effects on obesity in the United States: asystematic review of methods and results. J Community Health.2015;40(3):464–75. doi:10.1007/s10900-014-9958-z.
8. Duran AC, Almeida SL, Latorre M, Jaime PC. The role of thelocal retail food environment in fruit, vegetable and sugar-sweet-ened beverage consumption in Brazil. Public Health Nutr. 2016;19(6):1093–102. doi:10.1017/S1368980015001524.
9. Leite FHM, Cremm EC, Abreu DSC, Oliveira MA, Budd N,Martins PA. Association of neighbourhood food availability withthe consumption of processed and ultra-processed food productsby children in a city of Brazil: a multilevel analysis. PublicHealth Nutr. 2018;21(1):189–200. doi:10.1017/S136898001600361X.
10. Swinburn B, Egger G, Raza F. Dissecting obesogenic environ-ments: the development and application of a framework foridentifying and prioritizing environmental interventions forobesity. Prev Med. 1999;29(6):563–70. doi:10.1006/pmed.1999.0585.
11. Swinburn B, Sacks G, Vandevijvere S, Kumanyika S, Lobstein T,Neal T, Barquera S, Friel S, Hawkes C, Kelly B, et al.INFORMAS (International Network for Food and Obesity/non-communicable diseases Research, Monitoring and Action
Support): overview and key principles. Obes Rev. 2013;14(S1):1–12. doi:10.1111/obr.12087.
12. Glanz K, Salli JF, Saelens BE, Frank LD. Healthy nutrition envi-ronments: concepts and measures. Am J Health Promot. 2005;19(5):330–3. doi:10.4278/0890-1171-19.5.330.
13. Black C, Moon G, Baird J. Dietary inequalities: what is the evi-dence for the effect of the neighbourhood food environment?Health Place. 2014;27:229–42. doi:10.1016/j.healthplace.2013.09.015.
14. Ford PB, Dzewaltowski DA. Disparities in obesity prevalencedue to variation in the retail food environment: three testablehypotheses. Nutr Rev. 2008;66(4):216–28. doi:10.1111/j.1753-4887.2008.00026.x.
15. Turner C, Kalamatianou S, Drewnowski A, Kulkarni B, Kinra S,Kadiyala S. Food environment research in low- and middle-income countries: a systematic scoping review. Adv Nutr. 2020;11(2):387–97. doi:10.1093/advances/nmz031.
16. Duran AC, Diez-Roux AV, Latorre M, Jaime PC. Neighborhoodsocioeconomic characteristics and differences in the availabilityof healthy food stores and restaurants in Sao Paulo. Brazil.Health Place. 2013;23:39–47. doi:10.1016/j.healthplace.2013.05.001.
17. Davies G, Frausin G, Parry L. Are there food deserts in rainfor-est cities? Ann Am Assoc Geogr. 2017;107(4):794–811. doi:10.1080/24694452.2016.1271307.
18. Brazilian Institute of Geography and Statistics. Estimativas dapopulac~ao residente no Brasil e unidades de federac~ao com datade referencia em 1 de julho de 2016. 2016 [accessed 2019 Jul17]. https://www.ibge.gov.br/estatisticas/sociais/populacao/9103-estimativas-de-populacao.html?edicao=9112&t=resultado.
19. Brazilian Institute of Geography and Statistics. Cidades. 2017[accessed 2019 Jul 17]. https://cidades.ibge.gov.br/brasil/mg/vicosa/panorama.
20. Brazilian Institute of Geography and Statistics. Base deinformac~oes do Censo Demogr�afico 2010: Resultados doUniverso por setor censit�ario. 2011 [accessed 2019 Jul 17].https://censo2010.ibge.gov.br/resultados.html.
21. Duran AC, Lock K, Latorre M, Jaime PC. Evaluating the use ofin-store measures in retail food stores and restaurants in Brazil.Rev Saude Publ. 2015;49(80):1–10. doi:10.1590/S0034-8910.2015049005420.
22. Executive Secretariat of the Interministerial Chamber for Foodand Nutrition Security. Mapeamento dos Desertos Alimentaresno Brasil. 2018 [accessed 2019 Jul 17]. http://aplicacoes.mds.gov.br/sagirmps/noticias/arquivos/files/Estudo_tecnico_mapeamento_desertos_alimentares.pdf.
23. Brazilian Institute of Geography and Statistics. Geociencias. 2010[accessed 2019 Jul 17]. https://www.ibge.gov.br/geociencias/downloads-geociencias.html.
24. Austin SB, Melly SJ, Sanchez BN, Patel A, Buka S, GortmakerSL. Clustering of fast-food restaurants around schools: a novelapplication of spatial statistics to the study of food environments.Am J Public Health. 2005;95(9):1575–81. doi:10.2105/AJPH.2004.056341.
25. Camara G, Carvalho MS. National Institute for Space Research(INPE). An�alise espacial de eventos. 2002 [accessed 2019 Jul 17].http://mtc-m12.sid.inpe.br/col/sid.inpe.br/sergio/2004/10.07.14.53/doc/cap2-eventos.pdf.
26. Moura ACM, Freire GJM, Oliveira RH, Pereira MF, SoaresAME, Voll VL. Geoprocessamento no apoio a pol�ıticas do pro-grama Vila Viva em Belo Horizonte-MG: intervenc~oes em assen-tamentos urbanos prec�arios. Rev Bras Cartogr. 2009;61(2):177–88.
27. Assis MM, Leite MA, Carmo AS, Andrade ACS, Pessoa MC,Netto MP, Candido APC, Mendes LL. Food environment, socialdeprivation and obesity among students from Brazilian publicschools. Public Health Nutr. 2019;22(11):1920–7. doi:10.1017/S136898001800112X.
28. Pessoa MC, Mendes LL, Caiaffa WT, Malta DC, Vel�asquez-Mel�endez G. Availability of food stores and consumption of
fruit, legumes and vegetables in a Brazilian urban area. NutrHosp. 2015;31(3):1438–43. doi:10.3305/nh.2015.31.3.8245.
29. Jaime PC, Duran AC, Sarti FM, Lock K. Investigating environ-mental determinants of diet, physical activity, and overweightamong adults in Sao Paulo, Brazil. J Urban Health. 2011;88(3):567–81. doi:10.1007/s11524-010-9537-2.
30. Bridle-Fitzpatrick S. Food deserts or food swamps?: a mixed-methods study of local food environments in a Mexican city. SocSci Med. 2015;142:202–13. doi:10.1016/j.socscimed.2015.08.010.
31. Olendzki BC, Procter-Gray E, Wedick NM, Patil V, Zheng H,Kane K, Land T, Li W. Disparities in access to healthy andunhealthy foods in Central Massachusetts: implications for publichealth policy. J Am Coll Nutr. 2015;34(2):150–8. doi:10.1080/07315724.2014.917058.
32. Claro RM, Maia EG, Costa BVL, Diniz DP. Preco dos alimentosno Brasil: prefira preparac~oes culin�arias a alimentos
33. Martins APB, Levy RB, Claro RM, Moubarac JC, Monteiro CA.Increased contribution of ultra-processed food products in theBrazilian diet (1987–2009). Rev Sa�ude P�ublica. 2013;47(4):656–65. doi:10.1590/S0034-8910.2013047004968.
34. Swinburn BA, Sacks G, Hall KD, McPherson K, Finegood DT,Moodie ML, Gortmaker SL. The global obesity pandemic:Shaped by global drivers and local environments. Lancet. 2011;378(9793):804–14. doi:10.1016/S0140-6736(11)60813-1.
35. Wilkins EL, Morris MA, Radley D, Griffiths C. Using geographicinformation systems to measure retail food environments: dis-cussion of methodological considerations and a proposed report-ing checklist (Geo-FERN). Health Place. 2017;44:110–7. doi:10.1016/j.healthplace.2017.01.008.


![Group Ethics Portion Pediatric Asthma And Socioeconomic Disparities[1]](https://static.documents.pub/doc/80x56/55b3902bbb61eb793a8b45b1/group-ethics-portion-pediatric-asthma-and-socioeconomic-disparities1.jpg)


