Page 1
Article
Middle AlternativesRevisited: How theneither/nor ResponseActs as a Way of Saying‘‘I Don’t Know’’?
Patrick Sturgis1, Caroline Roberts2,and Patten Smith3
Abstract
A persistent problem in the design of bipolar attitude questions is whether ornot to include a middle response alternative. On the one hand, it is rea-sonable to assume that people might hold opinions which are ‘neutral’ withregard to issues of public controversy. On the other, question designerssuspect that offering a mid-point may attract respondents with no opinion, orthose who lean to one side of an issue but do not wish to incur the cognitivecosts required to determine a directional response. Existing research intothe effects of offering a middle response alternative has predominantly used asplit-ballot design, in which respondents are assigned to conditions whichoffer or omit a midpoint. While this body of work has been useful indemonstrating that offering or excluding a mid-point substantially influencesthe answers respondents provide, it does not offer any clear resolution tothe question of which format yields more accurate data. In this paper, we use
1 School of Social Sciences, University of Southampton, Southampton, United Kingdom2 FORS, University of Lausanne, Lausanne, Switzerland3 Ipsos-MORI Limited, London
Corresponding Author:
Patrick Sturgis, School of Social Sciences, University of Southampton, Southampton, SO17 1BJ,
United Kingdom.
Email: [email protected]
Sociological Methods & Research2014, Vol 43(1) 15-38
ª The Author(s) 2012Reprints and permission:
sagepub.com/journalsPermissions.navDOI: 10.1177/0049124112452527
smr.sagepub.com
at SAGE Publications on April 27, 2015smr.sagepub.comDownloaded from
Page 2
a different approach. We use follow-up probes administered to respondentswho initially select the mid-point to determine whether they selected thisalternative in order to indicate opinion neutrality, or to indicate that they donot have an opinion on the issue. We find the vast majority of responses turnout to be what we term ‘face-saving don’t knows’ and that reallocating theseresponses from the mid-point to the don’t know category significantly altersdescriptive and multivariate inferences. Counter to the survey-satisficingperspective, we find that those with this tendency is greatest amongst thosewho express more interest in the topic area.
Keywords
middle alternatives, satisficing, neither/nor, don’t know
Introduction
Attitudes have been defined as evaluations along a latent psychological
dimension of preference about a particular object (Eagly and Chaiken
1993). From this perspective, the attitude is best conceptualized as a bipolar
construct ranging from extremely negative through to extremely positive pre-
ferences, with a neutral midpoint along the continuum. This basic assump-
tion about the underlying structure of attitudes underpins the methods
typically used to measure and analyze them in survey research. Most survey
attitude measures typically attempt to assess both the direction of the evalua-
tion and its intensity, using response scales that capture these two dimensions
simultaneously (Alwin 1992). Probably, the most widely used of this type of
attitude measure is the bipolar response scale, in which respondents are asked
to rate the extent to which they agree or disagree with a statement intended to
capture positive or negative aspects of the attitude object (Likert 1932). If
implemented as their originator intended, Likert items should be adminis-
tered as multi-item batteries relating to the topic, object, or issue of interest.
However, resource constraints often mean that, in practice, only a small num-
ber of items can be used to assess an attitude domain and it is not at all
uncommon to find social surveys and opinion polls using just a single item
to gauge opinion on important areas of political controversy. This practice
has heightened the need to better understand the cognitive strategies that peo-
ple use to answer these types of survey questions to inform best practice in
their design.
16 Sociological Methods & Research 43(1)
at SAGE Publications on April 27, 2015smr.sagepub.comDownloaded from
Page 3
Central to the construction of bipolar response scales is the choice of
whether to use an even or an odd number of response alternatives. If an
odd number of alternatives is selected, it must be assumed that the mid-
point of the response scale represents views which are genuinely neutral;
that is to say, these must be substantive opinions that fall (approximately)
at the midpoint of the underlying preference dimension. On the other hand,
if an even number of response alternatives is chosen, the possibility of
measuring neutral opinions which do exist in the population is excluded
by design. This poses some difficult trade-offs for question designers and
it is to this choice that we seek to contribute some clarity and guidance in
this article. Of course, the question of how many response alternatives to
include on a rating scale is one that has troubled researchers for many
years and has received considerable attention in the literature on question-
naire design and measurement error (see Alwin 2007; Krosnick, Judd, and
Wittenbrink 2005; Krosnick and Presser, forthcoming). Yet a lack of con-
sensus persists, and practice in questionnaire design continues to vary
widely.
The first obvious problem that arises if a middle response alternative is
provided is that it is possible for respondents who are fatigued, or poorly
motivated to complete the survey to select the middle alternative when they
could, if pushed, give a directional response. Krosnick has termed this type
of responding—in which respondents who ‘‘lean’’ in a particular direction
on an issue but choose the midpoint to minimize cognitive costs—‘‘satisfi-
cing’’ (Krosnick 1991). The possibility of satisficing among midpoint
responders, however, must be pitted against the fact that neutrality is often
an entirely reasonable position to take on many issues, so excluding a mid-
dle alternative by providing an even number of answer categories, may
force genuinely neutral respondents to choose from among the directional
answer categories. We refer to this as ‘‘forced directional’’ responding and
it is the difficulty of minimizing satisficing without simultaneously promot-
ing ‘‘forced directional’’ responses that makes the question of whether or
not to include a middle response alternative so difficult to come to a satis-
factory conclusion about.
Yet, there exists a third potential source of error that must be considered
when deciding whether to offer a middle alternative, which has received
considerably less attention in the existing literature. This is the possibility
that respondents who do not hold an opinion on the issue at all will select
the middle alternative rather than explicitly admitting their ignorance by
selecting or volunteering ‘‘don’t know.’’ This type of socially desirable
responding, which we refer to as a ‘‘hidden don’t know’’ response, if
Sturgis et al. 17
at SAGE Publications on April 27, 2015smr.sagepub.comDownloaded from
Page 4
evident at nontrivial levels, is likely to be particularly problematic for valid
inference because it will lead to both overestimates of the degree of opinio-
nation in the population and violation of the ordinality assumption that
researchers typically invoke when analyzing bipolar response scales. A pri-
mary motivation of this article is to argue that, for many response scales
that employ a ‘‘neither/nor’’ alternative as the midpoint, it is the ‘‘hidden
don’t know’’ that is the primary threat to validity. Additionally, we seek
to show that, counter to the satisficing perspective, it is those who are most
interested in the topic area who are more likely to select the midpoint of an
item when their true opinion cannot be described as neutral. This is because
the decision to select the midpoint rather than admit ignorance is reflective
of a social desirability bias and, as such, is to be found most often among
individuals who believe they should have an opinion on matters of public
interest. The remainder of the article is structured as follows. First, we
review the existing literature on middle response alternatives, before
describing our hypotheses, research design, and data. We then present the
results of our statistical analyses before considering the implications of our
findings for our understanding of the cognitive basis of midpoint responses
and the optimal design of bipolar attitude items.
Why Do People Select Middle Alternatives?
Early studies by Rugg and Cantril (1944), Schuman and Presser (1981),
Kalton, Roberts, and Holt (1980), and Bishop (1987) used split-ballot
designs to evaluate the effects of offering versus omitting a middle response
option for questions in which respondents must decide between competing
policy proposals, and the midpoint provides an ‘‘in-between’’ alternative to
the two competing end point options. For example, Schuman and Presser
(1981; see also Presser and Schuman 1980) looked at middle alternatives
which asked people if they were ‘‘middle of the road’’ politically (rather
than left or right), if they thought marijuana laws in the future should be
kept ‘‘the same as now’’ (rather than made more strict or less strict), and
if the current level of U.S. foreign aid was ‘‘the right amount’’ (rather than
too much or too little). The principal finding of these early experiments is
broadly consistent and largely unsurprising. Offering a midpoint increases
the proportion of respondents reporting opinions in the middle category
(i.e., endorsing the ‘‘status quo’’ position), compared to when this alter-
native is not explicitly offered and interviewers are instructed to record
volunteered midpoint responses. In other words, when the midpoint is
18 Sociological Methods & Research 43(1)
at SAGE Publications on April 27, 2015smr.sagepub.comDownloaded from
Page 5
offered, respondents are more likely to report ‘‘neutral’’ attitudes than when
it is omitted.
Schuman and Presser found little evidence that omitting the midpoint
affected either the distribution of responses across the directional cate-
gories, or correlations between these outcomes and other variables in the
data set. This suggested that the increase in neutral responses is drawn with
approximately equal probability from across the remaining substantive
answer categories. Ayidiya and McClendon (1990) obtained similar find-
ings in a replication of Schuman and Presser’s experiments using a mail,
self-completion design. However, Kalton et al. (1980) and Bishop (1987)
found that offering respondents a middle alternative did affect the distribu-
tion of responses across the remaining categories, and altered correlations
between the variables of interest and a range of background characteristics,
though not in a substantial way, nor in a consistent direction. While clearly
demonstrating that the decision over whether or not to include a middle
response alternative significantly affects the distribution of the data
obtained, these split-ballot studies tell us rather little about the mechanisms
that cause midpoint responding and, as a consequence, which of the two
formats should be preferred by question designers. This is because the
differences in marginal frequencies across offered and omitted conditions
are equally well accounted for by (a) truly neutral respondents being forced
to select a substantive response in the omitted condition (forced directional
response), (b) respondents with a true substantive position selecting the
midpoint in the offered condition (satisficing response), or (c) some com-
bination of (a) and (b).
An additional limitation of these split-ballot studies for guiding best
practice today is that they employ ‘‘substantive’’ midpoints. That is to say,
the midpoint refers to an actual position on the issue in question, such as
‘‘keep things about the same,’’ rather than the ‘‘neither/nor’’ construction
that is so ubiquitous in contemporary survey research. And it is far from
obvious that the lessons learned from questions with substantive midpoints
should generalize in any straightforward way to the more common ‘‘neither/
nor’’ format. For, although there is a degree of ambiguity about what ‘‘keep
things about the same’’ might mean in exact policy terms, it is certainly not
a response that can be interpreted as semantically equivalent to having no
opinion on the issue. The ‘‘neither/nor’’ label that is now applied to the vast
majority of middle response alternatives in current survey practice is, on the
other hand, logically consistent with both opinion neutrality and having no
opinion on the issue in question. For instance, if I do not have an opinion on
the job performance of the Prime Minister, it is undoubtedly true to say that
Sturgis et al. 19
at SAGE Publications on April 27, 2015smr.sagepub.comDownloaded from
Page 6
I neither agree nor disagree with the statement ‘‘the Prime Minister is doing
a good job.’’ ‘‘I neither agree, nor disagree’’ with the statement would also,
of course, be an accurate response if my true opinion were that the Prime
Minister is doing neither a good job, nor a bad job but is performing some-
where in between these two descriptors. And herein lies a major potential
flaw in the design of the ‘‘neither/nor’’ midpoint. While analysts almost
universally treat responses to these types of question as having ordinal (and
sometimes interval) properties, it is likely that, for many items, the neither/
nor midpoint actually represents a mix of both neutral and no opinion
responses, in proportions that are unknown. The negative consequences for
valid inference, if this is the case, are obvious.
And, indeed, there is some evidence from existing research to support the
hypothesis that midpoint responding may be used as a socially acceptable
way of saying ‘‘I don’t know.’’ Split-ballot studies have found midpoint
responding to be associated with the tendency to select or volunteer a ‘‘don’t
know’’ response; when a midpoint was offered, the proportion of respondents
reporting ‘‘don’t know’’ decreased, and vice versa (Kalton et al. 1980;
Presser and Schuman 1980; Rugg and Cantrill 1944). This pattern suggests
that substantive midpoints are likely to attract people whose opinions are rel-
atively uncrystallized, or people ‘‘who having no opinion on the issue, find it
easier to choose a seemingly non-committal position than to say ‘‘don’t
know’’ (Schuman and Presser 1981:71). While the magnitude of this effect
has generally been found to be small (cf. a nonsignificant 2 percent differ-
ence, on average, between offered and omitted conditions in Schuman and
Presser’s study), it seems reasonable to assume that, for the reasons outlined
above, the difference will be substantially greater when the label provided for
the midpoint is logically consistent with having no opinion, as is the case
with the ‘‘neither/nor’’ formulation.
Other empirical approaches to establishing the optimal number of scale
points for attitude rating scales have focused on the estimation of reliabil-
ity and validity coefficients for response scales of different lengths (Alwin
2007; O’ Muircheartaigh et al. 2000; see Krosnick and Presser, forth-
coming for a review). Most prominently, Alwin (2002, 2007) has shown
that, compared to 2-point scales, 3-point scales have significantly poorer
reliability (see also Andrews 1984), a pattern which he attributes to the
uncertainty induced by the introduction of a potentially ambiguous mid-
point. However, the 5-point scales he analyzed yielded similar reliability
to 4-point scales, while 7-point scales had the lowest reliability of all.
Because this approach is based on the analysis of large item pools and
empirical estimation of reliability and validity, it is a powerful method
20 Sociological Methods & Research 43(1)
at SAGE Publications on April 27, 2015smr.sagepub.comDownloaded from
Page 7
of determining the most appropriate number of response alternatives when
considered in the aggregate. However, by the same token, because the
emphasis is on the analysis of covariances as the means of determining
the most appropriate response format, little is learned directly about the
psychological mechanisms which lead individual respondents to choose
the midpoint.
We have argued, then, that the split-ballot design is of limited value for
understanding the psychological mechanisms which lead to the observed
differences in marginal frequencies across experimental conditions. A
more direct approach to addressing this question has been developed and
applied in a recent study by Malhotra et al. (2009). They seek to identify
the optimal number of response alternatives for a range of attitude items
by examining changes in validity coefficients following the administration
of ‘‘branching’’ follow-up questions to an initial response provided on a
3-point scale. Branching questions involve two steps: respondents are first
asked to report the direction of their attitude (e.g., favor, oppose, neither
favor nor oppose) and in a follow-up question, they are then asked to report
the extremity of their response, or if they lean one way or the other for
those who initially select the middle alternative. Malhotra et al. found
that validity was highest when branching questions were used to obtain
7-point scales and when respondents selecting an end point at the first step
were subsequently branched into three response options. Branching the
midpoint into directional alternatives was found to yield no significant
gains in criterion validity. Additionally, when midpoint respondents, who
subsequently said they were leaning in a particular direction in follow-up
questions, were pooled with initial end point respondents who selected
the least extreme follow-up response, validity was compromised, leading
the authors to conclude that ‘‘respondents who placed themselves at the
midpoint belonged there’’ (Malhotra et al. 2009:318). This conclusion,
however, only considers the possibility that initial midpoint responders
are satisficing. It does not rule out the possibility that those who initially
select the neither/nor alternative are doing so as a way of saying ‘‘don’t
know.’’ Given the existing evidence to suggest that substantive mid-
points may attract don’t knows and the prima facie plausibility that this
tendency will be greater for ‘‘neither/nor’’ midpoints, our first hypothesis
becomes:
Hypothesis 1: The percentage of respondents who select a ‘‘neither/nor’’
alternative but indicate that this denotes a ‘‘don’t know’’ response in a
subsequent branching question will be greater than zero.
Sturgis et al. 21
at SAGE Publications on April 27, 2015smr.sagepub.comDownloaded from
Page 8
Because we have no a priori expectation from the existing literature about the
likely proportion of hidden don’t knows for each question, Hypothesis 1 is
specified as a test of the simple null hypothesis that the true value is zero
in the population.
Our theoretical model specifies that respondents who have no opinion on
an issue will often choose the ‘‘neither/nor’’ alternative rather than select or
volunteer a ‘‘don’t know’’ is essentially a matter of self-presentation; one can
select what looks like a substantive position and avoid a public admission of
ignorance, while still selecting a response which is logically consistent with
one’s actual position on the issue. As we do not directly observe the extent to
which respondents answer questions in a socially desirable manner, we must
test this hypothesis indirectly, as a function of another variable which we
assume to be a proximal cause of socially desirable responding. Because
holding an opinion on issues of public debate is likely to be most socially
desirable among those who are (or claim to be) interested and engaged in the
topic area, our second hypothesis is:
Hypothesis 2: For those with no opinion on an issue, selecting the ‘‘nei-
ther/nor’’ alternative rather than volunteering a ‘‘don’t know’’ response at
the outset will be most prevalent among those who report more interest in
the substantive area to which the question relates.
The conditioning premise in Hypothesis 2, ‘‘for those with no opinion on
an issue,’’ is crucial because it is also clear that those who express interest
in a particular topic domain will, all things equal, be more likely to have
an opinion about an issue within it. However, conditional on having no
opinion on a particular issue, we should expect psychological processes of
self-presentation to militate against volunteering a ‘‘don’t know’’ response
and toward selecting the ‘‘neither/nor’’ midpoint among those who report
greater interest. This expectation is supported by a number of existing studies
which have found overreporting of civic behavior and voting (Cassel 2003;
McCutcheon et al. 2003; Presser 1984; Vavrek 2006) and the reporting of
attitudes on fictitious issues (Sturgis and Smith 2010) to be highest among
those who report being interested in politics.
Data and Research Design
The data for this study were collected as part of the Ipsos-MORI General
Public Omnibus (GPO) survey. The GPO is a multistage, face-to-face inter-
view survey, covering a broad range of topics with a geographical coverage
22 Sociological Methods & Research 43(1)
at SAGE Publications on April 27, 2015smr.sagepub.comDownloaded from
Page 9
of mainland Britain. At the first stage, a regionally stratified sample of 210
parliamentary constituencies is randomly selected. At stage 2, a government
ward is randomly selected within each sampled constituency. Finally, 10
respondents are selected purposively within each ward to match population
marginals on age, sex, housing tenure, and working status. Fieldwork was
conducted during April and May 2008 (n = 3,113). The design is not random
but achieves a broad geographic coverage and matches the general popula-
tion closely on a range of characteristics. Ipsos-MORI does not record refu-
sals data, so it is not possible to report the American Association of Public
Opinion Research (AAPOR) refusal rate (http://www.aapor.org/uploads/
standarddefs_4.pdf).
Respondents were randomly assigned to one of three conditions. In con-
dition 1, they were administered the following question:
1. Overall, how satisfied or dissatisfied are you with the performance of
the European Commission?
(a) very satisfied (b) fairly satisfied (c) neither satisfied nor dissatisfied
(d) fairly dissatisfied (e) very dissatisfied
In condition 2, respondents were asked the following question:
2. How important or unimportant do you think it is for Britain to be at
the forefront of developments in nanotechnology?
(a) very important (b) fairly important (c) neither important nor unimpor-
tant (d) not very important (e) not at all important
In condition 3, respondents were administered the following question:
3. On balance, the advantages of genetically modified foods outweigh
any dangers
(a) strongly agree (b) agree (c) neither agree nor disagree (d) disagree
(e) strongly disagree
Printed cards containing the response alternatives were shown to respon-
dents to aid them in formulating a response. ‘‘Don’t know’’ was not
included as an explicit response alternative on the show cards but, if respon-
dents offered this answer (or similar), interviewers coded it as a ‘‘don’t
know.’’ Interviewers were not instructed to probe for a substantive answer
if a ‘‘don’t know’’ response was offered voluntarily. We selected these 3
Sturgis et al. 23
at SAGE Publications on April 27, 2015smr.sagepub.comDownloaded from
Page 10
items because they relate to low-salience issues, so comparatively high pro-
portions of the public were likely to have no opinion on them. They also
cover the three main response dimensions upon which response scales are
generally based in contemporary survey practice: agreement versus dis-
agreement; importance versus unimportance; and satisfaction versus dissa-
tisfaction. Any respondent selecting the ‘‘neither/nor’’ response alternative
was administered a follow-up question asking them to clarify whether their
response was meant to indicate genuine neutrality, or that they do not have
an opinion on the issue:
1. Which of the following statements best describes why you (neither
agree nor disagree, are neither satisfied nor dissatisfied, think it is nei-
ther important nor unimportant) that the advantages of genetically
modified (GM) foods outweigh any dangers/with the performance
of the European Commission/for Britain to be at the forefront of
developments in nanotechnology?
(a) I don’t really have an opinion on this issue.
(b) I have an opinion which is right in the middle on this issue.
(c) Neither of the above.
Respondents selecting option 3 ‘‘neither of the above’’ were asked to
state, in their own words, what led them to select the neither/nor alternative
and their verbatim responses were recorded by the interviewer. These were
then coded by Ipsos-MORI’s team of trained coders to a frame of discrete
codes. In addition to a range of standard demographic questions, respon-
dents were asked to state their level of interest in politics (for those in con-
dition 1) or in science (for those in conditions 2 and 3). The order in which
the interest questions were administered relative to the three issue items was
also randomized across groups (with half the respondents in each receiving
the interest question first and half receiving it second). Analysis showed
there to be no order effect on any of the 3 items, so the order conditions
were combined.
Results
Table 1 shows the raw marginal frequencies for each of the three questions.
The important thing to note about Table 1 is the high proportion of both
‘‘don’t know’’ responses and middle alternatives, with only 41 percent
to 58 percent of respondents providing substantive responses across the
3 items.1 These, then, were clearly quite low-salience issues for the British
24 Sociological Methods & Research 43(1)
at SAGE Publications on April 27, 2015smr.sagepub.comDownloaded from
Page 11
Tab
le1.
Mar
ginal
Freq
uen
cies
for
the
3It
ems.
Euro
pea
nco
mm
issi
on
Ver
ySa
tisf
ied
Fair
lySa
tisf
ied
Nei
ther
/Nor
Fair
lyD
issa
tisf
ied
Ver
yD
issa
tisf
ied
Don’t
Know
Tota
l
11
(1.1
%)
130
(12.6
%)
312
(30.3
%)
142
(13.8
%)
140
(13.6
%)
294
(28.6
%)
1,0
29
Nan
ote
chnolo
gyV
ery import
ant
Fair
lyim
port
ant
Nei
ther
/nor
Not
very
import
ant
Not
atal
lim
port
ant
Don’t
know
1,0
31
30
(2.8
%)
184
(17.5
%)
289
(27.4
%)
234
(22.3
%)
123
(11.7
%)
192
(18.2
%)
Gen
em
odifi
cation
Stro
ngl
yag
ree
Agr
eeN
eith
er/N
or
Dis
agre
eSt
rongl
ydis
agre
eD
on’t
know
1,0
53
240
(23.3
%)
272
(26.4
%)
125
(12.1
%)
56
(5.4
%)
26
(2.5
%)
312
(30.3
%)
25
at SAGE Publications on April 27, 2015smr.sagepub.comDownloaded from
Page 12
public at this point in time, even though they were of considerable interest to
academic scholars and policy makers.
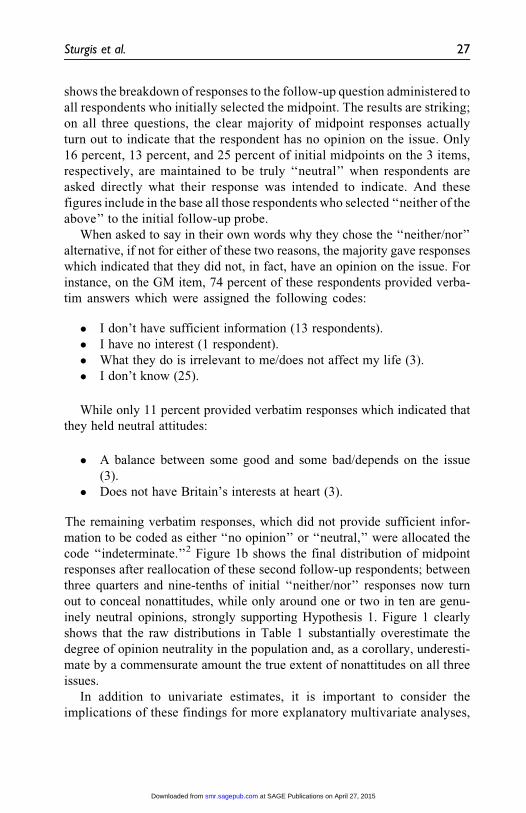
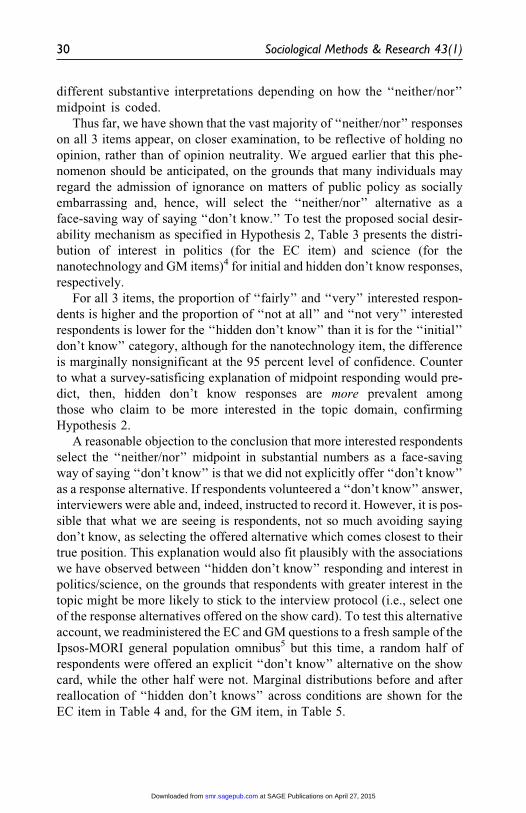
What proportion of the middle alternatives on these questions represent gen-
uinely neutral positions on the underlying preference dimension? Figure 1a
(b)
(a)
79%84%
69%
18%13%
26%
3% 3%5%
0%
10%
20%
30%
40%
50%
60%
70%
80%
90%
GMNanoECQuestion
hidden don't knowneutral attitudeindeterminate
65% 66%
53%
16%13%
25%18% 22% 21%
0%
10%
20%
30%
40%
50%
60%
70%
80%
90%
100%
GMNanoECQuestion
resp
onse
s to
follo
w-u
p qu
estio
nto
mid
poin
t res
pond
ents
(%)
Figure 1. Distribution of initial midpoint responses after (a) the follow-up probe(b) the follow-up probe and redistribution of ‘‘neither of the above’’ responses.
26 Sociological Methods & Research 43(1)
at SAGE Publications on April 27, 2015smr.sagepub.comDownloaded from
Page 13
shows the breakdown of responses to the follow-up question administered to
all respondents who initially selected the midpoint. The results are striking;
on all three questions, the clear majority of midpoint responses actually
turn out to indicate that the respondent has no opinion on the issue. Only
16 percent, 13 percent, and 25 percent of initial midpoints on the 3 items,
respectively, are maintained to be truly ‘‘neutral’’ when respondents are
asked directly what their response was intended to indicate. And these
figures include in the base all those respondents who selected ‘‘neither of the
above’’ to the initial follow-up probe.
When asked to say in their own words why they chose the ‘‘neither/nor’’
alternative, if not for either of these two reasons, the majority gave responses
which indicated that they did not, in fact, have an opinion on the issue. For
instance, on the GM item, 74 percent of these respondents provided verba-
tim answers which were assigned the following codes:
� I don’t have sufficient information (13 respondents).
� I have no interest (1 respondent).
� What they do is irrelevant to me/does not affect my life (3).
� I don’t know (25).
While only 11 percent provided verbatim responses which indicated that
they held neutral attitudes:
� A balance between some good and some bad/depends on the issue
(3).
� Does not have Britain’s interests at heart (3).
The remaining verbatim responses, which did not provide sufficient infor-
mation to be coded as either ‘‘no opinion’’ or ‘‘neutral,’’ were allocated the
code ‘‘indeterminate.’’2 Figure 1b shows the final distribution of midpoint
responses after reallocation of these second follow-up respondents; between
three quarters and nine-tenths of initial ‘‘neither/nor’’ responses now turn
out to conceal nonattitudes, while only around one or two in ten are genu-
inely neutral opinions, strongly supporting Hypothesis 1. Figure 1 clearly
shows that the raw distributions in Table 1 substantially overestimate the
degree of opinion neutrality in the population and, as a corollary, underesti-
mate by a commensurate amount the true extent of nonattitudes on all three
issues.
In addition to univariate estimates, it is important to consider the
implications of these findings for more explanatory multivariate analyses,
Sturgis et al. 27
at SAGE Publications on April 27, 2015smr.sagepub.comDownloaded from
Page 14
in which bipolar response scales are often deployed, and which treat
‘‘neither/nor’’ responses as the midpoint of an ordinal scale. Table 2 pre-
sents the coefficients and standard errors from ordered logit models pre-
dicting attitude toward the EC, before and after reallocation of ‘‘hidden
don’t knows’’.3 There are a number of differences in the magnitude and
significance of the coefficients across the two models that would lead to
quite different substantive interpretations about the precursors of atti-
tudes toward the European Commission. Most notably, men and those
more interested in politics are significantly more positive about the EC
in model 1 but not in model 2. Partly, this is due to the fact that the stan-
dard errors are somewhat larger in model 2, as a result of the increased
number of don’t know responses that are dropped from the analysis in
this model. However, the difference in sample size does not appear to
be the only factor underpinning the differences, as there are also some
sizable discrepancies in the magnitude of coefficient point estimates
between the two models. Whatever the reasons for the differences, how-
ever, it remains clear that standard analytical practices would yield rather
Table 2. Comparison of Ordinal Logistic Regression Models Predicting SatisfactionWith the EC Before and After Reallocation of ‘‘Hidden Don’t Knows’’.
Model 1,Prior to Recoding
Hidden Don’t Knows
Model 2,After Recoding Hidden
Don’t Knows
B SE B SE
Threshold#1 �1.74** .74 �0.40 1.04Threshold#2 1.00 .62 2.56*** .96Threshold#3 3.02*** .64 3.10*** .95Threshold#4 4.06*** .65 4.42*** .97Male 0.30* .14 0.18 .17Age 0.06*** .02 0.10*** .03Age squared �0.0004* .0001 0.0008 .0002Political interest 0.12 .06 0.11 .08Degree �0.06 .25 �0.07 .29Other qualification 0.28 .17 0.22 .22Social grade �0.05 .06 �0.05 .08Longstanding illness 0.14 .19 0.12 .22
Note. Coefficients are logits; n = 735 (model 1); n = 479 (model 2); standard errors estimatedusing Taylor-series linearization; *p < .05; **p < .01; ***p < .001; Source: Ipsos MORI generalpopulation omnibus survey.
28 Sociological Methods & Research 43(1)
at SAGE Publications on April 27, 2015smr.sagepub.comDownloaded from
Page 15
Tab
le3.
Dis
trib
utions
ofPolit
ical
/Sci
entific
Inte
rest
Acr
oss
‘‘Initia
l’’an
d‘‘H
idden
Don’t
Know
’’R
esponse
Cat
egori
es.
Not
atA
llIn
tere
sted
Not
Ver
yIn
tere
sted
Nei
ther
/Nor
Fair
lyIn
tere
sted
Ver
yIn
tere
sted
Tota
lC
hi-Sq
uar
eT
est
ofIn
dep
enden
ce
E.C
.In
itia
ldon’t
know
85
(28.9
%)
90
(30.6
%)
32
(10.9
%)
77
(26.2
%)
10
(3.4
%)
294
18
(df
=4),
p=
.001
Hid
den
don’t
know
47
(19.1
%)
57
(23.2
%)
30
(12.2
%)
95
(38.6
%)
17
(6.9
%)
246
G.M
.In
itia
ldon’t
know
64
(34.8
%48
(26.1
%)
28
(15.2
%)
38
(20.7
%)
6(3
.3%
)184
26
(df
=4),
p<
.001
Hid
den
don’t
know
31
(14.5
%)
57
(26.6
%)
48
(22.4
%)
61
(28.5
%)
17
(7.9
%)
214
Nan
ote
chnolo
gyIn
itia
ldon’t
know
82
(26.5
%)
95
(30.7
%)
34
(11%
)78
(25.2
%)
20
(6.5
%)
309
8.2
(df
=4),
p=
.086
Hid
den
don’t
know
19
(17.6
%)
29
(26.9
%)
19
(17.6
%)
36
(33.3
%)
5(4
.6%
)108
29
at SAGE Publications on April 27, 2015smr.sagepub.comDownloaded from
Page 16
different substantive interpretations depending on how the ‘‘neither/nor’’
midpoint is coded.
Thus far, we have shown that the vast majority of ‘‘neither/nor’’ responses
on all 3 items appear, on closer examination, to be reflective of holding no
opinion, rather than of opinion neutrality. We argued earlier that this phe-
nomenon should be anticipated, on the grounds that many individuals may
regard the admission of ignorance on matters of public policy as socially
embarrassing and, hence, will select the ‘‘neither/nor’’ alternative as a
face-saving way of saying ‘‘don’t know.’’ To test the proposed social desir-
ability mechanism as specified in Hypothesis 2, Table 3 presents the distri-
bution of interest in politics (for the EC item) and science (for the
nanotechnology and GM items)4 for initial and hidden don’t know responses,
respectively.
For all 3 items, the proportion of ‘‘fairly’’ and ‘‘very’’ interested respon-
dents is higher and the proportion of ‘‘not at all’’ and ‘‘not very’’ interested
respondents is lower for the ‘‘hidden don’t know’’ than it is for the ‘‘initial’’
don’t know’’ category, although for the nanotechnology item, the difference
is marginally nonsignificant at the 95 percent level of confidence. Counter
to what a survey-satisficing explanation of midpoint responding would pre-
dict, then, hidden don’t know responses are more prevalent among
those who claim to be more interested in the topic domain, confirming
Hypothesis 2.
A reasonable objection to the conclusion that more interested respondents
select the ‘‘neither/nor’’ midpoint in substantial numbers as a face-saving
way of saying ‘‘don’t know’’ is that we did not explicitly offer ‘‘don’t know’’
as a response alternative. If respondents volunteered a ‘‘don’t know’’ answer,
interviewers were able and, indeed, instructed to record it. However, it is pos-
sible that what we are seeing is respondents, not so much avoiding saying
don’t know, as selecting the offered alternative which comes closest to their
true position. This explanation would also fit plausibly with the associations
we have observed between ‘‘hidden don’t know’’ responding and interest in
politics/science, on the grounds that respondents with greater interest in the
topic might be more likely to stick to the interview protocol (i.e., select one
of the response alternatives offered on the show card). To test this alternative
account, we readministered the EC and GM questions to a fresh sample of the
Ipsos-MORI general population omnibus5 but this time, a random half of
respondents were offered an explicit ‘‘don’t know’’ alternative on the show
card, while the other half were not. Marginal distributions before and after
reallocation of ‘‘hidden don’t knows’’ across conditions are shown for the
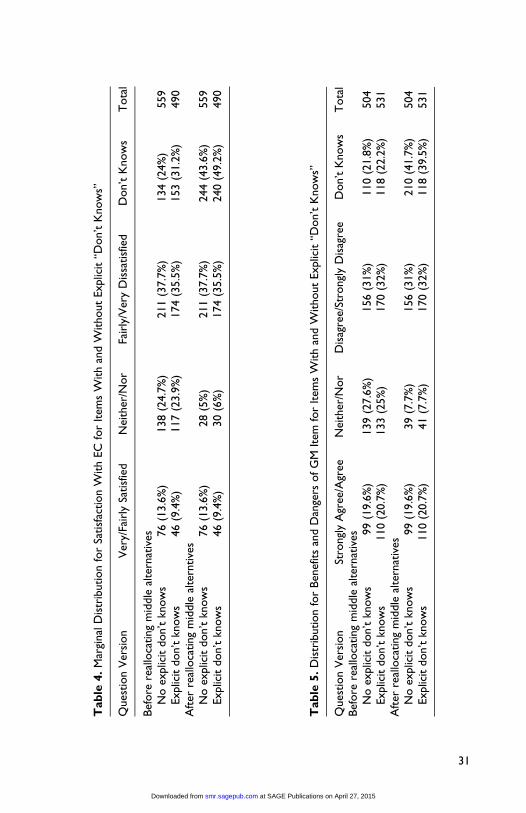
EC item in Table 4 and, for the GM item, in Table 5.
30 Sociological Methods & Research 43(1)
at SAGE Publications on April 27, 2015smr.sagepub.comDownloaded from
Page 17
Tab
le4.
Mar
ginal
Dis
trib
ution
for
Satisf
action
With
EC
for
Item
sW
ith
and
Without
Explic
it‘‘D
on’t
Know
s’’
Ques
tion
Ver
sion
Ver
y/Fa
irly
Satisf
ied
Nei
ther
/Nor
Fair
ly/V
ery
Dis
satisf
ied
Don’t
Know
sT
ota
l
Bef
ore
real
loca
ting
mid
dle
alte
rnat
ives
No
explic
itdon’t
know
s76
(13.6
%)
138
(24.7
%)
211
(37.7
%)
134
(24%
)559
Explic
itdon’t
know
s46
(9.4
%)
117
(23.9
%)
174
(35.5
%)
153
(31.2
%)
490
Aft
erre
allo
cating
mid
dle
alte
rntive
sN
oex
plic
itdon’t
know
s76
(13.6
%)
28
(5%
)211
(37.7
%)
244
(43.6
%)
559
Explic
itdon’t
know
s46
(9.4
%)
30
(6%
)174
(35.5
%)
240
(49.2
%)
490
Tab
le5.
Dis
trib
ution
for
Ben
efits
and
Dan
gers
ofG
MIt
emfo
rIt
ems
With
and
Without
Explic
it‘‘D
on’t
Know
s’’
Ques
tion
Ver
sion
Stro
ngl
yA
gree
/Agr
eeN
eith
er/N
or
Dis
agre
e/St
rongl
yD
isag
ree
Don’t
Know
sT
ota
lBef
ore
real
loca
ting
mid
dle
alte
rnat
ives
No
explic
itdon’t
know
s99
(19.6
%)
139
(27.6
%)
156
(31%
)110
(21.8
%)
504
Explic
itdon’t
know
s110
(20.7
%)
133
(25%
)170
(32%
)118
(22.2
%)
531
Aft
erre
allo
cating
mid
dle
alte
rnat
ives
No
explic
itdon’t
know
s99
(19.6
%)
39
(7.7
%)
156
(31%
)210
(41.7
%)
504
Explic
itdon’t
know
s110
(20.7
%)
41
(7.7
%)
170
(32%
)118
(39.5
%)
531
31
at SAGE Publications on April 27, 2015smr.sagepub.comDownloaded from
Page 18
Table 4 shows that, for the EC item, although offering an explicit ‘‘don’t
know’’ does increase the ‘‘don’t know’’ rate by 7 percent, it has no effect
on the rate of ‘‘neither/nor’’ responding, either before or after reallocation
of ‘‘hidden don’t knows.’’ In fact, the increase in the ‘‘don’t know’’ rate in
the offered condition comes entirely from across the substantive categories
in the omitted condition. This suggests that, rather than reducing the rate of
‘‘hidden don’t knows,’’ offering an explicit ‘‘don’t know’’ might increase
the rate of satisficing, by drawing respondents who are able to provide a
substantive answer toward the cognitively easier ‘‘don’t know’’ alternative.
As we argued earlier, of course, it is also possible that respondents with no
opinion who select the ‘‘don’t know’’ in the offered condition, are (in coun-
terfactual terms) randomly selecting substantive responses in the omitted
condition (Converse 1964). Either way, we can be confident that, for this
item, explicitly offering a ‘‘don’t know’’ alternative does not reduce the rate
of ‘‘hidden don’t knows.’’ For the GM item (Table 5), the same is true—the
inclusion of an explicit don’t know option has no effect on the rate of
‘‘neither/nor’’ responding, either before or after reallocation of ‘‘hidden don’t
knows,’’ although for this item, there is no evidence to suggest that it
increases satisficing or reduces random responding relative to the omitted
condition.
Discussion
The bipolar response scale with five or seven answer categories and a
‘‘neither/nor’’ midpoint, though by no means the only method used for
measuring attitudes, remains one of the most prevalent tools for measur-
ing social and political attitudes across the social sciences. Prominent sur-
veys which have implemented this question format in recent years
include, but are not limited to: the British Social Attitudes Survey; the
British Household Panel Survey; the British Crime Survey; the British
Election Study; the American National Election Studies; the General
Social Survey; and major multination studies including the European
Social Survey; the World Values Survey; and the International Social
Survey Program. Yet, despite their ubiquity in current survey practice,
there has long been a lack of understanding about the psychological
mechanisms respondents employ in answering them. As a consequence, it
has not been clear exactly how these items should be designed and imple-
mented to minimize random and systematic errors of measurement. The
reason that this lacuna has persisted for so long in the survey methodolo-
gical literature is, we have argued, that the split-ballot research designs
32 Sociological Methods & Research 43(1)
at SAGE Publications on April 27, 2015smr.sagepub.comDownloaded from
Page 19
that have traditionally been implemented to delineate the various compet-
ing sources of error do not provide sufficient leverage on the key question
of why people select midpoints.
There are at least three ways in which respondents might select a response
category on a bipolar response scale in a manner that does not reflect their
true psychological state. First, ‘‘satisficers’’ hold an opinion but select the
midpoint to avoid the cognitive costs of selecting the most appropriate direc-
tional alternative. Second, respondents who hold genuinely neutral opinions
but are not offered a midpoint are forced to select from among the available
directional categories—‘‘forced directional’’ responses. And third, respon-
dents who do not have an opinion on the issue at all but select the midpoint,
or from among the directional categories, as a way of saying ‘‘don’t know’’
without appearing to admit ignorance to the interviewer. The split-ballot
design, in which respondents are randomly assigned to receive items omit-
ting or offering a midpoint, is not well suited to identifying the relative con-
tributions made by each of these mechanisms, at least insofar as the design
has been implemented to date.
A recent methodological innovation by Malhotra et al. (2009) has
advanced our understanding of how to optimize the design of bipolar
response scales considerably. Instead of the standard split-ballot approach,
Malhotra et al. use ‘‘branching’’ questions to take respondents from an ini-
tial broad answer category to a more refined directional response, or to
maintain their initial position. They then compare validity coefficients from
the initial to the branched versions of the questions to determine the optimal
number of response categories for the item in question. Using this approach
across a pool of eight target attitude measures, they found that validity coef-
ficients were not improved by branching respondents who initially selected
the midpoint to the directional responses on either side. From this they con-
cluded that respondents who select the midpoint ‘‘belong there.’’ As we
noted earlier, however, this conclusion does not consider the possibility that
the initial ‘‘neither/nor’’ midpoint might also act as a way of saying ‘‘don’t
know.’’
In this study, we have applied a variant of Malhotra et al.’s branching
method to test this hypothesis directly. We have found that, for the 3 items
considered, the vast majority of respondents who initially selected the ‘‘nei-
ther/nor’’ alternative on a 5-point item selected the ‘‘I don’t have an opinion
on this issue’’ option when subsequently asked why they had chosen the mid-
point. Only a small minority selected the alternative option, denoting true
opinion neutrality, ‘‘I have an opinion which is right in the middle on this
issue.’’ Unsurprisingly, reallocating the ‘‘hidden don’t know’’ responses
Sturgis et al. 33
at SAGE Publications on April 27, 2015smr.sagepub.comDownloaded from
Page 20
from the midpoint to the ‘‘don’t know’’ category substantially altered mar-
ginal and multivariate distributions for all 3 items. Our contention is that the
response distributions of these variables prior to branching the midpoints
are less reflective of the underlying preference distribution than is the case
after the ‘‘hidden don’t knows’’ have been allocated away from the mid-
point. However, because we do not have criterion variables in our data set
by which the validity of these responses can be evaluated empirically,
we can speak of bias in the unbranched data only by assumption—these
measures are biased because they contain responses which, upon closer
investigation, are revealed not to be located at the midpoint of an ordinal
scale. While we believe this assumption to be both parsimonious and
plausible, additional work could usefully be undertaken to assess the
impact of the branching procedure applied to midpoints on criterion valid-
ity coefficients.
A novel contribution of this article is our demonstration that the motiva-
tion to employ a ‘‘face-saving don’t know’’ response strategy appears to
derive from a desire to avoid social embarrassment among respondents who
feel that they should have an opinion on important issues. Thus, and counter
to what the satisficing framework would predict, the ‘‘face-saving don’t
know’’ is found most frequently among those who express greater interest
in the topic area.
An important limitation to the generality of our conclusions is the fact
that we have focused on a small number of low-salience issues. Selecting
low-salience issues was a deliberate strategy in order to obtain sufficient
numbers of respondents with no opinion on each issue. On issues with
which the public are more familiar, the proportion of true don’t knows and,
therefore, of ‘‘hidden don’t knows’’ in the population would very likely be
smaller and the threat to valid inference concomitantly lower. To adopt
Converse’’s terminology with regard to his ‘‘black-and-white’’ model of
public opinion, these items should, therefore, be considered as ‘‘limiting
cases,’’ which act as a proof of concept rather than being typical or repre-
sentative of bipolar response scales in general (Converse 1964, 2000). An
important avenue of future research will be to determine the extent to which
our findings generalize to a broader range of issues that are higher in the
public consciousness.
Be that as it may, it is not at all uncommon for the public to be sur-
veyed about matters of which they are only dimly aware. Indeed, one of
the few things that we know with some certainty about public opinion,
after decades of empirical research, is that the majority of the public
are poorly informed about and little interested in politics and science
34 Sociological Methods & Research 43(1)
at SAGE Publications on April 27, 2015smr.sagepub.comDownloaded from
Page 21
(Allum et al. 2008; Delli Carpini and Keeter 1996; Miller 2001). Our
research is, therefore, of direct relevance to the many surveys which seek
to elicit public preferences on more peripheral areas of public policy and
debate.
What, then, do our findings imply for the design of bipolar response
scales? First, that it is important to include a midpoint, because a sub-
stantial minority of people do appear to hold attitudinal positions which
are genuinely neutral, in the sense of being located at the midpoint of a
underlying preference dimension. Omitting a middle alternative would
result in such individuals being forced to select a response alternative
that does not reflect their true attitudinal position and, as a result,
reduce item reliability and validity by forcing respondents with genuinely
neutral positions to select from amongst the available directional
alternatives.
However, while a midpoint should be included, whether it is most appro-
priately labeled ‘‘neither/nor’’ is highly questionable. Because neither
agreeing, nor disagreeing with a statement is logically consistent with both
opinion neutrality and having no opinion, this label incorporates an inherent
ambiguity that can only be resolved by the administration of follow-up
probes. These are time-consuming to administer and, therefore, costly.
Nonetheless, our results show that the additional cost of administering
branching questions from the midpoint into a ‘‘don’t know’’ category is
likely to be effective in meeting the key objective of any survey—valid
inference. The intuitively appealing recourse of including an explicit ‘‘don’t
know’’ alternative does not appear to solve the problem, for while this did
serve to increase the frequency of ‘‘don’t know’’ responses, it had no dis-
cernable effect on the rate of ‘‘hidden don’t knows.’’ Another possible res-
olution of the problem we have identified here may lie in using a label for
the midpoint which is more consistent with the way in which question
designers would like respondents to interpret it. We recommend this as a
particularly fruitful avenue for future research.
Declaration of Conflicting Interests
The author(s) declared no potential conflicts of interest with respect to the research,
authorship, and/or publication of this article.
Funding
The author(s) received no financial support for the research, authorship, and/or pub-
lication of this article.
Sturgis et al. 35
at SAGE Publications on April 27, 2015smr.sagepub.comDownloaded from
Page 22
Notes
1. When the GM item was administered as part of the 2003 British Social Attitude
Survey, the response distribution was 14 percent agree, 37 percent neither/nor,
33 percent disagree, and 16 percent don’t know.
2. The full distribution of verbatim codes for all 3 items is provided in the
Appendix A (see Online Appendix A which can be found at http://smr.sagepub
.com/supplemental/).
3. Various model specifications could be used for this demonstration, including
ordinary least squares and multinomial logit. We have chosen ordered logit
because this seems most suitable, given the distribution of the outcome.
However, the basic point that there are substantial differences between the coef-
ficients before and after reallocation of hidden don’t knows is consistent across
all three link functions. These are available from the corresponding author upon
request.
4. How interested would you say you are in politics/science? (1) very interested (2)
fairly interested (3) neither interested nor uninterested (4) not very interested (5)
not at all interested.
5. Data were collected during October 2008 (n = 2,084).
References
Allum, N., P. Sturgis, I. Brunton-Smith, and D. Tabourazi. 2008. ‘‘Science
Knowledge and Attitudes across Cultures: A Meta-Analysis.’’ Public
Understanding of Science 17:35-54.
Alwin, Duane F. 1992. ‘‘Information Transmission in the Survey Interview: Number
of Response Categories and the Reliability of Attitude Measurement.’’
Sociological Methodology 22:83-118.
Alwin, Duane. 2007. Margins of Error. A Study of Reliability in Survey Measure-
ments. Hoboken, NJ: John Wiley.
Andrews, Frank M. 1984. ‘‘Construct Validity and Error Components of Survey
Measures: A Structural Modeling Approach.’’ Public Opinion Quarterly 46:
409-42.
Ayidiya, Stephen A. and McKee J. McClendon. 1990. ‘‘Response Effects in Mail
Surveys.’’ Public Opinion Quarterly 54:229-47.
Bishop, George F. 1987. ‘‘Experiments with the Middle Response Alternative in
Survey Questions.’’ Public Opinion Quarterly 51:220-32.
Cassel, C. 2003. ‘‘Over-Reporting and Electoral Participation Research.’’ American
Politics Research 31:81-92.
Converse, Philip. 1964. ‘‘The Nature of Belief Systems in Mass Publics.’’
Pp. 206-61 in Ideology and Discontent, edited by David Apter. New York:
Free Press.
Converse, Philip. 2000. ‘‘Assess the Capacity of Mass Electorates.’’ Annual Review
of Political Science 3:331-53.
36 Sociological Methods & Research 43(1)
at SAGE Publications on April 27, 2015smr.sagepub.comDownloaded from
Page 23
Delli Carpini, Michael and Scott Keeter. 1996. What Americans Know about Politics
and Why it Matters. New Haven, CT: Yale University Press.
Eagly, Alice H. and Shelly Chaiken. 1993. The Psychology of Attitudes. London,
England: Harcourt Brace Jovanovich College.
Kalton, Graham, Julie Roberts, and Tim Holt. 1980. ‘‘The Effects of Offering
a Middle Response Opinion with Opinion Questions.’’ The Statistician 29:65-78.
Krosnick, Jon A. 1991. ‘‘Response Strategies for Coping with the Demands of
Attitude Measures in Surveys.’’ Applied Cognitive Psychology 5:214-36.
Krosnick, Jon A., Charles M. Judd, and Bernd Wittenbrink. 2005. ‘‘The
Measurement of Attitudes.’’ Pp. 21-76 in The Handbook of Attitudes, edited
by Dolores Albarracin, Blair T. Johnson, and Mark P. Zanna. Mahwah, NJ:
Lawrence Erlbaum.
Likert, Rensis. 1932. ‘‘A Technique for the Measurement of Attitudes.’’ Archives of
Psychology 140:1-55.
Malhotra, Neil, Jon A. Krosnick, and Randall K. Thomas. 2009. ‘‘Optimal Design of
Branching Questions to Measure Bipolar Constructs.’’ Public Opinion Quarterly
73:304-24.
McCutcheon, A. L., R. F. Belli, and Y. Tian. 2003. ‘‘Social Desirability and
Faulty Memory in Vote Over-Reporting: A Cross-National Comparison of the
American and British Electorates.’’ Presented at the annual meeting of the
American Association for Public Opinion Research, Sheraton Music City,
Nashville, TN.
Miller, S. 2001. ‘‘Public Understanding of Science at the Crossroads.’’ Public
Understanding of Science 10:115-20.
Presser, S. 1984. ‘‘Is Inaccuracy on Factual Survey Items Item Specific or
Respondent Specific.’’ Public Opinion Quarterly 48:344-55.
Presser, Stanley and Howard Schuman. 1980. ‘‘The Measurement of a Middle Posi-
tion in Attitude Surveys.’’ Public Opinion Quarterly 44:70-85.
Rugg, Donald and Hadley Cantril. 1944. ‘‘The Wording of Questions.’’ Pp. 23-50 in
Gauging Public Opinion, edited by Hadley Cantril. Princeton, NJ: Princeton
University Press.
Schuman, Howard and Stanley Presser. 1981. Questions and Answers in Attitude
Surveys. New York: Academic Press.
Sturgis, P. and P. Smith. 2010. ‘‘Fictitious Issues Revisited: Political Knowledge,
Interest, and the Generation of Nonattitudes.’’ Political Studies 58:66-84.
Vavrek, L. 2006. ‘‘Dangers of Self-Reports of Political Behavior.’’ Presented at the
annual meeting of the American Political Science Association, Philadelphia, PA.
Author Biographies
Patrick Sturgis is Professor of Research Methods in the Division of Social
Statistics and Director of the UK National Centre for Research Methods at the
University of Southampton.
Sturgis et al. 37
at SAGE Publications on April 27, 2015smr.sagepub.comDownloaded from
Page 24
Caroline Roberts is Senior Research Fellow at the Swiss Foundation for Research in
the Social Sciences (FORS) at the University of Lausanne.
Patten Smith is Director of Methodology at Ipsos-MORI Limited, London.
38 Sociological Methods & Research 43(1)
at SAGE Publications on April 27, 2015smr.sagepub.comDownloaded from


![´Á[Z ®(− æ ±S ]ª‹ª]1®] cæ ± å *ÚðaãE] ª-ªS®åS¦UÚ ª æ±1c ª ... fileq¬º ±ªn] ¯* Ÿd ®S ] T ª *ª ]¯*E rT åS SS E å å ] åc º ª ± e−ª]Hs °](https://static.documents.pub/doc/80x56/5ce86eb688c9935a6b8d1a12/az-ae-s-aa1-cae-a-udaae-a-asasuu-a-ae1c.jpg)


