Sociology Working Papers Paper Number 2014-06 Anarchy in the UK: Economic Deprivation, Social Disorganization, and Political Grievances in the London Riot of 2011 Juta Kawalerowicz and Michael Biggs University of Oxford Department of Sociology University of Oxford Manor Road Oxford OX1 3UQ
Transcript
Sociology Working Papers
Paper Number 2014-06
Anarchy in the UK: Economic Deprivation, Social Disorganization, and Political
Grievances in the London Riot of 2011
Juta Kawalerowicz and
Michael Biggs
University of Oxford
Department of Sociology University of Oxford
Manor Road Oxford OX1 3UQ
Anarchy in the UK: Economic Deprivation, Social Disorganization, and Political Grievances in the London Riot of 2011*
Department of Sociology, University of Oxford Thousands rioted in London in August 2011, with the police losing control of parts of the city for four days. This event was not an ethnic riot: participants were ethnically diverse and did
not discriminate in choosing targets for looting or destruction. Whereas the sociological literature has focused on variation in rioting across cities, we examine variation within London by mapping the residential addresses of 1,620 people subsequently charged with
rioting on to 25,022 neighbourhoods. Rioters tended to come from economically deprived areas. Rioters were more likely to come from neighbourhoods where ethnic fractionalization was high, which can be interpreted as evidence for social disorganization. These findings run
counter to the literature’s rejection of deprivation and disorganization as explanations for rioting. In addition, rioting was motivated by political grievances, as rioters tended to come from boroughs where police were perceived as disrespectful.
It wasn’t no drama, no stress, everyone had the power. Everyone had the strength. The police wasn’t in control. We had the power.
—young man recalling the riot (BBC 2012)
The outbreak of rioting in London in August 2011 was an extraordinary episode in British history. Over four days, thousands of people took part in destruction and looting, causing property damage costing at least $50 million. The police ceded control of large swathes of territory; rioting occurred in two-thirds of the city’s boroughs. Rioting in London also * Earlier versions were presented to the Alternative Futures and Popular Protest conference in March 2013 and the British Sociological Association conference in April 2014. We thank Betsy Stanko and Trevor Adams from the Metropolitan Police Service for their help in accessing the data, and Ben Bradford, Tak Wing Chan, Jalal Imran, Rima Majed, David Pettinicchio, Federico Varese, and Wybo Wiersma for their comments.
inspired outbreaks elsewhere in England, including Manchester and Birmingham. Parliament was recalled from summer recess to deal with the crisis. Eventually more than 3,000 people were arrested in the capital. This was the most widespread and prolonged breakdown of order in London’s history since the Gordon riot of 1780. What makes this episode sociologically intriguing is its divergence from the familiar pattern of an ethnic riot. To be sure, it was triggered by the police shooting of a young man of mixed race, but there the resemblance ends. The rioters were ethnically heterogeneous: of those arrested in London, just under half were classified as black while a third were white. Rioters did not focus on any ethnic group when targeting properties, and only the police were subject to sustained attack. The sociological literature has been dominated by ethnic riots in the United States, especially the spectacular wave of riots by African Americans in the 1960s. The London riot therefore provides an opportunity to test sociological theories on another sort of event.
Sociological investigation of riots is dominated by examination of variation in frequency and severity of rioting across American cities. Lieberson and Silverman (1965) conducted the first systematic comparison, while Spilerman (1970) provocatively concluded that social conditions did not matter. The tradition culminated in sophisticated event-history analyses by Myers (1997; 2000; 2010) and by Olzak and collaborators (Olzak 1992; Olzak and Shanahan 1996; Olzak, Shanahan, and McEneaney 1996). These studies are ideal for tracing the diffusion of rioting from one city to another. Taking the city as the unit of observation, however, provides only limited insight into the social contexts conducive to riots, because rioting is highly localized. There are surprisingly few systematic analyses of variation in rioting within a city.1 Herman and collaborators (Bergesen and Herman 1998; Herman 2005) locate riot fatalities within census tracts in six major American riots during the twentieth century. Baudains, Braithwaite, and Johnson (2013) map offences during the London riot of 2011 within areas comprising about 1500 people. We exploit similar data to analyze variation within London. Unlike previous work, we investigate where rioters live rather than where riot offences are committed, which has the advantage of more precisely matching individuals to their social context. We also disaggregate to smaller neighbourhoods, containing about 300 residents. The dependent variable is the number of rioters—those arrested and charged for offences committed during the riot—in each neighbourhood.
The findings make three major contributions to the literature on riots. One is demonstrating the importance of deprivation—a composite measure of concentrated
1 Earlier work on variation across census tracts (e.g. Abudu et al. 1972; Abudu Stark et al. 1974) is hard to interpret today because of the methods used.
disadvantage—for explaining variation in rioting. Since the 1970s the literature dismisses deprivation, on the grounds that it does not explain variation across cities (reinforced by the misinterpretation of findings from the 1960s riots). Such dismissal is unwarranted. The second contribution is showing that relations between residents and police made a significant difference to the prevalence of rioting within London. It is obvious that riots are often sparked by illegitimate police actions, but our analysis is unique in measuring residents’ perceptions of the police before the outbreak. The third contribution is identifying the potential significance of ethnic fractionalization. Neighbourhoods with greater diversity were more prone to riot. Whether this finding can be generalized to other riots remains to be seen. It does, however, have suggestive implications for debates over the local consequences of diversity (provoked by Putnam 2007).
The London riot We define a riot as an event in which a large number of people deliberately damage property and attack others; this often also involves looting. The numerical threshold is not pertinent here; 30 or 50 are common (Wilkinson 2013, 330). A riot invariably involves vicarious participants who watch and thereby encourage those who attack, destroy, or steal (Collins 2008, 413-30). But here we restrict the term “rioter” to those who actually commit the acts. Riot covers a wide variety of events, and so it is useful to make two heuristic distinctions2 (drawing on typologies by Marx 1970; McPhail 1994). The first is the occasion for the riot. Some riots develop out of another event, like a protest demonstration or sporting fixture; such riots are often explained as a spontaneous reaction (by a minority) to aggressive policing (e.g. Stott and Reicher 1998). In other cases, the event is originally a riot: people assemble specifically for the purpose of rioting (or of watching others riot). A second distinction is the type of target. In some cases rioters target the police or other organs of state power. In other cases they primarily target another non-state group.
These distinctions will help to situate the London riot. On August 4 a specialized armed unit of police shot and killed a young man of mixed race from Tottenham—Mark Duggan—who they suspected of carrying a gun. The circumstances of his death were unclear (and remain disputed). Certainly the authorities released false information to the media and failed to properly communicate with the family. Rumours circulated that Duggan had been deliberately assassinated. These accusations were taken up by the Black Independent Advisory Group, established to challenge policing in Haringey Borough (which encompasses 2 Prison revolts are an entirely different but important type of riots; for a detailed discussion see Goldstone and Useem (1999).
Tottenham). Two days after the shooting, on the afternoon of August 6, activists from the Group and Duggan’s family led a demonstration to Tottenham police station. About a hundred protesters waited while negotiations with the police continued. Over a period of three hours in the evening, crowds gathered and the tension grew. A police car was set alight and rioting began, inflamed by rumours (apparently false) that police at the scene had just beaten a young black woman or girl (Guardian, December 9, 2011). This initial outbreak can be classified as a riot developing out of protest. Hypothetically, if the police had defused the situation at the outset, the riot would not have occurred. Rioting spread to other points in Haringey Borough that night, as the police ceded control of the streets.3
Rioting on subsequent nights occurred as people congregated specifically for that purpose. The connection with Duggan’s killing was more tenuous beyond Haringey, but many rioters were certainly motivated by their own anger towards the police, arising from personal experience. This is a major theme to emerge from subsequent interviews with rioters (Lewis et al. 2011; Morrell et al. 2011). These interviews also reveal frustration at economic deprivation, resentment towards the government for cutting social programs, and the attraction of looting. Briggs (2012) suggests that rioters have a tendency to initially justify their actions by anger at the police; only when probed at length do they admit the importance of material gain (see also Treadwell et al. 2013). As his informant eventually acknowledged: “People wanted to get back at the police but at the same time get some bits [loot]” (Briggs 2012, 34). Aside from these motivations rooted in structural location, interviews also reveal an endogenous process of positive feedback (Biggs 2003). People rioted because others were rioting: “because everyone was doing it, I thought, if everyone was doing that and no one is getting caught at the time, why can’t I do it?” (BBC 2012). Alongside television, BlackBerry Messenger was important in relaying information as the event unfolded (Morrell et al. 2011, 30-33).
As observed at the outset, the London riot is not usefully framed as an ethnic riot. Obviously this event was completely different from a riot in which one ethnic group attacked another, like whites and blacks in Chicago in 1919 or Hindus and Muslims in Ahmedabad in 2002 (Chicago Commission on Race Relations 1922; Dhattiwala and Biggs 2012). More subtlety is needed to distinguish the London riot from the American “race” riots of the 1960s—such as Watts, Newark, and Detroit (Janowitz 1968). Those were sparked by a confrontation between white police and black citizens. Most importantly, the great majority
3 This account draws on Metropolitan Police 2012, 17, 32; Lewis et al. 2012, 16-17; Morrell et al. 2011, 13, 15.
of rioters were black (NACCD 1968, 74).4 Notorious riots in London in the 1980s fit the same pattern: in Brixton in 1981, and at the Broadwater Farm Estate in Tottenham in 1985 (Benyon and Salomos 1987; Keith 1993). The London riot differed in important respects. Duggan’s father was from Jamaica but his mother is white. His maternal aunt was prominent at the standoff outside Tottenham police station, and some of the protesters were white5. The senior police officer who tried to defuse the situation, at whom the crowd shouted “murderer,” is black (Guardian, July 2, 2012). The precipitating incident was therefore not strictly black and white. And this incident is only tangentially connected with rioting on the following days. When interviewed, rioters did not consider the event to be a race riot (Lewis et al. 2011, 5). Finally, the rioters were ethnically heterogeneous. Of those arrested in London, 47% were classified as black, 32% as white, 11% as mixed, and 8% as South Asian (Home Office 2011, 29). Blacks were overrepresented in comparison to the population and whites underrepresented, but no group comprised a pronounced majority.
Explaining riots Riots can be explained in various ways. We focus on the social, economic, and political circumstances which are conducive to rioting. This means neglecting the dynamics of the riot as a process, not because these dynamics are less important but because our ecological data is particularly suited to investigating cross-sectional variation. We consider five distinct explanations: deprivation, relative deprivation, ethnic competition, social disorganization, and political grievances.
Deprivation—standing for poverty, unemployment, and lack of education—is an obvious explanation for rioting. Several mechanisms can be adduced. People who are deprived have less reason to view societal institutions as legitimate. They have more to gain from looting, and less to lose from a criminal conviction. Deprivation may also operate indirectly. People who are deprived are less able to exercise power via political parties or social movements. They are more likely to experience conflict with police. Since the 1970s, however, sociologists have rejected or at least downplayed deprivation (prominent exceptions are Piven and Cloward 1992; Useem 1998). It is worth scrutinizing the various reasons for rejecting deprivation.
In the 1960s politicians denounced rioters as “riffraff” (Fogelson 1967), while sociological theory—in the tradition of Le Bon and Blumer—deemed them to be irrational 4 It is usually claimed that blacks targeted stores owned by whites, but Rosenfeld (1997) demonstrates how the ethnicity of owners can be confounded by type of store. 5 Video evidence from Fully Focused (2012).
(McPhail 1989). Rejecting these notions, revisionist sociologists unfortunately equated them with deprivation as an explanation. In addition, revisionists tended to conflate rioting with other forms of contention where privileged rather than deprived groups were in the vanguard; consider the role of college students in the Civil Rights movement. When all forms of contention are lumped together, then deprivation is no longer a plausible explanation.
Research on individual participation in the 1960s riots has been interpreted as refuting deprivation. McPhail (1971) summarizes ten reports on individual participation. Out of 50 bivariate associations with variables for deprivation, Cramer’s V is not statistically significant (at the .05 level) 19 times and it exceeds .3 only twice. One wonders how many sociological findings would survive such stringent bivariate tests in small samples. An early summary of the revisionist consensus appears in Oberschall’s textbook (1973, 307): “the majority of rioters were a representative cross section of the youth and adult males resident in the neighbourhoods in which rioting occurred and were not composed of habitual criminals, recent migrants, the unemployed and uneducated under-class.” The cited evidence does not provide unequivocal support for all these assertions. Just over half the arrested rioters had a criminal record, even if that does not necessarily denote habitual criminality (Fogelson and Hill 1968, 247). Although most rioters were not unemployed, surveys of Newark and Detroit (Caplan and Paige 1968) actually provided evidence that unemployment increased the probability of an individual rioting within riot-affected areas. Most importantly, Oberschall’s statement avoids the first-order question of whether rioters were more deprived than the population of the city as a whole, or equivalently whether rioting tended to occur in deprived neighbourhoods. Oberschall’s (1968, 328) own analysis of the Watts riot confirms its “lower-class character.”
More compelling evidence against deprivation comes from multivariate analysis of variation across and within American cities. Deprivation has no effect or a negative effect—the opposite from that predicted—on rioting (Herman 2005, 152; Olzak and Shanahan 1996, 949; Olzak et al. 1996, 604). Note though that nonwhite unemployment is incorporated into one of Olzak and Shanahan’s (1998, 69) preferred explanatory variables, competition. And the percentage or number of unemployed nonwhites significantly increases the probability of a riot (DiPasquale and Glaeser 1998, 69; Myers 1997, 107). Within cities, deprivation has no additional effect on fatalities when ethnic competition is taken into account (Bergesen and Herman 1998, 50; Herman 2005, 71, 110, 152). In sum, deprivation receives little support, though the evidence against it is less compelling than is portrayed.
Relative deprivation is a distinctive explanation. People are more likely to riot if their conditions are relatively worse than those a comparison group. For the 1960s riots, for example, blacks would riot where their conditions were worse relative to whites. Although the theoretical logic is compelling, there is very little empirical support (e.g. Caplan and Paige 1970, 20; Lieske 1972, 1327; Olzak and Shanahan 1996, 949; an exception is Morgan and Clark 1973, 621). This explanation is more difficult to test, because the scope of comparison remains unspecified by theory. It properly requires evidence on subjective beliefs before the riot; surveys and interviews undertaken afterwards are inevitably influenced by the riot itself. Without such evidence, a proxy can be constructed from the relative affluence of surrounding areas.
Ethnic competition has emerged as the master variable in recent literature on American riots. Olzak (1992, 3) argues that “ethnic conflicts and protests erupt when ethnic inequalities and racially ordered systems begin to break down.” The mechanism here is threat: people in one group are more likely to riot if they feel another group has designs on their prerogatives (Blumer 1958). The findings are complex. Race riots were more likely in cities with higher levels of segregation between whites and nonwhites, yet also where segregation was decreasing (Olzak et al. 1996, 604). Within a city, riot fatalities tended to occur in tracts where the black percentage was high and increasing; in Los Angeles in 1992, though, fatalities happened where the black percentage was declining (Bergesen and Herman 1998, 50; Herman 2005, 71, 110, 152). These results make sense theoretically where they accord with a majority threatened by an increasing minority, such as whites threatened by blacks in Chicago in 1919 or blacks (the majority in the local area) threatened by Latinos in Los Angeles in 1992. In Newark and Detroit in 1967, however, the interpretation of these results seems less straightforward.
Ethnic competition can hardly be used to explain a riot which lacks ethnic characteristics. We conjecture, however, that ethnic composition could be associated with social disorganization. Although the literature often specifies “breakdown” as a distinct explanation (e.g. Useem 1998), it is difficult to distinguish empirically from deprivation and lacks theoretical amplification. We use the concept of “social disorganization” (Shaw and McKay 1942) as synonymous with low levels of social cohesion or social capital or collective efficacy.6 The mechanism linking this with rioting is the same as for crime: in a disorganized community, the law-abiding majority are not able to prevent or punish criminal actions by a minority of young people. This mechanism does not apply to a riot with widespread support,
6 The term appears only in Ernest Burgess’ introduction (Shaw and McKay 1942, ix, xi).
where the majority of the community approves of rioters attacking a minority. It could be relevant, however, where rioters destroy property and loot stores close to home, thus harming the majority of residents. Social disorganization is ideally measured by survey questions (Warren 1969). In the absence of a direct measure, one proxy is ethnic fractionalization: the extent to which people belong to different ethnic groups. (This must be distinguished from “diversity” as a euphemism for the proportion of nonwhites.) Several American studies find that people in more fractionalized communities are less trusting and less likely to participate in collective activities (Alesina and Ferrara 2000; 2002; Putnam 2007). Whether this finding applies to Britain is hotly debated (Demireva and Heath 2014; Laurence 2011; Sturgis et al. 2010). Another proxy for social disorganization is electoral turnout (Putnam 1993).
Political grievances provide a final explanation. Grievances over policing are the most obvious, given that so many riots are precipitated by an incident in which the police are seen to have acted unjustly (e.g. NACCD 1968, 69; Keith 1993). Note, however, that the vast majority of such incidents do not trigger a riot. There is surprisingly little evidence that policing explains cross-sectional variation. Variables such as the number of police officers or the expenditure on police cannot capture the quality of policing (DiPasquale and Glaeser 1998; Morgan and Clark 1973). In the American context, the ratio of black police officers to black population is pertinent, but appears only in bivariate analysis (Lieberson and Silverman 1965, 896). When surveyed retrospectively, rioters are more aggrieved by the police than are nonparticipants (e.g. Murphy and Watson 1970: 186). Such evidence is problematic because the grievances may be the result, rather than the cause, of participation in the riot (McPhail 1971). More fundamentally, even if grievances predated the riot, they could reflect criminality on the part of people who subsequently rioted as well as malpractice on the part of the police. (As observed above, rioters are more likely to have a criminal record.) Ideally, then, we want evidence on grievances amongst the community as a whole, predating the riot. Perez, Berg, and Myers (2002) use a survey conducted in 1966 to compare policing in San Francisco and Boston: respondents (blacks and whites alike) were more likely to blame rioting on police brutality in the former than the latter, and the former subsequently experienced worse riots than the latter.7
Grievances over the provision of public services do not feature in the sociological literature, no doubt because the American riots of the 1960s coincided with a period of increasing government expenditure. Indeed, riots were more likely in cities with higher
7 A riot had occurred in San Francisco immediately before the survey (New York Times, September 29, 1966), which may have affected responses.
expenditure (DiPasquale and Glaeser 1998, 67; Lieske 1978, 1331). (Racial disparity in public services has not been tested.) Nevertheless, grievances over cuts in public services provide a plausible explanation for the London riot of 2011, given the testimony of rioters and the timing of the riot after the accession of a Conservative government (in 2010) committed to austerity. At the most aggregate level, with country-year as the unit of analysis, there is suggestive evidence that budget cuts increase protest, including riots (Ponticelli and Voth 2011).
From this review of explanations we draw five hypotheses. Rioters came from areas which were:
1. economically deprived 2. surrounded by prosperous areas 3. socially disorganized 4. characterized by poor relations with police 5. subjected to cuts in public expenditure
Hypothesis 1 is formulated in accordance with commentary on the London riot, though the conventional sociological view would not expect it to hold.
Data and Method The Metropolitan Police provided an anonymized list of 3,552 individuals whom they arrested in connection with the 2011 riot. This police force covers the conurbation of Greater London, with a population of 8.2 million.8 We filter this list by three criteria. First, we exclude individuals arrested for crimes committed after August 10, whose offences—such as handling stolen goods—did not imply participation in the actual riot. Second, we exclude individuals who were arrested but not subsequently charged in court. This exclusion distinguishes our study from previous analyses of arrest data (e.g. Fogelson and Hill 1968; Baudains, Braithwaite, and Johnson 2013).9 Third, we necessarily exclude individuals for whom no postcode was recorded (or whose postcode could not be identified). This reduces the number of individuals to 1,674. The most common offences were burglary and violent disorder10 (in which three or more people “use or threaten unlawful violence”). 8 A small portion of the financial district, known as the City of London (with only 7,400 residents), is under the jurisdiction of a separate police force. This witnessed no rioting and is excluded from our analysis. 9 There is no information on the ultimate verdict. In the English riots overall, only one in five of those charged were acquited (Ministry of Justice 2012, 4). 10 We choose not disaggregate by type or day of offence because this would lead to reliability issues; someone who was charged with a burglary committed on the third day, for example, may have committed other offences and may have been involved on previous days.
How representative is this “sample” of rioters? Oberschall (1968, 327) warns that “those arrested are more likely to be representative of the groups which were milling about or looting than of the activists.” After all, a riot signifies that the police have lost control—and so are individuals at the vortex of the riot are relatively invulnerable to arrest. Fortunately for our purpose, the police devoted unprecedented resources to subsequent investigations (Metropolitan Police 2012, 124-29). Hundreds of detectives were assigned, and they exploited CCTV which is ubiquitous in Britain. Almost two-thirds of our sample were arrested after August 10, extending to January 2012. We should acknowledge two offsetting biases in these later investigations. On one hand, the police could more readily identify suspects already known to them from previous brushes with the law (if the police tended to round up the usual suspects, we minimize this bias by restricting the sample to those against whom evidence was sufficient to bring them to court). On the other hand, experienced criminals were more adept at avoiding arrest, for example concealing themselves from CCTV (Harding 2012, 208-9). Seven out of ten of those arrested for riot offences in London had a prior criminal record, albeit this includes infractions too minor to warrant prosecution (Metropolitan Police 2012, 14).11 This accords nicely with 270 English rioters interviewed by Lewis et al. (2011, 14), of whom 68% admitted to a criminal record. Furthermore, the scale of the police investigations ensures that our sample of rioters is a significant fraction of the total number of rioters. Although any estimate of the total is hazardous, it must have been on the order of ten thousand in London.12
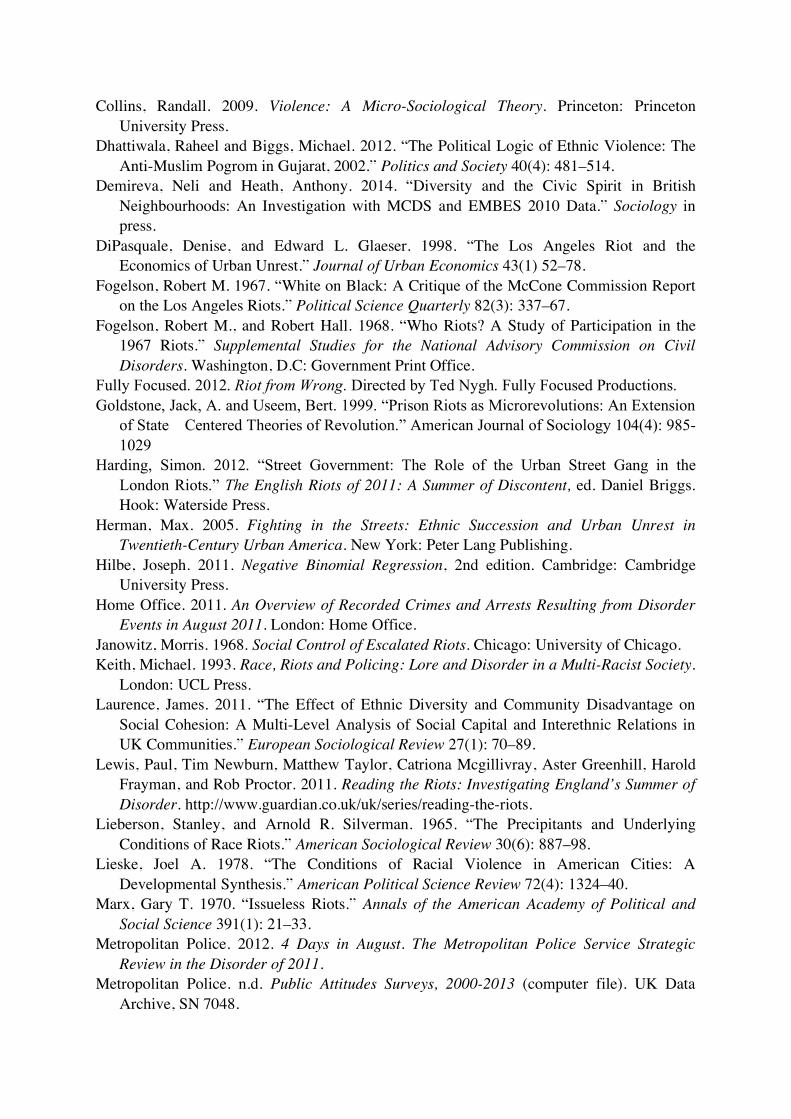
The great virtue of our data is that British postcodes provide exceptional spatial resolution. The residential addresses of rioters are matched with the smallest geographical unit available from the Census, the “output area.” At the 2011 Census—undertaken just four months before the riot—there are 25,022 of these neighbourhoods (as they will be termed) in London, with a median of 321 residents. Of our sample, 3% lived outside London. The remaining 1,620 individuals were located in 1,375 neighbourhoods (5% of the total). Figure 1 maps the geographical distribution, showing borough boundaries. The most flexible estimation strategy is to use a hurdle model with two components: logistic regression to predict whether any rioters came from the neighbourhood; if there were any, zero-truncated negative binomial regression to predict their number (Hilbe 2011). The second component has little power—only 199 neighbourhoods had more than a single rioter, and the maximum 11 In Britain, the police can issue a caution, reprimand, or warning to someone who admits guilt; no penalty is attached. 12 Singh et al. (2012, 16) estimate 13,000-15,000 people “actively involved” in the riots throughout England, though without explaining their method.
number of rioters was six—and so we focus on the logistic regression.13 This enables us to incorporate a multilevel structure, with neighbourhoods nested within 624 electoral wards, in turn nested within 32 boroughs. Boroughs are units of governance within London, with elected councils and control over local services.
[FIGURE 1 HERE] We estimate the probability of neighbourhoods having one or more rioters, piwb, where
neighbourhoods (i) are grouped by ward (w) and borough (b):
!
ln piwb1" piwb
#
$ %
&
' ( = )0 + ln(Piwb ) + )k* Xkiwb ++wb
(2) ++b(3)
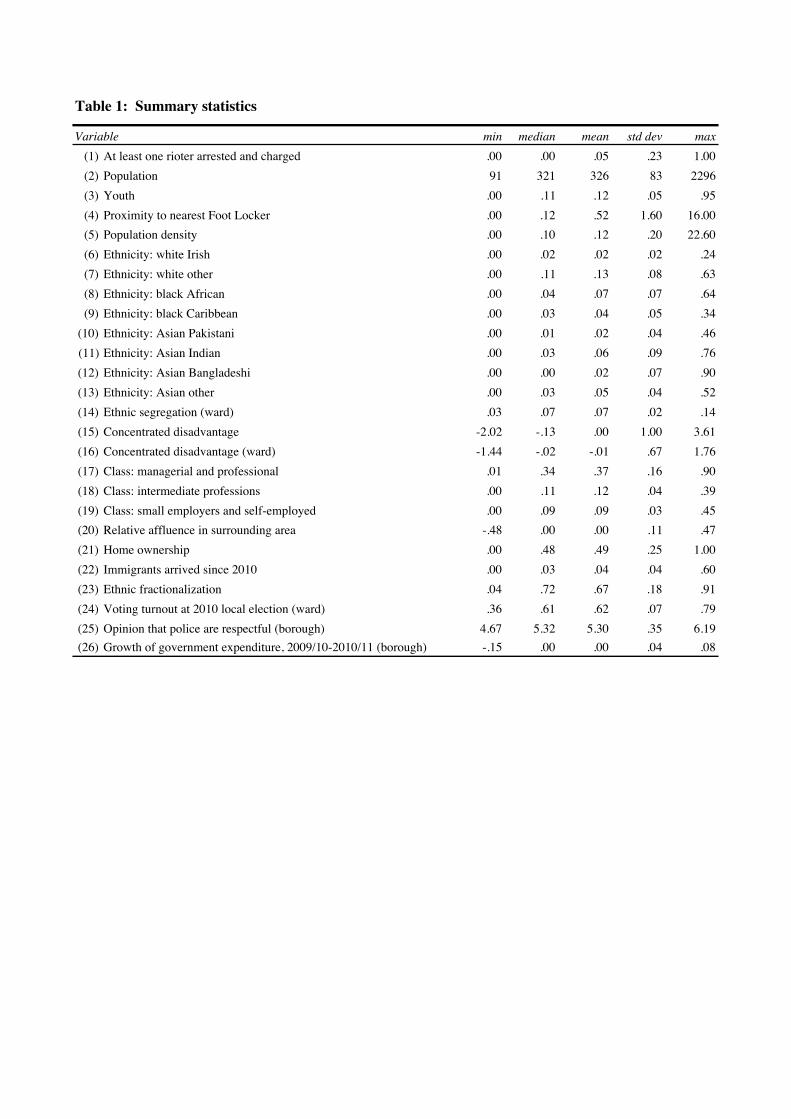
P is the population and Xk are independent variables. To account for the clustering of neighbourhoods within wards and boroughs, random intercepts !(2) and !(2) are entered at each level, drawn from the Normal distribution with mean zero and variance "(2) and "(3) respectively. Most independent variables are measured at the neighbourhood level.14 Table 1 provides the summary statistics (and Appendix Table 1 the correlations).
[TABLE 1 HERE] For Hypothesis 1, deprivation, the chief measure is an index of concentrated disadvantage
(inspired by Sampson, Raudenbush, and Earls 1999). It is constructed from six variables: unemployment, adults without educational qualifications, employment in routine and semi-routine occupations, overcrowded housing, council housing (equivalent to public housing in the United States), and single parents. These variables are combined using principal-component factor analysis (see Appendix Table 2). Combining the six variables into an index is appropriate because they are so highly correlated. We also include deprivation at the ward level, the weighted mean of concentrated disadvantage within the ward’s neighbourhoods. Aside from concentrated disadvantage, we consider the inverse of deprivation by including the proportion of the occupied population in each of the three top occupational classes (out of five): managerial and professional; intermediate occupations; small employers and self-employed. (The bottom class is subsumed within the index of concentrated disadvantage.) These three variables are expected to reduce rioting.
For Hypothesis 2, relative deprivation, we create a proxy variable for the extent to which the neighbourhood is surrounded by more affluent neighbourhoods:
13 Plain negative binomial regression on the number of rioters does not permit random intercepts at higher levels (Rabe-Hesketh and Skrondal 2008, 394). It yields essentially identical results to those shown in Table 2. 14 Measuring them instead at higher levels of aggregation, closer to the American census tract, produces a markedly inferior model (corrected AIC increases by 278 over Model 3).
!
Riwb =
A j " Aij=1
J
#
J
where A is the proportion of the occupied population in the top class (managers and professionals), for all neighbourhoods (j = 1 ... J) within a certain distance of neighbourhood iwb (measured from each centroid). After experimentation, 1,500 meters (.93 mile) is used for the distance threshold.
Social disorganization, Hypothesis 3, is captured by four variables. One is the proportion of residents who had immigrated to the United Kingdom since 2010. Another is the proportion of households owned (outright or mortgaged), which is expected to reduce rioting. Another is ethnic fractionalization. The census allowed respondents to choose from among 18 different ethnic groups (detailed below). The standard Herfindahl or Simpson index is calculated, to yield the probability that two individuals randomly drawn from the neighbourhood belong to different ethnic groups.15 Finally, we measure the proportion of the eligible electorate who voted in London’s local elections in May 2010.16 This is expected to reduce rioting.
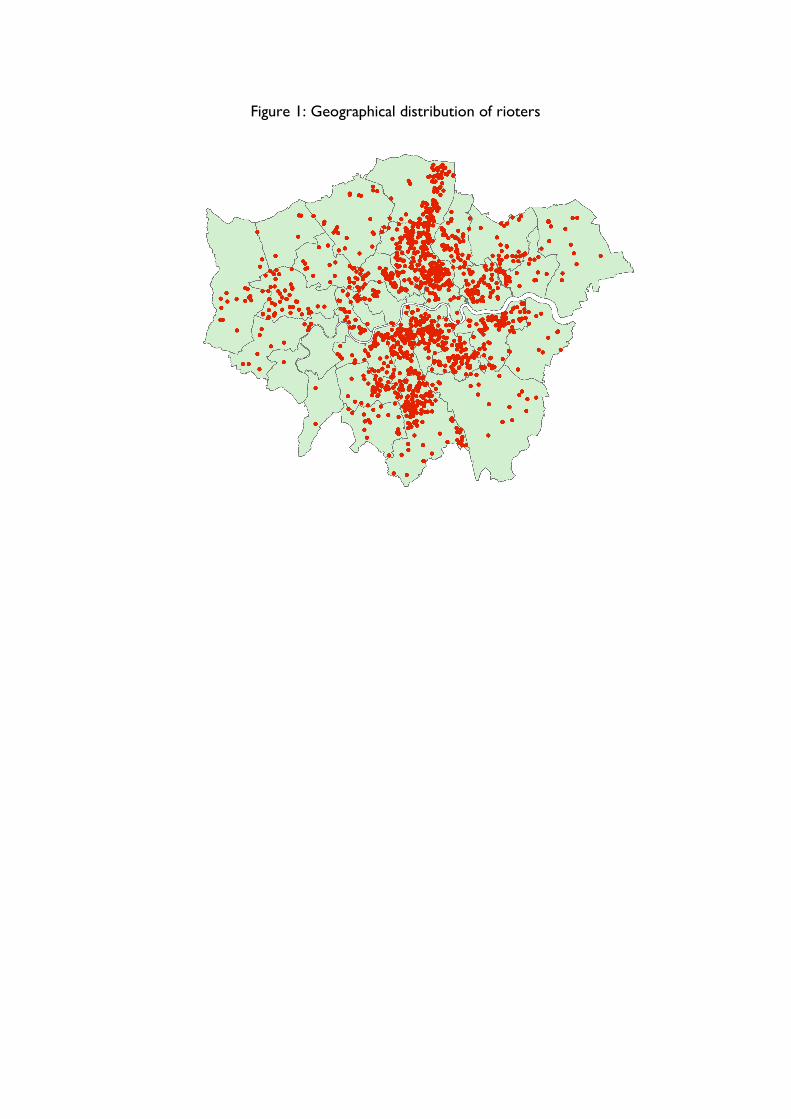
Hypotheses 4 and 5, on political grievances, are tested by variables at the borough level. With only 32 boroughs, it is necessary to choose a single variable for each. The Metropolitan Police regularly survey the public on their attitudes towards the police. We focus on the question “How well do you think the Metropolitan Police treat people with respect?” with answers on a scale ranging from 1 (“not at all well”) to 7 (“very well”). We aggregate over 6 months (January to June 2011) to boost the sample size for each borough (around 250). The average score ranges across boroughs from 4.7 to 6.2. This variable is expected to reduce rioting. For Hypothesis 5, we use net current expenditure of each borough’s local authority.17 This expenditure is mainly funded from central government, with a small portion raised from local taxes. Local expenditure is dominated by education and social care. We calculate the increase in net current expenditure for the financial year ending in March 2011 (compared to the year ending in March 2010). It ranges from -15%, representing a significant cut, to 8%. This variable is expected to reduce rioting.
15 Fractionalization computed instead from five coarser ethnic categories (white, black, Asian, mixed, other) is highly correlated (r = .92) and makes no difference to the results. Neither logging nor adding a quadratic term improves AIC. 16 http://data.london.gov.uk/datastore/package/borough-council-election-results-2010. 17 “Revenue Outturn Summary” at http://www.gov.uk/government/collections/local-authority-revenue-expenditure-and-financing.
Aside from the hypotheses, we incorporate ethnicity because of its importance in the sociological literature. The British census employs a detailed classification. For example, “Black/African/Caribbean/Black British” is subdivided into three categories: “African,” “Caribbean,” and “Other” (to be written in). We enter all categories exceeding 2.5% of London’s population (treating white British as reference category). It is crucial to remember that Caribbean, for example, refers to those who categorized themselves as such; it does not imply lack of British identity or foreign birth. Each ethnic category is expressed as a proportion of the total neighbourhood population. Given the importance of segregation between blacks and whites in the literature on the American riots of the 1960s, we also enter an index of multi-group segregation, Theil’s information theory index (Reardon and Firebaugh 2002). This measures the extent to which ethnic groups within the ward are segregated by neighbourhood.
Three control variables are included. Rioters are always predominantly young, and so we enter the proportion of the population aged between 16 and 24.18 Rioters tend to target locations close to home; the median distance to the location of the criminal offence was about 2 km (Baudains, Braithwaite, and Johnson 2013, 266). People living far away from potential looting opportunities should be less likely to participate. As a proxy for significant concentrations of retail stores, we use locations of the 24 Foot Locker outlets in London.19 This was a prominent chain targeted for looting (Briggs 2011; Becket 2012; Lewis et al. 2011, 28). For each neighbourhood, we compute distance to the nearest store. The proximity variable is calculated as one over the square of distance.20 We expect proximity to increase rioting. Finally, we enter population density, in thousands per hectare, expecting this to increase rioting.
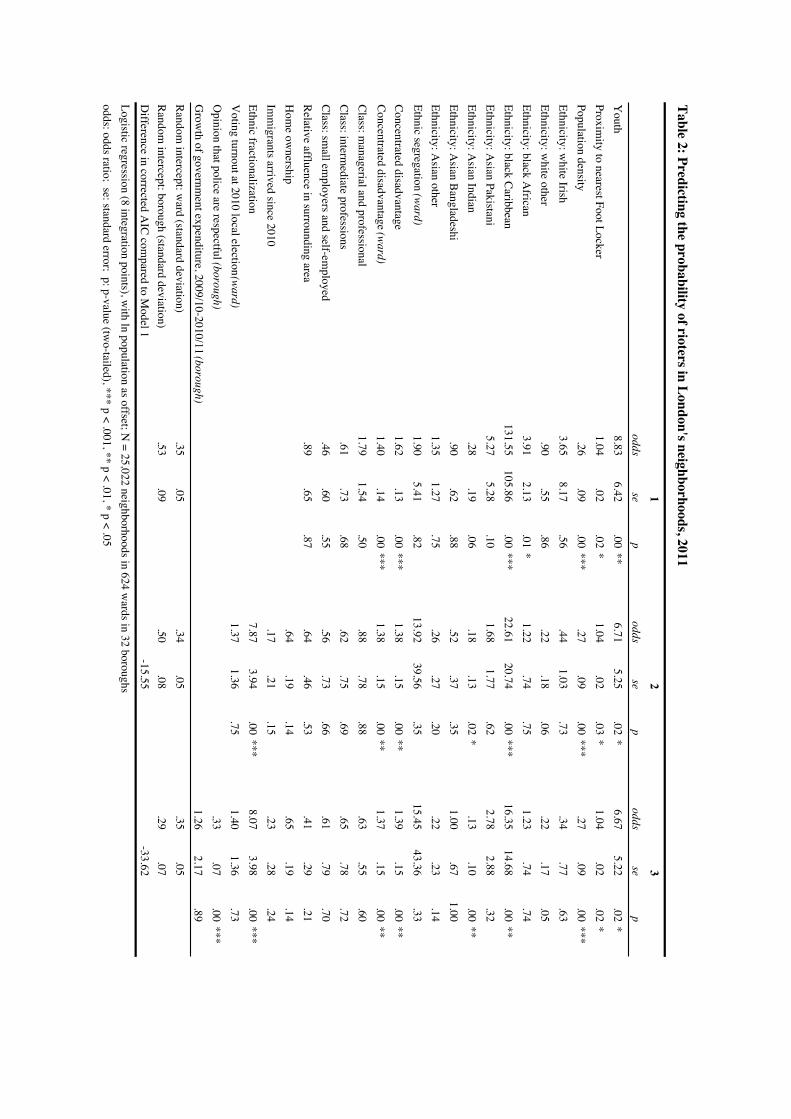
Results Table 2 shows the estimates, expressing coefficients as odds ratios. Model 1 begins with Hypotheses 1 and 2; Model 2 adds Hypothesis 3; Model 3 adds Hypotheses 4 and 5. Successive models represent a substantial improvement, as indicated by reductions in corrected AIC; this criterion captures the tradeoff between fit and parsimony (Burnham and Anderson 2004). The estimates for the square root of "(2) and "(3) reveal significant similarity 18 The sex ratio does not vary appreciably across neighborhoods. 19 A list of stores within London was compiled using an online store locator available at http://www.footlocker.eu/en/gb/k/store-locator.aspx. 20 Distances less than 250 meters are treated as 250, which is approximately the radius of the average neighborhood. Other functional forms, such as square root of distance or inverse distance prove inferior (e.g. Andrews and Biggs 2005; Myers 1997).
(unexplained by independent variables) among neighbourhoods within a ward and among wards within a borough. As expected, the probability of rioting increases with the proportion of young people and with the proximity of opportunities for looting. Population density unexpectedly reduces the probability of rioting.
[TABLE 2 HERE] In Model 1, Hypothesis 1 is strongly supported. Concentrated disadvantage greatly
increases the probability of rioting, and this effect is found both at the neighbourhood and at the ward level. Other variables for deprivation are not statistically significant. Hypothesis 2 is not supported, as the proxy for relative deprivation has no discernible effect. Even controlling for deprivation, rioting is strongly associated with people identifying as African and even more by those identifying as Caribbean, compared to white British (the difference between the two is statistically significant, p < .001). The marked difference between the two black groups reveals the utility of making finer ethnic distinctions. Rioting is also more associated with people of Pakistani origin than with those of Indian origin (the difference is statistically significant, p = .029).
In Model 2, Hypothesis 3 is supported by the strong positive effect of ethnic fractionalization.21 This variable also dramatically reduces the association between the two black ethnic groups and rioting. In other words, blacks tend to live in areas with high ethnic diversity. Controlling for fractionalization, the presence of people of Indian descent significantly reduces the probability of rioting compared to the presence of white British. The remaining variables for social disorganization have no discernible effect.
In Model 3, Hypothesis 4 is strongly supported. In boroughs where people felt they had the respect of police, rioting was less likely. Hypothesis 5 is not supported, as local government expenditure had no apparent effect. Hypotheses 1 and 3 are unaffected, and ethnic composition still has significant effects. The relative magnitude of these effects can be judged in comparison to the predicted probability of rioters coming from a “typical” neighbourhood, with all variables set at the median: this probability is .036. At the 10th percentile of concentrated disadvantage in both the neighbourhood and the ward, the predicted probability falls by more than half to .016. At the 90th percentiles of both, the predicted probability more than doubles to .078. Figure 2 shows how predicted probability varies with ethnic fractionalization, plotting observed values and highlighting the 10th, 50th, and 90th percentiles. Figure 3 shows how it varies with public opinion about the police.
21 The same measure of fractionalization at ward level is not statistically significant. Presumably this explains why Baudains, Braithwaite, and Johnson (2013, 271) find only a marginal effect.
[FIGURES 2 AND 3 HERE] One potential concern is the small number of boroughs. The result for public opinion
about the police can be tested by dropping each borough in turn from Model 3. The odds ratio hardly changes, ranging from .30 to .36. Boroughs are likely to differ systematically in ways not measured by the two independent variables. A variant of Model 2 can be estimated with a separate intercept for each borough. Haringey, where Duggan lived, has one of the highest intercepts. Nevertheless, this makes no difference to the results (Model 4 in Appendix Table 3).
Finally, it is worth briefly considering the second component of the hurdle model: predicting the number of rioters, conditional on there being at least one. As mentioned, this zero-truncated negative binomial regression is less informative because it is derived only from 1375 neighbourhoods with one or more rioters. (All boroughs are represented, albeit some by very few neighbourhoods.) Only three variables are statistically significant at the .05 level (Model 5 in Appendix Table 3). The rate of rioting increases with the proportion of people identifying as Asians of Pakistani descent. This estimate depends on a small number of neighbourhoods where they comprise a significant minority, and so should be taken with caution. The other two results lend further support to Hypotheses 1 and 4. The rate of rioting increases with neighbourhood deprivation. Boroughs where people judge the police to treat them with respect have a lower rate of rioting.
Discussion Before discussing the implications of these findings, we should reiterate their limitations. Our analysis assumes that people who were arrested and charged for crimes during the riot provide a tolerable approximation of the location of actual rioters. Unlike other studies using arrest data, we exclude cases where there was insufficient evidence to bring a charge. This makes our analysis less vulnerable to one concern, that the police arrest people without real evidence of their involvement. It is still vulnerable, of course, to the concern that many rioters escape detection.
Our analysis is ecological, identifying the characteristics of small neighbourhoods which make the presence of rioters more or less likely. The analysis requires geographical variation. This restriction might explain the lack of support for Hypothesis 5, measured by local authorities’ expenditure. In England, the bulk of expenditure is controlled by central government, and it certainly has greater salience. The abolition of the Education Maintenance Allowance, paid to teenagers (aged 16 to 19) who stayed in school, was mentioned by rioters in subsequent interviews (Lewis et al. 2011, 25; Morrell et al. 2011, 7). At the time of the
riot, most payments had not yet ceased. Such policy changes cannot be incorporated into our analysis. Therefore we do not conclude that government policy was unimportant in explaining the riot, only that we cannot detect such an effect across local authorities. Similarly, the lack of support for Hypothesis 2 does not license the conclusion that inequality was unimportant in explaining the riot, only that we cannot detect such an effect using local disparities in class composition.
Rioting varied with a neighbourhood’s ethnic composition, even after taking into account many other characteristics. There could be suspicion that the police disproportionately targeted blacks for arrest, but this is hard to reconcile with the disparity found between those identifying as African and those identifying as Caribbean. This disparity surely reflects the long history of conflict between police and Caribbean immigrants, going back to the 1950s, which reached its nadir in the riots of the 1980s (White 2001, 295-303). It is important to emphasize that London’s black population is not nearly as segregated as in American cities (Peach 1996). Of those identifying as Caribbean, only 4% live in a neighbourhood where blacks are the majority. This is why, despite the overrepresentation of blacks among those arrested, the riot did not manifest the characteristics of an ethnic riot. One methodological point is worth making. The significant differences within coarse ethnic categories—Asian as well as black—reveal the superiority of detailed categories as used in the British census.
Deprivation emerges as an important explanation for variation across London. The probability of rioters was increased by deprivation both in the immediate neighbourhood and in the wider area, the ward.22 These findings amplify what is known from qualitative and quantitative studies of the 2011 riot, but are hard to square with the rejection of deprivation in the sociological literature. As Useem (1998) observes, the case against deprivation has been exaggerated. It may be true that rioters were no more deprived than their neighbors who did not take part—but that proposition does not bear on the question of whether rioters were more likely to come from deprived neighbourhoods across the city as a whole, or equivalently whether rioters were more deprived than the city’s overall population. In American cities, areas where blacks predominate are almost invariably poor; indeed, proportion black is used as a measure of concentrated disadvantage (Sampson, Raudenbush, and Earls 1999). The overlap surely hinders any attempt to distinguish poverty from race in American ethnic riots. It is possible, by contrast, in London. Our results complement Caren’s
22 We also conducted a separate cross-city analysis of 2011 riots and found that deprivation was a significant factor.
(2011) cross-national time-series analysis, which suggests that riots tend to occur in economies undergoing recession.
Even after accounting for many other variables, rioting varied with public opinion about the police. This finding does not simply repeat what is known from rioters’ testimony. Our variable has two advantages. It reflects public opinion before the riot happened. Furthermore, it predominantly reflects the views of people who were not to take part in the riot. We suggest that where police had worse relations with the public, rioting against the police attracted less disapproval from the local community. Certainly there is strong evidence that anger at the police was not simply a justification advanced by rioters, but reflected real variation across London.
The most surprising finding is the association between ethnic fractionalization and rioting. Neighbourhoods with greater ethnic diversity were more likely to produce rioters. This we interpret as evidence for social disorganization. Disorganization—lack of collective efficacy at the community level—is conducive to crime (e.g. Sampson 2012). Young people experienced in crime were surely more likely to commit crimes during the riot. Note that disorganization at the community level is compatible with highly organized gangs (Shaw and McKay 1942, 436). In the London riot, criminal gangs exploited the opportunity and even arranged a truce to enable them to roam beyond their normal territories (Harding 2012). The Metropolitan Police classified 19% of those arrested as gang members, though it is not clear how membership is defined (Home Office 2011, 5). Aside from the enduring effect of social disorganization on crime, disorganization would have made it harder for parents and neighbours to prevent young people from joining the riot. Attacks on the police had a degree of legitimacy in some communities—above all in Haringey on the first night—but looting and arson did not. Interviews with people who did not participate in the riot reveal the importance of parental control (Morrell et al. 2011, 43-45). There are good reasons, then, to argue that rioting increased with social disorganization.
Social disorganization is not measured directly in our analysis, but only by proxy. We assume that it goes along with (because it is partly caused by) ethnic fractionalization. This assumption is controversial, especially in Britain. Ecological analysis of survey data, with trust and other dependent variables, provides mixed results. Laurence (2011) finds that ethnic fractionalization reduces collective efficacy. By contrast, Sturgis et al. (2010) and Demireva and Heath (2014) argue that fractionalization has no discernible effect, once deprivation and other factors are taken into account. Both studies, however, make the effect disappear only by controlling for factors that would mediate between ethnic fractionalization and social
disorganization: recorded crime or fear of crime, and social contact. Thus they do not challenge the association posited here. If a sceptical reader rejects our association of ethnic fractionalization with social disorganization, then they must provide another explanation for the fact that rioting was more likely in more fractionalized neighbourhoods.
Conclusion Riots remain an enduring sociological puzzle: what causes the rules regulating public order to collapse, as large numbers attack others, destroy property, and steal goods? The London riot of 2011 is an important case because it was not really an ethnic riot, the subset of events which dominate the literature. This is not to say that ethnicity was insignificant: rioters were more likely to come from neighbourhoods with greater ethnic fractionalization—interpreted as a proxy for social disorganization—and with a higher proportion of people of Caribbean descent. Nevertheless, rioters came from no single ethnic group, and ethnicity did not shape their choice of targets. The London riot of 2011 is also valuable for yielding unique data on where rioters lived and on public attitudes towards the police.
Our findings provide rigorous confirmation of two accepted explanations for this event: rioters came from economically deprived areas and from boroughs where policing had less legitimacy. We also identify an unexpected association between rioting and ethnic diversity, which warrants further research. It will be important to test the implications of our argument equating fractionalization with disorganization. One way of doing this would be to investigate the association between fractionalization and crime patterns—assault and theft, for example—before the riot. Crime statistics, of course, pose formidable problems of interpretation, because they depend on public confidence in the police and on police activity as well as actual distribution of crime. In addition, one would want to know not where crime was committed but rather where the perpetrators lived.
Our main contribution to the literature on riots is to challenge—echoing Piven and Cloward (1992) and Useem (1998)—the rejection of economic deprivation and of social disorganization as potential explanations for rioting. As sociologists in the 1970s defined the new field of social movements, they demarcated protest from crime (Oliver 2008), and focused explanation on resources, organizations, and networks. This perspective yielded tremendous insights, but not without blindspots. Aside from theoretical predispositions to downplay deprivation and disorganization, the American race riots of the 1960s may have reflected two distinctive features of the society from which they emerged. One was extreme segregation of blacks and whites. The other was exceptional political mobilization amongst the black populace, in the wake of Civil Rights and Black Power Movements. In this context,
perhaps economic deprivation had little explanatory purchase. But that finding would not warrant the rejection of deprivation in other social contexts. These conjectures can be tested with the investigation of different types of riots across various contexts.
References Abudu, Margaret J. G., Walter J. Raine, Stephen L. Burbeck, and Keith K. Davison. 1972.
“Black Ghetto Violence: A Case Study Inquiry into the Spatial Pattern of Four Los Angeles Riot Event-Types.” Social Problems 19(3): 408–26.
Alesina, Alberto, and Eliana La Ferrara. 2000. “Participation in Heterogeneous Communities.” The Quarterly Journal of Economics 115(3): 847–904.
Alesina, Alberto, and Eliana La Ferrara. 2002. “Who Trusts Others?” Journal of Public Economics 85(2): 207–34.
Alesina, Alberto, and Eliana La Ferrara. 2005. “Ethnic Diversity and Economic Performance.” Journal of Economic Literature 43(3): 762–800.
Andrews, Kenneth. T., and Michael Biggs. 2006. “The Dynamics of Protest Diffusion: Movement Organizations, Social Networks, and News Media in the 1960 Sit-Ins.” American Sociological Review 71(5): 752–77.
Baudains, Peter, Alex Braithwaite, and Shane D. Johnson. 2013. “Target Choice During Extreme Events: A Discrete Spatial Choice Model of the 2011 London Riots.” Criminology 51(2): 251–85.
BBC. 2012. The Riots: In Their Own Words. Directed by Fatima Salaria. London: BBC. Benyon, John, and John Solomos (eds). 1987. The Roots of Urban Unrest. Oxford:
Pergamon. Bergesen, Albert, and Max Herman. 1998. “Immigration, Race, and Riot: The 1992 Los
Angeles Uprising.” American Sociological Review 63(1): 39–54. Biggs, Michael. 2003. “Positive Feedback in Collective Mobilization: The American Strike
Wave of 1886.” Theory and Society 32(2): 217–54. Blumer, Herbert. 1958. “Race Prejudice as a Sense of Group Position.” Pacific Sociological
Review 1(1): 3–7. Briggs, Daniel. 2012. “Frustrations, Urban Relations and Temptations: Contextualising the
English Riots.” The English Riots of 2011: A Summer of Discontent, ed. Briggs. Hook: Waterside Press.
Burnham, Kenneth P. and David R. Anderson. 2004. “Multimodel Inference: Understanding AIC and BIC in Model Selection.” Sociological Methods and Research 33(2), 261–304.
Caplan, Nathan, and Jeffery M. Paige. 1968. “A Study of Ghetto Rioters.” Scientific American 219(2): 15–21.
Caren, Neal. 2011. “Bringing Adversity Back In: Economic Breakdown and the Pace of Collective Action.” Paper presented to the American Sociological Association’s annual meeting.
Chicago Commission on Race Relations. 1922. The Negro in Chicago: A Study of Race Relations and a Race Riot. Chicago: University of Chicago Press.
Collins, Randall. 2009. Violence: A Micro-Sociological Theory. Princeton: Princeton University Press.
Dhattiwala, Raheel and Biggs, Michael. 2012. “The Political Logic of Ethnic Violence: The Anti-Muslim Pogrom in Gujarat, 2002.” Politics and Society 40(4): 481–514.
Demireva, Neli and Heath, Anthony. 2014. “Diversity and the Civic Spirit in British Neighbourhoods: An Investigation with MCDS and EMBES 2010 Data.” Sociology in press.
DiPasquale, Denise, and Edward L. Glaeser. 1998. “The Los Angeles Riot and the Economics of Urban Unrest.” Journal of Urban Economics 43(1) 52–78.
Fogelson, Robert M. 1967. “White on Black: A Critique of the McCone Commission Report on the Los Angeles Riots.” Political Science Quarterly 82(3): 337–67.
Fogelson, Robert M., and Robert Hall. 1968. “Who Riots? A Study of Participation in the 1967 Riots.” Supplemental Studies for the National Advisory Commission on Civil Disorders. Washington, D.C: Government Print Office.
Fully Focused. 2012. Riot from Wrong. Directed by Ted Nygh. Fully Focused Productions. Goldstone, Jack, A. and Useem, Bert. 1999. “Prison Riots as Microrevolutions: An Extension
of State Centered Theories of Revolution.” American Journal of Sociology 104(4): 985-1029
Harding, Simon. 2012. “Street Government: The Role of the Urban Street Gang in the London Riots.” The English Riots of 2011: A Summer of Discontent, ed. Daniel Briggs. Hook: Waterside Press.
Herman, Max. 2005. Fighting in the Streets: Ethnic Succession and Urban Unrest in Twentieth-Century Urban America. New York: Peter Lang Publishing.
Home Office. 2011. An Overview of Recorded Crimes and Arrests Resulting from Disorder Events in August 2011. London: Home Office.
Janowitz, Morris. 1968. Social Control of Escalated Riots. Chicago: University of Chicago. Keith, Michael. 1993. Race, Riots and Policing: Lore and Disorder in a Multi-Racist Society.
London: UCL Press. Laurence, James. 2011. “The Effect of Ethnic Diversity and Community Disadvantage on
Social Cohesion: A Multi-Level Analysis of Social Capital and Interethnic Relations in UK Communities.” European Sociological Review 27(1): 70–89.
Lewis, Paul, Tim Newburn, Matthew Taylor, Catriona Mcgillivray, Aster Greenhill, Harold Frayman, and Rob Proctor. 2011. Reading the Riots: Investigating England’s Summer of Disorder. http://www.guardian.co.uk/uk/series/reading-the-riots.
Lieberson, Stanley, and Arnold R. Silverman. 1965. “The Precipitants and Underlying Conditions of Race Riots.” American Sociological Review 30(6): 887–98.
Lieske, Joel A. 1978. “The Conditions of Racial Violence in American Cities: A Developmental Synthesis.” American Political Science Review 72(4): 1324–40.
Marx, Gary T. 1970. “Issueless Riots.” Annals of the American Academy of Political and Social Science 391(1): 21–33.
Metropolitan Police. 2012. 4 Days in August. The Metropolitan Police Service Strategic Review in the Disorder of 2011.
Metropolitan Police. n.d. Public Attitudes Surveys, 2000-2013 (computer file). UK Data Archive, SN 7048.
McElroy, Jerome L., and Larry D. Singell. 1973. “Riot and Nonriot Cities An Examination of Structural Contours.” Urban Affairs Review 8(3): 281–302.
McPhail, Clark. 1971. “Civil Disorder Participation: A Critical Examination of Recent Research.” American Sociological Review 36(6): 1058–73.
McPhail, Clark. 1989. “Blumer’s Theory of Collective Behavior.” Sociological Quarterly 30(3): 401–23.
McPhail, Clark. 1994. “Presidential Address: The Dark Side of Purpose: Individual and Collective Violence in Riots.” The Sociological Quarterly 35(1): 1–32.
McPhail, Clark, and Ronald T. Wohlstein. 1983. “Individual and Collective Behaviors within Gatherings, Demonstrations, and Riots.” Annual Review of Sociology 9: 579–600.
Ministry of Justice. 2012. Statistical Bulletin on the Public Disorder of 6th to 9th August 2011: September 2012 update.
Morgan, William R., and Terry Nichols Clark. 1973. “The Causes of Racial Disorders: A Grievance-Level Explanation.” American Sociological Review 38(5): 611–24.
Morrell, Gareth, Sara Scott, Di McNeish, and Stephen Webster. 2011. The August Riots in England: Understanding the Involvement of Young People. London: NatCen.
Murphy, Raymond J. and James W. Watson. 1970. “The Structure of Discontent: Relationship between Social Structure, Grievance, and Riot Support.” The Los Angeles Riots: A Socio-Psychological Study, ed. Nathan Cohen. New York: Praeger Publishers.
Myers, Daniel. J. 2010. “Violent Protest and Heterogeneous Diffusion Processes: The Spread of US Racial Rioting from 1964 to 1971.” Mobilization 15(3): 289–321.
Myers, Daniel. J. 1997. “Racial Rioting in the 1960s: An Event History Analysis of Local Conditions.” American Sociological Review 62(1): 94–112.
Myers, Daniel. J. 2000. “The Diffusion of Collective Violence: Infectiousness, Susceptibility, and Mass Media Networks.” American Journal of Sociology 106(1): 173–208.
National Advisory Commission on Civil Disorders. 1968. Report of the National Advisory Commission on Civil Disorders. New York: National Advisory Commission on Civil Disorders.
Oberschall, Anthony. 1973. Social Conflict and Social Movements. Englewood Cliffs: N.J.: Prentice-Hall.
Oliver, Pamela E. 2008. “Repression and Crime Control: Why Social Movement Scholars Should Pay Attention to Mass Incarceration as a Form of Repression.” Mobilization 13(1): 1–24.
Olzak, Susan. 1992. The Dynamics of Ethnic Competition and Conflict. Stanford: Stanford University Press.
Olzak, Susan, and Suzanne Shanahan. 1996. “Deprivation and Race Riots: An Extension of Spilerman’s Analysis.” Social Forces 74(3): 931–61.
Olzak, Susan, Suzanne Shanahan, and Elizabeth H. McEneaney. 1996. “Poverty, Segregation, and Race Riots: 1960 to 1993.” American Sociological Review 61(4): 590–613.
Peach, Ceri. 1996. “Does Britain Have Ghettos?” Transactions of the Institute of British Geographers 21(1): 216–35.
Perez, Anthony Daniel, Kimberly M. Berg, and Daniel J. Myers. 2003. “Police and Riots, 1967-1969.” Journal of Black Studies 34(2): 153–82.
Piven, Frances Fox, and Richard A. Cloward. 1992, “Normalizing Collective Protest.” Frontiers in Social Movement Theory, ed. Aldon D. Morris and Carol McClurg Mueller. New Haven: Yale University Press.
Ponticelli, Jacopo, and Hans-Joachim Voth. 2011. “Austerity and Anarchy: Budget Cuts and Social Unrest in Europe, 1919-2008.” Discussion Paper, Centre for Economic Policy Research, London.
Putnam, Robert. 1993. Making Democracy Work: Civic Traditions in Modern Italy. Princeton, N.J.: Princeton University Press.
Putnam, Robert D. 2007. “E Pluribus Unum: Diversity and Community in the Twenty-First Century.” Scandinavian Political Studies 30(2): 137–74.
Rabe-Hesketh, Sophia, and Anders Skrondal. Multilevel and Longitudinal Modeling Using Stata. 2nd ed. College Station, Texas: Stata Press.
Riots, Communities, and Victims Panel. 2012. After the Riots: The Final Report of the Riots, Communities, and Victims Panel.
Rosenfeld, Michael J. 1997. “Celebration, Politics, Selective Looting and Riots: A Micro Level Study of the Bulls Riot of 1992 in Chicago.” Social Problems 44(4): 483–502.
Sampson, Robert J., Stephen W. Raudenbush, and Felton Earls. 1997. “Neighborhoods and Violent Crime: A Multilevel Study of Collective Efficacy.” Science 277(5328): 918–24.
Shaw, Clifford R., and Henry Donald McKay. 1942. Juvenile Delinquency and Urban Areas: A Study of Rates of Delinquency in Relation to Differential Characteristics of Local Communities in American Cities. Chicago: Chicago University Press.
Spilerman, Seymour. 1970. “The Causes of Racial Disturbances: A Comparison of Alternative Explanations.” American Sociological Review 35(4): 627–49.
Spilerman, Seymour. 1971. “The Causes of Racial Disturbances: Tests of an Explanation.” American Sociological Review 36(3): 427–42.
Spilerman, Seymour. 1976. “Structural Characteristics of Cities and the Severity of Racial Disorders.” American Sociological Review 41(5): 771–93.
Stott, Clifford, and Steve Reicher. 1998. “How Conflict Escalates: The Inter-Group Dynamics of Collective Football Crowd Violence.” Sociology 32(2): 353–77.
Sturgis, Patrick, Ian Brunton-Smith, Sanna Read, and Nick Allum. 2010. “Does Ethnic Diversity Erode Trust? Putnam’s ‘Hunkering Down’ Thesis Reconsidered.” British Journal of Political Science 41(1): 57–82.
Treadwell, James, Daniel Briggs, Simon Winlow, and Steve Hall. 2013. “Shopocalypse Now: Consumer Culture and the English Riots of 2011,” British Journal of Criminology 53(1), 1–17.
Useem, Bert. 1998. “Breakdown Theories of Collective Action.” Annual Review of Sociology 24: 215–38.
Wanderer, Jules J. 1969. “An Index of Riot Severity and Some Correlates.” American Journal of Sociology 74(5): 500–05.
Warren, Donald I. 1969. “Neighborhood Structure and Riot Behavior in Detroit: Some Exploratory Findings.” Social Problems, 16(4):464-84.
White, Jerry. 2001. London in the Twentieth Century: A City and Its People. London: Vintage Books.
Wilkinson, Steven I. 2009. “Riots.” Annual Review of Political Science 12: 329–43. Wilson, William Julius. 1987. The Truly Disadvantaged: The Inner City, the Underclass, and
Public Policy. Chicago: University of Chicago Press.
Figure 1: Geographical distribution of rioters
Table 1: Summary statistics
Variable min median mean std dev max(1) At least one rioter arrested and charged .00 .00 .05 .23 1.00(2) Population 91 321 326 83 2296(3) Youth .00 .11 .12 .05 .95(4) Proximity to nearest Foot Locker .00 .12 .52 1.60 16.00(5) Population density .00 .10 .12 .20 22.60(6) Ethnicity: white Irish .00 .02 .02 .02 .24(7) Ethnicity: white other .00 .11 .13 .08 .63(8) Ethnicity: black African .00 .04 .07 .07 .64(9) Ethnicity: black Caribbean .00 .03 .04 .05 .34
(10) Ethnicity: Asian Pakistani .00 .01 .02 .04 .46(11) Ethnicity: Asian Indian .00 .03 .06 .09 .76(12) Ethnicity: Asian Bangladeshi .00 .00 .02 .07 .90(13) Ethnicity: Asian other .00 .03 .05 .04 .52(14) Ethnic segregation (ward) .03 .07 .07 .02 .14(15) Concentrated disadvantage -2.02 -.13 .00 1.00 3.61(16) Concentrated disadvantage (ward) -1.44 -.02 -.01 .67 1.76(17) Class: managerial and professional .01 .34 .37 .16 .90(18) Class: intermediate professions .00 .11 .12 .04 .39(19) Class: small employers and self-employed .00 .09 .09 .03 .45(20) Relative affluence in surrounding area -.48 .00 .00 .11 .47(21) Home ownership .00 .48 .49 .25 1.00(22) Immigrants arrived since 2010 .00 .03 .04 .04 .60(23) Ethnic fractionalization .04 .72 .67 .18 .91(24) Voting turnout at 2010 local election (ward) .36 .61 .62 .07 .79(25) Opinion that police are respectful (borough) 4.67 5.32 5.30 .35 6.19(26) Growth of government expenditure, 2009/10-2010/11 (borough) -.15 .00 .00 .04 .08
Table 2: Predicting the probability of rioters in London's neighborhoods, 2011
12
3odds
sep
oddsse
podds
sep
Youth
8.836.42
.00**
6.715.25
.02*
6.675.22
.02*
Proximity to nearest Foot Locker
1.04.02
.02*
1.04.02
.03*
1.04.02
.02*
Population density.26
.09.00
***.27
.09.00
***.27
.09.00
***Ethnicity: w
hite Irish3.65
8.17.56
.441.03
.73.34
.77.63
Ethnicity: white other
.90.55
.86.22
.18.06
.22.17
.05Ethnicity: black A
frican3.91
2.13.01
*1.22
.74.75
1.23.74
.74Ethnicity: black Caribbean
131.55105.86
.00***
22.6120.74
.00***
16.3514.68
.00**
Ethnicity: Asian Pakistani
5.275.28
.101.68
1.77.62
2.782.88
.32Ethnicity: A
sian Indian.28
.19.06
.18.13
.02*
.13.10
.00**
Ethnicity: Asian Bangladeshi
.90.62
.88.52
.37.35
1.00.67
1.00Ethnicity: A
sian other1.35
1.27.75
.26.27
.20.22
.23.14
Ethnic segregation (ward)
1.905.41
.8213.92
39.56.35
15.4543.36
.33Concentrated disadvantage
1.62.13
.00***
1.38.15
.00**
1.39.15
.00**
Concentrated disadvantage (ward)
1.40.14
.00***
1.38.15
.00**
1.37.15
.00**
Class: managerial and professional
1.791.54
.50.88
.78.88
.63.55
.60Class: interm
ediate professions.61
.73.68
.62.75
.69.65
.78.72
Class: small em
ployers and self-employed
.46.60
.55.56
.73.66
.61.79
.70Relative affluence in surrounding area
.89.65
.87.64
.46.53
.41.29
.21H
ome ow
nership.64
.19.14
.65.19
.14Im
migrants arrived since 2010
.17.21
.15.23
.28.24
Ethnic fractionalization7.87
3.94.00
***8.07
3.98.00
***V
oting turnout at 2010 local election (ward)
1.371.36
.751.40
1.36.73
Opinion that police are respectful (borough)
.33.07
.00***
Grow
th of government expenditure, 2009/10-2010/11 (borough)
1.262.17
.89Random
intercept: ward (standard deviation)
.35.05
.34.05
.35.05
Random intercept: borough (standard deviation)
.53.09
.50.08
.29.07
Difference in corrected A
IC compared to M
odel 1-15.55
-33.62Logistic regression (8 integration points), w
ith ln population as offset; N = 25,022 neighborhoods in 624 w
ards in 32 boroughsodds: odds ratio; se: standard error; p: p-value (tw
o-tailed), *** p < .001, ** p < .01, * p < .05
Appendix Table 1: C
orrelation matrix
(1)(2)
(3)(4)
(5)(6)
(7)(8)
(9)(10)
(11)(12)
(13)(14)
(15)(16)
(17)(18)
(19)(20)
(21)(22)
(23)(24)
(25)(2)
.06(3)
.07.33
(4).02
-.03.03
(5).01
-.01.08
.05(6)
-.04-.13
-.11.07
.01(7)
-.02-.14
-.01.12
.15.18
(8).17
.08.18
.01.13
-.18-.10
(9).18
.07.11
.02.06
-.03-.05
.50(10)
.01.29
.13.09
-.01-.16
-.12.00
.07(11)
-.04.32
.08.00
-.05-.08
-.16-.14
-.09.47
(12).02
.15.21
-.01.12
-.14-.09
.04-.02
.13.00
(13).00
.22.11
.02.02
-.06-.01
.00.02
.36.49
-.04(14)
-.06-.15
-.02-.04
.00-.10
-.17-.18
-.35-.26
-.23.10
-.28(15)
.17.08
.23.01
.12-.13
-.21.67
.47.08
-.07.26
.07-.13
(16).15
.17.27
.01.10
-.14-.10
.58.44
.13-.01
.24.06
-.19.66
(17)-.13
-.30-.40
.05-.01
.25.36
-.53-.36
-.28-.16
-.24-.24
.15-.80
-.61(18)
-.05-.03
-.19-.11
-.18-.12
-.51-.16
-.08-.06
.03-.15
-.09.22
-.10-.13
-.18(19)
-.06.07
-.22-.07
-.17.03
.03-.18
-.08.11
.11-.16
.07-.10
-.18-.13
-.10.17
(20).10
.13.36
.02.07
-.08-.19
.39.26
.06-.05
.20.12
-.05.70
.22-.74
.05.01
(21)-.13
.10-.26
-.15-.26
-.02-.30
-.51-.32
.04.19
-.24-.02
.11-.66
-.44.28
.50.39
-.39(22)
-.02.06
.36.14
.19-.01
.56-.03
-.10.16
.19.08
.25-.08
-.12.01
.12-.48
-.17-.08
-.34(23)
.12.17
.25.12
.17.09
.39.46
.49.34
.25.15
.42-.52
.40.41
-.30-.48
-.11.24
-.56.40
(24)-.09
-.02-.25
-.10-.20
.07-.40
-.38-.26
-.15-.02
-.13-.12
.22-.36
-.55.25
.42.15
-.11.54
-.44-.56
(25)-.10
.11.06
-.02.00
-.08-.08
-.09-.28
.25.22
.29.10
.05.02
.04-.14
.00.06
-.02.05
.12-.04
-.03(26)
-.02.08
.04.03
.02.13
.11-.04
.11.23
.20.11
.21-.32
.00.00
.01-.18
.00.01
-.07.11
.31-.04
.31
APPENDIX TABLES
Appendix Table 2: Concentrated disadvantage
Variable Factor loading
Proportion of economically active population who are unemployed .85
Proportion of adults (16+) who lack any educational qualification .76
Proportion of occupied population who are in routine or semi-routine occupations .83
Proportion of households which have occupancy rating of -1 or under .67
Proportion of households which have socially rented tenure .85
Proportion of households with dependent children which are headed by a single parent .74
Appendix Table 3: Predicting the probability or num
ber of rioters in London's neighborhoods, 2011
45
oddsse
pirr
sep
Youth
6.044.72
.02*
1.782.87
.72Proxim
ity to nearest Foot Locker1.04
.02.04
*1.01
.03.67
Population density.26
.09.00
***2.13
1.64.33
Ethnicity: white Irish
.651.52
.851.30
6.39.96
Ethnicity: white other
.19.15
.04*
.641.32
.83Ethnicity: black A
frican1.18
.72.78
4.417.33
.37Ethnicity: black Caribbean
15.1714.02
.00**
16.7333.18
.16Ethnicity: A
sian Pakistani1.53
1.65.69
60.91125.95
.05*
Ethnicity: Asian Indian
.26.18
.06.10
.16.13
Ethnicity: Asian Bangladeshi
.48.37
.34.42
1.03.72
Ethnicity: Asian other
.34.36
.3076.96
189.49.08
Ethnic segregation (ward)
12.2234.86
.3813.88
88.62.68
Concentrated disadvantage1.37
.15.00
**1.60
.31.01
*Concentrated disadvantage (w
ard)1.32
.14.01
*1.00
.221.00
Class: managerial and professional
.60.55
.582.08
4.35.73
Class: intermediate professions
.61.74
.683.75
10.20.63
Class: small em
ployers and self-employed
.59.77
.6984.95
224.62.09
Relative affluence in surrounding area.50
.38.36
.20.26
.22H
ome ow
nership.62
.18.11
1.05.52
.92Im
migrants arrived since 2010
.15.19
.14.71
3.04.94
Ethnic fractionalization6.94
3.52.00
***.39
.52.48
Voting turnout at 2010 local election (w
ard)1.29
1.29.80
9.7718.67
.23O
pinion that police are respectful (borough).53
.15.03
*G
rowth of governm
ent expenditure, 2009/10-2010/11 (borough).65
1.39.84
Random intercept: w
ard (standard deviation).29
.05A
lpha (coefficient)2.24
3.38M
odel 4: logistic regression (8 integration points), with ln population as offset ; N
= 25,022 neighborhoods in 624 wards, separate intercepts for 32 boroughs (not show
n)M
odel 5: zero-truncated negative binomial regression, w
ith ln population as offset; N = 1,375 neighborhoods, standard errors adjusted for clustering by borough
odds: odds ratio; irr: incidence-rate ratio; se: standard error; p: p-value (two-tailed), *** p < .001, ** p < .01, * p < .05