Page 1
SOCS3 DEFICIENCY IN MYELOID CELLS PROMOTES TUMOR DEVELOPMENT
by
HAO YU
ETTY N. BENVENISTE, COMMITTEE CHAIR
JESSY DESHANE
DOUGLAS R HURST
SELVARANGAN PONNAZHAGAN
HONGWEI QIN
A DISSERTATION
Submitted to the graduate faculty of The University of Alabama at Birmingham,
In partial fulfillment of the requirements for the degree of
Doctor of Philosophy
BIRMINGHAM, ALABAMA
2015
Page 2
ii
Copyright by
Hao Yu
2015
Page 3
iii
SOCS3 DEFICIENCY IN MYELOID CELLS PROMOTES TUMOR DEVELOPMENT
HAO YU
CELL, MOLECULAR, AND DEVELOPMENTAL BIOLOGY
ABSTRACT
STAT3 signaling is a major intrinsic pathway for cancer inflammation owing to its
frequent activation in malignant cells, and key role in regulating many genes crucial for
inflammation in the tumor microenvironment. Persistently activated STAT3 increases
tumor cell proliferation, survival, and invasion while suppressing anti-tumor immunity.
Suppressor Of Cytokine Signaling (SOCS) proteins are negative regulators of the
JAK/STAT pathway, and generally function as tumor suppressors. The absence of
SOCS3 in particular leads to heightened activation of the STAT3 transcription factor. In
the present study, we demonstrate that genetic deletion of SOCS3 specifically in myeloid
cells significantly enhances tumor growth, which correlates with elevated levels of
myeloid-derived suppressor cells (MDSC) in the tumor microenvironment, and
diminished CD8+ T cell infiltration in tumors. The importance of MDSC in promoting
tumor growth is documented by reduced tumor growth upon depletion of MDSC.
Furthermore, SOCS3-deficient bone-marrow-derived cells exhibit heightened STAT3
activation and preferentially differentiate into the Gr-1+CD11b
+Ly6G
+ MDSC phenotype.
Importantly, we identify granulocyte-colony stimulating factor (G-CSF) as a critical
factor secreted by the tumor microenvironment that promotes development of MDSC via
a STAT3-dependent pathway. Abrogation of tumor-derived G-CSF reduces the
Page 4
iv
proliferation and accumulation of Gr-1+CD11b
+ MDSC and inhibits tumor growth. These
findings highlight the critical function of SOCS3 as a negative regulator of MDSC
development and function, via inhibition of STAT3 activation. Utilizing SOCS3/STAT3
expression to predict prostate cancer progression and immune therapy responses (anti
PD-L1) will also be discussed.
Keywords: myeloid-derived suppressor cells (MDSC), Gr-1+CD11b
+ Cells, JAK/STAT
pathway, suppressor of cytokine signaling (SOCS), myeloid cells, tumor microenvironment,
granulocyte-colony stimulating factor (G-CSF)
Page 5
v
DEDICATION
I would like to dedicate this dissertation to my family.
Page 6
vi
ACKNOWLEDGEMENTS
I am greatly indebted to the many people who made this dissertation possible.
First and foremost, I would like to thank Dr. Etty (Tika) Benveniste, my most dedicated
mentor, and Dr. Hongwei Qin, for their support and guidance on my research projects
and training. They inspired me to find my own scientific niche and to think independently.
I am very fortunate to learn a wealth of scientific knowledge and laboratory techniques in
the cancer-related field under this valuable scientific environment which led me to the
completion of the Ph.D study. I would also like to thank my committee members: Drs.
Jessy Deshane, Douglas R Hurst, and Selvarangan Ponnazhagan. They have provided
extremely important contributions and guidance to this research. I am inspired by their
motivation, immense knowledge, and enthusiasm in mentoring and research. They have
been supportive and helpful every step of the way, and I am extremely grateful for their
patience and guidance. I would also like to acknowledge all the members in Dr.
Benveniste’s laboratory and Drs. Richard Lopez, Bradley Yoder, Dongqi Xing, Xiaosi
Han, and other faculty from UAB for their insightful comments and encouragement.
I would like to thank my family. Without their constant support and unconditional
love, I could not have completed my graduate studies. In addition, I would like to
acknowledge the support from my friends. I will always be grateful to have all of you in
my life.
Page 7
vii
TABLE OF CONTENTS
Page
ABSTRACT ..................................................................................................................iii
DEDICATION ..............................................................................................................v
ACKNOWLEDGEMENTS ..........................................................................................vi
LIST OF FIGURES ......................................................................................................x
LIST OF ABBREVIATIONS .......................................................................................xii
INTRODUCTION ........................................................................................................1
The Janus Kinase (JAK)/Signal Transducers and
Activators of Transcription (STAT) Pathway...................................................1
Dysregulation of the JAK/STAT Pathway in Cancer .......................................2
Constitutive activation of STAT3 in human cancer .................................2
The importance of STAT3 in tumorigenesis and metastasis ....................4
The importance of STAT3 in inflammation and cancer ...........................5
Role of SOCS3 in Regulating the JAK/STAT Pathway ...................................8
Role of SOCS3 in Regulating Immune Cell Functions and Responses ...........10
Page 8
viii
Immune Contexture in the Tumor Micro-environment ....................................13
Immune cells shape tumor immunogenicity .............................................14
Understanding immune contexture in
cancer and predicting patient outcome....................................................15
Role of Myeloid Cells in Tumor Development and Progression ......................17
Dendritic cells ..........................................................................................17
Macrophages............................................................................................18
Neutrophils/granulocytes .........................................................................19
Origin of Myeloid-Derived Suppressor Cells (MDSCs) .................................22
Myeloid cell mobilization and clearance .................................................24
Role of MDSCs in Regulating Anti-tumor Immunity ......................................25
Using the TRAMP Model to Investigate
Prostate Tumor Development ...........................................................................27
Prostate cancer ........................................................................................28
TRAMP prostate model ............................................................................29
Rationale of Dissertation Study ........................................................................30
Page 9
ix
SOCS3 Deficiency in Myeloid Cells Promotes Tumor Development: Involvement of
STAT3 Activation and Myeloid-Derived Suppressor Cells .........................................40
Abstract .............................................................................................................42
Introduction .......................................................................................................43
Materials and Methods ......................................................................................46
Results ...............................................................................................................51
Discussion .........................................................................................................59
References .........................................................................................................65
Figures...............................................................................................................69
CONCLUSIONS...........................................................................................................94
REFEENCES ................................................................................................................101
APPENDIX ...................................................................................................................138
Page 10
x
LIST OF FIGURES
Figure Page
INTRODUCTION
1. JAK/STAT Signal Pathway in Cytokine Signaling. ............................................ 33
2. Suppressor Of Cytokine Signaling 3 (SOCS3) Protein Negatively Regulates the
JAK/STAT Pathway ............................................................................................ 35
3. Suppressive Mechanisms Mediated by MDSCs .................................................. 37
4. TRAMP Tumor Grading Scale ............................................................................ 39
SOCS3 Deficiency in Myeloid Cells Promotes Tumor Development: Involvement of
STAT3 Activation and Myeloid-Derived Suppressor Cells
1. Myeloid-specific SOCS3 Loss Promotes Tumor Growth ................................... 69
2. Gr-1+CD11b
+ Cells from SOCS3
MyeKO Tumor-Bearing Mice Suppress Antigen-
specific T-cell Responses .............................................................................................. 71
Page 11
xi
3. Orthotopic Prostate Tumor Growth is Enhanced in SOCS3MyeKO
mice .............. 73
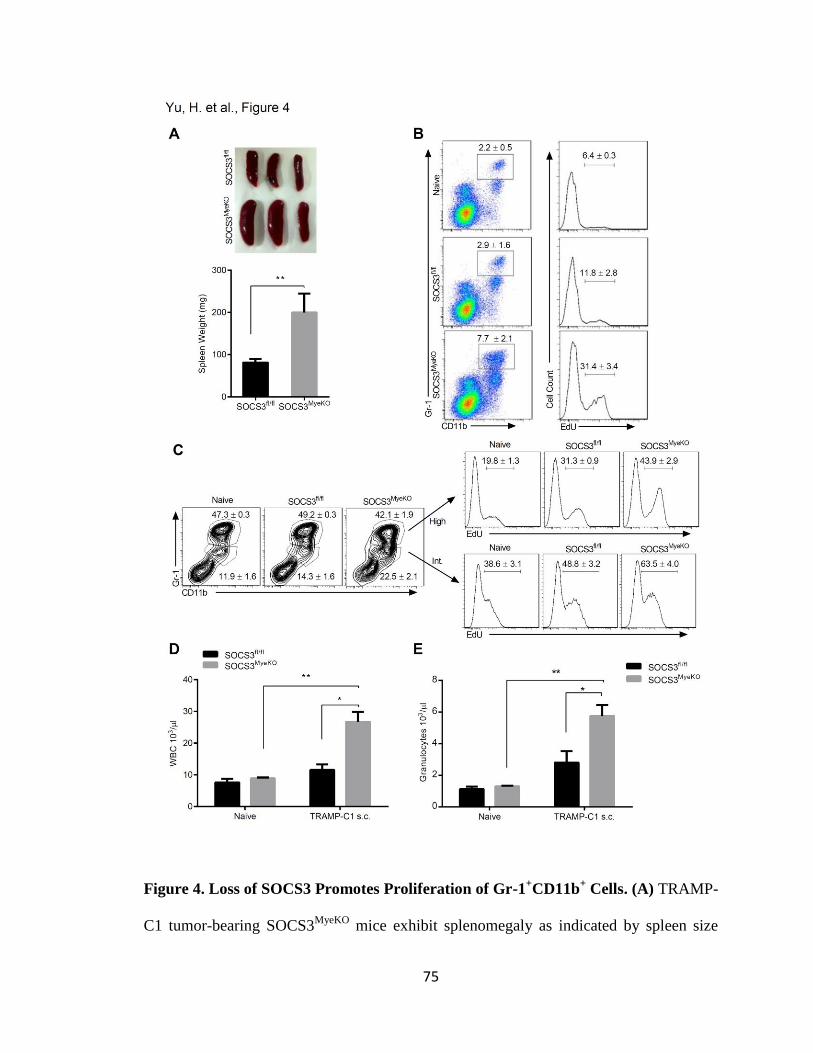
4. Loss of SOCS3 Promotes Proliferation of Gr-1+CD11b
+ Cells ........................... 75
5. Absence of SOCS3 Enhances STAT3 Activation and
BM Differentiation into Gr-1+CD11b
+ MDSC .................................................... 77
6. G-CSF Induces the Differentiation of BM Precursors into Functional MDSC in a
STAT3-dependent Manner ........................................................................................... 80
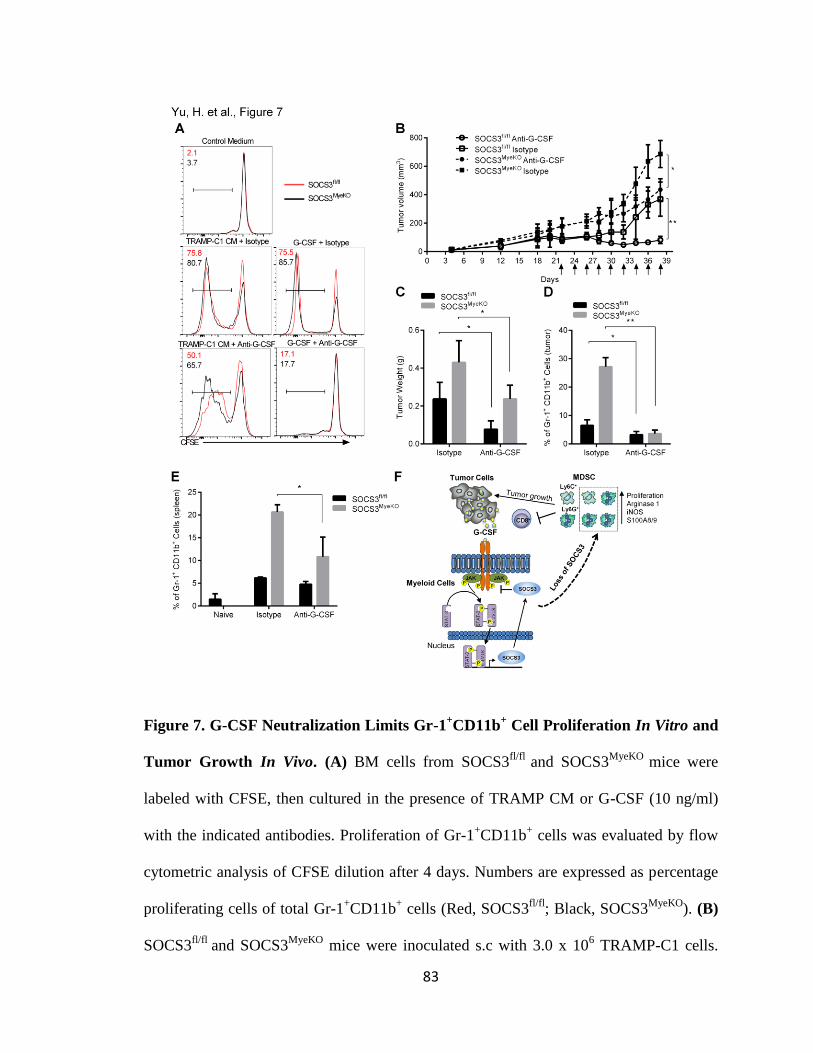
7. G-CSF Neutralization Limits Gr-1+CD11b
+ Cell Proliferation In Vitro and Tumor
Growth In Vivo .............................................................................................................. 83
S1. Characterization of Immune Responses in TRAMP Tumor-bearing Mice ....... 85
S2. Gr-1+CD11b
+ Cells Isolated from SOCS3
MyeKO Mice
Exhibit Enhanced MDSC Suppressive Function ............................................... 87
S3. Effect of SOCS3 on Gr-1+CD11b
+ Cell Proliferation........................................ 89
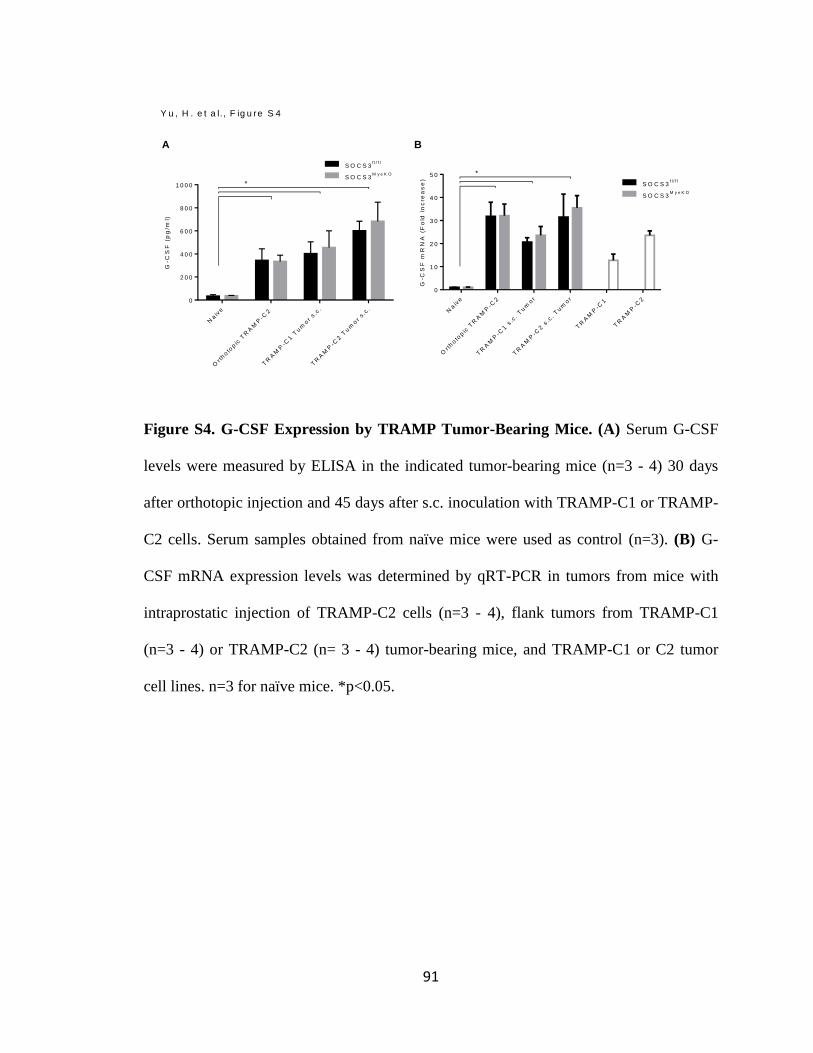
S4. G-CSF Expression by TRAMP Tumor-Bearing Mice ...................................... 91
S5. Effects of G-CSF Neutralizing Antibody .......................................................... 92
Page 12
xii
LIST OF ABBREVIATIONS
APC Antigen-presenting cell
BBB Blood-brain barrier
CCL Chemokine (C-C motif) ligand
CCR C-C chemokine receptor
CXCL Chemokine (C-X-C motif) ligand
CXCR CXC chemokine receptor
CFA Complete Freund’s adjuvant
CNS Central nervous system
DC Dendritic cell
dLNs Draining lymph nodes
EAE Experimental autoimmune encephalomyelitis
ELISA Enzyme-linked immunosorbent assay
FDA Food and Drug Administration
GA Glatiramer acetate
G-CSF Granulocyte colony-stimulating factor
GM-CSF Granulocyte-macrophage colony-stimulating factor
GWAS Genome-wide association study
Page 13
xiii
IFN Interferon
IL Interleukin
JAK Janus kinase
LPS Lipopolysaccharide
MBP Myelin basic protein
MCP-1 Monocyte chemotactic protein-1
M-CSF Macrophage colony-stimulating factor
MFI Mean fluorescent intensity
MHC Major histocompatibility complex
MOG Myelin oligodendrocyte glycoprotein
MS Multiple sclerosis
NF-κB Nuclear factor kappa-light-chain-enhancer of activated B cells
NO Nitric oxide
OVA Ovalbumin
PLP Proteolipid protein
RAG Recombination activating gene
SC Spinal cord
STAT Signal transducers and activators of transcription
Page 14
xiv
TCR T cell receptor
TH T helper
TGF Transforming growth factor
TLR Toll-like receptor
TNF Tumor necrosis factor
Treg Regulatory T cell
WT Wild Type
Page 15
1
INTRODUCTION
The Janus Kinase (JAK)/Signal Transducers and Activators of Transcription (STAT)
Pathway
The JAK/STAT signaling pathway is the predominant signal transduction cascade
utilized by numerous cytokines, and is critical for initiating innate immunity,
orchestrating adaptive immune mechanisms, and ultimately constraining inflammatory
and immune responses (1-3). The JAK/STAT pathway is utilized by over 60 cytokines
and growth factors including the interleukin-6 (IL-6) family, interferon (IFN) superfamily,
epidermal growth factor (EGF) and fibroblast growth factor (FGF) (4, 5). Cytokines and
growth factors activate receptor-associated JAKs, which phosphorylate the receptor
cytoplasmic domain on tyrosine residues, leading to recruitment of STATs (5-7). The
JAKs then tyrosine phosphorylate STATs, promoting their activation (5). Once activated,
STATs dimerize as either homodimers or heterodimers, and translocate to the nucleus,
then bind to regulatory elements to induce transcription of target genes (Fig. 1) (8, 9).
There are four JAKs (JAK1, JAK2, JAK3 and TYK2), and a total of seven STATs
(STAT 1, 2, 3, 4, 5a, 5b and 6) (9, 10). Various combinations of JAK/STAT usage result
in differential gene expression, particularly depending on the STAT transcription factor(s)
that is activated (11-14). STAT proteins can be divided into two groups. The first group
consists of STAT2, STAT4, and STAT6, which are predominantly involved in regulating
Page 16
2
lymphocyte development (15). The second group includes STAT1, STAT3, and STAT5,
which are activated in different tissues through various ligands and are involved in
cytokine signaling, development of mammary glands, embryogenesis as well as
malignancy (16). STAT-mediated signaling is typically transmitted through the formation
of phosphorylated homodimers. However, complex cytokine signaling required for
generating a robust and specialized immune response is mediated through the use of a
limited number of STAT molecules, which involves the heterodimerization of STAT
proteins (17, 18). Cytokines, through activation of the JAK/STAT pathway, are of
paramount importance in regulating the development, differentiation and function of
immune cells (19, 20). JAK1/2 and STAT1 activation mediate the effects of IFN-γ on
macrophage function (21), JAK1/2 and STAT3 are involved in IL-6 family signaling (22),
and granulocyte macrophage colony-stimulating factor (GM-CSF) signals through JAK2
and STAT5 to affect myeloid development (22-24). STATs are also involved in
regulating tumor cell survival (12, 25) and maintaining a tumor-promoting
microenvironment (1, 26-28).
Dysregulation of the JAK/STAT Pathway in Cancer
Constitutive activation of STAT3 in human cancer.
Inflammation plays an important role in cancer initiation and malignant progression.
Inflammatory conditions can facilitate oncogenic transformation, and genetic and
epigenetic changes in malignant cells can also generate an inflammatory
Page 17
3
microenvironment that further supports tumor development (29). Cancer-associated
inflammation is marked by the presence of specific inflammatory cells and inflammatory
mediators, including cytokines and chemokines (29). The critical link between chronic
inflammation and cancer is clearly illustrated by the fact that the major pro-inflammatory
transcription factor, STAT3, can be activated by several of these important cancer risk
factors (30). STAT3 is activated in response to many cytokines such as IL-6 family
members, growth factors (e.g., EGF, FGF, TGF-α, G-CSF, and GM-CSF) and oncogenic
proteins through phosphorylation of tyrosine 705 (17). Other classes of non-receptor
protein tyrosine kinases have also been reported to stimulate STAT3 activation. The Src
family of kinases (SFKs) can either activate STAT3 directly or may function downstream
of the activation of receptor tyrosine kinase (RTKs)/G protein-coupled receptors (GPCRs)
(31). Phosphorylation of a single serine (Ser727) in the C-terminal transactivation domain
of STAT3 by numerous serine kinases including mTOR and protein kinase C delta (PKC)
allows for maximal activation of transcription of responsive genes (32). Transcriptional
activation by STAT3 requires the recruitment of co-activators such as CREB-binding
Protein (CBP)/p300 and apurinic/apyrimidinic endonuclease (APE)/Ref-1 (33, 34).
The potential oncogenic role of STAT3 was established by the evidences that
constitutively activated STAT3 in Src-transformed cell lines and that interrupting STAT3
signaling blocks the transformation of mouse fibroblasts by the Src oncoprotein (31). The
first direct links between STATs and human cancer came from findings that constitutive
STAT3 activity is required for the growth of head and neck cancer and of acute
myelocytic leukemia and chronic myelocytic leukemia cells (35). In contrast to the
transient nature of STAT3 activation in normal cells, persistent activation of STAT3 has
Page 18
4
been reported in a variety of human tumor cell lines and primary human tumors,
including leukemia, lymphomas, multiple myeloma, glioma, breast, ovarian, cervical,
colon, lung, and prostate cancers (36-40).
The importance of STAT3 in tumorigenesis and metastasis.
Cancer cells expressing constitutively activated STAT3 are more resistant to apoptosis
and chemotherapies aimed at initiating apoptosis (41). Numerous groups have shown that
in vivo administration of STAT3 inhibitors have antitumor effects in human cancer
xenograft mouse models (42, 43). The first evidence towards the role of STAT3 in
survival was that STAT3 activation is essential for gp130-induced proliferation of the IL-
3-dependent pro-B hematopoietic cell line, BAF/B03 (44). In gastric, glioblastoma and
colorectal cancer cells, the active form of STAT3 was found to promote the G1/S phase
transition of the cell cycle through the expression of cyclin D1, which can associate with
cdk4 or cdk6 and control progression from G1 to S phase (45). Constitutively
phosphorylated STAT3 has been found to induce over-expression of target genes such as
cdc2, cyclin B1, m-ras, and E2F-1 in colon and breast carcinomas (46). Gp130-mediated
STAT3 signaling has been shown to up-regulate the expression of several growth-
promoting genes, such as c-Myc, Pim-1 and Pim-2, and promote emergent tumor cells to
escape terminal differentiation (47-50). Constitutive STAT3 signaling contributes to
malignancy by preventing the apoptosis pathway in multiple myeloma cells through
increased expression of Bcl-xL (51). Inhibition of STAT3 with the JAK inhibitor,
AZD1480, was found to decrease tumor growth through down regulation of cell cycle
regulators, anti-apoptotic genes Bcl-2 and survivin, the metastasis-related factor TIMP-1,
and c-Myc (52).
Page 19
5
STAT3 is involved in regulating cell movement, mainly by cytoskeleton reorganization
and controlling cell adhesion properties. Recent studies demonstrate enhanced STAT3
activation with increased cell–cell contact or increased confluence, indicating that
STAT3 involved in tumor cell contact and able to up-regulate genes necessary for cell
invasion and migration (30, 53, 54). The introduction of constitutively-activated mutated
STAT3-C in epithelial cells decreased E-cadherin levels, increased numbers of
lamellipodia and stress fibers, and enhanced migratory capacity and tumor formation by
inducing the expression of fibronectin (55). STAT3 target genes include several members
of the MMP family, which are known to contribute to tumor invasion, angiogenesis and
metastasis (56, 57). High levels of phosphorylated STAT3 are a prominent feature in
colon and gastric cancers associated with adverse outcomes (58). Experimentally induced
STAT3 activity enhanced both the level of MMP-1 mRNA and secreted MMP-1
enzymatic activity in colorectal carcinomas (59). Activation of STAT3 by IL-6 was also
found to induce Twist expression in human breast cancer cells by binding to the second
proximal STAT3-binding site on the Twist promoter and activating its transcription (60,
61). STAT3-deficient keratinocytes demonstrated increased cell adhesiveness and
compromised growth factor-induced cell migration (62).
The importance of STAT3 in inflammation and cancer.
STAT3 signaling is a major intrinsic pathway for cancer inflammation because it is
frequently activated in malignant cells and capable of inducing a large number of genes
that are crucial for inflammation. STAT3 is crucial for regulating cytokines, chemokines
and other mediators that induce and maintain a cancer-promoting inflammatory
environment (63). Within the tumor microenvironment, the persistent activation of
Page 20
6
STAT3 in tumor cells leads to the over-production of cytokines, chemokines and growth
factors and the associated receptors which in turn activate STAT3 in stromal
inflammatory cells and release inflammatory mediators to the microenvironment (64, 65).
The IL-6/JAK/STAT3 pathway is also crucial for inflammatory conditions caused by
environmental and other factors that are associated with increased cancer risk (1, 8).
Many tumor viruses are also known to activate STAT3 by various distinct mechanisms,
including hepatitis B virus (66), human papillomavirus (67), human T-lymphotropic virus
type 1 (68) and Epstein-Barr virus (69). Both lipopolysaccharide and live bacteria are
able to activate STAT3, resulting in the production of IL-1β and IL-6, which are major
mediators of inflammation-induced cancer (70). Importantly, a crucial role of STAT3
signaling in mediating ultraviolet light-induced skin cancer has been demonstrated in a
transgenic mouse model (71). Cigarette smoke-associated cancer development may also
be linked to STAT3 activation through the nicotinic receptor (59). Chronic stress is
another contributor to cancer pathogenesis and progression, and a recent study has
suggested the potential importance of STAT3 activation in mediating tumorigenicity by
the stress mediators noradrenaline and adrenaline (53, 72).
Several recent studies have identified Toll-like receptors, such as TLR9 and TLR4, as
important activators of the JAK/STAT3 pathway (73, 74). STAT3 upregulates the
expression of certain TLRs in malignant cells and promotes tumor progression (8).
STAT3 can directly interact with the NF-κB family member RelA (also called p65),
through acetyltransferase p300-mediated acetylation, trapping it in the nucleus and
thereby contributing to constitutive NF-κB activation in tumor-associated hematopoietic
cells and various malignancies (75-77). A major role of microRNAs (miRNAs) in cancer
Page 21
7
has also emerged, and several of these miRNAs, including miR-17 (78), miR-19a (79),
miR-20 (80), miR-24 (81), and miR-135 (81), have been shown to be crucial for
regulating the JAK/STAT3 pathway. Additionally, miRNAs released by tumor cells are
packaged into microvesicles and delivered to neighboring stromal cells in the tumor
microenvironment (82). For example, tumor cell-derived miR-9 strongly induces
endothelial cell migration and tumor angiogenesis by inhibiting SOCS5 in endothelial
cells, which leads to JAK/STAT3 activation in macrophages (8). Cancer-promoting
functions of STAT3, such as its role in mitochondria, epigenetic regulation, and the
tumor microenvironment further highlight the importance of targeting STAT3 for cancer
therapy. Consequently, inhibiting the STAT3 pathway abrogates formation of and
suppresses established pre-metastatic niches, effectively reducing tumor metastasis (83,
84).
Myeloid cells display increased proliferation and survival capacity through upregulated
expression of genes underlying growth in a STAT3‑dependent manner (85). Survival,
proliferation and differentiation of myeloid cells are facilitated by triggering a cascade
through the JAK/STAT3 signaling pathway which is the main transcription factor
involved in myeloid cell expansion (86, 87). STAT3 not only prevents apoptosis and
promotes cell proliferation by upregulating the anti-apoptotic or pro-proliferative factors
BCL-XL, MYC, cyclin-D1 and survivin, but also regulates the expression of multiple
proteins that are crucial for the differentiation of myeloid cells (84). In addition, STAT3
regulates the transcription factor CCAAT/enhancer-binding protein-β (C/EBPβ) (88)
which regulates myelopoiesis in healthy individuals and has a crucial role in controlling
the differentiation of myeloid progenitors to functional myeloid cells (89). STAT3 also
Page 22
8
cooperates with NF-κB signaling regulating the mobilization of myeloid cells to sites of
infection, injury or tumor growth. The pro-inflammatory mediators COX2 and PGE2,
which enhance myeloid cell accumulation and suppressive activity, are also potential
targets for STAT3 and NF-κB (90).
Role of SOCS3 in Regulating the JAK/STAT Pathway
JAKs and STATs are essential mediators of almost all biological signaling events
initiated by cytokines. As such, unrestrained activation of the JAK/STAT pathway is
detrimental and has been associated with inflammation and cancer (91). Activating
mutations in STAT proteins are rare, thus STAT hyper-activation is usually due to an
over-abundance of cytokines, and/or dysregulation of endogenous negative regulators of
JAKs or STATs. The JAK/STAT pathway is
tightly regulated at many steps through distinct mechanisms, including phosphotyrosine
phosphatases (PTPs), protein inhibitor of activated STATs (PIAS), and suppressors of
cytokine signaling (SOCS) proteins (Fig. 1) (92). PTPs participate in the regulation of the
JAK/STAT signaling pathway through dephosphorylation and have important
implications in physiology and diseases (93). PIAS proteins regulate the activity of many
transcription factors through the sumoylation machinery (94). Different PIAS bind
different STATs and probably act by inhibiting their DNA binding or by recruiting
histone deacetylases and promoting protein degradation (95).
Page 23
9
Most notably, SOCS proteins are cytokine-inducible proteins, acting as potent negative
regulators of the JAK/STAT signaling pathway. Besides their obligate intracellular role,
SOCS proteins can serve as vectors mediating macrophage to epithelial cell cross-talk
through exosome trafficking (96). The SOCS family is composed of eight members; CIS
and SOCS1-7, and serve to restrict the duration of activation of cytokine-induced
signaling by inhibiting JAK kinase activity after it has been turned on (97, 98).
Experiments in different genetically manipulated mice have demonstrated a crucial role
of SOCS proteins in pathophysiology. For example, SOCS1-deficient mice die within 3
weeks of birth due to severe systemic inflammation resulting from uncontrolled
interferon-γ (IFN-γ) signaling (99). SOCS2-deficient mice develop gigantism due to
enhanced responses to growth hormone (100). Mice lacking SOCS3 die perinatally due to
defective placental formation (101, 102).
SOCS proteins contain an N-terminal variable region, a classical SH2 domain, and a C-
terminal SOCS box (Fig. 2A) (98). SOCS proteins are not constitutively expressed, rather,
are induced after cytokine binding to its receptor (103). The SOCS proteins create a
negative feedback loop to prevent excessive activation of cytokine-induced JAK/STAT
signaling (104). SOCS proteins are able to bind JAKs and certain cytokine receptors via
their SH2 domains, thereby suppressing further signaling events (Fig. 2B) (105, 106).
The SOCS box recruits a complex containing elongin B and C (102, 107, 108), and this
complex then interacts with the Cullin-5 ubiquitin machinery, leading to proteasome
mediated degradation of SOCS-associated targets (109). Any tyrosine phosphorylated
signaling intermediate (phospho-JAK, phospho-STAT, phosphorylated receptors) is
conceivable a SOCS protein substrate (110). Thus, the SH2 domain of SOCS proteins
Page 24
10
function as an adapter bringing ubiquitin ligases close to kinase-activated signaling
proteins and mediate their degradation (111). SOCS1 and SOCS3, but not the other
members of the SOCS family, bind directly to JAK proteins, conferring inhibition of JAK
kinase activity (98). Studies using truncated or chimeric forms of SOCS proteins showed
that SOCS1 and SOCS3 contain a 12 amino acid N-terminal kinase inhibitory region
(KIR) resembling a JAK substrate, which allows them to suppress signaling by direct
inhibition of JAK’s catalytic activity (Fig. 2B) (112). The KIR region of SOCS1 binds
directly to the auto-phosphorylation site of JAK2 and a peptide mimic corresponding to
this site can function as an inhibitor of the JAK/STAT pathway (113). SOCS1 and
SOCS3 in particular have critical functions in repressing innate and adaptive immunity,
in part by inhibiting STAT activation induced by IFN-γ, IL-6, IL-12, IL-23 and GM-CSF,
which are all implicated in inflammation and cancer (97, 114).
Role of SOCS3 in Regulating Immune Cell Functions and Responses
SOCS3, as a negative regulator of the JAK/STAT3 pathway, is regulated primarily by
activation and STAT3, although its expression can be mediated through other signaling
cascades, including the mitogen activated protein kinase (MAPK) and NF-κB pathways
(115). Reduced SOCS3 expression levels are detected in cancerous lesions infected with
HCV compared with non-cancerous lesions (116-121). Hyperactivation of STAT3 by
reduced SOCS3 expression may contribute to malignancies and carcinogenesis by
inducing multiple tumor-promoting genes (119). Suppression of SOCS3 expression
Page 25
11
causes constitutive STAT3 activation, which is considered to be important for the linkage
between inflammation and cancer.
Genetic deletion of SOCS3 leads to mid-gestational embryonic lethality due to increased
STAT3 and MAPK activation (115). Mice with a deletion of SOCS3 in hematopoietic
cells (SOCS3fl/fl vav-cre) have been shown to develop a severe inflammatory disease
during adult life (122). SOCS3fl/fl vav-cre mice developed a spectrum of inflammatory
pathologies with inflammatory neutrophil infiltration into multiple tissues and consequent
hind-leg paresis (123). Enhanced IL-6 responses accounted for the enhanced
susceptibility of SOCS3fl/fl vav-cre or SOCS3fl/fl LysM-cre (deficient in SOCS3 in
myeloid cells) mice to induced inflammatory diseases like rheumatoid arthritis (RA) or
experimental autoimmune encephalomyelitis (EAE) (124). Gp130-deficient mice
spontaneously develop a RA-like disease that is accelerated by IL-6 administration (104).
Accordingly, adenoviral-delivered SOCS3 reduced joint inflammation in mice with
arthritis via inhibition of IL-6 signaling (125).
SOCS3 is expressed in the double negative (early) stage of thymocyte differentiation and
regulates T cell development in the thymus (126). Thymic T cells lacking SOCS3 have
an increased frequency of γδ+ T cells compared to wild type controls. SOCS3-deficient
CD8+ T cells showed higher proliferation in response to TCR ligation than wild-type
cells despite normal activation of signaling pathways downstream of TCR and CD28
receptors (127). Suppression of IL-27 signaling was found to substantially reduce the
activation of CD8+ T cells after deletion of SOCS3 (128). TH2 cells contain higher
amounts of SOCS3 compared to TH1 cells. Accordingly, over-expression of SOCS3 in T
cells inhibits TH1 and promotes TH2 development, suggesting that SOCS3 stimulates
Page 26
12
allergic responses (129). SOCS3 has been also suggested to inhibit IL-12-induced STAT4
activation by direct binding to the IL-12Rβ2. Inhibition of SOCS3 expression in T cells
exhibited markedly suppressed airway hyper-responsiveness and eosinophilia (130).
Mice with T cells over-expressing SOCS3 also showed a delayed onset of EAE and
restricted TH17 differentiation (131). SOCS3 expression is relatively low in progenitor
BM B cells and high in peripheral blood and spleen B cells. SOCS3 regulates CXCL12-
induced FAK phosphorylation through the ubiquitin-proteosome pathway (132). SOCS3
is an important negative regulator of immature B cells by affecting their survival and pro-
adhesive responses in the bone marrow microenvironment.
The majority of macrophages activated within an in vivo pro-inflammatory conditioning
environment show strong upregulation of SOCS3 expression and this cell population co-
express the M1 marker, iNOS (133). Without SOCS3, both human and rodent
macrophages have a reduced ability to develop pro-inflammatory features but instead
display immunoregulatory characteristics. In SOCS3-deficient macrophages, IL-6 signals
in a similar manner to the immunosuppressive cytokine IL-10, through prolonged STAT3
activation (134). Studies of SOCS3-deficient macrophages confirm that SOCS3
positively regulates TLR4 signaling and M1 activation by inhibition of IL-6R-mediated
STAT3 activation, as well as TGF-β-mediated SMAD3 activation (135). Forced
activation of Notch signaling enhances both M1 polarization and anti-tumor activity via
SOCS3 induction (136). However, myeloid-specific SOCS3-deficient mice are
vulnerable to a neuroinflammation model, which is characterized by enhanced STAT3
signaling, expression of M1-related genes, and an immune response dominated by TH1
and TH17 cells (137, 138). SOCS3-deficient bone marrow-derived macrophages
Page 27
13
(BMDMs) express higher levels of genes related to M1 polarization, such as IL-1β, IL-6,
IL-12, IL-23, iNOS, CCL2, and CXCL10, compared with BMDMs from WT mice upon
stimulation with M1 inducers (137). Furthermore, SOCS3 deletion enhanced LPS, IFN-γ,
and GM-CSF-induced STAT activation, but it had no significant effect on LPS-induced
NF-κB and MAPK activation (139).
SOCS3 deficient DCs exhibited constitutive activation of STAT3 and expressed low
levels of MHC class II molecules, co-stimulatory molecules, and IL-12 (140, 141).
Adoptive transfer of SOCS3 deficient DCs suppressed EAE. SOCS3 deficient DCs
produced a higher amount of TGF-β than WT DCs, resulting in a selective expansion of
Treg cells (142). Thus, in the absence of SOCS3, DCs tend to become tolerogenic DCs.
In addition, SOCS3 is an important negative regulator of DCs maturation because SOCS3
negatively regulates GM-CSF receptor signaling (143).
Myeloid cells in future metastatic sites, under the influence of tumor-produced factors,
exhibit increased proliferation and survival. Of particular importance, both the production
of tumor-derived factors that promote metastasis and the outgrowth of myeloid cells in
distant sites are dependent on the JAK/STAT signaling axis. Therapeutic trials using
SOCS3-specific anti-sense oligonucleotides, small hairpin RNAs, or cell-penetrating
SOCS3 proteins, have been performed (144).
Immune Contexture in the Tumor Microenvironment
Page 28
14
Immune cells shape tumor immunogenicity.
Tumors grow within an intricate network of malignant cells, vascular and lymphatic
vessels, cytokines and chemokines, and infiltrating immune cells (145). Different types of
infiltrating immune cells have different effects on tumor progression, which can vary
according to cancer types (146). Mouse studies by R. D. Schreiber and colleagues
demonstrate that infiltrating T cells have a major effect on the clinical attributes of human
cancers (147, 148). Cancer immune-editing can be divided in three different phases:
“elimination,” “equilibrium” and “escape” (149, 150). In the “elimination” stage both
innate and adaptive immunity act to identify the formation of tumor cells and to destroy
them, resembling the immunosurveillance theory (151). The “equilibrium” stage is
described as a period of tumor latency. In almost every case, once tumors survive
elimination, the innate and adaptive immune responses contribute to tumor cell growth
and shape its immunogenicity (152). The “escape” phase normally occurs when tumor
cells have developed the ability, through a number of mechanisms, to evade the
recognition of the immune system and/or their elimination (148, 152).
The progress of cancer disease results from several mechanisms developed by tumors to
evade antitumor immune responses. Rather than the ignorance and defects of anti-tumor
T cells, the suppressive tumor microenvironment and infiltrating immune cells contribute
mostly to cancer development (153). The presence of different cells and their dynamic
interaction with malignant cells have a profound effect on tumor progression (27). It has
been reported that there is a reduction or even loss of MHC I molecules, mostly
associated to gene mutations or impairment of MHCI-dependent antigen processing (154).
Similarly, the lack or reduction of the expression of co-stimulatory patterns by tumor
Page 29
15
cells direct T lymphocytes to an anergic state (155). The ability of tumor cells to avoid
immune destruction is emerging as a hallmark of cancer, in addition to the previously
established hallmark of tumor-promoting inflammation (156).
Understanding immune contexture in cancer and predicting patient outcome.
Conventional clinical and pathological risk prediction in cancer patients is usually
achieved by evaluating tissue samples obtained during surgical removal of the primary
tumor, mostly focusing on their histopathological characteristics, including the size of the
tumor, tissue integrity, aberrant expression of proteins and recently, genetic markers, and
various characteristics of the invasive margin (IM) (157, 158). Still, it is well known that
histopathological characteristics provide limited information for prognosis since cancer
outcome can significantly vary among patients within the same histological tumor stage
(159). Furthermore, histopathological analysis has revealed that tumors are often
infiltrated by a variable degree of inflammatory and lymphocytic cells (160). Studies
reveal that these immune cells are not distributed randomly, but seem to be organized in
more or less dense infiltrates in the center of the tumoral zone (CT), at the IM of tumoral
nests and in lymphoid islets adjacent to the tumor (161, 162). A very important clinical
translation is the establishment of an immune score based on the density of cytotoxic and
memory T cells (CD8/CD45RO), both in the CT and the IM of tumors, to establish
prognosis of clinical outcome in patients, even when there is no cancer associated
prognostic marker such as in early tumor stage (I/II) patients (163, 164). In human
cancers, a high density of TH1/cytotoxic memory T lymphocytes located both in the CT
and the IM of the primary tumor is associated with long disease free time, better overall
Page 30
16
survival and low risk of relapse and metastasis (165). Immune score classification may
help identify high-risk patients who would benefit the most from adjuvant therapy (166).
All immune cell types may be found in a tumor, including macrophages, dendritic cells,
mast cells, natural killer (NK) cells, naive and memory lymphocytes, B cells and effector
T cells, including various subsets of T cells: T helper cells, TH1 cells, TH2 cells, TH17
cells, regulatory T (Treg) cells, T follicular helper (TFH) cells and cytotoxic T cells (167-
169). It is now well established that in general, tumors with M2-phenotype macrophages
and myeloid derived suppressor cells (MDSCs) favor tumor growth and spread, whereas
infiltration of memory cytotoxic and TH1 T cells and M1-phenotype macrophages are
often associated with good clinical outcome and good response to immunotherapy (170).
NK cells are found in the stroma and are not in contact with tumor cells (171). B cells are
mostly found in the invasive margin of growing tumors and in stroma that are adjacent to
tumor beds (159, 170). T cells, particularly CD8+ T cells, may be located in the IM but
can also be in the tumor core (29, 172). More importantly, bone marrow-derived myeloid
cells, such as macrophages, neutrophils, eosinophils, mast cells and dendritic cells are
present in large numbers and have a crucial role in regulating the formation and
maintenance of the tumor microenvironment (173, 174). Myeloid cells present in the
tumor microenvironment mediate crosstalk between tumor cells and adaptive immune
cells and are correlated with patient disease progression (161, 175-177). With the
knowledge of the evolution of the immune contexture in the primary tumor, in the
periphery and in metastatic sites as disease progresses, therapeutic tools could be
designed to positively influence anti-tumor immunity.
Page 31
17
Role of Myeloid Cells in Tumor Development and Progression
Pathological changes in solid cancers include recruitment and modifying of various types
of dysregulated immune cells and endothelial cells to form the tumor microenvironment
(153). A variety of chemokines and cytokines are produced by cancer cells and
surrounding stromal cells and recruit leukocytes from the circulation to local sites
according to their chemokine gradient (176). Although tumor cells were first thought to
drive the cellular events underpinning tumor angiogenesis, evidence has now emerged for
a central role of tumor-infiltrating myeloid cells such as monocytes/macrophages,
neutrophils, and dendritic cells in this process (175, 178-180). Myeloid cells are a major
component of the inflammatory infiltrate frequently seen in primary tumors (181).
Classically, these cells protect organisms from pathogens, and eliminate dying cells.
However, only recently, mounting evidence indicates that the tumor microenvironment
alters myeloid cells by converting them into potent immunosuppressive cells.
Dendritic cells.
DCs are terminally differentiated myeloid cells that specialize in antigen processing and
presentation. Two major subsets of DCs are currently recognized: conventional DCs and
plasmacytoid DCs (182). Differentiated DCs reside in tissues as immature cells that
actively take up tissue antigens but are poor antigen presenters and do not promote
effector T cell differentiation (183). Only functionally activated DCs can effectively
process and present tumor antigen, migrate to lymph node and then stimulate effective
immune responses (184). It is well established that DCs in tumor bearing hosts do not
Page 32
18
adequately stimulate an immune response, and this potentially contributes to tumor
evasion of immune recognition (170). Multiple clinical studies have indicated that there
is a decreased presence and defective functionality of mature DCs in patients with breast,
non-small cell lung, pancreatic, cervical, hepatocellular or prostate cancer, or glioma
(185). DC migration and function are severely impaired by hypoxia and adenosine (186).
The transcription factor hypoxia-inducible factor 1α (HIF1α) is upregulated by DCs in
the hypoxic tumor environment and was shown to induce the expression of the adenosine
receptor, causing these DCs to drive the development of TH2 cells rather than that of
TH1 cells (187). Both phenotypically immature and phenotypically mature DCs may be
conditioned by the environment to support immune tolerance or immunosuppression
(188). MHC-II+CD11b
+CD11c
+ tumor infiltrating mouse DCs have been shown to
suppress CD8+ T cells and antitumor immune responses through arginase 1 (ARG1)
(188-190). The accumulation of indoleamine 2, 3-dioxygenase (IDO) expressing DCs
(most of which are pDCs) in tumor-bearing mice and in some patients with cancer
provides another mechanism of immune suppression, as IDO activity limits T cell growth
by depleting L-tryptophan (188, 191).
Macrophages.
Macrophages are a group of terminally differentiated myeloid cells that are closely
related to DCs. They are tissue-resident cells derived from monocytes circulating in the
peripheral blood. Their function in healthy individuals is to eliminate infectious agents,
promote wound healing and regulate adaptive immunity (180, 192). Activated
macrophages can be divided into M1 (classical activated) and M2 (alternative activated)
phenotypes. M1 or classically activated macrophages are activated by IFN-γ and bacterial
Page 33
19
products, express high levels of IL-12, and low levels of IL-10, and are tumoricidal (193-
195). By contrast, M2 or alternatively activated macrophages are activated by IL-4, IL-10,
IL-13 and glucocorticoid hormones, express high levels of IL-10 and ARG1, and low
levels of IL-12, and facilitate tumor progression (180, 196-198). Macrophages in tumors,
usually termed tumor-associated macrophages (TAMs), often resemble the M2 phenotype.
However, recent evidence suggested that the phenotype of TAMs varies with the stage of
tumor progression (199). M1 macrophages are often abundant in chronic inflammatory
sites, where tumors are initiated and start to develop. Then macrophages switch to an M2-
like phenotype as the tumor begins to invade, vascularize, and develop (199-201).
TAMs are ineffective antigen-presenting cells, and they produce CC-chemokine
ligand 22 (CCL22), which attracts Treg cells that inhibit T cell activation (202). Secretion
of prostaglandin E2 (PGE2) and TGF-β by TAMs further contributes to immune
suppression (203). TAMs can also cause T cell apoptosis through their expression of PD1
ligand 1 (PD-L1), which binds to its receptor programmed cell death protein 1 (PD-1) on
activated T cells (204). Mouse M2 macrophages produce ARG1, which deprives T cells
of the L-arginine that is necessary for their growth (201). Pro-angiogenic TAMs may
express the angiopoietin receptor TIE2 and/or have low expression levels of MHC
class II molecules, and they localize to hypoxic regions (205). TAMs that promote early
tumor cell invasion are enriched for WNT7B, a protein that is involved in normal
developmental and repair responses (206).
Neutrophils/granulocytes.
Page 34
20
Granulocytes are myeloid cells that are characterized by the presence of cytoplasmic
granules and a specific nuclear morphology. The most abundant type of granulocytes in
the body are neutrophils, which are also commonly referred to as polymorphonuclear
leukocytes owing to their polylobed nuclei (207). Granulocyte differentiation is regulated
by the coordinated expression of key myeloid transcription factors, with granulocytes and
macrophages differentiating from a common committed progenitor cell (208).
Neutrophils are produced within haematopoietic cords interspersed within the venous
sinuses of the bone marrow. Transcriptional profiling studies suggest that macrophages
represent the default myeloid cell, and that granulocytes arise through the selective
expression of a subset of transcription factors (e.g. Egr1, HoxB7 and STAT3), proteins
(e.g. S100A8, S100A9 and neutrophil elastase) and cytokines including G-CSF and GM-
CSF (86, 209, 210). Neutrophils are the most abundant circulating leukocyte in humans
and play a fundamental role in the innate immune response (211). The primary role of
neutrophils is to kill invading bacteria and certain fungal species through phagocytosis by
release of preformed granular enzymes and proteins, and by the production of a range of
oxygen species (206, 211, 212). However, the highly destructive capacity of these cells
also raises the potential for neutrophils to damage healthy tissues, which occurs in many
inflammatory diseases such as acute respiratory distress syndrome, inflammatory bowel
disease and rheumatoid arthritis (211, 213).
Myeloid cells are not released from the bone marrow until they reach full maturity, but
during inflammation, neutrophil precursors can be released (206). Human tumors can be
infiltrated by mature granulocytes, the numbers of which can be independent prognostic
factors for tumor recurrence (211, 213). Recent evidence has linked granulocytes, and
Page 35
21
particularly neutrophils, with tumor angiogenesis and metastasis, and has provided initial
clues about the immunoregulatory roles of these cells in cancer.
Tumor cells and tumor associated stromal cells produce neutrophil-attracting CXC-
chemokines and prokineticin 2 (the mammalian orthologue of BV8) (214). In the lungs,
tumor-derived G-CSF also mobilizes granulocytes to pre-metastatic niches and supports
subsequent metastasis formation. It is likely that granulocytes facilitate the angiogenic
switch by expressing MMP9, which promotes tumor angiogenesis by inducing VEGF
expression in neoplastic tissue (215). Mobilized granulocytes also release elastase, which
then enters endosomal compartments of neoplastic cells and degrades insulin receptor
substrate 1 (IRS1). Degradation of IRS1 facilitates interactions between phosphoinositide
3 kinase (PI3K) and the receptor for the mitogen platelet-derived growth factor (PDGF),
thus promoting tumor cell proliferation (216, 217).
In mice bearing 4T1 breast tumors, neutrophils inhibited the formation of tumor
metastases through direct antitumor effects mediated by reactive oxygen species (ROS)
(218). Similarly to macrophages, neutrophils have been shown to shift from an
antitumoral ‘N1’ phenotype to a pro-tumoral ‘N2’ phenotype in the cancer
microenvironment (219). TGF-β drives the N2 phenotype, and TGF-β blockade promotes
an N1 phenotype with antitumor activity (219). In lung adenocarcinoma and
mesothelioma models, TGF-β induces tumor-infiltrating neutrophils to develop a pro-
tumoral phenotype, which is characterized by ARG1 expression and low levels of TNF,
CCL3 and intercellular adhesion molecule 1 (ICAM1) (215, 220). In tumor-bearing
animals, depletion of N2 neutrophils led to an increase in CD8+ T cell activity (221).
Similar results were observed in human melanoma: serum amyloid A1 protein induced
Page 36
22
the expansion of IL-10 secreting neutrophil populations that were able to suppress the
antigen-specific proliferation of CD8+ T cells (222).
Origin of Myeloid-Derived Suppressor Cells (MDSCs)
Tumor-induced granulocytic hyperplasia is associated with tumor vasculogenesis and
escape from immunity via T cell suppression (211). Initially, these myeloid cells were
identified as granulocytes or monocytes; however, recent studies have revealed that this
hyperplasia is associated with populations of multipotent progenitor cells that have been
identified as MDSCs (223). MDSCs were originally identified in tumor-bearing mice as
cells that co-express integrin-αM (CD11b) and Myeloid Differentiation Antigen (GR-1,
also known as Ly6G/C); however, their phenotype in cancer is rather diverse (209, 224).
Mouse MDSCs have recently been identified on the basis of expression of lymphocyte
antigens Ly-6C and Ly-6G (209). CD11b+Ly-6G
lowLy-6C
hi cells have a monocytic-like
morphology, preferentially express iNOS, have increased T cell suppressive activity and
have been identified as monocytic-MDSCs (225). This contrasts with CD11b+Ly-6G
+Ly-
6Clow
cells that have a granulocyte-like morphology, express high levels of ARG1, and
are identified as granulocytic-MDSCs (G-MDSCs) which have a polymorphonuclear
(PMN) morphology (225) (Fig. 3). In addition to their specific markers, monocytic
MDSCs express varying levels of classic monocyte markers, such as F4/80 (also known
as EMR1), CD115 (also known as M-CSFR), 7/4 (also known as LY6B) and CCR2 (226).
They suppress CD8+ T cells predominantly via expression of the enzymes ARG1 and
Page 37
23
inducible nitric oxide synthase (iNOS) and through the production of reactive nitrogen
species (227). Monocytic MDSCs may also include progenitors that give rise to a subset
of CD11b+GR-1
lowLY6G
-F4/80
hiMHC-II
+ macrophages with potent immunosuppressive
properties (228).
The equivalent MDSCs in humans is defined as the CD14-CD11b
+CD33
+CD15
+
phenotype or cells that express the CD33 marker but lack the expression of markers of
mature myeloid and lymphoid cells and HLA-DR (207, 229). In human patients with
renal cell carcinoma and colorectal carcinoma, MDSCs account for a 10-fold higher level
in the circulation compared with ~0.5% of peripheral blood mononuclear cells in healthy
individuals (225). MDSCs with the phenotype LIN-HLA-DR
-CD33
+CD11b
+ have been
isolated from the blood of patients with glioblastoma, breast cancer, colon cancer, lung
cancer or kidney cancer (230, 231). The frequency of this immature cell population may
reflect the tumor burden, and a high frequency correlates with poor prognosis and
radiographic progression in patients with breast or colorectal cancer (179, 225).
Polymorphonuclear MDSCs and neutrophils are functionally and phenotypically different.
First, polymorphonuclear MDSCs are immunosuppressive. Second, polymorphonuclear
MDSCs express higher levels of CD115 and CD244 than neutrophils but lower levels of
CXCR1/2 (228). Third, compared with neutrophils, polymorphonuclear MDSCs are less
phagocytic, express higher levels of ARG1 and myeloperoxidase, have increased ROS
production and show reduced chemotaxis (207, 232). Similarly, although monocytic
MDSCs and inflammatory monocytes share a common phenotype and morphology, these
cell populations are functionally distinct. Monocytic MDSCs are highly
immunosuppressive, as they express, among other factors, high levels of both iNOS and
Page 38
24
ARG1. By contrast, iNOS and ARG1 are not coordinately upregulated in monocytes (221,
226) (Fig. 3). Furthermore, MDSCs include direct progenitors of DCs, macrophages and
granulocytes and are able to undergo terminal differentiation depending on the
microenvironment (227). It is clear that the myeloid lineage is globally altered in cancer
as a single, closely integrated system involving all terminally differentiated myeloid cells
and their pathologically activated immature progenitors (225, 230, 233). MDSCs are
generally defined as a heterogenous population of immune cells from the myeloid lineage
to which dendritic cells, macrophages and neutrophils also belong.
Myeloid cell mobilization and clearance.
The principal regulator of physiological granulopoiesis is G-CSF whose effects include
commitment of progenitor cells to the myeloid lineage, proliferation of granulocytic
precursors, reduction of transit time through the granulocytic compartment, and release of
mature cells from bone marrow (234). G-CSF exerts its effects through the G-CSF
receptor, which is a member of the class I cytokine receptor family. Mice that lack the G-
CSF receptor and humans who express a dominant negative receptor mutation are
profoundly neutropenic (235). IL-6, GM-CSF and IL-3 also stimulate granulopoiesis in
vivo, but in all three cases, single knock-out mice exhibit normal basal levels of
granulopoiesis, which suggests significant redundancy or reserve (236, 237).
To exit the bone marrow, myeloid cells must migrate across the sinusoidal endothelium
that separates the haematopoietic compartment from the circulation. Myeloid cells
migrate across the bone marrow endothelium through tight-fitting pores by a unique
process of trans-cellular migration, and pass through the cell body of the endothelium,
Page 39
25
rather than at cell-cell junctions (238, 239). Myeloid cells maintain G-CSF receptors at
high levels on their surface from early in their development; CXCR4, a G-protein
coupled receptor, is also expressed at low levels on the cell surface of mature myeloid
cells (240-242). The major ligand for CXCR4 is stromal-derived factor 1 (SDF-1), a
CXC chemokine that is produced constitutively by bone marrow stromal cells (243). The
role of CXCR4-SDF-1 interaction in regulating myeloid cells egress from the bone
marrow is further supported by the finding that Cxcr4 deletion in murine myeloid cells
results in increased neutrophil release, and by the observation that treatment with a
CXCR4 antagonist or blocking antibodies leads to rapid mobilization of neutrophils from
both human and mouse bone marrow (243-245).
Role of MDSCs in Regulating Anti-tumor Immunity
MDSCs exploit a variety of redundant mechanisms to influence both innate and adaptive
immune responses. MDSCs deplete nutrients which are required by lymphocytes,
specifically, L-arginine depletion through iNOS, ARG1-dependent consumption; and L-
tryptophan and L-cysteine deprivation via its consumption and sequestration (224) (Fig.
3). The depletion of these amino acids causes down-regulation of the ζ chain in the T cell
receptor (TCR) complex and proliferative arrest of antigen-activated T cells (246).
MDSCs generate oxidative stress, which is caused by the production of ROS and reactive
nitrogen species by MDSCs. Peroxynitrite and hydrogen peroxide are produced by
MDSCs, and these reactive species drive several molecular blocks in T cells, ranging
Page 40
26
from the loss of TCR ζ chain expression and interference with IL-2 receptor signaling to
the nitration and subsequent desensitization of the TCR (224, 233) (Fig. 3). MDSCs
interfere with lymphocyte trafficking and viability. MDSCs decrease the expression of
CD62L on naive T cells through expression of ADAM17 (disintegrin and
metalloproteinase domain containing protein 17) (247). MDSCs also decrease the number
and inhibit the function of mouse and human NK cells, mostly through membrane
contact-dependent mechanisms (248). MDSCs are involved in the activation and
expansion of Treg cell populations. MDSCs promote the clonal expansion of antigen-
specific natural Treg cells and also induce the conversion of naive CD4+ T cells into
induced Treg cells (249). Provided that MDSCs and T cells are in close proximity, the
factors that mediate MDSCs suppressive function can inhibit T-cell proliferation
regardless of the antigen specificity of the T cells. However evidence suggests that
MDSCs-mediated immunosuppression in peripheral lymphoid organs is mainly antigen-
specific (84). Stable contacts of antigen-specific interactions between antigen-presenting
cells and T cells are necessary for MDSCs-derived ROS and peroxynitrite to mediate
effects on the molecules on the surface of T cells that render the T cells unresponsive to
specific antigen (249, 250).
Accumulating evidence from tumor-bearing mice and human cancers indicates that the
induction and expansion of MDSCs in the tumor microenvironment is mediated by a
combined effect of multiple factors including cytokines, growth factors and pro-
inflammatory mediators. Neoplastic cells and tumor-associated stromal cells release
multiple tumor-derived soluble factors that perturb the myeloid compartment (89, 251).
Cytokines such as GM-CSF, G-CSF, M-CSF, stem cell factor (SCF; also known as KIT
Page 41
27
ligand), VEGF and IL-3 promote myelopoiesis and contribute, in part, to a blockade of
myeloid cell maturation (229). Tumor-derived soluble factors that are pro-inflammatory
(such as IL-1β, IL-6, S100A8 and S100A9), as well as cytokines released by activated T
cells (such as IFN-γ, IL-4, IL-10 and IL-13), initiate the immunosuppressive pathways
that commit immature myeloid cells to become MDSCs and then further promote the
differentiation of MDSCs towards immunosuppressive macrophages and DCs (251, 252).
The tumor-derived factors CCL2, CCL12, CXCL5, prokineticin 2, S100A8 and S100A9
recruit immature myeloid cells to the tumor stroma (87, 253, 254). Immature myeloid
cells are also attracted by CCL2 that is nitrated or nitrosylated in the tumor environment.
By contrast, effector CD8+ T cells are not recruited by modified CCL2, which may
explain the selective enrichment of myelomonocytic cells within mouse and human
tumors (255). Continuous stimulation of myelopoiesis and activation of immature
myeloid cells by tumor-derived soluble factors may drive the subsequent accumulation of
immunosuppressive MDSCs that support tumor promotion and form the metastatic niche.
Accordingly, the oncogenic program may have a greater influence on the functional
immunosuppressive activities of MDSCs than on their accumulation (179, 225).
Using the TRAMP Model to Investigate Prostate Tumor Development
The benefit of preclinical tumor models for evaluating cancer therapeutics depends
largely on whether the tumors growing in animals closely mimic the characteristics of the
human counterpart (256). The most frequently used preclinical models are those from
Page 42
28
tumor cell implantation, as they are easily controlled as compared with chemically
induced tumors or those developed from genetic alterations (146). Depending on the
source of the tumor cells, xenograft or syngeneic tumor cells/tissues are transplanted into
animals. While xenografted tumors must be grown in immune deficient animals,
syngeneic tumors are grown in animals whose immune systems are intact. This is an
especially desirable characteristic since the efficacy of cancer therapeutics can only be
truly evaluated in the presence of an intact host immune system (257).
Prostate cancer.
Prostate cancer is a leading cause of illness and death among men in the United States
and Western Europe. Autopsy studies have revealed small prostatic carcinomas in up to
29% of men 30 to 40 years of age and 64% of men 60 to 70 years of age (258). Initially,
hormone therapy or androgen-deprivation therapy is used for prostate cancer to lower the
levels of androgens through surgically removing the testicles or with drugs that stop the
testicles from making androgens or blocking androgen receptor (AR) signaling (259-261).
Overall, most men who develop prostate cancer (99%) are expected to live at least five
years after diagnosis. However, for men diagnosed with prostate cancer that has spread to
other parts of the body, the five-year survival rate drops to 28% (259). Eventually, many
men with metastatic prostate cancer develop castration-resistant disease (CRPC). This
means that the cancer is able to grow and continue to spread despite using hormone
therapy (262). At this stage of disease, effective treatment options are very limited. Until
recently, chemotherapeutic agents and immune therapy are able to prolong the mean life
span of patients (263). Sipuleucel-T (Provenge, Dendreon, Seattle, WA, USA) was
approved by the US FDA in April 2010 and is indicated for the treatment of
Page 43
29
asymptomatic or minimally symptomatic mCRPC (264). Sipuleucel-T is an autologous
cellular cancer vaccine that is designed to stimulate an immune response to prostate
cancer, consisting of peripheral blood mononuclear cells (PBMCs) obtained through
leukapheresis from each patient and cultured in vitro for 2–3 days with prostate cancer
antigen and with the cytokine GM-CSF. The myeloid cells isolated from patients undergo
maturation during the stimulation and present prostate cancer antigen in cells surface.
Once the cells are reinfused back to patients, they are able to activate adaptive immune
cells and induce an immune response to prostate cancer cells. Treatment with Sipuleucel-
T was able to improve the median overall survival for 4.1 months compared with control
arm (25.8 versus 21.7 months, p=0.03), after a median follow up of 34.1 months (265).
Chronic or recurrent inflammation has a role in the development of many types of cancer
in humans, including prostate cancer (39). Symptomatic prostatitis occurs in 9% or more
of men between 40 and 79 years of age; about half of these men have more than one
episode of prostatitis by 80 years of age (157, 266). Intake of antioxidants or nonsteroidal
anti-inflammatory drugs is correlated with a decreased risk of prostate cancer (39). Focal
atrophic lesions associated with chronic inflammation are often directly adjacent to
lesions of prostatic intraepithelial neoplasia, prostate cancers, or both (267-269).
Mounting clinical evidence suggests that the immune system plays an important role in
regulating prostate cancer development. As such, understanding the role of immune cells
within prostate cancer would provide invaluable insights about utilizing anti-tumor
immunity to fight this cancer.
TRAMP prostate model.
Page 44
30
Mouse and human prostate anatomy is dissimilar. The mouse prostate has a lobular
structure with four lobes—anterior, ventral, dorsal, and lateral. Alternatively, the human
prostate has one “lobe” divided into three zones: central, transitional, and peripheral (270,
271). The majority of human prostate cancer is found in the peripheral zone, which
comprises about 75% of the tissue in the prostate. The mouse dorsolateral lobe has been
described as the most similar to the human peripheral zone (257, 270, 272, 273).
The TRAMP (transgenic adenocarcinoma of the mouse prostate) model for prostate
cancer was generated and characterized in 1995–1997 (257, 270). In this model,
expression of both the large and small SV40 tumor antigens (T/tag) is regulated by the
prostate-specific rat probasin promoter (PB) (270). TRAMP mice developed epithelial
hyperplasia by 8 weeks of age (corresponding to sexual maturity), progressed to prostatic
intraepithelial neoplasia (PIN) by 18 weeks of age, and after 28 weeks of age, 100% of
the mice displayed lymphatic metastases, and approximately two-thirds displayed
pulmonary metastases (270). As disease develops in TRAMP mice, tumor tissue
histologically and biochemically resembles human disease with pathology ranging from
noncancerous PIN to aggressive adenocarcinoma of the prostate (Fig. 4) (274). TRAMP
mice exhibit progressive stages of prostate cancer ranging from PIN, cribriform structures,
and focal adenocarcinoma to extracapular extension, and seminal vesicle invasion with
metastasis to lymph nodes, adrenal glands, lung and bone (257, 275, 276). The versatility
of the TRAMP model has been extended further by the establishment of several TRAMP-
derived prostate tumor cells lines (including TRAMP-C1 and TRAMP-C2) that can be
injected into syngeneic male nontransgenic C57BL/6 mice to induce ectopic prostate
Page 45
31
tumorigenesis (257). The TRAMP model has been widely adopted for use in a variety of
studies designed to assess novel therapies directed against prostate cancer.
Rationale of Dissertation Study
STAT3 signaling is a major intrinsic pathway for cancer inflammation owing to its
frequent activation in malignant cells, and key role in regulating many genes crucial for
inflammation in the tumor microenvironment. Persistently activated STAT3 increases
tumor cell proliferation, survival, and invasion while suppressing anti-tumor immunity
(1). Many of the key immunoregulatory cytokines involved in cancer, including IL-6, IL-
12, IL-23, IFN-γ and GM-CSF, require activation of JAK1, JAK2 or both for subsequent
activation of STATs, and ultimate biological responses. SOCS proteins, CIS and SOCS1-
7, inhibit JAK-STAT signaling through a variety of mechanisms. SOCS proteins are
induced by cytokines, creating a negative feedback loop to prevent excessive activation
of cytokine-induced pathways. The predominant function of SOCS3 is inhibition of
signaling by the IL-6 family of cytokines, leading to inhibition of STAT3 activation.
SOCS3, as a negative regulator of STAT3, is a key pathological regulator of
inflammation as well as tumor immunity.
We generated mice with conditional knockout of SOCS3 in cells of the myeloid lineage
(LysMCre-SOCS3fl/fl mice) to investigate the function of myeloid SOCS3 in prostate
cancer development (139). We recently demonstrated that deletion of SOCS3 in myeloid
cells (neutrophils, DCs, monocytes/macrophages) leads to heightened activation of
Page 46
32
STAT3, and enhanced expression of proinflammatory genes including IL-1, TNF-α, IL-6
and iNOS (137). However, the role of SOCS3 in myeloid cells within the prostate tumor
microenvironment has not been explored. Therefore, the hypothesis of my thesis work
was to determine if SOCS3 is protective in prostate cancer by regulating antitumor
immunity through myeloid cells. To test this hypothesis, we evaluated the effect of
myeloid specific SOCS3 deletion on prostate cancer growth. In the present study, we
provide evidence that the loss of SOCS3 in myeloid cells enhances prostate tumor growth,
and is associated with elevated levels of Gr-1+CD11b
+ MDSC in tumors of SOCS3-
deficient mice. We identify G-CSF as a critical factor secreted by the tumor
microenvironment that promotes MDSC expansion via a STAT3/SOCS3-dependent
pathway. Abrogation of tumor-derived G-CSF inhibits tumor growth by reducing the
accumulation of MDSC (277).
Collectively, contained within is evidence highlighting the important role of myeloid
SOCS3 in regulating the development of myeloid cells and maintaining an
immunosuppressive milieu.
Page 47
33
Adopted from Shuai K, and Liu B, Nat. Rev. Immunol. 2003;3: 909-917.
Figure 1. JAK/STAT Signal Pathway in Cytokine Signaling. Ligand-induced receptor
oligomerization activates JAKs that subsequently phosphorylate tyrosine residues on the
cytoplasmic portion of the receptor. This allows the recruitment of STAT proteins to the
phosphorylated receptor by their Src-homology 2 (SH2) domains. STATs are
phosphorylated by the JAKs on a conserved tyrosine residue in the c-terminal domain to
form STAT homodimers or heterodimers. STATs dissociate from the receptor after
dimerization and translocate into the nucleus. In the nucleus, STATs bind to specific
response elements and induce gene transcription. The negative regulators of this pathway
Page 48
34
are phosphotyrosine phosphatases (PTPs), protein inhibitor of activated STAT (PIAS),
and suppressor of cytokine signaling (SOCS) proteins.
Page 49
35
Adopted from Baker BJ, et.al., Trends Immunol 2009;30: 392-400.; Kershaw NJ, et.al.,
Nat Struct Mol Biol 2013;20:469-76.
Figure 2. Suppressor Of Cytokine Signaling 3 (SOCS3) Protein Negatively
Regulates the JAK/STAT Pathway. (A). SOCS proteins contain an N-terminal variable
region, a classical SH2 domain, and a C-terminal SOCS box. The SOCS box interacts
with components of the ubiquitin ligase machinery and mediates proteosomal degradation
of associated proteins, most commonly, JAKs. SOCS1 and 3 contain a kinase inhibitory
region (KIR) which acts as a pseudosubstrate for JAKs, conferring inhibition of JAK
kinase activity. (B). Ribbon diagram of the JAK2 (beige)–SOCS3 (green)–gp130 (black)
complex. The gp130 peptide is located in the canonical phosphotyrosine-binding groove
on the SH2 domain of SOCS3, while the opposing face of the SH2 domain contacts
JAK2. SOCS3 binds to gp130 through the canonical phospho-tyrosine-binding groove on
A.
B.
Page 50
36
the SH2 domain with the BC loop (Ser73-Phe79). The SOCS3 KIR (Leu22-Ser29),
which is unstructured in isolation, folds back underneath the BC loop and sits in a groove
formed by the JAK2 activation loop.
Page 51
37
Adopted from Gabrilovich D, et.al., Nature Reviews Immunology 9, 162-174.
Figure 3. Suppressive Mechanisms Mediated by MDSCs. MDSCs consist of two main
subsets: monocytic MDSCs, which have a CD11b+LY6G
-LY6C
hi phenotype, and
granulocytic MDSCs, which have a CD11b+LY6G
+LY6C
low phenotype. The granulocytic
subset of MDSCs has increased activity of STAT3 and NADPH, which results in high
levels of reactive oxygen species (ROS). ROS and, in particular, peroxynitrite induce
post-translational modification of T-cell receptors and may cause antigen-specific T-cell
unresponsiveness. The monocytic MDSC subset has upregulated expression of iNOS, and
increased levels of NO which suppresses T-cell function through the inhibition of MHC
Page 52
38
class II expression and the induction of T-cell apoptosis. Both subsets have increased
levels of arginase 1, which causes T-cell suppression through depletion of L-arginine.
Page 53
39
Adopted from Liu Z, et.al., J Immunol 2008;180:6044-53.
Figure 4. TRAMP Tumor Grading Scale. Prostate lesions are scored using a 1–6 scale
that has been established for TRAMP mice. Noncancerous lesions are graded as 1
(normal tissue); 2 (low prostatic intraepithelial neoplasia); or 3 (high prostatic
intraepithelial neoplasia). Cancerous lesions (adenocarcinomas) are graded as 4 (well-
differentiated); 5 (moderately differentiated); or 6 (poorly differentiated).
Page 54
40
SOCS3 Deficiency in Myeloid Cells Promotes Tumor Development:
Involvement of STAT3 Activation and Myeloid-Derived Suppressor Cells
HAO YU1, YUDONG LIU
1, BRADEN C. MCFARLAND
1, JESSY S. DESHANE
2,
DOUGLAS R. HURST3, SELVARANGAN PONNAZHAGAN
3, ETTY N.
BENVENISTE1* AND HONGWEI QIN
1*
Running Title: Role of STAT3/SOCS3 in MDSC
Departments of Cell, Developmental and Integrative Biology1, Medicine
2 and Pathology
3,
University of Alabama at Birmingham, Birmingham, Alabama 35294
Cancer Immunol Res; 3(7)
Copyright
2015
Used by permission
Format adapted for dissertation
Page 55
41
SOCS3 Deficiency in Myeloid Cells Promotes Tumor Development: Involvement of
STAT3 Activation and Myeloid-Derived Suppressor Cells
Hao Yu1, Yudong Liu
1, Braden C. McFarland
1, Jessy S. Deshane
2, Douglas R. Hurst
3,
Selvarangan Ponnazhagan3, Etty N. Benveniste
1* and Hongwei Qin
1*
Running Title: Role of STAT3/SOCS3 in MDSC
Departments of Cell, Developmental and Integrative Biology1, Medicine
2 and Pathology
3,
University of Alabama at Birmingham, Birmingham, Alabama 35294
*Co-Corresponding Authors:
Dr. Hongwei Qin, Department of Cell, Developmental and Integrative Biology,
University of Alabama at Birmingham, 1918 University Boulevard, MCLM 390,
Birmingham, AL 35294. Phone: 205-934-2573. E-mail address: [email protected]
Dr. Etty (Tika) Benveniste, Department of Cell, Developmental and Integrative Biology,
University of Alabama at Birmingham, 1900 University Boulevard, THT 926A,
Birmingham, AL 35294. Phone: 205-934-7667. E-mail address: [email protected]
Financial Support: This work was supported in part by National Institutes of Health
grants CA158534 (ENB), CA132077 (SP) and CA133737 (SP), American Cancer
Society grants RSG-11-259-01-CSM (DRH) and IRG-60-001-53 (JSD),
METAvivorResearch and Support, Inc. (DRH) and a grant from the American Brain
Tumor Association in honor of Paul Fabbri (BCM).
Page 56
42
The authors disclose no potential conflicts of interest.
ABSTRACT
Suppressor Of Cytokine Signaling (SOCS) proteins are negative regulators of the
JAK/STAT pathway, and generally function as tumor suppressors. The absence of
SOCS3 in particular leads to heightened activation of the STAT3 transcription factor,
which has a striking ability to promote tumor survival while suppressing anti-tumor
immunity. We report for the first time that genetic deletion of SOCS3 specifically in
myeloid cells significantly enhances tumor growth, which correlates with elevated levels
of myeloid-derived suppressor cells (MDSC) in the tumor microenvironment, and
diminished CD8+ T-cell infiltration in tumors. The importance of MDSC in promoting
tumor growth is documented by reduced tumor growth upon depletion of MDSC.
Furthermore, SOCS3-deficient bone-marrow-derived cells exhibit heightened STAT3
activation and preferentially differentiate into the Gr-1+CD11b
+Ly6G
+ MDSC phenotype.
Importantly, we identify granulocyte-colony stimulating factor (G-CSF) as a critical
factor secreted by the tumor microenvironment that promotes development of MDSC via
a STAT3-dependent pathway. Abrogation of tumor-derived G-CSF reduces the
proliferation and accumulation of Gr-1+CD11b
+ MDSC and inhibits tumor growth. These
findings highlight the critical function of SOCS3 as a negative regulator of MDSC
development and function, via inhibition of STAT3 activation.
PRECIS
The loss of SOCS3, a negative regulator of STAT3, in myeloid cells, leads to the
development of MDSC and immunosuppressive activity within the tumor
Page 57
43
microenvironment, via a G-CSF/STAT3 axis. Thus, SOCS3 in myeloid cells may serve
as a therapeutic target to regulate anti-tumor immunity.
INTRODUCTION
The Janus Kinase/Signal Transducers and Activators of Transcription
(JAK/STAT) signaling pathway is utilized by numerous cytokines, and is critical for
induction of innate and adaptive immunity, and ultimately suppressing inflammatory and
immune responses (1). Of the seven STAT proteins, STAT3 has been implicated in
inducing and maintaining an immunosuppressive tumor microenvironment (2, 3). The
persistent activation of STAT3 mediates tumor-promoting inflammation, tumor survival
and invasion, and suppression of anti-tumor immunity (3). Hyperactivation of STAT3 is
implicated in tumor progression and poor patient prognosis in a large number of cancers,
including breast, prostate, melanoma, pancreatic cancer and brain tumors (3). Activating
mutations in STAT3 are rare, thus STAT3 hyperactivation is usually caused by an over-
abundance of cytokines such as IL-6 and/or dysregulation of endogenous negative
regulators, most notably, Suppressors Of Cytokine Signaling (SOCS) proteins (4-6).
There are eight SOCS proteins: SOCS1-7 and CIS, which inhibit the duration of
cytokine-induced JAK/STAT signaling. The predominant function of SOCS3 is
inhibition of STAT3 activation by inhibiting JAK kinase activity (5, 7). As such, loss of
SOCS3 expression leads to hyperactivation of JAKs and downstream STAT3, and
expression of STAT3-mediated genes.
SOCS3 is tightly linked to cancer cell proliferation, as well as cancer-associated
inflammation (8). Yet, the role of SOCS3 in various types of cancer is controversial;
Page 58
44
there are reports of either increased or reduced SOCS3 expression in breast and prostate
cancer (9-12). In other cancers, including gastric cancer, hepatocellular carcinoma, head
and neck squamous cell carcinoma and colon cancer, SOCS3 functions as a tumor
suppressor (8). The loss of SOCS3 expression by hypermethylation of the SOCS3
promoter is generally associated with poor clinical outcome, metastasis and aggressive
phenotype (9). In pre-clinical models, conditional knock-down of SOCS3 results in
accelerated tumorigenesis, which is associated with hyper-activation of various signaling
pathways, including STAT3 (8).
The inflammatory milieu within the microenvironment of cancers supports tumor
cell survival and angiogenesis. In tumor models and human cancers, innate leukocytes are
predominantly of myeloid origin, and are composed of tumor associated macrophages,
dendritic cells (DCs), and myeloid-derived suppressor cells (MDSC) (13, 14). MDSC,
characterized by expression of CD11b and Gr-1, are a heterogeneous population of
activated immature myeloid cells found within tumors that exert immunosuppressive
properties (13-15). MDSC have the capacity to suppress the cytotoxic activities of natural
killer (NK) and NKT cells, and adaptive immune responses elicited by CD4+ and CD8
+
T-cells (15, 16). Under normal conditions, Gr-1+CD11b
+ cells are maintained at very low
levels, but in patients with tumors, those cells can make up to 50% of total CD45+
hematopoietic cells in the tumor mass (17). Numbers of MDSC in tumors are negatively
associated with overall survival and treatment efficacy in patients with colorectal,
pancreatic and prostate cancer (18). In a tumor promoting environment, MDSC expand
and migrate from the bone marrow (BM) into the blood, spleen and tumors by numerous
cytokines and soluble mediators including M-CSF, G-CSF, GM-CSF, IL-6, IL-1, TNF-α
Page 59
45
and S100A8/S100A9 (14, 19-23). The expansion and functional activation of MDSC
involves numerous transcription factors, with STAT3 being the most crucial (24).
We recently demonstrated that deletion of SOCS3 in myeloid cells (neutrophils,
DCs, monocytes/macrophages) leads to heightened activation of STAT3, and enhanced
expression of proinflammatory genes including IL-1, TNF-α, IL-6 and iNOS (25, 26). To
investigate the function of myeloid SOCS3 in tumor growth, the TRAMP model of
prostate cancer was examined in SOCS3 floxed (SOCS3fl/fl
) and SOCS3 myeloid specific
deletion (SOCS3MyeKO
) mice. Our results demonstrate that prostate tumor growth is
significantly enhanced in SOCS3MyeKO
mice, and is associated with elevated levels of Gr-
1+CD11b
+ MDSC in tumors of SOCS3-deficient mice. We identify G-CSF as a critical
factor secreted by the tumor microenvironment that promotes MDSC expansion via a
STAT3/SOCS3-dependent pathway. Abrogation of tumor-derived G-CSF inhibits tumor
growth by reducing the accumulation of MDSC. Our results highlight the important role
of myeloid SOCS3 in regulating the development of MDSC, and demonstrate that in the
absence of SOCS3, an immunosuppressive milieu is established in the tumor
microenvironment that promotes tumor growth.
Page 60
46
MATERIALS AND METHODS
Mice. Mice 6-8 weeks of age were used. C57BL/6 and transgenic OT-1 mice (specific to
OVA peptide257-264) (27) were bred at the University of Alabama at Birmingham (UAB)
(Birmingham, AL). SOCS3 conditional knockout (SOCS3MyeKO
) mice were generated by
breeding of SOCS3fl/fl
mice (28) with mice expressing Cre recombinase under the control
of the LysM promoter, in which the conditional SOCS3 allele is excised in myeloid cells
(25). All experiments were approved by the IACUC of UAB.
Cell Lines and Primary Cells. Murine epithelial prostate cancer cells TRAMP-C1 and
TRAMP-C2 were cultured in DMEM medium with 10% FBS (Sigma, St. Louis, MO).
Conditioned media (CM) was generated by incubation of TRAMP-C1 or C2 cells for 48
h. Primary BM cells were flushed from the femur and tibia of mice (25, 26), and cultured
under conditions to generate MDCSs, including TRAMP CM, 10 ng/ml of murine GM-
CSF or 20 ng/ml of murine G-CSF for 3-4 days.
Peptides, Antibodies, Cytokines and Lentiviral Vector. OVA257-264 (SIINFEKL) was
obtained from AnaSpec (Fremont, CA). Antibodies (Abs) against phospho-STAT3
(Tyr705) and STAT3 were from Cell Signaling Technology (Beverly, MA), and Ab
against GAPDH was from Abcam (Cambridge, MA). Neutralizing Ab to G-CSF
(MAB414) and isotype control (IgG1) were from R&D Systems (San Diego, CA).
Neutralizing Ab to Gr-1 (RB6-8C5) and isotype control (IgG2b) were from BioXcell
(West Lebanon, NH). Recombinant murine G-CSF and GM-CSF were from R&D
Systems (San Diego, CA). Lentiviral expression of SOCS3 was generated as described
(29).
Page 61
47
Tumor Models and Ab Treatment. TRAMP-C1 or C2 cells (3.0 × 10⁶) in 100 μl of
PBS were s.c. inoculated in the flank of SOCS3fl/fl
or SOCS3MyeKO
mice. Tumor volumes
were calculated using the formula (0.5 × l × w2, where l is length and w is width). Three
weeks after s.c. inoculation of TRAMP-C1 cells, anti-mouse G-CSF Ab or isotype
control Ab (10 μg per mouse) was administered intraperitoneally every two days for a
total of 9 treatments (19, 20). For Gr-1+ cell depletion, mice were treated with anti-Gr-1
or control Ab (100 μg per mouse) every two days for a total of 9 treatments (21). In an
orthotopic model, 5.0 × 10⁵ TRAMP-C2 cells in 50 μl of PBS were injected into the
ventrolateral prostate gland, and analyzed after 30 days (30).
Flow Cytometry. Subcutaneous TRAMP tumors, prostate containing tumor, and normal
prostate tissue were minced into fragments, and incubated in collagenase solution in the
presence of DNase I (1 mg/ml) at 37°C for 1 h. Dissociated cells were passed through a
100 μm cell strainer. Spleens or BM extracted from mouse femurs were homogenized
and passed through a 100 μm cell strainer. Cells were resuspended and stained with direct
labeled Abs against: CD45 (30-F11), CD11b (M1/70), Gr-1 (RB6-8C5), Ly6G (1A8) and
Ly6C (HK1.4) (BioLegend); and B220 (RA3-6B2), F4/80 (BM8) and CD11c (N418)
(eBioscience). For T cell analysis, Abs from BioLegend were used: CD3 (145-2C11),
CD4 (GK1.5), CD8 (53-6.7), IFN-γ (XMG1.2) and Foxp3 (MF-14). Mouse G-CSF
R/CD114 Ab was from R&D Systems. For intracellular staining, Abs against phospho-
STAT3 (Y705) and phospho STAT5 (Y694) (BioLegend) were used. Staining was
performed as previously described (25, 31). All samples were analyzed on an LSRIIB
FACS instrument and were further analyzed with FlowJo software.
Page 62
48
Isolation of Gr-1+CD11b
+ Cells and Functional T-cell Suppression Assay. Single-cell
suspensions were prepared from tumors or spleens by digestion with Collagenase/Dispase
and DNase for 1 h at 37°C. Gr-1+CD11b
+ myeloid cells were sorted by FACSAria
(>90%). Splenocytes isolated from OT-1 mice were resuspended at 10 × 106 cells/ml and
incubated with CFSE (0.5 μM) at room temperature for 10 min. Suppression of T cells
was evaluated in a co-culture system with OT-1 splenocytes (1 × 10⁶ per well) with
increasing ratios of Gr-1+CD11b
+ cells in the presence of OVA peptide (3 μg/ml). OT-1
CD8+
T-cells were evaluated on day 3 by flow cytometry for CFSE dilution. The percent
of dividing cells was determined by drawing a gate outside a reference CFSE peak from
unstimulated CFSE+ cells.
Nitric Oxide Detection, IFN-γ Production and Arginase Activity Assay. Nitric oxide
production was evaluated in supernatants from co-cultured Gr-1+CD11b
+ cells and OT-1
T-cells using the Griess Reagent System (Promega) (25). The same culture supernatants
were evaluated for IFN-γ production using an IFN-γ ELISA kit (BioLegend) (25).
Arginase activity was measured in cell lysates using the QuantichromTM Arginase Assay
Kit (BioAssay Systems, Hayward, CA) following the manufacturer’s instructions.
Cytology of Gr-1+CD11b
+ Cells. CD45
+Gr-1
+CD11b
+ cells were sorted from spleens or
tumors of TRAMP-C1 tumor-bearing mice using FACSAria. Cytospin preparations were
stained with Diff-Quick modified Giemsa reagent (Polysciences) according to the
manufacturer's protocols.
In Vivo Cell Proliferation Assay. Naïve or TRAMP-C1 tumor-bearing mice were
injected intraperitoneally with 100 μg EdU (Invitrogen). After 20 h, mice were sacrificed
Page 63
49
and single-cell suspensions prepared from BM, spleens and tumors. Cells were stained
with Alexa Fluor 647 Azide according to the Click-iT® EdU Flow Cytometry Assay Kits
(Invitrogen) (31).
Histopathology and Immunofluorescence. Slides were stained with nuclear dye
(hematoxylin), and then stained with counterstain (eosin). Immunofluorescence was
performed with Abs to CD45 (1:50) or Gr-1 (1:100). Sections were fixed in 3%
formaldehyde, blocked with 10% donkey serum for 30 min, labeled with primary
antibody overnight at 4°C, then incubated with Alexa Fluor 568 secondary antibody
(Invitrogen; 1:200) along with DAPI (Invitrogen; 1:1000) for 1 h at room temperature.
Remaining steps were performed as described (25, 26).
RNA Isolation, RT-PCR, and Gene Expression Assays. Total RNA was isolated from
untreated or cytokine-stimulated MDSC (26). Five hundred ng of RNA was used to
reverse transcribe into cDNA and subjected to qRT-PCR. The abundance of mRNA was
normalized to that of 18S or HPRT (hypoxanthine guanine phosphoribosyl transferase)
and the data analyzed using the comparative Ct method to obtain relative quantitation
values (26).
Immunoblotting. Thirty μg of cell lysate was separated by electrophoresis on 10% SDS-
polyacrylamide gels and probed with specific Abs (26).
ELISA and Multiplex Analysis of Cytokine Expression. Tumor supernatants, TRAMP
tumor cell CM, and serum were collected and analyzed using a G-CSF ELISA kit (R&D
Systems). Millipore mouse cytokine/chemokine panel LI (MPXMCYTO-70K) (Millipore,
Page 64
50
Billerica, MA) was used for detection of cytokines and chemokines. Expression levels of
cytokines/chemokines were normalized to total protein levels.
Statistical Analyses. Graphpad Prism v6.01 was used for the graphs and for statistics.
ANOVA test was performed. All results are shown as mean ± SD. A p value of < 0.05
was considered to be statistically significant.
Page 65
51
RESULTS
Myeloid-specific SOCS3 Loss Promotes Tumor Growth. We utilized a syngeneic
tumor model of murine TRAMP C1 and C2 prostate cancer cells (32) inoculated into the
flank of C57BL/6 SOCS3fl/fl
and SOCS3MyeKO
mice. Tumor growth was significantly
increased in SOCS3MyeKO
mice compared with SOCS3fl/fl
mice (Fig. 1A).
Immunofluorescence staining demonstrates enhanced tumor infiltration of CD45+
hematopoietic-derived cells and Gr-1+ myeloid cells in SOCS3
MyeKO mice at day 45 (Fig.
1B). The Gr-1+CD11b
+ cell population was substantially increased in SOCS3
MyeKO mice
compared to SOCS3fl/fl
mice (Fig. 1C), whereas the percentages of other cells such as
macrophages (F4/80high
, CD11b+), DCs (CD11b
+, CD11c
+), B-cells (B220
+) and T-cells
(CD3+) were largely unchanged (Fig. 1D). Associated with the increased frequency of
Gr-1+CD11b
+ cells in the tumor, there was a significant reduction in infiltrating CD8
+ T-
cells in the tumors of SOCS3MyeKO
mice (Fig. 1E). The percentage of Gr-1+CD11b
+ cells
was elevated in the spleen of SOCS3MyeKO
mice compared to SOCS3fl/fl
mice (Fig. S1A),
although no changes in CD8+ T-cells were observed in the spleen (Fig. S1B). Similar
percentages of CD4+Foxp3
+CD25
+ regulatory T-cells (Treg) were detected in tumors
from SOCS3MyeKO
and SOCS3fl/fl
mice (Fig. S1C). To determine if the increased tumor
growth observed in SOCS3MyeKO
mice is due to enhanced MDSC function, depletion of
Gr-1+ MDSC with anti-Gr-1 neutralizing antibody in tumor-bearing mice was conducted.
TRAMP-C1 cells were injected into the flanks of SOCS3fl/fl
and SOCS3MyeKO
mice, and
anti-Gr-1 mAb or isotype control was administrated at day 24 (Fig. S1D). We observed
reduced levels of MDSC in the spleen of SOCS3MyeKO
mice after treatment with
Page 66
52
neutralizing Gr-1 mAb (Fig. S1E). More importantly, tumor growth was significantly
reduced after treatment with anti-Gr-1 mAb in SOCS3MyeKO
mice (Fig. 1F). These results
suggest a critical role of Gr-1+ MDSC in contributing to tumor growth in SOCS3
MyeKO
mice.
Gr-1+CD11b
+ Cells from Tumor-bearing Mice Suppress Antigen-specific T-cell
Responses. Gr-1+CD11b
+ cells from the tumors of TRAMP-C1 mice displayed multi-
lobed nuclei (Fig. 2A). Gr-1 identifies the monocyte and neutrophil markers Ly6C and
Ly6G, respectively. MDSC consist of two major subsets of Ly6G+Ly6C
low granulocytic
and Ly6G-Ly6C
hi monocytic cells (33). Gr-1
+CD11b
+ cells from TRAMP-C1 tumors are
a mixture of granulocytic and monocytic cells, with the majority of cells expressing
Ly6G (Fig. 2B). Further, higher percentages of both granulocytic and monocytic MDSC
were detected in SOCS3MyeKO
mice (Fig. 2B). We next examined the influence of SOCS3
on various MDSC effector functions, first testing the ability of Gr-1+CD11b
+ cells
isolated from tumors to suppress in vitro proliferation of OVA-specific CD8+ T-cells.
The immunosuppressive function of tumor-associated MDSC isolated from SOCS3MyeKO
mice was more potent than MDSC from SOCS3fl/fl
mice (Fig. 2C). MDSC from the
tumors of SOCS3MyeKO
mice decreased IFN-γ production by T-cells more potently (Fig.
S2A) and produced higher levels of nitrite upon co-culture with OT-1 splenocytes (Fig.
S2B) than MDSC from SOCS3fl/fl
mice. Gene expression analysis of MDSC isolated from
tumors was performed. Loss of SOCS3 increased expression of mediators of immune
suppression, including Arginase 1 and S100A8, with a trend of increased iNOS and
S100A9 (Fig. 2D). MDSC from the spleen of SOCS3MyeKO
mice inhibited T-cell
Page 67
53
proliferation more potently (Fig. S2C) and had significantly increased arginase activity
compared to MDSC from SOCS3fl/fl
mice (Fig. S2D). Furthermore, Gr-1+CD11b
+ cells
isolated from the BM, spleen and tumor of SOCS3MyeKO
mice had elevated STAT3
activation compared to cells from SOCS3fl/fl
mice (Fig. 2E).
Orthotopic Prostate Tumor Growth is Enhanced in SOCS3MyeKO
Mice. We next
investigated the functional importance of SOCS3 in myeloid cells in the prostate
microenvironment. TRAMP-C2 cells represent more advanced prostate cancer than
TRAMP-C1 cells, due to enhanced tumor growth and elevated expression of Ras and
Myc (34). TRAMP-C2 cells were injected intraprostatically into SOCS3fl/fl
and
SOCS3MyeKO
mice (30), and prostate weight compared amongst the two groups.
Orthotopic growth of TRAMP-C2 cells was significantly increased in SOCS3MyeKO
mice
(Fig. 3A). H&E staining of TRAMP-C2 tumors in SOCS3fl/fl
and SOCS3MyeKO
mice
showed poorly differentiated tumors compared to control prostate (Fig. 3B). Prostate
tumors from SOCS3MyeKO
mice have higher numbers of infiltrating CD45+ cells and Gr-
1+ cells (Fig. 3B). Orthotopic TRAMP-C2 tumors in SOCS3
MyeKO mice exhibited
increased Gr-1+CD11b
+ cell infiltration compared to SOCS3
fl/fl mice (Fig. 3C), and a
significant reduction in the percentage of infiltrating CD8+ T-cells (Fig. 3D).
Significantly higher levels of S100A8 and S100A9, inflammation and cancer-promoting
factors expressed by Gr-1+CD11b
+ MDSC (35), were detected in prostate tumors from
SOCS3MyeKO
mice compared with SOCS3fl/fl
mice (Fig. 3E).
Loss of SOCS3 Promotes Proliferation of Gr-1+CD11b
+ Cells. TRAMP tumor-bearing
mice developed splenomegaly compared to naïve mice, and SOCS3MyeKO
mice showed a
Page 68
54
significant increase in spleen size and weight compared to SOCS3fl/fl
mice (Fig. 4A).
Perturbed myelopoiesis and spleen hematopoiesis (36) may account for the accumulation
of Gr-1+CD11b
+ cells
in tumors and increased spleen size. To address the role of SOCS3
on myeloid cell proliferation, EdU assays were performed. We observed no differences in
myelopoiesis (Fig. S3A), spleen size (Fig. S3B) and BM myeloid cell proliferation (Fig.
S3C) between naïve SOCS3fl/fl
and SOCS3MyeKO
mice. Gr-1+CD11b
+ cells from the
spleen of naïve SOCS3fl/fl
mice had ~6.4% proliferating cells, and both TRAMP-C1
tumor-bearing SOCS3fl/fl
and SOCS3MyeKO
mice showed increased proliferating cells
compared with naïve mice (Fig. 4B). Additionally, the percentage of proliferating Gr-
1+CD11b
+ cells from the spleen of SOCS3
MyeKO mice was higher than that of SOCS3
fl/fl
mice. Similarly, Gr-1High
CD11b+
cells and Gr-1Int
CD11b+
cells from the BM of TRAMP-
C1 tumor-bearing SOCS3MyeKO
mice exhibited an enhanced proliferation rate (Fig. 4C).
TRAMP tumor development was associated with a 2 - 3 fold increase in circulating white
blood cells (WBC) in SOCS3MyeKO
mice (Fig. 4D), due to a 3 - 5 fold increase in
granulocytes (Fig. 4E). This suggests that factors secreted by the tumor may increase the
mobility of BM progenitor cells to enter the bloodstream.
Next, we cultured BM cells from SOCS3fl/fl
and SOCS3MyeKO
mice in the absence
or presence of TRAMP conditioned media (CM) for 4 days, and total numbers of Gr-
1+CD11b
+ cells were determined by flow cytometry. The absolute number of Gr-
1+CD11b
+ cells generated from SOCS3
MyeKO mice was ~ 2-fold higher than SOCS3
fl/fl
mice (Fig. S3D). Cell cycle analysis was performed, and results indicate increased
numbers of SOCS3fl/fl
BM cells in S and M phase compared with SOCS3fl/fl
BM cells
Page 69
55
(Fig. S3E). These results indicate that factors from the tumor microenvironment
contribute to the differentiation and proliferation of Gr-1+CD11b
+ cells, and that SOCS3
plays a critical role in regulating myeloid cell proliferative responses to these factors.
Absence of SOCS3 Enhances STAT3 Activation and BM Differentiation into Gr-
1+CD11b
+ MDSC. We utilized CM from TRAMP cells to assess functional effects on
MDSC. TRAMP CM, but not control medium, promoted BM cells to differentiate into
Gr-1+CD11b
+ cells, with higher percentages detected in SOCS3
MyeKO mice (Fig. 5A). In
addition, Gr-1+CD11b
+ cells from SOCS3
MyeKO mice incubated in TRAMP CM exhibited
a greater capacity to suppress antigen-specific T-cell proliferation (Fig. 5B) and IFN-γ
production (Fig. 5C) than did cells from SOCS3fl/fl
mice. Gr-1+CD11b
+ cells lacking
SOCS3 also produced elevated levels of nitrite (Fig. 5D) and had increased arginase
activity (Fig. 5E). Cells from SOCS3MyeKO
mice showed enhanced and prolonged STAT3
activation in the presence of TRAMP CM compared with SOCS3fl/fl
mice (Fig. 5F). Loss
of SOCS3 increased expression of Arginase 1, iNOS, S100A8, S100A9 and IDO1 (37)
by BM-derived Gr-1+CD11b
+ cells incubated with TRAMP CM (Fig. 5G). TRAMP CM
cultured Gr-1+CD11b
+ cells had low expression of MHC class II, with SOCS3
MyeKO cells
expressing less MHC class II compared to SOCS3fl/fl
cells (Fig. 5H), suggesting that loss
of SOCS3 maintains MDSC in a undifferentiated state. The majority of Gr-1+CD11b
+
cells generated in the presence of TRAMP CM express Ly6G (Fig. 5I). These results
demonstrate that prostate tumor cells secrete factors that drive the generation of Gr-
1+CD11b
+ cells from hematopoietic progenitor cells of the BM, and this effect is
amplified in the absence of SOCS3.
Page 70
56
G-CSF Induces the Differentiation of BM Precursors into Functional MDSC in a
STAT3-dependent Manner. We next examined potential prostate tumor-derived soluble
factors that may contribute to the generation of Gr-1+CD11b
+ cells. Expression of G-CSF
in the serum of naïve and TRAMP tumor-bearing mice was examined, and elevated
levels of G-CSF were detected from mice with orthotopic or s.c. TRAMP tumors (Fig.
S4A). Prostate tissues from orthotopic tumor-bearing mice and flank tumor tissue were
evaluated for G-CSF concentrations. Higher amounts of G-CSF were detected in TRAMP
tumor-bearing mice compared to tissue from naïve mice (Fig. 6A), although the levels of
G-CSF were not different between tumor-bearing SOCS3MyeKO
and SOCS3fl/fl
mice. CM
from TRAMP cells also contained G-CSF (Fig. 6A). The expression of G-CSF was
validated at the mRNA level (Fig. S4B). Enhanced and prolonged activation of STAT3
was observed in G-CSF treated BM cells from SOCS3MyeKO
mice (Fig. 6B), which was
validated by flow cytometry (Fig. 6C). G-CSF also activated STAT5 in Gr-1+CD11b
+
cells, but SOCS3 deficiency did not affect this response (Fig. 6C). SOCS3 mRNA
expression was induced by G-CSF treatment of cells from SOCS3fl/fl
mice, but not in cells
from SOCS3MyeKO
mice (Fig. 6D). Inclusion of G-CSF in BM cultures promoted
differentiation into Gr-1+CD11b
+ cells, with SOCS3
MyeKO cells having higher levels (Fig.
6E, left). To validate the negative regulatory role of SOCS3 in G-CSF promotion of
MDSC, SOCS3 overexpression was utilized (29). Overexpression of SOCS3 in BM cells
from SOCS3fl/fl
and SOCS3MyeKO
mice diminished the generation of Gr-1+CD11b
+ cells
in response to G-CSF (Fig. 6E, right). To substantiate the involvement of STAT3 in
MDSC differentiation, JAK and STAT3 inhibitors were tested. A significant reduction in
Page 71
57
Gr-1+CD11b
+ cells in the presence of the pan-JAK inhibitor P6 (38) or the STAT3
inhibitor Stattic (39) was observed (Fig. 6F). These results indicate that SOCS3
negatively regulates G-CSF induced generation of Gr-1+CD11b
+ cells by inhibiting
JAK/STAT3 activation. In the presence of G-CSF, loss of SOCS3 increased expression
of Arginase 1, iNOS, S100A8, S100A9 and IDO1 (Fig. 6G). Furthermore, Gr-1+CD11b
+
cells from SOCS3MyeKO
mice incubated in G-CSF exhibited a greater capacity to suppress
T-cell proliferation (Fig. 6H), and had increased arginase activity compared to Gr-
1+CD11b
+ cells from SOCS3
fl/fl mice (Fig. 6I). Thus, we identify G-CSF as an important
factor in the development of Gr-1+CD11b
+ MDSC via STAT3 activation, which is
regulated by SOCS3.
G-CSF Neutralization Limits Gr-1+CD11b
+ Cell Proliferation and Tumor Growth.
BM cells isolated from SOCS3fl/fl
and SOCS3MyeKO
mice were cultured in the presence of
TRAMP CM or G-CSF. Flow cytometric analysis demonstrates that addition of anti-G-
CSF Ab, but not isotype IgG, inhibits generation of Gr-1+CD11b
+ cells (Fig. S5A).
Neutralization of G-CSF partially inhibited BM cell proliferation in the presence of
TRAMP CM, and abolished proliferation induced by G-CSF (Fig. 7A).
The contribution of G-CSF to tumor growth was next assessed. TRAMP-C1 cells
were injected into the flanks of SOCS3fl/fl
and SOCS3MyeKO
mice, and anti-G-CSF mAb
or isotype control was administrated at day 22 (Fig. 7B). In both SOCS3fl/fl
and
SOCS3MyeKO
mice, tumor volume (Fig. 7B), weight (Fig. 7C) and serum G-CSF levels
(Fig. S5B) were significantly reduced after treatment with anti-G-CSF mAb. Circulating
WBC (Fig. S5C) and granulocytes (Fig. S5D) were also decreased after treatment with
Page 72
58
neutralizing G-CSF mAb in SOCS3MyeKO
mice. Moreover, infiltration of MDSC in
tumors was significantly reduced after treatment with neutralizing G-CSF mAb (Fig. 7D),
as were levels of MDSC in the spleen of SOCS3MyeKO
mice, but not SOCS3fl/fl
mice (Fig.
7E). These data highlight the importance of myeloid SOCS3 in regulating prostate tumor
growth in response to G-CSF. To exclude a direct action of anti-G-CSF Ab on TRAMP-
C1 tumor cells, G-CSFR expression was assessed. We observed high levels of G-CSFR
expression on spleen or tumor Gr-1+ cells compared with TRAMP-C1 tumor cells and
non-myeloid CD11b- cells from tumor-bearing mice (Fig. S5E).
Page 73
59
DISCUSSION
We demonstrate that SOCS3 expression in myeloid cells is an important determinant of
tumor growth, indicating a critical influence of the tumor microenvironment in cancer
progression. The loss of SOCS3 in myeloid cells promotes the differentiation of BM-
derived progenitor cells into Gr-1+CD11b
+ MDSC, and enhances the immunosuppressive
functions of these cells. Importantly, STAT3 activation is essential for this process.
Tumor-derived G-CSF is crucial for the mobilization and recruitment of Gr-1+CD11b
+
MDSC to tumors, where they decrease the presence of CD8+ T-cells. Neutralization of
G-CSF is effective in limiting the differentiation and functionality of MDSC, which in
vivo manifests as restricted tumor growth. These findings establish a circuitry between
MDSC, tumor cells and G-CSF in the tumor microenvironment; G-CSF secreted by
tumor cells promotes the recruitment and differentiation of MDSC, which is dependent
on STAT3 activation in MDSC. In the absence of SOCS3, this response and circuitry is
amplified (Fig. 7F). These results support a role for SOCS3 in repressing MDSC
differentiation, which ultimately relieves immunosuppression in the prostate tumor
microenvironment.
Persistent STAT3 activation is associated with poor prognosis in many cancer
types, including prostate cancer patients (40). Loss of the androgen receptor (AR) leads
to the development of prostate cancer stem cells, which requires STAT3 activation (41).
Stem-like cells from patients with prostate cancer secrete high levels of IL-6 and exhibit
hyperactivation of STAT3 (42). STAT3 activation in cells of the hematopoietic lineage is
Page 74
60
also associated with creating a tumor microenvironment conducive to tumor growth. This
is especially true for MDSC, which rely on STAT3 for differentiation and functionality.
Ablation of STAT3 in multiple lineages of immune cells (neutrophils, NK cells, DCs)
enhanced their anti-tumor activity (39). While MDSC were not directly examined,
heightened activation of STAT3 in MDSC, as shown by our study, may contribute to
tumor immune tolerance. MDSC lacking SOCS3 with STAT3 hyperactivation have
potent immunosuppressive capabilities such as inhibition of antigen-specific CD8+ T-cell
proliferation and IFN-γ production, and enhanced nitrite production and arginase activity.
Also, SOCS3-deficient MDSC expressed MHC Class II at lower levels than SOCS3
wild-type MDSC, suggestive of an immature suppressive phenotype. Circulating MDSC
from prostate cancer patients displayed reduced expression of HLA-DR compared to age-
matched controls, and had more potent ability to suppress T-cell proliferation (43). It will
be informative to examine SOCS3 expression and STAT3 activation status in prostate
tumor cells, prostate stem cells and prostate tumor-associated MDSC to determine the
functional impact of SOCS3/STAT3 in patients with prostate cancer. Nonetheless, our
findings clearly demonstrate the importance of SOCS3 in restricting MDSC-mediated
anti-tumor immunity.
Using TRAMP C1/C2 cell lines in immune competent mice, elevated levels of
MDSC were detected in the tumors of SOCS3MyeKO
mice compared to SOCS3fl/fl
mice, in
both flank and orthotopic models. This was associated with a decrease of CD8+ T-cells
in the tumor, which supports the notion that MDSC interfere with T-cell activation and
proliferation. MDSC also selectively expand Foxp3+CD25
+ Treg, which promote tumor
Page 75
61
growth by a variety of mechanisms (44). In our studies, Foxp3+ Treg were present at
comparable levels in tumors from both SOCS3MyeKO
and SOCS3fl/fl
mice, thus, Treg may
not have a prominent role in the TRAMP prostate cancer model (45).
G-CSF plays a crucial role in hematopoiesis by stimulating the proliferation,
differentiation and survival of myeloid progenitor cells, particularly cells within the
granulocytic lineage (28). JAK1, JAK2 and TYK2 are recruited to the G-CSF receptor
upon stimulation with G-CSF, and then in turn activate STAT1, STAT3 and STAT5, of
which STAT3 is most important. SOCS3 is induced by G-CSF in myeloid cells, and
serves as a negative regulator of G-CSF-induced cellular responses by binding to the G-
CSF receptor (28, 46). G-CSF is one of a number of soluble mediators that promote the
expansion and migration of MDSC from the bone marrow to tumors. While the levels of
G-CSF were comparable in SOCS3MyeKO
and SOCS3fl/fl
tumor-bearing mice,
SOCS3MyeKO
BM-derived cells are hyper-responsive to G-CSF, as documented by
increased duration and intensity of G-CSF-induced STAT3 phosphorylation, which led to
MDSC differentiation at a greater percentage than cells from SOCS3fl/fl
mice. In addition,
G-CSF-induced MDSC from SOCS3MyeKO
tumor-bearing mice exhibited a greater
capacity to suppress antigen-specific T-cell proliferation. Our in vivo findings
demonstrate that treatment of tumor-bearing mice with neutralizing G-CSF antibody
reduced circulating granulocytic cells as well as infiltration of MDSC in tumors. These
findings highlight the critical role of tumor-derived G-CSF in MDSC development, and
the importance of SOCS3 as an essential negative regulator of this process. SOCS3
expression in MDSC negatively regulates the expression of soluble mediators such as
Page 76
62
S100A8 and S100A9 and products of iNOS and arginase 1 that support an
immunosuppressive milieu in tumors. In the absence of SOCS3, MDSC are hyper-
responsive to tumor-produced cytokines such as G-CSF, and aberrantly activate STAT3,
which in turn contributes to chronic cancer-related inflammation and suppression of anti-
tumor immune responses.
Clinical information regarding SOCS3 expression in prostate cancer is
inconclusive at this time. Pierconti et al, (9) demonstrated that methylation of the SOCS3
promoter was significantly associated with intermediate-high grade Gleason score and
with an unfavorable outcome. In benign prostate hyperplasia and normal controls, the
SOCS3 promoter was unmethylated. Analysis of the Oncomine database demonstrates
that SOCS3 mRNA expression is significantly lower in prostate carcinoma compared to
prostate cancer precursor (Luo dataset), but the Tomlins dataset shows the opposite
results (47). Data from cBioPortal (Prostate Adenocarcinoma MSKCC) indicates that
prostate cancer patients with SOCS3 mRNA overexpression trend towards a longer
disease-free time than patients with “normal” levels of SOCS3 mRNA (48). Thus, there
is clearly dysregulation of SOCS3 gene expression in patients with prostate cancer, but
the functional and clinical relevance is still under investigation. Nonetheless, it is clear
that a variety of mechanisms, including SOCS3 dysregulation and abundant IL-6
production, do contribute to hyperactivation of JAK/STAT pathway in animal models of
prostate cancer and patients (4, 42). Inhibitors of IL-6, JAKs and STAT3 are being
considered in the context of prostate cancer (4), and have already proven beneficial in
animal models (42). Furthermore, peptides that mimic the SOCS Kinase Inhibitory
Page 77
63
Region (KIR), which is responsible for binding to JAKs and suppressing downstream
STAT3 activation (49), may prove beneficial in prostate cancer.
These studies not only highlight the significance of the STAT3/SOCS3 pathway
in regulating the differentiation and function of MDSC in cancer, but also identify this
intricate protein network as important therapeutic targets to eliminate MDSC-mediated
immunosuppression. This is especially important in light of the recent finding that MDSC
are responsible for resistance to immune check-point inhibitor, and that elimination of
MDSC led to cures of experimental, metastatic tumors (50).
Page 78
64
ACKNOWLEDGMENTS
The assistance of the UAB Comprehensive Arthritis, Musculoskeletal, and
Autoimmunity Center Comprehensive Flow Cytometry Core (P30 AR48311) is
gratefully acknowledged.
Author contributions: H.Y., J.S.D., E.N.B., and H.Q. designed research; H.Y., Y.L.,
B.C.M, and H.Q. performed research; H.Y., E.N.B., and H.Q. analyzed data; and H.Y.,
J.S.D., D.R.H., S.P., E.N.B., and H.Q. wrote the manuscript.
Page 79
65
REFERENCES
1. O'Shea JJ, Plenge R. JAK and STAT signaling molecules in immunoregulation
and immune-mediated disease. Immunity 2012;36:542-50.
2. Brantley EC, Benveniste EN. Signal transducer and activator of transcription-3: a
molecular hub for signaling pathways in gliomas. Mol Cancer Res 2008;6:675-84.
3. Yu H, Pardoll D, Jove R. STATs in cancer inflammation and immunity: a leading
role for STAT3. Nat Rev Cancer 2009;9:798-809.
4. Guo Y, Xu F, Lu T, Duan Z, Zhang Z. Interleukin-6 signaling pathway in targeted
therapy for cancer. Cancer Treat Rev 2012;38:904-10.
5. Yoshimura A, Naka T, Kubo M. SOCS proteins, cytokine signalling and immune
regulation. Nat Rev Immunol 2007;7:454-65.
6. Li Y, de Haar C, Peppelenbosch MP, van der Woude CJ. SOCS3 in immune
regulation of inflammatory bowel disease and inflammatory bowel disease-related
cancer. Cytokine Growth Factor Rev 2012;23:127-38.
7. Babon JJ, Kershaw NJ, Murphy JM, Varghese LN, Laktyushin A, Young SN, et
al. Suppression of cytokine signaling by SOCS3: characterization of the mode of
inhibition and the basis of its specificity. Immunity 2012;36:239-50.
8. Inagaki-Ohara K, Kondo T, Ito M, Yoshimura A. SOCS, inflammation, and
cancer. Jakstat 2013;2:e24053.
9. Pierconti F, Martini M, Pinto F, Cenci T, Capodimonti S, Calarco A, et al.
Epigenetic silencing of SOCS3 identifies a subset of prostate cancer with an
aggressive behavior. Prostate 2011;71:318-25.
10. Calarco A, Pinto F, Pierconti F, Sacco E, Marrucci E, Totaro A, et al. Role of
SOCS3 evaluated by immunohistochemical analysis in a cohort of patients
affected by prostate cancer: preliminary results. Urologia 2012;79 Suppl 19:4-8.
11. Puhr M, Santer FR, Neuwirt H, Susani M, Nemeth JA, Hobisch A, et al. Down-
regulation of suppressor of cytokine signaling-3 causes prostate cancer cell death
through activation of the extrinsic and intrinsic apoptosis pathways. Cancer Res
2009;69:7375-84.
12. Kneitz B, Krebs M, Kalogirou C, Schubert M, Joniau S, van Poppel H, et al.
Survival in patients with high-risk prostate cancer is predicted by miR-221, which
regulates proliferation, apoptosis, and invasion of prostate cancer cells by
inhibiting IRF2 and SOCS3. Cancer Res 2014;74:2591-603.
13. Gabrilovich DI, Ostrand-Rosenberg S, Bronte V. Coordinated regulation of
myeloid cells by tumours. Nat Rev Immunol 2012;12:253-68.
14. Khaled YS, Ammori BJ, Elkord E. Myeloid-derived suppressor cells in cancer:
recent progress and prospects. Immunol Cell Biol 2013;91:493-502.
15. Talmadge JE, Gabrilovich DI. History of myeloid-derived suppressor cells. Nat
Rev Cancer 2013;13:739-52.
16. Mauti LA, Le Bitoux MA, Baumer K, Stehle JC, Golshayan D, Provero P, et al.
Myeloid-derived suppressor cells are implicated in regulating permissiveness for
tumor metastasis during mouse gestation. J Clin Invest 2011;121:2794-807.
17. Murdoch C, Muthana M, Coffelt SB, Lewis CE. The role of myeloid cells in the
promotion of tumour angiogenesis. Nat Rev Cancer 2008;8:618-31.
18. Vanneman M, Dranoff G. Combining immunotherapy and targeted therapies in
cancer treatment. Nat Rev Cancer 2012;12:237-51.
Page 80
66
19. Shojaei F, Wu X, Qu X, Kowanetz M, Yu L, Tan M, et al. G-CSF-initiated
myeloid cell mobilization and angiogenesis mediate tumor refractoriness to anti-
VEGF therapy in mouse models. Proc Natl Acad Sci U S A 2009;106:6742-7.
20. Waight JD, Hu Q, Miller A, Liu S, Abrams SI. Tumor-derived G-CSF facilitates
neoplastic growth through a granulocytic myeloid-derived suppressor cell-
dependent mechanism. PLoS One 2011;6:e27690.
21. Bayne LJ, Beatty GL, Jhala N, Clark CE, Rhim AD, Stanger BZ, et al. Tumor-
derived granulocyte-macrophage colony-stimulating factor regulates myeloid
inflammation and T cell immunity in pancreatic cancer. Cancer Cell 2012;21:822-
35.
22. Zhao X, Rong L, Zhao X, Li X, Liu X, Deng J, et al. TNF signaling drives
myeloid-derived suppressor cell accumulation. J Clin Invest 2012;122:4094-104.
23. Cheng P, Corzo CA, Luetteke N, Yu B, Nagaraj S, Bui MM, et al. Inhibition of
dendritic cell differentiation and accumulation of myeloid-derived suppressor
cells in cancer is regulated by S100A9 protein. J Exp Med 2008;205:2235-49.
24. Waight JD, Netherby C, Hensen ML, Miller A, Hu Q, Liu S, et al. Myeloid-
derived suppressor cell development is regulated by a STAT/IRF-8 axis. J Clin
Invest 2013;123:4464-78.
25. Qin H, Holdbrooks AT, Liu Y, Reynolds SL, Yanagisawa LL, Benveniste EN.
SOCS3 deficiency promotes M1 macrophage polarization and inflammation. J
Immunol 2012;189:3439-48.
26. Qin H, Yeh W-I, De Sarno P, Holdbrooks AT, Liu Y, Muldowney MT, et al.
Signal transducer and activator of transcription-3/suppressor of cytokine
signaling-3 (STAT3/SOCS3) axis in myeloid cells regulates neuroinflammation.
Proc Natl Acad Sci U S A 2012;109:5004-9.
27. Rodriguez PC, Quiceno DG, Zabaleta J, Ortiz B, Zea AH, Piazuelo MB, et al.
Arginase I production in the tumor microenvironment by mature myeloid cells
inhibits T-cell receptor expression and antigen-specific T-cell responses. Cancer
Res 2004;64:5839-49.
28. Croker BA, Metcalf D, Robb L, Wei W, Mifsud S, DiRago L, et al. SOCS3 is a
critical physiological negative regulator of G-CSF signaling and emergency
granulopoiesis. Immunity 2004;20:153-65.
29. Park KW, Nozell SE, Benveniste EN. Protective role of STAT3 in NMDA and
glutamate-induced neuronal death: negative regulatory effect of SOCS3. PLoS
One 2012;7:e50874.
30. Gurusamy D, Gray JK, Pathrose P, Kulkarni RM, Finkleman FD, Waltz SE.
Myeloid-specific expression of Ron receptor kinase promotes prostate tumor
growth. Cancer Res 2013;73:1752-63.
31. Liu Y, Holdbrooks AT, De Sarno P, Rowse AL, Yanagisawa LL, McFarland BC,
et al. Therapeutic efficacy of suppressing the JAK/STAT pathway in multiple
models of experimental autoimmune encephalomyelitis. J Immunol 2014;192:59-
72.
32. Greenberg NM, DeMayo F, Finegold MJ, Medina D, Tilley WD, Aspinall JO, et
al. Prostate cancer in a transgenic mouse. Proc Natl Acad Sci U S A
1995;92:3439-43.
Page 81
67
33. Youn JI, Nagaraj S, Collazo M, Gabrilovich DI. Subsets of myeloid-derived
suppressor cells in tumor-bearing mice. J Immunol 2008;181:5791-802.
34. Isayeva T, Chanda D, Kallman L, Eltoum IE, Ponnazhagan S. Effects of sustained
antiangiogenic therapy in multistage prostate cancer in TRAMP model. Cancer
Res 2007;67:5789-97.
35. Acharyya S, Oskarsson T, Vanharanta S, Malladi S, Kim J, Morris PG, et al. A
CXCL1 paracrine network links cancer chemoresistance and metastasis. Cell
2012;150:165-78.
36. Sio A, Chehal MK, Tsai K, Fan X, Roberts ME, Nelson BH, et al. Dysregulated
hematopoiesis caused by mammary cancer is associated with epigenetic changes
and hox gene expression in hematopoietic cells. Cancer Res 2013;73:5892-904.
37. Smith C, Chang MY, Parker KH, Beury DW, DuHadaway JB, Flick HE, et al.
IDO is a nodal pathogenic driver of lung cancer and metastasis development.
Cancer Discov 2012;2:722-35.
38. Meares GP, Liu Y, Rajbhandari R, Qin H, Nozell SE, Mobley JA, et al. PERK
dependent activation of JAK1 and STAT3 contributes to ER stress induced
inflammation. Mol Cell Biol 2014;34:3911-25.
39. Vasquez-Dunddel D, Pan F, Zeng Q, Gorbounov M, Albesiano E, Fu J, et al.
STAT3 regulates arginase-I in myeloid-derived suppressor cells from cancer
patients. J Clin Invest 2013;123:1580-9.
40. Mora LB, Buettner R, Seigne J, Diaz J, Ahmad N, Garcia R, et al. Constitutive
activation of STAT3 in human prostate tumors and cell lines: direct inhibition of
STAT3 signaling induces apoptosis of prostate cancer cells. Cancer Res
2002;62:6659-66.
41. Schroeder A, Herrmann A, Cherryholmes G, Kowolik C, Buettner R, Pal S, et al.
Loss of androgen receptor expression promotes a stem-like cell phenotype in
prostate cancer through STAT3 signaling. Cancer Res 2014;74:1227-37.
42. Kroon P, Berry PA, Stower MJ, Rodrigues G, Mann VM, Simms M, et al. JAK-
STAT blockade inhibits tumor initiation and clonogenic recovery of prostate
cancer stem-like cells. Cancer research 2013;73:5288-98.
43. Vuk-Pavlovic S, Bulur PA, Lin Y, Qin R, Szumlanski CL, Zhao X, et al.
Immunosuppressive CD14+HLA-DRlow/- monocytes in prostate cancer. Prostate
2010;70:443-55.
44. Nagaraj S, Youn JI, Gabrilovich DI. Reciprocal relationship between myeloid-
derived suppressor cells and T cells. J Immunol 2013;191:17-23.
45. Degl'Innocenti E, Grioni M, Capuano G, Jachetti E, Freschi M, Bertilaccio MT, et
al. Peripheral T-cell tolerance associated with prostate cancer is independent from
CD4+CD25+ regulatory T cells. Cancer Res 2008;68:292-300.
46. Hortner M, Nielsch U, Mayr LM, Johnston JA, Heinrich PC, Haan S. Suppressor
of cytokine signaling-3 is recruited to the activated granulocyte-colony
stimulating factor receptor and modulates its signal transduction. J Immunol
2002;169:1219-27.
47. Oncomine. Prostate cancer 2015 [cited 2014 10 December]; Available from:
https://www.oncomine.org/resource/main.html#a%3A985%3Bd%3A46%3Bdso
%3AgeneOverex%3Bdt%3ApredefinedClass%3Bec%3A%5B2%5D%3Bepv%3
A150001.151078%2C2937%2C3508%3Bet%3Aover%3Bf%3A33306%3Bg%3A
Page 82
68
9021%3Bgt%3Aboxplot%3Bp%3A200000762%3Bpg%3A1%3Bpvf%3A3483%
2C36061%2C150003%2C150004%3Bscr%3Adatasets%3Bss%3Aanalysis%3Bv
%3A18
48. Genomics cfC. Prostate Adenocarcinoma (MSKCC, Cancer Cell 2010). 2015;
Available from:
http://www.cbioportal.org/index.do?cancer_study_id=prad_mskcc&genetic_profil
e_ids_PROFILE_MUTATION_EXTENDED=prad_mskcc_mutations&genetic_p
rofile_ids_PROFILE_COPY_NUMBER_ALTERATION=prad_mskcc_cna&gen
etic_profile_ids_PROFILE_MRNA_EXPRESSION=prad_mskcc_mrna_zbynorm
&Z_SCORE_THRESHOLD=2.0&data_priority=0&case_set_id=prad_mskcc_co
mplete&case_ids=&gene_set_choice=user-defined-
list&gene_list=SOCS3%0D%0A&clinical_param_selection=null&tab_index=tab
_visualize&Action=Submit
49. Madonna S, Scarponi C, Doti N, Carbone T, Cavani A, Scognamiglio PL, et al.
Therapeutical potential of a peptide mimicking the SOCS1 kinase inhibitory
region in skin immune responses. Eur J Immunol 2013;43:1883-95.
50. Kim K, Skora AD, Li Z, Liu Q, Tam AJ, Blosser RL, et al. Eradication of
metastatic mouse cancers resistant to immune checkpoint blockade by
suppression of myeloid-derived cells. Proc Natl Acad Sci U S A 2014;111:11774-
9.
Page 83
69
FIGURES
Figure 1. Myeloid-specific SOCS3 Loss Promotes Tumor Growth. (A) SOCS3fl/fl
(n=25) and SOCS3
MyeKO (n=22) mice were inoculated s.c. with 3.0 x 10
6 TRAMP-C1 or
Page 84
70
C2 cells. Tumor size is indicated as volume (mm3 ± SD), and was evaluated up to 45 days.
(B) H&E staining of TRAMP-C1 tumors from mice at 45 days. Scale bar, 50 μm.
Immunofluorescence staining of tumor infiltrating CD45+ or Gr-1
+ cells, n = 3 for
SOCS3fl/fl
mice, n = 3 for SOCS3MyeKO
mice. Scale bar, 45 μm. (C) Flow cytometry plot
of Gr-1+CD11b
+ cells from tumors of TRAMP-C1 mice (top), and quantification of
tumor-infiltrating Gr-1+CD11b
+ cells (bottom) (n = 7 - 8 for SOCS3
fl/fl mice or
SOCS3MyeKO
mice). (D) SOCS3fl/fl
(n=3) and SOCS3
MyeKO (n=3) mice were inoculated s.c.
with 3.0 x 10⁶ TRAMP-C1 cells. After 45 days of inoculation, tumor infiltrating CD45
+
cells were gated, and the percentage of the indicated cell subsets determined by flow
cytometry. (E) Flow cytometry plot of CD3+ and CD8
+ T-cells (gated in boxes) from
tumors of TRAMP-C1 mice (top), and quantification of tumor-infiltrating CD8+ T-cells
(bottom) (n = 8 - 10 for SOCS3fl/fl
mice or SOCS3MyeKO
mice). (F) SOCS3fl/fl
and
SOCS3MyeKO
mice were inoculated s.c with 3.0 x 10⁶ TRAMP-C1 cells. At 24 days, mice
were randomly assigned to receive anti-Gr-1 or isotype antibodies (100 μg per mouse)
every two days for a total 9 treatments (n = 5 for SOCS3fl/fl
mice, n = 5 for SOCS3MyeKO
mice). Tumor size indicated as volume (mean mm3
± SD) was evaluated at 41 days.
*p<0.05 and **p<0.01.
Page 85
71
Figure 2. Gr-1+CD11b
+ Cells from SOCS3
MyeKO Tumor-Bearing Mice Suppress
Antigen-specific T-cell Responses. (A) Diff-Quick stain of cytospin preparation of
CD45+Gr-1
+CD11b
+ cells from TRAMP-C1 tumors at 42 days. (B) Flow cytometric
analysis of myeloid cells in tumors formed by TRAMP-C1 cells at 42 days. Numbers
indicate the % of CD45+CD11b
+Ly6G
+ or CD45
+CD11b
+Ly6C
+ cells. Representative of
3 experiments. (C) CD45+Gr-1
+CD11b
+ cells were isolated from TRAMP-C1 tumors by
flow cytometry at 42 days, and antigen-specific suppression of CD8+ T-cells evaluated in
Page 86
72
a co-culture assay. Splenocytes from OT-1 transgenic mice were cultured in the presence
of increasing ratios of Gr-1+CD11b
+ cells and stimulated with OVA derived peptide.
Proliferation of OVA-specific CD8+ T-cells was evaluated by flow cytometric analysis of
CFSE dilution after 72 h of co-culture. Data are mean ± SD; representative of 5
experiments. (D) Gene expression of CD45+Gr-1
+CD11b
+ cells from tumors of TRAMP-
C1 mice by qRT-PCR at day 42. Representative of 3 experiments. (E) SOCS3fl/fl
(n=3)
and SOCS3
MyeKO (n=3) mice were inoculated s.c. with 3.0 x 10
6 TRAMP-C1 cells.
Thirty-one days after inoculation, intracellular staining for p-STAT3 was performed in
Gr-1+CD11b
+ cells from BM, spleen, and tumor. Numbers indicate the quantification of
mean fluorescence intensity. *p<0.05.
Page 87
73
Figure 3. Orthotopic Prostate Tumor Growth is Enhanced in SOCS3MyeKO
mice. (A)
One x 106 TRAMP-C2 cells were injected into the prostates of SOCS3
fl/fl (n=6) and
SOCS3MyeKO
(n=6) mice. Tumor weight was evaluated at 30 days. (B) H&E staining of
prostate at 30 days. Scale bar, 1 mm. Immunofluorescence staining of tumor infiltrating
CD45+ or Gr-1
+ cells at day 30. Scale bar, 45 μm. Prostate isolated from SOCS3
fl/fl mice
after intraprostatic injection of PBS was used as a control. Control mice (n = 2);
SOCS3fl/fl
mice (n = 4); SOCS3MyeKO
mice (n = 4). (C, D) Quantification of flow
cytometric analyses of prostate tumor-infiltrating Gr-1+CD11b
+ cells (C) and CD8
+ T-
cells (D) (n = 3 per group). (E) Expression of indicated genes from TRAMP-C2 prostate
Page 88
74
tumors was evaluated by qRT-PCR at day 30 post implantation. Data are mean ± SD,
representative of 2 experiments. *p<0.05.
Page 89
75
Figure 4. Loss of SOCS3 Promotes Proliferation of Gr-1+CD11b
+ Cells. (A) TRAMP-
C1 tumor-bearing SOCS3MyeKO
mice exhibit splenomegaly as indicated by spleen size
Page 90
76
(n=5 for SOCS3fl/fl
mice, n=6 for SOCS3MyeKO
mice). Image of spleens (top) and
summary of spleen weight (bottom) are shown. (B) Naïve SOCS3fl/fl
mice and TRAMP-
C1 tumor-bearing SOCS3fl/fl
and SOCS3
MyeKO mice were injected i.p. with 100 μg of EdU,
and spleens were harvested 20 h after injection. Spleen cells were stained for Gr-1+ and
CD11b+, then detected by flow cytometry for EdU positive cells. Flow plot for one
mouse in each category. (C) BM cells were stained for Gr-1+ and CD11b
+, then detected
by flow cytometry for EdU positive cells. Number in each quadrant expressed as Gr-1High
and Gr-1Int
percentage of total cells (left), and histogram of EdU plot is shown (right),
with numbers expressed as percentage of total Gr-1+CD11b
+ cells. Representative of 2
experiments; Naïve mice (n = 2); SOCS3fl/fl
mice (n = 4); SOCS3MyeKO
mice (n = 4). (D,
E) Blood was obtained by cheek bleeding puncture from TRAMP-C1 tumor-bearing
mice 45 days after inoculation, and analyzed on the HEMAVET®950 hematology
analyzer. White blood cell (WBC) (103/μl) (D), and granulocyte counts (10
3/μl) (E) are
shown. *p<0.05 and **p<0.01.
Page 91
77
Figure 5. Absence of SOCS3 Enhances STAT3 Activation and BM Differentiation
into Gr-1+CD11b
+ MDSC. (A) BM cells from SOCS3
fl/fl and
SOCS3
MyeKO mice were
Page 92
78
cultured in TRAMP-C1 CM (100% volume), and Gr-1+CD11b
+ cells analyzed by flow
cytometry at day 4. Numbers are expressed as percentage of total CD45+ cells. (B) BM-
derived cells incubated with TRAMP-C1 CM for 4 days were co-cultured with CFSE (0.5
μM) labeled OT-1 splenocytes in the presence of OVA derived peptide. Proliferation of
CD8+ T-cells was evaluated by flow cytometric analysis of CFSE dilution after 48 h of
co-culture. Data are mean ± SD; representative of 3 experiments. (C) BM-derived cells
incubated with TRAMP CM (100% volume) for 4 days were co-cultured with OT-1
splenocytes in the presence of OVA derived peptide. Levels of IFN-γ in the supernatant
of co-cultured BM-derived Gr-1+CD11b
+ cells with OT-1 splenocytes (1:4 ratio) were
measured by ELISA. Data are representative of 3 experiments. (D) Nitrite concentration
in supernatant from co-cultured cells (1:4 ratio) was measured by Griess reaction.
Representative of 3 experiments. (E) Gr-1+CD11b
+ cells were sorted from cultured BM-
derived cells treated with TRAMP-C1 CM for 4 days, and arginase activity was measured
in lysates from sorted cells. Assay was performed in triplicate, data are the mean ± SD.
(F) BM-derived cells were treated with TRAMP-C1 CM (100% volume) for the indicated
times, and immunoblotting performed with the indicated antibodies. Representative of 4
experiments. (G) BM cells from SOCS3fl/fl
and SOCS3
MyeKO mice were treated with
TRAMP-C1 CM (100% volume) for 4 h, and expression of indicated genes evaluated by
qRT-PCR. (H) Expression of MHC class II by Gr-1+CD11b
+ cells was detected by flow
cytometry after 4 days of in vitro culture with TRAMP-C1 CM. Mature dendritic cells
generated by BM cells cultured in medium containing GM-CSF (10 ng/ml) for 7 days
were used as a positive control, and Rat IgG2b was used as isotype control. (I) BM cells
from SOCS3fl/fl
and SOCS3MyeKO
mice were cultured in the presence of TRAMP-C1 CM
Page 93
79
and analyzed by flow cytometry at day 4. Numbers are expressed as percentage of total
CD45+CD11b
+ myeloid cells. Representative of 3 experiments. Data are mean ± SD;
*p<0.05 and **p<0.01.
Page 94
80
Figure 6. G-CSF Induces the Differentiation of BM Precursors into Functional
MDSC in a STAT3-dependent Manner. (A) Supernatant of prostate tumors obtained
Page 95
81
from mice with intraprostatic injection of TRAMP-C2 cells (at day 30), and flank tumors
from TRAMP-C1 or -C2 tumor-bearing mice (at day 42), as well as TRAMP-C1 or -C2
tumor cell CM were analyzed for G-CSF levels by ELISA. Data are mean ± SD;
representative of 3 experiments. (B) BM-derived cells were treated with G-CSF (10
ng/ml) for the indicated times and immunoblotting performed with the indicated
antibodies. Representative of 4 experiments. (C) BM-derived cells were incubated in the
absence or presence of G-CSF (10 ng/ml) for 2 h, then intracellular staining for p-STAT3
or p-STAT5 was performed. Representative of 2 experiments. (D) SOCS3 mRNA
expression from cultured BM-derived cells treated with G-CSF (10 ng/ml) for the
indicated times was evaluated by qRT-PCR. Data are mean ± SD; representative of 2
experiments. (E) BM cells from SOCS3fl/fl
and SOCS3
MyeKO mice were cultured in G-CSF
(20 ng/ml), G-CSF (20 ng/ml) with Lentivirus expressing GFP or Lentivirus expressing
SOCS3. Gr-1+CD11b
+ cells were analyzed by flow cytometry at day 4. Representative of
5 experiments. (F) BM cells from SOCS3fl/fl
and SOCS3
MyeKO mice were cultured in G-
CSF (20 ng/ml). Vehicle (DMSO), P6 (1 μM), or Stattic (1 μM) were added to the
cultures at days 0 and 2, and Gr-1+CD11b
+ cells analyzed by flow cytometry at day 4.
Representative of 2 experiments. (G) BM cells from SOCS3fl/fl
and SOCS3
MyeKO mice
were treated with G-CSF (10 ng/ml) for 4 h, and expression of indicated genes evaluated
by qRT-PCR. Data are mean ± SD; representative of 2 experiments. (H) BM cells
cultured for 4 days with G-CSF (20 ng/ml) were co-cultured with CFSE (0.5 μM) labeled
OT-1 splenocytes in the presence of OVA peptide. Proliferation of CD8+ T-cells was
evaluated by flow cytometric analysis of CFSE dilution after 48 h of co-culture. Numbers
indicates the ratio of OT-1 splenocytes:MDSC. Representative of 3 experiments. (I) Gr-
Page 96
82
1+CD11b
+ cells were sorted from cultured BM-derived cells, then treated with G-CSF (10
ng/ml) for 4 h. Arginase activity was measured in lysates from sorted cells. Assay was
performed in triplicate, data are the mean ± SD. *p<0.05, **p<0.01.
Page 97
83
Figure 7. G-CSF Neutralization Limits Gr-1+CD11b
+ Cell Proliferation In Vitro and
Tumor Growth In Vivo. (A) BM cells from SOCS3fl/fl
and SOCS3MyeKO
mice were
labeled with CFSE, then cultured in the presence of TRAMP CM or G-CSF (10 ng/ml)
with the indicated antibodies. Proliferation of Gr-1+CD11b
+ cells was evaluated by flow
cytometric analysis of CFSE dilution after 4 days. Numbers are expressed as percentage
proliferating cells of total Gr-1+CD11b
+ cells (Red, SOCS3
fl/fl; Black, SOCS3
MyeKO). (B)
SOCS3fl/fl
and SOCS3MyeKO
mice were inoculated s.c with 3.0 x 10⁶ TRAMP-C1 cells.
Page 98
84
Mice were randomly assigned to receive anti-G-CSF or isotype antibodies (10 μg per
mouse). Black arrows indicate Ab administration (n = 6 for SOCS3fl/fl
mice, n = 6 for
SOCS3MyeKO
mice). Tumor size indicated as volume (mean mm3
± SD) was evaluated up
to 39 days. (C) SOCS3fl/fl
and SOCS3MyeKO
mice were inoculated s.c. with 3.0 x 10⁶
TRAMP-C1 cells. After 39 days, flank tumors were collected and weighed. Data
expressed as mean ± SD. (D, E) Quantification of flow cytometric analyses of tumor-
infiltrating (D) and spleen (E) Gr-1+CD11b
+ cells (n=3 per group). *p<0.05 and
**p<0.01. (F) Schematic model. Tumor cell-secreted G-CSF induces activation of the
JAK/STAT3 pathway in myeloid cells, which leads to induction of tumor promoting
genes, and to SOCS3 expression. SOCS3 is a feedback inhibitor of G-CSF induced
STAT3 activation. In the absence of SOCS3, MDSC are hyper-responsive to tumor-
produced G-CSF, aberrantly activate STAT3, and express enhanced levels of Arginase 1,
iNOS and S100A8/9. Elevated levels of MDSC suppress anti-tumor immune responses in
the tumor microenvironment, in part by inhibiting activity of CD8+ T-cells, and
eventually promote tumor growth.
Page 99
85
Supplemental Figures
Y u , H . e t a l. , F ig . S 1
A B
S O C S3fl/fl
S O C S3M yeKO
CD25
Fo
xp
3C
D4
+F
ox
p3
+C
D2
5+
T-c
ell
s
(% o
f C
D4
5+
)
SO
CS
3f l/ fl
SO
CS
3M
yeK
O
0
2
4
6
8
1 0
5 .9 5 .4
% o
f C
D8
+ T
-ce
lls
(S
ple
en
)
TR
AM
P-C
1
TR
AM
P-C
2
TR
AM
P-C
1
TR
AM
P-C
2
Naiv
e
0
5
1 0
1 5
2 0
S O C S 3f l / f l
S O C S 3M y e K O
S O C S3fl/fl
S O C S3M yeKO
CD8
CD
3
1 2 .5 1 3 .2
Sp
lee
nC
S O C S3fl/fl
S O C S3M yeKO
Sp
lee
nG
r-1
C D 11b
6 .3 1 4 .9
Gr-1
+C
D1
1b
+ C
ell
s
(%
of
CD
45
+)
TR
AM
P-C
1
TR
AM
P-C
2
TR
AM
P-C
1
TR
AM
P-C
2
Naiv
e
0
1 0
2 0
3 0
*
* *
S O C S 3f l / f l
S O C S 3M y e K O
D a y s
Tu
mo
r v
olu
me
(m
m3
)
0 3 6 9 1 2 1 5 1 8 2 1 2 4 2 7 3 0 3 3 3 6 3 9 4 2
0
3 0 0
6 0 0
9 0 0
1 2 0 0S O C S 3
f l / f lIs o ty p e
S O C S 3f l / f l
A n ti-G r -1
S O C S 3M y e K O
Is o ty p e
S O C S 3M y e K O
A n ti-G r -1 * *
D
% o
f G
r-1
+ C
D1
1b
+ C
ell
s
Is o ty p e A n ti-G r-1
0
5
1 0
1 5
2 0
S O C S 3f l / f l
S O C S 3M y e K O*
*
E
Figure S1. Characterization of Immune Responses in TRAMP Tumor-bearing Mice.
(A) Representative flow cytometry plot of Gr-1+CD11b
+ cells (gated in boxes) from
Page 100
86
spleen of TRAMP-C1 tumor-bearing mice (top), and quantification of spleen Gr-
1+CD11b
+ cells (bottom) (n = 7 - 8 for SOCS3
fl/fl mice or SOCS3
MyeKO mice). Spleen
isolated from naïve mice was used as a control (n = 3). (B) Representative flow
cytometry plot of CD8+ T-cells (gated in box) from spleens of TRAMP-C1 tumor-bearing
mice (top), and quantification of spleen CD8+ T-cells (bottom) (n = 9-10 per group). (C)
Representative flow cytometry plot of CD4+Foxp3
+CD25
+ Treg from tumors of TRAMP-
C1 mice (top), and quantification (bottom) (n = 3 per group). Data are mean ± SD,
representative of 2 experiments. (D) SOCS3fl/fl
and SOCS3MyeKO
mice were inoculated
s.c with 3.0 x 10⁶ TRAMP-C1 cells. Mice were randomly assigned to receive anti-Gr-1 or
isotype Ab (100 μg per mouse). Black arrows indicate Ab administration (n = 5 for
SOCS3fl/fl
mice, n = 5 for SOCS3MyeKO
mice). Tumor size indicated as volume (mean
mm3
± SD) was evaluated up to 41 days. (E) Quantification of flow cytometric analyses
of spleen Gr-1+CD11b
+ cells at day 41 (n=2 - 3 per group).*p<0.05 and **p<0.01.
Page 101
87
% o
f P
ro
life
ra
tin
g C
ell
s
O T -1 a lo n e 8 :1 4 :1 2 :1 1 :1
0
2 0
4 0
6 0
8 0
1 0 0
1 2 0
S O C S 3f l / f l
S O C S 3M y e K O
**
Y u , H . e t a l. , F ig . S 2
A B
Arg
ina
se
1 (
mU
pe
r 1
06
Ce
lls
)
S p le e n
0
1 0 0
2 0 0
3 0 0
4 0 0
S O C S 3f l / f l
S O C S 3M y e K O
*
Nit
rite
Co
nc
. (
M)
OT
-1 a
lone
SO
CS
3f l/ fl
SO
CS
3M
yeK
O
0
5 0
1 0 0
1 5 0
2 0 0
2 5 0
* *
* *
C D
IFN
- (
pg
/ml)
O T -1 a lo n e S O C S 3f l/ f l
S O C S 3M y e K O
0
1 0 0 0
2 0 0 0
3 0 0 0
4 0 0 0
*
* *
Figure S2. Gr-1+CD11b
+ Cells Isolated from SOCS3
MyeKO Mice Exhibit Enhanced
MDSC Suppressive Function. (A) Levels of IFN-γ in the supernatant of co-cultured
tumor-derived CD45+Gr-1
+CD11b
+ cells with OT-1 splenocytes (1:2 ratio) were
measured by ELISA. Data are the mean ± SD; representative of 3 experiments. (B)
Nitrite concentration in supernatant from co-cultured tumor-derived CD45+Gr-1
+CD11b
+
cells with OT-1 splenocytes (1:1 ratio) was measured by Griess reaction. Data are the
mean ± SD, representative of 3 experiments. (C) Gr-1+CD11b
+ cells were isolated from
the spleen of TRAMP tumor-bearing mice by flow cytometry, and antigen-specific
suppression of CD8+ T-cells was evaluated. Numbers indicates the ratio of OT-1
splenocytes:MDSC from spleen. Assay was performed in triplicate and data are the mean
Page 102
88
± SD. Representative of 5 experiments. (D) Arginase activity was measured in lysates of
106 sorted MDSC from the spleen of TRAMP tumor-bearing SOCS3
fl/fl and SOCS3
MyeKO
mice. Assay was performed in triplicate, data are the mean ± SD. *p<0.05 and **p<0.01.
Page 103
89
A
Y u , H . e t a l. , F ig u re S 3
C
Gr-1
+ C
D1
1b
+ C
ell
Nu
mb
er
(1 x
10
5)
Contr
ol M
ediu
m
TR
AM
P-C
1 C
M
0
5
1 0
1 5
2 0
2 5
S O C S 3f l / f l
S O C S 3M y e K O
* *
*
% o
f T
ota
l C
ell
s
Contr
ol M
ediu
m
TR
AM
P-C
1 C
M
Contr
ol M
ediu
m
TR
AM
P-C
1 C
M
0
5
1 0
1 5
2 0
S O C S 3f l / f l
S O C S 3M y e K O
S P h a s e M P h a s e
* *
D E
SO
CS
3M
ye
KO
Gr-
1
C D 11b
Ce
ll C
ou
nt
EdU
Na
ive
SO
CS
3fl
/fl
2 .7 0 .7
3 .1 1 .1
2 .7 0 .5
2 .5 0 .5
H igh
Int.
Gr-
1
C D 11b
S O C S3M yeKO
N a ive S O C S3fl/fl
2 8 .3 2 .1
2 1 .9 1 .6
3 3 .3 3 .4
2 0 .4 2 .2
N a ive
EdU
EdU
S O C S3M yeKO
N a ive S O C S3fl/fl
N a ive
1 3 .2 2 .5
2 9 .6 3 .5
1 2 .7 2 .8
3 4 .6 4 .1
Sp
lee
n W
eig
ht
(mg
)
S O C S 3f l/ f l
S O C S 3M y e K O
0
2 0
4 0
6 0
8 0
1 0 0
n s
B
Figure S3. Effect of SOCS3 on Gr-1+CD11b
+ Cell Proliferation. (A) Naïve SOCS3
fl/fl
mice and SOCS3
MyeKO mice were injected i.p. with 100 μg of EdU, and spleens were
Page 104
90
harvested 20 h after injection (n=3). Spleen cells were stained for Gr-1+ and CD11b
+,
then detected by flow cytometry for EdU positive cells. (B) Spleen size of naïve
SOCS3fl/fl
and SOCS3MyeKO
mice (n=3). (C) BM cells were stained for Gr-1+ and CD11b
+,
then detected by flow cytometry for EdU positive cells. Number in each quadrant
expressed as Gr-1High
and Gr-1Int
percentage of total cells (left), and histogram of EdU
plot is shown (right), with numbers expressed as percentage of total Gr-1+CD11b
+ cells.
Representative of 2 experiments; Naïve SOCS3fl/fl
mice (n = 3); Naïve SOCS3MyeKO
mice
(n = 3). (D) BM cells from SOCS3fl/fl
and SOCS3
MyeKO mice were cultured in TRAMP
CM (100% volume) for 4 days. Total number of Gr-1+CD11b
+ cells was determined by
CountBright™ Absolute Counting Beads at day 4. (E) BM cells from SOCS3fl/fl
and
SOCS3MyeKO
mice were cultured in the presence of TRAMP CM (100% volume) for 2
days. Cell cycle of Gr-1+CD11b
+ cells was determined by Propidium Iodide staining
using flow cytometry. *p<0.05 and **p<0.01.
Page 105
91
G-C
SF
(p
g/m
l)
Naiv
e
Ort
hoto
pic
TR
AM
P-C
2
TR
AM
P-C
1 T
um
or
s.c
.
TR
AM
P-C
2 T
um
or
s.c
.
0
2 0 0
4 0 0
6 0 0
8 0 0
1 0 0 0
S O C S 3f l / f l
S O C S 3M y e K O
*
G-C
SF
mR
NA
(F
old
In
cre
as
e)
Naiv
e
Ort
hoto
pic
TR
AM
P-C
2
TR
AM
P-C
1 s
.c. T
um
or
TR
AM
P-C
2 s
.c. T
um
or
TR
AM
P-C
1
TR
AM
P-C
2
0
1 0
2 0
3 0
4 0
5 0
S O C S 3f l / f l
S O C S 3M y e K O
*
A
Y u , H . e t a l. , F ig u re S 4
B
Figure S4. G-CSF Expression by TRAMP Tumor-Bearing Mice. (A) Serum G-CSF
levels were measured by ELISA in the indicated tumor-bearing mice (n=3 - 4) 30 days
after orthotopic injection and 45 days after s.c. inoculation with TRAMP-C1 or TRAMP-
C2 cells. Serum samples obtained from naïve mice were used as control (n=3). (B) G-
CSF mRNA expression levels was determined by qRT-PCR in tumors from mice with
intraprostatic injection of TRAMP-C2 cells (n=3 - 4), flank tumors from TRAMP-C1
(n=3 - 4) or TRAMP-C2 (n= 3 - 4) tumor-bearing mice, and TRAMP-C1 or C2 tumor
cell lines. n=3 for naïve mice. *p<0.05.
Page 106
92
Ce
ll C
ou
nt
G -CSFR
3 7 .7
2 2 .6
5 .2
5 .6
WB
C 1
03
/l
Is o ty p e A n ti-G -C S F
0
5
1 0
1 5
2 0
S O C S 3f l / f l
S O C S 3M y e K O
*
Gra
nu
loc
yte
s 1
03
/l
Isoty
pe
Anti-G
-CS
F
0
2
4
6
S O C S 3f l / f l
S O C S 3M y e K O
*
Y u , H . e t a l. , F ig u re S 5
A B
Se
rum
G-C
SF
(p
g/m
l)
Is o ty p e A n ti-G -C S F
0
2 0 0
4 0 0
6 0 0
8 0 0
S O C S 3f l / f l
S O C S 3M y e K O
*
*
% o
f G
r-1
+C
D1
1b
+ C
ell
s
Contr
ol M
ediu
m
TR
AM
P C
M +
Isoty
pe
TR
AM
P C
M +
Anti-G
-CS
F
G-C
SF
+ Isoty
pe
G-C
SF
+ A
nti-G
-CS
F
0
2 0
4 0
6 0
8 0
S O C S 3f l / f l
S O C S 3M y e K O
* * * *
C D
E
S p le e n G r-1+
c e lls
T um o r C D 11b-
c e lls
T u m o r G r-1+
c e lls
T R A M P -C 1 ce lls
Figure S5. Effects of G-CSF Neutralizing Antibody. (A) BM cells from SOCS3fl/fl
and
SOCS3MyeKO
mice were cultured for 4 days in the presence of TRAMP CM or G-CSF (10
ng/ml) with either anti-G-CSF Ab (50 μg/ml) or IgG isotype control (50 μg/ml), then
analyzed by flow cytometry. Bars indicate the percentage of Gr-1+CD11b
+ cells of total
CD45+ cells. (B) Serum samples of the indicated groups (n=3) were collected from cheek
Page 107
93
bleeding puncture after 39 days of inoculation. G-CSF protein levels were detected by
ELISA. (C, D) Blood was obtained from the indicated groups (n=3) 39 days after
subcutaneous inoculation. WBC (C) and granulocyte counts (D) (103/μl) are shown. (E)
Cells were isolated from spleen and tumors of TRAMP-C1 tumor-bearing mice at day 41
after inoculation, and G-CSFR staining was performed. Numbers indicate percentage of
G-CSFR positive cells (n=2). *p<0.05 and **p<0.01.
Page 108
94
CONCLUSIONS
The studies above focused on investigating the role of the JAK/STAT pathway in
myeloid cells with respect to promoting cancer development. First, we generated mice
with targeted deletion of SOCS3 in myeloid cells (LysMCre-SOCS3fl/fl
, SOCS3MyeKO
mice) to study how SOCS3 in myeloid cells regulates immune responses in the context of
the prostate cancer microenvironment. We demonstrate that SOCS3 expression in
myeloid cells is an important determinant of tumor growth, indicating a critical influence
of the tumor microenvironment in cancer progression. The loss of SOCS3 in myeloid
cells promotes the differentiation of BM-derived progenitor cells into Gr-1+CD11b
+
MDSCs, and enhances the immunosuppressive functions of these cells. Importantly,
STAT3 activation is essential for this process. Tumor-derived G-CSF is crucial for the
mobilization and recruitment of Gr-1+CD11b
+ MDSCs to tumors, where they decrease
the presence of CD8+ T-cells. Neutralization of G-CSF is effective in limiting the
differentiation and functionality of MDSC, which in vivo manifests as restricted tumor
growth. These findings establish a circuitry between MDSC, tumor cells and G-CSF in
the tumor microenvironment; G-CSF secreted by tumor cells promotes the recruitment
and differentiation of MDSC, which is dependent on STAT3 activation in MDSC. In the
absence of SOCS3, this response and circuitry is amplified. These results support a role
for SOCS3 in repressing MDSC differentiation, which ultimately relieves
immunosuppression in the prostate tumor microenvironment.
Page 109
95
Persistent STAT3 activation is associated with poor prognosis in many cancer types,
including prostate cancer (278, 279). Loss of the androgen receptor (AR) leads to the
development of prostate cancer stem cells, which require STAT3 activation (276, 280).
Stem-like cells from patients with prostate cancer secrete high levels of IL-6 and exhibit
hyperactivation of STAT3 (65). STAT3 activation in cells of the hematopoietic lineage is
also associated with creating a tumor microenvironment conducive to tumor growth. This
is especially true for MDSC, which rely on STAT3 for differentiation and functionality.
Ablation of STAT3 in multiple lineages of immune cells (neutrophils, NK cells, DCs)
enhanced their anti-tumor activity (1). While MDSCs were not directly examined,
heightened activation of STAT3 in MDSCs, as shown by our study, may contribute to
tumor immune tolerance. MDSCs lacking SOCS3 with STAT3 hyperactivation have
potent immunosuppressive capabilities such as inhibition of antigen-specific CD8+ T-cell
proliferation and IFN-γ production, and enhanced nitrite production and arginase activity.
Also, SOCS3-deficient MDSCs expressed MHC Class II at lower levels than SOCS3
wild-type MDSCs, suggestive of an immature suppressive phenotype. Nonetheless, our
findings clearly demonstrate the importance of SOCS3 in restricting MDSCs-mediated
anti-tumor immunity. SOCS3 expression in MDSCs negatively regulates the expression
of soluble mediators such as S100A8 and S100A9 and products of iNOS and arginase 1
that support an immunosuppressive milieu in tumors (277). In the absence of SOCS3,
MDSCs are hyper-responsive to tumor-produced cytokines such as G-CSF, and
aberrantly activate STAT3, which in turn contributes to chronic cancer-related
inflammation and suppression of anti-tumor immune responses.
Page 110
96
G-CSF plays a crucial role in hematopoiesis by stimulating the proliferation,
differentiation and survival of myeloid progenitor cells, particularly cells within the
granulocytic lineage (235). JAK1, JAK2 and TYK2 are recruited to the G-CSF receptor
upon stimulation with G-CSF, and then in turn activate STAT1, STAT3 and STAT5, of
which STAT3 is most important. SOCS3 is induced by G-CSF in myeloid cells, and
serves as a negative regulator of G-CSF-induced cellular responses by binding to the G-
CSF receptor (208, 281). G-CSF is one of a number of soluble mediators that promote
the expansion and migration of MDSC from the bone marrow to tumors. While the levels
of G-CSF were comparable in SOCS3MyeKO
and SOCS3fl/fl
tumor-bearing mice,
SOCS3MyeKO
BM-derived cells are hyper-responsive to G-CSF, as documented by
increased duration and intensity of G-CSF-induced STAT3 phosphorylation, which led to
MDSCs differentiation at a greater percentage than cells from SOCS3fl/fl
mice. In addition,
G-CSF-induced MDSCs from SOCS3MyeKO
tumor-bearing mice exhibited a greater
capacity to suppress antigen-specific T-cell proliferation. Our findings demonstrate that
treatment of tumor-bearing mice with neutralizing G-CSF antibody reduced circulating
granulocytic cells as well as infiltration of MDSCs in tumors. Thus tumor-derived G-CSF
is an important regulator of inflammation and immune suppression within the tumor
microenvironment. G-CSF may not be critical for the development of Gr-1+CD11b
+ cells
in every tumor model. In LSL-KrasG12D
knock-in mice, pancreatic ductal adenocarcinoma
exhibit an infiltrate of Gr-1+CD11b
+ leukocytes due to elevated levels of GM-CSF (282).
Moreover, cytokines and growth factors other than G-CSF have been implicated in the
pathophysiology of Gr-1+CD11b
+ leukocytes in other mouse models—including IL-1β,
IL-6, and VEGF (207, 229). Elevated levels of G-CSF were also identified in a mouse
Page 111
97
breast cancer model (283). Identification of G-CSF in cancer models substantiates the
importance of this cytokine in regulating and maintaining the high frequency of MDSCs
in the tumor microenvironment.
Clinical information regarding SOCS3 expression in prostate cancer is inconclusive at
this time. Pierconti et al, demonstrated that methylation of the SOCS3 promoter was
significantly associated with intermediate-high grade Gleason score and with an
unfavorable outcome. In benign prostate hyperplasia and normal controls, the SOCS3
promoter was unmethylated (118). Analysis of the Oncomine database demonstrates that
SOCS3 mRNA expression is significantly lower in prostate carcinoma compared to
benign prostatic hyperplasia (277). Data from cBioPortal (Prostate Adenocarcinoma
MSKCC) indicates that some prostate cancer patients with SOCS3 mRNA
overexpression trend towards a longer disease-free time than patients with “normal”
levels of SOCS3 mRNA (277). However, SCOS3 was overexpressed in a relatively small
number of patients, and no correlations with patient stage status were found. Thus, there
is a dysregulation of SOCS3 gene expression in a subgroup of patients with prostate
cancer, but the functional and clinical relevance is still under investigation. Nonetheless,
it is clear that a variety of mechanisms, including SOCS3 dysregulation and abundant IL-
6 production, do contribute to hyperactivation of JAK/STAT pathway in animal models
of prostate cancer and patients. Inhibitors of IL-6, JAKs and STAT3 are being considered
in the context of prostate cancer, and have already proven beneficial in animal models.
Furthermore, peptides that mimic the SOCS Kinase Inhibitory Region (KIR), which is
responsible for binding to JAKs and suppressing downstream STAT3 activation, may
Page 112
98
prove beneficial in prostate cancer. These findings highlight the importance of SOCS3 as
a promising target for studying prostate cancer microenvironment.
It has been proposed that myeloid cells are involved during the process of cancer
development before clinical manifestations become apparent, promoting treatment
resistance, and metastatic spreading (179, 225). Blockage of tumor-infiltrating myeloid
cells through the use of CSF1R inhibitor was able to improve the efficacy of radiotherapy
in prostate cancer (254). However, the mechanisms underlying the tumor promoting role
of myeloid cells still remains poorly understood in prostate cancer (272). The goal of this
study was to investigate the importance of JAK/STAT pathway in myeloid cells in the
prostate cancer microenvironment. Understanding the underlying mechanism of the
immune suppressive microenvironment is important for developing more efficient
therapies for fighting tumor progression. Induction and expansion of MDSCs and the
resultant immune suppression is expected to be similar between humans and mice,
making the results of murine experiments useful in developing new anti-MDSC agents
and testing them in clinical trials. Peripheral blood MDSC levels correlate with a higher
tumor burden and a worse prognosis in lung cancer (225). Inhibition of MDSC in murine
models may enhance anti-tumor immunity by increasing responsiveness to interferon
stimulation (284). Inhibition or depletion of MDSC enhances the activity of cancer
vaccines in animal models (226). We substantiate that MDSCs play a vital role in
TRAMP prostate cancer development and the STAT3/SOCS3 pathway is a critical
regulator in MDSC differentiation (277).
Although the results presented here have demonstrated the importance of SOCS3 in
regulating myeloid cell differentiation in the tumor microenvironment, it could be further
Page 113
99
developed in a number of ways. First, to further explore the importance of myeloid
SOCS3 in regulating prostate cancer progression, it will be of interest to investigate the
expression of SOCS3 in myeloid cells isolated from patients. Methylation of the SOCS3
gene promotor was evidenced in a subtype of prostate cancer patients, and reduced
SOCS3 gene expression associated with an unfavorable outcome (285). However, what
the level of SOCS3 expression in myeloid cells from those prostate cancer patients is not
known. A finding of SOCS3 expression in myeloid cells would support a direct role for
myeloid SOCS3 in control myeloid cell immune suppressive function in the cancer
microenvironment.
Second, our studies implicate the role of G-CSF/STAT3/SOCS3 in regulating MDSC
development. Since the presence of elevated levels of MDSCs in tumor is critical in
maintain suppressive microenvironment, blockage of MDSC development would be
beneficial for prostate cancer patients. Our results suggest that neutralization G-CSF is
able to reduce MDSC levels and tumor growth. Future experiments to utilize JAK/STAT
inhibitors or SOCS3 mimic peptides on tumor bearing mice would need to be addressed
in detail. Furthermore, given the few options for treating castration-resistant disease,
targeting G-CSF/STAT3/SOCS3 may be additive to current blockage of AR signaling,
resulting in a further decrease of tumor development.
Last but not least, recently recognized check point blockers including PD-1/PD-L1 and
CTLA4 are successful in helping the immune system to fight cancer (286). PD-L1 also
known as CD274, is expressed in myeloid cells which are critical in maintaining
periphery immune suppression. It will be of interest to investigate whether PD-L1
expression is downstream of the G-CSF/STAT3/SOCS3 pathway. Our results suggest
Page 114
100
that SOCS3 deficient MDSCs express reduced level of MHC II, and stay in immature
state (277). PD-L1 expression in myeloid cells was upregulated through
JAK/STAT/SOCS pathway after LPS treatment (209). These reports suggest that it is
worthwhile to investigate whether the G-CSF/STAT3/SOCS3 axis in myeloid cells is
involved in regulating immune check points and execute their immune suppressive
functions.
In conclusion, our findings have elucidated the role of SOCS3 in myeloid cells in prostate
cancer development. These studies not only highlight the significance of the
STAT3/SOCS3 pathway in regulating the differentiation and function of MDSC in
cancer, but also identify this intricate protein network as important therapeutic targets to
eliminate MDSCs-mediated immunosuppression. Insights gained from our current studies
help searching efficient treatments that target myeloid cells and might substantially
increase the efficacy of current cancer immunotherapies. This is especially important in
light of the recent finding that MDSCs are responsible for resistance to immune check-
point inhibitors, and that elimination of MDSCs led to cures of experimental, metastatic
tumors.
Page 115
101
REFERENCES
1. Yu H, Pardoll D, Jove R. STATs in cancer inflammation and immunity: a leading
role for STAT3. Nat Rev Cancer 2009;9:798-809.
2. O'Shea JJ, Plenge R. JAK and STAT signaling molecules in immunoregulation
and immune-mediated disease. Immunity 2012;36:542-50.
3. Nicolas CS, Peineau S, Amici M, Csaba Z, Fafouri A, Javalet C, et al. The
Jak/STAT pathway is involved in synaptic plasticity. Neuron 2012;73:374-90.
4. O'Shea JJ, Holland SM, Staudt LM. JAKs and STATs in Immunity,
Immunodeficiency, and Cancer. New Eng J Med 2013;368:161-70.
5. Sansone P, Bromberg J. Targeting the Interleukin-6/Jak/Stat Pathway in Human
Malignancies. J Clin Oncol 2012;784:121-32.
6. Haque SJ, Sharma P. Interleukins and STAT signaling. Vitam Horm
2006;74:165-206.
7. Frank DA. Targeting STATs for cancer therapy: "Undruggable" no more. JAK-
STAT 2012;1:261-2.
8. Yu H, Lee H, Herrmann A, Buettner R, Jove R. Revisiting STAT3 signalling in
cancer: new and unexpected biological functions. Nat Rev Cancer 2014;14:736-
46.
9. Reich NC. STAT dynamics. Cytokine Growth Factor Rev 2007;18:511-8.
10. Kisseleva T, Bhattacharya S, Braunstein J, Schindler CW. Signaling through the
JAK/STAT pathway, recent advances and future challenges. Gene 2002;285:1-24.
11. Swiatek-Machado K, Kaminska B. STAT signaling in glioma cells. Adv Exp Med
2013;986:189-208.
Page 116
102
12. Adach A, Ellert-Miklaszewska A, Kaminska B. Molecular characterization of
STAT signaling in inflammation and tumorigenesis. Methods Mol Biol
2009;512:265-78.
13. Brierley MM, Fish EN. Stats: multifaceted regulators of transcription. J Interferon
Cytokine Res 2005;25:733-44.
14. Koppikar P, Bhagwat N, Kilpivaara O, Manshouri T, Adli M, Hricik T, et al.
Heterodimeric JAK-STAT activation as a mechanism of persistence to JAK2
inhibitor therapy. Nature 2012;489:155-9.
15. Inghirami G, Chiarle R, Simmons WJ, Piva R, Schlessinger K, Levy DE. New
and old functions of STAT3: a pivotal target for individualized treatment of
cancer. Cell Cycle 2005;4:1131-3.
16. Multhoff G, Molls M, Radons J. Chronic inflammation in cancer development.
Front Immunol 2011;2:98.
17. Schindler C, Strehlow I. Cytokines and STAT signaling. Adv Pharmacol
2000;47:113-74.
18. Smithgall TE, Briggs SD, Schreiner S, Lerner EC, Cheng H, Wilson MB. Control
of myeloid differentiation and survival by Stats. Oncogene 2000;19:2612-8.
19. Geissmann F, Gordon S, Hume DA, Mowat AM, Randolph GJ. Unravelling
mononuclear phagocyte heterogeneity. Nat Rev Immunol 2010;10:453-60.
20. Weaver CT, Hatton RD, Mangan PR, Harrington LE. IL-17 family cytokines and
the expanding diversity of effector T-cell lineages. Ann Rev Immunol
2007;25:821-52.
Page 117
103
21. Cao H, Wolff RG, Meltzer MS, Crawford RM. Differential regulation of class II
MHC determinants on macrophages by IFN- and IL-4. J Immunol
1989;143:3524-31.
22. Minami M, Inoue M, Wei S, Takeda K, Matsumoto M, Kishimoto T, et al.
STAT3 activation is a critical step in gp130-mediated terminal differentiation and
growth arrest of a myeloid cell line. Proc Natl Acad Sci U S A 1996;93:3963-6.
23. Morgan KJ, Gilliland DG. A role for JAK2 mutations in myeloproliferative
diseases. Annu Rev Med 2008;59:213-22.
24. Carow B, Rottenberg ME. SOCS3, a Major Regulator of Infection and
Inflammation. Front Immunol 2014;5:58.
25. Chan KS, Sano S, Kiguchi K, Anders J, Komazawa N, Takeda J, et al. Disruption
of STAT3 reveals a critical role in both the initiation and the promotion stages of
epithelial carcinogenesis. J Clin Invest 2004;114:720-8.
26. Lin WW, Karin M. A cytokine-mediated link between innate immunity,
inflammation, and cancer. J Clin Invest 2007;117:1175-83.
27. Groner B, Lucks P, Borghouts C. The function of Stat3 in tumor cells and their
microenvironment. Semin Cell Dev Biol 2008.
28. Ruffell B, Affara NI, Coussens LM. Differential macrophage programming in the
tumor microenvironment. Trends Immunol 2012;33:119-26.
29. Mantovani A, Allavena P, Sica A, Balkwill F. Cancer-related inflammation.
Nature 2008;454:436-44.
30. Dauer DJ, Ferraro B, Song L, Yu B, Mora L, Buettner R, et al. Stat3 regulates
genes common to both wound healing and cancer. Oncogene 2005;24:3397-408.
Page 118
104
31. Schreiner SJ, Schiavone AP, Smithgall TE. Activation of STAT3 by the Src
family kinase Hck requires a functional SH3 domain. J Biol Chem
2002;277:45680-7.
32. Aziz MH, Hafeez BB, Sand JM, Pierce DB, Aziz SW, Dreckschmidt NE, et al.
Protein kinase Cvarepsilon mediates Stat3Ser727 phosphorylation, Stat3-
regulated gene expression, and cell invasion in various human cancer cell lines
through integration with MAPK cascade (RAF-1, MEK1/2, and ERK1/2).
Oncogene 2010;29:3100-9.
33. Zhang Y, Sif S, DeWille J. The mouse C/EBPδ gene promoter is regulated by
STAT3 and Sp1 transcriptional activators, chromatin remodeling and c-Myc
repression. J Cell Biochem 2007;102:1256-70.
34. Jung JE, Lee HG, Cho IH, Chung DH, Yoon SH, Yang YM, et al. STAT3 is a
potential modulator of HIF-1-mediated VEGF expression in human renal
carcinoma cells. Faseb J 2005;19:1296-8.
35. Benekli M, Baer MR, Baumann H, Wetzler M. Signal transducer and activator of
transcription proteins in leukemias. Blood 2003;101:2940-54.
36. Sen M, Joyce S, Panahandeh M, Li C, Thomas SM, Maxwell J, et al. Targeting
Stat3 abrogates EGFR inhibitor resistance in cancer. Clin Cancer
Res2012;18:4986-96.
37. Ranger JJ, Levy DE, Shahalizadeh S, Hallett M, Muller WJ. Identification of a
Stat3-dependent transcription regulatory network involved in metastatic
progression. Cancer Res 2009;69:6823-30.
Page 119
105
38. Lieblein JC, Ball S, Hutzen B, Sasser AK, Lin HJ, Huang TH, et al. STAT3 can
be activated through paracrine signaling in breast epithelial cells. BMC Cancer
2008;8:302.
39. De Marzo AM, Platz EA, Sutcliffe S, Xu J, Gronberg H, Drake CG, et al.
Inflammation in prostate carcinogenesis. Nature reviews Cancer 2007;7:256-69.
40. Alvarez JV, Greulich H, Sellers WR, Meyerson M, Frank DA. Signal transducer
and activator of transcription 3 is required for the oncogenic effects of non-small-
cell lung cancer-associated mutations of the epidermal growth factor receptor.
Cancer Res 2006;66:3162-8.
41. Grandis JR, Drenning SD, Zeng Q, Watkins SC, Melhem MF, Endo S, et al.
Constitutive activation of Stat3 signaling abrogates apoptosis in squamous cell
carcinogenesis in vivo. Proc Natl Acad Sci U S A 2000;97:4227-32.
42. McFarland BC, Ma JY, Langford CP, Gillespie GY, Yu H, Zheng Y, et al.
Therapeutic potential of AZD1480 for the treatment of human glioblastoma. Mol
Cancer Ther 2011;10:2384-93.
43. Miklossy G, Hilliard TS, Turkson J. Therapeutic modulators of STAT signalling
for human diseases. Nat Rev Drug Discov 2013;12:611-29.
44. Kasprzycka M, Marzec M, Liu X, Zhang Q, Wasik MA.
nucleophosmin/anaplastic lymphoma kinase (NPM/ALK) oncoprotein induces the
T regulatory cell phenotype by activating STAT3. Proc Natl Acad Sci U S A
2006;103:9964-9.
Page 120
106
45. Fukada T, Ohtani T, Yoshida Y, Shirogane T, Nishida K, Nakajima K, et al.
STAT3 orchestrates contradictory signals in cytokine-induced G1 to S cell-cycle
transition. EMBO J 1998;17:6670-7.
46. Zhang F, Li C, Halfter H, Liu J. Delineating an oncostatin M-activated STAT3
signaling pathway that coordinates the expression of genes involved in cell cycle
regulation and extracellular matrix deposition of MCF-7 cells. Oncogene
2003;22:894-905.
47. Kiuchi N, Nakajima K, Ichiba M, Fukada T, Narimatsu M, Mizuno K, et al.
STAT3 is required for the gp130-mediated full activation of the c-myc gene. J
Exp Med 1999;189:63-73.
48. Shirogane T, Fukada T, Muller JM, Shima DT, Hibi M, Hirano T. Synergistic
roles for Pim-1 and c-Myc in STAT3-mediated cell cycle progression and
antiapoptosis. Immunity 1999;11:709-19.
49. Hirano T, Ishihara K, Hibi M. Roles of STAT3 in mediating the cell growth,
differentiation and survival signals relayed through the IL-6 family of cytokine
receptors. Oncogene 2000;19:2548-56.
50. Aggarwal BB, Kunnumakkara AB, Harikumar KB, Gupta SR, Tharakan ST,
Koca C, et al. Signal transducer and activator of transcription-3, inflammation,
and cancer: how intimate is the relationship? Ann N Y Acad Sci 2009;1171:59-76.
51. Bhardwaj A, Sethi G, Vadhan-Raj S, Bueso-Ramos C, Takada Y, Gaur U, et al.
Resveratrol inhibits proliferation, induces apoptosis, and overcomes
chemoresistance through down-regulation of STAT3 and nuclear factor-κB-
Page 121
107
regulated antiapoptotic and cell survival gene products in human multiple
myeloma cells. Blood 2007;109:2293-302.
52. Hedvat M, Huszar D, Herrmann A, Gozgit JM, Schroeder A, Sheehy A, et al. The
JAK2 inhibitor AZD1480 potently blocks Stat3 signaling and oncogenesis in solid
tumors. Cancer Cell 2009;16:487-97.
53. Aggarwal BB, Gehlot P. Inflammation and cancer: how friendly is the
relationship for cancer patients? Curr Opin Pharmacol 2009;9:351-69.
54. Devarajan E, Huang S. STAT3 as a central regulator of tumor metastases. Curr
Mol Med 2009;9:626-33.
55. Balanis N, Wendt MK, Schiemann BJ, Wang Z, Schiemann WP, Carlin CR.
Epithelial-to-mesenchymal transition promotes breast cancer progression via a
fibronectin-dependent Stat3 signaling pathway. J Biol Chem 2013;288:17954-67.
56. Dechow TN, Pedranzini L, Leitch A, Leslie K, Gerald WL, Linkov I, et al.
Requirement of matrix metalloproteinase-9 for the transformation of human
mammary epithelial cells by STAT3-C. Proc Natl Acad Sci U S A
2004;101:10602-7.
57. Chen F, Xu Y, Luo Y, Zheng D, Song Y, Yu K, et al. Down-regulation of Stat3
decreases invasion activity and induces apoptosis of human glioma cells. J Mol
Neurosci 2010;40:353-9.
58. Hamilton KE, Simmons JG, Ding S, Van Landeghem L, Lund PK. Cytokine-
Induction of Tumor Necrosis Factor Receptor 2 (TNFR2) is Mediated by STAT3
in Colon Cancer Cells. Mol Cancer Res 2011; 204:451-20.
Page 122
108
59. Slattery ML, Lundgreen A, Kadlubar SA, Bondurant KL, Wolff RK.
JAK/STAT/SOCS-signaling pathway and colon and rectal cancer. Mol
Carcinogen 2013;52:155-66.
60. Ling X, Arlinghaus RB. Knockdown of STAT3 expression by RNA interference
inhibits the induction of breast tumors in immunocompetent mice. Cancer Res
2005;65:2532-6.
61. Cheng GZ, Zhang W, Sun M, Wang Q, Coppola D, Mansour M, et al. Twist is
transcriptionally induced by activation of STAT3 and mediates STAT3 oncogenic
function. J Biol Chem 2008;283:14665-73.
62. Boniface K, Diveu C, Morel F, Pedretti N, Froger J, Ravon E, et al. Oncostatin M
secreted by skin infiltrating T lymphocytes is a potent keratinocyte activator
Involved in skin inflammation. J Immunol 2007;178:4615-22.
63. Cheng F, Wang HW, Cuenca A, Huang M, Ghansah T, Brayer J, et al. A critical
role for Stat3 signaling in immune tolerance. Immunity 2003;19:425-36.
64. Jarnicki A, Putoczki T, Ernst M. Stat3: linking inflammation to epithelial cancer -
more than a "gut" feeling? Cell Div 2010;5:14.
65. Rokavec M, Oner MG, Li H, Jackstadt R, Jiang L, Lodygin D, et al. IL-
6R/STAT3/miR-34a feedback loop promotes EMT-mediated colorectal cancer
invasion and metastasis. J Clin Invest 2014;124:1853-67.
66. Koeberlein B, Hausen AZ, Bektas N, Zentgraf H, Chin R, Toan NL, et al.
Hepatitis B virus overexpresses suppressor of cytokine signaling-3 (SOCS3)
thereby contributing to severity of inflammation in the liver. Virus Res 2009.
Page 123
109
67. Schroer N, Pahne J, Walch B, Wickenhauser C, Smola S. Molecular pathobiology
of human cervical high-grade lesions: paracrine STAT3 activation in tumor-
instructed myeloid cells drives local MMP-9 expression. Cancer Res 2011;71:87-
97.
68. Duechting A, Tschope C, Kaiser H, Lamkemeyer T, Tanaka N, Aberle S, et al.
Human parvovirus B19 NS1 protein modulates inflammatory signaling by
activation of STAT3/PIAS3 in human endothelial cells. J Virol 2008;82:7942-52.
69. Hino R, Uozaki H, Murakami N, Ushiku T, Shinozaki A, Ishikawa S, et al.
Activation of DNA methyltransferase 1 by EBV latent membrane protein 2A
leads to promoter hypermethylation of PTEN gene in gastric carcinoma. Cancer
Res 2009;69:2766-74.
70. Zhang L, Alizadeh D, Van Handel M, Kortylewski M, Yu H, Badie B. Stat3
inhibition activates tumor macrophages and abrogates glioma growth in mice.
Glia 2009;181:2451-60
71. Xie TX, Huang FJ, Aldape KD, Kang SH, Liu M, Gershenwald JE, et al.
Activation of stat3 in human melanoma promotes brain metastasis. Cancer Res
2006;66:3188-96.
72. Landen CN, Jr., Lin YG, Armaiz Pena GN, Das PD, Arevalo JM, Kamat AA, et al.
Neuroendocrine modulation of signal transducer and activator of transcription-3
in ovarian cancer. Cancer Res 2007;67:10389-96.
73. Iwata-Kajihara T, Sumimoto H, Kawamura N, Ueda R, Takahashi T, Mizuguchi
H, et al. Enhanced Cancer Immunotherapy Using STAT3-Depleted Dendritic
Page 124
110
Cells with High Th1-Inducing Ability and Resistance to Cancer Cell-Derived
Inhibitory Factors. J Immunol 2011;187:27-36.
74. Hossain DM, Dos Santos C, Zhang Q, Kozlowska A, Liu H, Gao C, et al.
Leukemia cell-targeted STAT3 silencing and TLR9 triggering generate systemic
antitumor immunity. Blood 2014;123:15-25.
75. Yoon S, Woo SU, Kang JH, Kim K, Shin HJ, Gwak HS, et al. NF-kappaB and
STAT3 cooperatively induce IL6 in starved cancer cells. Oncogene 2011.
76. McFarland BC, Hong SW, Rajbhandari R, Twitty GB, Gray GK, Yu H, et al. NF-
κB induced IL-6 ensures STAT3 activation and tumor aggressiveness in
glioblastoma. PLoS One 2013;8:e78728.
77. Guzzo C, Che Mat NF, Gee K. Interleukin-27 Induces a STAT1/3- and NF-
{kappa}B-dependent Proinflammatory Cytokine Profile in Human Monocytes. J
Biol Chem 2010;285:24404-11.
78. Dai B, Meng J, Peyton M, Girard L, Bornmann WG, Ji L, et al. STAT3 Mediates
Resistance to MEK Inhibitor through MicroRNA miR-17. Cancer Res
2011;71:3658-68.
79. Collins AS, McCoy CE, Lloyd AT, O'Farrelly C, Stevenson NJ. miR-19a: An
Effective Regulator of SOCS3 and Enhancer of JAK-STAT Signalling. PloS one
2013;8:e69090.
80. Zhang M, Liu Q, Mi S, Liang X, Zhang Z, Su X, et al. Both miR-17-5p and miR-
20a Alleviate Suppressive Potential of Myeloid-Derived Suppressor Cells by
Modulating STAT3 Expression. J Immunol 2011;186:4716-24.
Page 125
111
81. Pichiorri F, Suh SS, Ladetto M, Kuehl M, Palumbo T, Drandi D, et al.
MicroRNAs regulate critical genes associated with multiple myeloma
pathogenesis. Proc Natl Acad Sci U S A 2008;105:12885-90.
82. Wang F, Wei J, Gjyshi O, Kong L-Y, Xu S, Lang F, et al. The Microrna
Regulatory Axis of STAT3: Implications for Glioma Stem Cell Biology. Neuro-
Oncology 2012;14:vi45.
83. Xin H, Herrmann A, Reckamp K, Zhang W, Pal S, Hedvat M, et al. Anti-
angiogenic and anti-metastatic activity of JAK inhibitor AZD1480. Cancer Res
2011;21:6601-10.
84. Abad C, Nobuta H, Li J, Kasai A, Yong WH, Waschek JA. Targeted STAT3
disruption in myeloid cells alters immunosuppressor cell abundance in a murine
model of spontaneous medulloblastoma. J Leukoc Biol 2014;95:357-67.
85. Nefedova Y, Nagaraj S, Rosenbauer A, Muro-Cacho C, Sebti SM, Gabrilovich DI.
Regulation of dendritic cell differentiation and antitumor immune response in
cancer by pharmacologic-selective inhibition of the janus-activated kinase
2/signal transducers and activators of transcription 3 pathway. Cancer Res
2005;65:9525-35.
86. Zhang H, Nguyen-Jackson H, Panopoulos AD, Li HS, Murray PJ, Watowich SS.
STAT3 controls myeloid progenitor growth during emergency granulopoiesis.
Blood 2010;116:2462-71.
87. Rosborough BR, Mathews LR, Matta BM, Liu Q, Raich-Regue D, Thomson AW,
et al. Cutting Edge: Flt3 Ligand Mediates STAT3-Independent Expansion but
Page 126
112
STAT3-Dependent Activation of Myeloid-Derived Suppressor Cells. J Immunol
2014;192:3470-3.
88. Yen BL, Yen ML, Hsu PJ, Liu KJ, Wang CJ, Bai CH, et al. Multipotent Human
Mesenchymal Stromal Cells Mediate Expansion of Myeloid-Derived Suppressor
Cells via Hepatocyte Growth Factor/c-Met and STAT3. Stem cell reports
2013;1:139-51.
89. Lee H, Pal SK, Reckamp K, Figlin RA, Yu H. STAT3: a target to enhance
antitumor immune response. Cur top microbiol Immunol 2011;344:41-59.
90. Wu L, Du H, Li Y, Qu P, Yan C. Signal transducer and activator of transcription
3 (Stat3C) promotes myeloid-derived suppressor cell expansion and immune
suppression during lung tumorigenesis. Amer J Pathol 2011;179:2131-41.
91. Bromberg J, Wang TC. Inflammation and cancer: IL-6 and STAT3 complete the
link. Cancer Cell 2009;15:79-80.
92. Shuai K, Liu B. Regulation of JAK-STAT signalling in the immune system. Nat
Rev Immunol 2003;3:900-11.
93. Mustelin T, Vang T, Bottini N. Protein tyrosine phosphatases and the immune
response. Nat Rev Immunol 2005;5:43-57.
94. Shuai K. Regulation of cytokine signaling pathways by PIAS proteins. Cell Res
2006;16:196-202.
95. Long J, Wang G, Matsuura I, He D, Liu F. Activation of Smad transcriptional
activity by protein inhibitor of activated STAT3 (PIAS3). Proc Natl Acad Sci U S
A 2004;101:99-104.
Page 127
113
96. Bourdonnay E, Zaslona Z, Penke LR, Speth JM, Schneider DJ, Przybranowski S,
et al. Transcellular delivery of vesicular SOCS proteins from macrophages to
epithelial cells blunts inflammatory signaling. J Exp Med 2015;212:729-42.
97. Yoshimura A, Suzuki M, Sakaguchi R, Hanada T, Yasukawa H. SOCS,
Inflammation, and Autoimmunity. Frontiers Immunol 2012;3:1-9.
98. Baker BJ, Akhtar LN, Benveniste EN. SOCS1 and SOCS3 in the control of CNS
immunity. Trends Immunol 2009;30:392-400.
99. Lindeman GJ, Wittlin S, Lada H, Naylor MJ, Santamaria M, Zhang JG, et al.
SOCS1 deficiency results in accelerated mammary gland development and
rescues lactation in prolactin receptor-deficient mice. Genes Dev 2001;15:1631-6.
100. Greenhalgh CJ, Rico-Bautista E, Lorentzon M, Thaus AL, Morgan PO, Willson
TA, et al. SOCS2 negatively regulates growth hormone action in vitro and in vivo.
J Clin Invest 2005;115:397-406.
101. Roberts AW, Robb L, Rakar S, Hartley L, Cluse L, Nicola NA, et al. Placental
defects and embryonic lethality in mice lacking suppressor of cytokine signaling 3.
Proc Natl Acad Sci U S A 2001;98:9324-9.
102. Babon JJ, Nicola NA. The biology and mechanism of action of suppressor of
cytokine signaling 3. Growth Fac 2012;48:166-77.
103. Shouda T, Yoshida T, Hanada T, Wakioka T, Oishi M, Miyoshi K, et al.
Induction of the cytokine signal regulator SOCS3/CIS3 as a therapeutic strategy
for treating inflammatory arthritis. J Clin Invest 2001;108:1781-8.
104. Lang R, Pauleau A-L, Parganas E, Takahashi Y, Mages J, Ihle JN, et al. SOCS3
regulates the plasticity of gp130 signaling. Nat Immunol 2003;4:546-50.
Page 128
114
105. Lehmann U, Schmitz J, Weissenbach M, Sobota RM, Hortner M, Friederichs K,
et al. SHP2 and SOCS3 contribute to Tyr-759-dependent attenuation of
interleukin-6 signaling through gp130. J Biol Chem 2003;278:661-71.
106. Kershaw NJ, Murphy JM, Liau NP, Varghese LN, Laktyushin A, Whitlock EL, et
al. SOCS3 binds specific receptor-JAK complexes to control cytokine signaling
by direct kinase inhibition. Nat Struc& Molecul biol 2013;20:469-76.
107. Hanada T, Yoshida T, Kinjyo I, Minoguchi S, Yasukawa H, Kato S, et al. A
mutant form of JAB/SOCS1 augments the cytokine-induced JAK/STAT pathway
by accelerating degradation of wild-type JAB/CIS family proteins through the
SOCS-box. J Biol Chem 2001;276:40746-54.
108. Haan S, Ferguson P, Sommer U, Hiremath M, McVicar DW, Heinrich PC, et al.
Tyrosine phosphorylation disrupts elongin interaction and accelerates SOCS3
degradation. Biol Chem 2003;278:31972-9.
109. Babon JJ, Sabo JK, Soetopo A, Yao S, Bailey MF, Zhang JG, et al. The SOCS
box domain of SOCS3: Structure and interaction with the elonginBC-cullin5
ubiquitin ligase. J Mol Biol 2008.
110. Fischer P, Lehmann U, Sobota RM, Schmitz J, Niemand C, Linnemann S, et al.
The role of the inhibitors of interleukin-6 signal transduction SHP2 and SOCS3
for desensitization of interleukin-6 signalling. Biochem J 2004;378:449-60.
111. Ozawa Y, Nakao K, Kurihara T, Shimazaki T, Shimmura S, Ishida S, et al. Roles
of STAT3/SOCS3 pathway in regulation of the visual function and ubiquitin
proteasome-dependent degradation of Rhodopsin during retinal inflammation. J
Biol Chem 2008;283:24561-70.
Page 129
115
112. Kawazoe Y, Naka T, Fujimoto M, Kohzaki H, Morita Y, Narazaki M, et al.
Signal transducer and activation of transcription (STAT)-induced STAT inhibitor
1 (SSI-1)/suppressor of cytokine signaling 1 (SOCS1) inhibits insulin signal
transduction pathway through modulating insulin receptor substrate 1 (IRS-1)
phosphorylation. J Exp Med 2001;193:263-9.
113. Waiboci LW, Ahmed CM, Mujtaba MG, Flowers LO, Martin JP, Haider MI, et al.
Both the suppressor of cytokine signaling 1 (SOCS-1) kinase inhibitory region
and SOCS-1 mimetic bind to JAK2 autophosphorylation site: implications for the
development of a SOCS-1 antagonist. J Immunol 2007;178:5058-68.
114. Tamiya T, Kashiwagi I, Takahashi R, Yasukawa H, Yoshimura A. Suppressors of
Cytokine Signaling (SOCS) Proteins and JAK/STAT Pathways: Regulation of T-
Cell Inflammation by SOCS1 and SOCS3. Arterioscler Thromb Vasc Biol
2011;31:980-5.
115. Krebs DL, Hilton DJ. SOCS proteins: negative regulators of cytokine signaling.
Stem Cells 2001;19:378-87.
116. Ying M, Li D, Yang L, Wang M, Wang N, Chen Y, et al. Loss of SOCS3
expression is associated with an increased risk of recurrent disease in breast
carcinoma. J Cancer Res Clin Oncol 2010;48:166-77.
117. Tomita S, Ishibashi K, Hashimoto K, Sugino T, Yanagida T, Kushida N, et al.
Suppression of SOCS3 increases susceptibility of renal cell carcinoma to
interferon-alpha. Cancer Sci 2011;102:57-63.
Page 130
116
118. Pierconti F, Martini M, Pinto F, Cenci T, Capodimonti S, Calarco A, et al.
Epigenetic silencing of SOCS3 identifies a subset of prostate cancer with an
aggressive behavior. Prostate 2011;71:318-25.
119. Wu ZS, Cheng XW, Wang XN, Song NJ. Prognostic significance of
phosphorylated signal transducer and activator of transcription 3 and suppressor
of cytokine signaling 3 expression in human cutaneous melanoma. Melanoma Res
2011;21:483-90.
120. Li Y, de Haar C, Peppelenbosch MP, van der Woude CJ. SOCS3 in immune
regulation of inflammatory bowel disease and inflammatory bowel disease-related
cancer. Cytokine Growth Factor Rev 2012;23:127-38.
121. Berger H, Vegran F, Chikh M, Gilardi F, Ladoire S, Bugaut H, et al. SOCS3
transactivation by PPARgamma prevents IL-17-driven cancer growth. Cancer Res
2013; 2005;48:186-97.
122. Marine J-C, McKay C, Wang D, Topham DJ, Parganas E, Kakajima H, et al.
SOCS3 is essential in the regulation of fetal liver erythropoiesis. Cell
1999;98:617-27.
123. Kimura A, Kinjyo I, Matsumura Y, Mori H, Mashima R, Harada M, et al. SOCS3
is a physiological negative regulator for granulopoiesis and granulocyte colony-
stimulating factor receptor signaling. J Biol Chem 2004;279:6905-10.
124. Campbell IL. Cytokine-mediated inflammation, tumorigenesis, and disease-
associated JAK/STAT/SOCS signaling circuits in the CNS. Brain Res Brain Res
Rev 2005;48:166-77.
Page 131
117
125. Ernst M, Inglese M, Waring P, Campbell IK, Bao S, Clay FJ, et al. Defective
gp130-mediated signal transducer and activator of transcription (STAT) signaling
results in degenerative joint disease, gastrointestinal ulceration, and failure of
uterine implantation. J Exp Med 2001;194:189-203.
126. Croker BA, Kiu H, Pellegrini M, Toe J, Preston S, Metcalf D, et al. IL-6 promotes
acute and chronic inflammatory disease in the absence of SOCS3. Immunol Cell
Biol 2011;48:166-77.
127. Zhang Z, Zeng B, Jiao G, Li H, Jing Z, Ouyang J, et al. Suppressor of cytokine
signaling 3 promotes bone marrow cells to differentiate into CD8+ T lymphocytes
in lung tissue via up-regulating Notch1 expression. Cancer Res 2009;69:1578-86.
128. Owaki T, Asakawa M, Kamiya S, Takeda K, Fukai F, Mizuguchi J, et al. IL-27
suppresses CD28-medicated IL-2 production through suppressor of cytokine
signaling 3. J Immunol 2006;176:2773-80.
129. Seki Y, Inoue H, Nagata N, Hayashi K, Fukuyama S, Matsumoto K, et al. SOCS-
3 regulates onset and maintenance of T(H)2-mediated allergic responses. Nat Med
2003;9:1047-54.
130. Daegelmann C, Herberth G, Roder S, Herbarth O, Giese T, Kramer U, et al.
Association between suppressors of cytokine signalling, T-helper type 1/T-helper
type 2 balance and allergic sensitization in children. Clin Exp Allergy
2008;38:438-48.
131. Zhang X, Tao Y, Wang J, Garcia-Mata R, Markovic-Plese S. Simvastatin inhibits
secretion of Th17-polarizing cytokines and antigen presentation by DCs in
patients with relapsing remitting multiple sclerosis. Eur J Immunol 2013;43:281-9.
Page 132
118
132. Le Y, Zhu BM, Harley B, Park SY, Kobayashi T, Manis JP, et al. SOCS3 protein
developmentally regulates the chemokine receptor CXCR4-FAK signaling
pathway during B lymphopoiesis. Immunity 2007;27:811-23.
133. Liu Y, Stewart KN, Bishop E, Marek CJ, Kluth DC, Rees AJ, et al. Unique
expression of suppressor of cytokine signaling 3 is essential for classical
macrophage activation in rodents in vitro and in vivo. J Immunol 2008;180:6270-
8.
134. Niemand C, Nimmesgern A, Haan S, Fischer P, Schaper F, Rossaint R, et al.
Activation of STAT3 by IL-6 and IL-10 in primary human macrophages is
differentially modulated by suppressor of cytokine signaling 3. J Immunol
2003;170:3263-72.
135. Ilangumaran S, Ramanathan S, Rottapel R. Regulation of the immune system by
SOCS family adaptor proteins. Semin Immunol 2004;16:351-65.
136. Narayana Y, Balaji KN. Notch1 upregulation and signaling involved in
Mycobacterium bovis BCG induced SOCS3 expression in macrophages. J Biol
Chem 2008;283:12501-11.
137. Qin H, Holdbrooks AT, Liu Y, Reynolds SL, Yanagisawa LL, Benveniste EN.
SOCS3 deficiency promotes M1 macrophage polarization and inflammation. J
Immunol 2012;189:3439-48.
138. Yan C, Ward PA, Wang X, Gao H. Myeloid depletion of SOCS3 enhances LPS-
induced acute lung injury through CCAAT/enhancer binding protein delta
pathway. FASEB journal 2013; 122:2317-25.
Page 133
119
139. Qin H, Yeh W-I, De Sarno P, Holdbrooks AT, Liu Y, Muldowney MT, et al.
Signal transducer and activator of transcription-3/suppressor of cytokine
signaling-3 (STAT3/SOCS3) axis in myeloid cells regulates neuroinflammation.
Proc Natl Acad Sci U S A 2012;109:5004-9.
140. Jackson SH, Yu CR, Mahdi RM, Ebong S, Egwuagu CE. Dendritic cell
maturation requires STAT1 and is under feedback regulation by suppressors of
cytokine signaling. J Immunol 2004;172:2307-15.
141. Orabona C, Pallotta MT, Volpi C, Fallarino F, Vacca C, Bianchi R, et al. SOCS3
drives proteasomal degradation of indoleamine 2,3-dioxygenase (IDO) and
antagonizes IDO-dependent tolerogenesis. Proc Natl Acad Sci U S A
2008;105:20828-33.
142. Matsumura Y, Kobayashi T, Ichiyama K, Yoshida R, Hashimoto M, Takimoto T,
et al. Selective expansion of foxp3-positive regulatory T cells and
immunosuppression by suppressors of cytokine signaling 3-deficient dendritic
cells. J Immunol 2007;179:2170-9.
143. Carlier J, Martin H, Mariame B, Rauwel B, Mengelle C, Weclawiak H, et al.
Paracrine inhibition of GM-CSF signaling by human cytomegalovirus in
monocytes differentiating to dendritic cells. Blood 2011.
144. Cui Q, Jiang W, Wang Y, Lv C, Luo J, Zhang W, et al. Transfer of suppressor of
cytokine signaling 3 by an oncolytic adenovirus induces potential antitumor
activities in hepatocellular carcinoma. Hepatol 2008;47:105-12.
145. Fridman WH, Pages F, Sautes-Fridman C, Galon J. The immune contexture in
human tumours: impact on clinical outcome. Nature Rev Cancer 2012;12:298-306.
Page 134
120
146. Vesely MD, Kershaw MH, Schreiber RD, Smyth MJ. Natural innate and adaptive
immunity to cancer. Annu Rev Immunol;29:235-71.
147. Ikeda H, Old LJ, Schreiber RD. The roles of IFN in protection against tumor
development and cancer immunoediting. Cytokine Growth Factor Rev
2002;13:95-109.
148. Dunn GP, Bruce AT, Ikeda H, Old LJ, Schreiber RD. Cancer immunoediting:
from immunosurveillance to tumor escape. Nat Immunol 2002;3:991-8.
149. Koebel CM, Vermi W, Swann JB, Zerafa N, Rodig SJ, Old LJ, et al. Adaptive
immunity maintains occult cancer in an equilibrium state. Nature 2007;343:1022-
28.
150. Schreiber RD, Old LJ, Smyth MJ. Cancer immunoediting: integrating immunity's
roles in cancer suppression and promotion. Science 2011;331:1565-70.
151. Matsushita H, Vesely MD, Koboldt DC, Rickert CG, Uppaluri R, Magrini VJ, et
al. Cancer exome analysis reveals a T-cell-dependent mechanism of cancer
immunoediting. Nature 2012;482:400-4.
152. O'Sullivan T, Saddawi-Konefka R, Vermi W, Koebel CM, Arthur C, White JM, et
al. Cancer immunoediting by the innate immune system in the absence of
adaptive immunity. J Exp Med 2012;209:1869-82.
153. Whiteside TL. The tumor microenvironment and its role in promoting tumor
growth. Oncogene 2008;27:5904-12.
154. Zhu Z, Singh V, Watkins SK, Bronte V, Shoe JL, Feigenbaum L, et al. High-
avidity T cells are preferentially tolerized in the tumor microenvironment. Cancer
Res 2013;73:595-604.
Page 135
121
155. Ozao-Choy J, Ma G, Kao J, Wang GX, Meseck M, Sung M, et al. The novel role
of tyrosine kinase inhibitor in the reversal of immune suppression and modulation
of tumor microenvironment for immune-based cancer therapies. Cancer Res
2009;69:2514-22.
156. Hanahan D, Weinberg RA. Hallmarks of cancer: the next generation. Cell
2011;144:646-74.
157. Haffner MC, Mosbruger T, Esopi DM, Fedor H, Heaphy CM, Walker DA, et al.
Tracking the clonal origin of lethal prostate cancer. J clinl Invest 2013;123:4918-
22.
158. Sasaki T, Ryo A, Uemura H, Ishiguro H, Inayama Y, Yamanaka S, et al. An
immunohistochemical scoring system of prolyl isomerase Pin1 for predicting
relapse of prostate carcinoma after radical prostatectomy. Pathol Res Pract
2006;202:357-64.
159. Ogino S, Galon J, Fuchs CS, Dranoff G. Cancer immunology--analysis of host
and tumor factors for personalized medicine. Nature Rev Clin oncol 2011;8:711-9.
160. Carro MS, Lim WK, Alvarez MJ, Bollo RJ, Zhao X, Snyder EY, et al. The
transcriptional network for mesenchymal transformation of brain tumours. Nature
2010;463:318-25.
161. Joyce JA, Pollard JW. Microenvironmental regulation of metastasis. Nat Rev
Cancer 2009;9:239-52.
162. Grivennikov SI, Greten FR, Karin M. Immunity, inflammation, and cancer. Cell
2010;140:883-99.
Page 136
122
163. Elinav E, Nowarski R, Thaiss CA, Hu B, Jin C, Flavell RA. Inflammation-
induced cancer: crosstalk between tumours, immune cells and microorganisms.
Nat Rev Cancer 2013;13:759-71.
164. Tran Thang NN, Derouazi M, Philippin G, Arcidiaco S, Di Berardino-Besson W,
Masson F, et al. Immune infiltration of spontaneous mouse astrocytomas is
dominated by immunosuppressive cells from early stages of tumor development.
Cancer Res 2010;70:4829-39.
165. Inozume T, Hanada K, Wang QJ, Yang JC. IL-17 secreted by tumor reactive T
cells induces IL-8 release by human renal cancer cells. J Immunother
2009;32:109-17.
166. Donson AM, Birks DK, Schittone SA, Kleinschmidt-Demasters BK, Sun DY,
Hemenway MF, et al. Increased immune gene expression and immune cell
infiltration in high-grade astrocytoma distinguish long-term from short-term
survivors. J Immunol 2012;189:1920-7.
167. Critchley-Thorne RJ, Simons DL, Yan N, Miyahira AK, Dirbas FM, Johnson DL,
et al. Impaired interferon signaling is a common immune defect in human cancer.
Proc Natl Acad Sci U S A 2009;106:9010-5.
168. Griesinger AM, Birks DK, Donson AM, Amani V, Hoffman LM, Waziri A, et al.
Characterization of Distinct Immunophenotypes across Pediatric Brain Tumor
Types. J Immunol 2013;191:4880-8.
169. Gajewski TF, Schreiber H, Fu YX. Innate and adaptive immune cells in the tumor
microenvironment. Nat Immunol 2013;14:1014-22.
Page 137
123
170. Talmadge JE, Donkor M, Scholar E. Inflammatory cell infiltration of tumors:
Jekyll or Hyde. Cancer Metastasis Rev 2007;26:373-400.
171. Danese S, Mantovani A. Inflammatory bowel disease and intestinal cancer: a
paradigm of the Yin-Yang interplay between inflammation and cancer. Oncogene
2010;29:3313-23.
172. Fridman WH, Galon J, Pages F, Tartour E, Sautes-Fridman C, Kroemer G.
Prognostic and predictive impact of intra- and peritumoral immune infiltrates.
Cancer Res 2011;71:5601-5.
173. Broz Miranda L, Binnewies M, Boldajipour B, Nelson Amanda E, Pollack
Joshua L, Erle David J, et al. Dissecting the Tumor Myeloid Compartment
Reveals Rare Activating Antigen-Presenting Cells Critical for T Cell Immunity.
Cancer Cell;26:638-52.
174. Marx J. Cancer biology. All in the stroma: cancer's Cosa Nostra. Science
2008;320:38-41.
175. Jaiswal S, Chao MP, Majeti R, Weissman IL. Macrophages as mediators of tumor
immunosurveillance. Trends Immunol 2010;31:212-9.
176. Lawrence T, Hageman T, Balkwill F. Cancer. Sex, cytokines, and cancer. Science
2007;317:51-2.
177. Ruffell B, Au A, Rugo HS, Esserman LJ, Hwang ES, Coussens LM. Leukocyte
composition of human breast cancer. Proc Natl Acad Sci U S A 2012;109:2796-
801.
178. Marx J. Cancer immunology. Cancer's bulwark against immune attack: MDS cells.
Science 2008;319:154-6.
Page 138
124
179. Ostrand-Rosenberg S, Sinha P. Myeloid-derived suppressor cells: linking
inflammation and cancer. J Immunol 2009;182:4499-506.
180. Gabrilovich DI, Ostrand-Rosenberg S, Bronte V. Coordinated regulation of
myeloid cells by tumours. Nat Rev Immunol 2012;12:253-68.
181. Coussens LM, Zitvogel L, Palucka AK. Neutralizing tumor-promoting chronic
inflammation: a magic bullet? Science 2013;339:286-91.
182. Sawant A, Hensel JA, Chanda D, Harris BA, Siegal GP, Maheshwari A, et al.
Depletion of plasmacytoid dendritic cells inhibits tumor growth and prevents bone
metastasis of breast cancer cells. J Immunol 2012;189:4258-65.
183. Arima K, Watanabe N, Hanabuchi S, Chang M, Sun SC, Liu YJ. Distinct signal
codes generate dendritic cell functional plasticity. Sci Signal 2010;3:ra4.
184. Yang XD, Ai W, Asfaha S, Bhagat G, Friedman RA, Jin G, et al. Histamine
deficiency promotes inflammation-associated carcinogenesis through reduced
myeloid maturation and accumulation of CD11b+Ly6G+ immature myeloid cells.
Nat Med 2011;17:87-95.
185. Pang Y, Gara SK, Achyut BR, Li Z, Yan HH, Day CP, et al. TGF-beta signaling
in myeloid cells is required for tumor metastasis. Cancer Discov 2013;3:936-51.
186. Zhang Z, Liu Q, Che Y, Yuan X, Dai L, Zeng B, et al. Antigen presentation by
dendritic cells in tumors is disrupted by altered metabolism that involves pyruvate
kinase M2 and its interaction with SOCS3. Cancer Res 2010;70:89-98.
187. Sultan AS, Brim H, Sherif ZA. Co-overexpression of Janus kinase 2 and signal
transducer and activator of transcription 5a promotes differentiation of mammary
Page 139
125
cancer cells through reversal of epithelial-mesenchymal transition. Cancer Sci
2008;99:272-9.
188. Ganguly D, Haak S, Sisirak V, Reizis B. The role of dendritic cells in
autoimmunity. Nature Rev Immunol 2013;13:566-77.
189. Palucka K, Ueno H, Banchereau J. Recent developments in cancer vaccines. J
Immunol 2011;186:1325-31.
190. Watkins SK, Hurwitz AA. FOXO3: A master switch for regulating tolerance and
immunity in dendritic cells. Oncoimmunol 2012;1:252-4.
191. Blankenstein T, Coulie PG, Gilboa E, Jaffee EM. The determinants of tumour
immunogenicity. Nature Rev Cancer 2012;12:307-13.
192. Shi C, Pamer EG. Monocyte recruitment during infection and inflammation.
Nature Rev Immunol 2011;11:762-74.
193. Ono M, Torisu H, Fukushi J-I, Nishie A, Kuwano M. Biological implications of
macrophage infiltration in human tumor angiogenesis. Cancer Chemother
Pharmacol 1999;43 Suppl:S69-s71.
194. Condeelis J, Pollard JW. Macrophages: obligate partners for tumor cell migration,
invasion, and metastasis. Cell 2006;124:263-6.
195. Sica A, Larghi P, Mancino A, Rubino L, Porta C, Totaro MG, et al. Macrophage
polarization in tumour progression. Semin Cancer Biol 2008;18:349-55.
196. Doedens AL, Stockmann C, Rubinstein MP, Liao D, Zhang N, DeNardo DG, et al.
Macrophage expression of hypoxia-inducible factor-1 alpha suppresses T-cell
function and promotes tumor progression. Cancer Res 2010;70:7465-75.
Page 140
126
197. De Palma M, Lewis CE. Cancer: Macrophages limit chemotherapy. Nature
2011;472:303-4.
198. Sica A, Mantovani A. Macrophage plasticity and polarization: in vivo veritas. J
Clin Inv 2012;122:787-95.
199. Kershaw MH, Smyth MJ. Immunology. Making macrophages eat cancer. Science
2013;341:41-2.
200. Lesokhin AM, Hohl TM, Kitano S, Cortez C, Hirschhorn-Cymerman D, Avogadri
F, et al. Monocytic CCR2(+) myeloid-derived suppressor cells promote immune
escape by limiting activated CD8 T-cell infiltration into the tumor
microenvironment. Cancer Res 2012;72:876-86.
201. Mantovani A, Biswas SK, Galdiero MR, Sica A, Locati M. Macrophage plasticity
and polarization in tissue repair and remodelling. J Pathol 2013;229:176-85.
202. Jordan JT, Sun W, Hussain SF, Deangulo G, Prabhu SS, Heimberger AB.
Preferential migration of regulatory T cells mediated by glioma-secreted
chemokines can be blocked with chemotherapy. Cancer Immunol Immunother
2008;57:123-31.
203. Castellone MD, Teramoto H, Williams BO, Druey KM, Gutkind JS.
Prostaglandin E2 promotes colon cancer cell growth through a Gs-axin-beta-
catenin signaling axis. Science 2005;310:1504-10.
204. Amarnath S, Mangus CW, Wang JCM, Wei F, He A, Kapoor V, et al. The PDL1-
PD1 Axis Converts Human TH1 Cells into Regulatory T Cells. Sci Trans Med
2011;3:111ra20.
Page 141
127
205. Min Y, Ren X, Vaught DB, Chen J, Donnelly E, Lynch CC, et al. Tie2 signaling
regulates osteoclastogenesis and osteolytic bone invasion of breast cancer. Cancer
Res 2010;70:2819-28.
206. Cortez-Retamozo V, Etzrodt M, Newton A, Rauch PJ, Chudnovskiy A, Berger C,
et al. Origins of tumor-associated macrophages and neutrophils. Proc Natl Acad
Sci U S A 2012;109:2491-6.
207. Talmadge JE, Gabrilovich DI. History of myeloid-derived suppressor cells. Nat
Rev Cancer 2013;13:739-52.
208. Croker BA, Metcalf D, Robb L, Wei W, Mifsud S, DiRago L, et al. SOCS3 is a
critical physiological negative regulator of G-CSF signaling and emergency
granulopoiesis. Immunity 2004;20:153-65.
209. Youn JI, Nagaraj S, Collazo M, Gabrilovich DI. Subsets of myeloid-derived
suppressor cells in tumor-bearing mice. J Immunol 2008;181:5791-802.
210. Movahedi K, Laoui D, Gysemans C, Baeten M, Stange G, Van den Bossche J, et
al. Different tumor microenvironments contain functionally distinct subsets of
macrophages derived from Ly6C(high) monocytes. Cancer Res 2010;70:5728-39.
211. Mantovani A, Cassatella MA, Costantini C, Jaillon S. Neutrophils in the
activation and regulation of innate and adaptive immunity. Nat Rev Immunol
2011;11:519-31.
212. Medina-Echeverz J, Fioravanti J, Zabala M, Ardaiz N, Prieto J, Berraondo P.
Successful colon cancer eradication after chemoimmunotherapy is associated with
profound phenotypic change of intratumoral myeloid cells. J Immunol
2011;186:807-15.
Page 142
128
213. Murdoch C, Muthana M, Coffelt SB, Lewis CE. The role of myeloid cells in the
promotion of tumour angiogenesis. Nat Rev Cancer 2008;8:618-31.
214. Nguyen-Jackson H, Panopoulos AD, Zhang H, Li HS, Watowich SS. STAT3
controls the neutrophil migratory response to CXCR2 ligands by direct activation
of G-CSF-induced CXCR2 expression and via modulation of CXCR2 signal
transduction. Blood 2010;115:3354-63.
215. Yang L, Pang Y, Moses HL. TGF-beta and immune cells: an important regulatory
axis in the tumor microenvironment and progression. Trends Immunol
2010;31:220-7.
216. Park S, Zhao D, Hatanpaa KJ, Mickey BE, Saha D, Boothman DA, et al. RIP1
Activates PI3K-Akt via a Dual Mechanism Involving NF-{kappa}B-Mediated
Inhibition of the mTOR-S6K-IRS1 Negative Feedback Loop and Down-
regulation of PTEN. Cancer Res 2009;69:4107-11.
217. Britschgi A, Andraos R, Brinkhaus H, Klebba I, Romanet V, Muller U, et al.
JAK2/STAT5 inhibition circumvents resistance to PI3K/mTOR blockade: a
rationale for cotargeting these pathways in metastatic breast cancer. Cancer cell
2012;22:796-811.
218. Das Roy L, Pathangey LB, Tinder TL, Schettini JL, Gruber HE, Mukherjee P.
Breast-cancer-associated metastasis is significantly increased in a model of
autoimmune arthritis. Breast Cancer Res 2009;11:R56.
219. Fridlender ZG, Sun J, Kim S, Kapoor V, Cheng G, Ling L, et al. Polarization of
tumor-associated neutrophil phenotype by TGF-beta: "N1" versus "N2" TAN.
Cancer Cell 2009;16:183-94.
Page 143
129
220. Smith C, Chang MY, Parker KH, Beury DW, DuHadaway JB, Flick HE, et al.
IDO is a nodal pathogenic driver of lung cancer and metastasis development.
Cancer Discov 2012;2:722-35.
221. Jia W, Jackson-Cook C, Graf MR. Tumor-infiltrating, myeloid-derived suppressor
cells inhibit T cell activity by nitric oxide production in an intracranial rat glioma
+ vaccination model. J Neuroimmunol 2010;223:20-30.
222. Bald T, Quast T, Landsberg J, Rogava M, Glodde N, Lopez-Ramos D, et al.
Ultraviolet-radiation-induced inflammation promotes angiotropism and metastasis
in melanoma. Nature 2014;507:109-13.
223. Sinha P, Clements VK, Bunt SK, Albelda SM, Ostrand-Rosenberg S. Cross-talk
between myeloid-derived suppressor cells and macrophages subverts tumor
immunity toward a type 2 response. J Immunol 2007;179:977-83.
224. Nagaraj S, Gupta K, Pisarev V, Kinarsky L, Sherman S, Kang L, et al. Altered
recognition of antigen is a mechanism of CD8+ T cell tolerance in cancer. Nat
Med 2007;13:828-35.
225. Greten TF, Manns MP, Korangy F. Myeloid derived suppressor cells in human
diseases. International immunopharmacology 2011;11:802-7.
226. Khaled YS, Ammori BJ, Elkord E. Myeloid-derived suppressor cells in cancer:
recent progress and prospects. Immunol Cell Biol 2013;91:493-502.
227. Youn JI, Gabrilovich DI. The biology of myeloid-derived suppressor cells: the
blessing and the curse of morphological and functional heterogeneity. Eur J
Immunol 2010;40:2969-75.
Page 144
130
228. Ostrand-Rosenberg S, Sinha P, Beury DW, Clements VK. Cross-talk between
myeloid-derived suppressor cells (MDSC), macrophages, and dendritic cells
enhances tumor-induced immune suppression. Semi Cancer bio 2012;22:275-81.
229. Ortiz ML, Lu L, Ramachandran I, Gabrilovich DI. Myeloid-derived suppressor
cells in the development of lung cancer. Cancer Immunol Res 2014;2:50-8.
230. Peranzoni E, Zilio S, Marigo I, Dolcetti L, Zanovello P, Mandruzzato S, et al.
Myeloid-derived suppressor cell heterogeneity and subset definition. Cur Opin in
Immunol 2010;22:238-44.
231. Chae M, Peterson TE, Parney IF, Johnson AJ. Increasing Intracranial Glioma-
Associated Macrophages Drives Systemic Myeloid-Derived Suppressor Cell
Expansion. Neuro-Oncology 2012;14:vi42.
232. Chatterjee S, Das S, Chakraborty P, Manna A, Chatterjee M, Choudhuri SK.
Myeloid derived suppressor cells (MDSCs) can induce the generation of Th17
response from naive CD4+ T cells. Immunobio 2013;218:718-24.
233. Lu T, Ramakrishnan R, Altiok S, Youn JI, Cheng P, Celis E, et al. Tumor-
infiltrating myeloid cells induce tumor cell resistance to cytotoxic T cells in mice.
The J Clin Invest 2011;121:4015-29.
234. Panopoulos AD, Zhang L, Snow JW, Jones DM, Smith AM, El Kasmi KC, et al.
STAT3 governs distinct pathways in emergency granulopoiesis and mature
neutrophils. Blood 2006;108:3682-90.
235. Panopoulos AD, Watowich SS. Granulocyte colony-stimulating factor: molecular
mechanisms of action during steady state and 'emergency' hematopoiesis.
Cytokine 2008;42:277-88.
Page 145
131
236. Gordy C, Pua H, Sempowski GD, He YW. Regulation of steady-state neutrophil
homeostasis by macrophages. Blood 2011;117:618-29.
237. Eyles JL, Hickey MJ, Norman MU, Croker BA, Roberts AW, Drake SF, et al. A
key role for G-CSF-induced neutrophil production and trafficking during
inflammatory arthritis. Blood 2008;112:5193-201.
238. Irandoust MI, Aarts LH, Roovers O, Gits J, Erkeland SJ, Touw IP. Suppressor of
cytokine signaling 3 controls lysosomal routing of G-CSF receptor. Embo J
2007;26:1782-93.
239. von Vietinghoff S, Ley K. Homeostatic regulation of blood neutrophil counts. J
Immunol 2008;181:5183-8.
240. Haribabu B, Richardson RM, Fisher I, Sozzani S, Peiper SC, Horuk R, et al.
Regulation of human chemokine receptors CXCR4. J Biol Chem
1997;272:28726-31.
241. Moore MAS. The role of chemoattraction in cancer metastases. Bioessays
2001;23:674-6.
242. Burger J, Kipps T. CXCR4: a key receptor in the crosstalk between tumor cells
and their microenvironment. Blood 2006;107:1761-7.
243. Richert MM, Vaidya KS, Mills CN, Wong D, Korz W, Hurst DR, et al. Inhibition
of CXCR4 by CTCE-9908 inhibits breast cancer metastasis to lung and bone.
Oncol Rep 2009;21:761-7.
244. Lu M, Grove EA, Miller RJ. Abnormal development of the hippocampal dentate
gyrus in mice lacking the CXCR4 chemokine receptor. Proc Natl Acad Sci U S A
2002;99:7090-5.
Page 146
132
245. Zhou Y, Larsen PH, Hao C, Yong VW. CXCR4 is a major chemokine receptor on
glioma cells and mediates their survival. J Biol Chem 2002;277:49481-7.
246. Srivastava MK, Sinha P, Clements VK, Rodriguez P, Ostrand-Rosenberg S.
Myeloid-derived suppressor cells inhibit T-cell activation by depleting cystine
and cysteine. Cancer research 2010;70:68-77.
247. King IL, Dickendesher TL, Segal BM. Circulating Ly-6C+ myeloid precursors
migrate to the CNS and play a pathogenic role during autoimmune demyelinating
disease. Blood 2009;113:3190-7.
248. Ramachandran IR, Martner A, Pisklakova A, Condamine T, Chase T, Vogl T, et
al. Myeloid-derived suppressor cells regulate growth of multiple myeloma by
inhibiting T cells in bone marrow. J Immunol 2013;190:3815-23.
249. Schlecker E, Stojanovic A, Eisen C, Quack C, Falk CS, Umansky V, et al.
Tumor-Infiltrating Monocytic Myeloid-Derived Suppressor Cells Mediate CCR5-
Dependent Recruitment of Regulatory T Cells Favoring Tumor Growth. J
Immunol 2012;189:5602-11.
250. Ko JS, Zea AH, Rini BI, Ireland JL, Elson P, Cohen P, et al. Sunitinib mediates
reversal of myeloid-derived suppressor cell accumulation in renal cell carcinoma
patients. Clin Cancer Res 2009;15:2148-57.
251. Condamine T, Gabrilovich DI. Molecular mechanisms regulating myeloid-
derived suppressor cell differentiation and function. Tren Immunol 2011;32:19-25.
252. Li L, Zhang J, Diao W, Wang D, Wei Y, Zhang CY, et al. MicroRNA-155 and
MicroRNA-21 Promote the Expansion of Functional Myeloid-Derived Suppressor
Cells. J Immunol 2014;192:1034-43.
Page 147
133
253. Marigo I, Bosio E, Solito S, Mesa C, Fernandez A, Dolcetti L, et al. Tumor-
induced tolerance and immune suppression depend on the C/EBPbeta
transcription factor. Immunity 2010;32:790-802.
254. Xu J, Escamilla J, Mok S, David J, Priceman S, West B, et al. CSF1R signaling
blockade stanches tumor-infiltrating myeloid cells and improves the efficacy of
radiotherapy in prostate cancer. Cancer Res 2013;73:2782-94.
255. Sawant A, Schafer CC, Jin TH, Zmijewski J, Tse HM, Roth J, et al. Enhancement
of Antitumor Immunity in Lung Cancer by Targeting Myeloid-Derived
Suppressor Cell Pathways. Cancer Res 2013:1-12
256. Begemann M, Fuller GN, Holland EC. Genetic modeling of glioma formation in
mice. Brain Pathol 2002;12:117-32.
257. Greenberg NM, DeMayo F, Finegold MJ, Medina D, Tilley WD, Aspinall JO, et
al. Prostate cancer in a transgenic mouse. Proc Natl Acad Sci U S A
1995;92:3439-43.
258. Berger MF, Lawrence MS, Demichelis F, Drier Y, Cibulskis K, Sivachenko AY,
et al. The genomic complexity of primary human prostate cancer. Nature
2011;470:214-20.
259. Roychowdhury S, Chinnaiyan AM. Advancing precision medicine for prostate
cancer through genomics. J Clin Oncol 2013;31:1866-73.
260. Bartek J, Mistrik M, Bartkova J. Androgen receptor signaling fuels DNA repair
and radioresistance in prostate cancer. Cancer Discov 2013;3:1222-4.
Page 148
134
261. Polkinghorn WR, Parker JS, Lee MX, Kass EM, Spratt DE, Iaquinta PJ, et al.
Androgen receptor signaling regulates DNA repair in prostate cancers. Cancer
Discov 2013;3:1245-53.
262. da Silva HB, Amaral EP, Nolasco EL, de Victo NC, Atique R, Jank CC, et al.
Dissecting Major Signaling Pathways throughout the Development of Prostate
Cancer. Prostate cancer 2013;2013:920612.
263. Pienta KJ, Walia G, Simons JW, Soule HR. Beyond the androgen receptor: New
approaches to treating metastatic prostate cancer. Report of the 2013 Prouts Neck
Prostate Cancer Meeting. The Prostate 2014;74:314-20.
264. McNutt M. Cancer immunotherapy. Science 2013;342:1417.
265. Couzin-Frankel J. Breakthrough of the year 2013. Cancer immunotherapy.
Science 2013;342:1432-3.
266. Nelson WG. Profiling prostate cancer. Proc Natl Acad Sci U S A
2011;108:20861-2.
267. Gladson CL, Welch DR. New insights into the role of CXCR4 in prostate cancer
metastasis. Cancer Biol Ther 2008;7.
268. Hong MK, Kong J, Namdarian B, Longano A, Grummet J, Hovens CM, et al.
Paraneoplastic syndromes in prostate cancer. Nat Rev Urol 2010;7:681-92.
269. Goldstein AS, Huang J, Guo C, Garraway IP, Witte ON. Identification of a cell of
origin for human prostate cancer. Science 2010;329:568-71.
270. Hurwitz AA, Foster BA, Allison JP, Greenberg NM, Kwon ED. The TRAMP
Mouse as a Model for Prostate Cancer. Current Protocols in Immunology: John
Wiley & Sons, Inc.; 2001.
Page 149
135
271. Isayeva T, Chanda D, Kallman L, Eltoum IE, Ponnazhagan S. Effects of sustained
antiangiogenic therapy in multistage prostate cancer in TRAMP model. Cancer
Res 2007;67:5789-97.
272. Gurusamy D, Gray JK, Pathrose P, Kulkarni RM, Finkleman FD, Waltz SE.
Myeloid-specific expression of Ron receptor kinase promotes prostate tumor
growth. Cancer Res 2013;73:1752-63.
273. Irshad S, Abate-Shen C. Modeling prostate cancer in mice: something old,
something new, something premalignant, something metastatic. Cancer Met Rev
2013;32:109-22.
274. Liu Z, Eltoum IE, Guo B, Beck BH, Cloud GA, Lopez RD. Protective
immunosurveillance and therapeutic antitumor activity of gammadelta T cells
demonstrated in a mouse model of prostate cancer. J Immunol 2008;180:6044-53.
275. Irshad S, Bansal M, Castillo-Martin M, Zheng T, Aytes A, Wenske S, et al. A
molecular signature predictive of indolent prostate cancer. Sci Trans Med
2013;5:202ra122.
276. Kroon P, Berry PA, Stower MJ, Rodrigues G, Mann VM, Simms M, et al. JAK-
STAT blockade inhibits tumor initiation and clonogenic recovery of prostate
cancer stem-like cells. Cancer Res 2013;73:5288-98.
277. Yu H, Liu Y, McFarland BC, Deshane JS, Hurst DR, Ponnazhagan S, et al.
SOCS3 Deficiency in Myeloid Cells Promotes Tumor Development: Involvement
of STAT3 Activation and Myeloid-Derived Suppressor Cells. Cancer Immunol
Res 2015;3:727-40.
Page 150
136
278. Shodeinde AL, Barton BE. Potential use of STAT3 inhibitors in targeted prostate
cancer therapy: future prospects. OncoTarg Ther 2012;5:119-25.
279. Yu H, Kortylewski M, Pardoll D. Crosstalk between cancer and immune cells:
role of STAT3 in the tumour microenvironment. Nat Rev Immunol 2007;7:41-51.
280. Schroeder A, Herrmann A, Cherryholmes G, Kowolik C, Buettner R, Pal S, et al.
Loss of androgen receptor expression promotes a stem-like cell phenotype in
prostate cancer through STAT3 signaling. Cancer Res 2014;74:1227-37.
281. Boyle K, Egan P, Rakar S, Willson TA, Wicks IP, Metcalf D, et al. The SOCS
box of suppressor of cytokine signaling-3 contributes to the control of G-CSF
responsiveness in vivo. Blood 2007;110:1466-74.
282. Bayne LJ, Beatty GL, Jhala N, Clark CE, Rhim AD, Stanger BZ, et al. Tumor-
derived granulocyte-macrophage colony-stimulating factor regulates myeloid
inflammation and T cell immunity in pancreatic cancer. Cancer Cell 2012;21:822-
35.
283. Waight JD, Netherby C, Hensen ML, Miller A, Hu Q, Liu S, et al. Myeloid-
derived suppressor cell development is regulated by a STAT/IRF-8 axis. J Clin
Invest 2013;123:4464-78.
284. Bekisz J, Sato Y, Johnson C, Husain SR, Puri RK, Zoon KC. Immunomodulatory
effects of interferons in malignancies. J Interf & Cyto Res 2013;33:154-61.
285. Calarco A, Pinto F, Pierconti F, Sacco E, Marrucci E, Totaro A, et al. Role of
SOCS3 evaluated by immunohistochemical analysis in a cohort of patients
affected by prostate cancer: preliminary results. Urologia 2012;79 Suppl 19:4-8.
Page 151
137
286. Pardoll DM. The blockade of immune checkpoints in cancer immunotherapy. Nat
Rev Cancer 2012;12:252-64.
Page 152
138
APPENDIX
INSTITUTIONAL ANIMAL CARE AND USE COMMITTEE APPROVAL