182
SOFC Anode Hydrogen oxidation at porous nickel and nickel/yttria- stabilised zirconia cermet electrodes Baukje de Boer

SOFC Anode
Hydrogen oxidation at porous nickel and nickel/yttria-stabilised zirconia cermet electrodes
Baukje de Boer

Boer, Baukje de
SOFC Anodes : Hydrogen oxidation at porous nickel and nickel/yttria-stabilised zirconia
cermet electrodes
Thesis Enschede. – With ref. – With summary in Dutch.
ISBN 90-36511909
Copyright 1998 by B. de Boer, the Netherlands.

SOFC ANODE
HYDROGEN OXIDATION AT POROUS NICKEL AND
NICKEL/YTTRIA-STABILISED ZIRCONIA CERMET ELECTRODES
PROEFSCHRIFT
ter verkrijging van
de graad van doctor aan de Universiteit Twente,
op gezag van de rector magnificus,
prof. dr. F.A. van Vught,
volgens besluit van het College voor Promoties
in het openbaar te verdedigen
op vrijdag 9 oktober 1998 te 16.45 uur.
door
Baukje de Boer
geboren op 8 oktober 1968
te Appelscha

Dit proefschrift is goedgekeurd door de promotor
prof. dr. ir. H. Verweij
en de assistent promotor
dr. H.J.M. Bouwmeester

‘I have yet to see any problem, however complicated,which, when you looked at it in the right way,
did not become still more complicated’P. Anderson, 1926
(New scientist, 25 September 1969, p 639)

The investigations described in this thesis were supported financially by the Netherlands EnergyResearch Foundation, ECN.
Summary
In the ongoing search for alternative and environmental friendly power generation facili-ties, the fuel cell is a good candidate. There are several types of fuel cells with large differ-ences in application, size, cost and operating range. The Solid Oxide Fuel Cell (SOFC) is ahigh temperature fuel cell, interesting for decentralised generation of heat and power.Nickel/yttria-stabilised zirconia cermet is the state-of-the-art material for use as anode inSOFCs. This thesis describes a number of experimental studies on the anode of the SOFC.The emphasis is on two important aspects of this type of electrode, the kinetics of the hy-drogen oxidation reaction and the effect of the microstructure on the electrochemical per-formance of the electrode. Insight in these two aspects will lead to a better understandingand further improvements of the anode.A general introduction in fuel cells is given in Chapter 1, followed by a brief review onSOFC materials and SOFC anode kinetics as reported in literature. This last part gives areview of different mechanisms proposed in literature from which it is evident that the ex-act nature of the reaction kinetics has still not been well established.In Chapter 2 the experimental set-up and the design for the electrochemical cell is de-scribed. Let it be a warning to every researcher who needs to do concessions when an ex-perimental set-up is built to study only part of the system.Porous nickel electrodes are the subject of Chapter 3 and 4. The choice to study this type ofelectrodes is initiated because of their less complicated microstructure compared with theNi/YSZ cermet electrodes. The lithograpically prepared nickel pattern electrodes (Chapter3) have a well defined microstructure in terms of electrolyte area covered with nickel andthe Triple Phase Boundary (TPB) line between electrolyte, electrode and gas phase. Linepatterns with variation in nickel line width from 10 to 75 µm resulted after electrochemicalmeasurements in TPB lengths in the range 1.6 to 11.3 m⋅cm-2. For electrochemical charac-terisation of the electrodes impedance and I-η type of measurements are performed. Im-pedance measurements performed under standard conditions resulted in spectra, whichwhen analysed with an equivalent circuit, are built up out of three semicircles, one of thesedominating the overall behaviour. A relation between the TPB length and the overall elec-trode performance seems apparent, but experimental data show large scatter.The porous nickel electrodes described in Chapter 4 can be regarded as a nickel layer per-forated with small holes. Although quantification of the microstructure of this type ofelectrode is less straightforward compared with that of the lithographic electrodes, reason-able results are obtained with image analysis. TPB lengths of this type of electrode are inthe range 45 to 61 m⋅cm-2. Again a relation is obtained between the TPB length and theelectrode conductivity. At equilibrium the impedance diagram consists of one dominant arcat the high frequency side of the spectra and a significantly smaller arc at the low fre-quency side. Results of impedance and I-η measurements as a function of pH2 and pH2Oare discussed in view of a tentative multi-step mechanism formulated for the electrode re-action. The results indicate that a simple description in terms of a Butler-Volmer formal-ism, based on a single rate determining step, is excluded. It is suggested that a strongvariation in the fractional coverage of adsorbed intermediates with overpotential η on ei-
ther nickel or yttria-stabilised zirconia surfaces must be taken into consideration to accountfor the experimental data.To study the effect of YSZ in cermet electrodes the surface of a porous nickel electrodewas modified with fine YSZ (Chapter 5). The surface modification leads to a significantimprovement in the electrochemical activity compared with that of bare porous nickelelectrodes, e.g. the total electrode resistance decreases with more than 50%. This effect isascribed to an increase in the number of reaction sites. The polarisation and impedance be-haviour at different H2 and H2O partial pressures for the modified nickel electrodes isfound to be very similar to that observed for bare nickel electrodes.In Chapter 6, the study on the nickel/yttria-stabilised zirconia cermet electrodes starts withanalysis of the microstructure. By using different ratios of fine to coarse YSZ powder dur-ing the preparation of the electrodes seven different microstructures were obtained. Themicrostructures was quantified by image analysis in terms of porosity, nickel particle sizeand surface coverage of the interface between the electrode and the electrolyte. The rela-tion between the electrochemical performance of the electrode and the surface coverageindicates that, for coarse cermet structures, the electrode reaction is confined to the imme-diate interface between the cermet electrode and the electrolyte. For fine cermet structureson the other hand, the electrode reaction zone extends into the bulk of the cermet.To obtain more insight in the spatial extension of the TPB perimeter in a direction perpen-dicular to the electrolyte / porous electrode interface a ladder network (continuous trans-mission line) model is involved in analysis of impedance data as discussed in Chapter 7.For this network an analytical expression is derived for the impedance. The variables in themodel are the impedances associated with the transport of ionic and electronic charge car-riers through both constituent phases of ceramic and metal, and that of the charge transferreaction at the TPB points. The results show that the replacement of coarse YSZ particlesby a corresponding fraction of fine YSZ particles in electrode preparation reduces the totalpolarisation losses, but does not change the requirements regarding the thickness of theelectrodes in order to optimise their performance.In Chapter 8 the kinetics of the hydrogen oxidation reaction at the cermet electrodes isstudied by impedance measurements as a function of pH2 and pH2O partial pressures, ano-dic polarisation and temperature. The impedance spectra show a complex behaviour at thelow frequency side, which is not completely understood. This part consists of a smallsemicircle with a large capacitance value at the low frequency side and an inductive loopin the mid-frequency region. The appearance of an inductive loop can be associated withconcentration relaxation of adsorbed intermediates. The high frequency arc can be relatedwith the TPB length and is therefore ascribed to charge transfer.In the last chapter an evaluation of the results in this thesis work is given. As four differenttypes of electrodes, with their own specific microstructure are studied under the similarexperimental conditions, a perfect opportunity is created to obtain insight in the relationbetween the microstructure and the electrochemical performance of the electrodes. Theelectrodes cover a large range in the triple phase boundary length. For the nickel electrodesa linear relationship exists between the TPB length, which is related with the active areafor the electrode reaction, and the total electrode conductivity. Based upon this linear rela-

tionship it is concluded that for the cermet electrodes part of the bulk is active in the elec-trode reaction, consistent with the results from transmission line modelling of the imped-ance behaviour of the cermet. A transmission line model indicates that for all cermet elec-trodes the bulk will be active. For increasing fractions of fine to coarse YSZ in the cermetelectrodes the TPB length per unit volume of the electrode increases, leading to a decreasein the electrode resistance. This result emphasises the importance of a fine and highly per-colative structure for the cermet electrodeThe combined results of reaction kinetic studies at the different types of electrode supportthe conclusion that under the conditions covered by these experiments the electrode proc-esses are governed by charge transfer.
Samenvatting
In de voortdurende zoektocht naar alternatieve en milieuvriendelijke mogelijkheden voorde opwekking van electriciteit, wordt de brandstofcel gezien als een goede kandidaat. Erzijn verscheidende type brandstofcellen die zich onderscheiden op het gebied van toepas-sing, grootte, kosten en werkgebied. De vaste oxide brandstofcel (SOFC) is een brandstof-cel met een hoge werktemperatuur, deze cel is vooral interessant voor het gedecentrali-seerd opwekken van warmte en electriciteit. Nikkel/yttria-gestabiliseerd zirconia cermet isop dit moment het state-of-the-art materiaal voor de anode van de SOFC. Het accent vandit werk ligt bij twee belangrijke aspecten van dit type electrode, de kinetiek van de water-stof oxidatie reactie en het effect van de microstructuur op het electrochemisch gedrag vande electrode. Inzicht in deze aspecten zal leiden tot een beter begrip en tot betere prestatiesvan de anode.Een algemene introductie in brandstofcellen wordt gegeven in Hoofdstuk 1. Dit wordt ver-volgd met een kort overzicht van de SOFC materialen en de SOFC anode kinetiek zoalsgegeven in de literatuur. Uit de verschillende reactie mechanismen zoals deze zijn voorge-steld kan geconcludeerd worden dat de eigenlijke aard van de anode reactie nog niet isvastgesteld.In Hoofdstuk 2 wordt de experimentele opstelling en het ontwerp van de electrochemischecel beschreven. Laat het een waarschuwing zijn voor alle onderzoekers die concessiesmoeten doen op het moment dat een meetopstelling wordt gebouwd waarin slechts eendeel van het uiteindelijke systeem wordt bestudeerd.Poreuze nikkel electroden zijn het onderwerp van Hoofdstuk 3 en 4. De keuze om aan dittype electroden te meten wordt ingegeven door de eenvoudige microstructuur van nikkelelectroden in vergelijking met die van de Ni/YSZ cermet electroden. De nikkel patroonelectroden die gemaakt zijn met lithografische technieken (Hoofdstuk 3) bezitten een goedgedefinieerde microstructuur in termen van het met nikkel bedekte electrolyt oppervlak ende drie-fase-grens (TPB) tussen het electrolyt, de electrode en de gas fase. Lijn patronenwaarbij de nikkel lijn breedte wordt gevarieerd tussen 10 en 75 µm resulteert, na electro-chemische metingen, in een TPB lengte tussen de 1.6 en 11.3 m⋅cm-2. Voor de electroche-mische karakterisering van de electroden wordt gebruik gemaakt van impedantie en I-ηmetingen. Impedantie spectra die volgen uit impedantie metingen onder standaard condi-ties worden geanalyseerd met een equivalent circuit. Deze fit bestaat uit drie halve bogen,waarvan één boog het totale gedrag domineert. Een relatie werd gevonden tussen de TPBlengte en het totale electrode gedrag, waarbij vermeld dient te worden dat er in de electro-chemische data van de patroon electroden een behoorlijke spreiding zit.De poreuze nikkel electroden zoals beschreven in Hoofdstuk 4 kunnen worden beschouwdals nikkel lagen met vele kleine gaatjes. De quantificering van dit type microstructuren isminder eenvoudig dan die van patroon electroden. Met behulp van beeldanalyse techniekenkunnen redelijke resultaten worden verkregen. Voor dit type electrode ligt de TPB lengtetussen de 45 en 61 m⋅cm-2. Ook hier werd een relatie gevonden tussen de TPB lengte enhet totale electrode gedrag. In evenwicht bestaat het impedantie diagram uit één dominanteboog aan de hoog frequente zijde en een significant kleinere boog aan de laag frequentezijde. Resultaten van impedantie en I-η metingen als functie van de pH2 en pH2O worden
besproken in het licht van meer-stappen mechanisme voor de electrode reactie. De resul-taten geven aan dat een eenvoudige beschrijving in termen van een Butler-Volmer mecha-nisme, gebaseerd op één snelheidsbepalende stap, is uitgesloten. Er wordt gesuggereerd dater een sterke variatie bestaat in de fractionele bezetting van geadsorbeerde deeltjes op nik-kel ofwel YSZ, als functie van de overpotentiaal η.Om het effect van YSZ in cermet electroden te bestuderen wordt het oppervlak van eenporeuze nikkel electrode gemodificeerd met fijn YSZ (Hoofdstuk 5). De oppervlakte modi-ficatie leidt tot een significante verbetering van de electrochemische activiteit. In vergelij-king met een niet gemodificeerde poreuze nikkel electrode, neemt de totale electrode weer-stand af met meer dan 50%. Dit effect wordt toegeschreven aan een toenemend aantal ac-tieve plaatsen. Het polarisatie en impedantie gedrag voor de gemodificeerde nikkel elec-trode als functie van de H2 en H2O druk vertoont overeenkomst met de nikkel electroden.In Hoofdstuk 6 start het onderzoek aan de nikkel/yttria-gestabiliseerd zirconia cermetelectroden met een analyse van de microstructuur. Door gebruik te maken van verschillen-de verhoudingen in de fracties fijn en grof YSZ poeder was het mogelijk om zeven ver-schillende microstructuren te verkrijgen. De microstructuren werden gequantificeerd intermen van porositeit, nikkel deeltjes grootte en oppervlakte bedekking van het grensvlaktussen de electrode en het electrolyt. De relatie tussen het electrochemische gedrag van deelectrode en de bedekkingsgraad, indiceert dat voor grove cermet structuren de electrodereactie wordt beperkt tot het directe grensvlak tussen de cermet electrode en het electrolyt.Aan de andere kant breidt voor fijne cermet structuren de actieve laag zich uit in the bulkvan de cermet.Om meer inzicht te krijgen in de ruimtelijke uitbreiding van de TPB grens in een richtingloodrecht op die van de poreuze electrode / het electrolyt wordt, in Hoofdstuk 7, een laddermodel (transmissie lijn model) betrokken bij de analyse van de impedantie data. Voor ditnetwerk is een analytische oplossing afgeleid voor de impedantie. De variabelen in dit mo-del zijn geassocieerd met het transport van ionische lading dragers in het YSZ, met elec-tronische lading dragers door het nikkel en de lading overdracht reactie of de TPB punten.Het resultaat toont aan dat, wanneer grove YSZ deeltjes in het cermet vervangen wordendoor een corresponderende fractie fijne YSZ deeltjes, dit leidt tot een verlaging van de po-larisatie weerstand. De vereisten voor een optimale prestatie met betrekking tot de diktevan de electroden verandert niet.In Hoofdstuk 8 worden de resultaten gegeven van een studie naar de kinetiek van de water-stof oxidatie reactie aan de cermet electroden. Deze is uitgevoerd met behulp van impe-dantie metingen als functie van de partiële pH2 en pH2O druk, de anodische polarisatie ende temperatuur. De impedantie vertoont een complex gedrag aan de laag frequente zijde,welke niet geheel begrepen wordt. Dit deel bestaat voor de laag frequenties uit een kleinehalve cirkel met een hoge capaciteit waarde en voor het mid-frequentie gebied uit een ‘in-ductieve boog’. De verschijning van de ‘inductieve boog’ kan geassocieerd worden metconcentratie relaxatie van geadsorbeerde tussen producten. De hoog frequente boog kangerelateerd worden aan de TPB lengte en wordt daarom toegeschreven aan lading over-dracht.

In het laatste hoofdstuk wordt een evaluatie gegeven van de resultaten zoals beschreven indit proefschrift. Doordat vier verschillende types electroden zijn bestudeerd, die elk methun eigen specifieke microstructurele eigenschappen onder dezelfde experimentele condi-ties zijn bestudeerd, is een perfecte mogelijkheid gecreëerd om het inzicht te vergroten inde relatie tussen de microstructuur en het electrochemische gedrag van de electroden. Deelectroden beslaan een groot bereik in TPB lengte. Voor de nikkel electroden is een lineai-re relatie gevonden tussen de TPB lengte, gerelateerd aan het actieve gebied voor de elec-trode reactie, en de totale electrode geleidbaarheid. Gebaseerd op deze lineaire relatie kangeconcludeerd worden dat voor cermet electroden de bulk van de electrode actief moetworden. Dit resultaat is overeenstemming met resultaten verkregen uit transmissie lijn mo-dellering, welke indiceert dat voor alle cermet electroden de bulk actief zal zijn. Voor toe-nemende fracties fijn YSZ in de cermet electroden neemt de TPB lengte per volume een-heid van de electrode toe, dit leidt tot een afname van de electrode weerstand. Dit resultaatbenadrukt het belang van een fijne en hoog percolatieve structuur voor cermet electroden.De gecombineerde resultaten van de studie naar de reactie kinetiek aan verschillende typeelectroden onderschrijft de conclusie dat onder de toegepaste experimentele condities hetelectrode proces wordt gedomineerd door lading overdracht.

Table of contents
1 Introduction 11.1 The Fuel Cell 1
1.1.1 Definition of a fuel cell 11.1.2 Historical background 21.1.3 Types of fuel cells 21.1.4 Advantages and drawbacks of fuel cells 4
1.2 Solid Oxide Fuel Cell 51.2.1 Thermodynamic principles 51.2.2 Fuel Cell efficiency 61.2.3 SOFC materials 91.2.4 SOFC anode kinetics 11
1.3 Scope of this thesis 202 Experimental considerations 25
2.1 Introduction 252.2 The experimental set-up 25
2.2.1 The electrochemical cell 252.2.2 Sample holder 262.2.3 Gas conditioning and controlling system 272.2.4 Furnace and controller 272.2.5 Measurement Equipment 27
2.3 Sample choice in view of geometric requirements for the electrode configuration 282.3.1 Experimental 302.3.2 Results 312.3.3 Discussion 312.3.4 Comparison of results of different type of electrolytes for porous nickel and cermettype of electrodes. 342.3.5 Conclusions 35
3 Hydrogen oxidation at nickel pattern electrodes on yttria-stabilised zirconia 373.1 Introduction 373.2 Experimental 38
3.2.1 Sample preparation 383.2.2 Characterisation of the electrode microstructure 383.2.3 Electrochemical characterisation 39
3.3 Results 403.3.1 Microstructure 403.3.2 Electrochemical performance 43
3.4 Discussion 503.4.1 Relationship of electrode performance with microstructure 503.4.2 Electrochemical measurements 513.4.3 Comparison with data from Mizusaki et al. 52
3.5 Conclusions 534 Hydrogen oxidation at porous nickel electrodes on yttria-stabilised zirconia 55
4.1 Introduction 554.2 Theory 56
4.2.1 Reaction scheme 564.2.2 Langmuir adsorption 574.2.3 I - η relationship 58
4.3 Experimental 604.3.1 Sample preparation 604.3.2 Characterisation of the electrode microstructure 614.3.3 Electrochemical characterisation 61

4.4 Results 624.4.1 Microstructure 624.4.2 Electrochemical performance 64
4.5 Discussion 704.5.1 Reaction mechanism 704.5.2 Relationship of the microstructure with electrode conductivity 754.5.3 Comparison with literature 75
4.6 Concluding remarks 785 Hydrogen oxidation at porous nickel electrodes on yttria-stabilised zirconia: Effect of surfacemodification with fine YSZ. 81
5.1 Introduction 815.1.1 Fabrication of electrolyte and electrodes 825.1.2 Electrochemical characterisation 83
5.2 Results 845.2.1 Microstructure 845.2.2 Electrochemical performance 85
5.3 Discussion 915.3.1 Microstructure 915.3.2 Polarisation and impedance characteristics 95
5.4 Conclusions 966 Cermet electrodes, relation between microstructure and performance 99
6.1 Introduction 996.2 Experimental 100
6.2.1 Sample preparation 1006.2.2 Electrochemical characterisation 1016.2.3 Microstructural characterisation 102
6.3 Results and Discussion 1026.3.1 Microstructure 1026.3.2 Electrochemical performance 1066.3.3 Relation between microstructure and electrochemical performance 110
6.4 Conclusions 1127 Impedance of porous cermet electrodes 115
7.1 Introduction 1157.2 Theory 1167.3 Discussion of the model 1187.4 Experimental 1207.5 Results and discussion 121
7.5.1 Impedance analysis using 'Equivalent Circuit' 1217.5.2 Impedance analysis using the ladder network model 123
7.6 Conclusions 1258 Investigation into the kinetics of hydrogen oxidation on the Ni/YSZ cermet electrode 129
8.1 Introduction 1298.2 Experimental 130
8.2.1 Sample preparation 1308.2.2 Electrochemical characterisation 130
8.3 Results 1318.3.1 Impedance measurements 1318.3.2 I-η measurements 141
8.4 Discussion 1418.4.1 Processes observed on the cermet electrode 1418.4.2 Comparison with porous nickel electrodes 1458.4.3 Comparison with literature 1468.4.4 Overall comparison 148
8.5 Conclusions 1499 Evaluation 151

9.1 Introduction 1519.2 Relationship of the microstructure with electrode resistance 1519.3 Hydrogen oxidation reaction at the anode 155
Dankwoord 159Levensloop 161

1
1 Introduction
Abstract
A general introduction is given on fuel cells. The history, different types, advantages anddrawbacks of fuel cells are discussed. The second part of this introductory chapter is con-cerned with the Solid Oxide Fuel Cell (SOFC), its principles, materials employed andelectrode kinetics. Particular attention is drawn to the presently available knowledge onkinetics of the anodic reaction. At the end of the chapter the scope of this thesis is pre-sented.
1.1 The Fuel Cell
1.1.1 Definition of a fuel cell
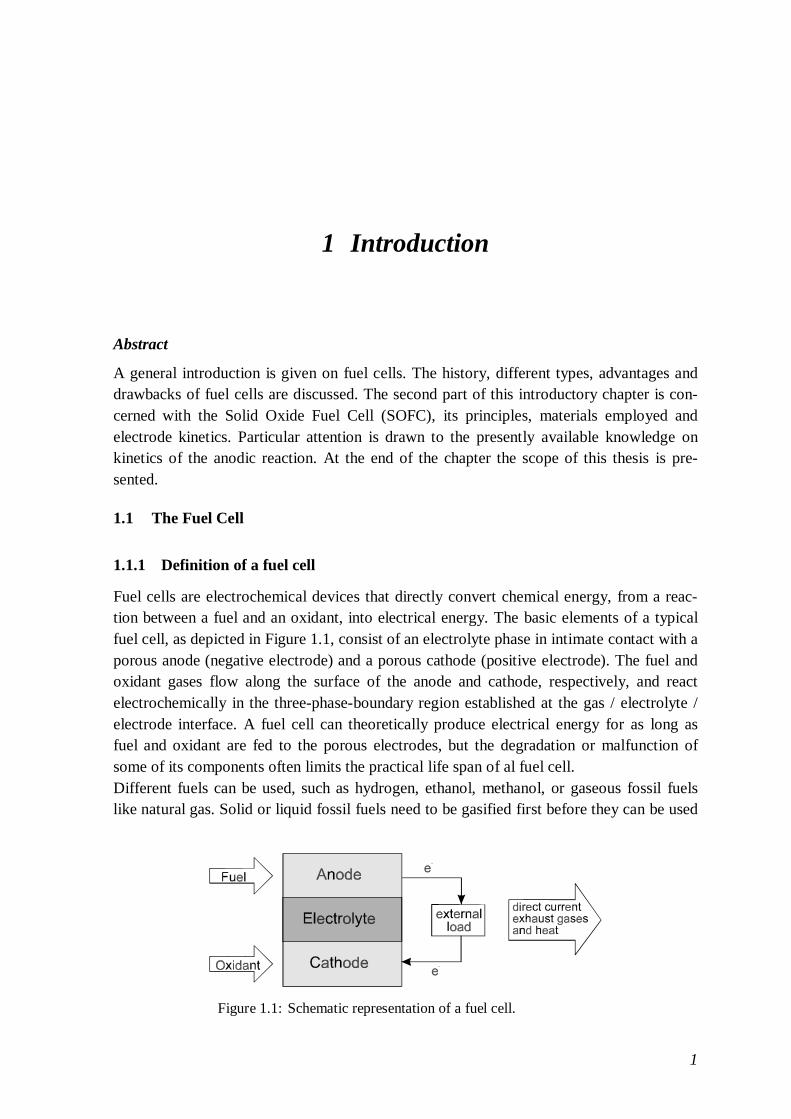
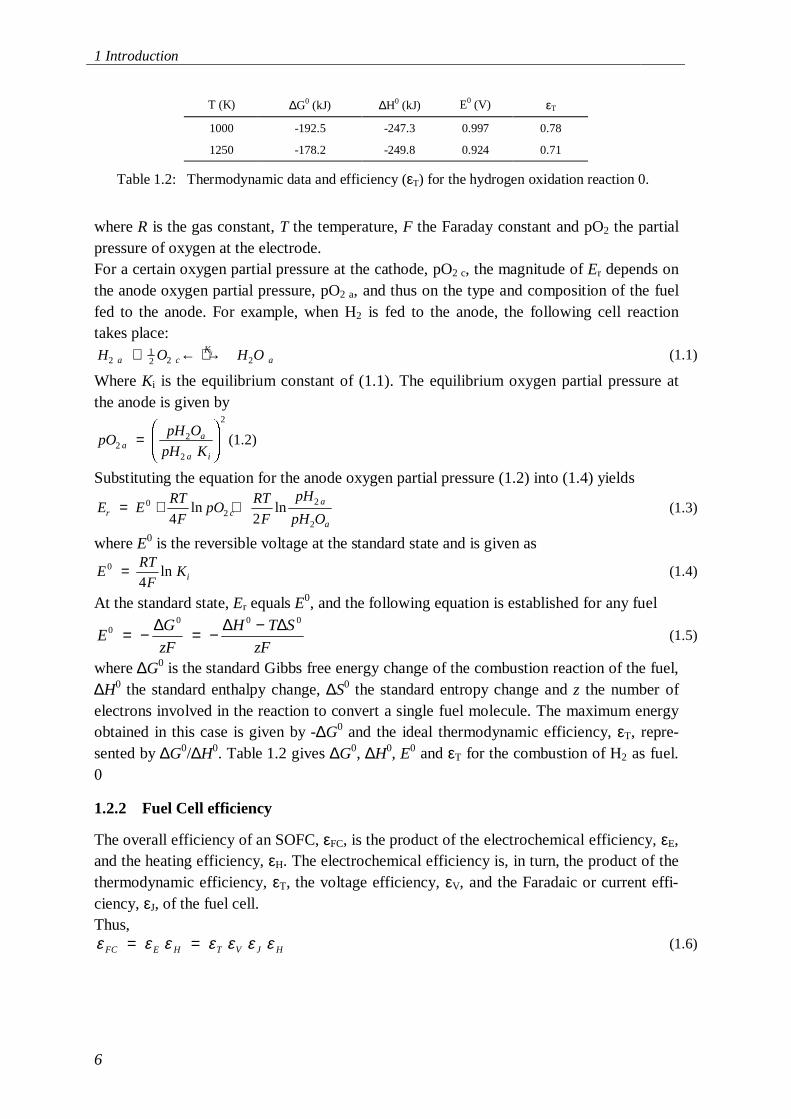
Fuel cells are electrochemical devices that directly convert chemical energy, from a reac-tion between a fuel and an oxidant, into electrical energy. The basic elements of a typicalfuel cell, as depicted in Figure 1.1, consist of an electrolyte phase in intimate contact with aporous anode (negative electrode) and a porous cathode (positive electrode). The fuel andoxidant gases flow along the surface of the anode and cathode, respectively, and reactelectrochemically in the three-phase-boundary region established at the gas / electrolyte /electrode interface. A fuel cell can theoretically produce electrical energy for as long asfuel and oxidant are fed to the porous electrodes, but the degradation or malfunction ofsome of its components often limits the practical life span of al fuel cell.Different fuels can be used, such as hydrogen, ethanol, methanol, or gaseous fossil fuelslike natural gas. Solid or liquid fossil fuels need to be gasified first before they can be used
Figure 1.1: Schematic representation of a fuel cell.
1 Introduction
2
as a fuel. Oxygen or air can be used as oxidant.
1.1.2 Historical background
The fuel cell concept dates from the beginning of the 19th century and is ascribed to SirHumprey Davy 0. The possibility of making it a reality was demonstrated by Sir WilliamGrove, who operated a successful hydrogen-oxygen cell in 1839, generally stated as thestart of fuel cell history. Grove built a cell in which the reaction of hydrogen and oxygenproduced water, and generated an electric current. He stated: ‘A shock was given whichcould be felt by five persons joining hands, and which when taken by a single person waspainful’ 0.The history of the solid oxide electrolytes can be considered to commence at the end of the19th century, when Nernst produces his ‘glower’ 0. Nernst discovered that the very highelectrical resistance of pure solid oxides could be greatly reduced by addition of certainother oxides. The most promising of these mixtures consisted mainly of zirconia (ZrO2)with small amounts of added yttria (Y2O3). This is still the most widely used electrolytematerial in the Solid Oxide Fuel Cells (SOFC).The first working SOFC was demonstrated by Baur and Preis (1937), using stabilised zir-conia as electrolyte and coke and magnetite as a fuel and oxidant, respectively 0. At a cur-rent density of approximately 0.3mA/cm2 the cell voltage was 0.65V. Although the opera-tion of the first SOFC was demonstrated, the current output of this cell was too low forpractical purposes.A first period of intense activity in SOFC research began in the early 1960s, with intensiveresearch programs driven by new energy needs mainly for military, space and transportapplications 000. At that time basic research dealt with the improvement of electrolyteconductivity and the first steps in SOFC technology. A second period of high activity be-gan in the mid-1980s and goes on today, focussing on electrode materials and technology.Efforts thus far have resulted in ‘almost’ commercial units which are part of our powergeneration facilities. Leading companies in SOFC commercialisation are Siemens and Sul-zer (Europe) 0, Westinghouse Electrical Cooperation (USA) 0 and Fuji Electric CorporateResearch and Development, Ltd and Tokyo Electric Power Co. (Japan) 0.In the Netherlands the first 100 kWe SOFC field unit (Westinghouse SOFC technology)was put into operation at the end of 1997 as a demonstration project where 6 Danish Pro-duction Companies names ELSAM and a Consortium of 5 Dutch Energy DistributionCompanies, EnergieNed and the Dutch Subsidiser NOVEM co-operate 0.
1.1.3 Types of fuel cells
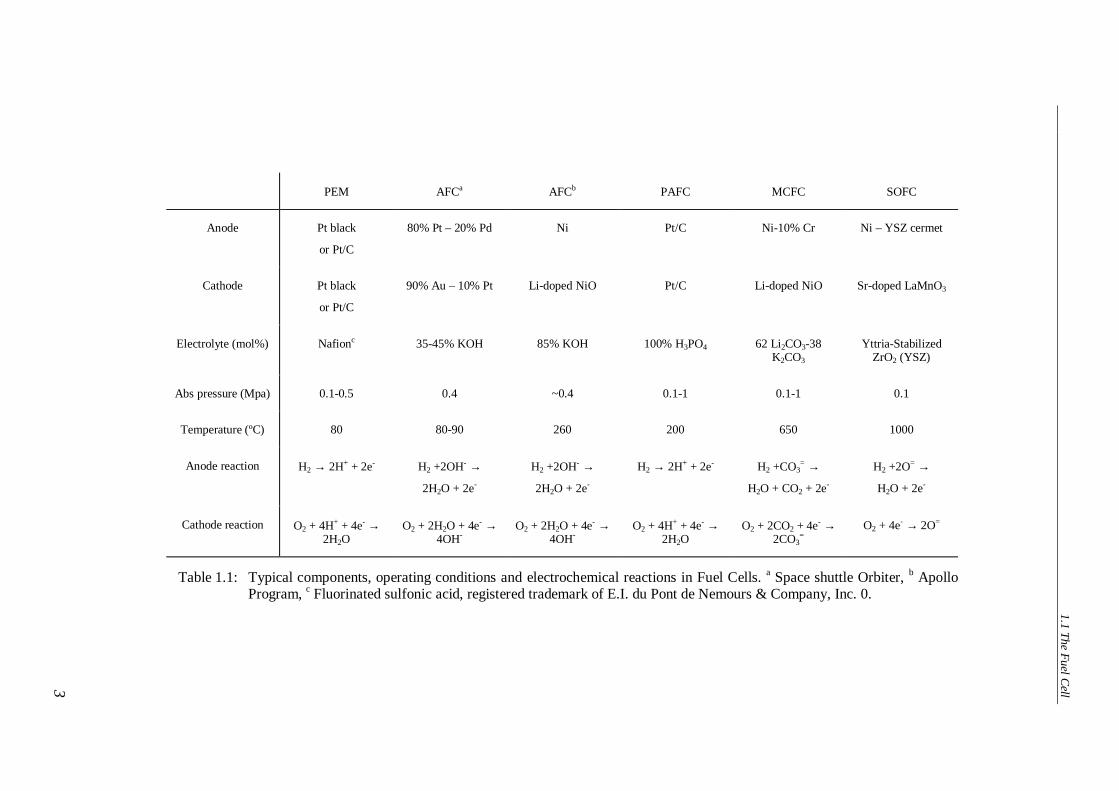
The various types of fuel cells are usually classified by the applied electrolyte (Table 1.1).The following types are known• the polymer electrolyte fuel cell (PEFC);• alkaline fuel cell (AFC);• the phosforic acid fuel cell (PAFC);• the molten carbonate fuel cell (MCFC);• the solid oxide fuel cell (SOFC).
1.1 T
he F
uel C
ell
3
SOFC
Ni – YSZ cermet
Sr-doped LaMnO3
Yttria-StabilizedZrO2 (YSZ)
0.1
1000
H2 +2O= →
H2O + 2e-
O2 + 4e- → 2O=
MCFC
Ni-10% Cr
Li-doped NiO
62 Li2CO3-38K2CO3
0.1-1
650
H2 +CO3= →
H2O + CO2 + 2e-
O2 + 2CO2 + 4e- →2CO3
=
PAFC
Pt/C
Pt/C
100% H3PO4
0.1-1
200
H2 → 2H+ + 2e-
O2 + 4H+ + 4e- →2H2O
AFCb
Ni
Li-doped NiO
85% KOH
~0.4
260
H2 +2OH- →
2H2O + 2e-
O2 + 2H2O + 4e- →4OH-
AFCa
80% Pt – 20% Pd
90% Au – 10% Pt
35-45% KOH
0.4
80-90
H2 +2OH- →
2H2O + 2e-
O2 + 2H2O + 4e- →4OH-
PEM
Pt black
or Pt/C
Pt black
or Pt/C
Nafionc
0.1-0.5
80
H2 → 2H+ + 2e-
O2 + 4H+ + 4e- →2H2O
Anode
Cathode
Electrolyte (mol%)
Abs pressure (Mpa)
Temperature (ºC)
Anode reaction
Cathode reaction
Table 1.1: Typical components, operating conditions and electrochemical reactions in Fuel Cells. a Space shuttle Orbiter, b ApolloProgram, c Fluorinated sulfonic acid, registered trademark of E.I. du Pont de Nemours & Company, Inc. 0.
1 Introduction
4
Large differences exist in application, design, size, cost and operating range for the differ-ent type of fuel cells. The fuel cells above are listed in order of increasing operating tem-perature, ranging from ~80°C for PEFC to 1000°C for SOFC. The low temperature fuelcells (PEFC, AFC, PAFC) utilise aqueous electrolytes in which H+ or OH- ions are thedominant ionic current carriers.At higher temperatures, CO3
2- ions in the molten salt electrolyte of the MCFCs and O2-
ions in the solid electrolyte of the SOFC are the ionic current carriers. The operating tem-perature has consequences for design, the efficiency of the fuel cell, the choice of othermaterials needed in and around the fuel cell and the kind of fuel that may be used. For lowtemperature fuel cells (PEFC, AFC and PAFC) the operating temperature is too low to en-able direct oxidation of hydrocarbon fuels like natural gas, therefore fuels like hydrogenand methanol are used. Low temperature fuel cells are generally seen as interesting forsmall scale applications, for example mobile applications like cars (PEFC0), notebooks,phones etc.For high temperature fuel cells (MCFC and SOFC) it is possible to use natural gas whichcan be reformed internally into hydrogen and carbon monoxide (depending on operatingtemperature a catalyst will be necessary). The high temperature fuel cells, but also PAFC,are interesting for the decentralised generation of heat and power. 00000
1.1.4 Advantages and drawbacks of fuel cells
The advantages and drawbacks of fuel cell systems are determined by their type and appli-cation. As it can be useful to compare a SOFC or MCFC system with traditional genera-tors, a small fuel cell developed for applications as notebooks or mobile phones should becompared with traditional batteries. The advantages and drawbacks given here are mostlybased on SOFC systems, but in general part of it will be valid for other types of fuel cells.The main advantages:(1) High energy conversion efficiency. Because of the direct conversion of free enthalpy
into electrical energy the usual losses from fuel to electrical energy, due to the conver-sion of fuel to heat, heat to mechanical energy and mechanical energy to electrical en-ergy, is avoided. The efficiency is further improved when the by-product heat is fullyutilised.
(2) Environmental compatibility. Fuel cells are capable of using practical fuels as an en-ergy source with minor environmental impacts (less CO2 and NOx produced per kWattpower).
(3) Modularity. Fuel cells have the characteristics of modularity, i.e. cells can be made inmodular sizes. The size of a fuel cell can be easily increased or decreased and its elec-tric efficiency is relatively independent of size.
(4) Siting flexibility. Because fuel cells can be made in a variety of sizes they can be placedat different locations with minimum siting restrictions. Fuel cell operation is quiet be-cause a fuel cell has no moving parts. Consequently fuel cells can be easily locatednear points of use such as urban residential areas.
0

1.2 Solid Oxide Fuel Cell
5
Unfortunately, there are some drawbacks which have caused a slow introduction of solidoxide fuel cells on the energy market 0:(1) Material problems in relation with costs: For SOFC there are roughly two design
types, tubular 0 and flat plate 0. For the tubular cell material problems are less, but fab-rication costs are high. For the flat plate design fabrication costs are less, but morematerial problems arise.
(2) Economics. Introduction on the energy market would presently involve a high capitalcost-to-performance ratio.
1.2 Solid Oxide Fuel Cell
1.2.1 Thermodynamic principles
The principle of an SOFC is illustrated in Figure 1.2, two electrodes (the anode and cath-ode) being separated by a solid electrolyte. Oxidant is reduced at the cathode and fuel isoxidised at the anode.If hydrogen and oxygen are used as fuel and oxidant, respectively, in an SOFC with anoxygen ion conducting electrolyte the reactions in the fuel cell involve the oxidation andreduction of oxygen at the electrodes. At the cathode the reduction of oxygen is given asO e Oc e2
24 2+ =− − (1.1)
where the subscripts c and e refer to states at the cathode and in the electrolyte, respec-tively.At the anode the reverse reaction of (1.1) takes place:2 42
2O O ee a− −= + (1.2)
where the subscript a refers to states at the anode. Consequently, the overall cell reaction(which determines the cell voltage) can be represented by the following equationO Oc a2 2= (1.3)
The SOFC is therefore considered to be an oxygen concentration cell, and the electromo-tive force (emf) or reversible (thermodynamic) voltage, Er, is given by the Nernst equation:
ERT
F
pO
pOrc
a
=4
2
2
ln (1.4)
Figure 1.2: A Solid Oxide Fuel Cell.
1 Introduction
6
where R is the gas constant, T the temperature, F the Faraday constant and pO2 the partialpressure of oxygen at the electrode.For a certain oxygen partial pressure at the cathode, pO2 c, the magnitude of Er depends onthe anode oxygen partial pressure, pO2 a, and thus on the type and composition of the fuelfed to the anode. For example, when H2 is fed to the anode, the following cell reactiontakes place:H O H Oa c
Ka
i2
12 2 2+ ← → (1.1)
Where Ki is the equilibrium constant of (1.1). The equilibrium oxygen partial pressure atthe anode is given by
pOpH O
pH Kaa
a i2
2
2
2
=
(1.2)
Substituting the equation for the anode oxygen partial pressure (1.2) into (1.4) yields
E ERT
FpO
RT
F
pH
pH Or ca
a
= + +02
2
24 2ln ln (1.3)
where E0 is the reversible voltage at the standard state and is given as
ERT
FKi
0
4= ln (1.4)
At the standard state, Er equals E0, and the following equation is established for any fuel
EG
zF
H T S
zF0
0 0 0
= − = − −∆ ∆ ∆(1.5)
where ∆G0 is the standard Gibbs free energy change of the combustion reaction of the fuel,∆H0 the standard enthalpy change, ∆S0 the standard entropy change and z the number ofelectrons involved in the reaction to convert a single fuel molecule. The maximum energyobtained in this case is given by -∆G0 and the ideal thermodynamic efficiency, εT, repre-sented by ∆G0/∆H0. Table 1.2 gives ∆G0, ∆H0, E0 and εT for the combustion of H2 as fuel.0
1.2.2 Fuel Cell efficiency
The overall efficiency of an SOFC, εFC, is the product of the electrochemical efficiency, εE,and the heating efficiency, εH. The electrochemical efficiency is, in turn, the product of thethermodynamic efficiency, εT, the voltage efficiency, εV, and the Faradaic or current effi-ciency, εJ, of the fuel cell.Thus,ε ε ε ε ε ε εFC E H T V J H= = (1.6)
T (K) ∆G0 (kJ) ∆H0 (kJ) E0 (V) εT
1000 -192.5 -247.3 0.997 0.78
1250 -178.2 -249.8 0.924 0.71
Table 1.2: Thermodynamic data and efficiency (εT) for the hydrogen oxidation reaction 0.
1.2 Solid Oxide Fuel Cell
7
1.1.1.1 Heating efficiency
The heating efficiency must be considered in cases where the fuel contains inert gases, im-purities and other combustibles in addition to the electrochemically active species. Theheating value efficiency, εH, is defined as:
ε Hcom
H
H= ∆
∆
0
(1.7)
where ∆H0 represents the amount of enthalpy of fuel species available in the fuel cell togenerate electricity and ∆Hcom represents the amount of enthalpy included in all combusti-ble species in the fuel gases fed to the fuel cell.
1.1.1.2 Thermodynamic efficiency
In an SOFC the free enthalpy change of the cell reaction, ∆G, may be totally converted toelectrical energy. Thus a fuel cell has an intrinsic (maximum) thermodynamic efficiencygiven by
εT
G
H
T S
H= = −∆
∆∆
∆1 (1.8)
1.1.1.3 Voltage efficiency
In an operating SOFC the cell voltage is always less than the reversible voltage. As thecurrent is drawn from the fuel cell, the cell voltage is reduced due to various losses. Thereduction in the cell voltage under current load depends on current density and severalfactors such as temperature, pressure, gas flow rate, gas combustion and cell material. Thevoltage efficiency, εV, is defined as the ratio of the operating cell voltage under load, E, tothe equilibrium cell voltage, Er, and is given as
εVr
E
E= (1.9)
The difference between the operating cell voltage and the expected reversible voltage istermed polarisation or overpotential and is presented as η. The total polarisation of a cell isthe sum of four types of polarisation: charge transfer or activation polarisation, ηA, diffu-sion or concentration polarisation, ηD, reaction polarisation, ηR, and resistance or ohmicpolarisation, ηΩ:η η η η η= + + +A D R Ω (1.10)
Polarisation cannot be eliminated but can be minimised by material choice and cell design.Temperature, pressure, electrolyte composition and electrode material naturally influencecell polarisation.1.1.1.3.1 Charge transfer or activation polarisation(Electro) chemical reactions involve an energy barrier that must be overcome by reactingspecies. This energy barrier, called the activation energy, results in activation or chargetransfer polarisation, ηA. Activation polarisation is related to current density, i, by the fol-lowing equation:
i iF
RTi
F
RTa A c A=
− −
0 0exp expβ η β η
(1.11)
1 Introduction
8
Where β is the symmetry coefficient and i0 is the exchange current density. The symmetrycoefficient is considered as the fraction of the change in polarisation which leads to achange in the reaction rate constant. The exchange current density is related to the bal-anced forward and reverse electrode reaction rates at equilibrium. A high exchange currentdensity means a high electrochemical reaction rate and, in that case, a good fuel cell per-formance is expected. The exchange current density can be determined experimentally byextrapolating plots of log i versus η to η=0. For large values of η (either negative or posi-tive) one of the bracketed terms in (1.11) becomes negligible. After rearranging one ob-tainsη A a b i= ± log (1.12)
which is usually referred to as the Tafel equation. Parameters a and b are constants whichare related to the applied electrode material, type of electrode reaction and temperature.1.1.1.3.2 Diffusion or concentration polarisationDiffusion or concentration polarisation, ηD, becomes eminent when the electrode reactionis hindered by mass transport effects, i.e., when the supply of reactant and/or the removalof reaction products by diffusion to or from the electrode is slower than that correspondingto the charging/discharging current i. When the electrode process is governed completelyby diffusion, the limiting current, iL, is reached. The limiting current can be calculatedfrom the diffusion coefficient of the reacting species, D, their concentration, cM, and thethickness of the diffusion layer, δ, by applying Fick's law as
izFD c
LM= ∆
δ(1.13)
For an electrode process free of activation polarisation, the diffusion or concentration po-larisation can be expressed as
ηDL
RT
zF
i
i= −
ln 1 (1.14)
In general, mass transport is a function of temperature, pressure and concentration of thespecies involved. In SOFC’s the reactants must diffuse through the porous anode and cath-ode, emphasising the importance of the microstructure and design of electrodes.1.1.1.3.3 Reaction polarisationThe reaction polarisation, ηR, appears when the rate of the electrode process is influencedby a chemical reaction. A possible reaction includes the incorporation of oxygen in theoxide sublattice at the cathode.
1.1.1.4 Resistance or ohmic polarisation
The ohmic polarisation is caused by the resistance of the conducting ions (through theelectrolyte), electrons (through the electrodes and current collectors) and contact resis-tances between cell components. The ohmic polarisation, ηΩ, is given asηΩ = iRi (1.15)
where Ri represents the total ohmic cell resistance, including both ionic and electronic re-sistances.
1.2 Solid Oxide Fuel Cell
9
1.1.1.5 Current efficiency
The efficiency of a SOFC drops if all of the reactants are not converted to reaction prod-ucts. For 100% conversion of a fuel, the amount of current density, iF, produced is given as(Faraday's law)
i zFdf
dtF = (1.16)
where df/dt is the molar flow rate of the fuel. For the amount of fuel actually consumed,the current density produced is given by
i zFdf
dt consumed
=
(1.17)
The current efficiency, εJ, is the ratio of the actual current produced to the current availablefrom complete electrochemical conversion of the fuel
ε JF
i
i= (1.18)
In the case of fuel cells, the current efficiency is commonly expressed as fuel utilisation. 0
1.2.3 SOFC materials
The basic components of a ceramic fuel cell stack are the electrolyte, the anode, the cath-ode and the interconnect. Each component serves several functions in the fuel cell and hasto meet certain requirements. These requirements include: proper stability (chemical,phase, morphological and dimensional) in oxidising and/or reducing environments, chemi-cal compatibility with other components and a proper conductivity. The electrolyte andinterconnect must be dense in order to separate the oxidant and fuel gases, whereas bothanode and cathode must be porous to allow gas transport to the reaction sites. An overviewof the state of the art materials is given in Table 1.3. Extended reviews are provided in theliterature 000. A short discussion about the electrolyte and cathode follows, more attentionis given to the anode.
1.1.1.6 The electrolyte
Yttria-stabilized zirconia ((Y2O3)0.08-(ZrO2)0.92 abbreviated as YSZ) is the most commonelectrolyte in SOFCs because the material possesses an adequate level of oxygen-ion con-
component composition specific conductivity at1000ºC (S/m)
conductivity depending on
Anode Ni/YSZ cermet 400 - 1000 Ni/YSZ particle size ratio
Ni content
Cathode SrxLa1-xMnO3-δ 6 - 60 Porosity
Sr content
Electrolyte Y2O3-ZrO2 10 - 15 Density
Yttria content
Interconnect LaCrO3
Table 1.3: State of the art materials used in SOFC and relevant properties 00.
1 Introduction
10
ductivity and exhibits desirable stability in oxidising and reducing atmospheres. ZrO2 in itspure form does not serve as a good electrolyte because its ionic conductivity is too low.Therefore it is doped with Y2O3, which means a direct substitution of a trivalent cation ofappropriate size, e.g. Y3+, for the host lattice cation Zr4+. The substitution not only creates alarge concentration of oxygen vacancies but also stabilises the cubic fluorite structure 00.
1.1.1.7 The cathode
The perovskite materials SrxLa1-xMnO3-δ (SLM) with x between 0.15 and 0.50 is consid-ered as the standard SOFC cathode material. SLM is mainly an electronic conductor andthe oxygen reduction reaction is assumed to take place at the interface between cathodematerial, electrolyte and the oxygen gas phase 0. Only at high overpotentials does SLMshow appreciable ionic conductivity 0.
1.1.1.8 The anode
The nickel/yttria-stabilised zirconia (Ni/YSZ) cermet (ceramic-metal mixture) is at thismoment the state of the art material for the anode. Nickel is used because it is one of themetals that is able to withstand the operating conditions of a SOFC: reducing conditionsand a temperature of 1000ºC. Other possible materials are cobalt and noble metals, buttaking into account volatility, chemical stability, catalytic activity and cost, nickel appearsto be the best candidate. Nickel plays the role of the electronic conducting phase and needsto transport the electrons from the reaction site to the current collector. YSZ is added tosupport the nickel-metal particles, to inhibit coarsening of the metallic particles and to pro-vide a thermal expansion coefficient acceptably close to those of the other cell compo-nents. The functional properties of the YSZ in the anode are a matter of discussion, it issuggested that it may play an active role by forming conductive paths for oxygen transport,thereby enlarging the active area available for the electrode reaction. The third importantphase in the cermet structures is the porous phase. This phase is important for easy gasphase diffusion to (hydrogen) and from (water) the active sites. 00000.The most important requirements for the anode are:• Long term stability. Sinter activity during operation has to be virtually absent, meaning
maintaining good electronic and ionic conductive phases as well as porosity.• Low polarisation resistance of the electrode.• Physical and chemical stability under a reducing atmosphere at high temperature.• Matching of the thermal expansion coefficient to the electrolyte to prevent the electrode
from flaking of the electrolyte.• High catalytic activity to promote reaction of the fuel with oxide ions.00000The above requirements cannot be satisfied only by choosing the appropriate composition.The nature of the starting powder and the applied manufacturing technique has a strongeffect on the electrochemical properties of the electrode in the final assembly. For instance,parameters like the particle morphology of the powder and the porosity of the sinteredelectrode will influence the electrical conductivity of the electrode structure. These twoparameters also influence the total amount of electrode particles which occupy the elec-trolyte interface. Other parameters such as the sintering temperature and the sintering time
1.2 Solid Oxide Fuel Cell
11
of the electrode will have an effect on the adherence of the electrode structure to the elec-trolyte and possible formation of deleterious reaction products between the electrode andthe electrolyte. Hence, the manufacturing procedure is very important 0.Other materials that have been studied as anode are:• Nickel without the addition of YSZ, especially for research purposes in order to perform
experiments with simple geometrical structures 000.• Ruthenium/stabilised ZrO2 cermet. This material shows a lower polarisation then that of
Ni/YSZ cermet. Ruthenium has the advantage of a better resistance to sintering and alsoa higher reforming activity compared with nickel 00. Disadvantages are cost and evapo-ration of ruthenium oxide.
• (Ni-Mg)O-YSZ. The use of this material improves the overvoltage characteristics of theanode compared to Ni-YSZ cermet anodes which is attributed to a finer porous structurethat induces a greater specific surface area 0.
• To decrease the anodic overpotential, it was suggested to insert a mixed conductor be-tween YSZ and the metallic conductors. A significant decrease of polarisation wasfound when ceria-based solid solutions like (CeO2)0.6(LaO1.5)0.4 were used 0. This effectwas attributed to mixed conduction resulting from the partial reduction of Ce4+ to Ce3+
in the reducing operating conditons. A decrease in anodic polarization was also foundfor other oxide components such as praseodymium oxide (PrOx), ceria (CeOx) and sa-maria-doped ceria (SDC) 0. Other studies indicated a significant decrease of the ohmicdrop when YSZ was used with a thin modified layer of mixed conductors 0. A com-parative study of ceria and titania doped YSZ has shown that additions in the order of10 mol% titania increased the electronic conductivity of the solid solution 00. This sug-gests that such solids solutions may be good candidates as anode cermet components forSOFC.
1.2.4 SOFC anode kinetics
Even though studies on SOFC electrodes started back in 1960 and a lot of work has beenpublished ever since, the exact nature of the reaction kinetics is still not established. In thissection, an impression is given of what is known about the reaction kinetics on nickelmetal and Ni/YSZ cermet electrodes.
1.1.1.9 Nickel electrodes
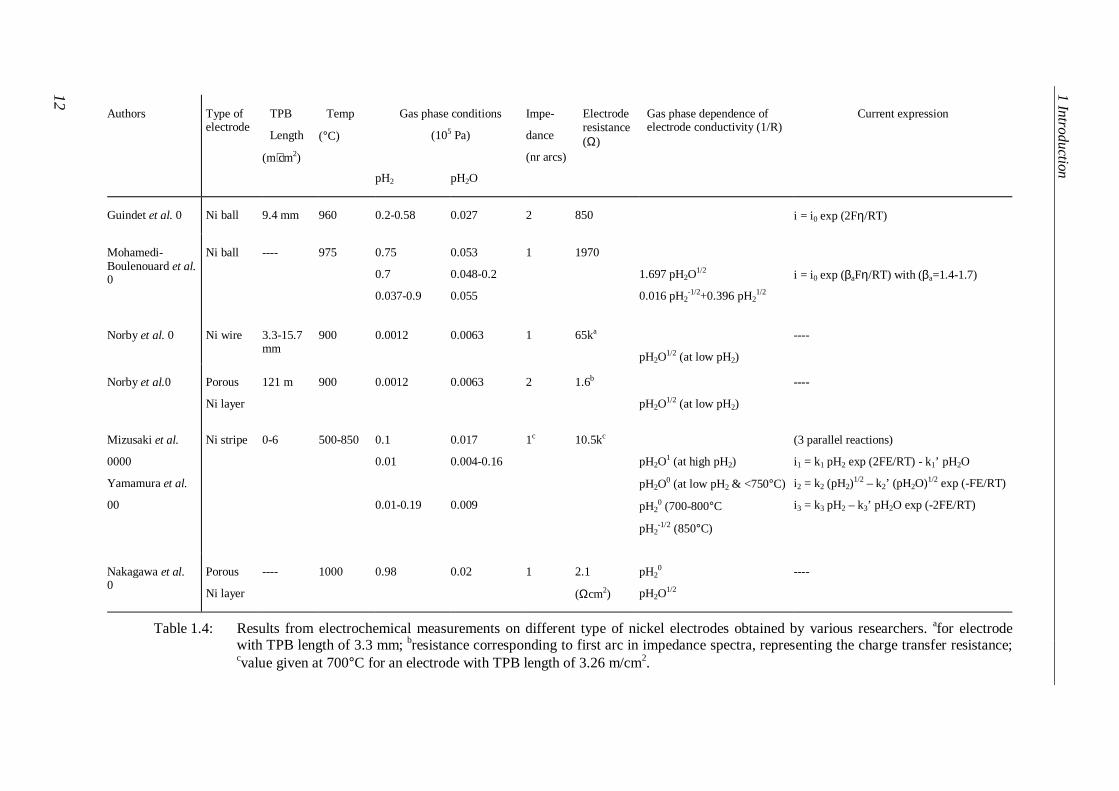
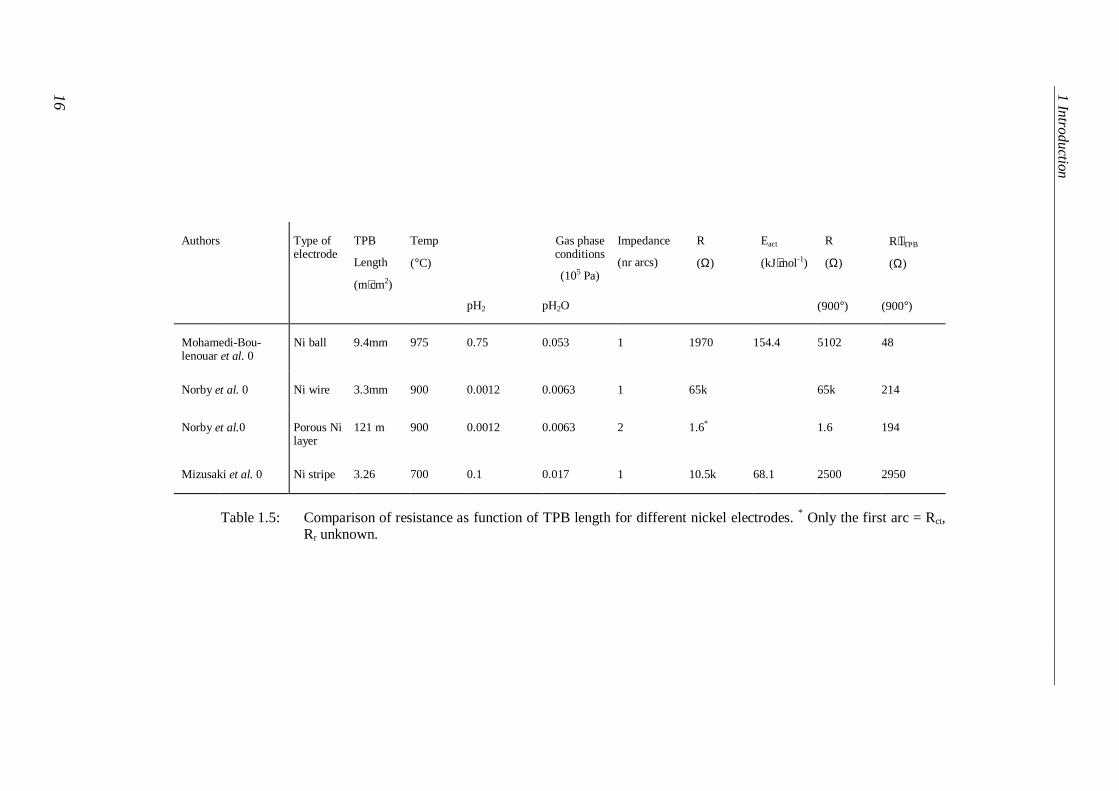
Studies on nickel metal electrodes have been initiated because of their less complicatedmicrostructure compared with that of Ni/YSZ cermet electrodes. Using these electrodes itshould be possible to avoid structural limitations and measure purely chemical parametersand relate them with the microstructure. Attempts to relate the polarisation resistance to thelength of the Triple Phase Boundary (TPB) have been done for simple geometries usingnickel wires and porous nickel layers 00, nickel stripes 000000 and a nickel ball 00. A sur-vey of the results from measurements on various nickel electrodes is given in Table 1.4.
1 In
trod
uction
12
Current expression
i = i0 exp (2Fη/RT)
i = i0 exp (βaFη/RT) with (βa=1.4-1.7)
----
----
(3 parallel reactions)
i1 = k1 pH2 exp (2FE/RT) - k1’ pH2O
i2 = k2 (pH2)1/2 – k2’ (pH2O)1/2 exp (-FE/RT)
i3 = k3 pH2 – k3’ pH2O exp (-2FE/RT)
----
Gas phase dependence ofelectrode conductivity (1/R)
1.697 pH2O1/2
0.016 pH2-1/2+0.396 pH2
1/2
pH2O1/2 (at low pH2)
pH2O1/2 (at low pH2)
pH2O1 (at high pH2)
pH2O0 (at low pH2 & <750°C)
pH20 (700-800°C
pH2-1/2 (850°C)
pH20
pH2O1/2
Electroderesistance(Ω)
850
1970
65ka
1.6b
10.5kc
2.1
(Ωcm2)
Impe-
dance
(nr arcs)
2
1
1
2
1c
1
pH2O
0.027
0.053
0.048-0.2
0.055
0.0063
0.0063
0.017
0.004-0.16
0.009
0.02
Gas phase conditions
(105 Pa)
pH2
0.2-0.58
0.75
0.7
0.037-0.9
0.0012
0.0012
0.1
0.01
0.01-0.19
0.98
Temp
(°C)
960
975
900
900
500-850
1000
TPB
Length
(m⋅cm2)
9.4 mm
----
3.3-15.7mm
121 m
0-6
----
Type ofelectrode
Ni ball
Ni ball
Ni wire
Porous
Ni layer
Ni stripe
Porous
Ni layer
Table 1.4: Results from electrochemical measurements on different type of nickel electrodes obtained by various researchers. afor electrodewith TPB length of 3.3 mm; bresistance corresponding to first arc in impedance spectra, representing the charge transfer resistance;cvalue given at 700°C for an electrode with TPB length of 3.26 m/cm2.
Authors
Guindet et al. 0
Mohamedi-Boulenouard et al.0
Norby et al. 0
Norby et al.0
Mizusaki et al.
0000
Yamamura et al.
00
Nakagawa et al.0
1.2 Solid Oxide Fuel Cell
13
Guindet et al. 0 studied H2 oxidation on a nickel ball pressed onto an YSZ disc at 960°C.They paid special interest to polarisation curves, having selected points on the curve char-acterised by impedance spectroscopy. A maximum current density was found for an anodicpolarisation close to –850 mV versus air. Since this value is close to that of the Ni-NiOsystem, the formation of nickel oxide is suggested. For lower anodic potentials between –1000 and –850 mV versus air, hydrogen oxidation takes place on the nickel and the log iversus η curve follows Tafel behaviour (see Table 1.4). At anodic potentials between -850and –650 mV versus air NiO is formed. Hydrogen oxidation still takes place on nickel, butnow also on passivating NiO. The electrode resistance increases and a large capacitive ef-fect is seen in the impedance plot.For anodic potentials smaller than –650 mV versus air, hydrogen oxidation takes placeonly on NiO and an inductive loop appears at the low frequency side of the impedance dia-gram. In later work Guindet and co-workers 0 also studied the influence of H2 and H2Opartial pressures. The interfacial conductivity showed a minimum in pH2. For low pH2 val-ues the conductivity was found to be proportional to pH2
-1/2 and for high pH2 to pH21/2. At
fixed pH2, a pH2O1/2 dependence was found. Anodic polarisation curves, measured as a
function of pH2O, were analysed with Butler-Volmer type of equations, resulting in an ap-parent anodic transfer coefficients, αa, varying between 1.4 and 1.7. Based on analysis ofthe polarisation curves, the authors concluded that charge transfer is not the rate determin-ing step in the anodic reaction.
Norby et al. 0 paid special attention to the relation between the TPB and the electrode per-formance. As electrodes these authors used a nickel wire wrapped around an alumina rodand an electroplated nickel layer (2µm thick) with circular holes made by microlithogra-phy. For the nickel wire electrodes an impedance diagram with one semicircle was re-corded. The resistance associated with this semicircle was attributed to charge transfer andthe Constant Phase Element (CPE) was attributed to the double layer capacitance. For theporous nickel layer two semicircles were found in the impedance diagram. The semicircleappearing at the low frequency side dominated the spectrum and was ascribed to a reactionresistance and associated surface coverage of adsorbed intermediates. This resistance de-creased with increasing pH2O, while increasing with pH2. The charge transfer resistancevaried approximately with pH2O
-1/2 at low pH2 values. At moderate pH2 values, the chargetransfer resistance exhibited a inverse linear relationship with the TPB length.The general conclusion drawn by Norby et al. is that for electrodes with a small TPBlength and a large nickel and YSZ area available per unit TPB length, the rate is limited bycharge transfer, due to the restricted TPB length. On the other hand, the reaction resistancedominates for the electrode with a large TPB length and a smaller accessible area of nickeland YSZ per unit TPB length. The authors suggested that for the latter electrode andprobably for most of the Ni-YSZ cermet electrodes, the rates are limited by a too small orinactive surface rather than by a small TPB length.
Mizusaki et al. 0000 and Yamamura et al. 00 studied nickel pattern electrodes. With pho-tolithography, 16 pattern electrodes were prepared, different in the width and distance be-
1 Introduction
14
tween the stripes (5-10-25-50µm for nickel and/or YSZ). In 00, they present a linear rela-tion between the electrode conductivity and the TPB length. Impedance spectra consistedof one semicircle. The associated resistance was found to be essentially independent of pH2
and, at high vapour pressure, proportional to pH2O-1, but becoming asymptotically constant
with decreasing pH2O.Based on these results and the polarisation curves measured as a function of pH2 andpH2O, the following model was proposed 0. The major adsorbed species on the nickel sur-face are assumed to be Oads, OHads, Hads and H2Oads. The coverages of these species aretaken to be low and, therefore, the portion of vacant adsorption sites, θv close to 1. Be-tween YSZ and nickel, Oad adatoms exchange reversibly. The following equilibria are ex-pected to hold near the TPBH O s H OHad e ad ad2 + ↔ + (1.20)
OH s H Oad e ad ad+ ↔ + (1.21)
O O sad ad YSZ e↔ +, (1.22)
O e Oad YSZ Ox
, + ↔2 (1.23)
H O g s H Oe ad2 2 + ↔ (1.24)
where se denotes a vacant site on the nickel surface. The reaction,2 22H H g sad e→ + (1.25)
is assumed to be slow and does not reach equilibrium near the TPB.Under virtual equilibrium condition for reactions (1.20) - (1.24), three possible rate deter-mining reaction steps are considered:(i) direct attack of H2(g) on Oad:
H g O H O i k pHFE
RTk pH Oad ad2 2 1 1 2 1 2
2 + → =
−: exp ' (1.26)
which process predominates under anodic polarisation.(ii) surface diffusion of Had on the nickel surface towards reaction sites near the TPB
H H i k pH k pH OFE
RTad adTPB→ = − −
2 2 2
1 22 2
1 2/ ' / exp (1.27)
where the constants k2 and k2’ comprise, among other factors, the ratio of a diffusion coef-ficient over an effective distance in accordance with Fick’s first law of diffusion. This pro-cess would dominate under small cathodic polarisation.(iii) dissociative adsorption of H2(g) near the TPB
H g V H i k pH k pH OFE
RTad ad2 3 3 2 3 22 22
+ → = − −
: exp' (1.28)
which process predominates under large cathodic polarisation.All three rate-determining processes proceed in parallel. The magnitude of the rate con-stants and the oxygen activity at the nickel/YSZ interface determine which process domi-nates.
A kind of intermediate electrode between nickel electrodes and cermet electrodes wasstudied by Nakagawa et al. 0. The investigated electrodes consisted of a sputtered nickellayer having a thickness between 0.8 and 12.9 µm, coated with a plasma-sprayed porous
1.2 Solid Oxide Fuel Cell
15
YSZ layer (0-207µm). The effect of the porous ceramic top layer appeared in the imped-ance diagram at equilibrium, but not under polarisation in dc experiments. For a 2 µm thicknickel layer without a porous YSZ top layer, one depressed arc was found in the imped-ance diagram. Upon coating with YSZ a second arc appeared. The associated resistancewas found to be proportional to the thickness of the applied porous YSZ layer and attrib-uted to the diffusion of H2O inside the porous YSZ layer. Because no effect was observedon the electrode performance in the applied range of the nickel layer thickness, the effec-tive reaction zone for the rate determining process on nickel was estimated to be less than1µm from the electrode/electrolyte interface. The results led the authors to the overall con-clusion that under polarisation an activation process and not a diffusion process is impor-tant for the anodic reaction.
Table 1.4 summarises results on nickel electrodes obtained by different authors. Overall itcan be stated that comparison between the results is difficult mainly because different typeof electrodes are used by different authors, measurements being performed at differenttemperatures and under different ambient conditions.
One of the reasons to use nickel electrodes in many investigations is to search for the ex-pected inverse relationship between the specific resistance and the TPB length. Results arecompared in Table 1.5, where the specific resistances observed in different studies arenormalised for the TPB length of the electrode used in the investigation. Huge differencescan be seen in the normalised values. No corrections were made for differences in the gasphase conditions employed by the various authors. It should however be mentioned thatsuch a correction cannot account for the observed scatter, so other factors need to be con-sidered.
1.1.1.10 Cermet electrodes
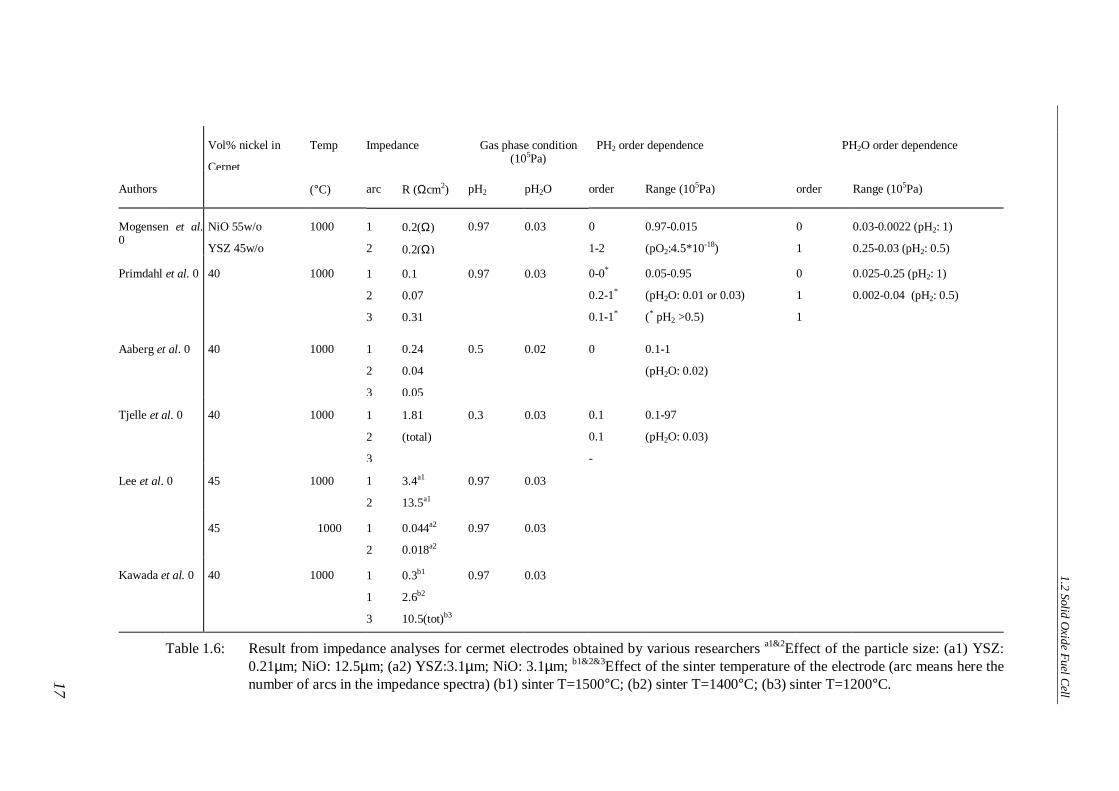
The most widely studied anode for oxidation of hydrogen in SOFCs is the Ni/YSZ cermetanode. Use of the cermet structure is a basic requirement to increase adhesion between an-ode and electrolyte and stability of the electrode, compared to nickel. Another reason touse a cermet structure is the possibility of increasing the number of reaction sites pernominal electrode area. The complex microstructure of Ni/YSZ cermet anodes, the prob-lem of establishing a quantitative description of such structures and the complex imped-ance spectra obtained have resulted in a significant number of studies on this system. Asurvey of measurement results is given in Table 1.6 (impedance) and Table 1.7 (polarisa-tion). Below some possible reaction mechanisms are given as described by various authors.
In 1993, Mogensen and Lindegaard 0 proposed a mechanism for the oxidation of hydrogenon a Ni/YSZ cermet electrode. This model is probably most often referred to in literature.It is based on impedance data where the polarisation resistance consisted of two separatecontributions, only one of these being strongly dependent on both the H2 partial pressureand the ratio pH2/pH2O. The high frequency semicircle is assumed to arise partly from thetransfer of ions across the TPB line and partly from the resistance inside the electrode par-ticles. The associated CPE is probably connected with the accumulation of charge
1 In
trod
uction
16
R⋅lTPB
(Ω)
(900°)
48
214
194
2950
R
(Ω)
(900°)
5102
65k
1.6
2500
Eact
(kJ⋅mol-1)
154.4
68.1
R
(Ω)
1970
65k
1.6*
10.5k
Impedance
(nr arcs)
1
1
2
1
Gas phaseconditions
(105 Pa)
pH2O
0.053
0.0063
0.0063
0.017
pH2
0.75
0.0012
0.0012
0.1
Temp
(°C)
975
900
900
700
TPB
Length
(m⋅cm2)
9.4mm
3.3mm
121 m
3.26
Type ofelectrode
Ni ball
Ni wire
Porous Nilayer
Ni stripe
Table 1.5: Comparison of resistance as function of TPB length for different nickel electrodes. * Only the first arc = Rct,Rr unknown.
Authors
Mohamedi-Bou-lenouar et al. 0
Norby et al. 0
Norby et al.0
Mizusaki et al. 0
1.2 S
olid O
xide F
uel C
ell
17
Range (105Pa)
0.03-0.0022 (pH2: 1)
0.25-0.03 (pH2: 0.5)
0.025-0.25 (pH2: 1)
0.002-0.04 (pH2: 0.5)
PH2O order dependence
order
0
1
0
1
1
Range (105Pa)
0.97-0.015
(pO2:4.5*10-18)
0.05-0.95
(pH2O: 0.01 or 0.03)
(* pH2 >0.5)
0.1-1
(pH2O: 0.02)
0.1-97
(pH2O: 0.03)
PH2 order dependence
order
0
1-2
0-0*
0.2-1*
0.1-1*
0
0.1
0.1
-
pH2O
0.03
0.03
0.02
0.03
0.03
0.03
0.03
Gas phase condition(105Pa)
pH2
0.97
0.97
0.5
0.3
0.97
0.97
0.97
R (Ωcm2)
0.2(Ω)
0.2(Ω)
0.1
0.07
0.31
0.24
0.04
0.05
1.81
(total)
3.4a1
13.5a1
0.044a2
0.018a2
0.3b1
2.6b2
10.5(tot)b3
Impedance
arc
1
2
1
2
3
1
2
3
1
2
3
1
2
1
2
1
1
3
Temp
(°C)
1000
1000
1000
1000
1000
1000
1000
Vol% nickel in
Cernet
NiO 55w/o
YSZ 45w/o
40
40
40
45
45
40
Table 1.6: Result from impedance analyses for cermet electrodes obtained by various researchers a1&2Effect of the particle size: (a1) YSZ:0.21µm; NiO: 12.5µm; (a2) YSZ:3.1µm; NiO: 3.1µm; b1&2&3Effect of the sinter temperature of the electrode (arc means here thenumber of arcs in the impedance spectra) (b1) sinter T=1500°C; (b2) sinter T=1400°C; (b3) sinter T=1200°C.
Authors
Mogensen et al.0
Primdahl et al. 0
Aaberg et al. 0
Tjelle et al. 0
Lee et al. 0
Kawada et al. 0
1 In
trod
uction
18
Validity of given current expression
Electrode characteristics depend on sinter temp.
(only valid for well prepared electrodes)
725-825°C: β= 0.7 (independent of temp.)
890°C: β =0.25
950°C: β =0.47
(a) β=2 (b) β=1
value of β depends on microstructure
Current expression
i = i0(exp (2Fη/RT) - exp (-Fη/RT))
i = i0(exp (βFη/RT) – exp (-βFη/RT))
ia = i0 exp (βFη/RT)
pH2O
0.03
0.05
0.02
Gas phase conditions
(105 Pa)
pH2
0.97
0.48
0.3
Temp
(°C)
1000
725-950
1000
Vol% nickelin cermet
40
----
(a) 33
(b) 50
Table 1.7: Result from polarisation measurements for cermet electrodes obtained by various researchers.
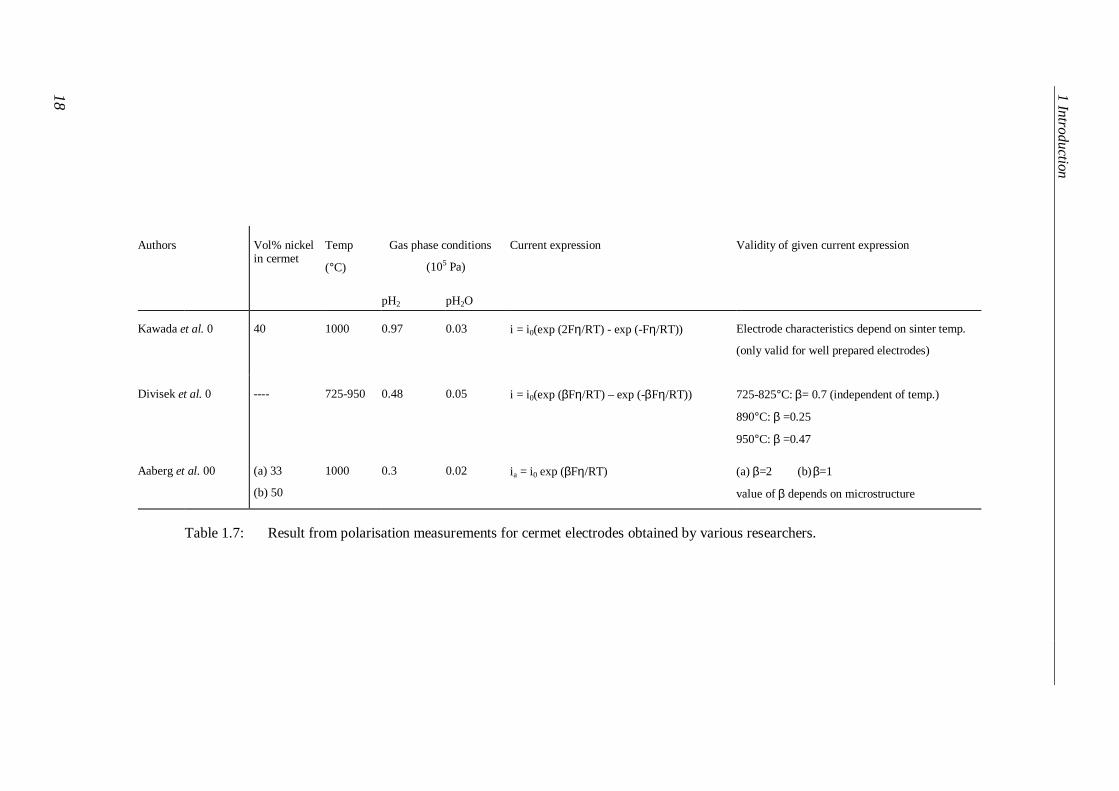
Authors
Kawada et al. 0
Divisek et al. 0
Aaberg et al. 00
1.2 Solid Oxide Fuel Cell
19
at the interface between the Ni and YSZ particles. It does not behave as an ideal capaci-tance (CPE with n=0.67), which is attributed to a variation in grain size and orientation,causing a distribution in relaxation times. The semicircle at low frequencies is attributed toa reaction resistance associated with the formation of water (equation (1.32)), which is as-sumed to occur at the YSZ surface. The CPE associated with the low frequency semicirclewould be related to the degree in coverage of protons and H2O on the Ni surface. Based onthe above interpretations the following mechanism was proposed:H Had Ni2 2↔ , (1.29)
2 × ↔ ++ −H H ead Ni ad Ni, , (1.30)
Diffusion of H to the Ni YSZ boundaryad Ni,+ −
2 2× + ↔+ − −H O OHad Ni YSZ YSZ, (1.31)
2 22OH H O OYSZ YSZ
− −↔ + (1.32)
Recently this mechanism was reformulated 0, allowing incorporation of protons in the bulkof the Ni and YSZ as well as on the surface:H g H eNi2 2 2 ↔ +• − (1.33)
H HNi i YSZ• •↔ , (1.34)
2 2H O H O Vi Ox
ad YSZ O• ••+ ↔ +, (1.35)
H O H O gad YSZ2 2, ↔ (1.36)
Reactions (1.34) and (1.35) are assumed to be rate-limiting. This mechanism accounts fortwo arcs in the impedance plot. Recent studies on Ni/YSZ cermet electrodes by Mogensenand Primdahl 0 indicate that most structures are well described by three, more or lessoverlapping arcs, implying that at least three (physical or chemical) processes contribute tothe limitation of the reaction rate. The high frequency arc is sensitive to the cermet struc-ture (particle size) and relatively insensitive to atmospheric composition and overvoltage.The related CPE is interpreted as a double layer capacitance at the Ni/YSZ interface. Themedium- and low frequency arc are sensitive to atmospheric composition and overvoltage.The capacitance associated with the low frequency arc behaves ideal, is in the order 0.5-2.5F/cm2 and is very dependent on pH2O. This magnitude of the capacitance suggests changesin the bulk composition of the gas phase above the electrode, rather than surface adsorptionof charged species.
A more or less similar reaction scheme has been suggested by Aaberg et al. 00.H g Hads Ni2 2 ↔ , (1.37)
H H eads Ni ads YSZ, ,↔ +• − (1.38)
2 2H O H O Vads YSZ O O,• ••+ ↔ + (1.39)
Aaberg et al. assumed, in agreement with earlier findings by Skaarup et al. 0, that adsorp-tion and mobility of hydrogen on nickel is fast. Consequently, it is reasonable to assumethat hydrogen adatoms are abundantly present at the Ni/YSZ boundary even when theelectrode is moderately polarised to anodic potentials. The electrochemical transfer ofprotons from the metal to the electrolyte is assumed to be the potential dependent step,which is assumed to be close to equilibrium. The rate determining step will be the combi-
1 Introduction
20
nation of protons and oxide ions on the electrolyte surface. This is probably a multi stepprocess. With the above assumptions and the assumption that (1.38) is not far from equilib-rium, Aaberg et al. arrived at the following equation for the anodic current:i Fk pH FE RTa = 2 23 2
' exp ( / ) (1.40)
k3’ is the rate constant. This is identical to the relation Mizusaki et al. 0 found for the ano-dic current under anodic polarisation. Experimentally the transfer coefficient was found tovary between 1 and 2, depending on the microstructure.An alternative route for (1.38) could beH H eads abs Ni i/ , ↔ +• − (1.41)
and illustrates protons being absorbed in the electrolyte. If (1.39) is slow the interstitialprotons will accumulate in the electrolyte. Reaction (1.41) than acts merely as a large ca-pacitance, but does not contribute much to the overall rate unless sub-surface diffusion ofprotons extends towards the reaction zone. Its involvement may account for the large ca-pacitance experimentally found at low frequencies, provided that the diffusion coefficientfor protons in zirconia is high. The solubility of hydrogen in zirconia, as reported earlier byWagner 0, is proposed to contribute to an extension of the reaction zone. Whether the pro-tons are transferred across the TPB in an adsorbed state only, or additionally, across themetal zirconia interface as hydrogen dissolved in the metal, is not clear.
Impedance analysis is a widely used tool for kinetic studies on electrodes. Very frequentlyand as described above, the impedance data is fitted to a number of RQ-arcs, to which nophysical meaning can be ascribed in a simple manner. Especially for cermet electrodes,containing both electronic and ionic conducting phases, the use of a chain ladder networkis of interest. With this type of network (also known as transmission line model) bulk ac-tivity of the cermet is visualised. 000000
1.3 Scope of this thesis
A number of studies on different types of nickel anode for SOFC are described in this the-sis. Emphasis is put on the relation between the microstructure and the electrode perform-ance. A broad range of microstructures is covered by starting with pattern electrodes andporous nickel structures, finally arriving at the complex microstructures of Ni/YSZ cermetstructures. Attention is paid to the kinetics of the hydrogen oxidation reaction.The experimental set-up is described in Chapter 2, where the design of the electrochemicalcell is also discussed.Nickel electrodes are the subject of Chapters 3 and 4. These types of electrode are not di-rectly interesting as an anode for real SOFC applications, but are very interesting for re-search purposes because of their uncomplicated geometry. This makes them indispensablefor studies on the relation between microstructure and electrochemical performance.Lithographically prepared nickel pattern electrodes are the subject of Chapter 3. This typeof electrode results in relatively small nickel perimeters. Results from impedance and po-larisation types of measurements are discussed. In Chapter 4 results on porous nickel elec-trodes are described. These electrodes have a nickel perimeter about 5 times longer thanthe lithographically prepared electrodes. Besides impedance and polarisation measure-

1.3 Scope of this thesis
21
ments under different conditions a model is proposed for the hydrogen oxidation reactionat the nickel anode.A kind of intermediate electrode between the nickel and cermet electrode is discussed inChapter 5. By modifying a porous nickel electrode with fine YSZ particles the effect of theYSZ in a cermet is studied.The real state-of-the-art SOFC anodes are treated in the Chapters 6-8. The influence of themicrostructure on the electrode performance is described in Chapter 6. The microstructureis affected by changing the particle size of the YSZ fraction in the preparation of theNi/YSZ cermet electrode. Coarse and fine YSZ powder were mixed in different ratios re-sulting in seven different microstructures. Impedance measurements were performed tostudy the electrode performance. In Chapter 7 impedance data are analysed with a networkmodel. Chapter 8 describes impedance and polarisation measurements obtained under dif-ferent conditions aiming at kinetic parameters of the hydrogen oxidation reaction at thecermet electrode.A brief evaluation of the results obtained in this thesis is given in Chapter 9.
ReferencesH. Davy, Nicholson’s J. Nat. Phil., 144, 1802.W.R. Grove, Phil. Mag., 14, 127, 1839.W. Nernst, Über die elektrolytische Leitung fester Körper bei sehr hohen Temperaturen, Z. Elektrochem., 6, 41, 1899.E. Baur and H.Z. Preis, Über Brennstoff-ketten mit FestLeitern, Z. Electrochem., 43, 727-32, 1937.E. M. Cohn, ‘NASA’s Fuel Cell Program’, Fuel Cell Systems, Advances in Chemistry series 47, Ed. by G.J. Young, H.R.
Linden, pp 1-8, Am. Chem. Soc. 1965.B.S. Baker, L.G. Marianowski, J. Meek and H.R. Linden, ‘High Temperature Natural Gas for Fuel Cells’, Fuel Cell Sys-
tems, Advances in Chemistry series 47, Ed. by G.J. Young, H.R. Linden, pp 247-62, Am. Chem. Soc. 1965.W.T. Reid, ‘Fuel Cells for Practical Energy Conversion Systems’, From Electrocatalysis to Fuel Cells’, Ed. by G.
Sandstede, University of Washington Press, ISBN 0-295-95178-8, 1972.P. Zegers, ‘Status of Solid Oxide Fuel Cell Development in Europe’, Proc. of the 3th Int. Symp. On SOFC-III, pp 16-20,
Honolulu, Hawaii, 1993.M.C. Williams, ‘Status of Solid Oxide Fuel Cell Development in Japan’, Proc. of the 4th Int. Symp. On SOFC-IV, pp 3-9,
Yokohama, Japan, 1995.M. Nishikawa, ‘Status of Solid Oxide Fuel Cell Development in the United States’, Proc. of the 4th Int. Symp. On SOFC-
IV, pp 10-19, Yokohama, Japan, 1995.J. Kuipers, ‘Status of the Westinghouse, EDB and ELSAM 100kWe SOFC Field Unit’, European Fuel Cell News, pp 19,
5, 1, 1998.E. Barendrecht, H. Barten, L de Vaal, ‘Brandstofcel nadert précommerciële fase’, Chemisch Magazine, 10, 424-427,
1994.U. Bünger, ‘Fuel Cells and Hydrogen in the City of Tomorrow’, European Fuel Cell News, pp 11-13, 5, 1, 1998.T. Bozzoni, ‘PAFC in the City of Tomorrow’, European Fuel Cell News, pp 14-15, 5, 1, 1998.P.J. Kortbeek, R.G. Ottervanger, ‘MCFC’s in the City of Tomorrow’, European Fuel Cell News, pp 15-16, 5, 1, 1998.H.E. Vollmar, W. Drenckhahn, ‘Stationary PEMFCs and SOFCs in the City of Tomorrow’, European Fuel Cell News, pp
17-18, 5, 1, 1998.K. Kinoshita, ‘Electrochemical oxygen technology’ pp 163-259, ISBN 0-471-57043-5, John Wiley & Sons, Inc. New
York, 1992.S.C. Singhal, ‘Tubular Solid Oxide Fuel Cells’, in Proc. Of the third Int. Symp. on Solid Oxide Fuel Cells, pp 665-77,
Hawaii, 1993.A. Hammou, J. Guindet, ‘Solid Oxide Fuel Cells’, Chapter 12 in The CRC Handbook of Solid State Electrochemistry, pp
409-45, CRC Press, 1997.N.Q. Minh, ‘Science and technology of Ceramic Fuel Cells’, ISBN 0-444-89568, Elsevier, Tokyo, 1995.E. Siebert, A. Hammouche, M. Kleitz, ‘Impedance Spectroscopy Analysis of La1-xSrxMnO3/Yttria-Stabilized Zirconia
Electrode Kinetics, Electrochemica Acta, 40, 1741-53, 1995.F. van Heuveln, 'Characterisation of porous cathodes for application in Solid Oxide Fuel Cells', thesis, University of
Twente, 1997.A. Hammou, J. Guindet, 'Solid Oxide Fuel Cells', Ch 12 of 'The CRC Handbook of Solid-State Electrochemistry', pp
409-445, CRC Press, Inc., 1997.N.Q. Minh, 'Ceramic Fuel Cells', J. Am. Ceram. Soc., 76 [3] 563-88, 1993.T. Shirakawa, S. Matsuda, and A. Fukushima, 'Characterisation of NiO/YSZ electrodes by Temperature Programmed
Reduction', pp.464-72 in: Proc. Of the 3rd Int. Symp. On Solid Oxide Fuel Cells, Honolulu, Hawaii, 1993.

1 Introduction
22
F.H. van Heuveln, F.P.F. van Berkel, and J.P.P. Huijsmans, 'Electrochemical characterisation of porous electrodes andapplications in SOFC'; pp. 53-68 in: Risø High Temp. Electrochemical Behaviour of Fast Ion and Mixed Conduc-tors, 14th Risø Inter. Symp. On Material Science, 1993.
F.P.F. van Berkel, F.H. van Heuveln and J.P.P. Huijsmans, ‘Status of SOFC Components Development at ECN’, pp. 533-41 in: Proc. Of the 3rd Int. Symp. On Solid Oxide Fuel Cells, Honolulu, Hawaii, 1993.
K.C. Chou, S. Yuan, and U. Pal, 'Deposition, electrical property and direct porosity measurement of Ni-ZrO2 cermetelectrodes'; pp 744-751 in: Proc. Of the 3rd Int. Symp. On Solid Oxide Fuel Cells, Honolulu, Hawaii, 1993.
M. Mogensen and T. Lindegaard, 'The kinetics of hydrogen oxidation on a Ni/YSZ SOFC electrode at 1000ºC'; pp. 484-93 in: Proc. Of the 3rd Int. Symp. On Solid Oxide Fuel Cells, Honolulu, Hawaii, 1993.
J. Divisek, A. Kornyshev, W. Lehnert, U. Stimming, I.C. Vinke and K. Wioppermann, ‘Advanced characterisation tech-niques for Nickel-YSZ Cermet Electrodes used in Solid Oxide Fuel Cells’, Electrochemical Proceedings Volume97-18, 606-16, 1997.
A. Ioselevich, A.A. Kornyshev and W. Lehnert, ‘Degradation of SOFC Anodes due to Sintering of Metal Particles: Cor-related Percolation Model’, J. Electroch. Soc., 144, 3010-19, 1997.
T. Kawada, N. Sakai, J. Yokokawa, M. Dokiya, M. Mori and T. Iwata, ‘Structure and Polarisation Characteristics ofSolid Oxide Fuel Cell Anodes’, SSI, 40/41, 402-06, 1990.
T. Norby, O.J. Velle, H. Leth-Olsen and R. Tunold, 'Reaction resistance in relation to three phase boundary length ofNi/YSZ electrodes', pp.473-78 in: Proc. Of the 3rd Int. Symp. On Solid Oxide Fuel Cells, Honolulu, Hawaii, 1993
J. Mizusaki, H. Tagawa, T. Saito, K. Kamitani, T. Yamamura, K. Hirano, S. Ehara, T. Takagi, T. Hikita, M. Ippommatsuand S. Nakagawa, 'Preparation of Nickel pattern electrodes on YSZ and their electrochemical properties in H2-H2Oatmospheres'; pp. 533-41 in: Proc. Of the 3rd Int. Symp. On Solid Oxide Fuel Cells, Honolulu, Hawaii, 1993.
J. Guindet, C. Roux, and A. Hammou, 'Hydrogen oxidation at the Ni/Zirconia electrode', pp.553-58 in: Proc. of the 2nd
Int. Symp. on Solid Oxide Fuel Cells, Athens, Greece, July 2-5, 1991.M. Suzuki, H. Sasaki, S. Otoshi, and M. Ippommatsu, Development of Ru/Y2O3 SOFC anode', pp.585-91 in: Proc. of the
2nd Int. Symp. on Solid Oxide Fuel Cells, Athens, Greece, July 2-5, 1991.M. Suzuki, H. Sasaki, S. Otoshi, A. Kajimura and M. Ippommatsu, 'High power density solid oxide electrolyte fuel cells
using Ru/Y2O3 stabilised zirconia cermet anodes, Solid State Ionics, 62, 125-30, 1993.K. Okumura, Y.Yamamoto, T. Fukui, S. Hanyu, Y. Kubo, Y. Esaki, M. Hattori, A. Kusunoki and S. Takeuchi, 'Micro-
structure and overvoltage characteristics of the anode for Solid Oxide Fuel Cells', pp. 444-53 in: Proc. Of the 3rd Int.Symp. On Solid Oxide Fuel Cells, Honolulu, Hawaii, 1993.
C.S. Tedmon, H.S. Spacil and S.P. Mittof, General Electric, Rep. 69-C-056, 1969.K. Eguchi, T. Setoguchi, K. Okamoto and H. Arai, 'An investigation on anode materials and anodic reaction for Solid
Oxide Fuel Cell', pp. 494-503 in: Proc. Of the 3rd Int. Symp. On Solid Oxide Fuel Cells, Honolulu, Hawaii, 1993.H. Miyamoto, M. Sumi, K. Mori, I. Koshiro, F. Nanjo and M. Funatsu, ‘Improvement of Anode Performance by YSZ
Surface Modification’, in Proc. Of the Third Int. Symp of SOFC, pp 504-12, The Electrochemical Society, Pen-nington, NJ, 1993.
R.M.C. Marques, J.R. Frade, F.M.B. Marques, ‘Ceramic materials for SOFC anode cermets’in Proc. Of the Third Int.Symp of SOFC, pp 513-22, The Electrochemical Society, Pennington, NJ, 1993.
M.T. Colomer, J.R. Jurado, R.M.C. Marques, F.M.B. Marques, ‘Evaluation of Titania Doped YSZ for SOFC Anodes’, inProc. Of the Third Int. Symp of SOFC, pp 523-32, The Electrochemical Society, Pennington, NJ, 1993.
M. Mogensen, S. Sunde and S. Primdahl, ‘SOFC Anode Kinetics’, pp 77-100 in: Proc. of the 17th Risø Int. Symp. onMaterial Science: High Temp. Electrochemistry: Ceramics and Metals, Roskilde, Denmark, 1996.
T. Kawada, N. Sakai, H. Yokokawa, M. Dokiya, M. Mori and T. Iwata, ‘Characteristics of slurry-coated nickel zirconiacermet anodes for solid oxide fuel cells, J. Electrochem. Soc. 137, 10 , 3042-47, 1990.
J. Divisek, L.G.J. de Haart, P. Holtappels, U. Stimming and I.C. Vinke, ‘Elelctrode kinetics of hydrogen oxidation onNickel/YSZ cermet anodes, pp 235-40 in: Proc. of the 17th Risø Int. Symp. on Material Science: High Temp.Electrochemistry: Ceramics and Metals, Roskilde, Denmark, 1996.
J. Mizusaki, T. Yamamura, H. Yoshitake, H. Tagawa, K. Hirano, S. Ehara, T. Takagi, M. Hishinuma, H. Sasaki, T. Sogi,Y. Nakamura, and K. Hishimoto, ‘Kinetic studies on Ni/YSZ anode reaction of SOFC in H2-H2O atmospheres bythe use of Nickel pattern electrodes‘, pp 363-68 in: Proc. of the 17th Risø Int. Symp. on Material Science: HighTemp. Electrochemistry: Ceramics and Metals, Roskilde, Denmark, 1996.
J. Mizusaki, H. Tagawa, T. Saito, K. Kamitain, T. Yamamura, K. Hirano, S. Ehara, T. Takagi, T. Hikita, M. Ippommatsu,S. Nakagawa, K. Hashimoto, ‘Preparation of Nickel Pattern Electrodes on YSZ and Their Electrochemical Proper-ties in H2-H2O Atmospheres, J. Electrochem. Soc., 141, 2129-34, 1994.
J. Mizusaki, H. Tagawa, T. Saito, T. Yamamura, K. Kamitani, K. Hirano, S. Ehara, T. Takagi, T. Hikita, M. Ippommatsu,S. Nakagawa, K. Hashimoto, 'Kinetic studies of the reaction at the nickel pattern electrode on YSZ in H2-H2O at-mospheres', Solid State Ionics, 70/71, 52-58, 1994.
P.A. Osborg, T. Norby, ‘Characterisation of a H2+H2O/Ni/YSZ point electrode system by impedance spectroscopy’,pp47-50, in 7th SOFC Workshop, theory and measurement of microscale processes in Solid Oxide Fuel Cells, Wa-dahl, Norway, 18-20 Jan., 1995.
T. Yamamura, H. Tagawa, T. Saito, J. Mizusaki, K. Kamitani, K. Hirano, S. Ehara, T. Takagi, Y. Hishinuma, H. Sasaki,T. Sogi, Y. Nakamura, K. Hashimoto, ‘Reaction Kinetics at the Nickel Pattern Electrode on YSZ and its depend-ence on Temperature’, Proc. of the 4th Int. Symp. On SOFC-IV, pp 741-49, Yokohama, Japan, 1995.
T. Yamamura, H. Yoshitaka, H. Tagawa, N. Mori, K. Hirano, J. Mizusaki, S. Ehara, T. Takagi, M. Hishinuma, H. Sasaki,Y. Nakamura, K. Hashimoto, ‘Experimental Evidence for Three Phase Boundary as Active Site on Nickel/YSZSystem’, pp 617-25 in: Proc. Of 2nd European SOFC Forum, Oslo, Norway, 1996.

1.3 Scope of this thesis
23
F.Z. Mohamedi-Boulenouar, J. Guindet and A. Hammou, ‘Influence of Water Vapour on Electrochemical Oxidation ofHydrogen at the Ni/Zirconia Interface’, pp 441-50 in: Proc. of the 17th Risø Int. Symp. on Material Science: HighTemp. Electrochemistry: Ceramics and Metals, Roskilde, Denmark, 1996.
N. Nakagawa, H. Sakurai, K. Kondo and K. Kato, 'Study on the extension of reaction zone from Ni/YSZ interface byusing fixed film electrodes', pp 721-30 in Proc. of the 4th Int. Symp. On SOFC-IV, pp 741-49, Yokohama, Japan,1995.
S. Primdahl and M. Mogensen, ‘Oxidation of Hydrogen on Ni/Yttria-Stabilized Zirconia Cermet Anodes’, J. Electro-chem. Soc., 144, 3409-19, 1997.
R.J Aaberg, R. Tunold, S. Tjelle, R. Ødegård, ‘Oxidation of CO and H2 on Ni/YSZ cermet electrodes’, pp 511-16 in:Proc. of the 17th Risø Int. Symp. on Material Science: High Temp. Electrochemistry: Ceramics and Metals, Ro-skilde, Denmark, 1996.
R.J Aaberg, R. Tunold, S. Tjelle, R. Ødegård, ‘A Possible Reaction Mechanism for the Oxidation of H2 on Ni/YSZ cer-met Electrodes, pp 557- 64 in: The Electrochemical Society, Aachen, 1997.
S. Skaarup, B. Zachau-Christiansen and T. Jacobsen, ‘Surface Species and Surface Mobility on Ni/YSZ Anodes’, pp 423-30 in: Proc. of the 17th Risø Int. Symp. on Material Science: High Temp. Electrochemistry: Ceramics and Metals,Roskilde, Denmark, 1996.
C. Wagner, Ber. Bunsenges. Physic Chem., 72, 778-81, 1968.S. Tjelle, R. Tunold and R. Ødegård, ‘Oxidation of H2 and CO on Ni/YSZ cermet’, pp 67-72 in: Proc. Of the 7th SOFC
workshop, Advanced Fuel Cells Programme Annex II Modelling and Evaluation of Advanced SOFC, Wadahl,Norway, 1995.
C-H Lee, C-H Lee, H-Y Lee and S.M Oh, ‘ Microstructure and anodic properties of Ni/YSZ cermets in Solid Oxide FuelCells’, Solid State Ionics 98, 39-48, 1997.
Ch. Bleise, J. Divisek, B. de Haart, P. Holtappels, B. Steffen and U. Stimming, ‘Kinetic Modelling of the Anodic Reac-tion Considering the Porous Structure’, pp 31-39 in: Proc. Of the 7th SOFC workshop, Advanced Fuel Cells Pro-gramme Annex II Modelling and Evaluation of Advanced SOFC, Wadahl, Norway, 1995.
A. Hahn, H. Landes, ‘Investigations into the kinetics of SOFC cathodes’ pp 595-605 in Proc. Of the 5th Int. Symp. OnSOFC, Ed. U. Stimming, S.C. Singhal, H. Tagawa, and W. Lehnert, The Electrochemical Society, Aachen, 1997.
F. Richter, ‘Impedance Measurements under High Current for Development and Quality Control of Solid Oxide FuelCells (SOFCs)’, pp 3-7, Electrochemical Applications 1/97, Zahner-elektrik GmbH & Co, 1997.
G. Paasch, P.H. Nguyen, ‘Impedance of Inhomogeneous Porous Electrodes, a novel Transfer Matrix Calculation Method,pp 7-9, Electrochemical Applications 1/97, Zahner-elektrik GmbH & Co, 1997.
M.H.R. Lankhorst, F.H. van Heuveln and F.P.F. van Berkel, ‘Analytical Expressions for the Impedance of Networks’,ECN-internal report, 1997.


25
2 Experimental considerations
2.1 Introduction
In this thesis interest is focused on the electrochemical performance of nickel and nickel /yttria-stabilised zirconia cermet anodes in the hydrogen oxidation reaction. The presentchapter describes:• the experimental set-up,• the design considerations regarding the electrochemical cell.
2.2 The experimental set-up
The experimental set-up is schematically represented in Figure 2.1 and is suitable for:• impedance and polarisation measurements,• electrochemical measurements as a function of gas condition (pH2, pH2O), polarisation
and temperature.Essential parts are described in more detail in the following sections.
2.2.1 The electrochemical cell
One of the important require-ments for the electrochemical cellis the possibility to perform half-cell measurements. Half-cellmeasurements allow the study ofone electrode, in this case the an-ode. The consequence of half-cellmeasurements is the need for anadditional electrode, the referenceelectrode. The commonly usedterminology of electrodes isworking, counter and referenceelectrode. The working electrodeis the electrode whose perform-ance or characteristics are understudy. The counter electrode is Figure 2.1: Overview of the experimental set-up.
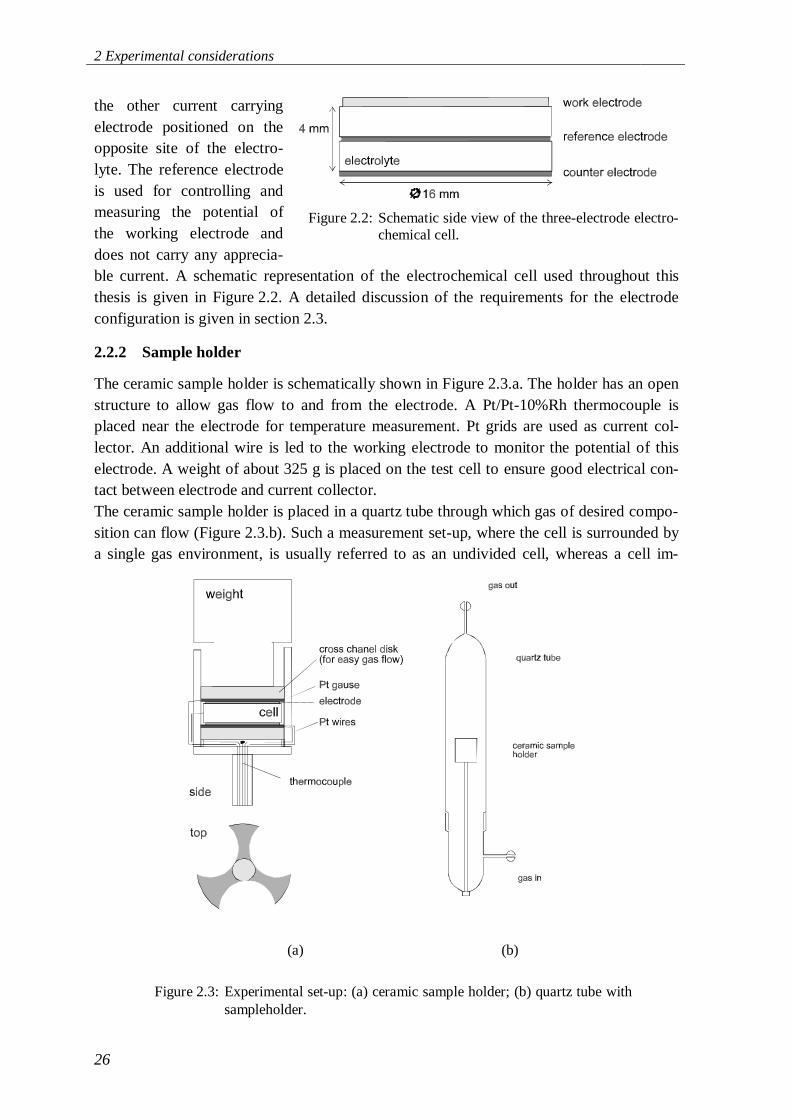
2 Experimental considerations
26
the other current carryingelectrode positioned on theopposite site of the electro-lyte. The reference electrodeis used for controlling andmeasuring the potential ofthe working electrode anddoes not carry any apprecia-ble current. A schematic representation of the electrochemical cell used throughout thisthesis is given in Figure 2.2. A detailed discussion of the requirements for the electrodeconfiguration is given in section 2.3.
2.2.2 Sample holder
The ceramic sample holder is schematically shown in Figure 2.3.a. The holder has an openstructure to allow gas flow to and from the electrode. A Pt/Pt-10%Rh thermocouple isplaced near the electrode for temperature measurement. Pt grids are used as current col-lector. An additional wire is led to the working electrode to monitor the potential of thiselectrode. A weight of about 325 g is placed on the test cell to ensure good electrical con-tact between electrode and current collector.The ceramic sample holder is placed in a quartz tube through which gas of desired compo-sition can flow (Figure 2.3.b). Such a measurement set-up, where the cell is surrounded bya single gas environment, is usually referred to as an undivided cell, whereas a cell im-
Figure 2.2: Schematic side view of the three-electrode electro-chemical cell.
(a) (b)
Figure 2.3: Experimental set-up: (a) ceramic sample holder; (b) quartz tube withsampleholder.
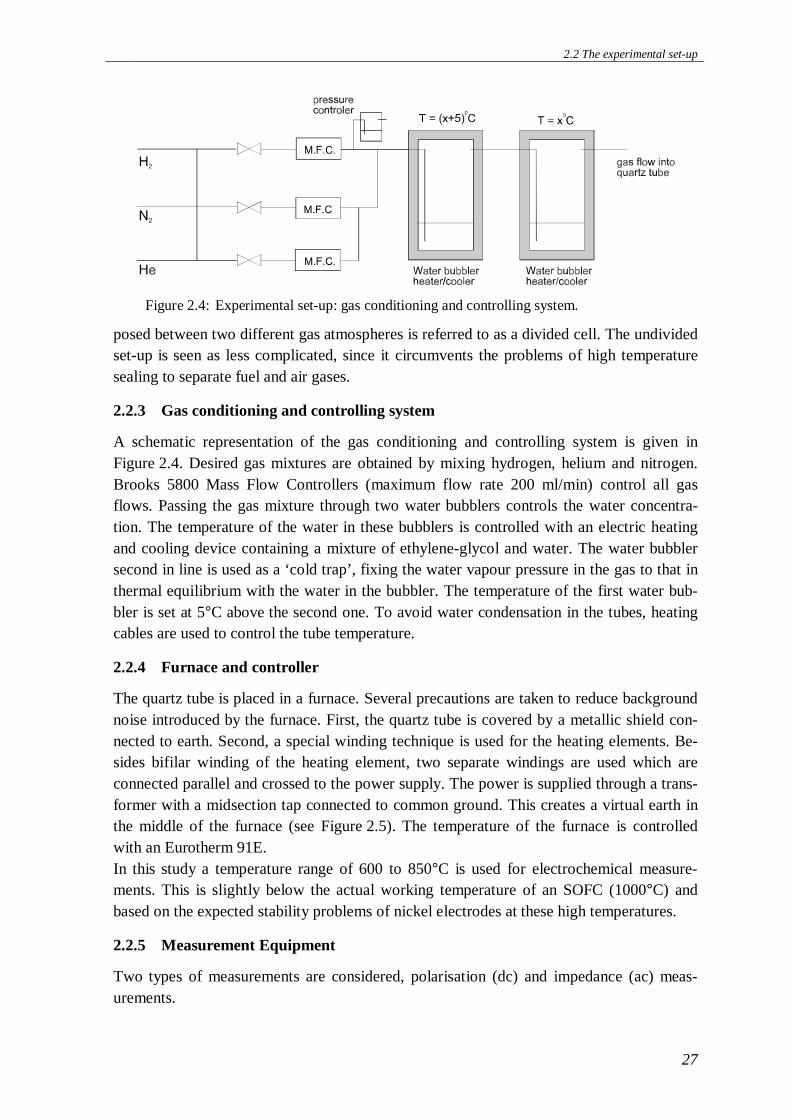
2.2 The experimental set-up
27
posed between two different gas atmospheres is referred to as a divided cell. The undividedset-up is seen as less complicated, since it circumvents the problems of high temperaturesealing to separate fuel and air gases.
2.2.3 Gas conditioning and controlling system
A schematic representation of the gas conditioning and controlling system is given inFigure 2.4. Desired gas mixtures are obtained by mixing hydrogen, helium and nitrogen.Brooks 5800 Mass Flow Controllers (maximum flow rate 200 ml/min) control all gasflows. Passing the gas mixture through two water bubblers controls the water concentra-tion. The temperature of the water in these bubblers is controlled with an electric heatingand cooling device containing a mixture of ethylene-glycol and water. The water bubblersecond in line is used as a ‘cold trap’, fixing the water vapour pressure in the gas to that inthermal equilibrium with the water in the bubbler. The temperature of the first water bub-bler is set at 5°C above the second one. To avoid water condensation in the tubes, heatingcables are used to control the tube temperature.
2.2.4 Furnace and controller
The quartz tube is placed in a furnace. Several precautions are taken to reduce backgroundnoise introduced by the furnace. First, the quartz tube is covered by a metallic shield con-nected to earth. Second, a special winding technique is used for the heating elements. Be-sides bifilar winding of the heating element, two separate windings are used which areconnected parallel and crossed to the power supply. The power is supplied through a trans-former with a midsection tap connected to common ground. This creates a virtual earth inthe middle of the furnace (see Figure 2.5). The temperature of the furnace is controlledwith an Eurotherm 91E.In this study a temperature range of 600 to 850°C is used for electrochemical measure-ments. This is slightly below the actual working temperature of an SOFC (1000°C) andbased on the expected stability problems of nickel electrodes at these high temperatures.
2.2.5 Measurement Equipment
Two types of measurements are considered, polarisation (dc) and impedance (ac) meas-urements.
Figure 2.4: Experimental set-up: gas conditioning and controlling system.

2 Experimental considerations
28
For polarisation measurements a Solartron Electrochemical Interface (model 1287) is used.The actual measurements are controlled with a computer program (using Test Point [1]).This program enables measurement of the current through the cell as function of the volt-age drop between working and reference electrode, in a certain overpotential range, with acertain time and a certain voltage interval.For impedance measurements a Solartron Frequency Response Analyser 1255 is used incombination with a Solartron Electrochemical Interface 1287. The Frequency ResponseAnalyser generates an ac signal in the frequency range of 1 MHz to 10 mHz, the Electro-chemical Interface controls the amplitude of the ac signal placed between working and ref-erence electrode (10 mV). Measurements are performed using Zplot 0, a commerciallyavailable computer program for impedance measurements.
2.3 Sample choice in view of geometric requirements for the electrode configuration
To study the performance of an SOFC, anodic and cathodic overvoltages have to be meas-ured independently. A reference electrode is commonly used for this purpose. However,the positioning of the electrodes is a point of controversy among investigators 000 and avariety of electrode configurations have been proposed in literature. An survey is given in0. For a good comparison with real SOFC conditions thin electrolytes are favourable. Forthese electrolytes, with a thickness of 100 – 150 µm, the reference electrode has to beplaced next to the working or counter electrode. The separation or gap between the refer-ence and the adjacent current carrying electrode should be large compared with the thick-ness of the electrolyte. Ideally, no different lines of equipotential should enter the referenceelectrode, because in the case that a potential difference occurs along the reference elec-trode an electrochemical driven reaction over the reference electrode will appear. If thereference electrode is placed further from the working electrode, the potential differencewill normally decrease, in that respect it should be placed as far away from the current car-rying electrodes as possible. A few examples of electrode geometries with current lines andthe expected equipotential line measured by the reference electrode are given in Figure 2.6.
Figure 2.5: Experimental set-up: schematic drawing of the heating cables in thefurnace with the connection to the power supply.
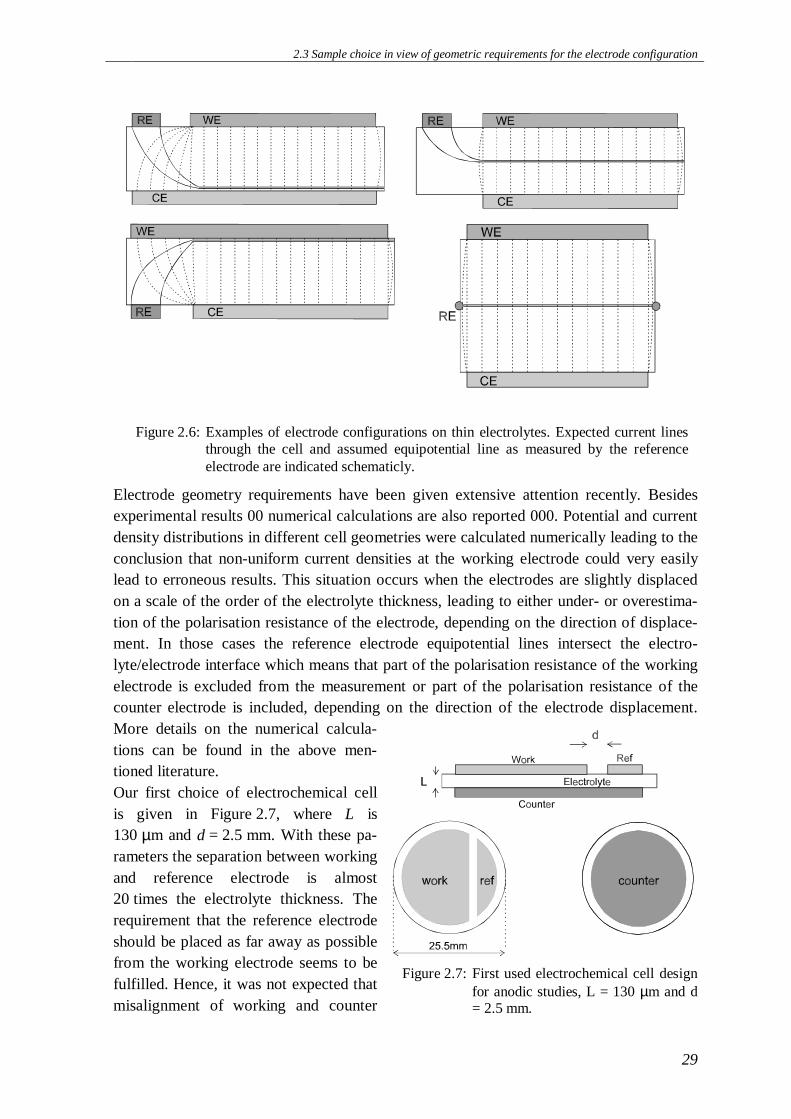
2.3 Sample choice in view of geometric requirements for the electrode configuration
29
Electrode geometry requirements have been given extensive attention recently. Besidesexperimental results 00 numerical calculations are also reported 000. Potential and currentdensity distributions in different cell geometries were calculated numerically leading to theconclusion that non-uniform current densities at the working electrode could very easilylead to erroneous results. This situation occurs when the electrodes are slightly displacedon a scale of the order of the electrolyte thickness, leading to either under- or overestima-tion of the polarisation resistance of the electrode, depending on the direction of displace-ment. In those cases the reference electrode equipotential lines intersect the electro-lyte/electrode interface which means that part of the polarisation resistance of the workingelectrode is excluded from the measurement or part of the polarisation resistance of thecounter electrode is included, depending on the direction of the electrode displacement.More details on the numerical calcula-tions can be found in the above men-tioned literature.Our first choice of electrochemical cellis given in Figure 2.7, where L is130 µm and d = 2.5 mm. With these pa-rameters the separation between workingand reference electrode is almost20 times the electrolyte thickness. Therequirement that the reference electrodeshould be placed as far away as possiblefrom the working electrode seems to befulfilled. Hence, it was not expected thatmisalignment of working and counter
Figure 2.6: Examples of electrode configurations on thin electrolytes. Expected current linesthrough the cell and assumed equipotential line as measured by the referenceelectrode are indicated schematicly.
Figure 2.7: First used electrochemical cell designfor anodic studies, L = 130 µm and d= 2.5 mm.
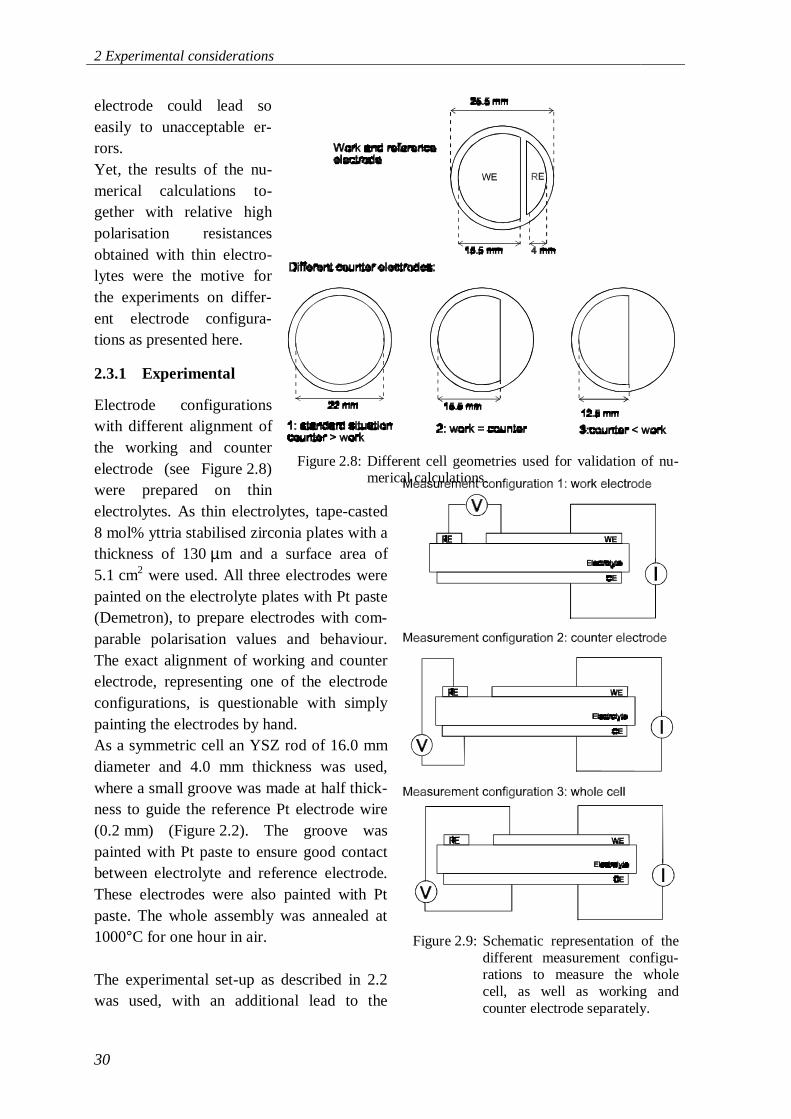
2 Experimental considerations
30
electrode could lead soeasily to unacceptable er-rors.Yet, the results of the nu-merical calculations to-gether with relative highpolarisation resistancesobtained with thin electro-lytes were the motive forthe experiments on differ-ent electrode configura-tions as presented here.
2.3.1 Experimental
Electrode configurationswith different alignment ofthe working and counterelectrode (see Figure 2.8)were prepared on thinelectrolytes. As thin electrolytes, tape-casted8 mol% yttria stabilised zirconia plates with athickness of 130 µm and a surface area of5.1 cm2 were used. All three electrodes werepainted on the electrolyte plates with Pt paste(Demetron), to prepare electrodes with com-parable polarisation values and behaviour.The exact alignment of working and counterelectrode, representing one of the electrodeconfigurations, is questionable with simplypainting the electrodes by hand.As a symmetric cell an YSZ rod of 16.0 mmdiameter and 4.0 mm thickness was used,where a small groove was made at half thick-ness to guide the reference Pt electrode wire(0.2 mm) (Figure 2.2). The groove waspainted with Pt paste to ensure good contactbetween electrolyte and reference electrode.These electrodes were also painted with Ptpaste. The whole assembly was annealed at1000°C for one hour in air.
The experimental set-up as described in 2.2was used, with an additional lead to the
Figure 2.8: Different cell geometries used for validation of nu-merical calculations.
Figure 2.9: Schematic representation of thedifferent measurement configu-rations to measure the wholecell, as well as working andcounter electrode separately.

2.3 Sample choice in view of geometric requirements for the electrode configuration
31
counter electrode to monitor the potential of this electrode.Impedance measurements were performed on the working electrode, but also on the coun-ter electrode and the whole cell (see Figure 2.9). This type of experiment should provideinformation about the equipotential line that is probed by the reference electrode. Allmeasurements were performed in air at 850°C.
For comparison additional experiments on nickel and cermet electrodes on thin asymmetricas well as thick symmetric cells are presented. These measurements are performed in a hy-drogen atmosphere with 2.3% water at 850°C and are part of the hydrogen oxidation studyon nickel and cermet electrodes as described in this thesis.
2.3.2 Results
Impedance spectra obtained for the working and counter electrode and the whole cell, forthe different electrode geometries are given in Figure 2.10 to Figure 2.13. A survey of thehigh and low frequency intercepts of the impedance arc is given in Table 2.1.Let us consider the results for electrode configuration 1 as given in Figure 2.10.In principle, there exists a large misalignment between working and counter electrode forthis configuration. Calculations predict a large error for the measured polarisation resis-tance of the working electrode. As seen in Figure 2.10 a polarisation resistance of 23.7 Ω isfound for the working electrode. For the whole cell a value of 57 Ω is found. The differ-ence between these two values should be equal to the polarisation resistance of the counterelectrode. Hence a value of 33.3 Ω is expected, but a value of only 0.8 Ω is measured. Ifthe working electrode is measured again, after measuring the counter electrode, this valueis reduced to 3.4 Ω. These results suggest that it is not possible to measure an accuratevalue for the counter electrode and that measuring of this counter electrode has a large ef-fect on the whole cell. For electrode configuration 2 and 3 the same kind of behaviour isobserved. For these configurations it did not seem possible to measure the working elec-trode. The results of the impedance measurements performed on the symmetric cell showthat independent measurement of the performance of the working and counter electrode ispossible with a reference electrode (Figure 2.13).
2.3.3 Discussion
Results as presented in section 2.3.2 indicate that problems do arise for thin electrolyteswith misaligned electrodes if the polarisation resistance of the working as well as thecounter electrode have to be measured. The smallest electrode can be encountered as the‘problem’ electrode, meaning that impedance measurements on this electrode cannot beperformed without affecting the performance of the whole cell. Measurement results asgiven in section 2.3.2 can be explained by assuming that the equipotential line measured bythe reference electrode changes with frequency (the measured resistance changes with fre-quency and therefore also the current distribution) and intersects the electrolyte/electrodeinterface (as predicted by calculations 0). If for electrode configuration 1, at a certain fre-quency, the equipotential line measured by the reference electrode does intercept the elec-trode/electrolyte interface of the counter electrode the potential of the reference electrode
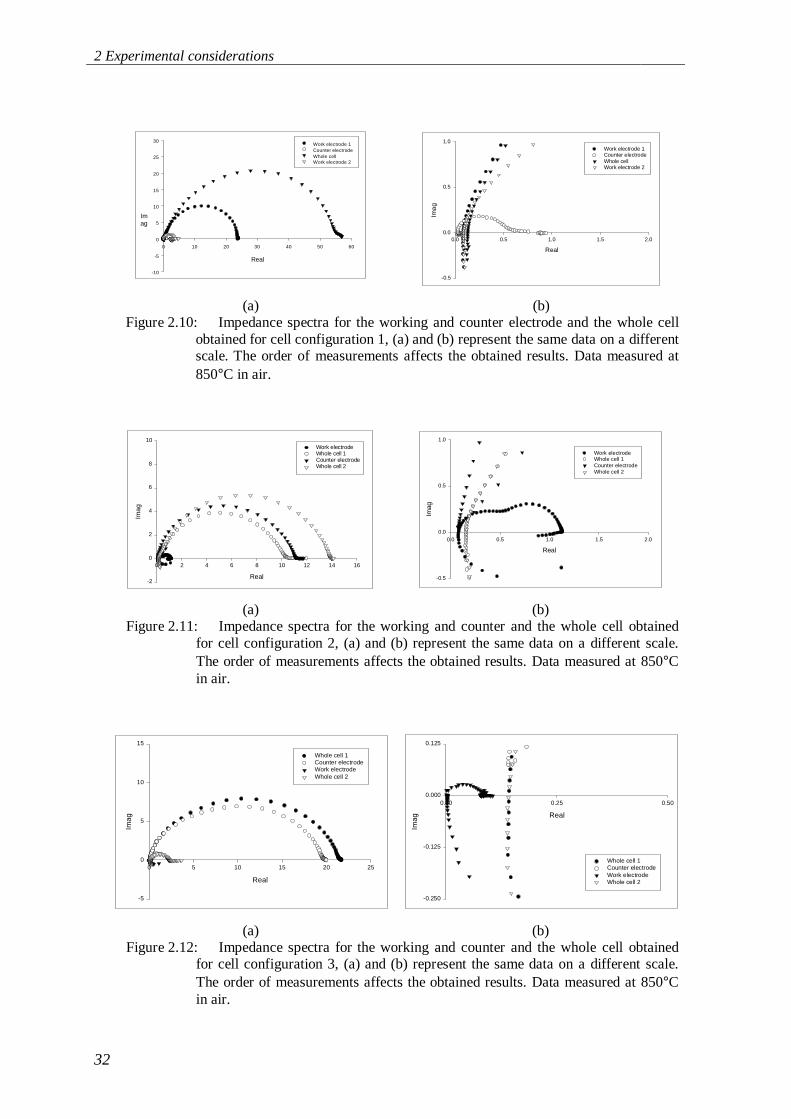
2 Experimental considerations
32
Real
0 10 20 30 40 50 60
Imag
-10
-5
0
5
10
15
20
25
30Work electrode 1Counter electrodeWhole cellWork electrode 2
Real
0.0 0.5 1.0 1.5 2.0
Ima
g
-0.5
0.0
0.5
1.0Work electrode 1Counter electrodeWhole cellWork electrode 2
(a) (b)Figure 2.10: Impedance spectra for the working and counter electrode and the whole cell
obtained for cell configuration 1, (a) and (b) represent the same data on a differentscale. The order of measurements affects the obtained results. Data measured at850°C in air.
Real
0 2 4 6 8 10 12 14 16
Imag
-2
0
2
4
6
8
10Work electrodeWhole cell 1Counter electrodeWhole cell 2
Real
0.0 0.5 1.0 1.5 2.0
Imag
-0.5
0.0
0.5
1.0
Work electrodeWhole cell 1Counter electrodeWhole cell 2
(a) (b)Figure 2.11: Impedance spectra for the working and counter and the whole cell obtained
for cell configuration 2, (a) and (b) represent the same data on a different scale.The order of measurements affects the obtained results. Data measured at 850°Cin air.
Real
0 5 10 15 20 25
Imag
-5
0
5
10
15
Whole cell 1Counter electrodeWork electrodeWhole cell 2
Real
0.00 0.25 0.50
Imag
-0.250
-0.125
0.000
0.125
Whole cell 1Counter electrodeWork electrodeWhole cell 2
(a) (b)Figure 2.12: Impedance spectra for the working and counter and the whole cell obtained
for cell configuration 3, (a) and (b) represent the same data on a different scale.The order of measurements affects the obtained results. Data measured at 850°Cin air.
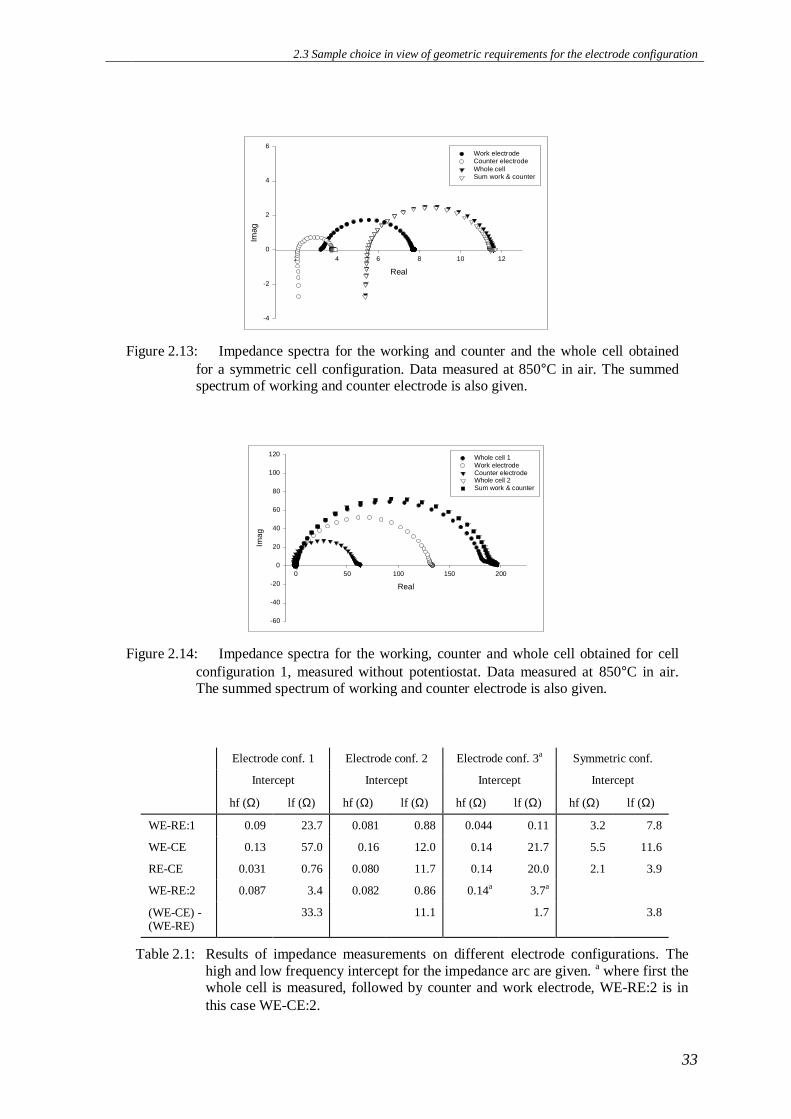
2.3 Sample choice in view of geometric requirements for the electrode configuration
33
Real
2 4 6 8 10 12Im
ag
-4
-2
0
2
4
6Work electrodeCounter electrodeWhole cellSum work & counter
Figure 2.13: Impedance spectra for the working and counter and the whole cell obtainedfor a symmetric cell configuration. Data measured at 850°C in air. The summedspectrum of working and counter electrode is also given.
Real
0 50 100 150 200
Imag
-60
-40
-20
0
20
40
60
80
100
120 Whole cell 1Work electrodeCounter electrodeWhole cell 2Sum work & counter
Figure 2.14: Impedance spectra for the working, counter and whole cell obtained for cellconfiguration 1, measured without potentiostat. Data measured at 850°C in air.The summed spectrum of working and counter electrode is also given.
Electrode conf. 1 Electrode conf. 2 Electrode conf. 3a Symmetric conf.
Intercept Intercept Intercept Intercept
hf (Ω) lf (Ω) hf (Ω) lf (Ω) hf (Ω) lf (Ω) hf (Ω) lf (Ω)
WE-RE:1 0.09 23.7 0.081 0.88 0.044 0.11 3.2 7.8
WE-CE 0.13 57.0 0.16 12.0 0.14 21.7 5.5 11.6
RE-CE 0.031 0.76 0.080 11.7 0.14 20.0 2.1 3.9
WE-RE:2 0.087 3.4 0.082 0.86 0.14a 3.7a
(WE-CE) -(WE-RE)
33.3 11.1 1.7 3.8
Table 2.1: Results of impedance measurements on different electrode configurations. Thehigh and low frequency intercept for the impedance arc are given. a where first thewhole cell is measured, followed by counter and work electrode, WE-RE:2 is inthis case WE-CE:2.
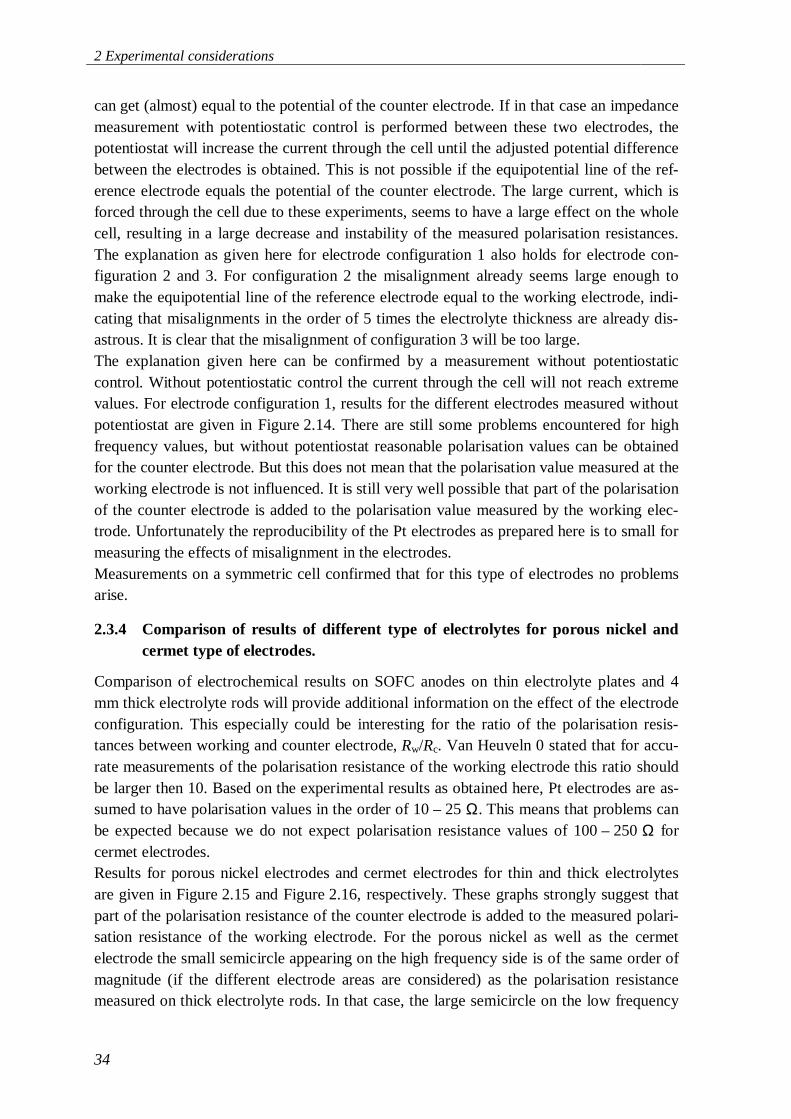
2 Experimental considerations
34
can get (almost) equal to the potential of the counter electrode. If in that case an impedancemeasurement with potentiostatic control is performed between these two electrodes, thepotentiostat will increase the current through the cell until the adjusted potential differencebetween the electrodes is obtained. This is not possible if the equipotential line of the ref-erence electrode equals the potential of the counter electrode. The large current, which isforced through the cell due to these experiments, seems to have a large effect on the wholecell, resulting in a large decrease and instability of the measured polarisation resistances.The explanation as given here for electrode configuration 1 also holds for electrode con-figuration 2 and 3. For configuration 2 the misalignment already seems large enough tomake the equipotential line of the reference electrode equal to the working electrode, indi-cating that misalignments in the order of 5 times the electrolyte thickness are already dis-astrous. It is clear that the misalignment of configuration 3 will be too large.The explanation given here can be confirmed by a measurement without potentiostaticcontrol. Without potentiostatic control the current through the cell will not reach extremevalues. For electrode configuration 1, results for the different electrodes measured withoutpotentiostat are given in Figure 2.14. There are still some problems encountered for highfrequency values, but without potentiostat reasonable polarisation values can be obtainedfor the counter electrode. But this does not mean that the polarisation value measured at theworking electrode is not influenced. It is still very well possible that part of the polarisationof the counter electrode is added to the polarisation value measured by the working elec-trode. Unfortunately the reproducibility of the Pt electrodes as prepared here is to small formeasuring the effects of misalignment in the electrodes.Measurements on a symmetric cell confirmed that for this type of electrodes no problemsarise.
2.3.4 Comparison of results of different type of electrolytes for porous nickel andcermet type of electrodes.
Comparison of electrochemical results on SOFC anodes on thin electrolyte plates and 4mm thick electrolyte rods will provide additional information on the effect of the electrodeconfiguration. This especially could be interesting for the ratio of the polarisation resis-tances between working and counter electrode, Rw/Rc. Van Heuveln 0 stated that for accu-rate measurements of the polarisation resistance of the working electrode this ratio shouldbe larger then 10. Based on the experimental results as obtained here, Pt electrodes are as-sumed to have polarisation values in the order of 10 – 25 Ω. This means that problems canbe expected because we do not expect polarisation resistance values of 100 – 250 Ω forcermet electrodes.Results for porous nickel electrodes and cermet electrodes for thin and thick electrolytesare given in Figure 2.15 and Figure 2.16, respectively. These graphs strongly suggest thatpart of the polarisation resistance of the counter electrode is added to the measured polari-sation resistance of the working electrode. For the porous nickel as well as the cermetelectrode the small semicircle appearing on the high frequency side is of the same order ofmagnitude (if the different electrode areas are considered) as the polarisation resistancemeasured on thick electrolyte rods. In that case, the large semicircle on the low frequency

2.3 Sample choice in view of geometric requirements for the electrode configuration
35
side is caused by misalignment of the working and counter electrode. This causes errors inthe order of 100% for the nickel electrode and 400% for the cermet electrode.
2.3.5 Conclusions
Validation of the numerical calculations on the used electrode configuration for a thinelectrode is not straightforward. Besides the electrode geometry the measurement methodinfluences the results. Strong evidence is found for the idea that the equipotential line ofthe reference electrode probes part of the counter or working electrode depending on thealignment of these electrodes. It is possible that the actual alignment and the ratio betweenthe polarisation resistances of the working and counter electrodes influence the size of theactual error in the polarisation. However, considering preparation techniques of the elec-trodes and expected uncertainty in polarisation resistances of, for example Pt paint elec-trodes, the asymmetric electrode configuration on a thin electrolyte is in our opinion notsuitable for kinetic studies on electrode reactions. For the symmetric cell design(Figure 2.2) the numerical calculations did not predict errors in measured polarisation re-sistances of the electrodes, which was confirmed by our experiments. Therefore it was de-cided to perform all electrochemical measurements on these thick electrolytes in a symmet-
Real
0 5 10 15 20 25 30
Ima
g
-5
0
5
10
15
Real
0 2 4 6 8 10 12 14 16 18
Imag
-4
-2
0
2
4
6
8
10
(a) (b)Figure 2.15: Impedance spectra obtained for porous nickel electrodes on (a) thin electrolyte
plates and (b) 4 mm thick electrolyte rods. Measurements were performed underH2 atmosphere with 2.3% H2O at 850°C.
Real
0 2 4 6 8 10 12
Imag
-2
-1
0
1
2
3
4
5
6Cermet on thin electrolyte
Real
0 10 20 30 40
Imag
-10
-5
0
5
10
15
20
Work electrodeCounter electrodeWhole cellSum work & counter
(a) (b)Figure 2.16: Impedance spectra obtained for nickel/YSZ cermet electrodes on (a) thin
electrolyte plates and (b) 4 mm thick electrolyte rods. Measurements were per-formed under H2 atmosphere with 2.3% H2O at 850°C.
2 Experimental considerations
36
ric electrode configuration, realising that thick electrolytes have disadvantages like a largeuncompensated resistance between working and counter electrode.
References
[1] Test Point, Capital Equipment Corp.Zplot W, ‘Data acquisition of impedance, gain phase and group delay measurements’, Scribner Associates and Solartron
Instruments Ltd.M. Nagata, Y. Itoh and H. Iwahara, ‘Dependence of Observed Overvoltages on the Positioning of the Reference Elec-
trode on the Electrolyte”, Solid State Ionics, 67, 215-24, 1994.F.H. van Heuveln, F.P.F. van Berkel, and J.P.P. Huijsmans, ‘Electrochemical Characterisation of Porous Electrodes and
Applications in SOFC, Proc of the 14th Risø Int. Symp. on materials science, High Temp. electrochemical behav-iour of fast ion and mixed conductors, pp 75-84, 1993.
G. Hsieh, T.O. Mason, E.J. Garboczi, L.R. Pederson, ‘Experimental limitations in impedance spectroscopy: Part III. Ef-fect of the reference electrode geometry/position’, Solid State Ionics, 96, 153-72, 1997.
J. Winkler, P.V. Hendriksen, N. Bonanos, and M. Mogensen, ‘Geometric requirements of Solid Electrolyte Cells with aReference Electrode’, J. Electrochem. Soc. 145, 1184-94, 1998.
G. Reinhardt and W. Göpel, ‘Electrode reactions at Solid Electrolytes: Finite Difference Calculations to describe Geo-metric and Electrical Properties of Planar Devices’, Proc. of the Third Int. Symp. on: Ionic and Mixed ConductingCeramics’, Proc. Vol. 97-24, pp 610-30, 1997.
F.H. van Heuveln, ‘Characterisation of porous cathodes for application in solid oxide fuel cells’, thesis, University ofTwente, 1997.
37
3 Hydrogen oxidation at nickel pattern electrodeson yttria-stabilised zirconia
Abstract
Nickel pattern electrodes were prepared by lithographic techniques. Different patterns wereprepared by varying the width of and the distance between adjacent nickel stripes. Imped-ance and polarisation measurements were used for characterisation. Despite some graingrowth during these experiments, the patterned layers remained dense and showed goodadherence to the zirconia electrolyte. With changes in the microstructure comes variationof the total electrode resistance, which suggests that the performance of the pattern elec-trodes scales with the available length of the nickel perimeter. Current passage seems tocause positive effects on the performance.
3.1 Introduction
Ni/YSZ cermet is the state of the art material for the anode of the Solid Oxide Fuel Cell(SOFC) [1]0. The cermet consists of an electronic conducting phase (nickel), an ionic con-ducting phase (YSZ) and sufficient porosity to enable mass transport via the gas phase to(and from) the active areas when used as an anode. The microstructure is complex and hasa large influence on the electrochemical performance 00000. It is therefore an importanttopic for research aiming at a further improvement of the performance of the Ni/YSZ an-ode. Such considerations may however underestimate the role which might be played bythe reaction mechanism in determining the overall performance. The microstructure of thecermet electrodes is hard to quantify in measurable parameters. The cermet structure there-fore does not seem to be the most obvious choice for studying the anodic reaction mecha-nism. The less complicated geometries of nickel electrodes, e.g. nickel point 000, litho-graphically prepared porous nickel layers 0 and pattern electrodes 00000 offer better start-ing points for research, but comparison of these results is not straightforward because ofthe different measurement conditions employed in the different studies cited.The present work can be regarded as the first of a series of studies on hydrogen oxidationat different types of nickel and Ni/YSZ cermet electrodes, covering a large variety of elec-trode microstructures. By using the same measurement conditions for these electrodes abetter understanding of the anodic reaction mechanism and associated relation with the mi-crostructure is aimed at. In this study nickel pattern electrodes are prepared with litho-
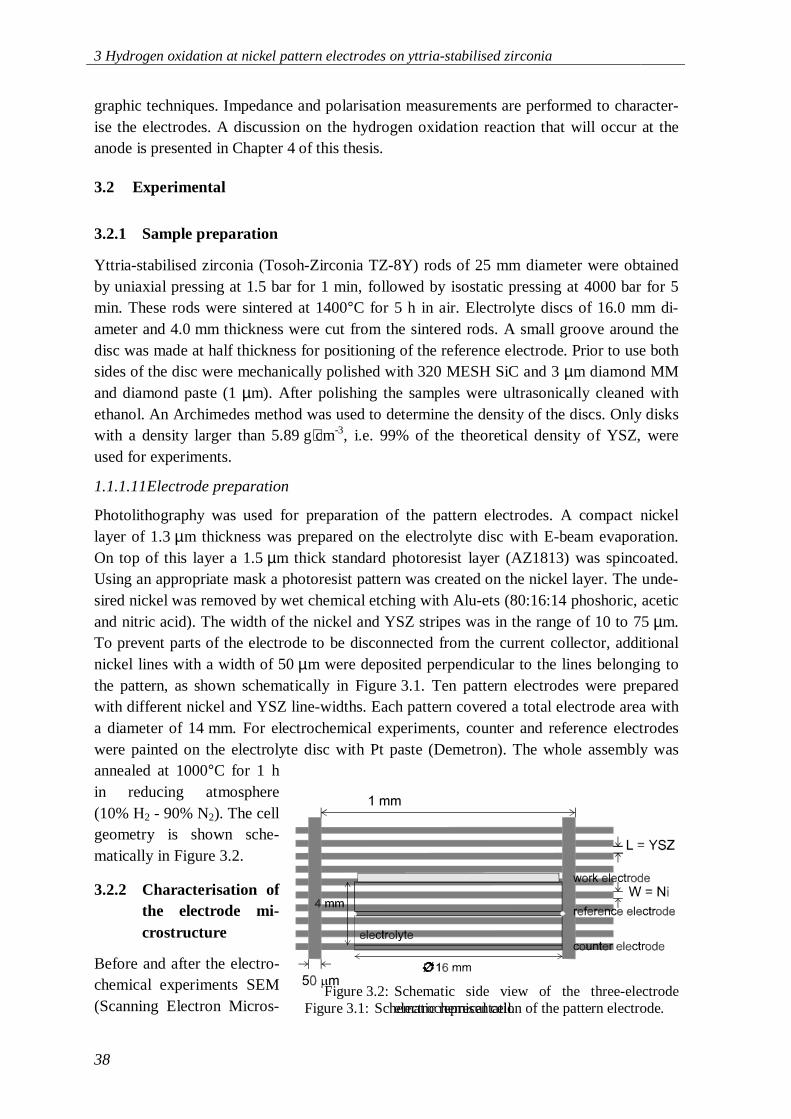
3 Hydrogen oxidation at nickel pattern electrodes on yttria-stabilised zirconia
38
graphic techniques. Impedance and polarisation measurements are performed to character-ise the electrodes. A discussion on the hydrogen oxidation reaction that will occur at theanode is presented in Chapter 4 of this thesis.
3.2 Experimental
3.2.1 Sample preparation
Yttria-stabilised zirconia (Tosoh-Zirconia TZ-8Y) rods of 25 mm diameter were obtainedby uniaxial pressing at 1.5 bar for 1 min, followed by isostatic pressing at 4000 bar for 5min. These rods were sintered at 1400°C for 5 h in air. Electrolyte discs of 16.0 mm di-ameter and 4.0 mm thickness were cut from the sintered rods. A small groove around thedisc was made at half thickness for positioning of the reference electrode. Prior to use bothsides of the disc were mechanically polished with 320 MESH SiC and 3 µm diamond MMand diamond paste (1 µm). After polishing the samples were ultrasonically cleaned withethanol. An Archimedes method was used to determine the density of the discs. Only diskswith a density larger than 5.89 g⋅cm-3, i.e. 99% of the theoretical density of YSZ, wereused for experiments.
1.1.1.11 Electrode preparation
Photolithography was used for preparation of the pattern electrodes. A compact nickellayer of 1.3 µm thickness was prepared on the electrolyte disc with E-beam evaporation.On top of this layer a 1.5 µm thick standard photoresist layer (AZ1813) was spincoated.Using an appropriate mask a photoresist pattern was created on the nickel layer. The unde-sired nickel was removed by wet chemical etching with Alu-ets (80:16:14 phoshoric, aceticand nitric acid). The width of the nickel and YSZ stripes was in the range of 10 to 75 µm.To prevent parts of the electrode to be disconnected from the current collector, additionalnickel lines with a width of 50 µm were deposited perpendicular to the lines belonging tothe pattern, as shown schematically in Figure 3.1. Ten pattern electrodes were preparedwith different nickel and YSZ line-widths. Each pattern covered a total electrode area witha diameter of 14 mm. For electrochemical experiments, counter and reference electrodeswere painted on the electrolyte disc with Pt paste (Demetron). The whole assembly wasannealed at 1000°C for 1 hin reducing atmosphere(10% H2 - 90% N2). The cellgeometry is shown sche-matically in Figure 3.2.
3.2.2 Characterisation ofthe electrode mi-crostructure
Before and after the electro-chemical experiments SEM(Scanning Electron Micros- Figure 3.1: Schematic representation of the pattern electrode.
Figure 3.2: Schematic side view of the three-electrodeelectrochemical cell.
3.2 Experimental
39
copy) micrographs of the nickel pattern electrodes were taken at different positions on thesurface. These were used to measure the width of both the nickel and YSZ stripes. To ac-count for grain growth at the edge of the nickel stripes and for measuring the grain size ofthe nickel particles, the SEM pictures were edited to black and white representations andtransferred into an image analysis system. The results enabled calculation of the total pe-rimeter of the nickel structure, the surface coverage of nickel, the nickel grain size and thegrain boundary length.
3.2.3 Electrochemical characterisation
Electrochemical experiments were performed in a single-gas environment at atmosphericpressure. At standard conditions a gas flow of 100 ml·min-1 H2 (STP) with 2.3% H2O at850°C was used. All gas flows were controlled by Brooks 5800E Mass Flow Controllers.Passing the gas mixture through a water bubbler system in a temperature bath controlledthe water vapour pressure.Impedance measurements were performed over frequencies ranging from 1 MHz to0.01 Hz using a Solartron Frequency Response Analyser 1255 in combination with a So-lartron Electrochemical Interface 1287. An excitation voltage of 10 mV (rms) was used toensure that measurements were performed in the linear regime. The impedance data wasanalysed using the computer program ‘Equivalent Circuit’ 0.The dc polarisation of the nickel pattern electrodes was studied using a Solartron Electro-chemical Interface 1287 for potentiostatic control. Overpotentials were corrected for theuncompensated resistance of the electrolyte, the value of which was evaluated from data ofimpedance spectroscopy.After heating the electrode to 850°C in a hydrogen atmosphere with 2.3% water vapour thefollowing experiments were conducted.• Impedance measurements under standard conditions until reproducibility of the data
was obtained.• I-η measurements under standard conditions. Prior to measurement the work electrode
was anodically biased at 500 mV for 30 min. After this the I-η curve was recorded bydecreasing the potential stepwise in cathodic direction.
• Impedance measurements under standard conditions.Next a number of electrodes were subjected to one or more of the following experiments:• Impedance measurements as a function of pH2 and pH2O. These were performed in the
pH2 range of 9.98⋅104 – 4.95⋅103 Pa with pH2O fixed at 2.33⋅103 Pa and a total gasflow of 100 ml⋅min-1. By increasing the total flow rate to 150 and 200 ml⋅min-1 the pH2
range was extended in the low pH2 range to 6.67⋅103 – 2.56⋅103 Pa. In the pH2O-range,measurements were performed from 6.03⋅102 – 3.08⋅104 Pa fixing pH2 8.11⋅104 Pa.Helium was used as the balancing gas.
• Impedance measurements under standard conditions, the electrode being anodicallypolarised at 50, 100, 150, 200, 250, 300, 400 and 500 mV relative to the referenceelectrode. Potential values given here are not corrected for the ohmic IR drop of theelectrolyte.
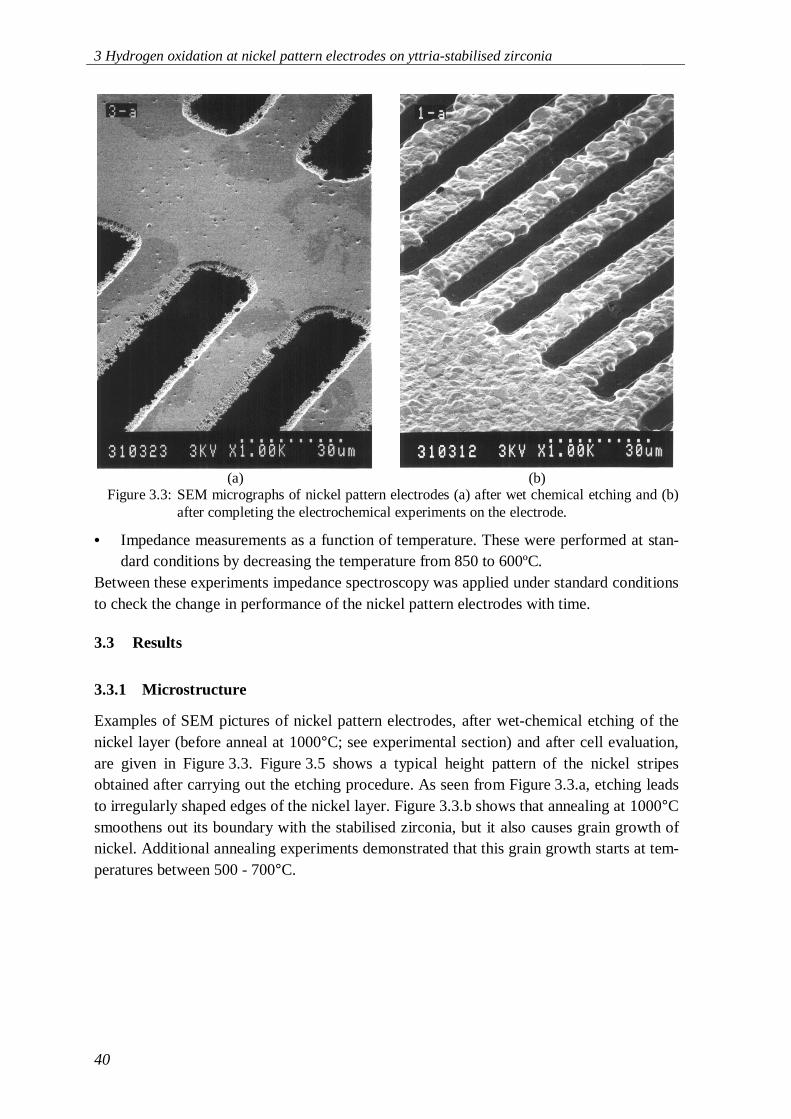
3 Hydrogen oxidation at nickel pattern electrodes on yttria-stabilised zirconia
40
• Impedance measurements as a function of temperature. These were performed at stan-dard conditions by decreasing the temperature from 850 to 600ºC.
Between these experiments impedance spectroscopy was applied under standard conditionsto check the change in performance of the nickel pattern electrodes with time.
3.3 Results
3.3.1 Microstructure
Examples of SEM pictures of nickel pattern electrodes, after wet-chemical etching of thenickel layer (before anneal at 1000°C; see experimental section) and after cell evaluation,are given in Figure 3.3. Figure 3.5 shows a typical height pattern of the nickel stripesobtained after carrying out the etching procedure. As seen from Figure 3.3.a, etching leadsto irregularly shaped edges of the nickel layer. Figure 3.3.b shows that annealing at 1000°Csmoothens out its boundary with the stabilised zirconia, but it also causes grain growth ofnickel. Additional annealing experiments demonstrated that this grain growth starts at tem-peratures between 500 - 700°C.
(a) (b)Figure 3.3: SEM micrographs of nickel pattern electrodes (a) after wet chemical etching and (b)
after completing the electrochemical experiments on the electrode.
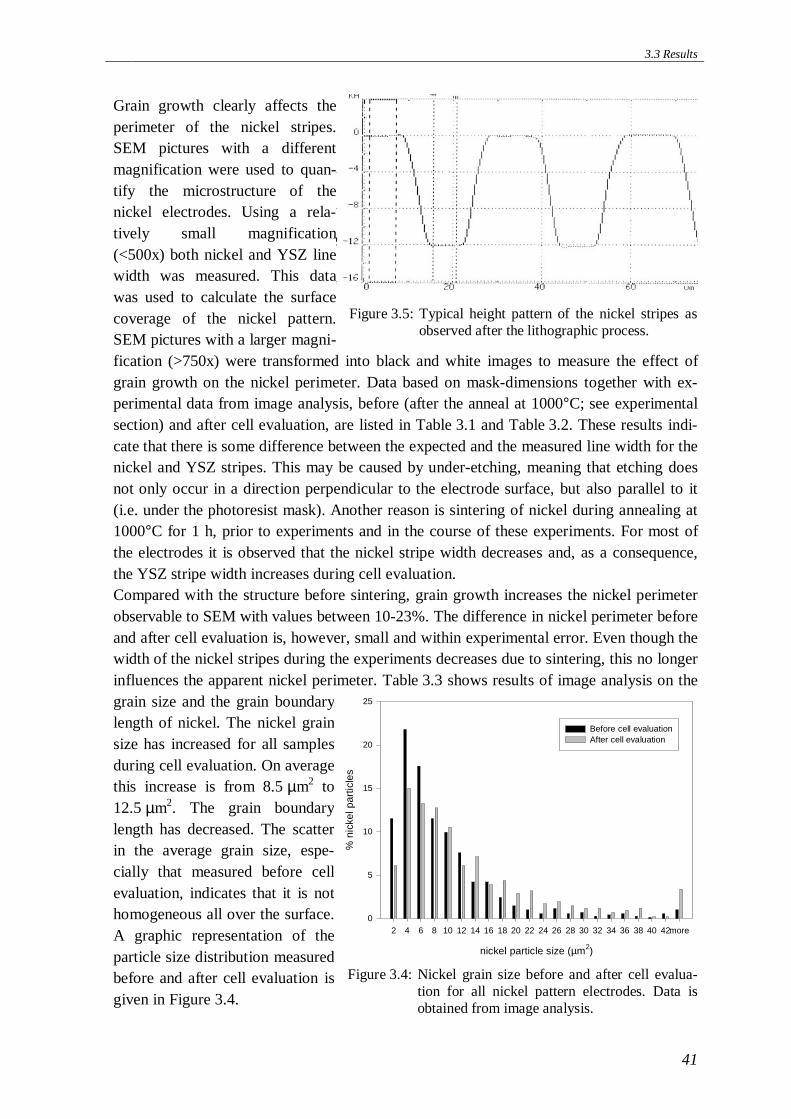
3.3 Results
41
Grain growth clearly affects theperimeter of the nickel stripes.SEM pictures with a differentmagnification were used to quan-tify the microstructure of thenickel electrodes. Using a rela-tively small magnification(<500x) both nickel and YSZ linewidth was measured. This datawas used to calculate the surfacecoverage of the nickel pattern.SEM pictures with a larger magni-fication (>750x) were transformed into black and white images to measure the effect ofgrain growth on the nickel perimeter. Data based on mask-dimensions together with ex-perimental data from image analysis, before (after the anneal at 1000°C; see experimentalsection) and after cell evaluation, are listed in Table 3.1 and Table 3.2. These results indi-cate that there is some difference between the expected and the measured line width for thenickel and YSZ stripes. This may be caused by under-etching, meaning that etching doesnot only occur in a direction perpendicular to the electrode surface, but also parallel to it(i.e. under the photoresist mask). Another reason is sintering of nickel during annealing at1000°C for 1 h, prior to experiments and in the course of these experiments. For most ofthe electrodes it is observed that the nickel stripe width decreases and, as a consequence,the YSZ stripe width increases during cell evaluation.Compared with the structure before sintering, grain growth increases the nickel perimeterobservable to SEM with values between 10-23%. The difference in nickel perimeter beforeand after cell evaluation is, however, small and within experimental error. Even though thewidth of the nickel stripes during the experiments decreases due to sintering, this no longerinfluences the apparent nickel perimeter. Table 3.3 shows results of image analysis on thegrain size and the grain boundarylength of nickel. The nickel grainsize has increased for all samplesduring cell evaluation. On averagethis increase is from 8.5 µm2 to12.5 µm2. The grain boundarylength has decreased. The scatterin the average grain size, espe-cially that measured before cellevaluation, indicates that it is nothomogeneous all over the surface.A graphic representation of theparticle size distribution measuredbefore and after cell evaluation isgiven in Figure 3.4.
nickel particle size (µm2)
2 4 6 8 10 12 14 16 18 20 22 24 26 28 30 32 34 36 38 40 42more
% n
icke
l par
ticle
s
0
5
10
15
20
25
Before cell evaluationAfter cell evaluation
Figure 3.4: Nickel grain size before and after cell evalua-tion for all nickel pattern electrodes. Data isobtained from image analysis.
Figure 3.5: Typical height pattern of the nickel stripes asobserved after the lithographic process.
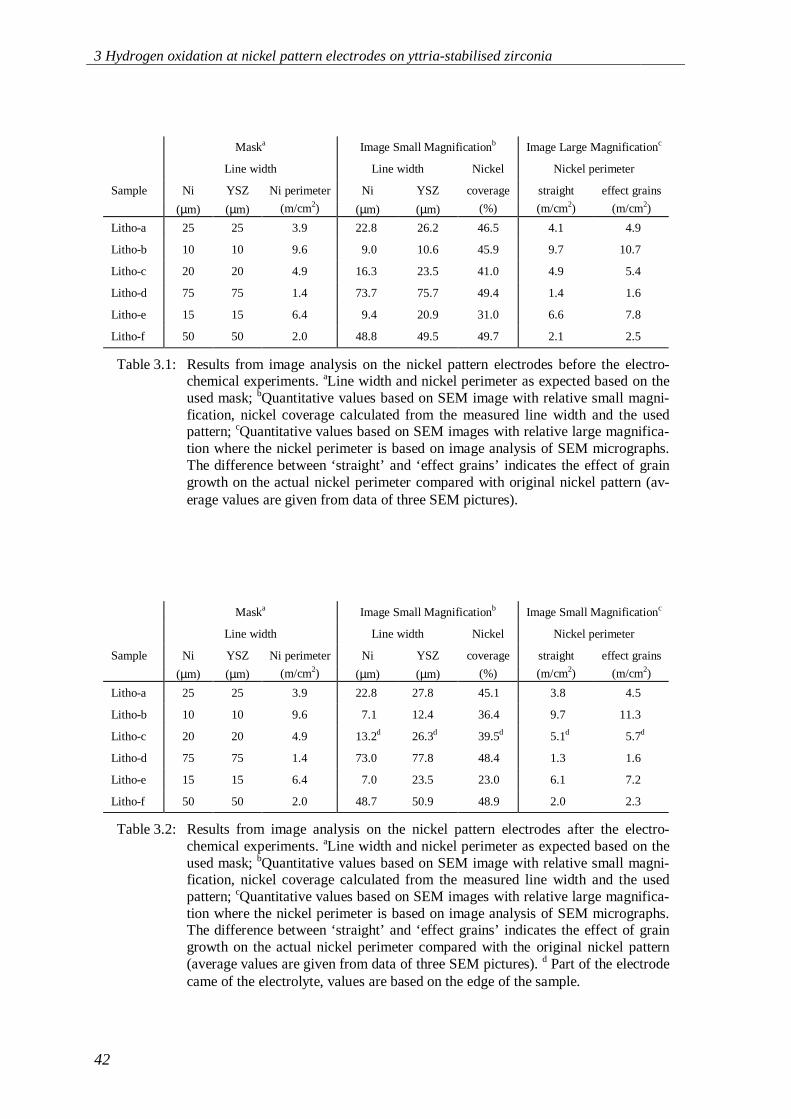
3 Hydrogen oxidation at nickel pattern electrodes on yttria-stabilised zirconia
42
Maska Image Small Magnificationb Image Large Magnificationc
Line width Line width Nickel Nickel perimeter
Sample Ni YSZ Ni perimeter Ni YSZ coverage straight effect grains
(µm) (µm) (m/cm2) (µm) (µm) (%) (m/cm2) (m/cm2)
Litho-a 25 25 3.9 22.8 26.2 46.5 4.1 4.9
Litho-b 10 10 9.6 9.0 10.6 45.9 9.7 10.7
Litho-c 20 20 4.9 16.3 23.5 41.0 4.9 5.4
Litho-d 75 75 1.4 73.7 75.7 49.4 1.4 1.6
Litho-e 15 15 6.4 9.4 20.9 31.0 6.6 7.8
Litho-f 50 50 2.0 48.8 49.5 49.7 2.1 2.5
Table 3.1: Results from image analysis on the nickel pattern electrodes before the electro-chemical experiments. aLine width and nickel perimeter as expected based on theused mask; bQuantitative values based on SEM image with relative small magni-fication, nickel coverage calculated from the measured line width and the usedpattern; cQuantitative values based on SEM images with relative large magnifica-tion where the nickel perimeter is based on image analysis of SEM micrographs.The difference between ‘straight’ and ‘effect grains’ indicates the effect of graingrowth on the actual nickel perimeter compared with original nickel pattern (av-erage values are given from data of three SEM pictures).
Maska Image Small Magnificationb Image Small Magnificationc
Line width Line width Nickel Nickel perimeter
Sample Ni YSZ Ni perimeter Ni YSZ coverage straight effect grains
(µm) (µm) (m/cm2) (µm) (µm) (%) (m/cm2) (m/cm2)
Litho-a 25 25 3.9 22.8 27.8 45.1 3.8 4.5
Litho-b 10 10 9.6 7.1 12.4 36.4 9.7 11.3
Litho-c 20 20 4.9 13.2d 26.3d 39.5d 5.1d 5.7d
Litho-d 75 75 1.4 73.0 77.8 48.4 1.3 1.6
Litho-e 15 15 6.4 7.0 23.5 23.0 6.1 7.2
Litho-f 50 50 2.0 48.7 50.9 48.9 2.0 2.3
Table 3.2: Results from image analysis on the nickel pattern electrodes after the electro-chemical experiments. aLine width and nickel perimeter as expected based on theused mask; bQuantitative values based on SEM image with relative small magni-fication, nickel coverage calculated from the measured line width and the usedpattern; cQuantitative values based on SEM images with relative large magnifica-tion where the nickel perimeter is based on image analysis of SEM micrographs.The difference between ‘straight’ and ‘effect grains’ indicates the effect of graingrowth on the actual nickel perimeter compared with the original nickel pattern(average values are given from data of three SEM pictures). d Part of the electrodecame of the electrolyte, values are based on the edge of the sample.
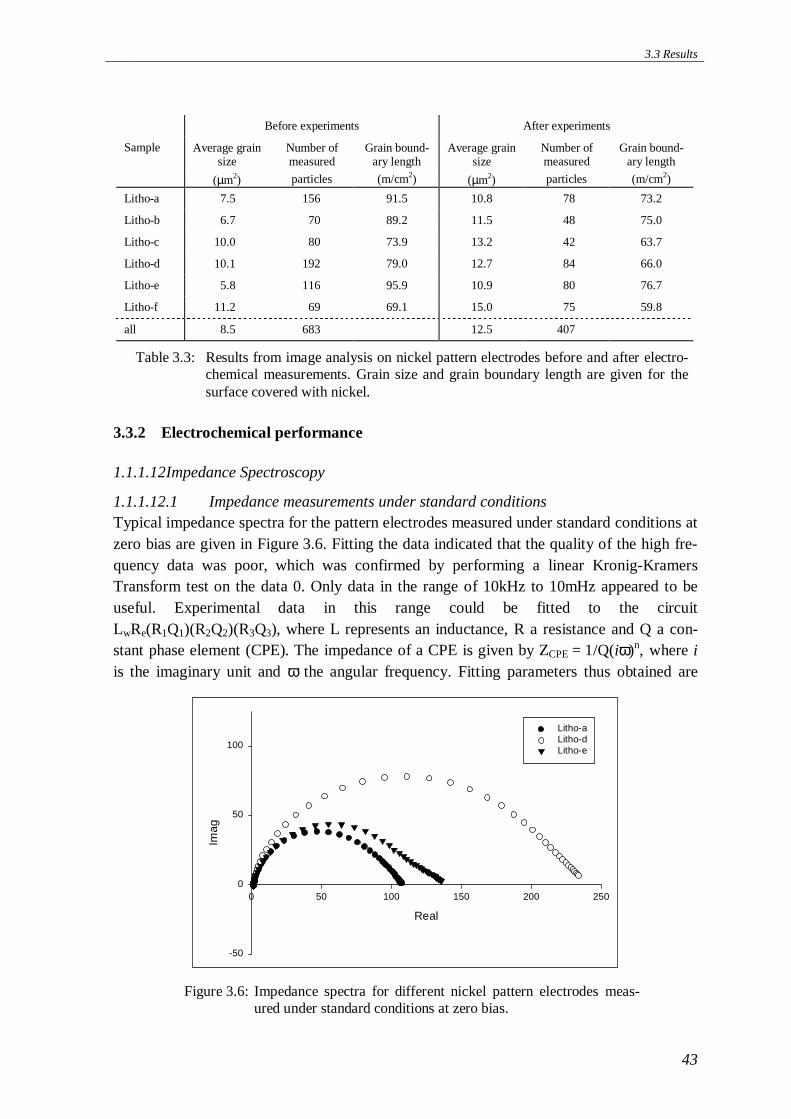
3.3 Results
43
3.3.2 Electrochemical performance
1.1.1.12 Impedance Spectroscopy
1.1.1.12.1 Impedance measurements under standard conditionsTypical impedance spectra for the pattern electrodes measured under standard conditions atzero bias are given in Figure 3.6. Fitting the data indicated that the quality of the high fre-quency data was poor, which was confirmed by performing a linear Kronig-KramersTransform test on the data 0. Only data in the range of 10kHz to 10mHz appeared to beuseful. Experimental data in this range could be fitted to the circuitLwRe(R1Q1)(R2Q2)(R3Q3), where L represents an inductance, R a resistance and Q a con-stant phase element (CPE). The impedance of a CPE is given by ZCPE = 1/Q(iω)n, where iis the imaginary unit and ω the angular frequency. Fitting parameters thus obtained are
Before experiments After experiments
Sample Average grainsize
Number ofmeasured
Grain bound-ary length
Average grainsize
Number ofmeasured
Grain bound-ary length
(µm2) particles (m/cm2) (µm2) particles (m/cm2)
Litho-a 7.5 156 91.5 10.8 78 73.2
Litho-b 6.7 70 89.2 11.5 48 75.0
Litho-c 10.0 80 73.9 13.2 42 63.7
Litho-d 10.1 192 79.0 12.7 84 66.0
Litho-e 5.8 116 95.9 10.9 80 76.7
Litho-f 11.2 69 69.1 15.0 75 59.8
all 8.5 683 12.5 407
Table 3.3: Results from image analysis on nickel pattern electrodes before and after electro-chemical measurements. Grain size and grain boundary length are given for thesurface covered with nickel.
Real
0 50 100 150 200 250
Imag
-50
0
50
100
Litho-aLitho-dLitho-e
Figure 3.6: Impedance spectra for different nickel pattern electrodes meas-ured under standard conditions at zero bias.
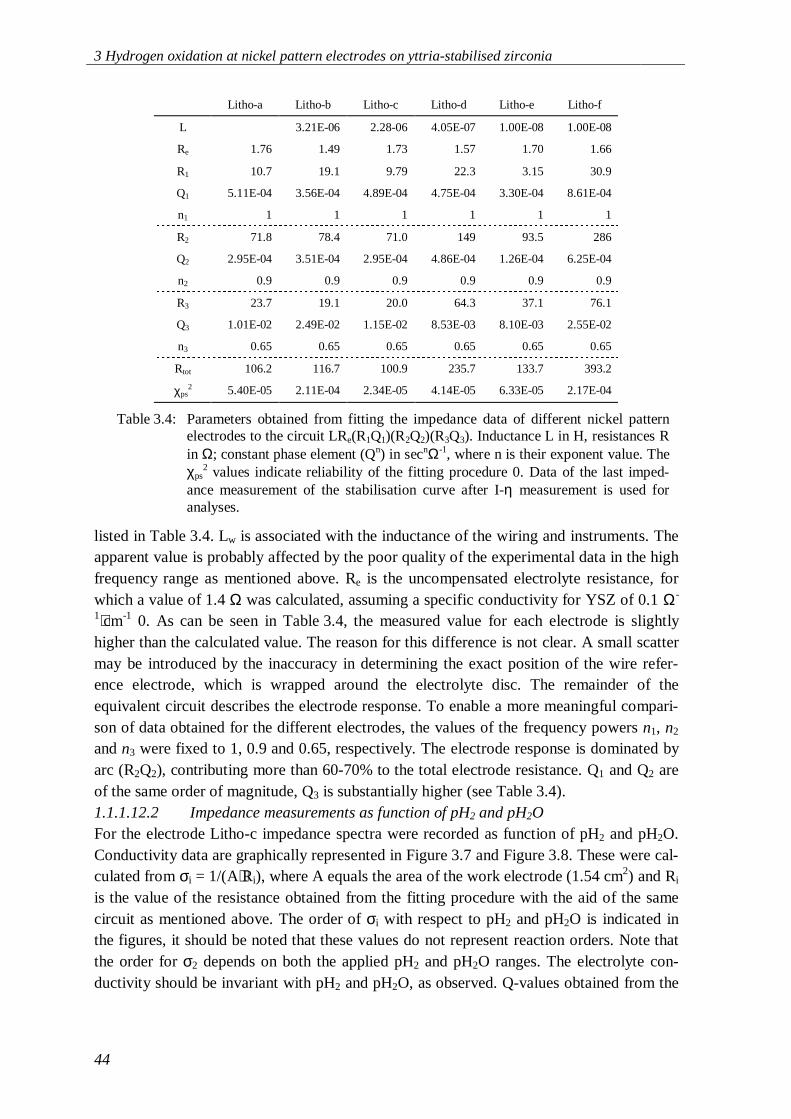
3 Hydrogen oxidation at nickel pattern electrodes on yttria-stabilised zirconia
44
listed in Table 3.4. Lw is associated with the inductance of the wiring and instruments. Theapparent value is probably affected by the poor quality of the experimental data in the highfrequency range as mentioned above. Re is the uncompensated electrolyte resistance, forwhich a value of 1.4 Ω was calculated, assuming a specific conductivity for YSZ of 0.1 Ω-
1⋅cm-1 0. As can be seen in Table 3.4, the measured value for each electrode is slightlyhigher than the calculated value. The reason for this difference is not clear. A small scattermay be introduced by the inaccuracy in determining the exact position of the wire refer-ence electrode, which is wrapped around the electrolyte disc. The remainder of theequivalent circuit describes the electrode response. To enable a more meaningful compari-son of data obtained for the different electrodes, the values of the frequency powers n1, n2
and n3 were fixed to 1, 0.9 and 0.65, respectively. The electrode response is dominated byarc (R2Q2), contributing more than 60-70% to the total electrode resistance. Q1 and Q2 areof the same order of magnitude, Q3 is substantially higher (see Table 3.4).1.1.1.12.2 Impedance measurements as function of pH2 and pH2OFor the electrode Litho-c impedance spectra were recorded as function of pH2 and pH2O.Conductivity data are graphically represented in Figure 3.7 and Figure 3.8. These were cal-culated from σi = 1/(A⋅Ri), where A equals the area of the work electrode (1.54 cm2) and Ri
is the value of the resistance obtained from the fitting procedure with the aid of the samecircuit as mentioned above. The order of σi with respect to pH2 and pH2O is indicated inthe figures, it should be noted that these values do not represent reaction orders. Note thatthe order for σ2 depends on both the applied pH2 and pH2O ranges. The electrolyte con-ductivity should be invariant with pH2 and pH2O, as observed. Q-values obtained from the
Litho-a Litho-b Litho-c Litho-d Litho-e Litho-f
L 3.21E-06 2.28-06 4.05E-07 1.00E-08 1.00E-08
Re 1.76 1.49 1.73 1.57 1.70 1.66
R1 10.7 19.1 9.79 22.3 3.15 30.9
Q1 5.11E-04 3.56E-04 4.89E-04 4.75E-04 3.30E-04 8.61E-04
n1 1 1 1 1 1 1
R2 71.8 78.4 71.0 149 93.5 286
Q2 2.95E-04 3.51E-04 2.95E-04 4.86E-04 1.26E-04 6.25E-04
n2 0.9 0.9 0.9 0.9 0.9 0.9
R3 23.7 19.1 20.0 64.3 37.1 76.1
Q3 1.01E-02 2.49E-02 1.15E-02 8.53E-03 8.10E-03 2.55E-02
n3 0.65 0.65 0.65 0.65 0.65 0.65
Rtot 106.2 116.7 100.9 235.7 133.7 393.2
χps2 5.40E-05 2.11E-04 2.34E-05 4.14E-05 6.33E-05 2.17E-04
Table 3.4: Parameters obtained from fitting the impedance data of different nickel patternelectrodes to the circuit LRe(R1Q1)(R2Q2)(R3Q3). Inductance L in H, resistances Rin Ω; constant phase element (Qn) in secnΩ-1, where n is their exponent value. Theχps
2 values indicate reliability of the fitting procedure 0. Data of the last imped-ance measurement of the stabilisation curve after I-η measurement is used foranalyses.

3.3 Results
45
fitting procedure are plotted as function of pH2 and pH2O in Figure 3.9 and Figure 3.10,respectively.
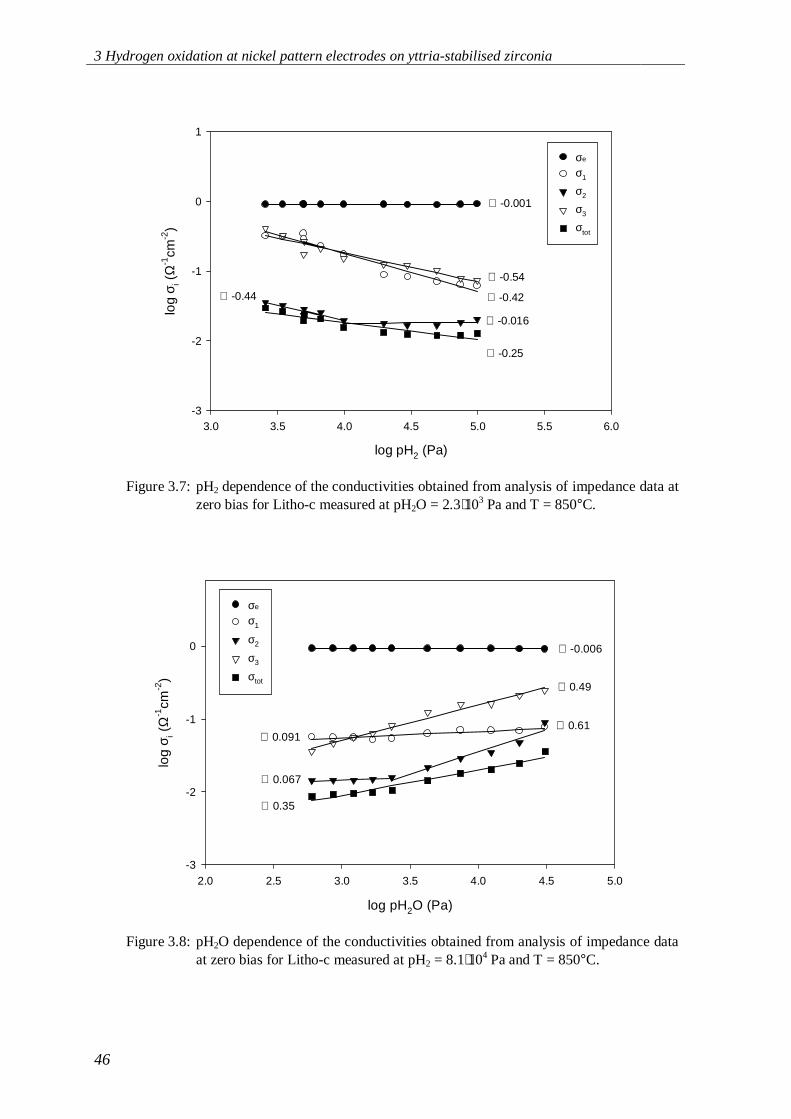
3 Hydrogen oxidation at nickel pattern electrodes on yttria-stabilised zirconia
46
log pH2 (Pa)
3.0 3.5 4.0 4.5 5.0 5.5 6.0
log
σ i (Ω
-1cm
-2)
-3
-2
-1
0
1
σe
σ1
σ2
σ3
σtot
∠ -0.001
∠ -0.54
∠ -0.42
∠ -0.016
∠ -0.25
∠ -0.44
Figure 3.7: pH2 dependence of the conductivities obtained from analysis of impedance data atzero bias for Litho-c measured at pH2O = 2.3⋅103 Pa and T = 850°C.
log pH2O (Pa)
2.0 2.5 3.0 3.5 4.0 4.5 5.0
log
σ i (Ω
-1cm
-2)
-3
-2
-1
0
σe
σ1
σ2
σ3
σtot
∠ -0.006
∠ 0.49
∠ 0.091∠ 0.61
∠ 0.35
∠ 0.067
Figure 3.8: pH2O dependence of the conductivities obtained from analysis of impedance dataat zero bias for Litho-c measured at pH2 = 8.1⋅104 Pa and T = 850°C.
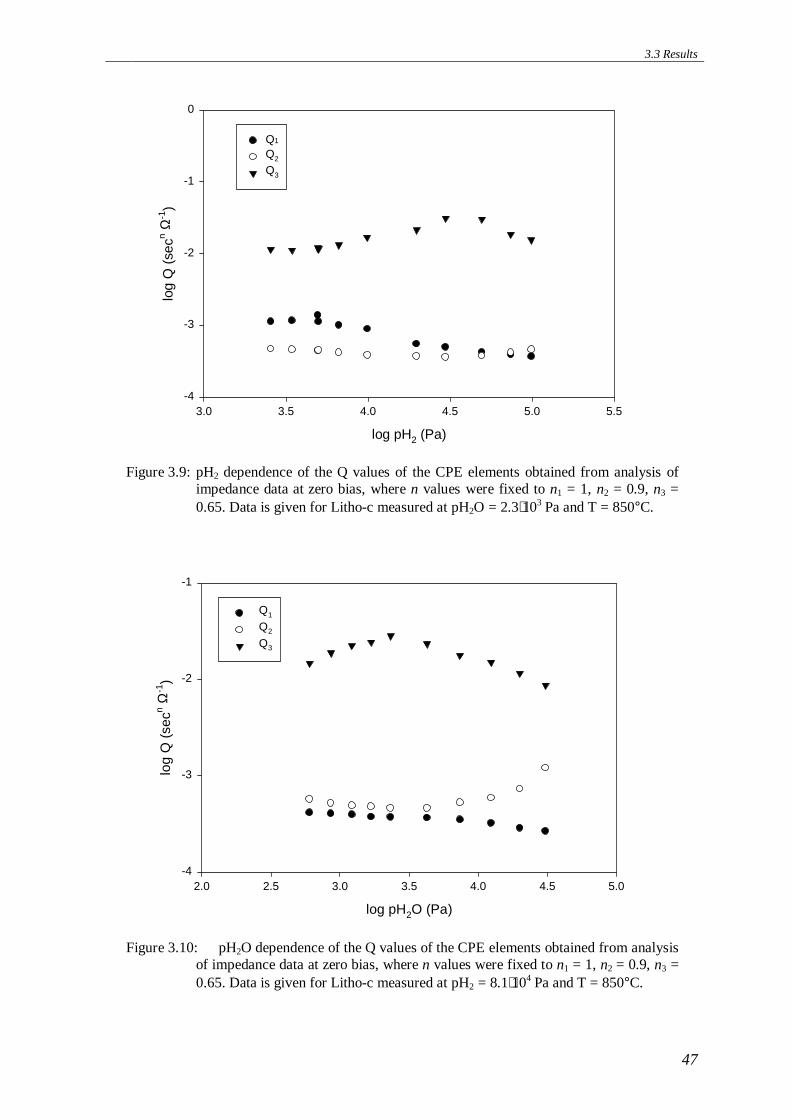
3.3 Results
47
log pH2 (Pa)
3.0 3.5 4.0 4.5 5.0 5.5
log
Q (
secn Ω
-1)
-4
-3
-2
-1
0
Q1
Q2
Q3
Figure 3.9: pH2 dependence of the Q values of the CPE elements obtained from analysis ofimpedance data at zero bias, where n values were fixed to n1 = 1, n2 = 0.9, n3 =0.65. Data is given for Litho-c measured at pH2O = 2.3⋅103 Pa and T = 850°C.
log pH2O (Pa)
2.0 2.5 3.0 3.5 4.0 4.5 5.0
log
Q (
secn Ω
-1)
-4
-3
-2
-1
Q1
Q2
Q3
Figure 3.10: pH2O dependence of the Q values of the CPE elements obtained from analysisof impedance data at zero bias, where n values were fixed to n1 = 1, n2 = 0.9, n3 =0.65. Data is given for Litho-c measured at pH2 = 8.1⋅104 Pa and T = 850°C.
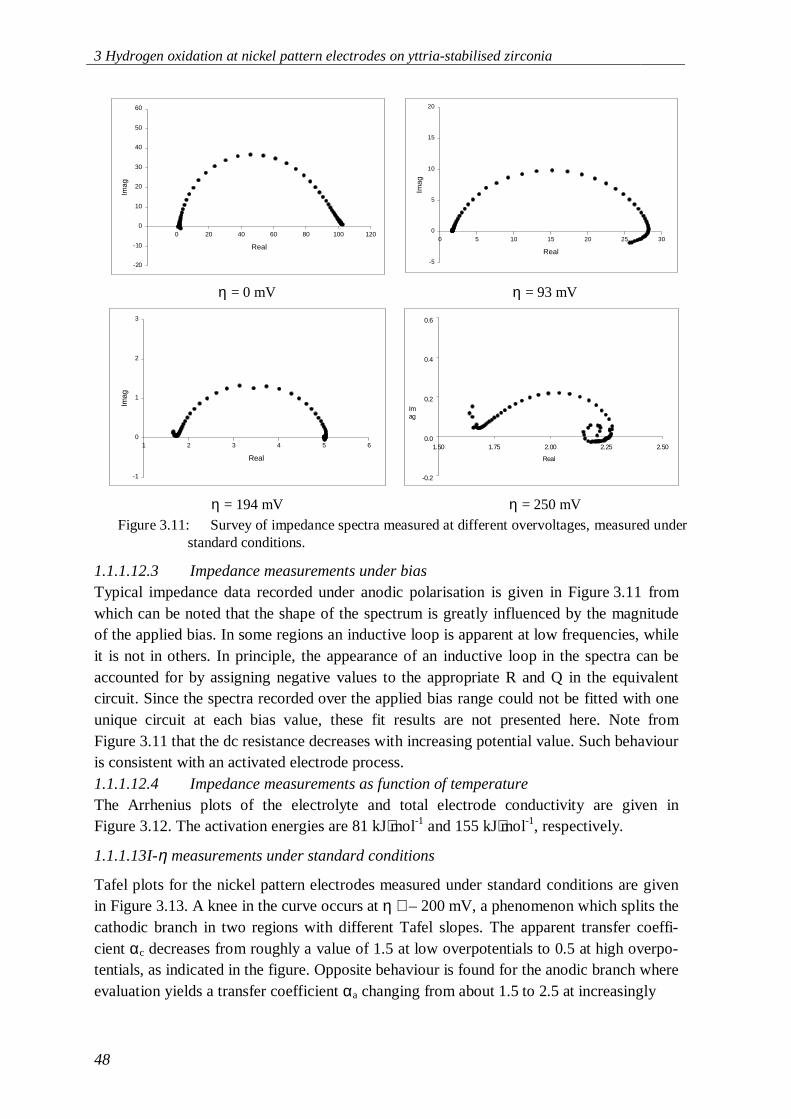
3 Hydrogen oxidation at nickel pattern electrodes on yttria-stabilised zirconia
48
1.1.1.12.3 Impedance measurements under biasTypical impedance data recorded under anodic polarisation is given in Figure 3.11 fromwhich can be noted that the shape of the spectrum is greatly influenced by the magnitudeof the applied bias. In some regions an inductive loop is apparent at low frequencies, whileit is not in others. In principle, the appearance of an inductive loop in the spectra can beaccounted for by assigning negative values to the appropriate R and Q in the equivalentcircuit. Since the spectra recorded over the applied bias range could not be fitted with oneunique circuit at each bias value, these fit results are not presented here. Note fromFigure 3.11 that the dc resistance decreases with increasing potential value. Such behaviouris consistent with an activated electrode process.1.1.1.12.4 Impedance measurements as function of temperatureThe Arrhenius plots of the electrolyte and total electrode conductivity are given inFigure 3.12. The activation energies are 81 kJ⋅mol-1 and 155 kJ⋅mol-1, respectively.
1.1.1.13 I-η measurements under standard conditions
Tafel plots for the nickel pattern electrodes measured under standard conditions are givenin Figure 3.13. A knee in the curve occurs at η ≅ – 200 mV, a phenomenon which splits thecathodic branch in two regions with different Tafel slopes. The apparent transfer coeffi-cient αc decreases from roughly a value of 1.5 at low overpotentials to 0.5 at high overpo-tentials, as indicated in the figure. Opposite behaviour is found for the anodic branch whereevaluation yields a transfer coefficient αa changing from about 1.5 to 2.5 at increasingly
Real
0 20 40 60 80 100 120
Imag
-20
-10
0
10
20
30
40
50
60
Real
0 5 10 15 20 25 30
Imag
-5
0
5
10
15
20
η = 0 mV η = 93 mV
Real
1 2 3 4 5 6
Imag
-1
0
1
2
3
Real
1.50 1.75 2.00 2.25 2.50
Imag
-0.2
0.0
0.2
0.4
0.6
η = 194 mV η = 250 mVFigure 3.11: Survey of impedance spectra measured at different overvoltages, measured under
standard conditions.
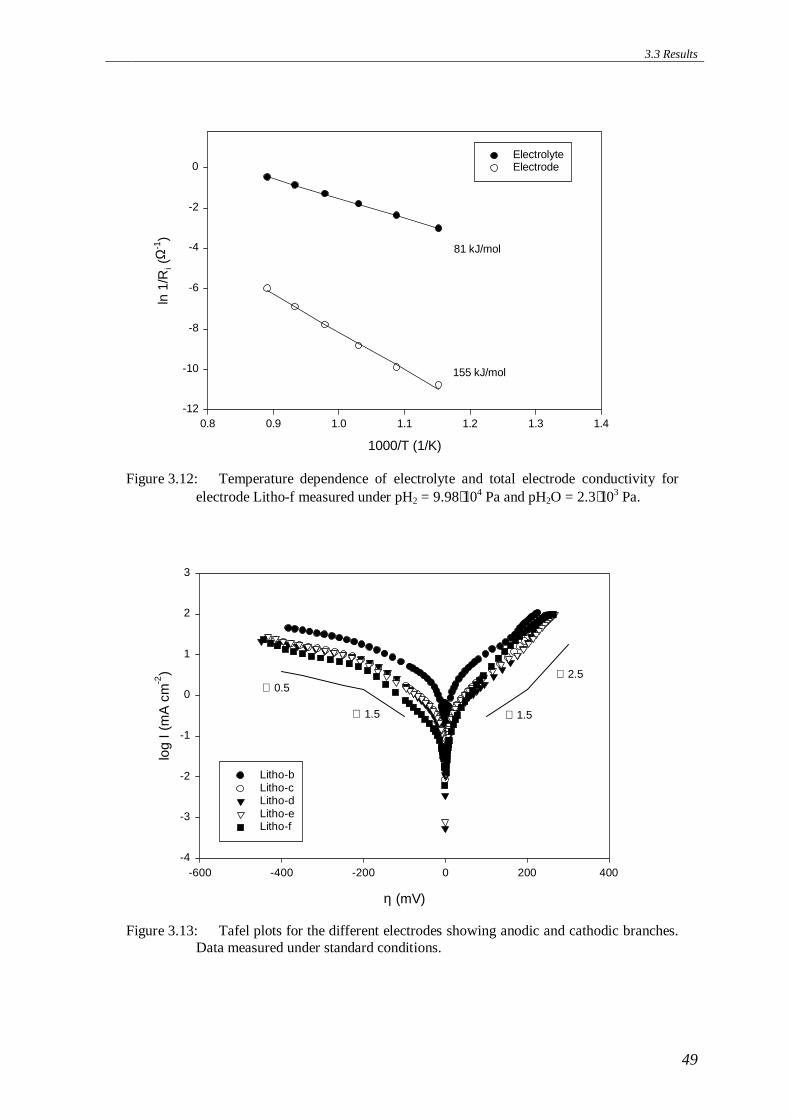
3.3 Results
49
1000/T (1/K)
0.8 0.9 1.0 1.1 1.2 1.3 1.4
ln 1
/Ri (
Ω-1
)
-12
-10
-8
-6
-4
-2
0ElectrolyteElectrode
81 kJ/mol
155 kJ/mol
Figure 3.12: Temperature dependence of electrolyte and total electrode conductivity forelectrode Litho-f measured under pH2 = 9.98⋅104 Pa and pH2O = 2.3⋅103 Pa.
η (mV)
-600 -400 -200 0 200 400
log
I (m
A c
m-2
)
-4
-3
-2
-1
0
1
2
3
Litho-bLitho-cLitho-dLitho-eLitho-f
∠ 2.5
∠ 1.5
∠ 0.5
∠ 1.5
Figure 3.13: Tafel plots for the different electrodes showing anodic and cathodic branches.Data measured under standard conditions.

3 Hydrogen oxidation at nickel pattern electrodes on yttria-stabilised zirconia
50
high overpotential. Determination of the α-values is ambiguous, as linear regions of theTafel slopes are difficult to identify. Therefore, care must be taken in using these values ininterpretating the reaction mechanism.
1.1.1.14 Electrode stability
The total electrode resistance as a function of time for electrode Litho-e is given inFigure 3.14.a. Data was obtained from impedance measurements under standard condi-tions, but this was interrupted for the time needed to acquire data from I-η measurementsas indicated in the figure. About 100 h are needed to attain a steady performance. The I-ηmeasurements also have a large influence on the apparent resistance value. After thesemeasurements a certain time is again required before a steady resistance is established.Figure 3.14.b shows data obtained for electrode Litho-c, which has been subjected to dif-ferent types of electrochemical measurements. The general behaviour is similar to that ob-served in Figure 3.14.a, in a sense that each type of measurement affects the momentaryvalue of the electrode resistance. This is most pronounced if the electrode is anodicallypolarised for longer times (about 4 h) as with the impedance measurements under anodicbias. Within approximately 40 h of measurement this change in performance appeared tobe irreversible. Similar observations were made for other pattern electrodes.
3.4 Discussion
3.4.1 Relationship of electrode performance with microstructure
Despite the grain growth that happens during the course of the electrochemical experi-ments, the patterned nickel layers remained dense and showed good adherence to the YSZelectrolyte. Figure 3.15 shows the total electrode conductivity calculated from data of im-pedance measurements under standard conditions as a function of the nickel perimeter ob-tained from image analysis. The conductivity value was taken from the first impedancemeasurement and after the I-η measurements and subsequent stabilisation. The generaltrend is an increase of the electrode conductivity with an increasing perimeter length of thenickel pattern, which agrees with data on nickel pattern electrodes obtained by Mizusaki et
Time (h)
0 20 40 60 80 100 120 140 160 180 200
Rto
t (Ω
)
0
20
40
60
80
100
120
140
160
180
200
I-η measurements
Time (h)
0 20 40 60 80 100 120 140 160 180 200 220
Rto
t (Ω
)
0
20
40
60
80
100
120
140
160
180
I-η
ImpedancepH2
ImpedancepH2O
Impedanceanodic polarised
(a) (b)Figure 3.14: Total electrode resistance as function of time. Data obtained from analysis of
impedance data for sample (a) Litho-e and (b) Litho-c measured under standardconditions.

3.4 Discussion
51
al. 0. There is, however, significant scatter present in Figure 3.15, which may be due to thefact that the edges of the nickel layer at the boundary with YSZ are not well defined. Theshape of the edges changes during the time span of the experiments due to grain-growth.An other reason that could cause scatter is inhomogeneous current collection over theelectrode area. From the data as given in Figure 3.15, it is not possible to distinguish if thenickel grain boundary length affects the overall electrode process.The observations mentioned above would suggest that the rate determining process takesplace at or in the near proximity of the three-phase-boundary line between nickel, zirconiaand the gas phase as has been suggested by others 00. On the other hand, such considera-tions cannot explain the increase in conductivity observed after anodically biasing theelectrode (see section 1.1.1.14). As noted before, image analysis of SEM pictures of theelectrode morphology before and after cell evaluation did not reveal a change in the nickelperimeter length. This observation evokes the question whether there are other factors in-volved in establishing the electrode performance. A possible explanation could be thatsome ‘electrochemical damage’ occurs during current passage which, from the presentview on the mechanistic basis of the electrode reaction, would lead to an effective broad-ening of the reaction zone. Clearly more studies are needed to evaluate this effect.
3.4.2 Electrochemical measurements
Impedance data from this study indicate that there are several contributions to the overallelectrochemical performance of the pattern electrodes. The most important contributioncomes from the arc designated as (R2Q2). The associated conductivity is a function of pH2
and pH2O as indicated in Figure 3.7 and Figure 3.8, respectively. As long as the compari-son is restricted to similar ranges in pH2 and pH2O, the observed orders are consistent with
Nickel perimeter (m cm-2)
0 2 4 6 8 10 12 14 16 18 20
σ tot (
Ω-1
cm
-2)
0.000
0.002
0.004
0.006
0.008
0.010
0.012
0.014
First experimentLast experiment
Figure 3.15: Total electrode conductivity as a function of the measured nickel perimeter.Data were taken from analysis of impedance data measured under standard con-dition, where the last impedance measurement are taken (for Litho-c the last im-pedance measurement before additional measurements). The nickel perimeter isobtained from image analysis of the electrode microstructure before and after cellevaluation. Line is given as a guide to the eye.
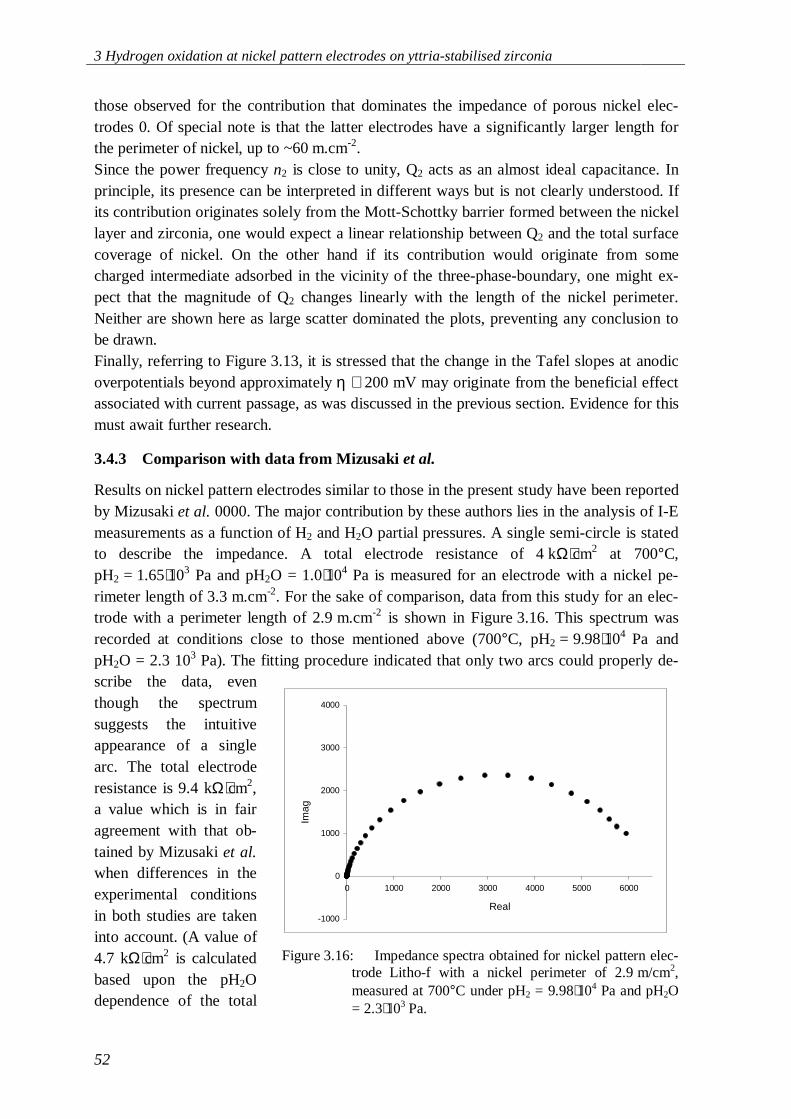
3 Hydrogen oxidation at nickel pattern electrodes on yttria-stabilised zirconia
52
those observed for the contribution that dominates the impedance of porous nickel elec-trodes 0. Of special note is that the latter electrodes have a significantly larger length forthe perimeter of nickel, up to ~60 m.cm-2.Since the power frequency n2 is close to unity, Q2 acts as an almost ideal capacitance. Inprinciple, its presence can be interpreted in different ways but is not clearly understood. Ifits contribution originates solely from the Mott-Schottky barrier formed between the nickellayer and zirconia, one would expect a linear relationship between Q2 and the total surfacecoverage of nickel. On the other hand if its contribution would originate from somecharged intermediate adsorbed in the vicinity of the three-phase-boundary, one might ex-pect that the magnitude of Q2 changes linearly with the length of the nickel perimeter.Neither are shown here as large scatter dominated the plots, preventing any conclusion tobe drawn.Finally, referring to Figure 3.13, it is stressed that the change in the Tafel slopes at anodicoverpotentials beyond approximately η ≅ 200 mV may originate from the beneficial effectassociated with current passage, as was discussed in the previous section. Evidence for thismust await further research.
3.4.3 Comparison with data from Mizusaki et al.
Results on nickel pattern electrodes similar to those in the present study have been reportedby Mizusaki et al. 0000. The major contribution by these authors lies in the analysis of I-Emeasurements as a function of H2 and H2O partial pressures. A single semi-circle is statedto describe the impedance. A total electrode resistance of 4 kΩ⋅cm2 at 700°C,pH2 = 1.65⋅103 Pa and pH2O = 1.0⋅104 Pa is measured for an electrode with a nickel pe-rimeter length of 3.3 m.cm-2. For the sake of comparison, data from this study for an elec-trode with a perimeter length of 2.9 m.cm-2 is shown in Figure 3.16. This spectrum wasrecorded at conditions close to those mentioned above (700°C, pH2 = 9.98⋅104 Pa andpH2O = 2.3 103 Pa). The fitting procedure indicated that only two arcs could properly de-scribe the data, eventhough the spectrumsuggests the intuitiveappearance of a singlearc. The total electroderesistance is 9.4 kΩ⋅cm2,a value which is in fairagreement with that ob-tained by Mizusaki et al.when differences in theexperimental conditionsin both studies are takeninto account. (A value of4.7 kΩ⋅cm2 is calculatedbased upon the pH2Odependence of the total
Real
0 1000 2000 3000 4000 5000 6000
Imag
-1000
0
1000
2000
3000
4000
Figure 3.16: Impedance spectra obtained for nickel pattern elec-trode Litho-f with a nickel perimeter of 2.9 m/cm2,measured at 700°C under pH2 = 9.98⋅104 Pa and pH2O= 2.3⋅103 Pa.

3.5 Conclusions
53
electrode resistance as measured for electrode Litho-c at 850°C.)Comparing the results of the I-η measurements is not straightforward. These were done asa function of the electrode potential E relative to Pt/air in the study by Mizusaki et al. Inthe present study these were made as a function of the overpotential η, i.e. the referenceelectrode being in equilibrium with the atmosphere imposed to the anode.
3.5 Conclusions
We have shown that, in principle, several mechanistic processes determine the electro-chemical performance of nickel pattern electrodes. However, in the range of H2 and H2Opartial pressures covered by the experiments one of these is found to be dominant. Varia-tion of the total electrode resistance with microstructure suggests that the performancescales with the available length of the nickel perimeter. Positive effects on the performancemay be induced by current passage.
Acknowledgement
M.W. den Otter and F.J.G. Roesthuis are thanked for preparation of the lithographic sam-ples.
ReferencesS.C. Singhal, ‘Status of Solid Oxide Fuel Cell Technology’, Proceedings of the 17th Risø International Symposium on
Materials Science, High temperature Electrochemistry: Ceramics and Metals, 123-38, 1996.N.Q. Minh, ‘Ceramic Fuel Cells’, J. Am. Ceram. Soc., 76, 563-88, 1993.T. Kawada, N. Sakai, J. Yokokawa, M. Dokiya, M. Mori and T. Iwata, ‘Structure and Polarisation Characteristics of
Solid Oxide Fuel Cell Anodes’, SSI, 40/41, 402-06, 1990.F.P.F. van Berkel, F.H. van Heuveln and J.P.P. Huijsmans, ‘Characterisation of Solid Oxide Fuel Cell Electrodes by Im-
pedance Spectroscopy and I-V Characteristics’, Solid State Ionics, 72, 240-47, 1994.S. Primdahl and M. Mogensen, ‘Oxidation of Hydrogen on Ni/Yttria-Stabilized Zirconia Cermet Anodes’, J. Electro-
chem. Soc., 144, 3409-19, 1997.R.J Aaberg, R. Tunold, S. Tjelle, R. Ødegård, ‘Oxidation of CO and H2 on Ni/YSZ cermet electrodes’, pp 511-16 in:
Proc. of the 17th Risø Int. Symp. on Material Science: High Temp. Electrochemistry: Ceramics and Metals, Ro-skilde, Denmark, 1996.
C-H Lee, C-H Lee, H-Y Lee and S.M Oh, ‘ Microstructure and anodic properties of Ni/YSZ cermets in Solid Oxide FuelCells’, SSI 98, 39-48, 1997.
J. Guindet, C. Roux, and A. Hammou, 'Hydrogen oxidation at the Ni/Zirconia electrode', pp.553-58 in: Proc. of the 2nd
Int. Symp. on Solid Oxide Fuel Cells, Athens, Greece, July 2-5, 1991.F.Z. Mohamedi-Boulenouar, J. Guindet and A. Hammou, ‘Influence of Water Vapour on Electrochemical Oxidation of
Hydrogen at the Ni/Zirconia Interface’, pp 441-50 in: Proc. of the 17th Risø Int. Symp. on Material Science: HighTemp. Electrochemistry: Ceramics and Metals, Roskilde, Denmark, 1996.
P.A. Osborg, T. Norby, ‘Characterisation of a H2+H2O/Ni/YSZ point electrode system by impedance spectroscopy’,pp47-50, in 7th SOFC Workshop, theory and measurement of microscale processes in Solid Oxide Fuel Cells, Wa-dahl, Norway, 18-20 Jan., 1995.
T. Norby, O.J. Velle, H. Leth-Olsen and R. Tunold, 'Reaction resistance in relation to three phase boundary length ofNi/YSZ electrodes', pp.473-78 in: Proc. Of the 3rd Int. Symp. On Solid Oxide Fuel Cells, Honolulu, Hawaii, 1993.
J. Mizusaki, H. Tagawa, T. Saito, K. Kamitani, T. Yamamura, K. Hirano, S. Ehara, T. Takagi, T. Hikita, M. Ippommatsuand S. Nakagawa, 'Preparation of Nickel pattern electrodes on YSZ and their electrochemical properties in H2-H2Oatmospheres'; pp. 533-41 in: Proc. Of the 3rd Int. Symp. On Solid Oxide Fuel Cells, Honolulu, Hawaii, 1993.
J. Mizusaki, H. Tagawa, T. Saito, K. Kamitain, T. Yamamura, K. Hirano, S. Ehara, T. Takagi, T. Hikita, M. Ippommatsu,S. Nakagawa, K. Hashimoto, ‘Preparation of Nickel Pattern Electrodes on YSZ and Their Electrochemical Proper-ties in H2-H2O Atmospheres, J. Electrochem. Soc., 141, 2129-34, 1994.
J. Mizusaki, H. Tagawa, T. Saito, T. Yamamura, K. Kamitani, K. Hirano, S. Ehara, T. Takagi, T. Hikita, M. Ippommatsu,S. Nakagawa, K. Hashimoto, 'Kinetic studies of the reaction at the nickel pattern electrode on YSZ in H2-H2O at-mospheres', Solid State Ionics, 70/71, 52-58, 1994.
T. Yamamura, H. Tagawa, T. Saito, J. Mizusaki, K. Kamitani, K. Hirano, S. Ehara, T. Takagi, Y. Hishinuma, H. Sasaki,T. Sogi, Y. Nakamura, K. Hashimoto, ‘Reaction Kinetics at the Nickel Pattern Electrode on YSZ and its depend-ence on Temperature’, Proc. of the 4th Int. Symp. On SOFC-IV, pp 741-49, Yokohama, Japan, 1995.
J. Mizusaki, T. Yamamura, H. Yoshitake, H. Tagawa, K. Hirano, S. Ehara, T. Takagi, M. Hishinuma, H. Sasaki, T. Sogi,Y. Nakamura, and K. Hishimoto, ‘Kinetic studies on Ni/YSZ anode reaction of SOFC in H2-H2O atmospheres by

3 Hydrogen oxidation at nickel pattern electrodes on yttria-stabilised zirconia
54
the use of Nickel pattern electrodes‘, pp 363-68 in: Proc. of the 17th Risø Int. Symp. on Material Science: HighTemp. Electrochemistry: Ceramics and Metals, Roskilde, Denmark, 1996.
B.A. Boukamp, ‘A Nonlinear least squares fit procedure for analysis of immittance data of electrochemical systems,Solid State Ionics, 20, 31-44, 1986.
B.A. Boukamp, ‘A linear Kronig-Kramers Transform Test for Immitance Data Validation’, J. Electrochem. Soc., 142,1885-94, 1995.
F.P.F. van Berkel, J.P. de Jong, ‘De Relatie tussen de Morfologie en de Electrochemische Eigenschappen van Ni/YSZAnodematerialen’, ECN Internal Report, 2918-GR14,1993.
Chapter 4 of this thesis.

55
4 Hydrogen oxidation at porous nickel electrodes onyttria-stabilised zirconia
Abstract
The hydrogen oxidation reaction at porous nickel electrodes on yttria-stabilised zirconia isstudied using impedance and polarisation measurements as a function of temperature,overpotential, H2 and H2O partial pressures. The microstructure of the nickel electrodes isvaried by using a different layer thickness, annealing time and temperature in subsequentE-beam assisted evaporation steps. Image analysis is used to characterise the microstruc-ture.At equilibrium, the impedance diagram is characterised by a single arc even though thefitting procedure indicates that it is overlapping a second, significantly smaller arc. Theassociated resistance of the dominant arc becomes smaller with increasing anodic polarisa-tion. This observation is consistent with data from steady-state polarisation measurements.The activation energy of the conductivity associated with the dominant arc is 152 kJ mol-1.The electrochemical performance of the prepared nickel electrodes relates to the exposedlength of the triple phase boundary. The associated pH2 and pH2O dependencies are differ-ent under equilibrium (from impedance), anodic and cathodic polarisation. The observa-tions are discussed in view of a tentative multi-step mechanism formulated for the elec-trode reaction. The results from this study invalidate a simple description in terms of aButler-Volmer formalism, based on a single rate determining step. It is expected that astrong variation in the fractional coverage of adsorbed intermediates on either nickel orzirconia surfaces has to be considered.
4.1 Introduction
The porous cermet electrode made of nickel and yttria-stabilised zirconia (Ni/YSZ) iscommonly used as anode for SOFC applications [1][2]. Despite numerous studies on thekinetics of oxygen reduction taking place at the SOFC cathode [3][4][5], the fuel oxidationreaction has received much less attention. The kinetics of hydrogen oxidation have beenstudied to some extent, but still there is no consensus about major details in the reactionmechanism.It is generally accepted that nickel is highly active for H2 oxidation. However, the micro-structure of the cermet has a major impact on the electrode performance

4 Hydrogen oxidation at porous nickel electrodes on yttria-stabilised zirconia
56
0[7][8][9][10][11]. Its contribution obscures the interpretation of experimental data and,hence, a correct diagnosis of pathways in the reaction mechanism. The cermet structure isbasically required to obtain adhesion and stability when using nickel as the active anode[12]. It may contribute electrochemically by the increased number of active sites in theelectrode compared with that of a planar electrode design. The active sites are assumed tobe located in the close vicinity of the triple phase boundary, the area where gas phase,electrode and electrolyte meet. However, due to the complicated microstructure of thecermet structure the number of these active sites, which may vary across the volume of thecermet, is very difficult to assess. Furthermore, percolativity of the cermet structure is re-quired to enable gas phase, electronic and ionic transport. As a consequence electrocata-lytic effects may be mixed with transport effects. For all these reasons the elucidation ofthe hydrogen oxidation kinetics on the Ni/YSZ cermet is quite cumbersome.So far only a few studies have been initiated on nickel point [13]00, lithographic porouslayer 0 and pattern electrodes [17][18]0[20]0, having less complicated geometries than thecermet electrode. However, mechanisms and essential pathways for the hydrogen oxidationreaction as quoted by the different authors differ considerably. For the results of thesestudies to be unambiguous, the experiments should have been carried out under standard-ised conditions. The conditions often vary strongly from experiment to experiment so thatcomparison of the results obtained is hardly meaningful.In the present study, we concentrate on hydrogen oxidation on porous nickel electrodes.The electrode kinetics are investigated using combined application of impedance andsteady-state polarisation measurements under different gas phase conditions. The parame-ters describing the microstructure of the porous electrode, as obtained from image analysis,are compared with its electrochemical performance. The results are discussed following aclassical formulation of the electrode kinetics based on a tentative multi-step mechanismfor the hydrogen oxidation reaction. Results are compared with data reported in literature.
4.2 Theory
4.2.1 Reaction scheme
The overall hydrogen oxidation reaction,H O H O2
12 2 2+ ↔ (4.1)
can be seen to exist of several sequential reaction steps, each of which may be rate deter-mining. To enable discussion of the experimental data from this study, the followingscheme for the electrode reaction is postulated:step H s Helectrode ads1 2 22 + → (4.2)
step H O OH e sads Ox
O electrode2 + → + +• (4.3)
step OH s OH VO electrolyte ads O3 • − ••+ → + (4.4)
step H OH H O e sads ads ads electrode4 2+ → + +− (4.5)
step H O H O sads gas electrolyte5 2 2→ + (4.6)
where selectrode and selectrolyte denote vacant sites on the nickel electrode surface and the solidelectrolyte surface, respectively. Step 1 describes the dissociative adsorption of hydrogen

4.2 Theory
57
gas molecules on the nickel surface. Charge transfer occurs at the triple phase boundary inboth steps 2 and 4, whereas step 3 represents the exchange between protonated ions on theoxygen sublattice and hydroxide ions on the oxide surface. In step 4, these hydroxide ionsare again protonated to form adsorbed water molecules. The latter are desorbed from theoxide surface in step 5.The inclusion of step 3, involving the interstitial protons as a mediator in the reactionscheme, was first proposed by Mogensen et al. [22]. This would account for the importantrole the triple phase boundary perimeter plays in the hydrogen oxidation kinetics onNi/YSZ anodes observed by many investigators in the field 0[18]. However, there is nodirect evidence from experiment for the involvement of the interstitial protons in the reac-tion kinetics. A plausible mechanism may therefore also be one in which steps 2 and 3 arereplaced bystep a H O s V OH e sads O
xelectrolyte O ads electrode2 + + → + + +•• − (4.7)
In what follows, the above-described mechanism is used to derive the i-η relationship. Ba-sic assumptions made in the derivation are1) microscopic reversibility, i.e. the sequence of reaction steps for forward and backward
reactions are the same,2) the rate constants are independent of the fractional coverages of surface intermediates
on either nickel or stabilised zirconia,3) adsorption of gases and/or intermediate species can be described by the Langmuir-type
isotherm. Hydrogen atoms are adsorbed only on the nickel surface, H2O and OH- ad-sorb simultaneously and competitively on the electrolyte surface,
4) no steps are bounded by a limited diffusion or migration of species,5) virtual equilibrium for all steps except the rate limiting step.
The rate equations corresponding to steps 1-5 are
step r k pH kH H1 11 12
2 12= − − −θ θ (4.8)
step r k fE k a fEH OH HO
2 12 2 2 2 2= − − −− •θ β θ βexp exp (4.9)
step r k a kOH OH H O OHO
3 13 3 32= − − −• − −−θ θ θ (4.10)
step r k fE k fEH OH H O H4 14 4 4 4 42= − − −− −θ θ β θ θ βexp exp (4.11)
step r k k pH OH O OH H O5 15 5 5 22 2= − − −− −θ θ θ (4.12)
where f = F/RT, E the electrode potential, βi the symmetry coefficient, θi’s are the frac-tional coverage of surface species i, and ki and k-i are the specific rate constants for theforward and backward reaction, respectively. The activities of VO
•• and Oox in the electro-
lyte are taken to be constant.
4.2.2 Langmuir adsorption
Assuming that for the dissociative equilibrium of H2 on the nickel surface the Langmuiradsorption isotherm is applicable, the equilibrium constant can be written as
Kk
k pHads
Heq
Heq= =
−−
1
1
2
221
θθ
( )
(4.13)
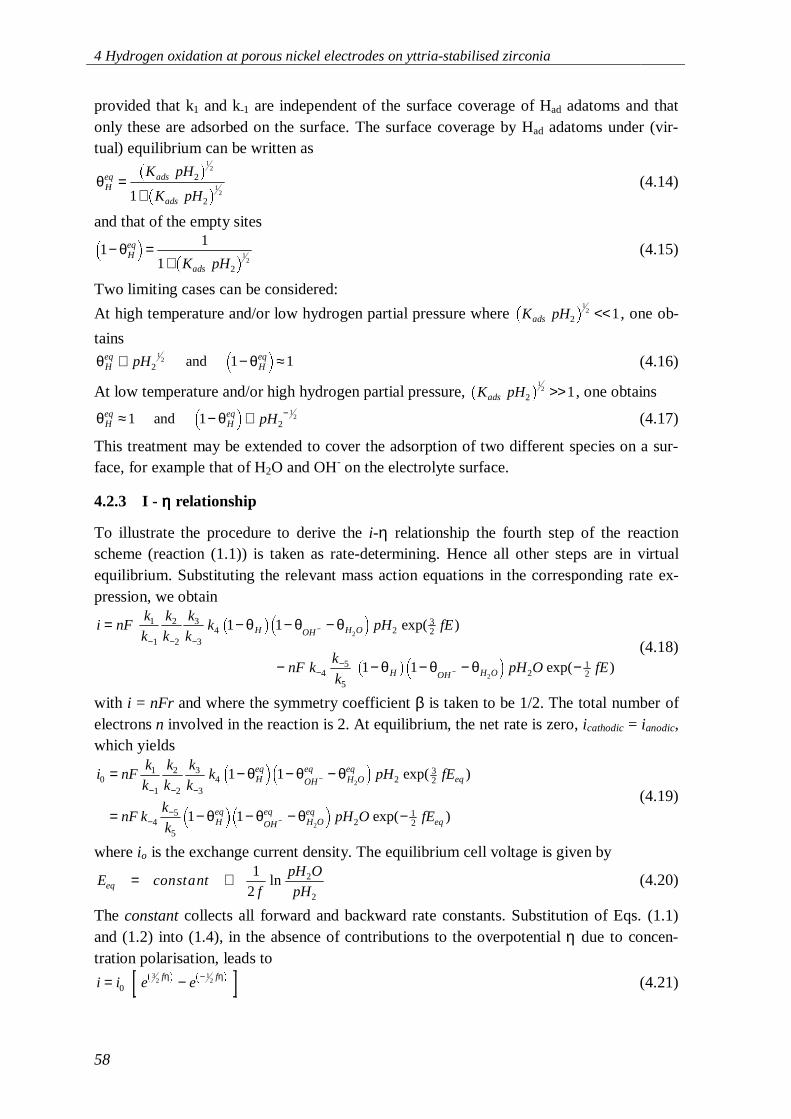
4 Hydrogen oxidation at porous nickel electrodes on yttria-stabilised zirconia
58
provided that k1 and k-1 are independent of the surface coverage of Had adatoms and thatonly these are adsorbed on the surface. The surface coverage by Had adatoms under (vir-tual) equilibrium can be written as
θHeq ads
ads
K pH
K pH=
+2
2
12
121
(4.14)
and that of the empty sites
11
1 2
12
− =+
θHeq
adsK pH
(4.15)
Two limiting cases can be considered:
At high temperature and/or low hydrogen partial pressure where K pHads 2
12 1 << , one ob-
tains
θ θHeq
HeqpH∝ − ≈2
12 1 1and (4.16)
At low temperature and/or high hydrogen partial pressure, K pHads 2
12 1 >> , one obtains
θ θHeq
Heq pH≈ − ∝ −1 1 2
12and (4.17)
This treatment may be extended to cover the adsorption of two different species on a sur-face, for example that of H2O and OH- on the electrolyte surface.
4.2.3 I - ηηηη relationship
To illustrate the procedure to derive the i-η relationship the fourth step of the reactionscheme (reaction (1.1)) is taken as rate-determining. Hence all other steps are in virtualequilibrium. Substituting the relevant mass action equations in the corresponding rate ex-pression, we obtain
i nFk
k
k
k
k
kk pH fE
nF kk
kpH O fE
H OH H O
H OH H O
= − − −
− − − − −
− − −
−−
−
−
1
1
2
2
3
34 2
32
45
52
12
1 1
1 1
2
2
θ θ θ
θ θ θ
exp( )
exp( )(4.18)
with i = nFr and where the symmetry coefficient β is taken to be 1/2. The total number ofelectrons n involved in the reaction is 2. At equilibrium, the net rate is zero, icathodic = ianodic,which yields
i nFk
k
k
k
k
kk pH fE
nF kk
kpH O fE
Heq
OH
eqH Oeq
eq
Heq
OHeq
H Oeq
eq
01
1
2
2
3
34 2
32
45
52
12
1 1
1 1
2
2
= − − −
= − − − −
− − −
−−
−
−
θ θ θ
θ θ θ
exp( )
exp( )(4.19)
where io is the exchange current density. The equilibrium cell voltage is given by
E constantf
pH O
pHeq = + 12
2
2
ln (4.20)
The constant collects all forward and backward rate constants. Substitution of Eqs. (1.1)and (1.2) into (1.4), in the absence of contributions to the overpotential η due to concen-tration polarisation, leads to
i i e ef f= − −0
32
12η η (4.21)
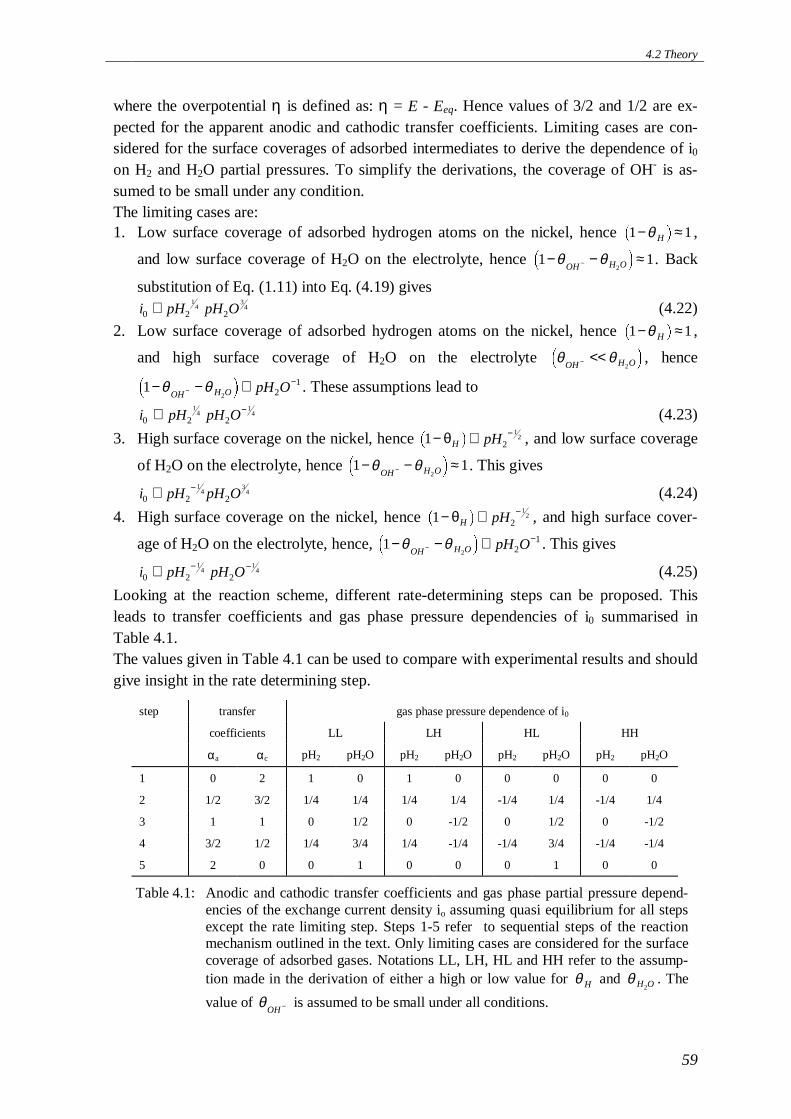
4.2 Theory
59
where the overpotential η is defined as: η = E - Eeq. Hence values of 3/2 and 1/2 are ex-pected for the apparent anodic and cathodic transfer coefficients. Limiting cases are con-sidered for the surface coverages of adsorbed intermediates to derive the dependence of i0
on H2 and H2O partial pressures. To simplify the derivations, the coverage of OH- is as-sumed to be small under any condition.The limiting cases are:1. Low surface coverage of adsorbed hydrogen atoms on the nickel, hence 1 1− ≈θ H ,
and low surface coverage of H2O on the electrolyte, hence 1 12
− − ≈−θ θOH H O . Back
substitution of Eq. (1.11) into Eq. (4.19) givesi pH pH O0 2 2
14
34∝ (4.22)
2. Low surface coverage of adsorbed hydrogen atoms on the nickel, hence 1 1− ≈θ H ,
and high surface coverage of H2O on the electrolyte θ θOH H O− <<
2 , hence
12 2
1− − ∝−−θ θ
OH H O pH O . These assumptions lead to
i pH pH O0 2 2
14
14∝ − (4.23)
3. High surface coverage on the nickel, hence 1 2
12− ∝ −θH pH , and low surface coverage
of H2O on the electrolyte, hence 1 12
− − ≈−θ θOH H O . This gives
i pH pH O0 2 2
14
34∝ − (4.24)
4. High surface coverage on the nickel, hence 1 2
12− ∝ −θH pH , and high surface cover-
age of H2O on the electrolyte, hence, 12 2
1− − ∝−−θ θ
OH H O pH O . This gives
i pH pH O0 2 2
14
14∝ − − (4.25)
Looking at the reaction scheme, different rate-determining steps can be proposed. Thisleads to transfer coefficients and gas phase pressure dependencies of i0 summarised inTable 4.1.The values given in Table 4.1 can be used to compare with experimental results and shouldgive insight in the rate determining step.
step transfer gas phase pressure dependence of i0
coefficients LL LH HL HH
αa αc pH2 pH2O pH2 pH2O pH2 pH2O pH2 pH2O
1 0 2 1 0 1 0 0 0 0 0
2 1/2 3/2 1/4 1/4 1/4 1/4 -1/4 1/4 -1/4 1/4
3 1 1 0 1/2 0 -1/2 0 1/2 0 -1/2
4 3/2 1/2 1/4 3/4 1/4 -1/4 -1/4 3/4 -1/4 -1/4
5 2 0 0 1 0 0 0 1 0 0
Table 4.1: Anodic and cathodic transfer coefficients and gas phase partial pressure depend-encies of the exchange current density io assuming quasi equilibrium for all stepsexcept the rate limiting step. Steps 1-5 refer to sequential steps of the reactionmechanism outlined in the text. Only limiting cases are considered for the surfacecoverage of adsorbed gases. Notations LL, LH, HL and HH refer to the assump-tion made in the derivation of either a high or low value for θ H and θ H O2
. The
value of θOH− is assumed to be small under all conditions.
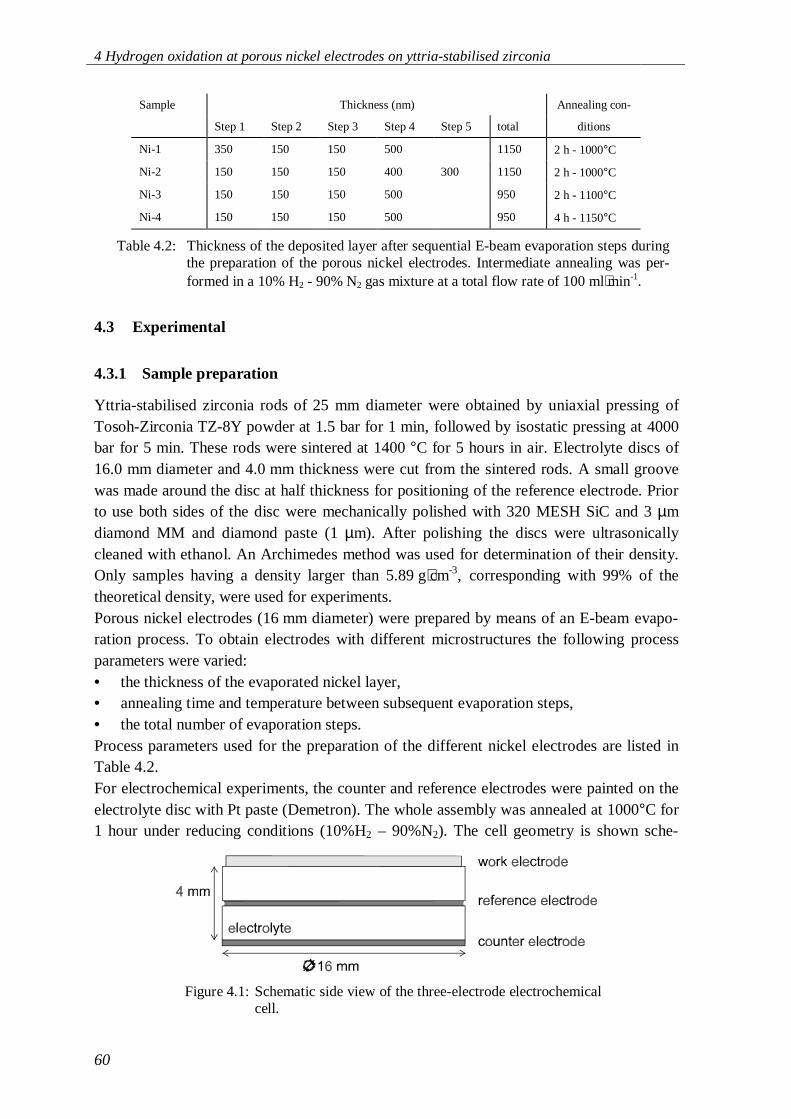
4 Hydrogen oxidation at porous nickel electrodes on yttria-stabilised zirconia
60
4.3 Experimental
4.3.1 Sample preparation
Yttria-stabilised zirconia rods of 25 mm diameter were obtained by uniaxial pressing ofTosoh-Zirconia TZ-8Y powder at 1.5 bar for 1 min, followed by isostatic pressing at 4000bar for 5 min. These rods were sintered at 1400 °C for 5 hours in air. Electrolyte discs of16.0 mm diameter and 4.0 mm thickness were cut from the sintered rods. A small groovewas made around the disc at half thickness for positioning of the reference electrode. Priorto use both sides of the disc were mechanically polished with 320 MESH SiC and 3 µmdiamond MM and diamond paste (1 µm). After polishing the discs were ultrasonicallycleaned with ethanol. An Archimedes method was used for determination of their density.Only samples having a density larger than 5.89 g⋅cm-3, corresponding with 99% of thetheoretical density, were used for experiments.Porous nickel electrodes (16 mm diameter) were prepared by means of an E-beam evapo-ration process. To obtain electrodes with different microstructures the following processparameters were varied:• the thickness of the evaporated nickel layer,• annealing time and temperature between subsequent evaporation steps,• the total number of evaporation steps.Process parameters used for the preparation of the different nickel electrodes are listed inTable 4.2.For electrochemical experiments, the counter and reference electrodes were painted on theelectrolyte disc with Pt paste (Demetron). The whole assembly was annealed at 1000°C for1 hour under reducing conditions (10%H2 – 90%N2). The cell geometry is shown sche-
Sample Thickness (nm) Annealing con-
Step 1 Step 2 Step 3 Step 4 Step 5 total ditions
Ni-1 350 150 150 500 1150 2 h - 1000°C
Ni-2 150 150 150 400 300 1150 2 h - 1000°C
Ni-3 150 150 150 500 950 2 h - 1100°C
Ni-4 150 150 150 500 950 4 h - 1150°C
Table 4.2: Thickness of the deposited layer after sequential E-beam evaporation steps duringthe preparation of the porous nickel electrodes. Intermediate annealing was per-formed in a 10% H2 - 90% N2 gas mixture at a total flow rate of 100 ml⋅min-1.
Figure 4.1: Schematic side view of the three-electrode electrochemicalcell.
4.3 Experimental
61
matically in Figure 4.1.
4.3.2 Characterisation of the electrode microstructure
Before and after the electrochemical experiments SEM (Scanning Electron Microscopy)micrographs of the porous nickel electrodes were made at five different positions on thesurface. The pictures obtained were edited to black and white representations, which weretransferred into an image analysis system. The results enabled calculation of the totallength of the nickel perimeter and the surface coverage by nickel.
4.3.3 Electrochemical characterisation
Electrochemical experiments were performed in a single-gas environment at atmosphericpressure. At standard conditions a gas flow of 100ml·min-1 H2 with 2.3% H2O at 850°Cwas used. Brooks 5800E Mass Flow Controllers controlled all gas flows. Passing the gasmixture through two water bubblers controlled the water concentration. The water tem-perature in these bubblers was controlled with an electric heating/cooling device contain-ing a mixture of ethylene-glycol and water. The second water bubbler was used as a coldtrap, fixing the water concentration in the gas to the aqueous vapour pressure over water atthe temperature maintained in this bubbler. For all electrochemical measurements heliumwas used as inert gas.Impedance measurements were performed in the frequency range of 1 MHz to 0.01 Hzusing a Solartron Frequency Response Analyser 1255 in combination with a SolartronElectrochemical Interface 1287. An excitation voltage of 10 mV (rms) was used to ensurethat measurements were performed in the linear regime. The impedance data was analysedusing the computer program ‘Equivalent Circuit’ [23].The dc polarisation behaviour of the porous nickel electrodes was studied using a SolartronElectrochemical Interface 1287 for potentiostatic control. The current through the electro-chemical cell was measured after reaching steady-state. Overpotentials were corrected forthe uncompensated resistance of the electrolyte, the value of which was evaluated fromdata obtained from impedance spectroscopy.After heating the nickel electrode to 850°C in the standard gas mixture, impedance dia-grams were recorded. When stable performance was attained, the following series of ex-periments were conducted.• Impedance measurements as a function of pH2 and pH2O. These were performed in the
pH2 range from 9.98⋅104 to 4.95⋅103 Pa with pH2O fixed at 2.33⋅103 Pa, and in thepH2O-range from 1.22⋅103 to 2.00⋅104 Pa fixing pH2 at 8.11⋅104 Pa.
• I-η measurements under standard conditions. Prior to measurement the work electrodewas anodically biased at 500 mV. Subsequently the I-η curve was recorded by de-creasing the potential stepwise in the cathodic direction.
• I-η measurements as a function of pH2 and pH2O. These were performed under bothcathodic and anodic polarisation. The applied pH2 and pH2O ranges correspond tothose listed above.
• Impedance measurements under standard conditions, the electrode being anodicallypolarised at 50, 150, 200, 250, 300, 400 and 500 mV relative to the reference elec-
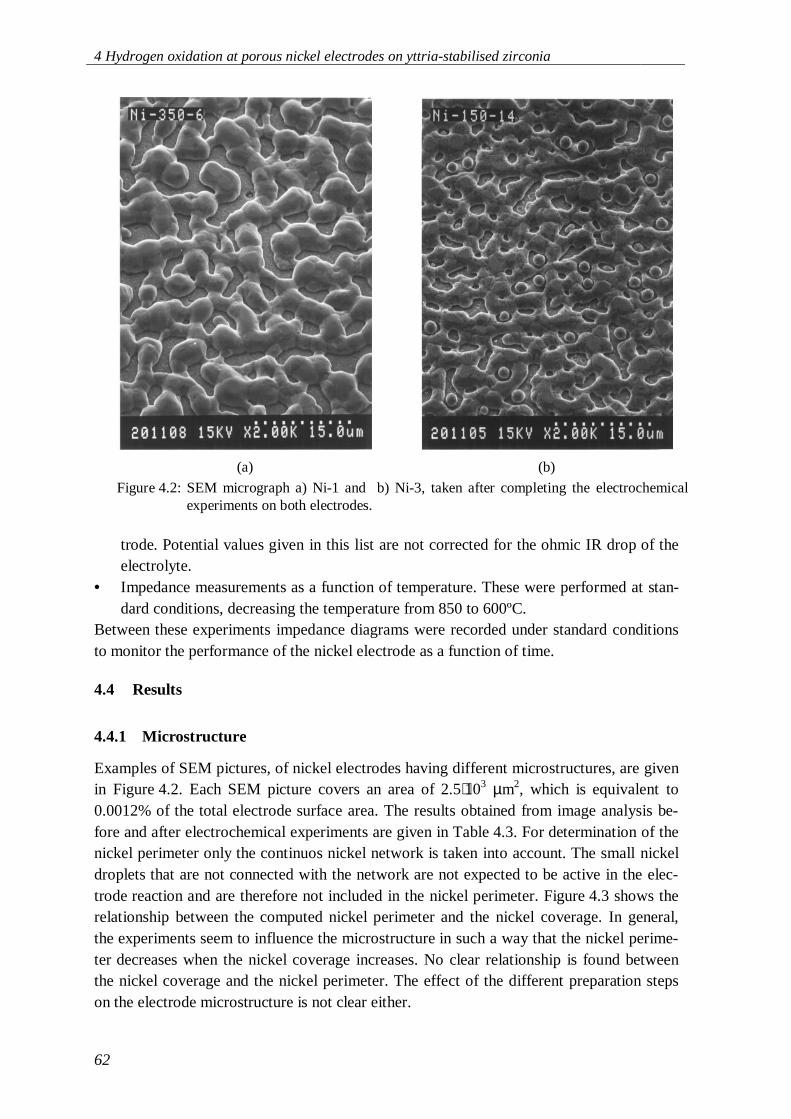
4 Hydrogen oxidation at porous nickel electrodes on yttria-stabilised zirconia
62
trode. Potential values given in this list are not corrected for the ohmic IR drop of theelectrolyte.
• Impedance measurements as a function of temperature. These were performed at stan-dard conditions, decreasing the temperature from 850 to 600ºC.
Between these experiments impedance diagrams were recorded under standard conditionsto monitor the performance of the nickel electrode as a function of time.
4.4 Results
4.4.1 Microstructure
Examples of SEM pictures, of nickel electrodes having different microstructures, are givenin Figure 4.2. Each SEM picture covers an area of 2.5⋅103 µm2, which is equivalent to0.0012% of the total electrode surface area. The results obtained from image analysis be-fore and after electrochemical experiments are given in Table 4.3. For determination of thenickel perimeter only the continuos nickel network is taken into account. The small nickeldroplets that are not connected with the network are not expected to be active in the elec-trode reaction and are therefore not included in the nickel perimeter. Figure 4.3 shows therelationship between the computed nickel perimeter and the nickel coverage. In general,the experiments seem to influence the microstructure in such a way that the nickel perime-ter decreases when the nickel coverage increases. No clear relationship is found betweenthe nickel coverage and the nickel perimeter. The effect of the different preparation stepson the electrode microstructure is not clear either.
(a) (b)
Figure 4.2: SEM micrograph a) Ni-1 and b) Ni-3, taken after completing the electrochemicalexperiments on both electrodes.

4.4 Results
63
Nickel perimeter (m/cm2)
Before measurements After measurements
Sample average stdev average stdev
Ni-1 59 2 45 2
Ni-2 79 3 61 5
Ni-3 62 3 52 6
Ni-4 56 4 56 5
Surface coverage Ni (%)
Before measurements Aftere measurements
Sample average stdev average stdev
Ni-1 69 2 72 2
Ni-2 61 3 65 2
Ni-3 68 2 69 3
Ni-4 59 3 60 2
Table 4.3: Results from image analysis on the porous nickel electrodes before and after theelectrochemical experiments. Average values are given from data taken at fivedifferent positions at the surface.
nickel perimeter (m/cm2)
30 40 50 60 70 80 90
% N
i cov
erag
e
40
50
60
70
80
Before experimentsAfter experiments
Ni-2
Ni-4
Ni-2
Ni-3Ni-1
Ni-1
Ni-3
Figure 4.3: Relationship between the nickel perimeter and the percentage of nickel coveragefor different electrodes. Results are given from image analysis before and afterelectrochemical experiments.
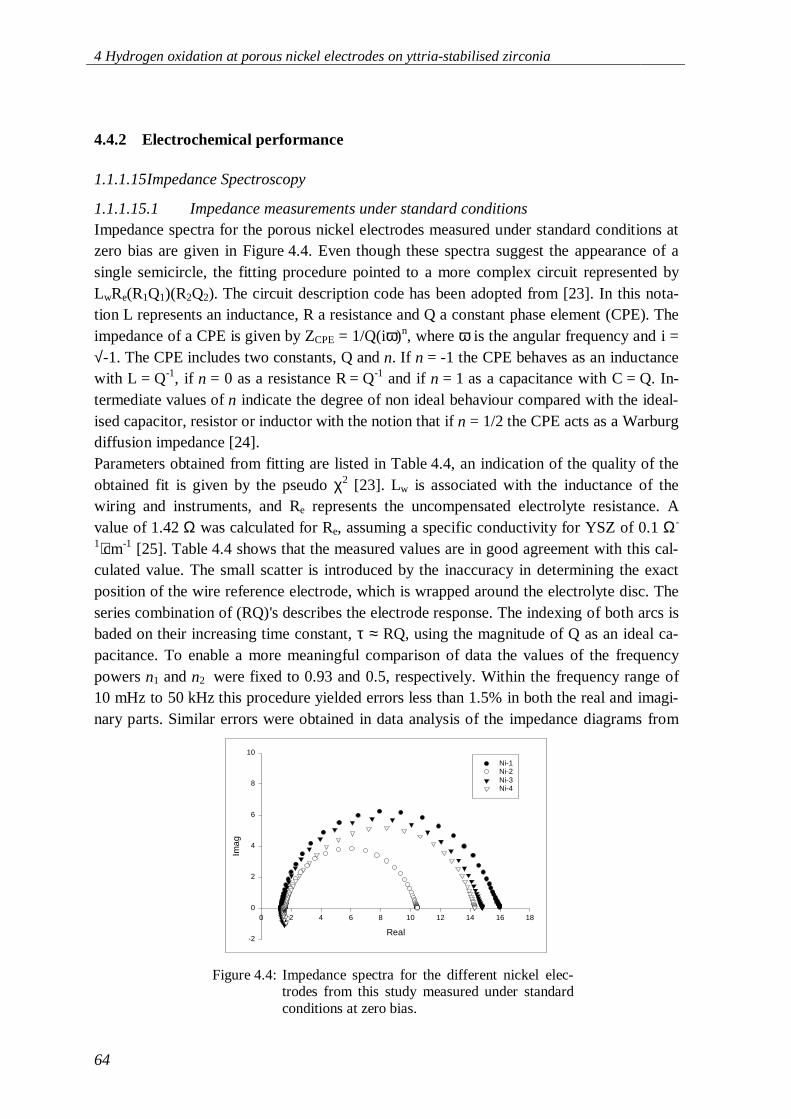
4 Hydrogen oxidation at porous nickel electrodes on yttria-stabilised zirconia
64
4.4.2 Electrochemical performance
1.1.1.15 Impedance Spectroscopy
1.1.1.15.1 Impedance measurements under standard conditions Impedance spectra for the porous nickel electrodes measured under standard conditions atzero bias are given in Figure 4.4. Even though these spectra suggest the appearance of asingle semicircle, the fitting procedure pointed to a more complex circuit represented byLwRe(R1Q1)(R2Q2). The circuit description code has been adopted from [23]. In this nota-tion L represents an inductance, R a resistance and Q a constant phase element (CPE). Theimpedance of a CPE is given by ZCPE = 1/Q(iω)n, where ω is the angular frequency and i =√-1. The CPE includes two constants, Q and n. If n = -1 the CPE behaves as an inductancewith L = Q-1, if n = 0 as a resistance R = Q-1 and if n = 1 as a capacitance with C = Q. In-termediate values of n indicate the degree of non ideal behaviour compared with the ideal-ised capacitor, resistor or inductor with the notion that if n = 1/2 the CPE acts as a Warburgdiffusion impedance [24]. Parameters obtained from fitting are listed in Table 4.4, an indication of the quality of theobtained fit is given by the pseudo χ2 [23]. Lw is associated with the inductance of thewiring and instruments, and Re represents the uncompensated electrolyte resistance. Avalue of 1.42 Ω was calculated for Re, assuming a specific conductivity for YSZ of 0.1 Ω-
1⋅cm-1 [25]. Table 4.4 shows that the measured values are in good agreement with this cal-culated value. The small scatter is introduced by the inaccuracy in determining the exactposition of the wire reference electrode, which is wrapped around the electrolyte disc. Theseries combination of (RQ)'s describes the electrode response. The indexing of both arcs isbaded on their increasing time constant, τ ≈ RQ, using the magnitude of Q as an ideal ca-pacitance. To enable a more meaningful comparison of data the values of the frequencypowers n1 and n2 were fixed to 0.93 and 0.5, respectively. Within the frequency range of10 mHz to 50 kHz this procedure yielded errors less than 1.5% in both the real and imagi-nary parts. Similar errors were obtained in data analysis of the impedance diagrams from
Real
0 2 4 6 8 10 12 14 16 18
Imag
-2
0
2
4
6
8
10
Ni-1Ni-2Ni-3Ni-4
Figure 4.4: Impedance spectra for the different nickel elec-trodes from this study measured under standardconditions at zero bias.
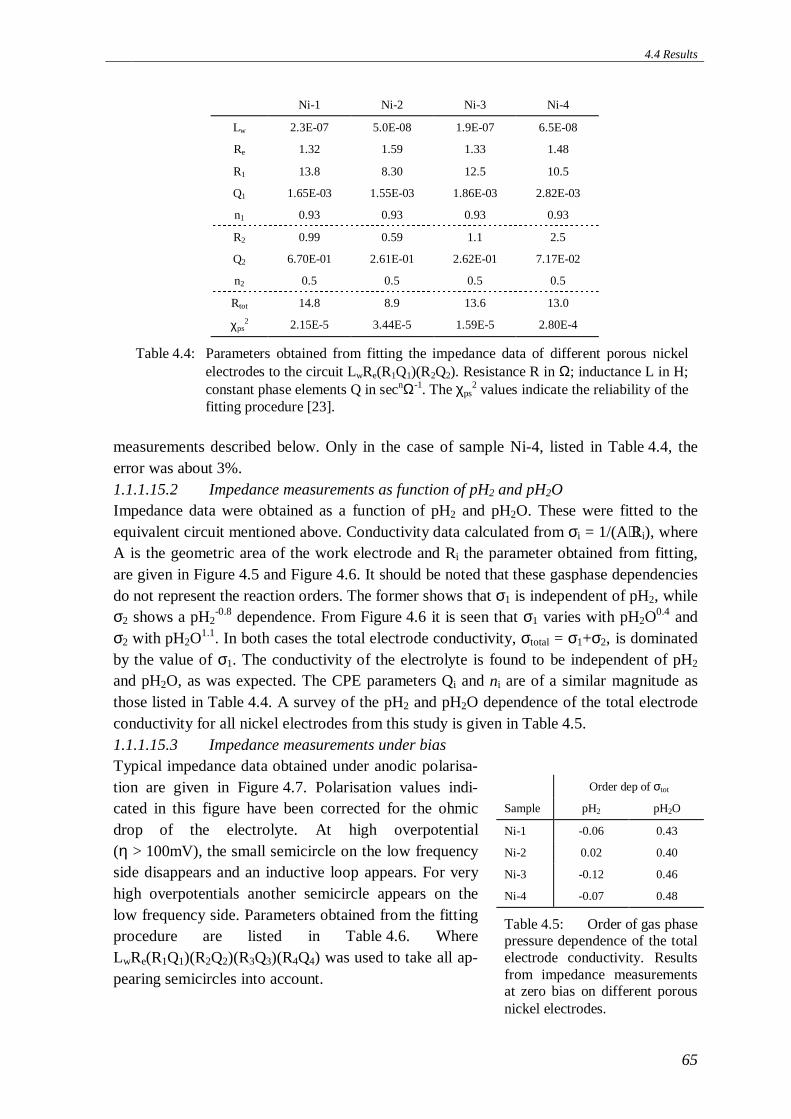
4.4 Results
65
measurements described below. Only in the case of sample Ni-4, listed in Table 4.4, theerror was about 3%.1.1.1.15.2 Impedance measurements as function of pH2 and pH2O Impedance data were obtained as a function of pH2 and pH2O. These were fitted to theequivalent circuit mentioned above. Conductivity data calculated from σi = 1/(A⋅Ri), whereA is the geometric area of the work electrode and Ri the parameter obtained from fitting,are given in Figure 4.5 and Figure 4.6. It should be noted that these gasphase dependenciesdo not represent the reaction orders. The former shows that σ1 is independent of pH2, whileσ2 shows a pH2
-0.8 dependence. From Figure 4.6 it is seen that σ1 varies with pH2O0.4 and
σ2 with pH2O1.1. In both cases the total electrode conductivity, σtotal = σ1+σ2, is dominated
by the value of σ1. The conductivity of the electrolyte is found to be independent of pH2
and pH2O, as was expected. The CPE parameters Qi and ni are of a similar magnitude asthose listed in Table 4.4. A survey of the pH2 and pH2O dependence of the total electrodeconductivity for all nickel electrodes from this study is given in Table 4.5.1.1.1.15.3 Impedance measurements under bias Typical impedance data obtained under anodic polarisa-tion are given in Figure 4.7. Polarisation values indi-cated in this figure have been corrected for the ohmicdrop of the electrolyte. At high overpotential(η > 100mV), the small semicircle on the low frequencyside disappears and an inductive loop appears. For veryhigh overpotentials another semicircle appears on thelow frequency side. Parameters obtained from the fittingprocedure are listed in Table 4.6. WhereLwRe(R1Q1)(R2Q2)(R3Q3)(R4Q4) was used to take all ap-pearing semicircles into account.
Ni-1 Ni-2 Ni-3 Ni-4
Lw 2.3E-07 5.0E-08 1.9E-07 6.5E-08
Re 1.32 1.59 1.33 1.48
R1 13.8 8.30 12.5 10.5
Q1 1.65E-03 1.55E-03 1.86E-03 2.82E-03
n1 0.93 0.93 0.93 0.93
R2 0.99 0.59 1.1 2.5
Q2 6.70E-01 2.61E-01 2.62E-01 7.17E-02
n2 0.5 0.5 0.5 0.5
Rtot 14.8 8.9 13.6 13.0
χps2 2.15E-5 3.44E-5 1.59E-5 2.80E-4
Table 4.4: Parameters obtained from fitting the impedance data of different porous nickelelectrodes to the circuit LwRe(R1Q1)(R2Q2). Resistance R in Ω; inductance L in H;constant phase elements Q in secnΩ-1. The χps
2 values indicate the reliability of thefitting procedure [23].
Order dep of σtot
Sample pH2 pH2O
Ni-1 -0.06 0.43
Ni-2 0.02 0.40
Ni-3 -0.12 0.46
Ni-4 -0.07 0.48
Table 4.5: Order of gas phasepressure dependence of the totalelectrode conductivity. Resultsfrom impedance measurementsat zero bias on different porousnickel electrodes.
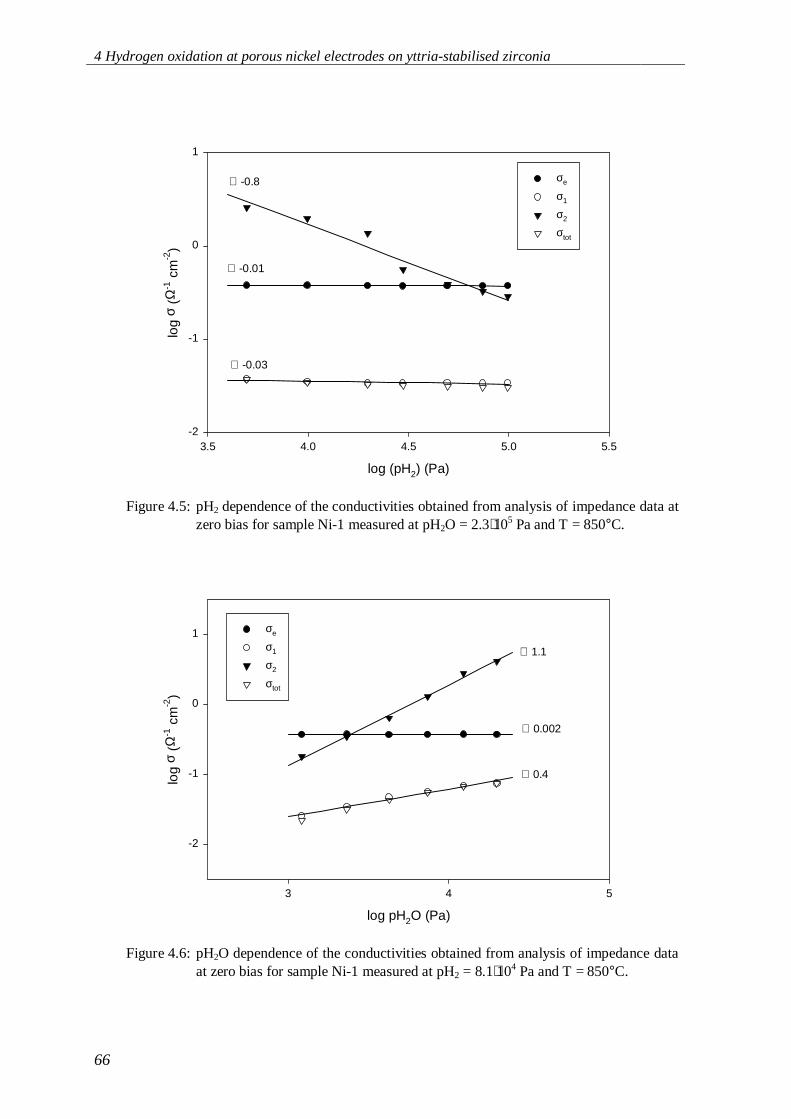
4 Hydrogen oxidation at porous nickel electrodes on yttria-stabilised zirconia
66
log (pH2) (Pa)
3.5 4.0 4.5 5.0 5.5
log
σ (Ω
-1 c
m-2
)
-2
-1
0
1
σe
σ1
σ2
σtot
∠ -0.03
∠ -0.8
∠ -0.01
Figure 4.5: pH2 dependence of the conductivities obtained from analysis of impedance data atzero bias for sample Ni-1 measured at pH2O = 2.3⋅105 Pa and T = 850°C.
log pH2O (Pa)
3 4 5
log
σ (Ω
-1 c
m-2
)
-2
-1
0
1 σe
σ1
σ2
σtot
∠ 0.4
∠ 0.002
∠ 1.1
Figure 4.6: pH2O dependence of the conductivities obtained from analysis of impedance dataat zero bias for sample Ni-1 measured at pH2 = 8.1⋅104 Pa and T = 850°C.
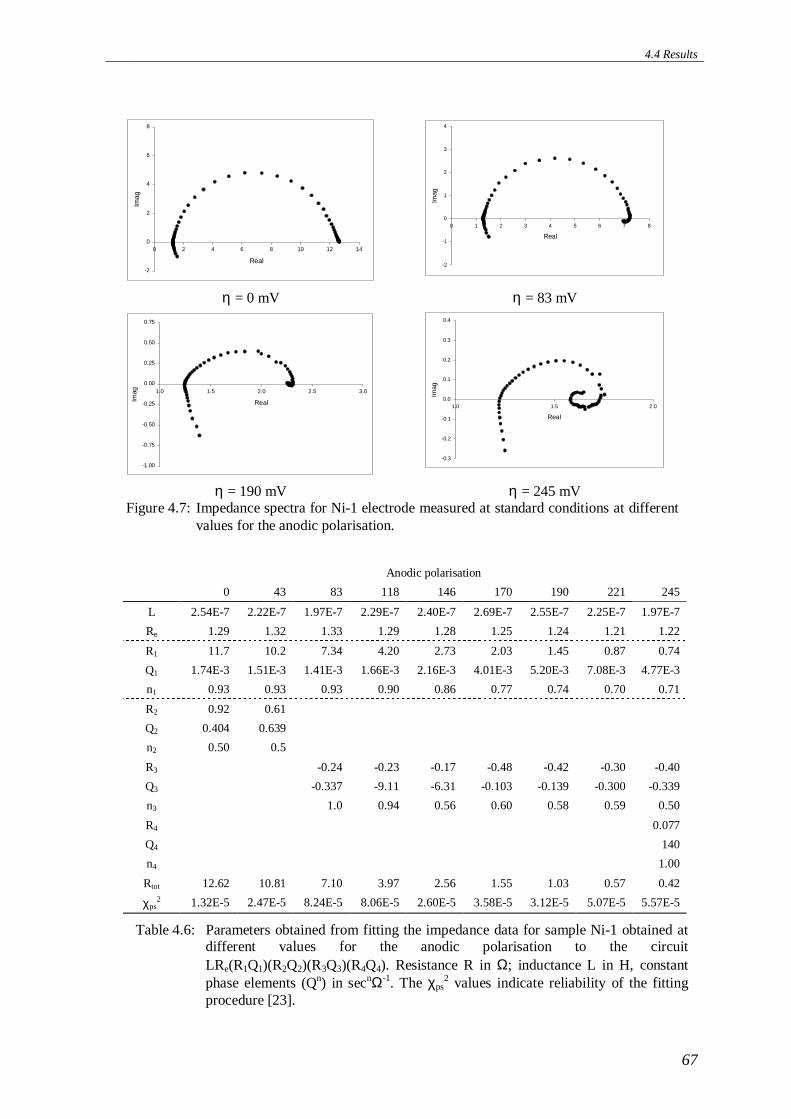
4.4 Results
67
Real
0 2 4 6 8 10 12 14
Imag
-2
0
2
4
6
8
Real
0 1 2 3 4 5 6 7 8
Imag
-2
-1
0
1
2
3
4
η = 0 mV η = 83 mV
Real
1.0 1.5 2.0 2.5 3.0
Imag
-1.00
-0.75
-0.50
-0.25
0.00
0.25
0.50
0.75
Real
1.0 1.5 2.0
Imag
-0.3
-0.2
-0.1
0.0
0.1
0.2
0.3
0.4
η = 190 mV η = 245 mVFigure 4.7: Impedance spectra for Ni-1 electrode measured at standard conditions at different
values for the anodic polarisation.
Anodic polarisation
0 43 83 118 146 170 190 221 245
L 2.54E-7 2.22E-7 1.97E-7 2.29E-7 2.40E-7 2.69E-7 2.55E-7 2.25E-7 1.97E-7
Re 1.29 1.32 1.33 1.29 1.28 1.25 1.24 1.21 1.22
R1 11.7 10.2 7.34 4.20 2.73 2.03 1.45 0.87 0.74
Q1 1.74E-3 1.51E-3 1.41E-3 1.66E-3 2.16E-3 4.01E-3 5.20E-3 7.08E-3 4.77E-3
n1 0.93 0.93 0.93 0.90 0.86 0.77 0.74 0.70 0.71
R2 0.92 0.61
Q2 0.404 0.639
n2 0.50 0.5
R3 -0.24 -0.23 -0.17 -0.48 -0.42 -0.30 -0.40
Q3 -0.337 -9.11 -6.31 -0.103 -0.139 -0.300 -0.339
n3 1.0 0.94 0.56 0.60 0.58 0.59 0.50
R4 0.077
Q4 140
n4 1.00
Rtot 12.62 10.81 7.10 3.97 2.56 1.55 1.03 0.57 0.42
χps2 1.32E-5 2.47E-5 8.24E-5 8.06E-5 2.60E-5 3.58E-5 3.12E-5 5.07E-5 5.57E-5
Table 4.6: Parameters obtained from fitting the impedance data for sample Ni-1 obtained atdifferent values for the anodic polarisation to the circuitLRe(R1Q1)(R2Q2)(R3Q3)(R4Q4). Resistance R in Ω; inductance L in H, constantphase elements (Qn) in secnΩ-1. The χps
2 values indicate reliability of the fittingprocedure [23].
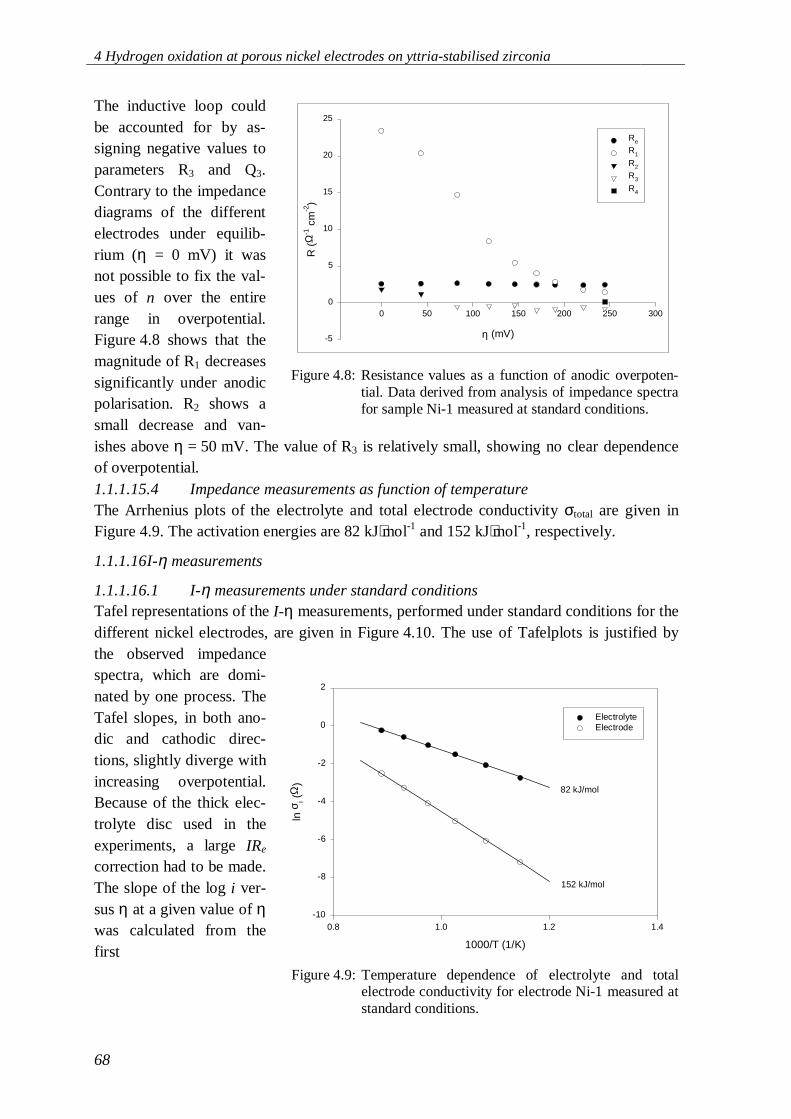
4 Hydrogen oxidation at porous nickel electrodes on yttria-stabilised zirconia
68
The inductive loop couldbe accounted for by as-signing negative values toparameters R3 and Q3.Contrary to the impedancediagrams of the differentelectrodes under equilib-rium (η = 0 mV) it wasnot possible to fix the val-ues of n over the entirerange in overpotential.Figure 4.8 shows that themagnitude of R1 decreasessignificantly under anodicpolarisation. R2 shows asmall decrease and van-ishes above η = 50 mV. The value of R3 is relatively small, showing no clear dependenceof overpotential.1.1.1.15.4 Impedance measurements as function of temperatureThe Arrhenius plots of the electrolyte and total electrode conductivity σtotal are given inFigure 4.9. The activation energies are 82 kJ⋅mol-1 and 152 kJ⋅mol-1, respectively.
1.1.1.16 I-η measurements
1.1.1.16.1 I-η measurements under standard conditionsTafel representations of the I-η measurements, performed under standard conditions for thedifferent nickel electrodes, are given in Figure 4.10. The use of Tafelplots is justified bythe observed impedancespectra, which are domi-nated by one process. TheTafel slopes, in both ano-dic and cathodic direc-tions, slightly diverge withincreasing overpotential.Because of the thick elec-trolyte disc used in theexperiments, a large IRe
correction had to be made.The slope of the log i ver-sus η at a given value of ηwas calculated from thefirst
η (mV)
0 50 100 150 200 250 300R
(Ω
-1 c
m-2
)
-5
0
5
10
15
20
25
Re
R1
R2
R3
R4
Figure 4.8: Resistance values as a function of anodic overpoten-tial. Data derived from analysis of impedance spectrafor sample Ni-1 measured at standard conditions.
1000/T (1/K)
0.8 1.0 1.2 1.4
ln σ
i (Ω
)
-10
-8
-6
-4
-2
0
2
ElectrolyteElectrode
152 kJ/mol
82 kJ/mol
Figure 4.9: Temperature dependence of electrolyte and totalelectrode conductivity for electrode Ni-1 measured atstandard conditions.
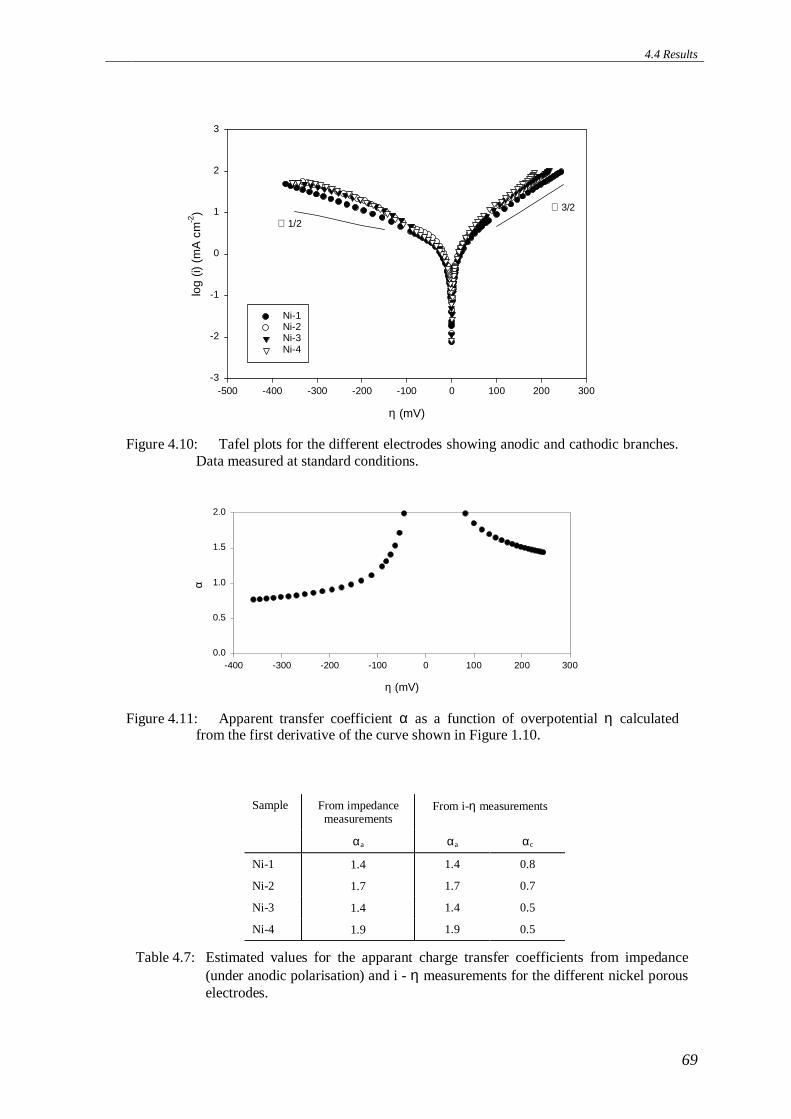
4.4 Results
69
η (mV)
-500 -400 -300 -200 -100 0 100 200 300
log
(i) (
mA
cm
-2)
-3
-2
-1
0
1
2
3
Ni-1Ni-2Ni-3Ni-4
∠ 3/2
∠ 1/2
Figure 4.10: Tafel plots for the different electrodes showing anodic and cathodic branches.Data measured at standard conditions.
η (mV)
-400 -300 -200 -100 0 100 200 300
α
0.0
0.5
1.0
1.5
2.0
Figure 4.11: Apparent transfer coefficient α as a function of overpotential η calculatedfrom the first derivative of the curve shown in Figure 1.10.
Sample From impedancemeasurements
From i-η measurements
αa αa αc
Ni-1 1.4 1.4 0.8
Ni-2 1.7 1.7 0.7
Ni-3 1.4 1.4 0.5
Ni-4 1.9 1.9 0.5
Table 4.7: Estimated values for the apparant charge transfer coefficients from impedance(under anodic polarisation) and i - η measurements for the different nickel porouselectrodes.
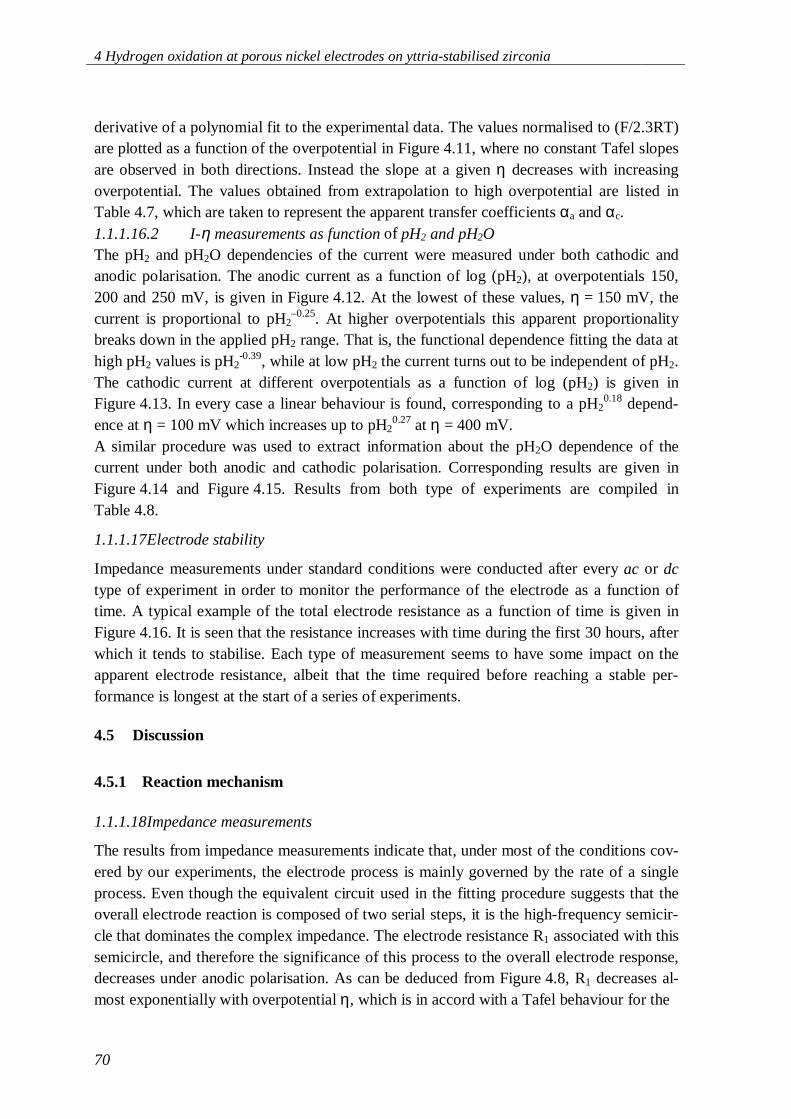
4 Hydrogen oxidation at porous nickel electrodes on yttria-stabilised zirconia
70
derivative of a polynomial fit to the experimental data. The values normalised to (F/2.3RT)are plotted as a function of the overpotential in Figure 4.11, where no constant Tafel slopesare observed in both directions. Instead the slope at a given η decreases with increasingoverpotential. The values obtained from extrapolation to high overpotential are listed inTable 4.7, which are taken to represent the apparent transfer coefficients αa and αc.1.1.1.16.2 I-η measurements as function of pH2 and pH2OThe pH2 and pH2O dependencies of the current were measured under both cathodic andanodic polarisation. The anodic current as a function of log (pH2), at overpotentials 150,200 and 250 mV, is given in Figure 4.12. At the lowest of these values, η = 150 mV, thecurrent is proportional to pH2
–0.25. At higher overpotentials this apparent proportionalitybreaks down in the applied pH2 range. That is, the functional dependence fitting the data athigh pH2 values is pH2
-0.39, while at low pH2 the current turns out to be independent of pH2.The cathodic current at different overpotentials as a function of log (pH2) is given inFigure 4.13. In every case a linear behaviour is found, corresponding to a pH2
0.18 depend-ence at η = 100 mV which increases up to pH2
0.27 at η = 400 mV.A similar procedure was used to extract information about the pH2O dependence of thecurrent under both anodic and cathodic polarisation. Corresponding results are given inFigure 4.14 and Figure 4.15. Results from both type of experiments are compiled inTable 4.8.
1.1.1.17 Electrode stability
Impedance measurements under standard conditions were conducted after every ac or dctype of experiment in order to monitor the performance of the electrode as a function oftime. A typical example of the total electrode resistance as a function of time is given inFigure 4.16. It is seen that the resistance increases with time during the first 30 hours, afterwhich it tends to stabilise. Each type of measurement seems to have some impact on theapparent electrode resistance, albeit that the time required before reaching a stable per-formance is longest at the start of a series of experiments.
4.5 Discussion
4.5.1 Reaction mechanism
1.1.1.18 Impedance measurements
The results from impedance measurements indicate that, under most of the conditions cov-ered by our experiments, the electrode process is mainly governed by the rate of a singleprocess. Even though the equivalent circuit used in the fitting procedure suggests that theoverall electrode reaction is composed of two serial steps, it is the high-frequency semicir-cle that dominates the complex impedance. The electrode resistance R1 associated with thissemicircle, and therefore the significance of this process to the overall electrode response,decreases under anodic polarisation. As can be deduced from Figure 4.8, R1 decreases al-most exponentially with overpotential η, which is in accord with a Tafel behaviour for the
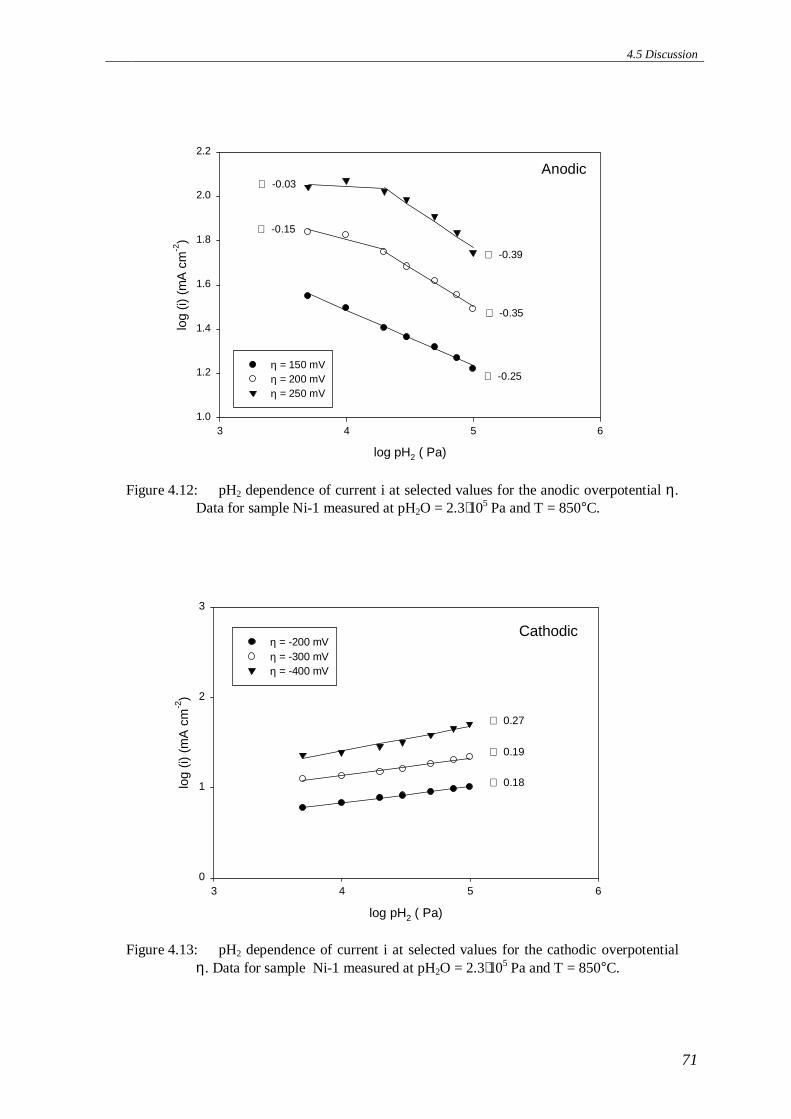
4.5 Discussion
71
log pH2 ( Pa)
3 4 5 6
log
(i) (
mA
cm
-2)
1.0
1.2
1.4
1.6
1.8
2.0
2.2
η = 150 mVη = 200 mVη = 250 mV
∠ -0.25
∠ -0.35
∠ -0.39
∠ -0.15
∠ -0.03Anodic
Figure 4.12: pH2 dependence of current i at selected values for the anodic overpotential η.Data for sample Ni-1 measured at pH2O = 2.3⋅105 Pa and T = 850°C.
log pH2 ( Pa)
3 4 5 6
log
(i) (
mA
cm
-2)
0
1
2
3
η = -200 mVη = -300 mVη = -400 mV
∠ 0.18
∠ 0.19
∠ 0.27
Cathodic
Figure 4.13: pH2 dependence of current i at selected values for the cathodic overpotentialη. Data for sample Ni-1 measured at pH2O = 2.3⋅105 Pa and T = 850°C.
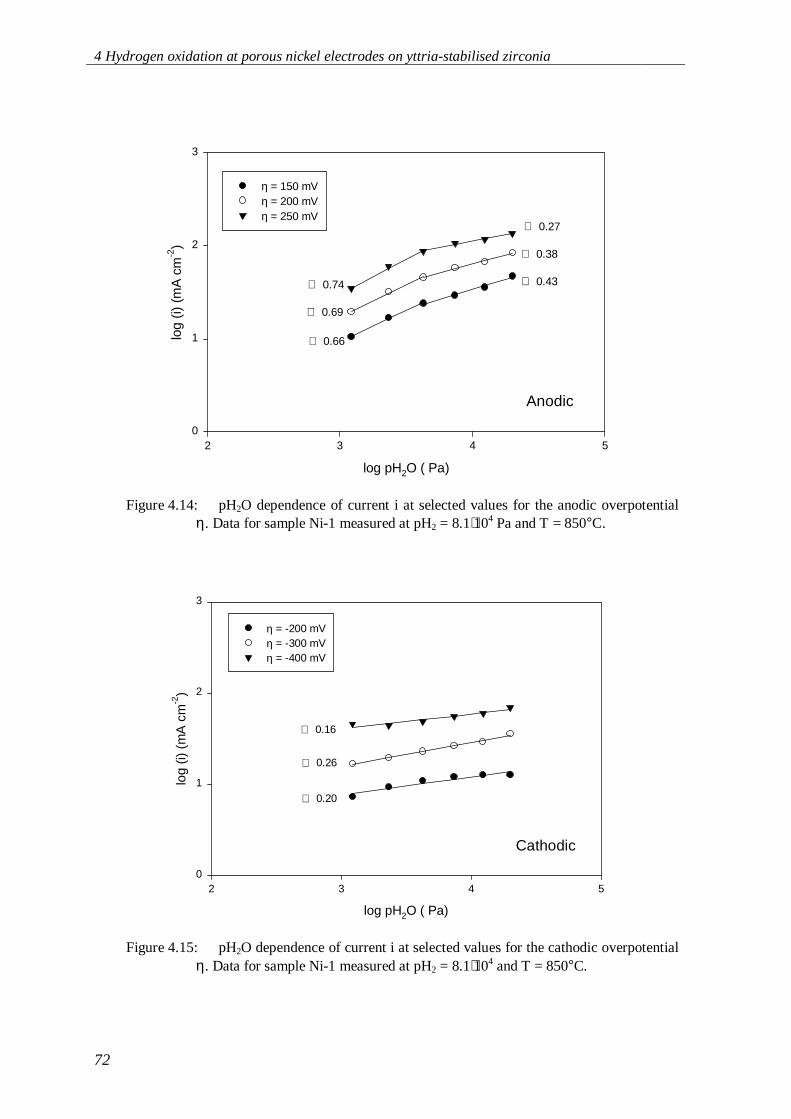
4 Hydrogen oxidation at porous nickel electrodes on yttria-stabilised zirconia
72
log pH2O ( Pa)
2 3 4 5
log
(i) (
mA
cm
-2)
0
1
2
3
η = 150 mVη = 200 mVη = 250 mV
∠ 0.66
∠ 0.69
∠ 0.74 ∠ 0.43
∠ 0.38
∠ 0.27
Anodic
Figure 4.14: pH2O dependence of current i at selected values for the anodic overpotentialη. Data for sample Ni-1 measured at pH2 = 8.1⋅104 Pa and T = 850°C.
log pH2O ( Pa)
2 3 4 5
log
(i) (
mA
cm
-2)
0
1
2
3
η = -200 mVη = -300 mVη = -400 mV
∠ 0.20
∠ 0.26
∠ 0.16
Cathodic
Figure 4.15: pH2O dependence of current i at selected values for the cathodic overpotentialη. Data for sample Ni-1 measured at pH2 = 8.1⋅104 and T = 850°C.
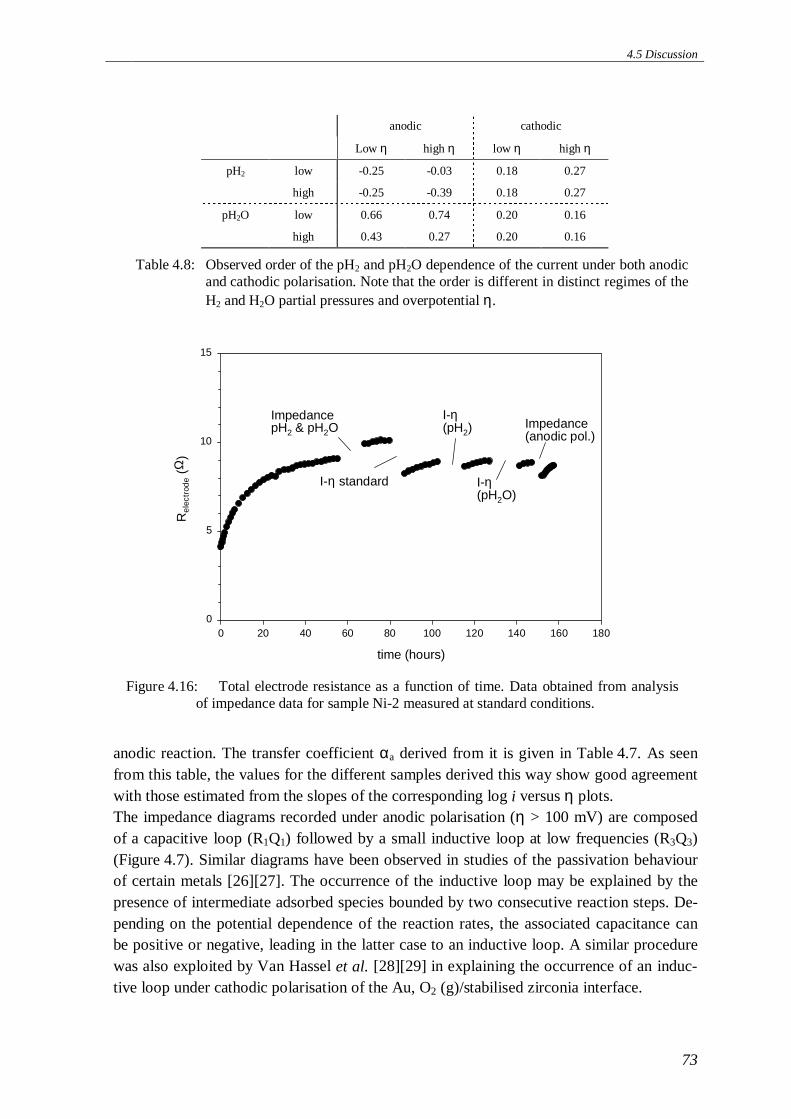
4.5 Discussion
73
anodic reaction. The transfer coefficient αa derived from it is given in Table 4.7. As seenfrom this table, the values for the different samples derived this way show good agreementwith those estimated from the slopes of the corresponding log i versus η plots.The impedance diagrams recorded under anodic polarisation (η > 100 mV) are composedof a capacitive loop (R1Q1) followed by a small inductive loop at low frequencies (R3Q3)(Figure 4.7). Similar diagrams have been observed in studies of the passivation behaviourof certain metals [26][27]. The occurrence of the inductive loop may be explained by thepresence of intermediate adsorbed species bounded by two consecutive reaction steps. De-pending on the potential dependence of the reaction rates, the associated capacitance canbe positive or negative, leading in the latter case to an inductive loop. A similar procedurewas also exploited by Van Hassel et al. [28][29] in explaining the occurrence of an induc-tive loop under cathodic polarisation of the Au, O2 (g)/stabilised zirconia interface.
anodic cathodic
Low η high η low η high η
pH2 low -0.25 -0.03 0.18 0.27
high -0.25 -0.39 0.18 0.27
pH2O low 0.66 0.74 0.20 0.16
high 0.43 0.27 0.20 0.16
Table 4.8: Observed order of the pH2 and pH2O dependence of the current under both anodicand cathodic polarisation. Note that the order is different in distinct regimes of theH2 and H2O partial pressures and overpotential η.
time (hours)
0 20 40 60 80 100 120 140 160 180
Rel
ectr
ode
(Ω)
0
5
10
15
ImpedancepH2 & pH2O
I-η standard
I-η (pH2)
I-η(pH2O)
Impedance(anodic pol.)
Figure 4.16: Total electrode resistance as a function of time. Data obtained from analysisof impedance data for sample Ni-2 measured at standard conditions.
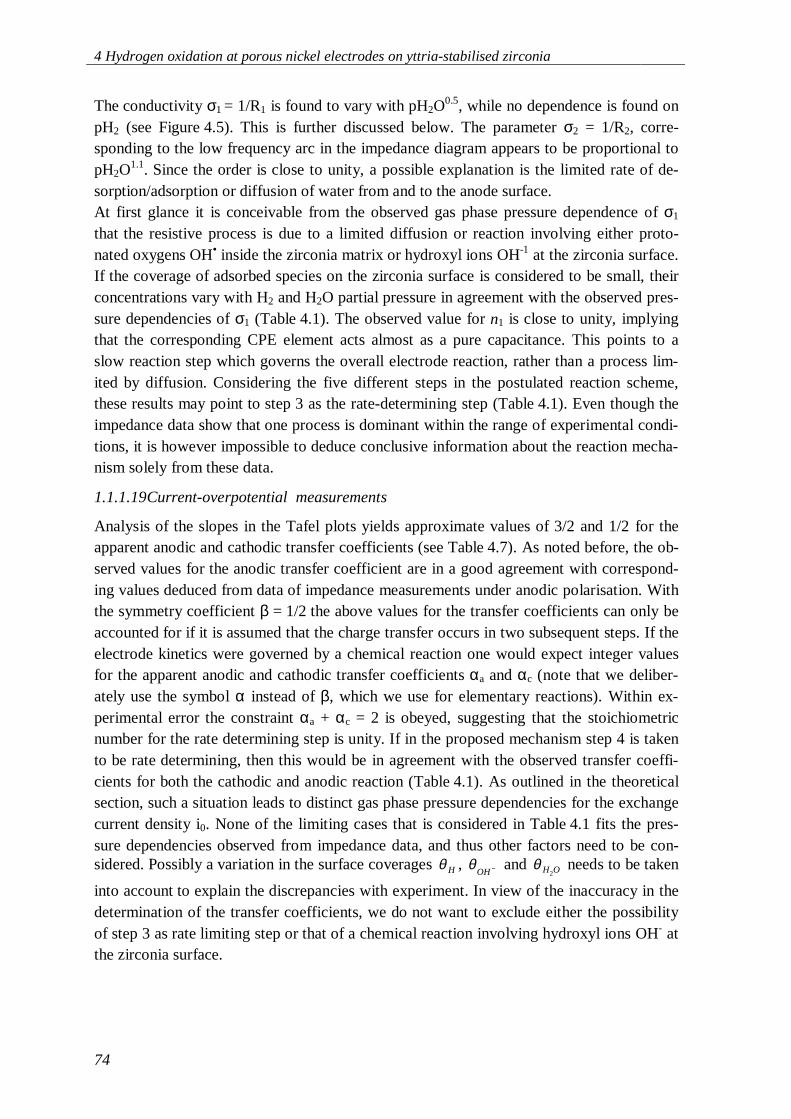
4 Hydrogen oxidation at porous nickel electrodes on yttria-stabilised zirconia
74
The conductivity σ1 = 1/R1 is found to vary with pH2O0.5, while no dependence is found on
pH2 (see Figure 4.5). This is further discussed below. The parameter σ2 = 1/R2, corre-sponding to the low frequency arc in the impedance diagram appears to be proportional topH2O
1.1. Since the order is close to unity, a possible explanation is the limited rate of de-sorption/adsorption or diffusion of water from and to the anode surface.At first glance it is conceivable from the observed gas phase pressure dependence of σ1
that the resistive process is due to a limited diffusion or reaction involving either proto-nated oxygens OH• inside the zirconia matrix or hydroxyl ions OH-1 at the zirconia surface.If the coverage of adsorbed species on the zirconia surface is considered to be small, theirconcentrations vary with H2 and H2O partial pressure in agreement with the observed pres-sure dependencies of σ1 (Table 4.1). The observed value for n1 is close to unity, implyingthat the corresponding CPE element acts almost as a pure capacitance. This points to aslow reaction step which governs the overall electrode reaction, rather than a process lim-ited by diffusion. Considering the five different steps in the postulated reaction scheme,these results may point to step 3 as the rate-determining step (Table 4.1). Even though theimpedance data show that one process is dominant within the range of experimental condi-tions, it is however impossible to deduce conclusive information about the reaction mecha-nism solely from these data.
1.1.1.19 Current-overpotential measurements
Analysis of the slopes in the Tafel plots yields approximate values of 3/2 and 1/2 for theapparent anodic and cathodic transfer coefficients (see Table 4.7). As noted before, the ob-served values for the anodic transfer coefficient are in a good agreement with correspond-ing values deduced from data of impedance measurements under anodic polarisation. Withthe symmetry coefficient β = 1/2 the above values for the transfer coefficients can only beaccounted for if it is assumed that the charge transfer occurs in two subsequent steps. If theelectrode kinetics were governed by a chemical reaction one would expect integer valuesfor the apparent anodic and cathodic transfer coefficients αa and αc (note that we deliber-ately use the symbol α instead of β, which we use for elementary reactions). Within ex-perimental error the constraint αa + αc = 2 is obeyed, suggesting that the stoichiometricnumber for the rate determining step is unity. If in the proposed mechanism step 4 is takento be rate determining, then this would be in agreement with the observed transfer coeffi-cients for both the cathodic and anodic reaction (Table 4.1). As outlined in the theoreticalsection, such a situation leads to distinct gas phase pressure dependencies for the exchangecurrent density i0. None of the limiting cases that is considered in Table 4.1 fits the pres-sure dependencies observed from impedance data, and thus other factors need to be con-sidered. Possibly a variation in the surface coverages θ H , θ
OH− and θ H O2 needs to be taken
into account to explain the discrepancies with experiment. In view of the inaccuracy in thedetermination of the transfer coefficients, we do not want to exclude either the possibilityof step 3 as rate limiting step or that of a chemical reaction involving hydroxyl ions OH- atthe zirconia surface.
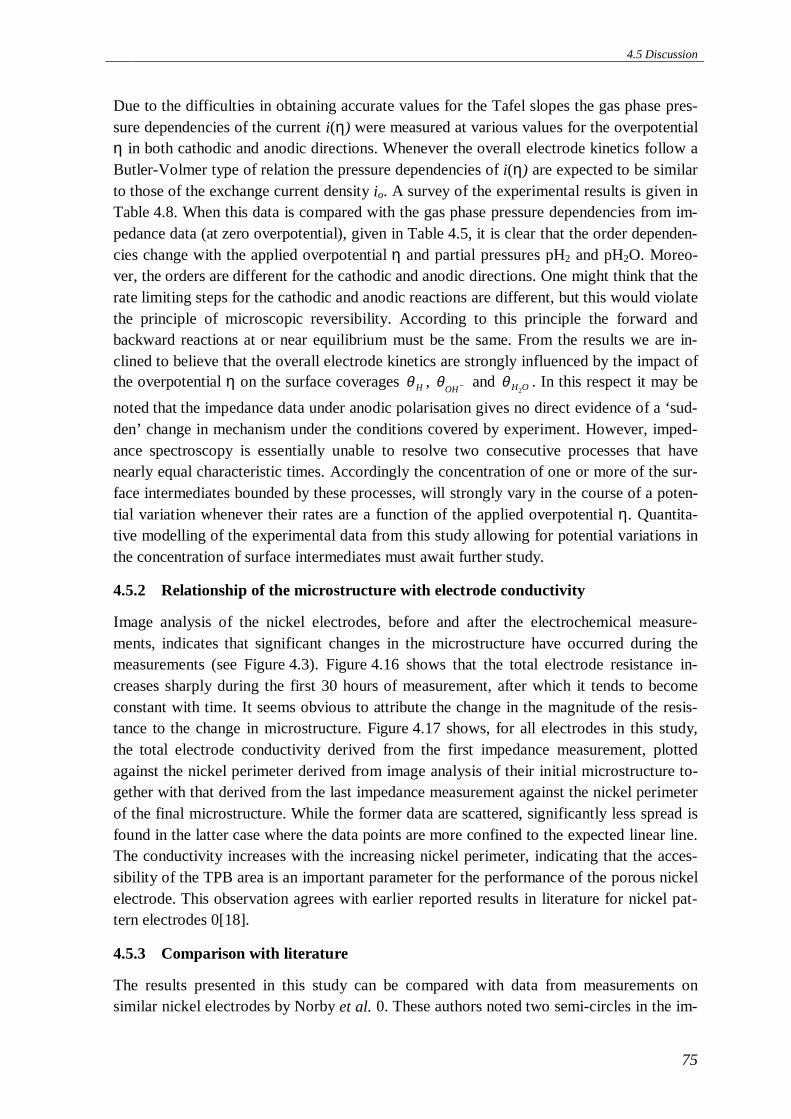
4.5 Discussion
75
Due to the difficulties in obtaining accurate values for the Tafel slopes the gas phase pres-sure dependencies of the current i(η) were measured at various values for the overpotentialη in both cathodic and anodic directions. Whenever the overall electrode kinetics follow aButler-Volmer type of relation the pressure dependencies of i(η) are expected to be similarto those of the exchange current density io. A survey of the experimental results is given inTable 4.8. When this data is compared with the gas phase pressure dependencies from im-pedance data (at zero overpotential), given in Table 4.5, it is clear that the order dependen-cies change with the applied overpotential η and partial pressures pH2 and pH2O. Moreo-ver, the orders are different for the cathodic and anodic directions. One might think that therate limiting steps for the cathodic and anodic reactions are different, but this would violatethe principle of microscopic reversibility. According to this principle the forward andbackward reactions at or near equilibrium must be the same. From the results we are in-clined to believe that the overall electrode kinetics are strongly influenced by the impact ofthe overpotential η on the surface coverages θ H , θ
OH− and θ H O2. In this respect it may be
noted that the impedance data under anodic polarisation gives no direct evidence of a ‘sud-den’ change in mechanism under the conditions covered by experiment. However, imped-ance spectroscopy is essentially unable to resolve two consecutive processes that havenearly equal characteristic times. Accordingly the concentration of one or more of the sur-face intermediates bounded by these processes, will strongly vary in the course of a poten-tial variation whenever their rates are a function of the applied overpotential η. Quantita-tive modelling of the experimental data from this study allowing for potential variations inthe concentration of surface intermediates must await further study.
4.5.2 Relationship of the microstructure with electrode conductivity
Image analysis of the nickel electrodes, before and after the electrochemical measure-ments, indicates that significant changes in the microstructure have occurred during themeasurements (see Figure 4.3). Figure 4.16 shows that the total electrode resistance in-creases sharply during the first 30 hours of measurement, after which it tends to becomeconstant with time. It seems obvious to attribute the change in the magnitude of the resis-tance to the change in microstructure. Figure 4.17 shows, for all electrodes in this study,the total electrode conductivity derived from the first impedance measurement, plottedagainst the nickel perimeter derived from image analysis of their initial microstructure to-gether with that derived from the last impedance measurement against the nickel perimeterof the final microstructure. While the former data are scattered, significantly less spread isfound in the latter case where the data points are more confined to the expected linear line.The conductivity increases with the increasing nickel perimeter, indicating that the acces-sibility of the TPB area is an important parameter for the performance of the porous nickelelectrode. This observation agrees with earlier reported results in literature for nickel pat-tern electrodes 0[18].
4.5.3 Comparison with literature
The results presented in this study can be compared with data from measurements onsimilar nickel electrodes by Norby et al. 0. These authors noted two semi-circles in the im-
4 Hydrogen oxidation at porous nickel electrodes on yttria-stabilised zirconia
76
pedance diagrams, which could be fitted to the equivalent circuit LR0(RctQdl)(RrQr). Meas-urements were carried out at different conditions (pH2 = 120 Pa, pH2O = 630 Pa, 900°C),this complicates direct comparison of their results with those obtained from the presentstudy. The resistance associated with the high frequency semicircle Rct varied approxi-mately with pH2O
-0.5 and was found to be linearly related with the TPB length. These ob-servations fully match the results from the present study. For an electrode specimen havinga total TPB length of 120 m Norby et al. measured a value of 1.6 Ω for Rct. For sample Ni-2 with a TBP length of 121 m we measured under conditions closest to those employed byNorby et al. a value of 4.4 Ω for R1. This value was measured at pH2 = 8⋅104 Pa, pH2O =2⋅104 Pa and 850°C. The similarity is excellent when the difference in temperature appliedin both studies is taken into account. Using the activation energy of 160 kJ.mol-1 from thisstudy, a value of 2.1 Ω at 900°C is calculated. Norby et al. attributed the high-frequencysemicircle to the charge transfer resistance shunted by the double layer capacitance. Thelow frequency semicircle was ascribed to a reaction resistance Rr and associated surfacecoverage of adsorbed species Qr. Due to the different experimental conditions in the studyby Norby et al., it is not entirely clear whether this semicircle ought to be compared withthe small semicircle at the low frequency side found in the present work.
Mizusaki and co-workers [17][18][20]0 have done a series of studies on nickel patternelectrodes on yttria-stabilized single crystals. This approach enables a good control of thevalue of the total TPB length per cm2, a value which is about a factor 10 smaller than thevalue estimated for the porous nickel electrodes in this study. The impedance spectrum of
Nickel perimeter (m/cm2)
30 40 50 60 70 80 90
σ tot (
Ω−1
cm-2
)
0.00
0.05
0.10
0.15
0.20
First experimentLast experiment
Figure 4.17: Total electrode resistance as a function of the nickel perimeter. Data weretaken from analysis of impedance data measured at standard conditions. Thenickel perimeter resulted from image analysis of the electrode microstructure. Theresistance derived from the first impedance measurement is plotted against thenickel perimeter before, and that of the last impedance measurements against thenickel perimeter obtained after finishing the series of electrochemical experimentsindicated.
4.5 Discussion
77
the nickel pattern electrode is governed by a single semicircle, which resembles, except forthe small low frequency arc, the spectra found for the porous nickel electrodes. The totalelectrode resistance is in the range 1.0⋅104 - 1.3⋅104 Ω.m (1.0 - 1.25 m TPB length, 700°C,pH2 = 1.0⋅104 Pa, pH2O = 1.65⋅103 Pa) to be compared with 1.3⋅104 - 1.9⋅104 Ω⋅m (90 – 121 m TPB length, 700°C, pH2 = 1.0⋅105 Pa, pH2O = 2.3⋅103 Pa) for the porous nickel elec-trodes in this study. The above ranges take into account the difference in the TPB length ofboth type of nickel electrodes. Several studies carried out by different authors have stressedthe importance of the TPB length in the overall kinetics of the hydrogen oxidation reactionon Ni/YSZ electrodes 0[18]. The electrode resistance is expected to vary inversely propor-tional to the TPB. This behavior holds over a wide range in TPB length, as described else-where in this thesis where the results from different type of electrodes used are compared(Chapter 9).
Expressions for the current i, for H2 to H2O oxidation on nickel pattern electrodes havebeen, presented by Mizusaki et al. 0. As these expressions were derived from experimentsin which not the overpotential η but rather the potential E was fixed (relative to Pt/air),comparison of the results obtained with those from the present study is not straightforward.The following rate expression was obtained by Mizusaki et al. from current measurementsunder anodic and cathodic polarization,i k pH e k pH O ef
fEb
fE= − −2
22
1 2/ (4.26)
The observed transfer coefficients αa = 2 and αc = 1 differ from the values αa = 3/2 and αc
= 1/2 found in this study. Equation (4.26) clearly contradicts the concept of a single rate-determining step as the reaction orders for both anodic and cathodic reaction are different.Hence this equation cannot be valid at conditions near to equilibrium (η ≅ 0), where theprinciple of microscopic reversibility must apply. Since, by definition, η = E - Eeq, one getsupon substitution,
i k pH e e k pH O e e
k pH O e k pH e
ffE f E E
bfE f E E
ff
bf
eq eq eq eq= −
= −
− − − −
−
22 2
21 2
22
21 2
/
' ' /η η(4.27)
where additional use is made of the exponential form of the Nernst equation (Eq. (4.20)).The meaning of the forward and backward rate constants kf and kb have slightly alteredfrom that given in Eq. (4.26), as indicated by the prime notation. The values for the pH2
and pH2O dependencies indicated in Eq. (4.27) may be compared with those given inTable 4.8. The obvious reason for the moderate agreement obtained is the difference in theexperimental approaches in both studies as outlined above. Another difficulty lies in identi-fying linear Tafel regions in log (i) versus η plots for both the cathodic and anodic reac-tions, which affects the pH2 and pH2O dependencies obtained in Eq. (4.27). The importantfeature observed in both studies is the changing gas phase pressure dependencies with ap-plied (over-) potential. Mizusaki and co-workers [20] proposed another rate expression forthe cathodic current under high polarisation values. All these results seem to support theconclusion drawn in the previous section that the electrode kinetics cannot be interpreted interms of a single rate-determining step.

4 Hydrogen oxidation at porous nickel electrodes on yttria-stabilised zirconia
78
4.6 Concluding remarks
The assumptions generally made in treating multi-step electrode kinetics are that one stepis rate determining and that the steps before and afterward are in virtual equilibrium. Theresults from this study put evidence forward that such a simple description does not holdfor the hydrogen oxidation reaction at porous nickel electrodes on stabilised zirconia. Theobserved H2 and H2O pressure dependency on the properties of these electrodes, varyingwith the applied overpotential, suggest that concomitant changes in the fractional coverageof adsorbed intermediates occur either on nickel or zirconia. Whenever limited by two con-secutive processes, whose rates are activation controlled, also the intermediate concentra-tion will vary in the course of potential variations. Hence the surface coverage of the in-termediate may strongly depart from the coverage under virtual equilibrium conditions,which is one of the tacit assumptions in classical analysis of the electrode kinetics.Within the experimental range 45 - 61 m/cm2 the electrochemical performance of the po-rous nickel electrode relates with the exposed length of the nickel perimeter (expected tobe related with TPB). Similar observations have been made by others 0[18] and these sug-gest that the rate determining reaction step(s) take(s) place at or in the near vicinity of thisboundary line. The data from impedance measurements shows that the significance of thisstep to the overall electrode performance decreases under anodic polarisation. In cermetstructures of Ni/YSZ its contribution to the overall kinetics therefore may become mixedwith contributions of another kind.
Acknowledgement
Ms. M. Gonzalez is thanked for performing part of the measurements.
References
[1] S.C. Singhal, ‘Status of Solid Oxide Fuel Cell Technology’, Proceedings of the 17th Risø International Symposiumon Materials Science, High temperature Electrochemistry: Ceramics and Metals, 123-38, 1996.
[2] C. Bagger, N. Christiansen, P.V. Hendriksen, E.J. Jensen, S.S. Larsen, M. Mogensen, ‘Techno- Economic Problemsof SOFC Commercialization, Proceedings of the 17th Risø International Symposium on Materials Science, Hightemperature Electrochemistry: Ceramics and Metals, 167-74, 1996.
[3] T. Jacobsen, B. Zachau-Christiansen, L. Bay and S. Skaarup, ‘SOFC Cathode Mechanisms’, Proceedings of the 17th
Risø International Symposium on Materials Science, High temperature Electrochemistry: Ceramics and Metals, 29-40, 1996.
[4] F.H. van Heuveln, H.J.M. Bouwmeester, and F.P.F. van Berkel, ‘Electrode Properties of Sr-Doped LaMnO3 onYttria-Stabilized Zirconia, I. Three Phase Boundary Area’, J. Electrochem. Soc., 144, 126-33, 1997.
[5] F.H. van Heuveln, H.J.M. Bouwmeester, ‘Electrode Properties of Sr-Doped LaMnO3 on Yttria-Stabilized Zirconia,I. Electrode kinetics’, J. Electrochem. Soc., 144, 134-40, 1997.
[6] S. Primdahl and M. Mogensen, ‘Oxidation of Hydrogen on Ni/Yttria-Stabilized Zirconia Cermet Anodes’, J. Elec-trochem. Soc., 144, 3409-19, 1997.
[7] T. Kawada, N. Sakai, H. Yokokawa, M. Dokiya, M. Mori and T. Iwata, ‘Characteristics of slurry-coated nickelzirconia cermet anodes for solid oxide fuel cells, J. Electrochem. Soc. 137, 10 , 3042-47, 1990.
[8] F.P.F. van Berkel, F.H. van Heuveln and J.P.P. Huijsmans, ‘Characterisation of Solid Oxide Fuel Cell Electrodes byImpedance Spectroscopy and I-V Characteristics’, SSI, 72, 240-47, 1994.
[9] J. Divisek, A. Kornyshev, W. Lehnert, U. Stimming, I.C. Vinke and K. Wioppermann, ‘Advanced characterisationtechniques for Nickel-YSZ Cermet Electrodes used in Solid Oxide Fuel Cells’, Electrochemical Proceedings Vol-ume 97-18, 606-16, 1997.
[10] A. Ioselevich, A.A. Kornyshev and W. Lehnert, ‘Degradation of SOFC Anodes due to Sintering of Metal Particles:Correlated Percolation Model’, J. Electroch. Soc., 144, 3010-19, 1997.
[11] H. Itoh, T. Yamamoto, M. Mori, T. Horita, N. Sakai, H. Yokokawa and M. Dokiya, ‘Configurational and ElectricalBehavior of Ni-YSZ Cermet with Novel Microstructure for Solid Oxide Fuel Cell Anodes, J. Electrochem. Soc.144, 641-46, 1997.
[12] N.Q. Minh, ‘Ceramic Fuel Cells’, J. Am. Ceram. Soc., 76, 563-88, 1993.

4.6 Concluding remarks
79
[13] J. Guindet, C. Roux, and A. Hammou, 'Hydrogen oxidation at the Ni/Zirconia electrode', pp.553-58 in: Proc. of the2nd Int. Symp. on Solid Oxide Fuel Cells, Athens, Greece, July 2-5, 1991.
[14] F.Z. Mohamedi-Boulenouar, J. Guindet and A. Hammou, ‘Influence of Water Vapour on Electrochemical Oxida-tion of Hydrogen at the Ni/Zirconia Interface’, pp 441-50 in: Proc. of the 17th Risø Int. Symp. on Material Science:High Temp. Electrochemistry: Ceramics and Metals, Roskilde, Denmark, 1996.
[15] P.A. Osborg, T. Norby, ‘Characterisation of a H2+H2O/Ni/YSZ point electrode system by impedance spectroscopy’,pp47-50, in 7th SOFC Workshop, theory and measurement of microscale processes in Solid Oxide Fuel Cells, Wa-dahl, Norway, 18-20 Jan., 1995.
[16] T. Norby, O.J. Velle, H. Leth-Olsen and R. Tunold, 'Reaction resistance in relation to three phase boundary lengthof Ni/YSZ electrodes', pp.473-78 in: Proc. Of the 3rd Int. Symp. On Solid Oxide Fuel Cells, Honolulu, Hawaii,1993.
[17] J. Mizusaki, H. Tagawa, T. Saito, K. Kamitani, T. Yamamura, K. Hirano, S. Ehara, T. Takagi, T. Hikita, M. Ip-pommatsu and S. Nakagawa, 'Preparation of Nickel pattern electrodes on YSZ and their electrochemical propertiesin H2-H2O atmospheres'; pp. 533-41 in: Proc. Of the 3rd Int. Symp. On Solid Oxide Fuel Cells, Honolulu, Hawaii,1993.
[18] J. Mizusaki, H. Tagawa, T. Saito, K. Kamitain, T. Yamamura, K. Hirano, S. Ehara, T. Takagi, T. Hikita, M. Ip-pommatsu, S. Nakagawa, K. Hashimoto, ‘Preparation of Nickel Pattern Electrodes on YSZ and Their Electrochemi-cal Properties in H2-H2O Atmospheres, J. Electrochem. Soc., 141, 2129-34, 1994.
[19] J. Mizusaki, H. Tagawa, T. Saito, T. Yamamura, K. Kamitani, K. Hirano, S. Ehara, T. Takagi, T. Hikita, M. Ip-pommatsu, S. Nakagawa, K. Hashimoto, 'Kinetic studies of the reaction at the nickel pattern electrode on YSZ inH2-H2O atmospheres', Solid State Ionics, 70/71, 52-58, 1994.
[20] J. Mizusaki, T. Yamamura, H. Yoshitake, H. Tagawa, K. Hirano, S. Ehara, T. Takagi, M. Hishinuma, H. Sasaki, T.Sogi, Y. Nakamura, and K. Hishimoto, ‘Kinetic studies on Ni/YSZ anode reaction of SOFC in H2-H2O atmospheresby the use of Nickel pattern electrodes‘, pp 363-68 in: Proc. of the 17th Risø Int. Symp. on Material Science: HighTemp. Electrochemistry: Ceramics and Metals, Roskilde, Denmark, 1996.
[21] T. Yamamura, H. Tagawa, T. Saito, J. Mizusaki, K. Kamitani, K. Hirano, S. Ehara, T. Takagi, Y. Hishinuma, H.Sasaki, T. Sogi, Y. Nakamura, K. Hashimoto, ‘Reaction Kinetics at the Nickel Pattern Electrode on YSZ and its de-pendence on Temperature’, Proc. of the 4th Int. Symp. On SOFC-IV, pp 741-49, Yokohama, Japan, 1995.
[22] M. Mogensen, S. Sunde and S. Primdahl, ‘SOFC Anode Kinetics’, pp 77-100 in: Proc. of the 17th Risø Int. Symp.on Material Science: High Temp. Electrochemistry: Ceramics and Metals, Roskilde, Denmark, 1996.
[23] B.A. Boukamp, ‘A Nonlinear least squares Fit Procedure for Analysis of Immittance data of Electrochemical Sys-tems’, Solid State Ionics, 20, 31-44, 1986.
[24] J.R. MacDonald, Impedance Spectroscopy, John Wiley and sons, 1987.[25] F.P.F. van Berkel, J.P. de Jong, ‘De Relatie tussen de Morfologie en de Electrochemische Eigenschappen van
Ni/YSZ Anodematerialen’, ECN Internal Report, 2918-GR14,1993.[26] I. Epelboin, M. Keddam, and J.C. Lestrade, ‘Faradaic Impedances and Intermediates in Electrochemical Reactions’,
Faradaic Impedances and Intermediates in Electrochemical Reactions, Disc. Faraday Soc. 56, 264-275, 1973.[27] I. Epelboin, C. Gabrielli, M. Keddam and H. Takenouti, ‘The Study of the Passivation Process by the Electrode
Impedance Analysis’, Chapter 3 of Comprehensive Treatise of Electrochem., Ed. J. O’M Bockris, B.E. Conway, E.Yeager and R.E. White, 151-94, New York/London, Plenium 1981.
[28] B.A. van Hassel, B.A. Boukamp, A.J. Burggraaf, ‘Electrode Polarisation at the Au, O2(g) /Yttria Stabilized ZirconiaInterface, I Theoretical Considerations of Reaction Model’, Solid State Ionics, 48, 139-54, 1991.
[29] B.A. van Hassel, B.A. Boukamp, A.J. Burggraaf, ‘Electrode Polarisation at the Au, O2(g) /Yttria Stabilized ZirconiaInterface, II Electrochemical measurements and Analysis’, Solid State Ionics, 48, 155-71, 1991.

81
5 Hydrogen oxidation at porous nickel electrodes onyttria-stabilised zirconia: Effect of surface
modification with fine YSZ.
Abstract
Investigations have been performed in order to elucidate the role of zirconia in the nickel-zirconia cermet used as anode in solid oxide fuel cells. Instead of the cermet electrode, thehydrogen oxidation reaction has been studied at porous nickel electrodes whose surfaceshave been modified by dispersion with fine particles of yttria-stabilised zirconia. The sur-face modification leads to a significant improvement in the electrochemical activity com-pared with the bare porous nickel electrodes. The results are explained in terms of an in-creased number of reaction sites. The very similar polarisation and impedance behaviour atdifferent H2 and H2O partial pressures, compared with that observed for the bare nickelelectrodes, gives strong credence for this hypothesis.
5.1 Introduction
In Solid Oxide Fuel Cells (SOFC), the porous cermet made of nickel and yttria-stabilisedzirconia (Ni/YSZ) is generally used as anode material [1]0. The major purpose of the po-rous structure is the customary one: creating a large internal surface to keep local currentdensities and overpotentials low while achieving a large external current density. At pres-ent however, there is no consensus about the detailed kinetics of, e.g., the hydrogen oxida-tion reaction on Ni/YSZ cermet electrodes. The precise function and relative importance ofthe cermet components are unclear. From one point of view the presence of YSZ acts as asupport for the nickel particles, preventing them from sintering together, as well as pro-viding a better thermal match with the electrolyte 0. Along this view the important steps inthe electrode reaction would take place on the nickel surface, at or in the near vicinity ofthe triple-phase-boundary line (TPB) between electrode, electrolyte and gas phase. An al-ternative view is to assign a definite active role in the electrochemistry to the YSZ compo-nent 000000.In a previous study we have investigated porous nickel electrodes by steady-state polarisa-tion measurements and complex impedance spectroscopy. Electrodes with a variable mi-crostructure were obtained by using a different layer thickness, annealing time and tem-
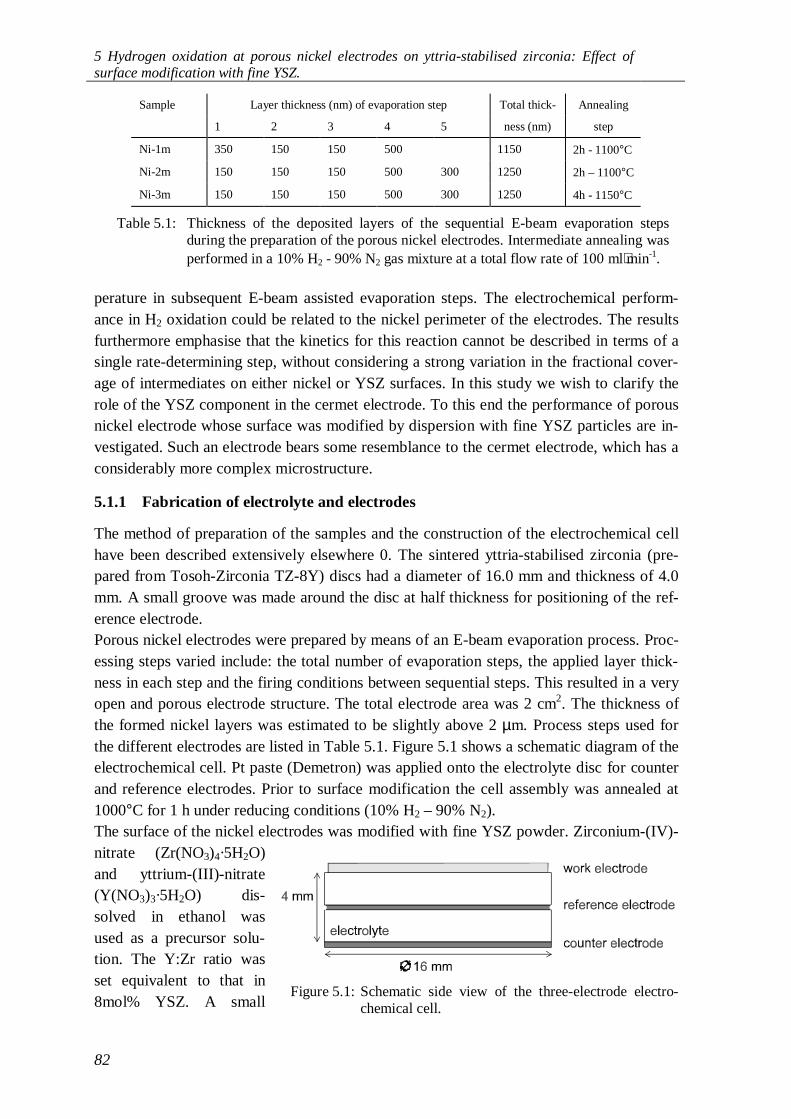
5 Hydrogen oxidation at porous nickel electrodes on yttria-stabilised zirconia: Effect ofsurface modification with fine YSZ.
82
perature in subsequent E-beam assisted evaporation steps. The electrochemical perform-ance in H2 oxidation could be related to the nickel perimeter of the electrodes. The resultsfurthermore emphasise that the kinetics for this reaction cannot be described in terms of asingle rate-determining step, without considering a strong variation in the fractional cover-age of intermediates on either nickel or YSZ surfaces. In this study we wish to clarify therole of the YSZ component in the cermet electrode. To this end the performance of porousnickel electrode whose surface was modified by dispersion with fine YSZ particles are in-vestigated. Such an electrode bears some resemblance to the cermet electrode, which has aconsiderably more complex microstructure.
5.1.1 Fabrication of electrolyte and electrodes
The method of preparation of the samples and the construction of the electrochemical cellhave been described extensively elsewhere 0. The sintered yttria-stabilised zirconia (pre-pared from Tosoh-Zirconia TZ-8Y) discs had a diameter of 16.0 mm and thickness of 4.0mm. A small groove was made around the disc at half thickness for positioning of the ref-erence electrode.Porous nickel electrodes were prepared by means of an E-beam evaporation process. Proc-essing steps varied include: the total number of evaporation steps, the applied layer thick-ness in each step and the firing conditions between sequential steps. This resulted in a veryopen and porous electrode structure. The total electrode area was 2 cm2. The thickness ofthe formed nickel layers was estimated to be slightly above 2 µm. Process steps used forthe different electrodes are listed in Table 5.1. Figure 5.1 shows a schematic diagram of theelectrochemical cell. Pt paste (Demetron) was applied onto the electrolyte disc for counterand reference electrodes. Prior to surface modification the cell assembly was annealed at1000°C for 1 h under reducing conditions (10% H2 – 90% N2).The surface of the nickel electrodes was modified with fine YSZ powder. Zirconium-(IV)-nitrate (Zr(NO3)4·5H2O)and yttrium-(III)-nitrate(Y(NO3)3·5H2O) dis-solved in ethanol wasused as a precursor solu-tion. The Y:Zr ratio wasset equivalent to that in8mol% YSZ. A small
Sample Layer thickness (nm) of evaporation step Total thick- Annealing
1 2 3 4 5 ness (nm) step
Ni-1m 350 150 150 500 1150 2h - 1100°C
Ni-2m 150 150 150 500 300 1250 2h – 1100°C
Ni-3m 150 150 150 500 300 1250 4h - 1150°C
Table 5.1: Thickness of the deposited layers of the sequential E-beam evaporation stepsduring the preparation of the porous nickel electrodes. Intermediate annealing wasperformed in a 10% H2 - 90% N2 gas mixture at a total flow rate of 100 ml⋅min-1.
Figure 5.1: Schematic side view of the three-electrode electro-chemical cell.
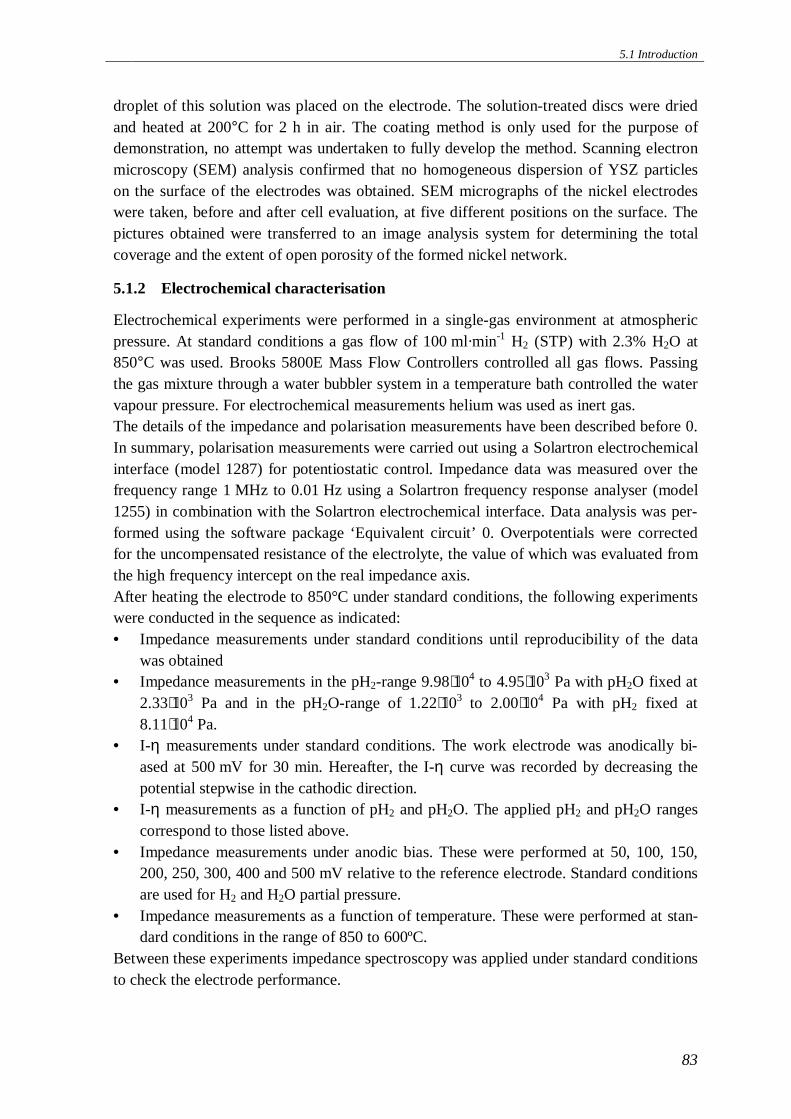
5.1 Introduction
83
droplet of this solution was placed on the electrode. The solution-treated discs were driedand heated at 200°C for 2 h in air. The coating method is only used for the purpose ofdemonstration, no attempt was undertaken to fully develop the method. Scanning electronmicroscopy (SEM) analysis confirmed that no homogeneous dispersion of YSZ particleson the surface of the electrodes was obtained. SEM micrographs of the nickel electrodeswere taken, before and after cell evaluation, at five different positions on the surface. Thepictures obtained were transferred to an image analysis system for determining the totalcoverage and the extent of open porosity of the formed nickel network.
5.1.2 Electrochemical characterisation
Electrochemical experiments were performed in a single-gas environment at atmosphericpressure. At standard conditions a gas flow of 100 ml·min-1 H2 (STP) with 2.3% H2O at850°C was used. Brooks 5800E Mass Flow Controllers controlled all gas flows. Passingthe gas mixture through a water bubbler system in a temperature bath controlled the watervapour pressure. For electrochemical measurements helium was used as inert gas.The details of the impedance and polarisation measurements have been described before 0.In summary, polarisation measurements were carried out using a Solartron electrochemicalinterface (model 1287) for potentiostatic control. Impedance data was measured over thefrequency range 1 MHz to 0.01 Hz using a Solartron frequency response analyser (model1255) in combination with the Solartron electrochemical interface. Data analysis was per-formed using the software package ‘Equivalent circuit’ 0. Overpotentials were correctedfor the uncompensated resistance of the electrolyte, the value of which was evaluated fromthe high frequency intercept on the real impedance axis.After heating the electrode to 850°C under standard conditions, the following experimentswere conducted in the sequence as indicated:• Impedance measurements under standard conditions until reproducibility of the data
was obtained• Impedance measurements in the pH2-range 9.98⋅104 to 4.95⋅103 Pa with pH2O fixed at
2.33⋅103 Pa and in the pH2O-range of 1.22⋅103 to 2.00⋅104 Pa with pH2 fixed at8.11⋅104 Pa.
• I-η measurements under standard conditions. The work electrode was anodically bi-ased at 500 mV for 30 min. Hereafter, the I-η curve was recorded by decreasing thepotential stepwise in the cathodic direction.
• I-η measurements as a function of pH2 and pH2O. The applied pH2 and pH2O rangescorrespond to those listed above.
• Impedance measurements under anodic bias. These were performed at 50, 100, 150,200, 250, 300, 400 and 500 mV relative to the reference electrode. Standard conditionsare used for H2 and H2O partial pressure.
• Impedance measurements as a function of temperature. These were performed at stan-dard conditions in the range of 850 to 600ºC.
Between these experiments impedance spectroscopy was applied under standard conditionsto check the electrode performance.
5 Hydrogen oxidation at porous nickel electrodes on yttria-stabilised zirconia: Effect ofsurface modification with fine YSZ.
84
5.2 Results
Below are the experimental observations made on the modified nickel electrodes dis-cussed. Data obtained for the bare nickel electrodes has been presented and discussedelsewhere in this thesis 0.
5.2.1 Microstructure
Figure 5.2 shows the microstructure of both bare and modified nickel electrodes after cellevaluation. From these it can be seen that the nickel forms a continuous network with con-siderable open porosity. To obtain a variable microstructure the electrodes were fired aftersuccessive E-beam evaporation steps at 1100-1150°C (for 2-4h in 10%H2 – 90%N2), tem-peratures much higher those that during the measurements. Five SEM pictures at differentpositions on the surface were used for image analysis. These images covered together0.006% of the electrode area. From these the surface coverage and the total perimeter ofthe nickel particles contributing to the network were estimated. Results from SEM picturestaken before and after cell evaluation are listed in Table 5.2.Although the total perimeter of the nickel network in Table 5.2 is expected to be related tothe TPB length, it is not immediately clear from the SEM analysis whether there are differ-
(a) (b)
(c) (d)Figure 5.2: SEM micrographs of (a) & (b) a bare and (c) & (d) modified porous nickel elec-
trode, taken after completing the electrochemical measurements.
5.2 Results
85
ences between both types of electrodes on a smaller microscopic level. Figure 5.2 showsthat, in the case of the modified electrode, small YSZ particles are apparent on the nickelsurface as residues of the solution-treatment. Sometimes these residues appeared in theform of flakes (not shown). Also some roughening effect of the electrolyte surface is ap-parent, which could be caused by a thin layer of small YSZ particles. To which extent thepresence of small YSZ particles contributes to the TPB length effective for the modifiedelectrode cannot be judged from the SEM observations.
5.2.2 Electrochemical performance
1.1.1.20 Impedance Spectroscopy
1.1.1.20.1 Impedance measurements under standard conditionsThe bare and modified nickel electrodes give similar spectra. Impedance representations(measured at zero bias) of the different modified nickel electrodes are given in Figure 5.3.In general, data could be fitted to the equivalent circuit LwRe(R1Q1)(R2Q2), where L is aninductance, R a resistance and Q designates the impedance of a constant phase element(CPE). The latter is given by ZCPE=1/Q(iω)n, where i is the imaginary unit, ω the angularfrequency and n the frequency power. For the electrode Ni-3m the arc (R2Q2) could not betaken into account accurately. Parameters obtained from fitting are listed in Table 5.3.The inductance Lw is ascribed to leads and instruments. Re is the uncompensated electro-lyte resistance. The values for Re, given in Table 5.3, may be compared with 1.4 Ω calcu-lated assuming a specific conductivity for YSZ of 0.1 Ω-1⋅cm-1 0. The series combinationof (RQ)’s describe the electrode response. To enable a more meaningful comparison ofdata the frequency powers n1 and n2 were fixed during fitting to values 0.93 en 0.5, respec-tively (for Ni-3m, n1 = 0.84). The reliability of the fitting procedure is indicated by χps
2 inTable 5.3 0. The (R1Q1) arc is found to be dominant and makes up a contribution
Perimeter of nickel network (m/cm2)
Before measurements After measurements
Sample average deviation average stdev
Ni-1m 45 2 53 3
Ni-2m 59 3 54 4
Ni-3m 59 5 59 6
Surface coverage Ni (%)
Before measurements Aftere measurements
Sample average deviation average stdev
Ni-1m 60 2 55 2
Ni-2m 76 3 73 4
Ni-3m 69 3 65 2
Table 5.2: Results from image analysis on the nickel structure of modified porous nickelelectrodes before and after electrochemical experiments. Average values are givenfrom data taken at five different positions at the surface.
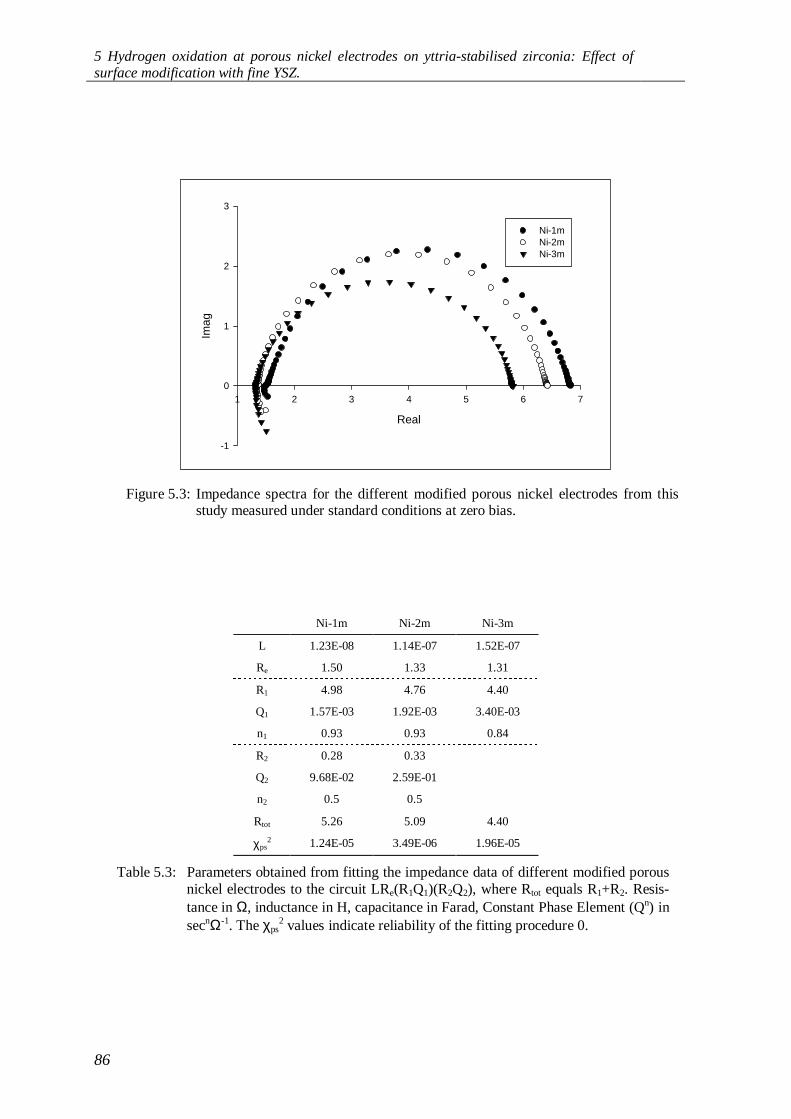
5 Hydrogen oxidation at porous nickel electrodes on yttria-stabilised zirconia: Effect ofsurface modification with fine YSZ.
86
Real
1 2 3 4 5 6 7
Imag
-1
0
1
2
3
Ni-1mNi-2mNi-3m
Figure 5.3: Impedance spectra for the different modified porous nickel electrodes from thisstudy measured under standard conditions at zero bias.
Ni-1m Ni-2m Ni-3m
L 1.23E-08 1.14E-07 1.52E-07
Re 1.50 1.33 1.31
R1 4.98 4.76 4.40
Q1 1.57E-03 1.92E-03 3.40E-03
n1 0.93 0.93 0.84
R2 0.28 0.33
Q2 9.68E-02 2.59E-01
n2 0.5 0.5
Rtot 5.26 5.09 4.40
χps2 1.24E-05 3.49E-06 1.96E-05
Table 5.3: Parameters obtained from fitting the impedance data of different modified porousnickel electrodes to the circuit LRe(R1Q1)(R2Q2), where Rtot equals R1+R2. Resis-tance in Ω, inductance in H, capacitance in Farad, Constant Phase Element (Qn) insecnΩ-1. The χps
2 values indicate reliability of the fitting procedure 0.
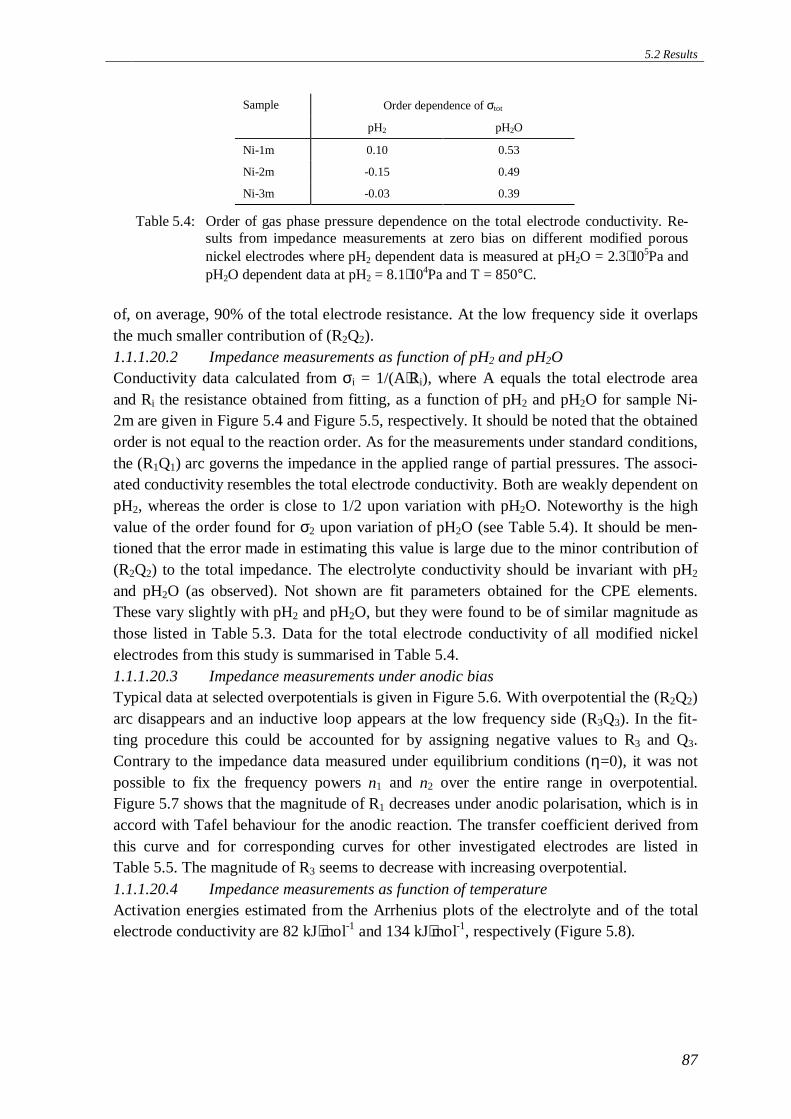
5.2 Results
87
of, on average, 90% of the total electrode resistance. At the low frequency side it overlapsthe much smaller contribution of (R2Q2).1.1.1.20.2 Impedance measurements as function of pH2 and pH2OConductivity data calculated from σi = 1/(A⋅Ri), where A equals the total electrode areaand Ri the resistance obtained from fitting, as a function of pH2 and pH2O for sample Ni-2m are given in Figure 5.4 and Figure 5.5, respectively. It should be noted that the obtainedorder is not equal to the reaction order. As for the measurements under standard conditions,the (R1Q1) arc governs the impedance in the applied range of partial pressures. The associ-ated conductivity resembles the total electrode conductivity. Both are weakly dependent onpH2, whereas the order is close to 1/2 upon variation with pH2O. Noteworthy is the highvalue of the order found for σ2 upon variation of pH2O (see Table 5.4). It should be men-tioned that the error made in estimating this value is large due to the minor contribution of(R2Q2) to the total impedance. The electrolyte conductivity should be invariant with pH2
and pH2O (as observed). Not shown are fit parameters obtained for the CPE elements.These vary slightly with pH2 and pH2O, but they were found to be of similar magnitude asthose listed in Table 5.3. Data for the total electrode conductivity of all modified nickelelectrodes from this study is summarised in Table 5.4.1.1.1.20.3 Impedance measurements under anodic biasTypical data at selected overpotentials is given in Figure 5.6. With overpotential the (R2Q2)arc disappears and an inductive loop appears at the low frequency side (R3Q3). In the fit-ting procedure this could be accounted for by assigning negative values to R3 and Q3.Contrary to the impedance data measured under equilibrium conditions (η=0), it was notpossible to fix the frequency powers n1 and n2 over the entire range in overpotential.Figure 5.7 shows that the magnitude of R1 decreases under anodic polarisation, which is inaccord with Tafel behaviour for the anodic reaction. The transfer coefficient derived fromthis curve and for corresponding curves for other investigated electrodes are listed inTable 5.5. The magnitude of R3 seems to decrease with increasing overpotential.1.1.1.20.4 Impedance measurements as function of temperatureActivation energies estimated from the Arrhenius plots of the electrolyte and of the totalelectrode conductivity are 82 kJ⋅mol-1 and 134 kJ⋅mol-1, respectively (Figure 5.8).
Sample Order dependence of σtot
pH2 pH2O
Ni-1m 0.10 0.53
Ni-2m -0.15 0.49
Ni-3m -0.03 0.39
Table 5.4: Order of gas phase pressure dependence on the total electrode conductivity. Re-sults from impedance measurements at zero bias on different modified porousnickel electrodes where pH2 dependent data is measured at pH2O = 2.3⋅105Pa andpH2O dependent data at pH2 = 8.1⋅104Pa and T = 850°C.
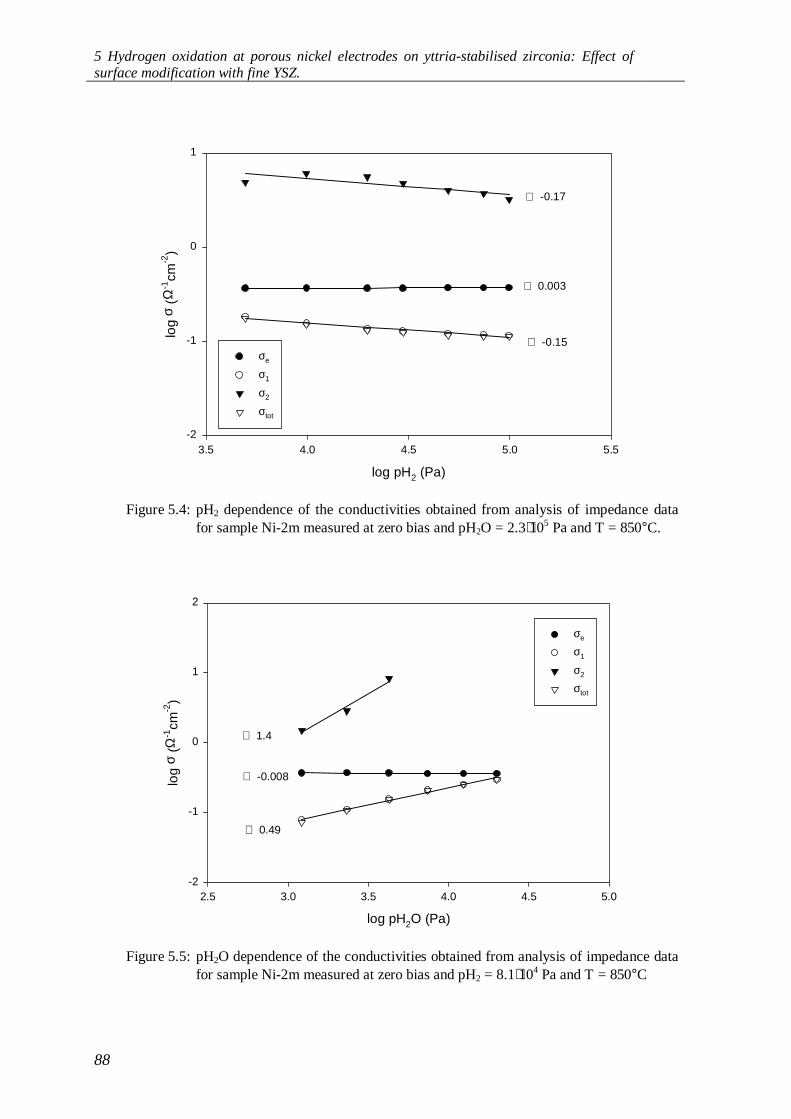
5 Hydrogen oxidation at porous nickel electrodes on yttria-stabilised zirconia: Effect ofsurface modification with fine YSZ.
88
log pH2 (Pa)
3.5 4.0 4.5 5.0 5.5
log
σ (Ω
-1cm
-2)
-2
-1
0
1
σe
σ1
σ2
σtot
∠ -0.17
∠ 0.003
∠ -0.15
Figure 5.4: pH2 dependence of the conductivities obtained from analysis of impedance datafor sample Ni-2m measured at zero bias and pH2O = 2.3⋅105 Pa and T = 850°C.
log pH2O (Pa)
2.5 3.0 3.5 4.0 4.5 5.0
log
σ (Ω
-1cm
-2)
-2
-1
0
1
2
σe
σ1
σ2
σtot
∠ 0.49
∠ -0.008
∠ 1.4
Figure 5.5: pH2O dependence of the conductivities obtained from analysis of impedance datafor sample Ni-2m measured at zero bias and pH2 = 8.1⋅104 Pa and T = 850°C
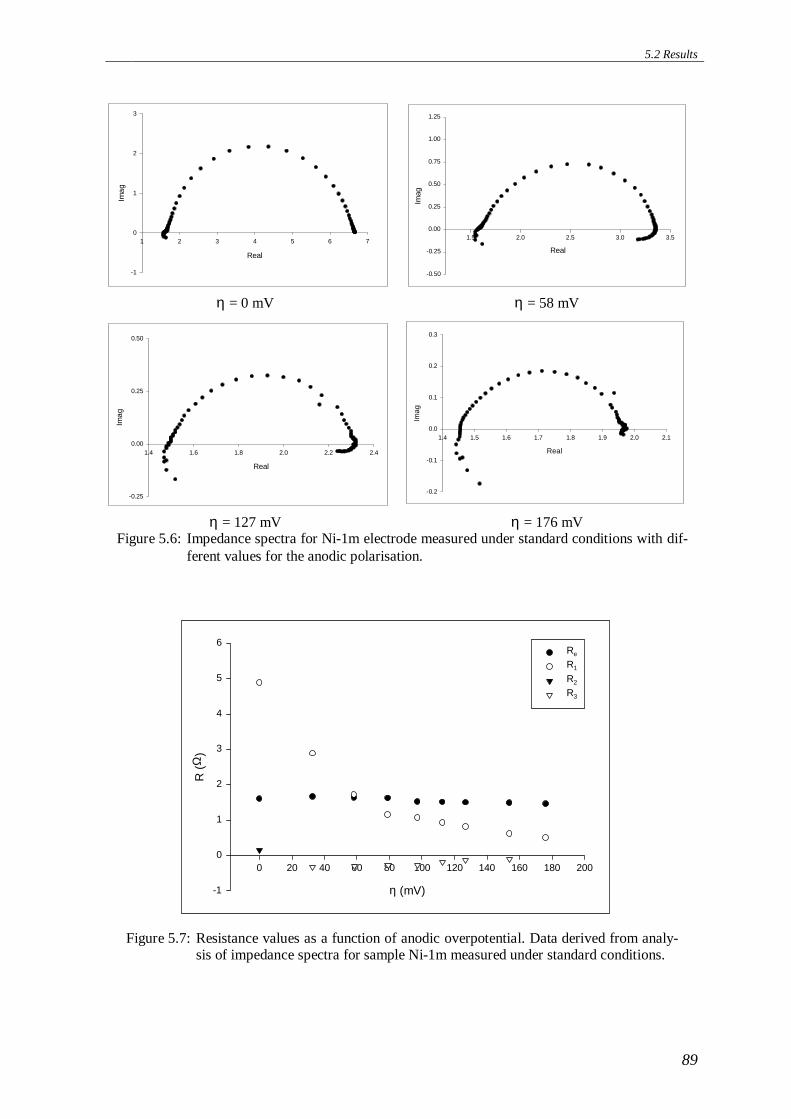
5.2 Results
89
Real
1 2 3 4 5 6 7
Ima
g
-1
0
1
2
3
Real
1.5 2.0 2.5 3.0 3.5
Imag
-0.50
-0.25
0.00
0.25
0.50
0.75
1.00
1.25
η = 0 mV η = 58 mV
Real
1.4 1.6 1.8 2.0 2.2 2.4
Ima
g
-0.25
0.00
0.25
0.50
Real
1.4 1.5 1.6 1.7 1.8 1.9 2.0 2.1
Imag
-0.2
-0.1
0.0
0.1
0.2
0.3
η = 127 mV η = 176 mVFigure 5.6: Impedance spectra for Ni-1m electrode measured under standard conditions with dif-
ferent values for the anodic polarisation.
η (mV)
0 20 40 60 80 100 120 140 160 180 200
R (
Ω)
-1
0
1
2
3
4
5
6Re
R1
R2
R3
Figure 5.7: Resistance values as a function of anodic overpotential. Data derived from analy-sis of impedance spectra for sample Ni-1m measured under standard conditions.
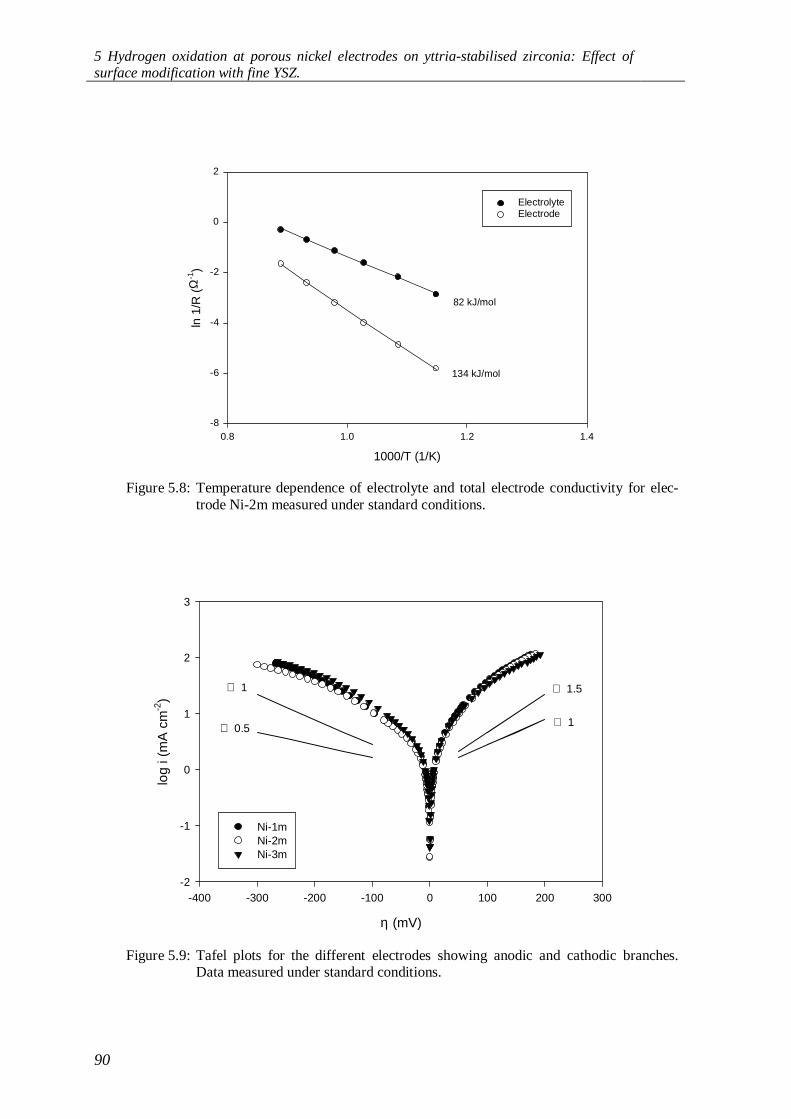
5 Hydrogen oxidation at porous nickel electrodes on yttria-stabilised zirconia: Effect ofsurface modification with fine YSZ.
90
1000/T (1/K)
0.8 1.0 1.2 1.4
ln 1
/R (
Ω-1
)
-8
-6
-4
-2
0
2
ElectrolyteElectrode
82 kJ/mol
134 kJ/mol
Figure 5.8: Temperature dependence of electrolyte and total electrode conductivity for elec-trode Ni-2m measured under standard conditions.
η (mV)
-400 -300 -200 -100 0 100 200 300
log
i (m
A c
m-2
)
-2
-1
0
1
2
3
Ni-1mNi-2mNi-3m
∠ 1
∠ 1.5
∠ 0.5
∠ 1
Figure 5.9: Tafel plots for the different electrodes showing anodic and cathodic branches.Data measured under standard conditions.
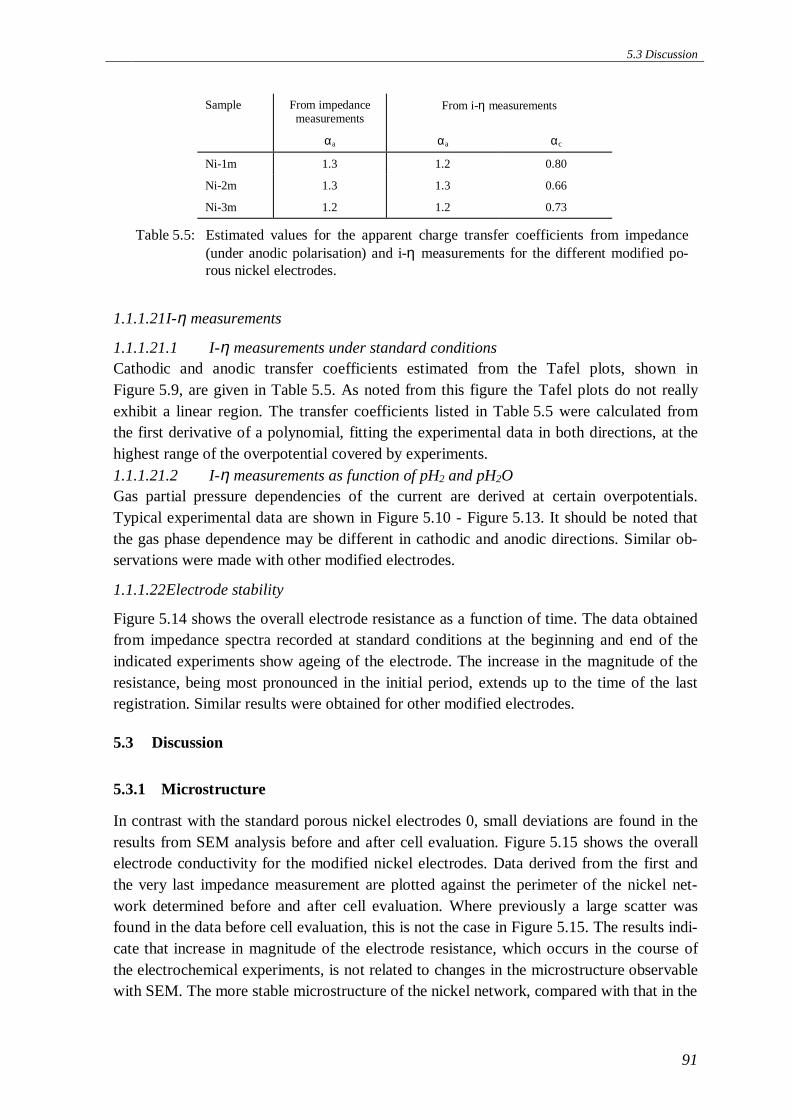
5.3 Discussion
91
1.1.1.21 I-η measurements
1.1.1.21.1 I-η measurements under standard conditionsCathodic and anodic transfer coefficients estimated from the Tafel plots, shown inFigure 5.9, are given in Table 5.5. As noted from this figure the Tafel plots do not reallyexhibit a linear region. The transfer coefficients listed in Table 5.5 were calculated fromthe first derivative of a polynomial, fitting the experimental data in both directions, at thehighest range of the overpotential covered by experiments.1.1.1.21.2 I-η measurements as function of pH2 and pH2OGas partial pressure dependencies of the current are derived at certain overpotentials.Typical experimental data are shown in Figure 5.10 - Figure 5.13. It should be noted thatthe gas phase dependence may be different in cathodic and anodic directions. Similar ob-servations were made with other modified electrodes.
1.1.1.22 Electrode stability
Figure 5.14 shows the overall electrode resistance as a function of time. The data obtainedfrom impedance spectra recorded at standard conditions at the beginning and end of theindicated experiments show ageing of the electrode. The increase in the magnitude of theresistance, being most pronounced in the initial period, extends up to the time of the lastregistration. Similar results were obtained for other modified electrodes.
5.3 Discussion
5.3.1 Microstructure
In contrast with the standard porous nickel electrodes 0, small deviations are found in theresults from SEM analysis before and after cell evaluation. Figure 5.15 shows the overallelectrode conductivity for the modified nickel electrodes. Data derived from the first andthe very last impedance measurement are plotted against the perimeter of the nickel net-work determined before and after cell evaluation. Where previously a large scatter wasfound in the data before cell evaluation, this is not the case in Figure 5.15. The results indi-cate that increase in magnitude of the electrode resistance, which occurs in the course ofthe electrochemical experiments, is not related to changes in the microstructure observablewith SEM. The more stable microstructure of the nickel network, compared with that in the
Sample From impedancemeasurements
From i-η measurements
αa αa αc
Ni-1m 1.3 1.2 0.80
Ni-2m 1.3 1.3 0.66
Ni-3m 1.2 1.2 0.73
Table 5.5: Estimated values for the apparent charge transfer coefficients from impedance(under anodic polarisation) and i-η measurements for the different modified po-rous nickel electrodes.
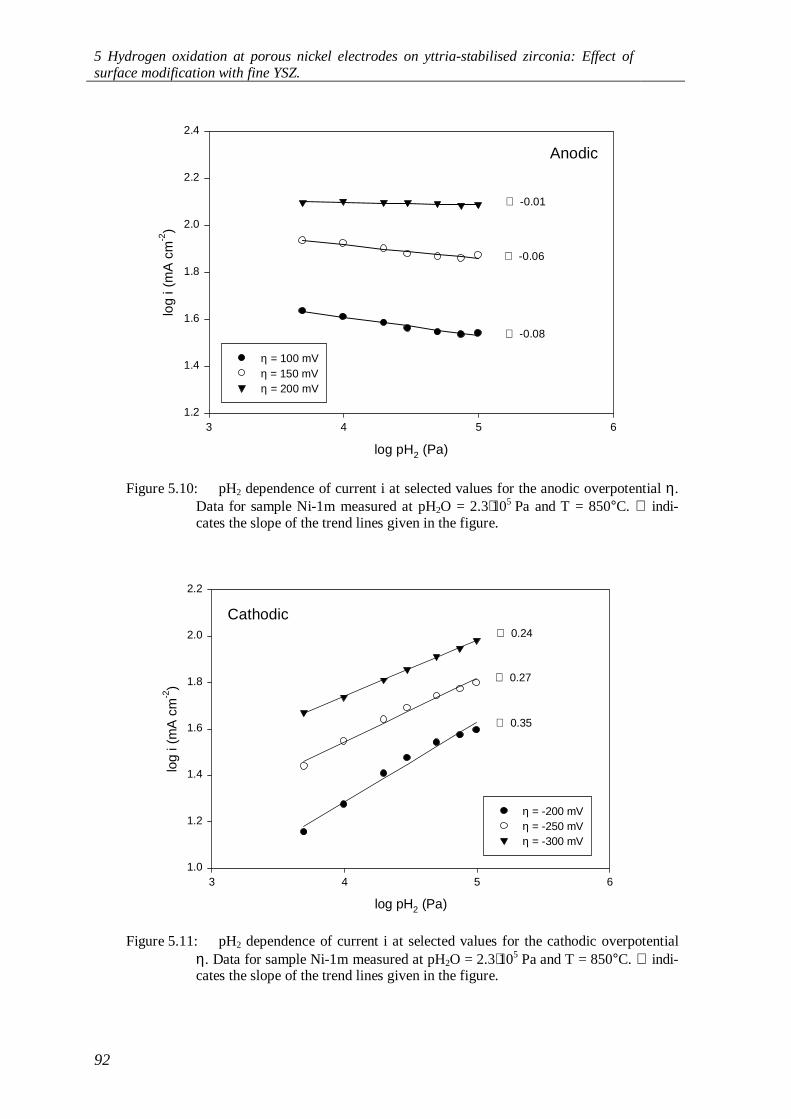
5 Hydrogen oxidation at porous nickel electrodes on yttria-stabilised zirconia: Effect ofsurface modification with fine YSZ.
92
log pH2 (Pa)
3 4 5 6
log
i (m
A c
m-2
)
1.2
1.4
1.6
1.8
2.0
2.2
2.4
η = 100 mVη = 150 mVη = 200 mV
∠ -0.01
∠ -0.06
∠ -0.08
Anodic
Figure 5.10: pH2 dependence of current i at selected values for the anodic overpotential η.Data for sample Ni-1m measured at pH2O = 2.3⋅105 Pa and T = 850°C. ∠ indi-cates the slope of the trend lines given in the figure.
log pH2 (Pa)
3 4 5 6
log
i (m
A c
m-2
)
1.0
1.2
1.4
1.6
1.8
2.0
2.2
η = -200 mVη = -250 mVη = -300 mV
∠ 0.35
∠ 0.27
∠ 0.24
Cathodic
Figure 5.11: pH2 dependence of current i at selected values for the cathodic overpotentialη. Data for sample Ni-1m measured at pH2O = 2.3⋅105 Pa and T = 850°C. ∠ indi-cates the slope of the trend lines given in the figure.
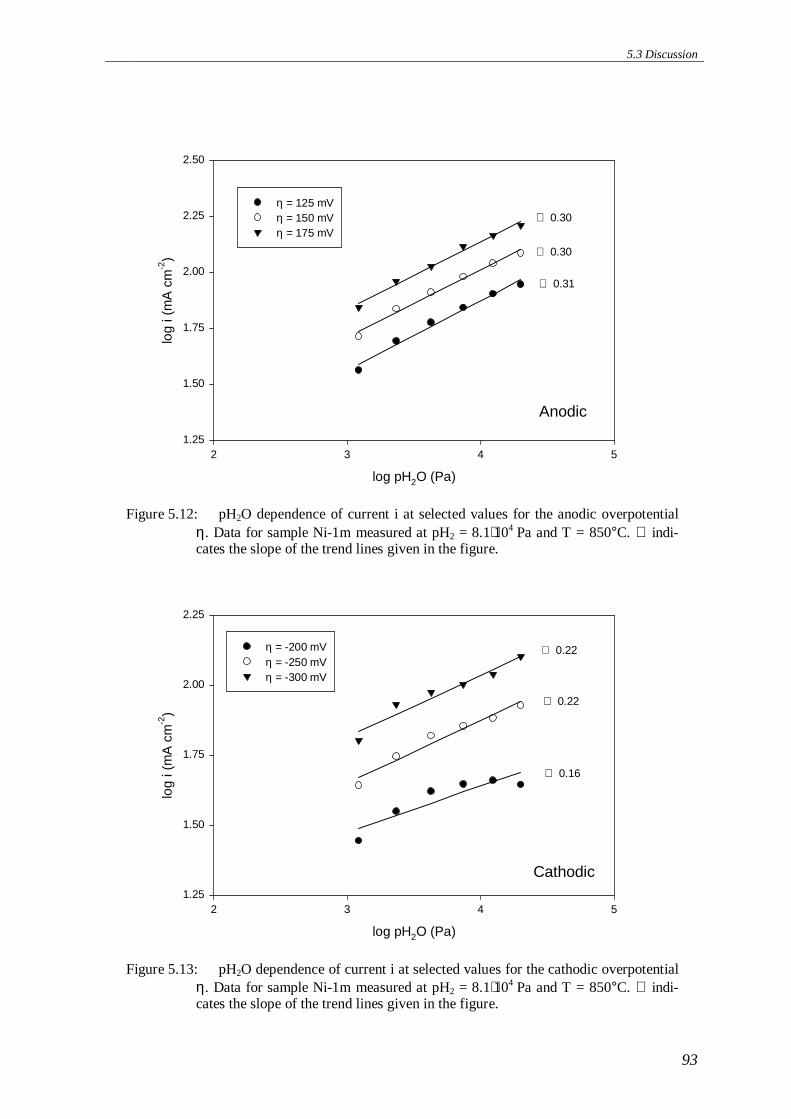
5.3 Discussion
93
log pH2O (Pa)
2 3 4 5
log
i (m
A c
m-2
)
1.25
1.50
1.75
2.00
2.25
2.50
η = 125 mVη = 150 mVη = 175 mV
∠ 0.31
∠ 0.30
∠ 0.30
Anodic
Figure 5.12: pH2O dependence of current i at selected values for the anodic overpotentialη. Data for sample Ni-1m measured at pH2 = 8.1⋅104 Pa and T = 850°C. ∠ indi-cates the slope of the trend lines given in the figure.
log pH2O (Pa)
2 3 4 5
log
i (m
A c
m-2
)
1.25
1.50
1.75
2.00
2.25
η = -200 mVη = -250 mVη = -300 mV
∠ 0.16
∠ 0.22
∠ 0.22
Cathodic
Figure 5.13: pH2O dependence of current i at selected values for the cathodic overpotentialη. Data for sample Ni-1m measured at pH2 = 8.1⋅104 Pa and T = 850°C. ∠ indi-cates the slope of the trend lines given in the figure.
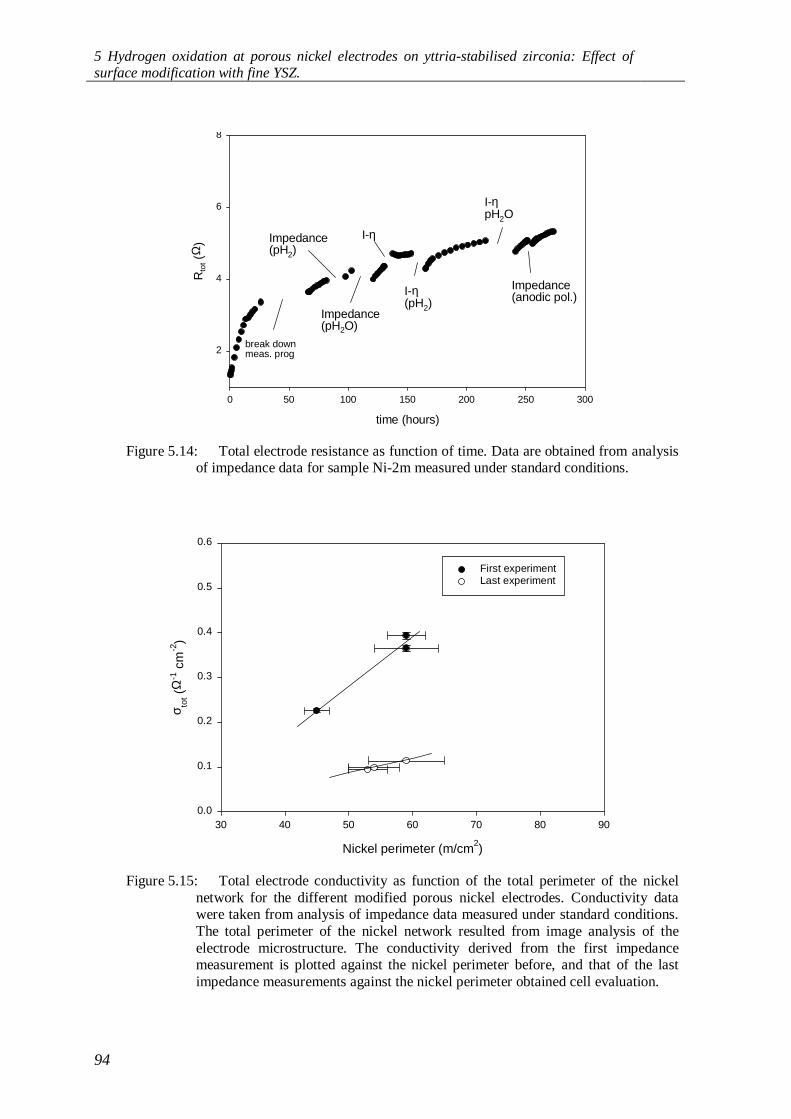
5 Hydrogen oxidation at porous nickel electrodes on yttria-stabilised zirconia: Effect ofsurface modification with fine YSZ.
94
time (hours)
0 50 100 150 200 250 300
Rto
t (Ω
)
2
4
6
8
Impedance(pH2)
Impedance(pH2O)
I-η
I-η(pH2)
I-ηpH2O
Impedance(anodic pol.)
break downmeas. prog
Figure 5.14: Total electrode resistance as function of time. Data are obtained from analysisof impedance data for sample Ni-2m measured under standard conditions.
Nickel perimeter (m/cm2)
30 40 50 60 70 80 90
σ tot (
Ω-1
cm
-2)
0.0
0.1
0.2
0.3
0.4
0.5
0.6
First experimentLast experiment
Figure 5.15: Total electrode conductivity as function of the total perimeter of the nickelnetwork for the different modified porous nickel electrodes. Conductivity datawere taken from analysis of impedance data measured under standard conditions.The total perimeter of the nickel network resulted from image analysis of theelectrode microstructure. The conductivity derived from the first impedancemeasurement is plotted against the nickel perimeter before, and that of the lastimpedance measurements against the nickel perimeter obtained cell evaluation.
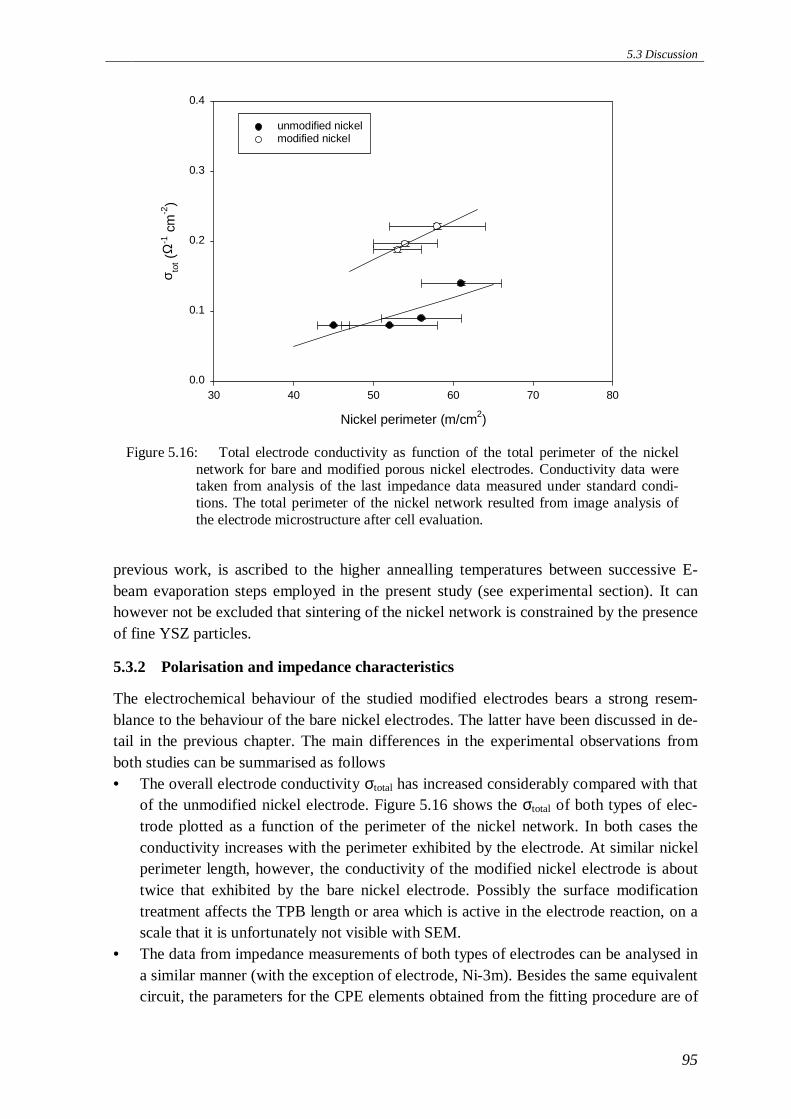
5.3 Discussion
95
previous work, is ascribed to the higher annealling temperatures between successive E-beam evaporation steps employed in the present study (see experimental section). It canhowever not be excluded that sintering of the nickel network is constrained by the presenceof fine YSZ particles.
5.3.2 Polarisation and impedance characteristics
The electrochemical behaviour of the studied modified electrodes bears a strong resem-blance to the behaviour of the bare nickel electrodes. The latter have been discussed in de-tail in the previous chapter. The main differences in the experimental observations fromboth studies can be summarised as follows• The overall electrode conductivity σtotal has increased considerably compared with that
of the unmodified nickel electrode. Figure 5.16 shows the σtotal of both types of elec-trode plotted as a function of the perimeter of the nickel network. In both cases theconductivity increases with the perimeter exhibited by the electrode. At similar nickelperimeter length, however, the conductivity of the modified nickel electrode is abouttwice that exhibited by the bare nickel electrode. Possibly the surface modificationtreatment affects the TPB length or area which is active in the electrode reaction, on ascale that it is unfortunately not visible with SEM.
• The data from impedance measurements of both types of electrodes can be analysed ina similar manner (with the exception of electrode, Ni-3m). Besides the same equivalentcircuit, the parameters for the CPE elements obtained from the fitting procedure are of
Nickel perimeter (m/cm2)
30 40 50 60 70 80
σ tot (
Ω-1
cm
-2)
0.0
0.1
0.2
0.3
0.4
unmodified nickelmodified nickel
Figure 5.16: Total electrode conductivity as function of the total perimeter of the nickelnetwork for bare and modified porous nickel electrodes. Conductivity data weretaken from analysis of the last impedance data measured under standard condi-tions. The total perimeter of the nickel network resulted from image analysis ofthe electrode microstructure after cell evaluation.

5 Hydrogen oxidation at porous nickel electrodes on yttria-stabilised zirconia: Effect ofsurface modification with fine YSZ.
96
the same order of magnitude. Only, as noted above, the resistance values havechanged. Within experimental error the ratio R1/R2 for both types of electrodes doesnot change. The latter might indicate that the electrode modification affects both proc-esses to a similar extent.
• The activation energy of the overall electrode process is found to be slightly lower thanthat on the bare nickel electrode, 134 and 154 kJ⋅mol-1.
• The transfer coefficient αa derived from impedance data under different anodic biasvalues shows good correspondence with the α’s determined from the slope of log(i)versus η plots. Overall the values, obtained for both cathodic and anodic transfer coef-ficients, tend to be slightly lower than those observed for the bare nickel electrodes (cf.Table 5.5 with Table 4.7).
• As for the bare nickel electrodes, the H2 and H2O partial pressure dependencies of theelectrode performance are different under equilibrium (from impedance data), anodicand cathodic polarisation. Observed dependencies at similar values for the overpoten-tial may however slightly differ for both types of electrodes.
5.4 Conclusions
Porous nickel electrodes on yttria-stabilised zirconia have been modified by dispersionwith fine particles of the YSZ phase. The marked similarity in the performance of bare andmodified nickel electrodes in hydrogen oxidation strongly suggests that essential steps inthe electrode mechanism on both types of electrodes are similar. Hence, views on themechanism presented in the previous chapter essentially remain unaltered. The significantreduction in overall electrode resistance of the modified electrodes, compared with that ofthe bare nickel electrode, can be attributed to an increased number of active sites. Such be-haviour is reminiscent of the increase in the number of active sites encountered in cermetstructures of nickel and YSZ.
Acknowledgement
Ms. M. Gonzalez is thanked for her assistance in performing part of the measurements.
References
S.C. Singhal, ‘Status of Solid Oxide Fuel Cell Technology’, Proceedings of the 17th Risø International Symposium onMaterials Science, High temperature Electrochemistry: Ceramics and Metals, 123-38, 1996.
N.Q. Minh, ‘Ceramic Fuel Cells’, J. Am. Ceram. Soc., 76, 563-88, 1993.M. Mogensen and T. Lindegaard, ‘The kinetic of hydrogen oxidation on a Ni-YSZ SOFC electrode at 1000°C, Proc of
Solid Oxide Fuel Cells 1993 (SOFC-III), pp 484-93, 1993.M. Mogensen, ‘Electrode kinetics of SOFC anodes s and cathode’, Proc of the 14th Risø Int. Symp. on materials science,
High Temp. electrochemical behaviour of fast ion and mixed conductors, pp 117-35, 1993M. Mogensen and S. Skaarup, ‘Kinetic and geometric aspects of solid oxide fuel cell electrodes’, Solid State Ionics, 86-
88, pp1151, 1996.H. Itoh, T. Yamamoto, M. Mori, T. Horita, N. Sakai, H. Yokokawa and M. Dokiya, ‘Configurational and Electrical Be-
havior of Ni-YSZ Cermet with Novel Microstructure for Solid Oxide Fuel Cell Anodes, J. Electrochem. Soc. 144,641-46, 1997.
J. Divisek, A. Kornyshev, W. Lehnert, U. Stimming, I.C. Vinke and K. Wioppermann, ‘Advanced characterisation tech-niques for Nickel-YSZ Cermet Electrodes used in Solid Oxide Fuel Cells’, Electrochemical Proceedings Volume97-18, 606-16, 1997.
A. Ioselevich, A.A. Kornyshev and W. Lehnert, ‘Degradation of SOFC Anodes due to Sintering of Metal Particles: Cor-related Percolation Model’, J. Electroch. Soc., 144, 3010-19, 1997.
Chapter 4 of this thesis

5.4 Conclusions
97
N. Nakagawa, H. Sakurai, K. Kondo and K. Kato, ‘Study on the extension of reaction zone from Ni/YSZ interface byusing fixed film electrodes’, pp 721-30 in: Proc. of 4th Int. Symp. on SOFC, Japan, 1995.
B.A. Boukamp, ‘A nonlinear least squares fit procedure for analysis of Immitance data of Electrochemical Systems’,Solid State Ionics, 20, 31-44, 1986.
F.P.F. van Berkel, J.P. de Jong, ‘De Relatie tussen de Morfologie en de Electrochemische Eigenschappen van Ni/YSZAnodematerialen’, ECN Internal Report, 2918-GR14,1993.

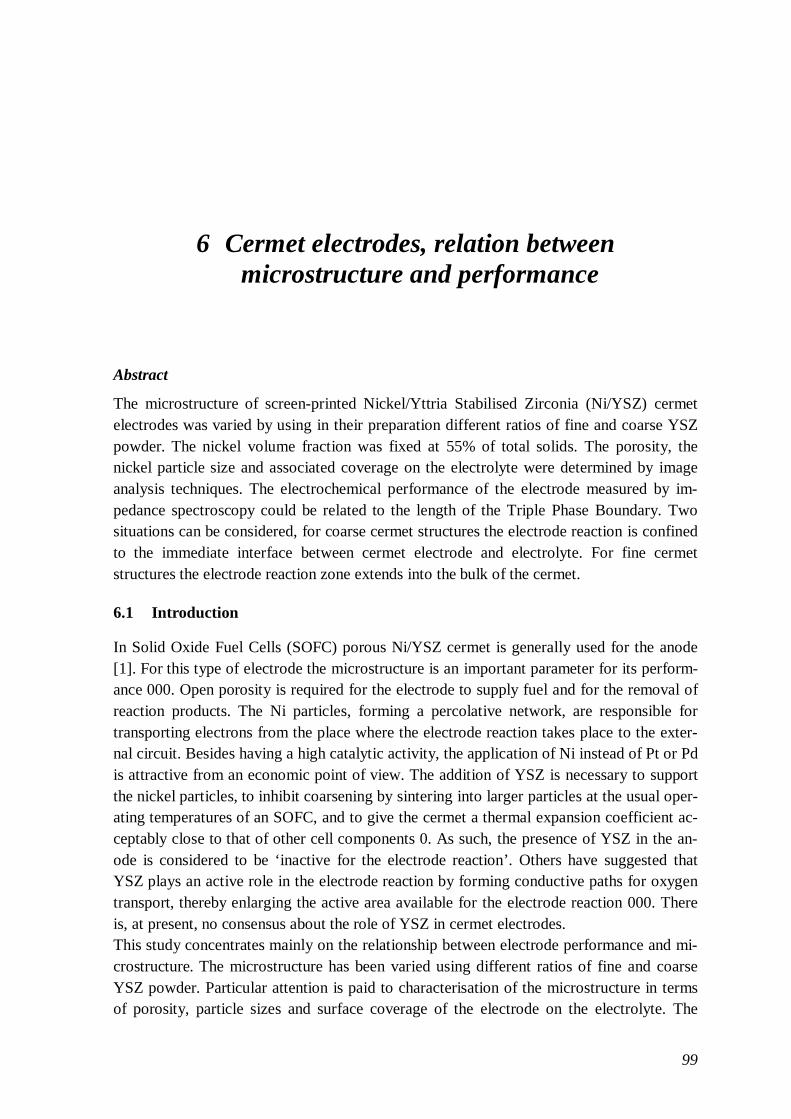
99
6 Cermet electrodes, relation betweenmicrostructure and performance
Abstract
The microstructure of screen-printed Nickel/Yttria Stabilised Zirconia (Ni/YSZ) cermetelectrodes was varied by using in their preparation different ratios of fine and coarse YSZpowder. The nickel volume fraction was fixed at 55% of total solids. The porosity, thenickel particle size and associated coverage on the electrolyte were determined by imageanalysis techniques. The electrochemical performance of the electrode measured by im-pedance spectroscopy could be related to the length of the Triple Phase Boundary. Twosituations can be considered, for coarse cermet structures the electrode reaction is confinedto the immediate interface between cermet electrode and electrolyte. For fine cermetstructures the electrode reaction zone extends into the bulk of the cermet.
6.1 Introduction
In Solid Oxide Fuel Cells (SOFC) porous Ni/YSZ cermet is generally used for the anode[1]. For this type of electrode the microstructure is an important parameter for its perform-ance 000. Open porosity is required for the electrode to supply fuel and for the removal ofreaction products. The Ni particles, forming a percolative network, are responsible fortransporting electrons from the place where the electrode reaction takes place to the exter-nal circuit. Besides having a high catalytic activity, the application of Ni instead of Pt or Pdis attractive from an economic point of view. The addition of YSZ is necessary to supportthe nickel particles, to inhibit coarsening by sintering into larger particles at the usual oper-ating temperatures of an SOFC, and to give the cermet a thermal expansion coefficient ac-ceptably close to that of other cell components 0. As such, the presence of YSZ in the an-ode is considered to be ‘inactive for the electrode reaction’. Others have suggested thatYSZ plays an active role in the electrode reaction by forming conductive paths for oxygentransport, thereby enlarging the active area available for the electrode reaction 000. Thereis, at present, no consensus about the role of YSZ in cermet electrodes.This study concentrates mainly on the relationship between electrode performance and mi-crostructure. The microstructure has been varied using different ratios of fine and coarseYSZ powder. Particular attention is paid to characterisation of the microstructure in termsof porosity, particle sizes and surface coverage of the electrode on the electrolyte. The
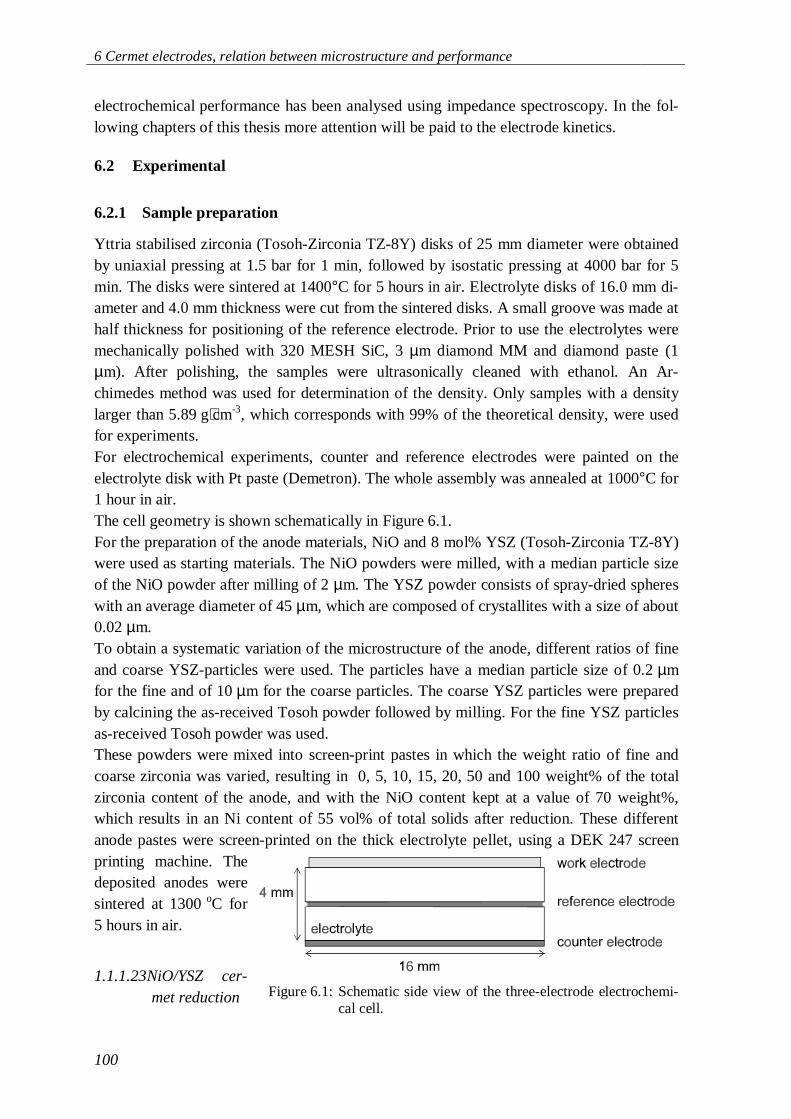
6 Cermet electrodes, relation between microstructure and performance
100
electrochemical performance has been analysed using impedance spectroscopy. In the fol-lowing chapters of this thesis more attention will be paid to the electrode kinetics.
6.2 Experimental
6.2.1 Sample preparation
Yttria stabilised zirconia (Tosoh-Zirconia TZ-8Y) disks of 25 mm diameter were obtainedby uniaxial pressing at 1.5 bar for 1 min, followed by isostatic pressing at 4000 bar for 5min. The disks were sintered at 1400°C for 5 hours in air. Electrolyte disks of 16.0 mm di-ameter and 4.0 mm thickness were cut from the sintered disks. A small groove was made athalf thickness for positioning of the reference electrode. Prior to use the electrolytes weremechanically polished with 320 MESH SiC, 3 µm diamond MM and diamond paste (1µm). After polishing, the samples were ultrasonically cleaned with ethanol. An Ar-chimedes method was used for determination of the density. Only samples with a densitylarger than 5.89 g⋅cm-3, which corresponds with 99% of the theoretical density, were usedfor experiments.For electrochemical experiments, counter and reference electrodes were painted on theelectrolyte disk with Pt paste (Demetron). The whole assembly was annealed at 1000°C for1 hour in air.The cell geometry is shown schematically in Figure 6.1.For the preparation of the anode materials, NiO and 8 mol% YSZ (Tosoh-Zirconia TZ-8Y)were used as starting materials. The NiO powders were milled, with a median particle sizeof the NiO powder after milling of 2 µm. The YSZ powder consists of spray-dried sphereswith an average diameter of 45 µm, which are composed of crystallites with a size of about0.02 µm.To obtain a systematic variation of the microstructure of the anode, different ratios of fineand coarse YSZ-particles were used. The particles have a median particle size of 0.2 µmfor the fine and of 10 µm for the coarse particles. The coarse YSZ particles were preparedby calcining the as-received Tosoh powder followed by milling. For the fine YSZ particlesas-received Tosoh powder was used.These powders were mixed into screen-print pastes in which the weight ratio of fine andcoarse zirconia was varied, resulting in 0, 5, 10, 15, 20, 50 and 100 weight% of the totalzirconia content of the anode, and with the NiO content kept at a value of 70 weight%,which results in an Ni content of 55 vol% of total solids after reduction. These differentanode pastes were screen-printed on the thick electrolyte pellet, using a DEK 247 screenprinting machine. Thedeposited anodes weresintered at 1300 oC for5 hours in air.
1.1.1.23 NiO/YSZ cer-met reduction Figure 6.1: Schematic side view of the three-electrode electrochemi-
cal cell.
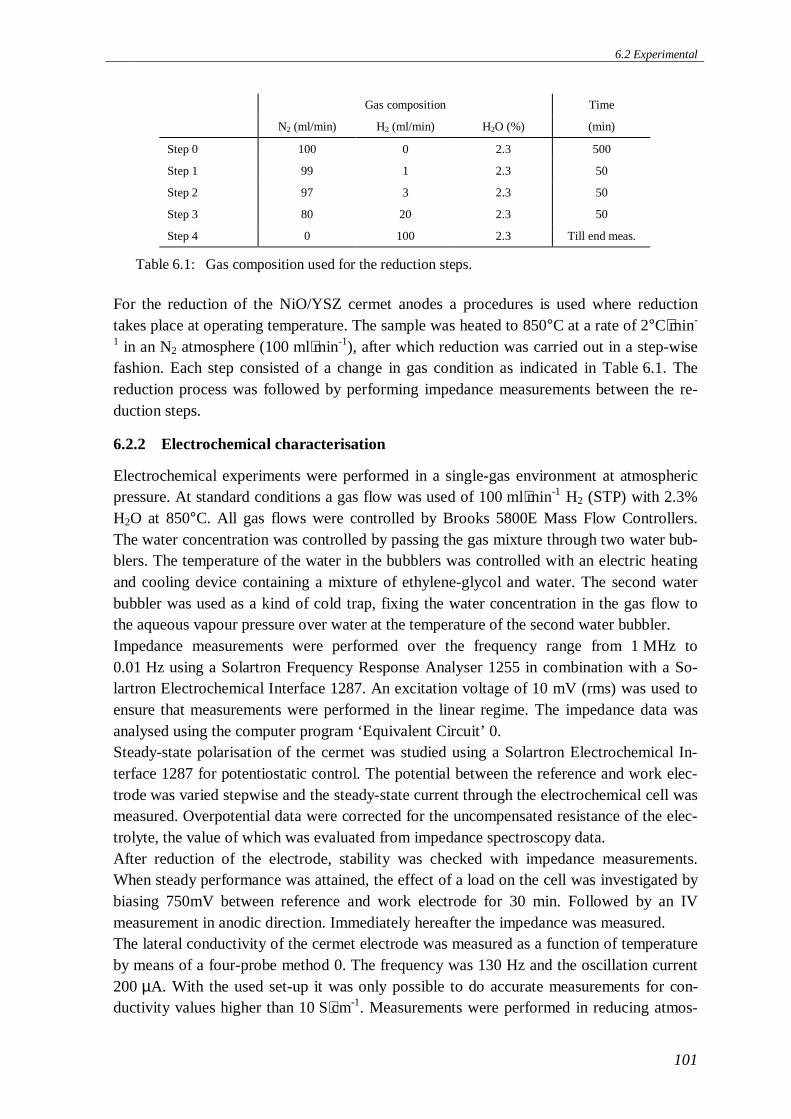
6.2 Experimental
101
For the reduction of the NiO/YSZ cermet anodes a procedures is used where reductiontakes place at operating temperature. The sample was heated to 850°C at a rate of 2°C⋅min-
1 in an N2 atmosphere (100 ml⋅min-1), after which reduction was carried out in a step-wisefashion. Each step consisted of a change in gas condition as indicated in Table 6.1. Thereduction process was followed by performing impedance measurements between the re-duction steps.
6.2.2 Electrochemical characterisation
Electrochemical experiments were performed in a single-gas environment at atmosphericpressure. At standard conditions a gas flow was used of 100 ml⋅min-1 H2 (STP) with 2.3%H2O at 850°C. All gas flows were controlled by Brooks 5800E Mass Flow Controllers.The water concentration was controlled by passing the gas mixture through two water bub-blers. The temperature of the water in the bubblers was controlled with an electric heatingand cooling device containing a mixture of ethylene-glycol and water. The second waterbubbler was used as a kind of cold trap, fixing the water concentration in the gas flow tothe aqueous vapour pressure over water at the temperature of the second water bubbler.Impedance measurements were performed over the frequency range from 1 MHz to0.01 Hz using a Solartron Frequency Response Analyser 1255 in combination with a So-lartron Electrochemical Interface 1287. An excitation voltage of 10 mV (rms) was used toensure that measurements were performed in the linear regime. The impedance data wasanalysed using the computer program ‘Equivalent Circuit’ 0.Steady-state polarisation of the cermet was studied using a Solartron Electrochemical In-terface 1287 for potentiostatic control. The potential between the reference and work elec-trode was varied stepwise and the steady-state current through the electrochemical cell wasmeasured. Overpotential data were corrected for the uncompensated resistance of the elec-trolyte, the value of which was evaluated from impedance spectroscopy data.After reduction of the electrode, stability was checked with impedance measurements.When steady performance was attained, the effect of a load on the cell was investigated bybiasing 750mV between reference and work electrode for 30 min. Followed by an IVmeasurement in anodic direction. Immediately hereafter the impedance was measured.The lateral conductivity of the cermet electrode was measured as a function of temperatureby means of a four-probe method 0. The frequency was 130 Hz and the oscillation current200 µA. With the used set-up it was only possible to do accurate measurements for con-ductivity values higher than 10 S⋅cm-1. Measurements were performed in reducing atmos-
Gas composition Time
N2 (ml/min) H2 (ml/min) H2O (%) (min)
Step 0 100 0 2.3 500
Step 1 99 1 2.3 50
Step 2 97 3 2.3 50
Step 3 80 20 2.3 50
Step 4 0 100 2.3 Till end meas.
Table 6.1: Gas composition used for the reduction steps.

6 Cermet electrodes, relation between microstructure and performance
102
pheres using a gasmixture of 5 vol% H2 / 95 vol% N2. The maximum temperature of themeasurements was 950oC.
6.2.3 Microstructural characterisation
After completing the electrochemical experiments Scanning Electron Microscopy (SEM)micrographs were taken from the cermet structures. Representative pictures were used forimage analysis to quantify the microstructure of the cermet electrodes (7 SEM micrographsfor every type of electrode). Porosity was calculated from values of the layer thickness,mass and theoretical densities of both Ni and YSZ. The Ni particle size was estimated byusing a lineal intercept technique 0. Intercepts were taken from a raster of lines coveringmore than 400 particles. SEM pictures of the fracture surface were used to obtain an esti-mate of the surface coverage of the cermet structure on the electrolyte and the particle sizeat the interface.
6.3 Results and Discussion
6.3.1 Microstructure
Examples of SEM pictures of electrode specimens containing different ratios of fine/coarseYSZ powder are given in Figure 6.2. Results obtained from image analysis are given inTable 6.2 and Figure 6.3, Figure 6.4 and Figure 6.5. The presence of the coarse fractionrelative to that of fine YSZ ensures a comparatively high porosity of the cermets. This canbe seen in the data presented in Table 6.2 and Figure 6.3, where the porosity decreasesfrom 63% to 50% upon full replacement of coarse with fine YSZ.The addition of fine YSZ to the cermet also influences the sintering behaviour of nickelparticles. Their growth is constrained by the presence of fine YSZ. Figure 6.4 shows thatthe average sintered Ni particle size decreases substantially with increasing weight per-centage of fine YSZ, from a value of 2.2 µm to 1.0 µm for 0 w/0 and 100 w/0 fine YSZ,respectively. The associated coverage on the electrolyte surface increases from 17 to 53%.The most significant change takes place at small fractions of fine YSZ (Table 6.2 andFigure 6.5). It should be noted, however, that the degree of surface coverage includes bothNi and YSZ particles.Another important aspect emerging from image analysis is the contact diameter of the par-ticles at the interface This value is hardly influenced by the w/0 of fine YSZ in the cermetand takes a constant value of about 1.1 µm. This suggests that sintering of the Ni particlesoccurs to some extent in the bulk of the cermet, but is constrained at the immediate inter-face with the electrolyte.

6.3 Results and Discussion
103
(a) (b)
(c) (d)
(e) (f)
Figure 6.2: Micrographs of Ni/YSZ cermet electrodes prepared with different fractions offine/coarse YSZ powder, (a) 0 w/0; (b) 10 w/0; (c) 15 w/0; (d) 20 w/0; (e) 50 w/0 and(f) 100 w/0 fine YSZ.
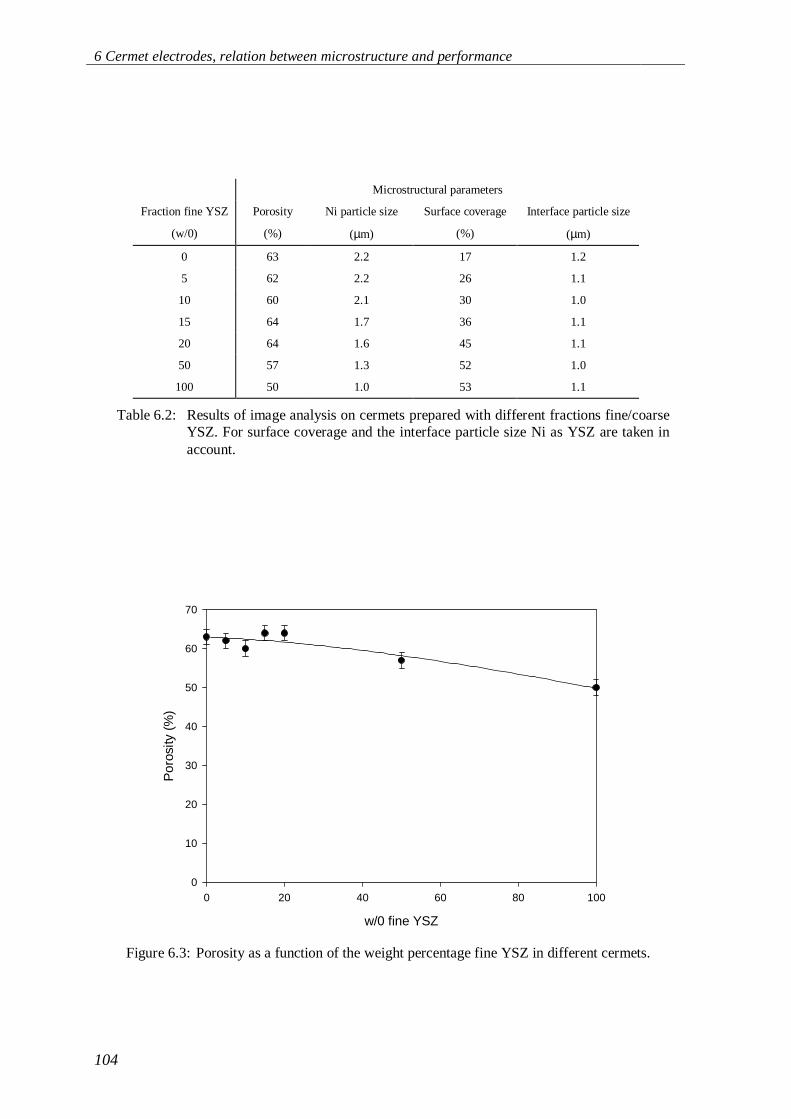
6 Cermet electrodes, relation between microstructure and performance
104
Microstructural parameters
Fraction fine YSZ
(w/0)
Porosity
(%)
Ni particle size
(µm)
Surface coverage
(%)
Interface particle size
(µm)
0 63 2.2 17 1.2
5 62 2.2 26 1.1
10 60 2.1 30 1.0
15 64 1.7 36 1.1
20 64 1.6 45 1.1
50 57 1.3 52 1.0
100 50 1.0 53 1.1
Table 6.2: Results of image analysis on cermets prepared with different fractions fine/coarseYSZ. For surface coverage and the interface particle size Ni as YSZ are taken inaccount.
w/0 fine YSZ
0 20 40 60 80 100
Por
osity
(%
)
0
10
20
30
40
50
60
70
Figure 6.3: Porosity as a function of the weight percentage fine YSZ in different cermets.
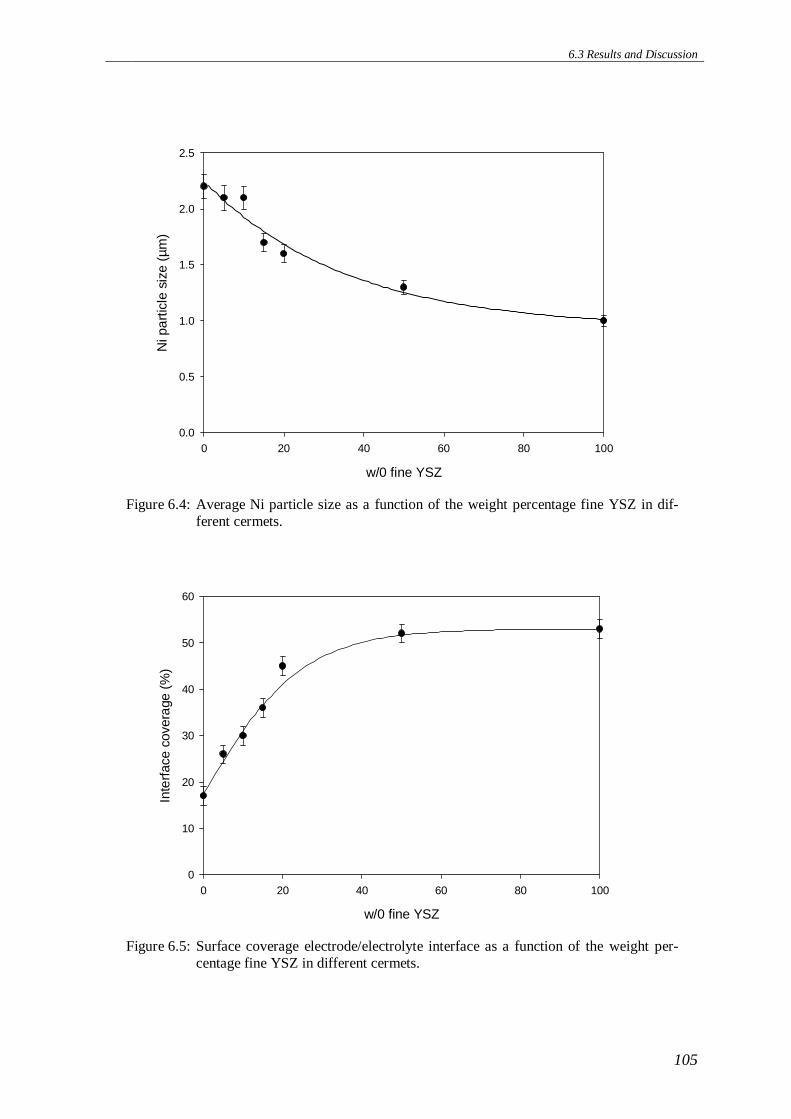
6.3 Results and Discussion
105
w/0 fine YSZ
0 20 40 60 80 100
Ni p
artic
le s
ize
(µm
)
0.0
0.5
1.0
1.5
2.0
2.5
Figure 6.4: Average Ni particle size as a function of the weight percentage fine YSZ in dif-ferent cermets.
w/0 fine YSZ
0 20 40 60 80 100
Inte
rfac
e co
vera
ge (
%)
0
10
20
30
40
50
60
Figure 6.5: Surface coverage electrode/electrolyte interface as a function of the weight per-centage fine YSZ in different cermets.

6 Cermet electrodes, relation between microstructure and performance
106
6.3.2 Electrochemical performance
1.1.1.24 Impedance Spectroscopy
Impedance diagrams for different cermet structures are given in Figure 6.6. The equivalentcircuit that was found to match most closely the observed impedance diagrams can be rep-resented by LwRe(R1Q1)(R2Q2)(R3Q3), where the circuit description code is taken from ref.0. In this notation, L represents an inductance, R a resistance and Q a constant phase ele-ment (CPE). The impedance of a CPE is ZCPE = 1/Q(iω)n, where ω is the angular frequencyand i = √-1. The CPE includes two constants, Q and n. If n = -1 the CPE behaves as an in-ductance with L=Q-1, if n = 0 as a resistance with R=Q-1, if n = ½ as a Warburg diffusionimpedance and if n = 1 as a capacitance with C=Q. Intermediate values of n indicate thedegree of non-ideal behaviour compared to the idealised capacitor, resistor, inductor or dif-fusion process 0.The values of the elements for the equivalent circuit obtained from fitting are listed inTable 6.3. Lw is associated with the inductance of the wiring and instruments, and Re repre-sents the uncompensated electrolyte resistance. A value of 1.42 Ω was calculated for Re,using a specific conductivity for YSZ of 0.1 Ω-1⋅cm-1 at 850°C. The measured values are inclose agreement with this calculated value (Table 6.3).The three parallel combinations of a resistance and a CPE in series describe the electroderesponse. The high frequency semicircle (R1Q1) can be attributed to charge transfer (R1)and the double layer capacitance represented by a CPE (Q1). R1 decreases with increasingw/0 YSZ (see also Figure 6.7). The addition of a small fraction of fine YSZ already in-duces a pronounced decrease in the value of R1. The CPE values related with the doublelayer are in the range of 10-3 – 10-4 Ω-1secn, values that are common for a double layer (00).No clear relation is found between Q1 and the fraction of fine YSZ in the cermet (seeFigure 6.8). The n1-value of about 0.8 indicates that there is a slight departure from idealcapacitive behaviour.The combination (R2Q2) with negative values for R2 and Q2 is necessary to fit the inductiveloop appearing in the mid-frequency range. This inductive loop appears only in data forcermet microstructures in which part of the coarse YSZ has been replaced by a corre-sponding fraction of fine YSZ powder. As seen from Figure 6.6, the inductive loop be-comes smaller for samples containing less fine YSZ. The appearance of the inductive loopsis not completely understood. Possible explanations could be the presence of intermediateadsorbates during the reaction sequence (000). The electrode kinetics is subject of Chapter8 of this thesis.The low-frequency semicircle is relatively small. The corresponding Q-values are in therange of 0.1-1 Ω-1secn. The appearance of semicircles at the low frequency side with theserelative high capacitive values are in literature ascribed to changes in the chemical compo-sition of the bulk phase above the electrode 00.
1.1.1.25 Conductivity experiments
Figure 6.10 shows the electrical DC lateral resistance of the cermets with different ratiosfine/coarse YSZ. The resistance initially increases with the increasing fraction of fine YSZ,
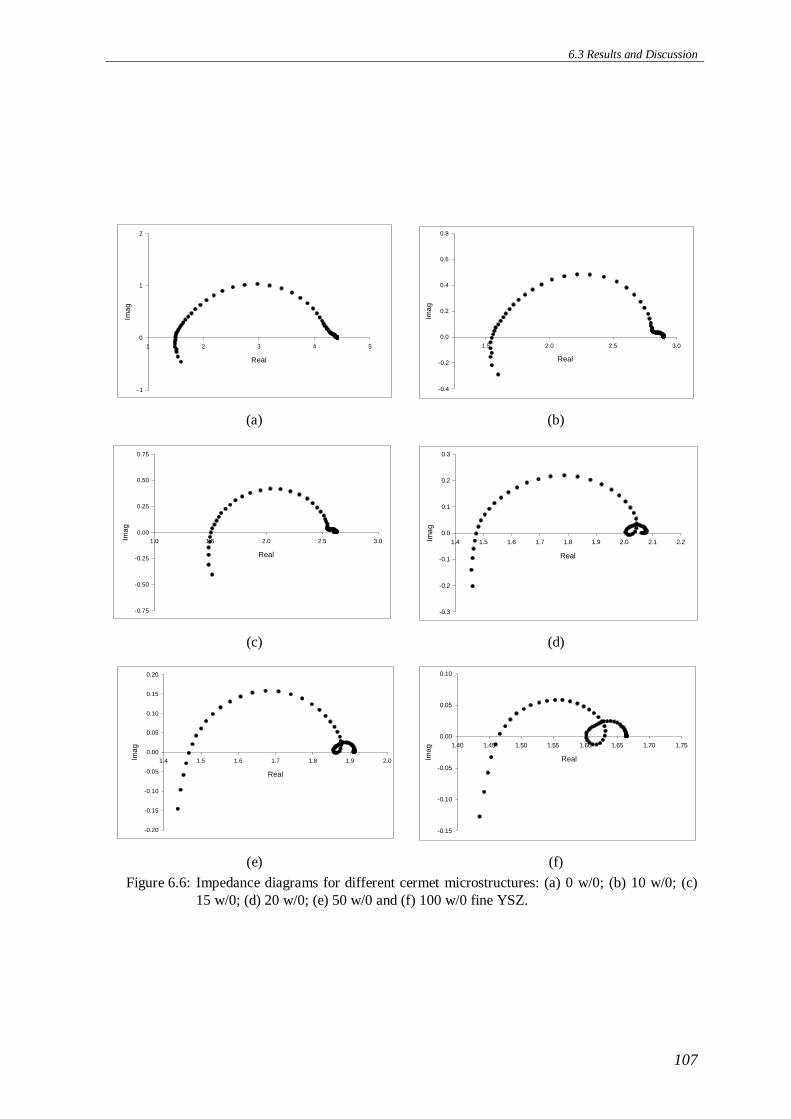
6.3 Results and Discussion
107
Real
1 2 3 4 5
Imag
-1
0
1
2
Real
1.5 2.0 2.5 3.0
Imag
-0.4
-0.2
0.0
0.2
0.4
0.6
0.8
(a) (b)
Real
1.0 1.5 2.0 2.5 3.0Imag
-0.75
-0.50
-0.25
0.00
0.25
0.50
0.75
Real
1.4 1.5 1.6 1.7 1.8 1.9 2.0 2.1 2.2Ima
g
-0.3
-0.2
-0.1
0.0
0.1
0.2
0.3
(c) (d)
Real
1.4 1.5 1.6 1.7 1.8 1.9 2.0Imag
-0.20
-0.15
-0.10
-0.05
0.00
0.05
0.10
0.15
0.20
Real
1.40 1.45 1.50 1.55 1.60 1.65 1.70 1.75
Imag
-0.15
-0.10
-0.05
0.00
0.05
0.10
(e) (f)
Figure 6.6: Impedance diagrams for different cermet microstructures: (a) 0 w/0; (b) 10 w/0; (c)15 w/0; (d) 20 w/0; (e) 50 w/0 and (f) 100 w/0 fine YSZ.
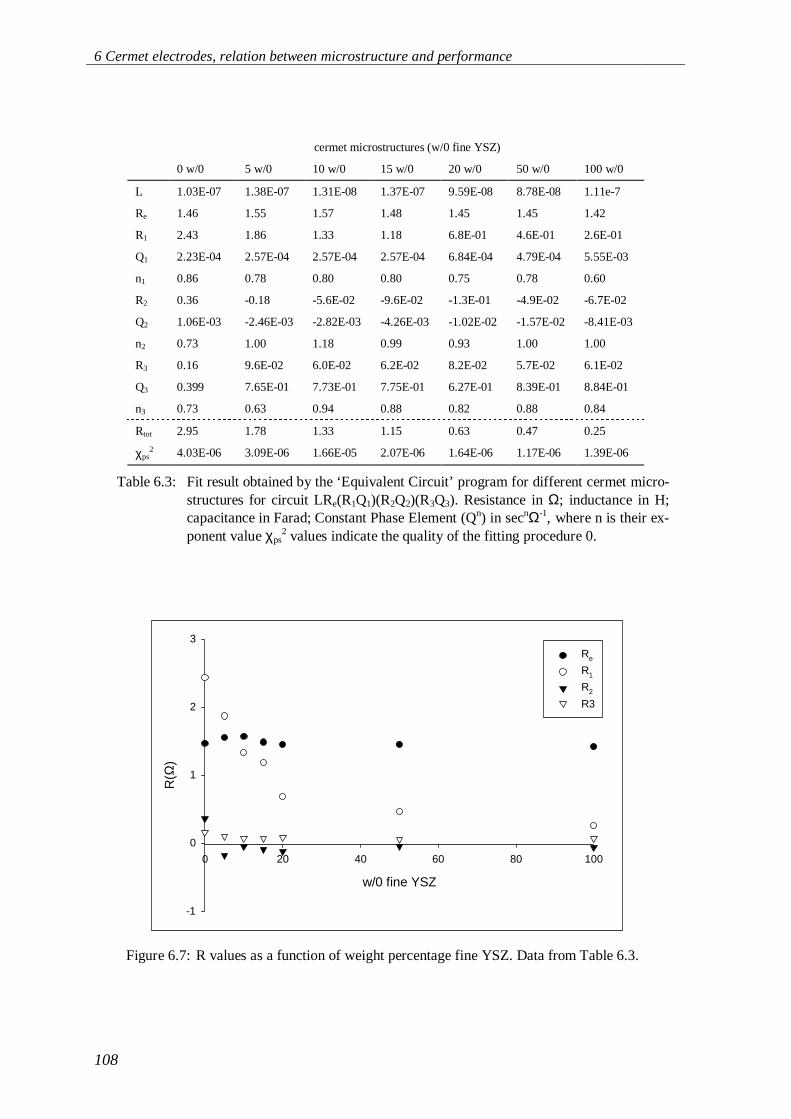
6 Cermet electrodes, relation between microstructure and performance
108
cermet microstructures (w/0 fine YSZ)
0 w/0 5 w/0 10 w/0 15 w/0 20 w/0 50 w/0 100 w/0
L 1.03E-07 1.38E-07 1.31E-08 1.37E-07 9.59E-08 8.78E-08 1.11e-7
Re 1.46 1.55 1.57 1.48 1.45 1.45 1.42
R1 2.43 1.86 1.33 1.18 6.8E-01 4.6E-01 2.6E-01
Q1 2.23E-04 2.57E-04 2.57E-04 2.57E-04 6.84E-04 4.79E-04 5.55E-03
n1 0.86 0.78 0.80 0.80 0.75 0.78 0.60
R2 0.36 -0.18 -5.6E-02 -9.6E-02 -1.3E-01 -4.9E-02 -6.7E-02
Q2 1.06E-03 -2.46E-03 -2.82E-03 -4.26E-03 -1.02E-02 -1.57E-02 -8.41E-03
n2 0.73 1.00 1.18 0.99 0.93 1.00 1.00
R3 0.16 9.6E-02 6.0E-02 6.2E-02 8.2E-02 5.7E-02 6.1E-02
Q3 0.399 7.65E-01 7.73E-01 7.75E-01 6.27E-01 8.39E-01 8.84E-01
n3 0.73 0.63 0.94 0.88 0.82 0.88 0.84
Rtot 2.95 1.78 1.33 1.15 0.63 0.47 0.25
χps2 4.03E-06 3.09E-06 1.66E-05 2.07E-06 1.64E-06 1.17E-06 1.39E-06
Table 6.3: Fit result obtained by the ‘Equivalent Circuit’ program for different cermet micro-structures for circuit LRe(R1Q1)(R2Q2)(R3Q3). Resistance in Ω; inductance in H;capacitance in Farad; Constant Phase Element (Qn) in secnΩ-1, where n is their ex-ponent value χps
2 values indicate the quality of the fitting procedure 0.
w/0 fine YSZ
0 20 40 60 80 100
R(Ω
)
-1
0
1
2
3Re
R1
R2
R3
Figure 6.7: R values as a function of weight percentage fine YSZ. Data from Table 6.3.
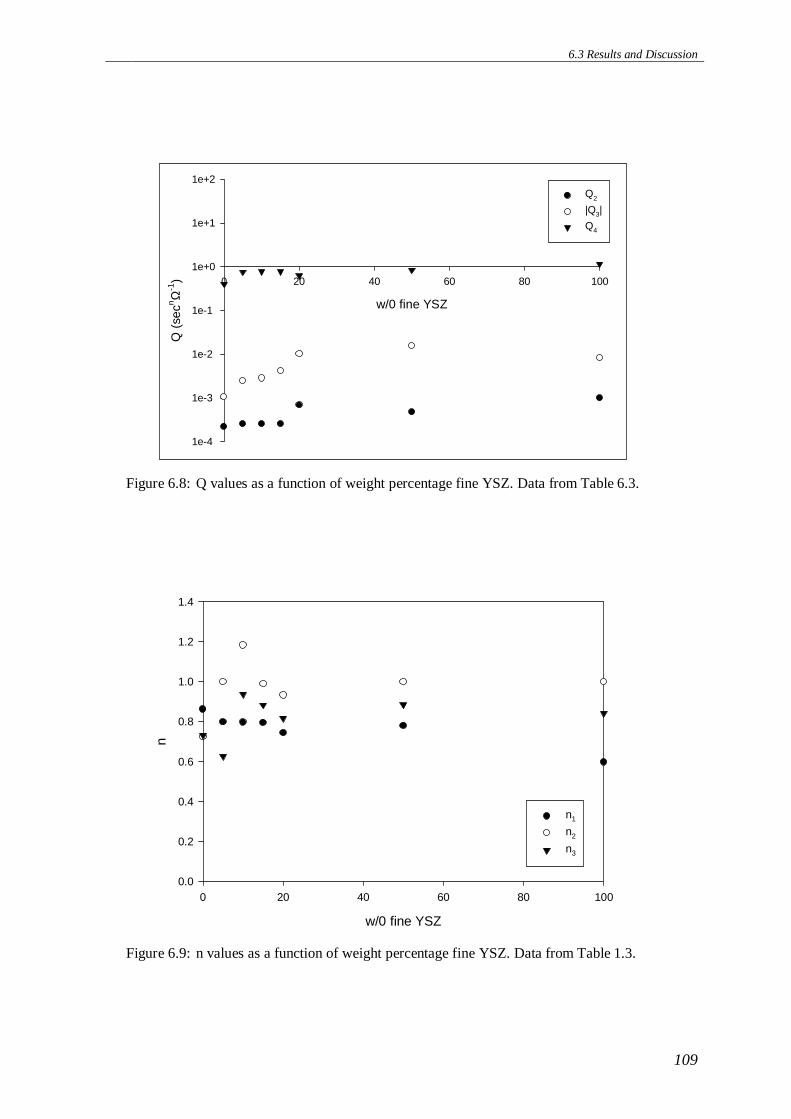
6.3 Results and Discussion
109
w/0 fine YSZ
0 20 40 60 80 100
Q (
secn Ω
-1)
1e-4
1e-3
1e-2
1e-1
1e+0
1e+1
1e+2Q2
|Q3|
Q4
Figure 6.8: Q values as a function of weight percentage fine YSZ. Data from Table 6.3.
w/0 fine YSZ
0 20 40 60 80 100
n
0.0
0.2
0.4
0.6
0.8
1.0
1.2
1.4
n1
n2
n3
Figure 6.9: n values as a function of weight percentage fine YSZ. Data from Table 1.3.
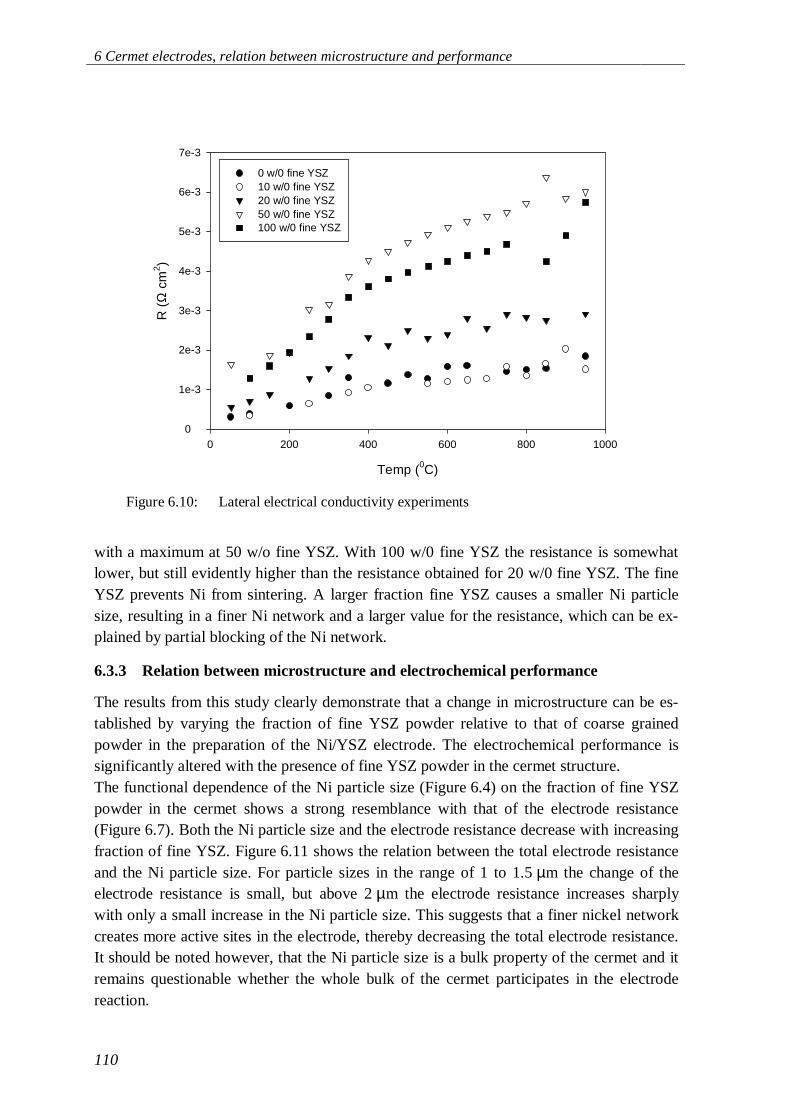
6 Cermet electrodes, relation between microstructure and performance
110
with a maximum at 50 w/o fine YSZ. With 100 w/0 fine YSZ the resistance is somewhatlower, but still evidently higher than the resistance obtained for 20 w/0 fine YSZ. The fineYSZ prevents Ni from sintering. A larger fraction fine YSZ causes a smaller Ni particlesize, resulting in a finer Ni network and a larger value for the resistance, which can be ex-plained by partial blocking of the Ni network.
6.3.3 Relation between microstructure and electrochemical performance
The results from this study clearly demonstrate that a change in microstructure can be es-tablished by varying the fraction of fine YSZ powder relative to that of coarse grainedpowder in the preparation of the Ni/YSZ electrode. The electrochemical performance issignificantly altered with the presence of fine YSZ powder in the cermet structure.The functional dependence of the Ni particle size (Figure 6.4) on the fraction of fine YSZpowder in the cermet shows a strong resemblance with that of the electrode resistance(Figure 6.7). Both the Ni particle size and the electrode resistance decrease with increasingfraction of fine YSZ. Figure 6.11 shows the relation between the total electrode resistanceand the Ni particle size. For particle sizes in the range of 1 to 1.5 µm the change of theelectrode resistance is small, but above 2 µm the electrode resistance increases sharplywith only a small increase in the Ni particle size. This suggests that a finer nickel networkcreates more active sites in the electrode, thereby decreasing the total electrode resistance.It should be noted however, that the Ni particle size is a bulk property of the cermet and itremains questionable whether the whole bulk of the cermet participates in the electrodereaction.
Temp (0C)
0 200 400 600 800 1000
R (
Ω c
m2 )
0
1e-3
2e-3
3e-3
4e-3
5e-3
6e-3
7e-3
0 w/0 fine YSZ10 w/0 fine YSZ20 w/0 fine YSZ50 w/0 fine YSZ100 w/0 fine YSZ
Figure 6.10: Lateral electrical conductivity experiments
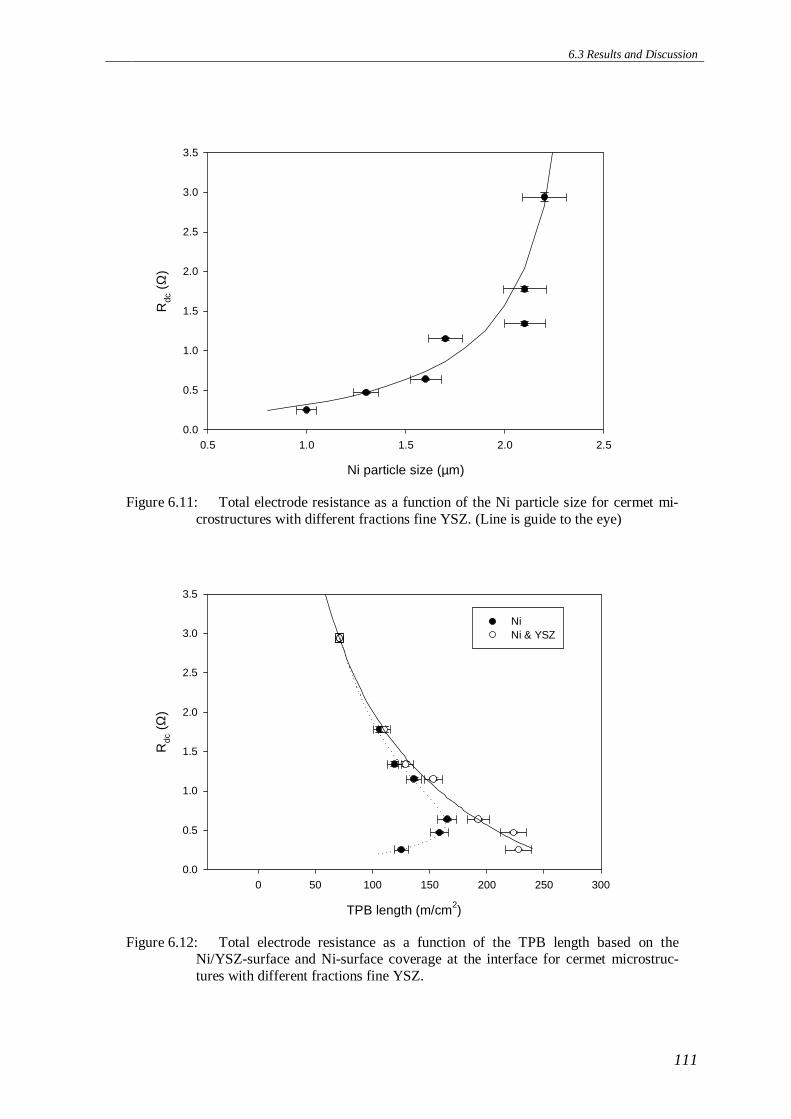
6.3 Results and Discussion
111
Ni particle size (µm)
0.5 1.0 1.5 2.0 2.5
Rdc
(Ω
)
0.0
0.5
1.0
1.5
2.0
2.5
3.0
3.5
Figure 6.11: Total electrode resistance as a function of the Ni particle size for cermet mi-crostructures with different fractions fine YSZ. (Line is guide to the eye)
TPB length (m/cm2)
0 50 100 150 200 250 300
Rdc
(Ω
)
0.0
0.5
1.0
1.5
2.0
2.5
3.0
3.5
NiNi & YSZ
Figure 6.12: Total electrode resistance as a function of the TPB length based on theNi/YSZ-surface and Ni-surface coverage at the interface for cermet microstruc-tures with different fractions fine YSZ.
6 Cermet electrodes, relation between microstructure and performance
112
Figure 6.12 shows that the total electrode resistance decreases with increasing surface cov-erage. The surface coverage relates to the length of the Triple Phase Boundary at the inter-face. It was observed that with the application of the present screen printing technique, thecoarse YSZ particles get positioned within the bulk but not at the interface between elec-trode and electrolyte. With this observation we can calculate the degree of Ni coverage atthe interface from the relative fractions of fine YSZ and Ni in the cermet. With the addi-tional observation of an almost constant particle size at the interface, the Triple PhaseBoundary length at the interface, can be calculated and will be linearly related with the Nicoverage. Figure 6.12 shows that an inverse linear relationship between electrode resis-tance and TPB length is indeed seen at relatively small fractions of fine YSZ, but not athigher values. A possible explanation for the observed behaviour is that with low fractionsof fine YSZ the electrode reaction is confined to the immediate vicinity of the interface,but at high fractions extends into the bulk of the cermet structure.
6.4 Conclusions
The results from SEM imaging show that the particle size of YSZ imposes a large influ-ence on the microstructure of Ni/YSZ electrodes. While the presence of a coarse YSZpowder ensures a relatively high porosity of the cermet structure, fine YSZ powder pre-vents Ni from sintering into larger agglomerates. Similar results were also found by otherinvestigators 000. The presence of fine YSZ therefore leads to a finer Ni network andguarantees a high degree of surface coverage for Ni particles at the interface between thecermet electrode and the electrolyte. Varying the relative amounts of coarse and fine YSZin the preparation of the cermet electrodes resulted in a significantly improved electrodeperformance with higher fractions of fine YSZ. At low fractions of fine YSZ, where per-colativity is predicted to be poor, the results from impedance spectroscopy suggest that theelectrode reaction is confined to the immediate interface between cermet electrode andelectrolyte. The observed inverse linear relationship in this region between the electroderesistance and the calculated TPB length suggests that the electrode reaction concentratesat the triple phase perimeter, which is distributed over the electrolyte surface. Only at highfractions of fine YSZ does the electrode reaction zone extend into the bulk of the cermet.The extent of the inward expansion of the active electrode area could not be calculatedfrom the present data and awaits further studies.
Acknowledgement
The Netherlands Energy Research Foundation (ECN) is thanked for the preparation of thecermet electrodes.
References
S.C. Singhal, ‘Status of Solid Oxide Fuel Cell Technology’, Proc. of the 17th Risø Int. Sym. on Materials Science, HighTemperature Electrochemistry: Ceramics and Metals, 123-38, 1996.
H. Itoh, T. Yamamoto, M. Mori, T. Horita, N. Sakai, H. Yokokawa and M. Dokiya, ‘Configurational and Electrical Be-havior of Ni-YSZ Cermet with Novel Microstructure for Solid Oxide Fuel Cell Anodes, J. Electrochem. Soc. 144,641-46, 1997.
F.P.F. van Berkel, F.H. van Heuveln and J.P.P. Huijsmans, ‘Characterisation of Solid Oxide Fuel Cell Electrodes by Im-pedance Spectroscopy and I-V Characteristics’, Solid State Ionics, 72, 240-47, 1994.
D.W. Dees, T.D. Claar, T.E. Easler, D.C. Fee and F.C. Mrazek, ‘Conductivity of Porous Ni/ZrO2-Y2O3 Cermets’, J.Electrochem. Soc., 134, 2141-46, 1987.

6.4 Conclusions
113
N.Q. Minh, ‘Ceramic Fuel Cells’, J. Am. Ceram. Soc., 76, 563-88, 1993.J. Divisek, A. Kornyshev, W. Lehnert, U. Stimming, I.C. Vinke and K. Wippermann, ‘Advanced characterisation tech-
niques for Nickel-YSZ Cermet Electrodes used in Solid Oxide Fuel Cells’, Electrochemical Proceedings Volume97-18, 606-16, 1997.
A. Ioselevich, A.A. Kornyshev and W. Lehnert, ‘Degradation of SOFC Anodes due to Sintering of Metal Particles: Cor-related Percolation Model’, J. Electroch. Soc., 144, 3010-19, 1997.
T. Kawada, N. Sakai, J. Yokokawa, M. Dokiya, M. Mori and T. Iwata, ‘Structure and Polarisation Characteristics ofSolid Oxide Fuel Cell Anodes’, SSI, 40/41, 402-06, 1990.
B.A. Boukamp, ‘A Nonlinear least squares fit procedure for analysis of immittance data of electrochemical systems,Solid State Ionics, 20, 31-44, 1986.
L Plomp, a. Booy, J.A.M. van Roosmalen, and E.H.P. Cordfunke, ‘A Four Probe Apparatus for the High ResolutionConductivity Measurements of Ceramic Oxides at high Temperatures’, Rev. Sci. Instrum., 61, 1949-53, 1990.
M.I. Mendelson, ‘Average Grain Size in Polycrystalline Ceramics’, J. Am. Ceram. Soc., 52, 443-46 (1996).J.R. MacDonald, Impedance Spectroscopy, John Wiley and Sons, New York, 1987.T. Kenjo and K. Wada, ‘Geometrical effects on pseudocapacitance in Pt/YSZ high temperature air cathodes’, Solid State
Ionics, 67, 249-55, 1994.R.D. Armstrong and B.R. Horrocks, ‘The Double Layer Structure at the Metal-Solid Electrolyte Interface’, Solid State
Ionics, 94, 181-87, 1997.F.J.F. Miranda, O.E. Barcia, O.R. Mattos, and R. Wiart, ‘Electrodeposition of Zn-Ni Alloys in Sulfate Electrolytes: I.
Experimental Approach’, J. Electrochem. Soc., 144, 3441-48 (1997).F.J.F. Miranda, O.E. Barcia, O.R. Mattos, and R. Wiart, ‘Electrodeposition of Zn-Ni Alloys in Sulfate Electrolytes: II.
Reaction Modeling’, J. Electrochem. Soc., 144, 3449-57 (1997).Y.C. Hsiao, J.R. Selman, ‘The degradation of SOFC electrodes’, Solid State Ionics, 98, 33-38 (1997)S. Primdahl and M. Mogensen, ‘Gas conversion impedance: SOFC Anodes in H2/H2O Atmospheres’, pp 530-29 in Elec-
trochemical proc. Vol 97-18 Aachen, 1997J. Geyer, H. Kohlmüller, H. Landes, R. Stübner, ‘Investigations into the kinetics of the Ni-YSZ Cermet anode of a Solid
Oxide Fuel Cell, Electrochemical Proceedings Volume 97-18, 1997.


115
7 Impedance of porous cermet electrodes
Abstract
An analytical expression is derived for the impedance of a porous cermet electrode. Themodel that accounts for the spatial extension of the triple phase boundary (TPB) lengthbetween gas, electrolyte and metal phases in a direction perpendicular to the electrolyte /porous electrode interface is that of a ladder network (continuous transmission line). Thevariables in this model are the impedances associated with the transport of ionic and elec-tronic charge carriers through both constituent phases of metal and ceramic, and that of thecharge transfer reaction at the TPB points. The expression obtained enables calculation ofthe optimum thickness for the porous composite electrode. The model is used for analysisof the impedance of nickel/yttria-stabilised-zirconia electrodes in the hydrogen oxidationreaction.
7.1 Introduction
It is generally known that nickel has a high activity in hydrogen oxidation. To obtain adhe-sion with the electrolyte (usually YSZ) and stability under conditions encountered in solidoxide fuel cells (SOFCs) (i.e. high temperature and reducing conditions), these usuallyemploy Ni-YSZ composites as anode [1]00. Another benefit of the application of porouselectrodes is a high specific surface area and thus reduced polarisation losses in the fuelcell. In the Ni-YSZ composite anode, which consists of nickel particles, electrolyte parti-cles and pores, the actual electrochemical activity is present at the three-phase-boundary.Each of the three components must be continuous, i.e. the composite must provide con-ductive pathways for electronic and (oxygen) ionic transport, and for the diffusive trans-port of fuel and reaction products. As a consequence of this spatial expansion from theelectrode / electrolyte interface into the bulk of the electrode, the electrochemical activitymay vary in distance from the electrode / electrolyte surface. The optimal compositestructure is determined in a competitive interplay of the fundamental properties exhibitedby each of the components.Several studies have been initiated to explore the effect of microstructure on the electro-chemical performance of Ni/YSZ cermet anodes 0000. The latter is frequently character-ised by impedance measurements. A major problem in this respect concerns the origin andphysical interpretation of empirical ‘equivalent circuits’ used to fit the experimental data.
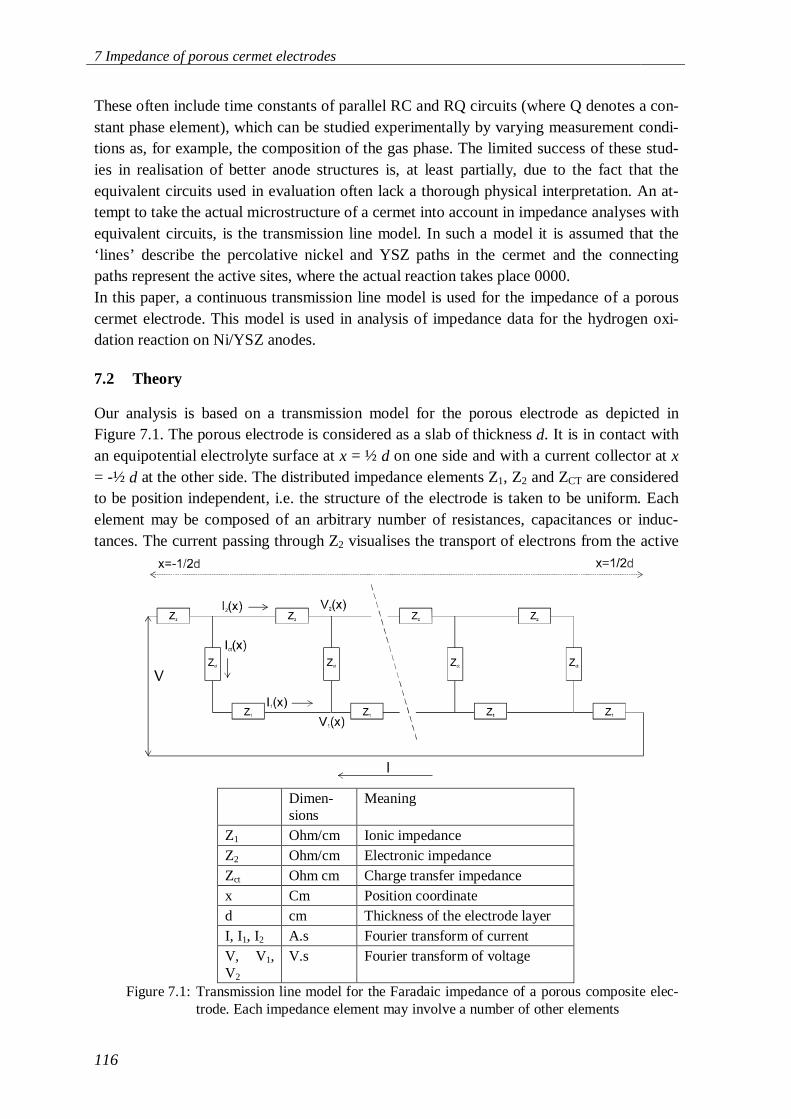
7 Impedance of porous cermet electrodes
116
These often include time constants of parallel RC and RQ circuits (where Q denotes a con-stant phase element), which can be studied experimentally by varying measurement condi-tions as, for example, the composition of the gas phase. The limited success of these stud-ies in realisation of better anode structures is, at least partially, due to the fact that theequivalent circuits used in evaluation often lack a thorough physical interpretation. An at-tempt to take the actual microstructure of a cermet into account in impedance analyses withequivalent circuits, is the transmission line model. In such a model it is assumed that the‘lines’ describe the percolative nickel and YSZ paths in the cermet and the connectingpaths represent the active sites, where the actual reaction takes place 0000.In this paper, a continuous transmission line model is used for the impedance of a porouscermet electrode. This model is used in analysis of impedance data for the hydrogen oxi-dation reaction on Ni/YSZ anodes.
7.2 Theory
Our analysis is based on a transmission model for the porous electrode as depicted inFigure 7.1. The porous electrode is considered as a slab of thickness d. It is in contact withan equipotential electrolyte surface at x = ½ d on one side and with a current collector at x= -½ d at the other side. The distributed impedance elements Z1, Z2 and ZCT are consideredto be position independent, i.e. the structure of the electrode is taken to be uniform. Eachelement may be composed of an arbitrary number of resistances, capacitances or induc-tances. The current passing through Z2 visualises the transport of electrons from the active
Dimen-sions
Meaning
Z1 Ohm/cm Ionic impedanceZ2 Ohm/cm Electronic impedanceZct Ohm cm Charge transfer impedancex Cm Position coordinated cm Thickness of the electrode layerI, I1, I2 A.s Fourier transform of currentV, V1,V2
V.s Fourier transform of voltage
Figure 7.1: Transmission line model for the Faradaic impedance of a porous composite elec-trode. Each impedance element may involve a number of other elements
7.2 Theory
117
sites in the interior of the electrode to the current collector, while the current through Z1 isassociated with the transport of oxygen ions from the electrolyte to the active sites. Thepath with Zct reflects the electrochemical exchange of charge at the three-phase-boundarycontact points. It is further assumed that• the porous electrode is homogeneous in its area of contact with both the electrolyte
membrane and the current collector,• limitations regarding the conductivity occur only in the thickness direction of the elec-
trode,• mass transport of fuel and reaction products proceeds via the pores without any diffu-
sion limitation.With these definitions and assumptions, the model can be represented by the followingcoupled differential equationsdV x
dxZ I x1
1 1
( )( )= − × (7.1)
dV x
dxZ I x2
2 2
( )( )= − × (7.2)
dI x
dx
dI x
dx
V x V x
Zct
1 2 1 2( ) ( ) ( ) ( )= − =−
(7.3)
with the boundary conditionsI I x I x= +1 2( ) ( ) (7.4)
I I x d I x d= = − = =1 2
1
2
1
2( ) ( ) (7.5)
V V x d V x d= = − − =2 1
1
2
1
2( ) ( ) (7.6)
Symbols and parameters are defined in Figure 7.1. Solutions to the differential equationsread
I xZ
Z ZI
Z
Z ZI
kx
kdI
k x d
kd11
1 2
1
1 212
12( )
cosh
cosh
sinh ( )
sinh=
+
−+
++
(7.7)
I xZ
Z ZI
Z
Z ZI
kx
kdI
k x d
kd21
1 2
1
1 212
12( )
cosh
cosh
sinh ( )
sinh=
+
++
−+
(7.8)
V xZ Z
Z ZIx
Z Z
Z Z
I
k
kx
kd
Z I
k
k x d
kdC1
1 2
1 2
1 2
1 2
1
12
12( )
sinh
cosh
cosh ( )
sinh= −
+
−+
−+
+ (7.9)
V xZ Z
Z ZIx
Z
Z Z
I
k
kx
kd
Z I
k
k x d
kdC2
1 2
1 2
22
1 2
1
12
12( )
sinh
cosh
cosh ( )
sinh= −
+
−+
++
+ (7.10)
where C is an arbitrary constant and the parameter k is defined by
kZ Z
Zct
=+1 2 (7.11)
On combining (1.1), (1.1), (1.2), (1.4) and (1.11) we obtain
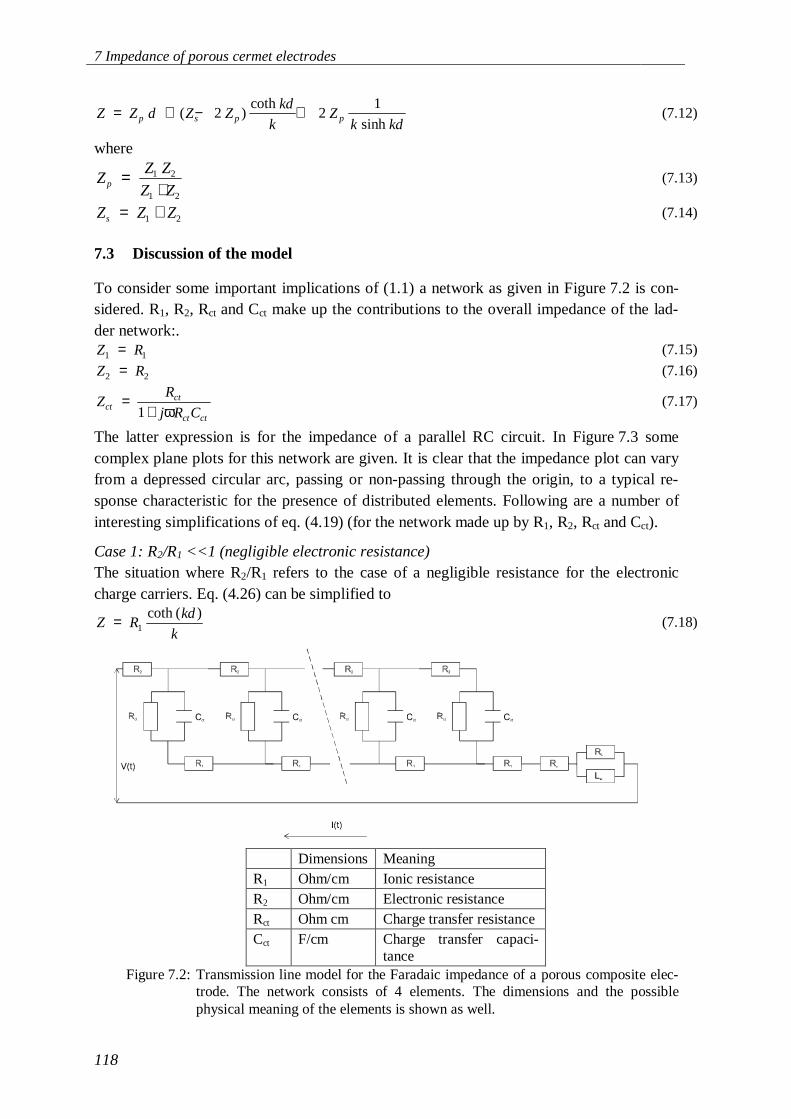
7 Impedance of porous cermet electrodes
118
Z Z d Z Zkd
kZ
k kdp s p p= + − +( )coth
sinh2 2
1(7.12)
where
ZZ Z
Z Zp =+
1 2
1 2
(7.13)
Z Z Zs = +1 2 (7.14)
7.3 Discussion of the model
To consider some important implications of (1.1) a network as given in Figure 7.2 is con-sidered. R1, R2, Rct and Cct make up the contributions to the overall impedance of the lad-der network:.Z R1 1= (7.15)
Z R2 2= (7.16)
ZR
j R Cctct
ct ct
=+1 ω
(7.17)
The latter expression is for the impedance of a parallel RC circuit. In Figure 7.3 somecomplex plane plots for this network are given. It is clear that the impedance plot can varyfrom a depressed circular arc, passing or non-passing through the origin, to a typical re-sponse characteristic for the presence of distributed elements. Following are a number ofinteresting simplifications of eq. (4.19) (for the network made up by R1, R2, Rct and Cct).
Case 1: R2/R1 <<1 (negligible electronic resistance)The situation where R2/R1 refers to the case of a negligible resistance for the electroniccharge carriers. Eq. (4.26) can be simplified to
Z Rkd
k= 1
coth ( )(7.18)
Dimensions MeaningR1 Ohm/cm Ionic resistanceR2 Ohm/cm Electronic resistanceRct Ohm cm Charge transfer resistanceCct F/cm Charge transfer capaci-
tanceFigure 7.2: Transmission line model for the Faradaic impedance of a porous composite elec-
trode. The network consists of 4 elements. The dimensions and the possiblephysical meaning of the elements is shown as well.
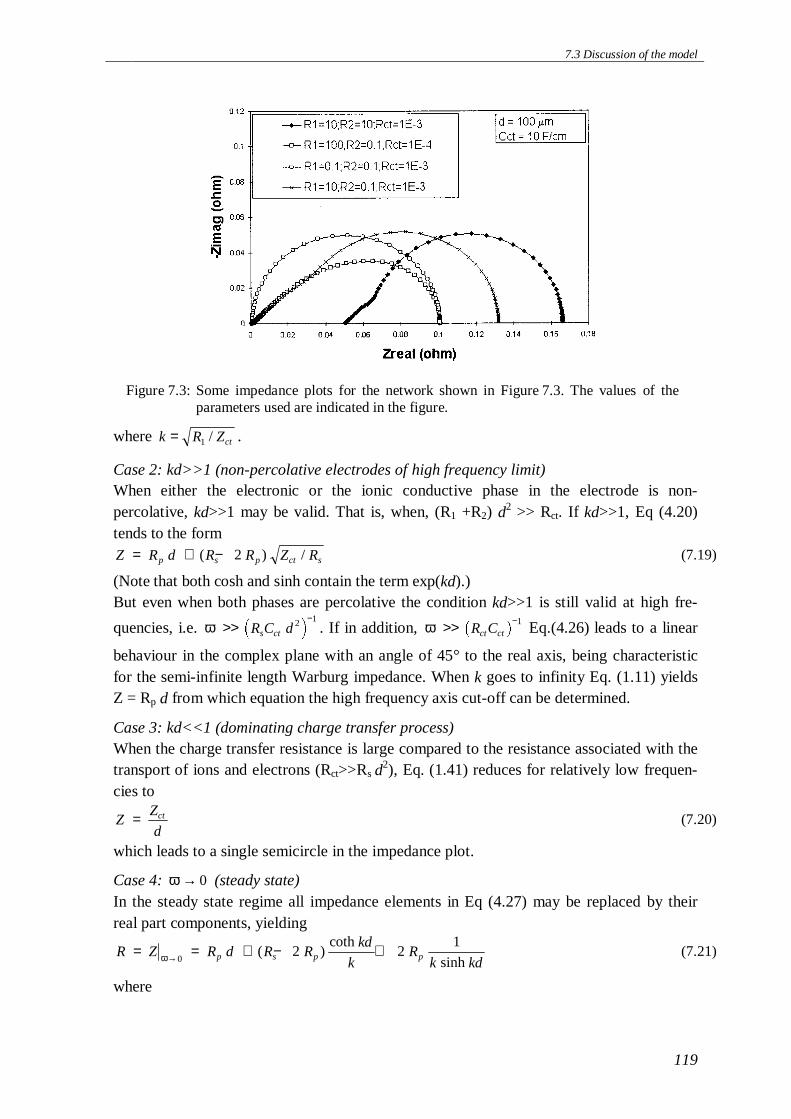
7.3 Discussion of the model
119
where k R Zct= 1 / .
Case 2: kd>>1 (non-percolative electrodes of high frequency limit)When either the electronic or the ionic conductive phase in the electrode is non-percolative, kd>>1 may be valid. That is, when, (R1 +R2) d
2 >> Rct. If kd>>1, Eq (4.20)tends to the formZ R d R R Z Rp s p ct s= + −( ) /2 (7.19)
(Note that both cosh and sinh contain the term exp(kd).)But even when both phases are percolative the condition kd>>1 is still valid at high fre-
quencies, i.e. ω >>−
R C ds ct2 1
. If in addition, ω >> −R Cct ct
1 Eq.(4.26) leads to a linear
behaviour in the complex plane with an angle of 45° to the real axis, being characteristicfor the semi-infinite length Warburg impedance. When k goes to infinity Eq. (1.11) yieldsZ = Rp d from which equation the high frequency axis cut-off can be determined.
Case 3: kd<<1 (dominating charge transfer process)When the charge transfer resistance is large compared to the resistance associated with thetransport of ions and electrons (Rct>>Rs d
2), Eq. (1.41) reduces for relatively low frequen-cies to
ZZ
dct= (7.20)
which leads to a single semicircle in the impedance plot.
Case 4: ω → 0 (steady state)In the steady state regime all impedance elements in Eq (4.27) may be replaced by theirreal part components, yielding
R Z R d R Rkd
kR
k kdp s p p= = + − +→ω 02 2
1( )
coth
sinh(7.21)
where
Figure 7.3: Some impedance plots for the network shown in Figure 7.3. The values of theparameters used are indicated in the figure.
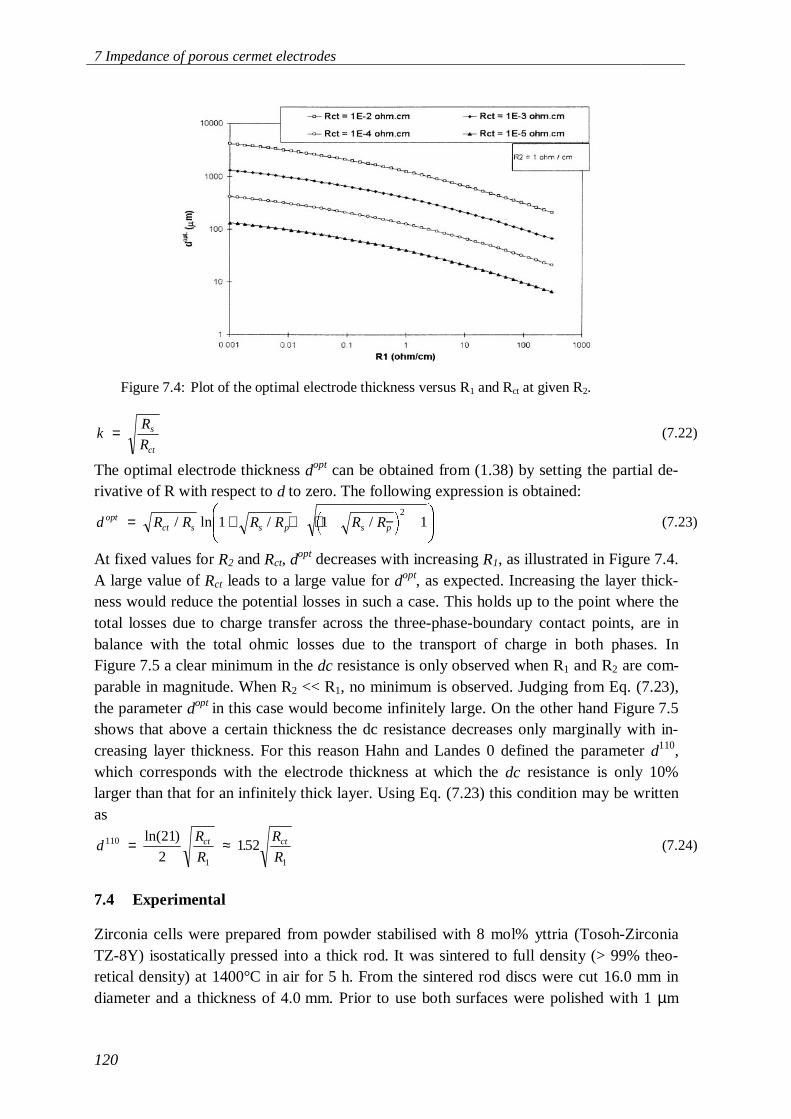
7 Impedance of porous cermet electrodes
120
kR
Rs
ct
= (7.22)
The optimal electrode thickness dopt can be obtained from (1.38) by setting the partial de-rivative of R with respect to d to zero. The following expression is obtained:
d R R R R R Roptct s s p s p= + + + −
/ ln / /1 1 12
(7.23)
At fixed values for R2 and Rct, dopt decreases with increasing R1, as illustrated in Figure 7.4.
A large value of Rct leads to a large value for dopt, as expected. Increasing the layer thick-ness would reduce the potential losses in such a case. This holds up to the point where thetotal losses due to charge transfer across the three-phase-boundary contact points, are inbalance with the total ohmic losses due to the transport of charge in both phases. InFigure 7.5 a clear minimum in the dc resistance is only observed when R1 and R2 are com-parable in magnitude. When R2 << R1, no minimum is observed. Judging from Eq. (7.23),the parameter dopt in this case would become infinitely large. On the other hand Figure 7.5shows that above a certain thickness the dc resistance decreases only marginally with in-creasing layer thickness. For this reason Hahn and Landes 0 defined the parameter d110,which corresponds with the electrode thickness at which the dc resistance is only 10%larger than that for an infinitely thick layer. Using Eq. (7.23) this condition may be writtenas
dR
R
R
Rct ct110
1 1
21
2152= ≈ln( ). (7.24)
7.4 Experimental
Zirconia cells were prepared from powder stabilised with 8 mol% yttria (Tosoh-ZirconiaTZ-8Y) isostatically pressed into a thick rod. It was sintered to full density (> 99% theo-retical density) at 1400°C in air for 5 h. From the sintered rod discs were cut 16.0 mm indiameter and a thickness of 4.0 mm. Prior to use both surfaces were polished with 1 µm
Figure 7.4: Plot of the optimal electrode thickness versus R1 and Rct at given R2.

7.5 Results and discussion
121
diamond paste and ultrasonically cleaned with ethanol. A screen printing technique wasused to form the Ni/YSZ working electrode at one of the polished surfaces. Different ratiosof fine and coarse YSZ powder were used in the screen printing paste to obtain a system-atic variation in the microstructure. The nickel content in the paste was fixed to a value of 55vol% of the total solid mass obtained after reduction. The deposited anodes were sintered at1300°C for 5 h in air. Reduction of the NiO was carried out in-situ, prior to the electrochemi-cal experiments at 850°C, by stepwise changing the gas flow from nitrogen to a standard gasmixture as described below. Platinum paint (Demetron) was applied to the other side of thedisc to form the counter electrode. A small groove around the disc was used for embeddingof the platinum wire reference electrode. This groove was coated with platinum paint toimprove the reference contact. Platinum wires (∅ = 0.2 mm) were used as current leadsand potential probes. Before the cell was mounted in the apparatus for electrochemicalmeasurements it was fired in air at 1000°C for 1 h to anneal the Pt paint.Electrochemical experiments were done at 850°C in hydrogen gas saturated with 2.3%H2O (100ml⋅min-1 (STP)), using the electrochemical cell in an undivided set-up. Imped-ance spectra were acquired over the range form 1 MHz to 10 mHz using a Solartron 1255frequency response analyser with a Solartron 1287 electrochemical interface. This data wasanalysed using the 'Equivalent Circuit' program 0 and the transmission line model de-scribed in Section 7.2. The experimental set-up has been described in detail elsewhere 0.
7.5 Results and discussion
7.5.1 Impedance analysis using 'Equivalent Circuit'
Typical impedance diagrams obtained for cermet electrodes with different microstructuresare given in Figure 7.6. These could be fitted using the 'Equivalent Circuit' program 0 withthe aid of the circuit LwRe(R1Q1)(R2Q2)(R3Q3), where L is an inductance, R a resistanceand Q designates the impedance of a constant phase element (CPE). The latter is
Figure 7.5: Dc resistance versus electrode thickness. Calculations are based upon Eq. 7.23using the parameters indicated in the figure.
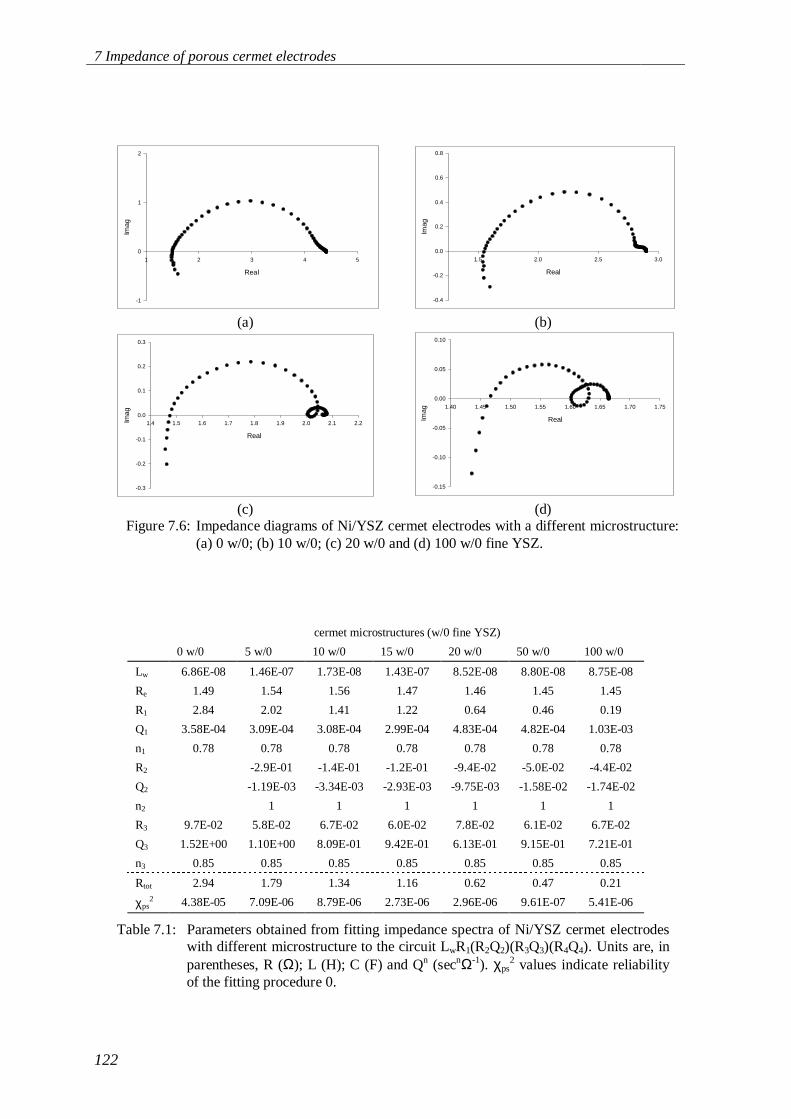
7 Impedance of porous cermet electrodes
122
Real
1 2 3 4 5
Imag
-1
0
1
2
Real
1.5 2.0 2.5 3.0
Imag
-0.4
-0.2
0.0
0.2
0.4
0.6
0.8
(a) (b)
Real
1.4 1.5 1.6 1.7 1.8 1.9 2.0 2.1 2.2Imag
-0.3
-0.2
-0.1
0.0
0.1
0.2
0.3
Real
1.40 1.45 1.50 1.55 1.60 1.65 1.70 1.75
Imag
-0.15
-0.10
-0.05
0.00
0.05
0.10
(c) (d)Figure 7.6: Impedance diagrams of Ni/YSZ cermet electrodes with a different microstructure:
(a) 0 w/0; (b) 10 w/0; (c) 20 w/0 and (d) 100 w/0 fine YSZ.
cermet microstructures (w/0 fine YSZ)
0 w/0 5 w/0 10 w/0 15 w/0 20 w/0 50 w/0 100 w/0
Lw 6.86E-08 1.46E-07 1.73E-08 1.43E-07 8.52E-08 8.80E-08 8.75E-08
Re 1.49 1.54 1.56 1.47 1.46 1.45 1.45
R1 2.84 2.02 1.41 1.22 0.64 0.46 0.19
Q1 3.58E-04 3.09E-04 3.08E-04 2.99E-04 4.83E-04 4.82E-04 1.03E-03
n1 0.78 0.78 0.78 0.78 0.78 0.78 0.78
R2 -2.9E-01 -1.4E-01 -1.2E-01 -9.4E-02 -5.0E-02 -4.4E-02
Q2 -1.19E-03 -3.34E-03 -2.93E-03 -9.75E-03 -1.58E-02 -1.74E-02
n2 1 1 1 1 1 1
R3 9.7E-02 5.8E-02 6.7E-02 6.0E-02 7.8E-02 6.1E-02 6.7E-02
Q3 1.52E+00 1.10E+00 8.09E-01 9.42E-01 6.13E-01 9.15E-01 7.21E-01
n3 0.85 0.85 0.85 0.85 0.85 0.85 0.85
Rtot 2.94 1.79 1.34 1.16 0.62 0.47 0.21
χps2 4.38E-05 7.09E-06 8.79E-06 2.73E-06 2.96E-06 9.61E-07 5.41E-06
Table 7.1: Parameters obtained from fitting impedance spectra of Ni/YSZ cermet electrodeswith different microstructure to the circuit LwR1(R2Q2)(R3Q3)(R4Q4). Units are, inparentheses, R (Ω); L (H); C (F) and Qn (secnΩ-1). χps
2 values indicate reliabilityof the fitting procedure 0.
7.5 Results and discussion
123
given by ZCPE=1/Q(iω)n, where i is the imaginary unit and ω the angular frequency. Pa-rameters obtained from fitting are listed in Table 7.1.Lw is associated with the inductance of the wiring and instruments, whereas Re representsthe uncompensated resistance of the electrolyte membrane. The three parallel RQ subcir-cuits describe the electrode response. The frequency powers n1, n2 and n3 of the CPE ele-ments were fixed to enable comparison between the corresponding Q-values obtained forthe different electrodes (see Table 7.1). For the cermet structure with zero w/0 of fine YSZpowder only two RQ subcircuits are needed to obtain a sufficiently low value for χps
2, aparameter which is indicative for the reliability of the fit procedure 0.In Figure 7.6 an inductive loop is apparent in the mid-frequency range. In the fitting proce-dure this could be accounted for by assigning negative values to parameters R2 and Q2. Theorigin of the inductive loop might be explained in terms of the relaxation involving the sur-face coverage of an adsorbed intermediate species limited by two frequency-dependent rateprocesses. To derive the Faradaic impedance of heterogeneous reaction mechanisms due toadsorbed intermediates several methods have been developed 0. Analysis basically re-quires information about the potential dependence of the rate constants involved, the frac-tional coverage of the surface and of the free and blocked sites (in case there are two ormore adsorbed intermediates) and the total amount of active sites available. Model calcu-lations of these kind of processes have not been reported for the hydrogen oxidation reac-tion on Ni/YSZ composite electrodes, which is most certainly due to the complexity of itsreaction mechanism. Even though impedance measurements are indispensable to obtaininformation about the time constants of the rate processes involved, they do not providedirect information about the nature of the adsorbed intermediates. Comparable inductivebehaviour is reported for SOFC cathodes by Hsiao et al. 0. Resistance values as a functionof the fraction of fine YSZ in the cermet structure are shown in Figure 7.7. As seen fromthis figure, the absolute value of R2 decreases with increasing fraction of fine YSZ, whichobservation emphasises on the importance of the microstructure in determining essentialfeatures in the impedance diagram.The resistance R1 associated with the high-frequency arc decreases significantly if only asmall fraction of coarse YSZ is replaced by fine YSZ. As this arc is commonly interpretedas due to charge transfer 000, the increased number of three-phase-boundary contact pointsin the composite with increasing the volume fraction of fine YSZ can explain such behav-iour. The resistance R3 associated with the low-frequency arc appears to be almost inde-pendent of the cermet microstructure.The Q values of the CPE elements of the three semicircles are represented in Figure 7.8.
7.5.2 Impedance analysis using the ladder network model
In this section the impedance data is analysed using the ladder network model. To simplifymatters, is assumed that Eqs. (7.15), (7.16) and (7.17) give the expressions for the elementsof the network (see also Figure 7.2). Only the high frequency data of the spectra is consid-ered. Therefore the experimental data was corrected by subtracting (R2Q2)(R3Q3) as ob-tained by fitting the experimental data with the program 'Equivalent Circuit'. To includeproperly the excluded (R2Q2)(R3Q3) of the spectrum in the network analysis, more should

7 Impedance of porous cermet electrodes
124
w/0 fine YSZ in cermet
0 20 40 60 80 100
R (
Ωcm
2)
-1
0
1
2
3
4Re
R1
R2
R3
Rtot
Figure 7.7: Resistance values obtained from impedance data at zero bias for cermet structureswith different fractions fine YSZ powder.
w/0 fine YSZ in cermet
0 20 40 60 80 100
log
Qn (
secn Ω
-1)
-4
-3
-2
-1
0
1
2
Q1
Q2
Q3
Figure 7.8: Q values of the CPE elements obtained from impedance data at zero bias for cer-met structures with different fractions fine YSZ powder, n values were fixed at(n1,n2,n3) = (0.78, 1, 0.85).
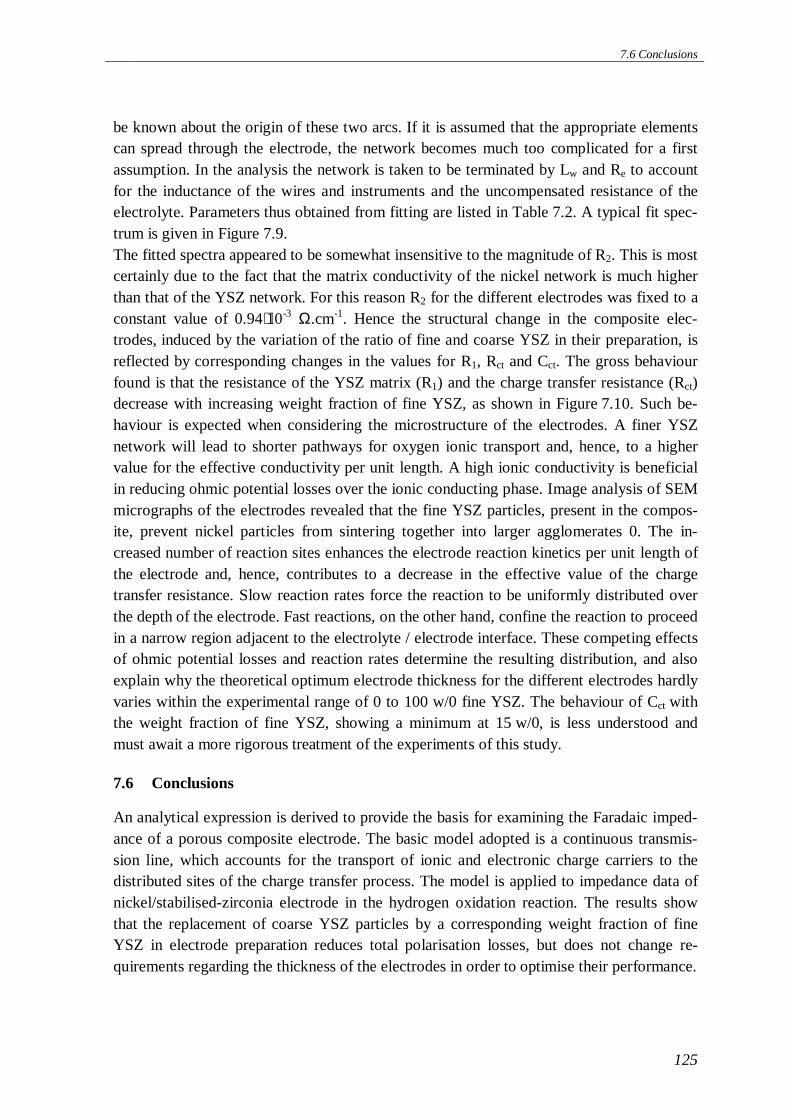
7.6 Conclusions
125
be known about the origin of these two arcs. If it is assumed that the appropriate elementscan spread through the electrode, the network becomes much too complicated for a firstassumption. In the analysis the network is taken to be terminated by Lw and Re to accountfor the inductance of the wires and instruments and the uncompensated resistance of theelectrolyte. Parameters thus obtained from fitting are listed in Table 7.2. A typical fit spec-trum is given in Figure 7.9.The fitted spectra appeared to be somewhat insensitive to the magnitude of R2. This is mostcertainly due to the fact that the matrix conductivity of the nickel network is much higherthan that of the YSZ network. For this reason R2 for the different electrodes was fixed to aconstant value of 0.94⋅10-3 Ω.cm-1. Hence the structural change in the composite elec-trodes, induced by the variation of the ratio of fine and coarse YSZ in their preparation, isreflected by corresponding changes in the values for R1, Rct and Cct. The gross behaviourfound is that the resistance of the YSZ matrix (R1) and the charge transfer resistance (Rct)decrease with increasing weight fraction of fine YSZ, as shown in Figure 7.10. Such be-haviour is expected when considering the microstructure of the electrodes. A finer YSZnetwork will lead to shorter pathways for oxygen ionic transport and, hence, to a highervalue for the effective conductivity per unit length. A high ionic conductivity is beneficialin reducing ohmic potential losses over the ionic conducting phase. Image analysis of SEMmicrographs of the electrodes revealed that the fine YSZ particles, present in the compos-ite, prevent nickel particles from sintering together into larger agglomerates 0. The in-creased number of reaction sites enhances the electrode reaction kinetics per unit length ofthe electrode and, hence, contributes to a decrease in the effective value of the chargetransfer resistance. Slow reaction rates force the reaction to be uniformly distributed overthe depth of the electrode. Fast reactions, on the other hand, confine the reaction to proceedin a narrow region adjacent to the electrolyte / electrode interface. These competing effectsof ohmic potential losses and reaction rates determine the resulting distribution, and alsoexplain why the theoretical optimum electrode thickness for the different electrodes hardlyvaries within the experimental range of 0 to 100 w/0 fine YSZ. The behaviour of Cct withthe weight fraction of fine YSZ, showing a minimum at 15 w/0, is less understood andmust await a more rigorous treatment of the experiments of this study.
7.6 Conclusions
An analytical expression is derived to provide the basis for examining the Faradaic imped-ance of a porous composite electrode. The basic model adopted is a continuous transmis-sion line, which accounts for the transport of ionic and electronic charge carriers to thedistributed sites of the charge transfer process. The model is applied to impedance data ofnickel/stabilised-zirconia electrode in the hydrogen oxidation reaction. The results showthat the replacement of coarse YSZ particles by a corresponding weight fraction of fineYSZ in electrode preparation reduces total polarisation losses, but does not change re-quirements regarding the thickness of the electrodes in order to optimise their performance.
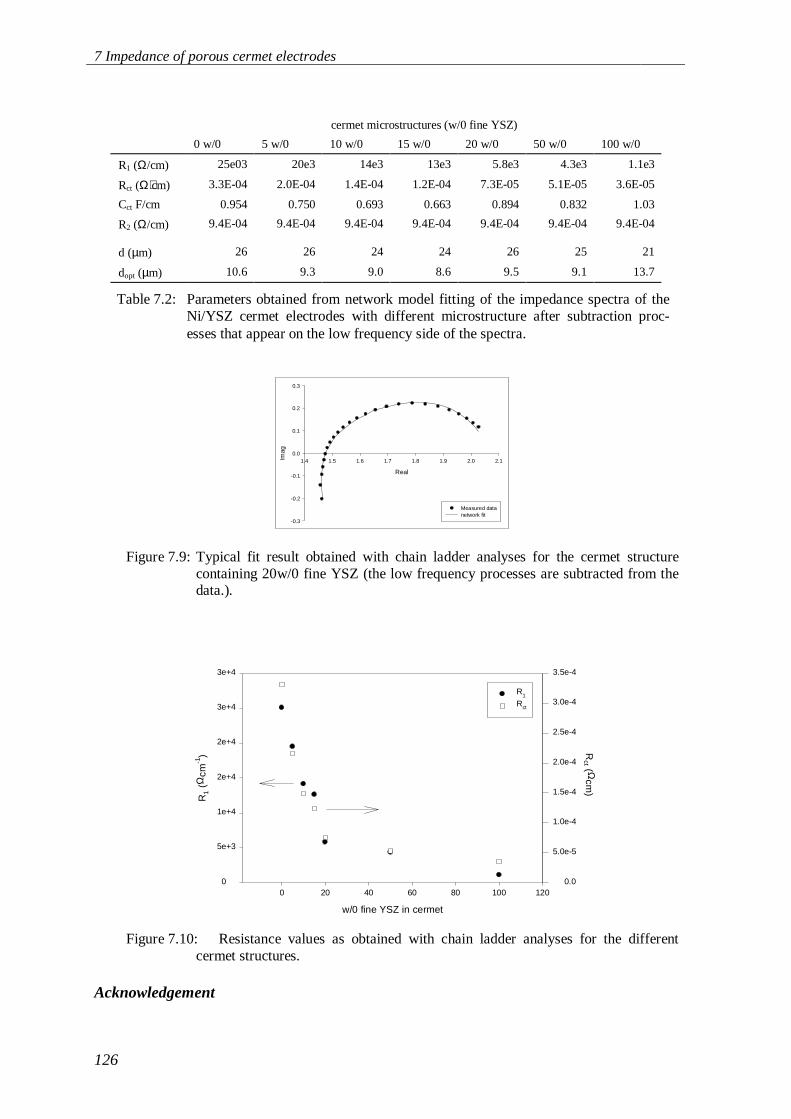
7 Impedance of porous cermet electrodes
126
Acknowledgement
cermet microstructures (w/0 fine YSZ)
0 w/0 5 w/0 10 w/0 15 w/0 20 w/0 50 w/0 100 w/0
R1 (Ω/cm) 25e03 20e3 14e3 13e3 5.8e3 4.3e3 1.1e3
Rct (Ω⋅cm) 3.3E-04 2.0E-04 1.4E-04 1.2E-04 7.3E-05 5.1E-05 3.6E-05
Cct F/cm 0.954 0.750 0.693 0.663 0.894 0.832 1.03
R2 (Ω/cm) 9.4E-04 9.4E-04 9.4E-04 9.4E-04 9.4E-04 9.4E-04 9.4E-04
d (µm) 26 26 24 24 26 25 21
dopt (µm) 10.6 9.3 9.0 8.6 9.5 9.1 13.7
Table 7.2: Parameters obtained from network model fitting of the impedance spectra of theNi/YSZ cermet electrodes with different microstructure after subtraction proc-esses that appear on the low frequency side of the spectra.
Real
1.4 1.5 1.6 1.7 1.8 1.9 2.0 2.1Imag
-0.3
-0.2
-0.1
0.0
0.1
0.2
0.3
Measured datanetwork fit
Figure 7.9: Typical fit result obtained with chain ladder analyses for the cermet structurecontaining 20w/0 fine YSZ (the low frequency processes are subtracted from thedata.).
w/0 fine YSZ in cermet
0 20 40 60 80 100 120
R1
(Ωcm
-1)
0
5e+3
1e+4
2e+4
2e+4
3e+4
3e+4
Rct ( Ω
cm)
0.0
5.0e-5
1.0e-4
1.5e-4
2.0e-4
2.5e-4
3.0e-4
3.5e-4
R1
Rct
Figure 7.10: Resistance values as obtained with chain ladder analyses for the differentcermet structures.

7.6 Conclusions
127
M.H.R. Lankhorst is thanked for useful discussions and for the mathematical analysis pre-sented in this chapter. F.P.F. van Berkel is thanked for critical reading of the manuscript.
References
S.C. Singhal, ‘Status of Solid Oxide Fuel Cell Technology’, Proc. of the 17th Risø Int. Sym. on Materials Science, HighTemperature Electrochemistry: Ceramics and Metals, 123-38, 1996.
N.Q. Minh, ‘Ceramic Fuel Cells’, J. Am. Ceram. Soc., 76, 563-88, 1993.A. Hammou, J. Guindet, 'Solid Oxide Fuel Cells', Ch 12 of 'The CRC Handbook of Solid-State Electrochemistry', pp
409-445, CRC Press, Inc., 1997.H. Itoh, T. Yamamoto, M. Mori, T. Horita, N. Sakai, H. Yokokawa and M. Dokiya, ‘Configurational and Electrical Be-
havior of Ni-YSZ Cermet with Novel Microstructure for Solid Oxide Fuel Cell Anodes, J. Electrochem. Soc. 144,641-46, 1997.
F.P.F. van Berkel, F.H. van Heuveln and J.P.P. Huijsmans, ‘Characterisation of Solid Oxide Fuel Cell Electrodes by Im-pedance Spectroscopy and I-V Characteristics’, Solid State Ionics, 72, 240-47, 1994.
D.W. Dees, T.D. Claar, T.E. Easler, D.C. Fee and F.C. Mrazek, ‘Conductivity of Porous Ni/ZrO2-Y2O3 Cermets’, J.Electrochem. Soc., 134, 2141-46, 1987.
S. Primdahl and M. Mogensen, ‘Oxidation of Hydrogen on Ni/Yttria-Stabilized Zirconia Cermet Anodes’, J. Electro-chem. Soc., 144, 3409-19, 1997.
T. Kawada, N. Sakai, J. Yokokawa, M. Dokiya, M. Mori and T. Iwata, ‘Structure and Polarisation Characteristics ofSolid Oxide Fuel Cell Anodes’, SSI, 40/41, 402-06, 1990.
A. Hahn, H. Landes, ‘Investigations into the kinetics of SOFC cathodes’ pp 595-605 in Proc. Of the 5th Int. Symp. OnSOFC, Ed. U. Stimming, S.C. Singhal, H. Tagawa, and W. Lehnert, The Electrochemical Society, Aachen, 1997.
F. Richter, ‘Impedance Measurements under High Current for Development and Quality Control of Solid Oxide FuelCells (SOFCs)’, pp 3-7, Electrochemical Applications 1/97, Zahner-elektrik GmbH & Co, 1997.
G. Paasch, P.H. Nguyen, ‘Impedance of Inhomogeneous Porous Electrodes, a novel Transfer Matrix Calculation Method,pp 7-9, Electrochemical Applications 1/97, Zahner-elektrik GmbH & Co, 1997.
B.A. Boukamp, ‘A Nonlinear least squares fit procedure for analysis of immittance data of electrochemical systems,Solid State Ionics, 20, 31-44, 1986.
Chapter 2 of this thesis.J.R. MacDonald, Impedance Spectroscopy, John Wiley and Sons, New York, 1987.Y.C. Hsiao, J.R. Selman, ‘The degradation of SOFC Electrodes’, Solid State Ionics 98 33-38, 1997.T. Norby, O.J. Velle, H. Leth-Olsen and R. Tunold, 'Reaction resistance in relation to three phase boundary length of
Ni/YSZ electrodes', pp.473-78 in: Proc. Of the 3rd Int. Symp. On Solid Oxide Fuel Cells, Honolulu, Hawaii, 1993.M. Mogensen and T. Lindegaard, 'The kinetics of hydrogen oxidation on a Ni/YSZ SOFC electrode at 1000ºC'; pp. 484-
93 in: Proc. Of the 3rd Int. Symp. On Solid Oxide Fuel Cells, Honolulu, Hawaii, 1993.Chapter 6 of this thesis.

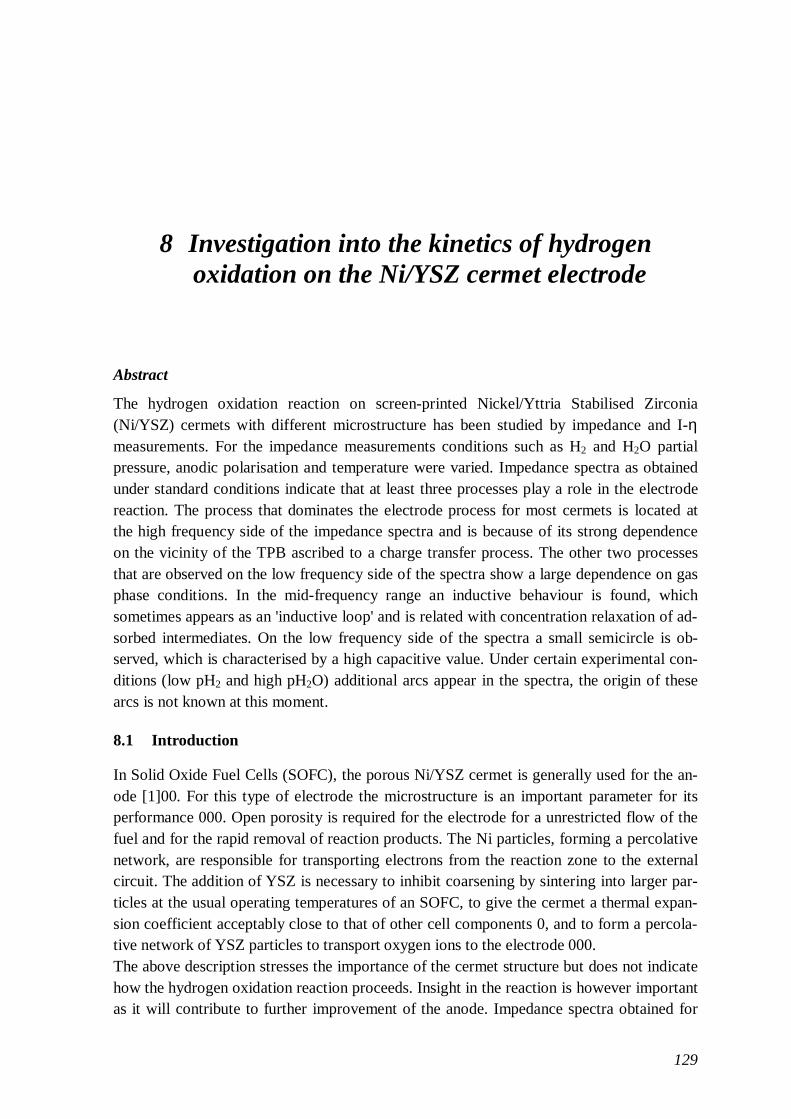
129
8 Investigation into the kinetics of hydrogenoxidation on the Ni/YSZ cermet electrode
Abstract
The hydrogen oxidation reaction on screen-printed Nickel/Yttria Stabilised Zirconia(Ni/YSZ) cermets with different microstructure has been studied by impedance and I-ηmeasurements. For the impedance measurements conditions such as H2 and H2O partialpressure, anodic polarisation and temperature were varied. Impedance spectra as obtainedunder standard conditions indicate that at least three processes play a role in the electrodereaction. The process that dominates the electrode process for most cermets is located atthe high frequency side of the impedance spectra and is because of its strong dependenceon the vicinity of the TPB ascribed to a charge transfer process. The other two processesthat are observed on the low frequency side of the spectra show a large dependence on gasphase conditions. In the mid-frequency range an inductive behaviour is found, whichsometimes appears as an 'inductive loop' and is related with concentration relaxation of ad-sorbed intermediates. On the low frequency side of the spectra a small semicircle is ob-served, which is characterised by a high capacitive value. Under certain experimental con-ditions (low pH2 and high pH2O) additional arcs appear in the spectra, the origin of thesearcs is not known at this moment.
8.1 Introduction
In Solid Oxide Fuel Cells (SOFC), the porous Ni/YSZ cermet is generally used for the an-ode [1]00. For this type of electrode the microstructure is an important parameter for itsperformance 000. Open porosity is required for the electrode for a unrestricted flow of thefuel and for the rapid removal of reaction products. The Ni particles, forming a percolativenetwork, are responsible for transporting electrons from the reaction zone to the externalcircuit. The addition of YSZ is necessary to inhibit coarsening by sintering into larger par-ticles at the usual operating temperatures of an SOFC, to give the cermet a thermal expan-sion coefficient acceptably close to that of other cell components 0, and to form a percola-tive network of YSZ particles to transport oxygen ions to the electrode 000.The above description stresses the importance of the cermet structure but does not indicatehow the hydrogen oxidation reaction proceeds. Insight in the reaction is however importantas it will contribute to further improvement of the anode. Impedance spectra obtained for
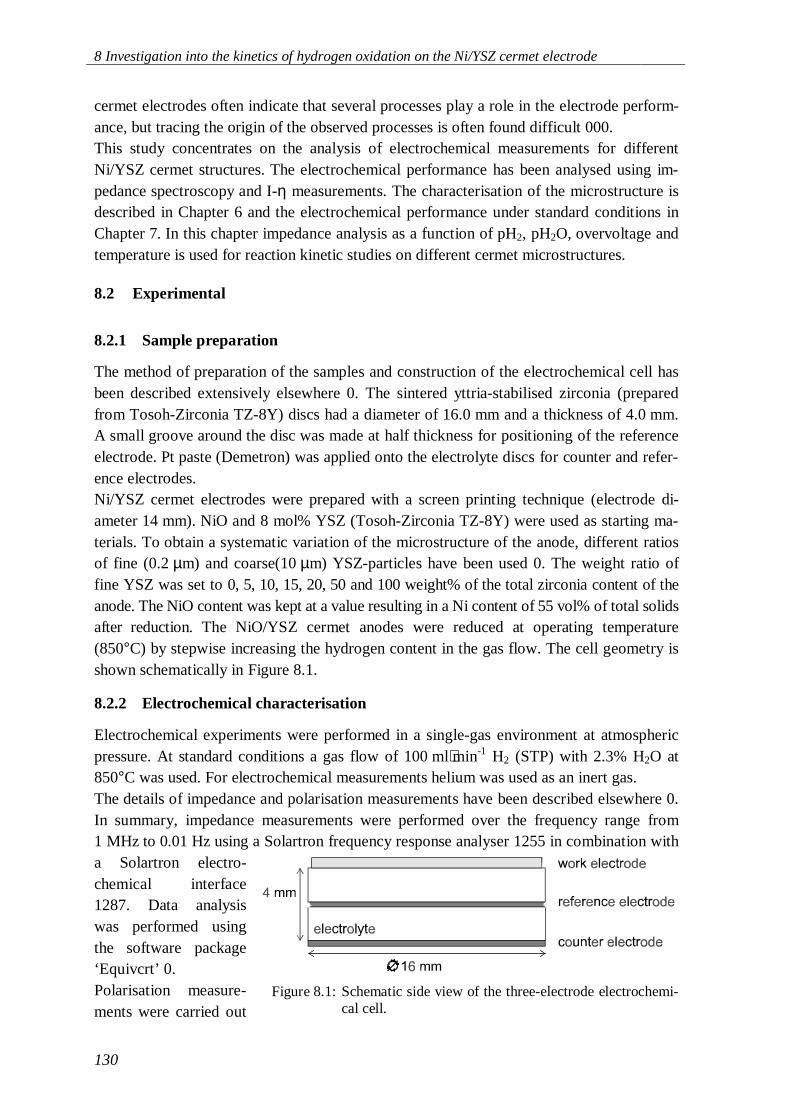
8 Investigation into the kinetics of hydrogen oxidation on the Ni/YSZ cermet electrode
130
cermet electrodes often indicate that several processes play a role in the electrode perform-ance, but tracing the origin of the observed processes is often found difficult 000.This study concentrates on the analysis of electrochemical measurements for differentNi/YSZ cermet structures. The electrochemical performance has been analysed using im-pedance spectroscopy and I-η measurements. The characterisation of the microstructure isdescribed in Chapter 6 and the electrochemical performance under standard conditions inChapter 7. In this chapter impedance analysis as a function of pH2, pH2O, overvoltage andtemperature is used for reaction kinetic studies on different cermet microstructures.
8.2 Experimental
8.2.1 Sample preparation
The method of preparation of the samples and construction of the electrochemical cell hasbeen described extensively elsewhere 0. The sintered yttria-stabilised zirconia (preparedfrom Tosoh-Zirconia TZ-8Y) discs had a diameter of 16.0 mm and a thickness of 4.0 mm.A small groove around the disc was made at half thickness for positioning of the referenceelectrode. Pt paste (Demetron) was applied onto the electrolyte discs for counter and refer-ence electrodes.Ni/YSZ cermet electrodes were prepared with a screen printing technique (electrode di-ameter 14 mm). NiO and 8 mol% YSZ (Tosoh-Zirconia TZ-8Y) were used as starting ma-terials. To obtain a systematic variation of the microstructure of the anode, different ratiosof fine (0.2 µm) and coarse(10 µm) YSZ-particles have been used 0. The weight ratio offine YSZ was set to 0, 5, 10, 15, 20, 50 and 100 weight% of the total zirconia content of theanode. The NiO content was kept at a value resulting in a Ni content of 55 vol% of total solidsafter reduction. The NiO/YSZ cermet anodes were reduced at operating temperature(850°C) by stepwise increasing the hydrogen content in the gas flow. The cell geometry isshown schematically in Figure 8.1.
8.2.2 Electrochemical characterisation
Electrochemical experiments were performed in a single-gas environment at atmosphericpressure. At standard conditions a gas flow of 100 ml⋅min-1 H2 (STP) with 2.3% H2O at850°C was used. For electrochemical measurements helium was used as an inert gas.The details of impedance and polarisation measurements have been described elsewhere 0.In summary, impedance measurements were performed over the frequency range from1 MHz to 0.01 Hz using a Solartron frequency response analyser 1255 in combination witha Solartron electro-chemical interface1287. Data analysiswas performed usingthe software package‘Equivcrt’ 0.Polarisation measure-ments were carried out
Figure 8.1: Schematic side view of the three-electrode electrochemi-cal cell.
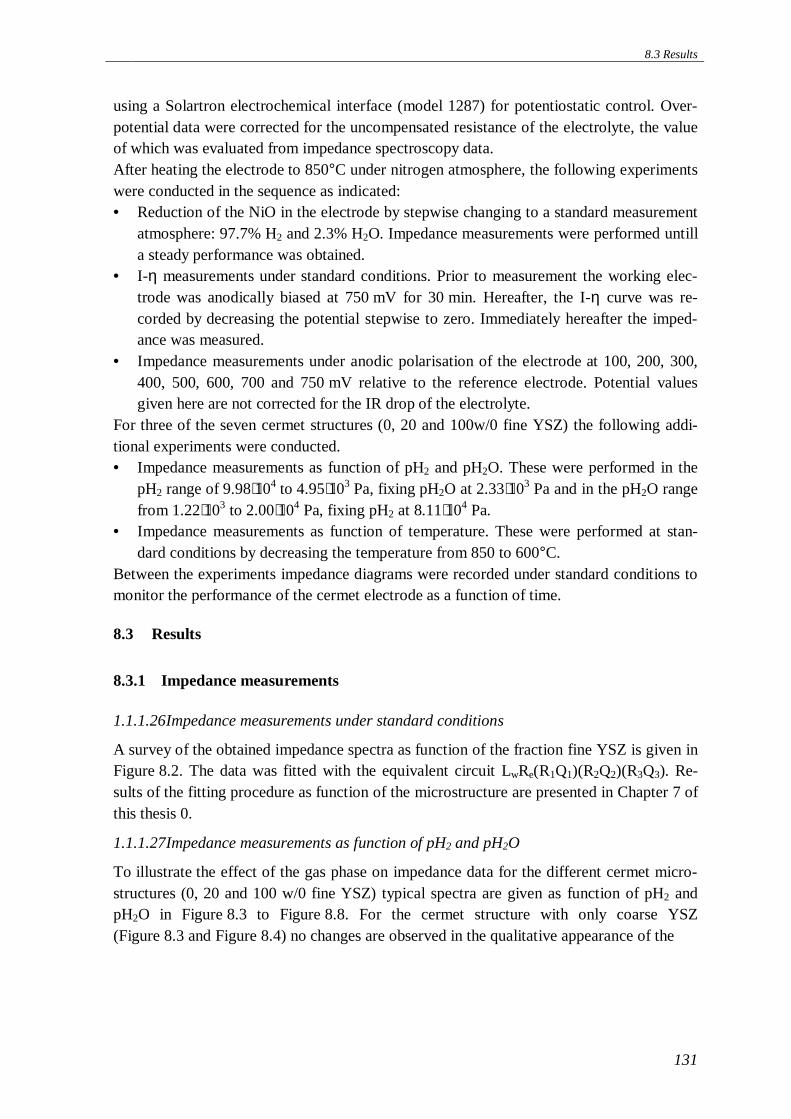
8.3 Results
131
using a Solartron electrochemical interface (model 1287) for potentiostatic control. Over-potential data were corrected for the uncompensated resistance of the electrolyte, the valueof which was evaluated from impedance spectroscopy data.After heating the electrode to 850°C under nitrogen atmosphere, the following experimentswere conducted in the sequence as indicated:• Reduction of the NiO in the electrode by stepwise changing to a standard measurement
atmosphere: 97.7% H2 and 2.3% H2O. Impedance measurements were performed untilla steady performance was obtained.
• I-η measurements under standard conditions. Prior to measurement the working elec-trode was anodically biased at 750 mV for 30 min. Hereafter, the I-η curve was re-corded by decreasing the potential stepwise to zero. Immediately hereafter the imped-ance was measured.
• Impedance measurements under anodic polarisation of the electrode at 100, 200, 300,400, 500, 600, 700 and 750 mV relative to the reference electrode. Potential valuesgiven here are not corrected for the IR drop of the electrolyte.
For three of the seven cermet structures (0, 20 and 100w/0 fine YSZ) the following addi-tional experiments were conducted.• Impedance measurements as function of pH2 and pH2O. These were performed in the
pH2 range of 9.98⋅104 to 4.95⋅103 Pa, fixing pH2O at 2.33⋅103 Pa and in the pH2O rangefrom 1.22⋅103 to 2.00⋅104 Pa, fixing pH2 at 8.11⋅104 Pa.
• Impedance measurements as function of temperature. These were performed at stan-dard conditions by decreasing the temperature from 850 to 600°C.
Between the experiments impedance diagrams were recorded under standard conditions tomonitor the performance of the cermet electrode as a function of time.
8.3 Results
8.3.1 Impedance measurements
1.1.1.26 Impedance measurements under standard conditions
A survey of the obtained impedance spectra as function of the fraction fine YSZ is given inFigure 8.2. The data was fitted with the equivalent circuit LwRe(R1Q1)(R2Q2)(R3Q3). Re-sults of the fitting procedure as function of the microstructure are presented in Chapter 7 ofthis thesis 0.
1.1.1.27 Impedance measurements as function of pH2 and pH2O
To illustrate the effect of the gas phase on impedance data for the different cermet micro-structures (0, 20 and 100 w/0 fine YSZ) typical spectra are given as function of pH2 andpH2O in Figure 8.3 to Figure 8.8. For the cermet structure with only coarse YSZ(Figure 8.3 and Figure 8.4) no changes are observed in the qualitative appearance of the
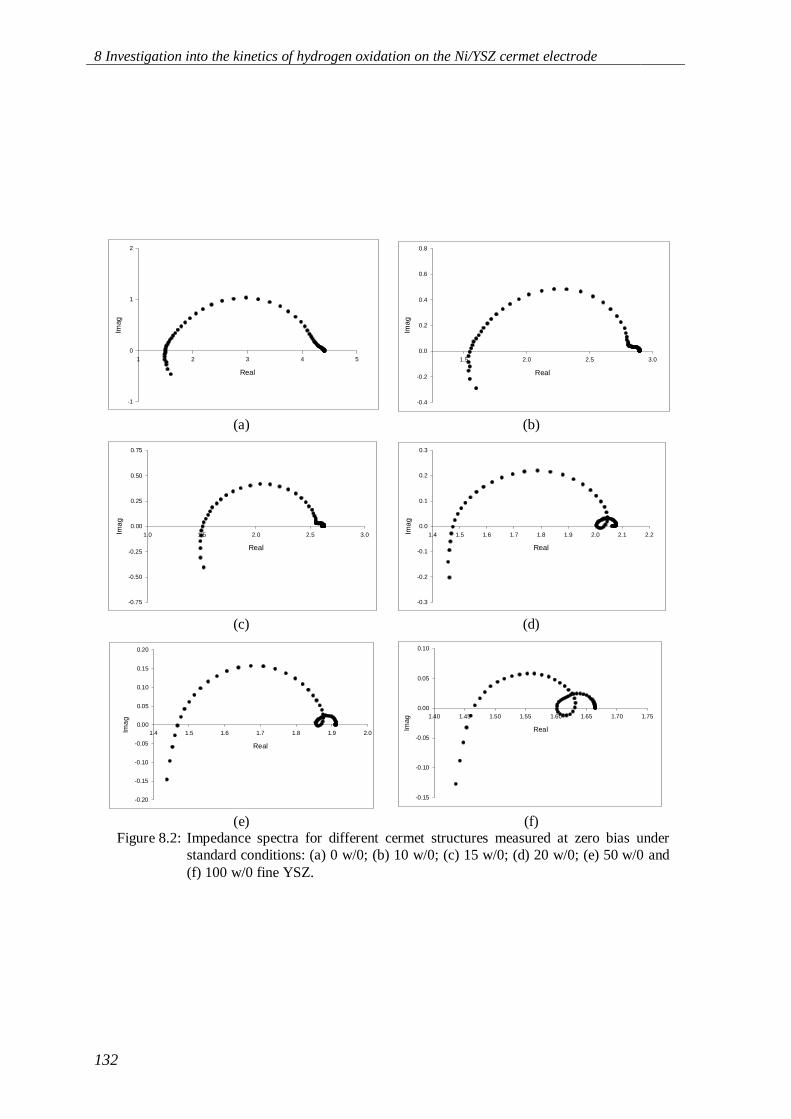
8 Investigation into the kinetics of hydrogen oxidation on the Ni/YSZ cermet electrode
132
Real
1 2 3 4 5
Imag
-1
0
1
2
Real
1.5 2.0 2.5 3.0
Imag
-0.4
-0.2
0.0
0.2
0.4
0.6
0.8
(a) (b)
Real
1.0 1.5 2.0 2.5 3.0Imag
-0.75
-0.50
-0.25
0.00
0.25
0.50
0.75
Real
1.4 1.5 1.6 1.7 1.8 1.9 2.0 2.1 2.2Imag
-0.3
-0.2
-0.1
0.0
0.1
0.2
0.3
(c) (d)
Real
1.4 1.5 1.6 1.7 1.8 1.9 2.0Ima
g
-0.20
-0.15
-0.10
-0.05
0.00
0.05
0.10
0.15
0.20
Real
1.40 1.45 1.50 1.55 1.60 1.65 1.70 1.75
Imag
-0.15
-0.10
-0.05
0.00
0.05
0.10
(e) (f)Figure 8.2: Impedance spectra for different cermet structures measured at zero bias under
standard conditions: (a) 0 w/0; (b) 10 w/0; (c) 15 w/0; (d) 20 w/0; (e) 50 w/0 and(f) 100 w/0 fine YSZ.
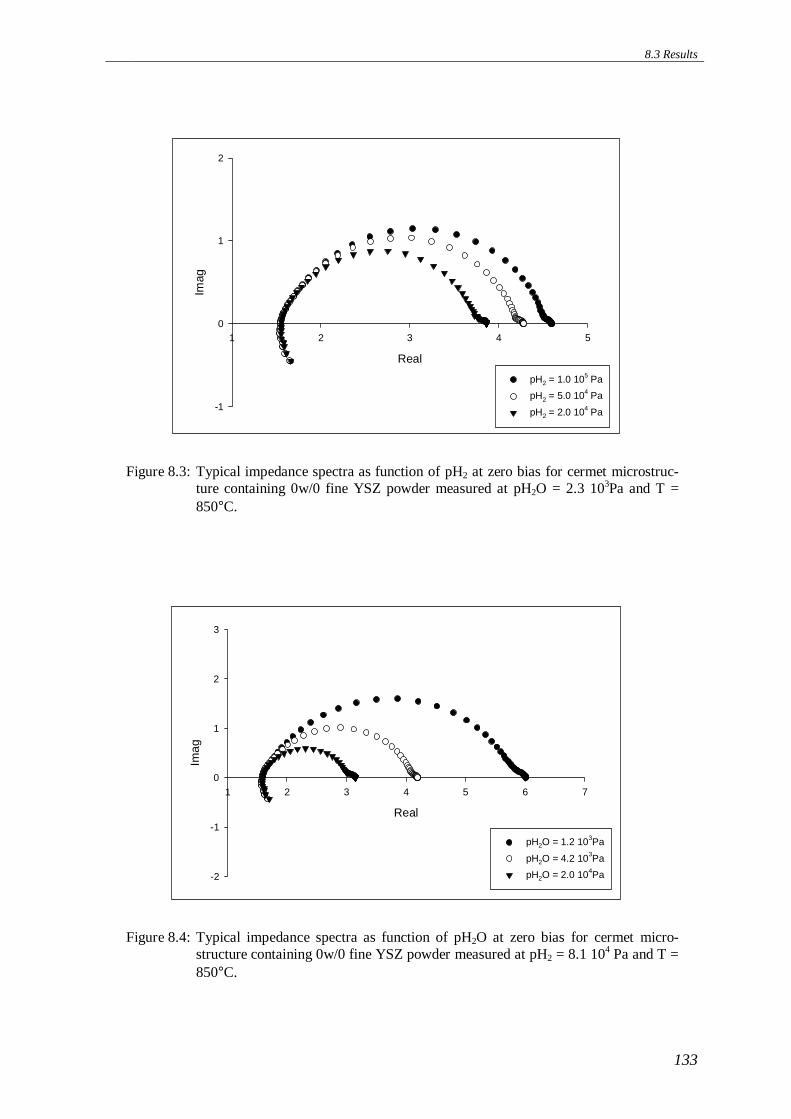
8.3 Results
133
Real
1 2 3 4 5
Imag
-1
0
1
2
pH2 = 1.0 105 Pa
pH2 = 5.0 104 Pa
pH2 = 2.0 104 Pa
Figure 8.3: Typical impedance spectra as function of pH2 at zero bias for cermet microstruc-ture containing 0w/0 fine YSZ powder measured at pH2O = 2.3 103Pa and T =850°C.
Real
1 2 3 4 5 6 7
Imag
-2
-1
0
1
2
3
pH2O = 1.2 103Pa
pH2O = 4.2 103Pa
pH2O = 2.0 104Pa
Figure 8.4: Typical impedance spectra as function of pH2O at zero bias for cermet micro-structure containing 0w/0 fine YSZ powder measured at pH2 = 8.1 104 Pa and T =850°C.
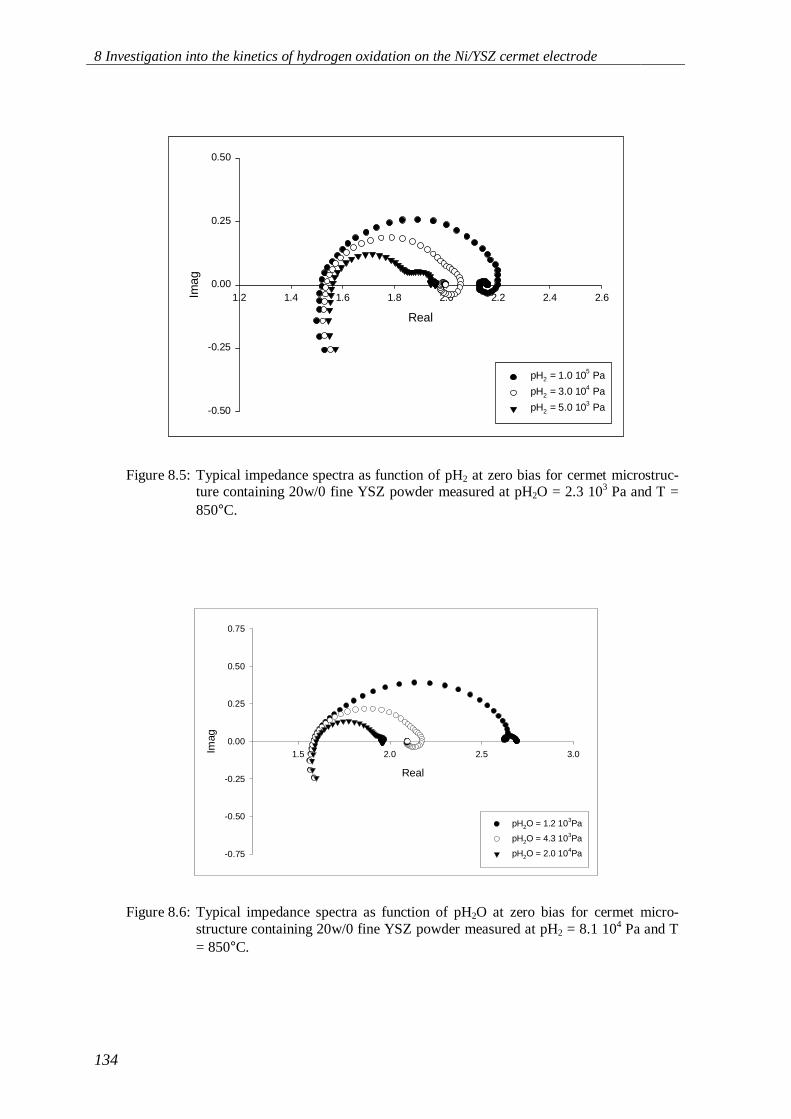
8 Investigation into the kinetics of hydrogen oxidation on the Ni/YSZ cermet electrode
134
Real
1.2 1.4 1.6 1.8 2.0 2.2 2.4 2.6Imag
-0.50
-0.25
0.00
0.25
0.50
pH2 = 1.0 105 Pa
pH2 = 3.0 104 Pa
pH2 = 5.0 103 Pa
Figure 8.5: Typical impedance spectra as function of pH2 at zero bias for cermet microstruc-ture containing 20w/0 fine YSZ powder measured at pH2O = 2.3 103 Pa and T =850°C.
Real
1.5 2.0 2.5 3.0Imag
-0.75
-0.50
-0.25
0.00
0.25
0.50
0.75
pH2O = 1.2 103Pa
pH2O = 4.3 103Pa
pH2O = 2.0 104Pa
Figure 8.6: Typical impedance spectra as function of pH2O at zero bias for cermet micro-structure containing 20w/0 fine YSZ powder measured at pH2 = 8.1 104 Pa and T= 850°C.
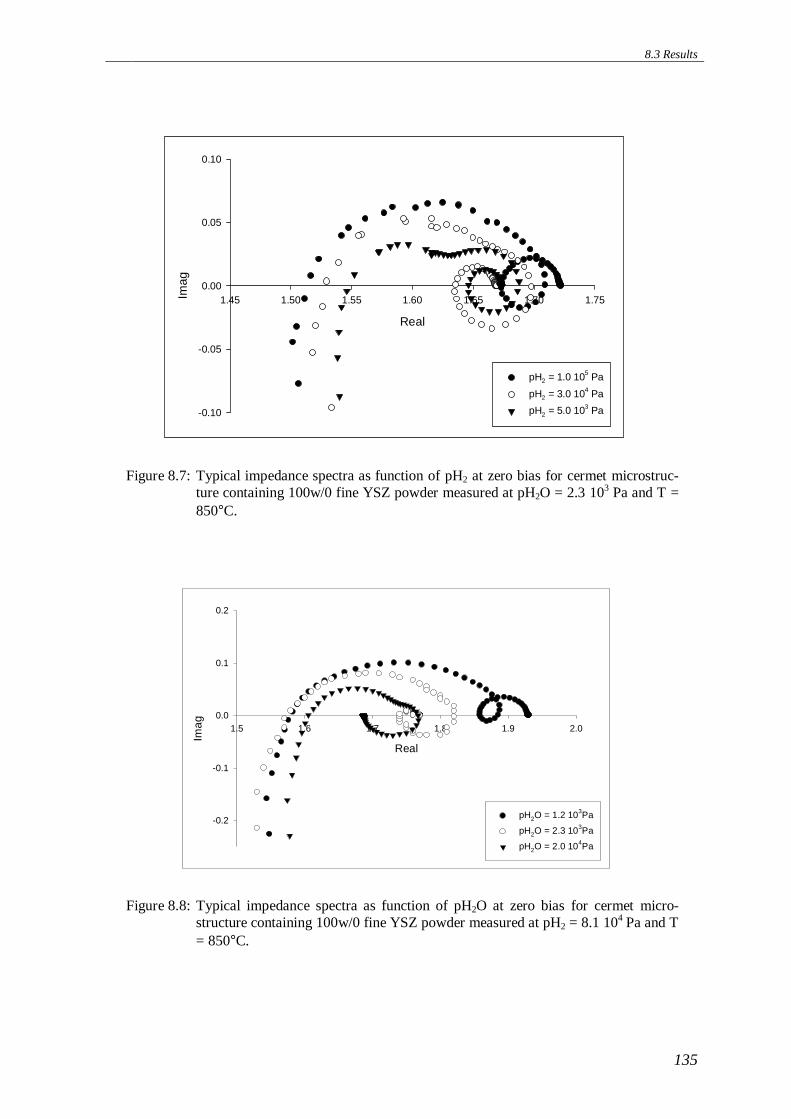
8.3 Results
135
Real
1.45 1.50 1.55 1.60 1.65 1.70 1.75Imag
-0.10
-0.05
0.00
0.05
0.10
pH2 = 1.0 105 Pa
pH2 = 3.0 104 Pa
pH2 = 5.0 103 Pa
Figure 8.7: Typical impedance spectra as function of pH2 at zero bias for cermet microstruc-ture containing 100w/0 fine YSZ powder measured at pH2O = 2.3 103 Pa and T =850°C.
Real
1.5 1.6 1.7 1.8 1.9 2.0
Imag
-0.2
-0.1
0.0
0.1
0.2
pH2O = 1.2 103Pa
pH2O = 2.3 103Pa
pH2O = 2.0 104Pa
Figure 8.8: Typical impedance spectra as function of pH2O at zero bias for cermet micro-structure containing 100w/0 fine YSZ powder measured at pH2 = 8.1 104 Pa and T= 850°C.
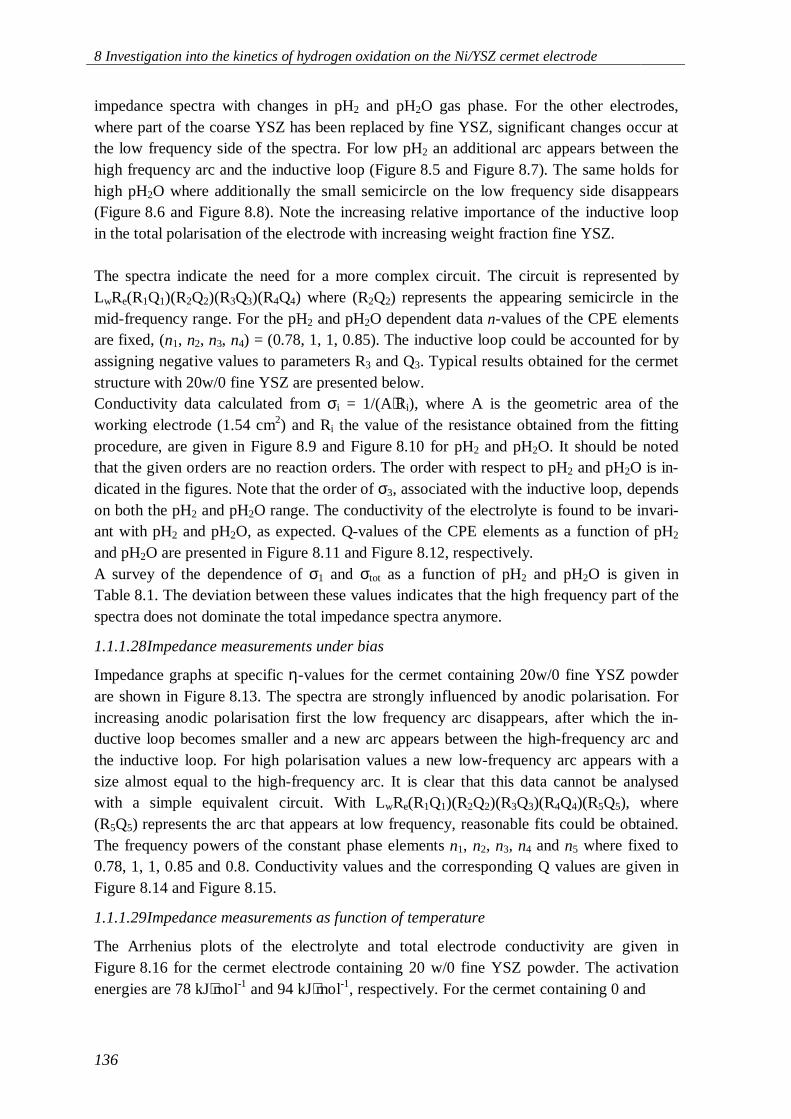
8 Investigation into the kinetics of hydrogen oxidation on the Ni/YSZ cermet electrode
136
impedance spectra with changes in pH2 and pH2O gas phase. For the other electrodes,where part of the coarse YSZ has been replaced by fine YSZ, significant changes occur atthe low frequency side of the spectra. For low pH2 an additional arc appears between thehigh frequency arc and the inductive loop (Figure 8.5 and Figure 8.7). The same holds forhigh pH2O where additionally the small semicircle on the low frequency side disappears(Figure 8.6 and Figure 8.8). Note the increasing relative importance of the inductive loopin the total polarisation of the electrode with increasing weight fraction fine YSZ.
The spectra indicate the need for a more complex circuit. The circuit is represented byLwRe(R1Q1)(R2Q2)(R3Q3)(R4Q4) where (R2Q2) represents the appearing semicircle in themid-frequency range. For the pH2 and pH2O dependent data n-values of the CPE elementsare fixed, (n1, n2, n3, n4) = (0.78, 1, 1, 0.85). The inductive loop could be accounted for byassigning negative values to parameters R3 and Q3. Typical results obtained for the cermetstructure with 20w/0 fine YSZ are presented below.Conductivity data calculated from σi = 1/(A⋅Ri), where A is the geometric area of theworking electrode (1.54 cm2) and Ri the value of the resistance obtained from the fittingprocedure, are given in Figure 8.9 and Figure 8.10 for pH2 and pH2O. It should be notedthat the given orders are no reaction orders. The order with respect to pH2 and pH2O is in-dicated in the figures. Note that the order of σ3, associated with the inductive loop, dependson both the pH2 and pH2O range. The conductivity of the electrolyte is found to be invari-ant with pH2 and pH2O, as expected. Q-values of the CPE elements as a function of pH2
and pH2O are presented in Figure 8.11 and Figure 8.12, respectively.A survey of the dependence of σ1 and σtot as a function of pH2 and pH2O is given inTable 8.1. The deviation between these values indicates that the high frequency part of thespectra does not dominate the total impedance spectra anymore.
1.1.1.28 Impedance measurements under bias
Impedance graphs at specific η-values for the cermet containing 20w/0 fine YSZ powderare shown in Figure 8.13. The spectra are strongly influenced by anodic polarisation. Forincreasing anodic polarisation first the low frequency arc disappears, after which the in-ductive loop becomes smaller and a new arc appears between the high-frequency arc andthe inductive loop. For high polarisation values a new low-frequency arc appears with asize almost equal to the high-frequency arc. It is clear that this data cannot be analysedwith a simple equivalent circuit. With LwRe(R1Q1)(R2Q2)(R3Q3)(R4Q4)(R5Q5), where(R5Q5) represents the arc that appears at low frequency, reasonable fits could be obtained.The frequency powers of the constant phase elements n1, n2, n3, n4 and n5 where fixed to0.78, 1, 1, 0.85 and 0.8. Conductivity values and the corresponding Q values are given inFigure 8.14 and Figure 8.15.
1.1.1.29 Impedance measurements as function of temperature
The Arrhenius plots of the electrolyte and total electrode conductivity are given inFigure 8.16 for the cermet electrode containing 20 w/0 fine YSZ powder. The activationenergies are 78 kJ⋅mol-1 and 94 kJ⋅mol-1, respectively. For the cermet containing 0 and
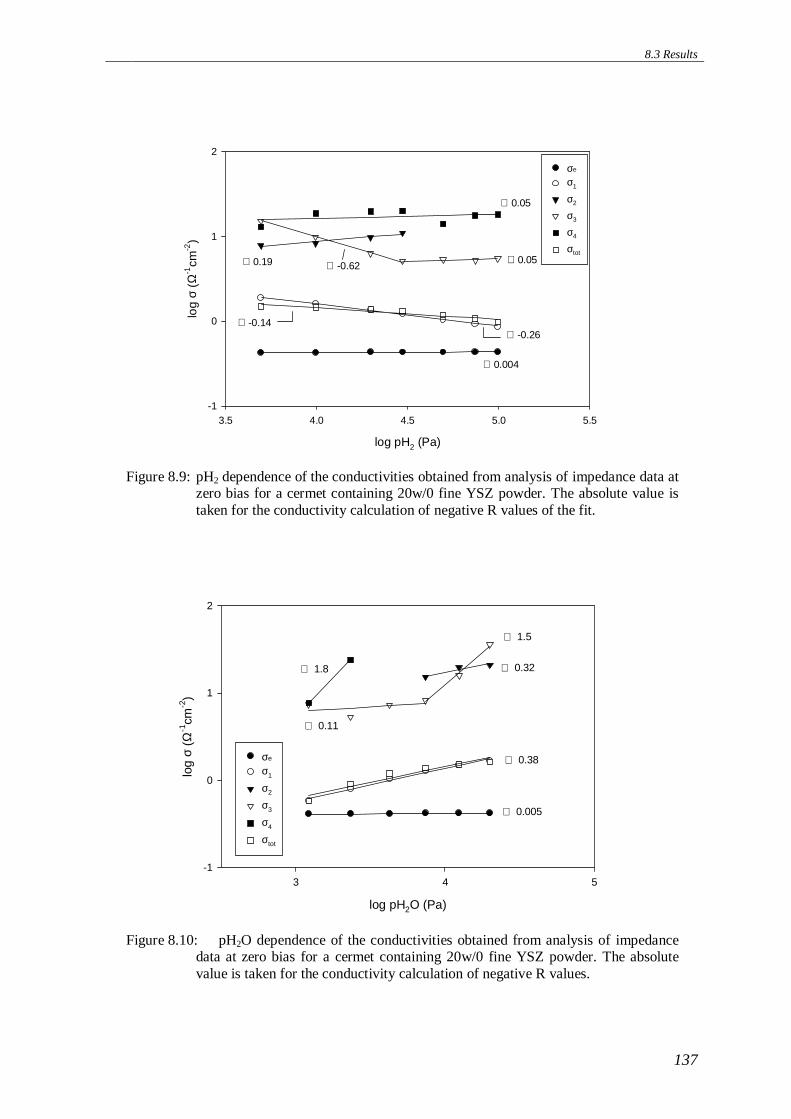
8.3 Results
137
log pH2 (Pa)
3.5 4.0 4.5 5.0 5.5
log
σ (Ω
-1cm
-2)
-1
0
1
2
σe
σ1
σ2
σ3
σ4
σtot
∠ 0.004
∠ -0.26
∠ 0.19 ∠ 0.05∠ -0.62
∠ -0.14
∠ 0.05
Figure 8.9: pH2 dependence of the conductivities obtained from analysis of impedance data atzero bias for a cermet containing 20w/0 fine YSZ powder. The absolute value istaken for the conductivity calculation of negative R values of the fit.
log pH2O (Pa)
3 4 5
log
σ (Ω
-1cm
-2)
-1
0
1
2
σe
σ1
σ2
σ3
σ4
σtot
∠ 0.005
∠ 0.38
∠ 1.8
∠ 0.11
∠ 1.5
∠ 0.32
Figure 8.10: pH2O dependence of the conductivities obtained from analysis of impedancedata at zero bias for a cermet containing 20w/0 fine YSZ powder. The absolutevalue is taken for the conductivity calculation of negative R values.
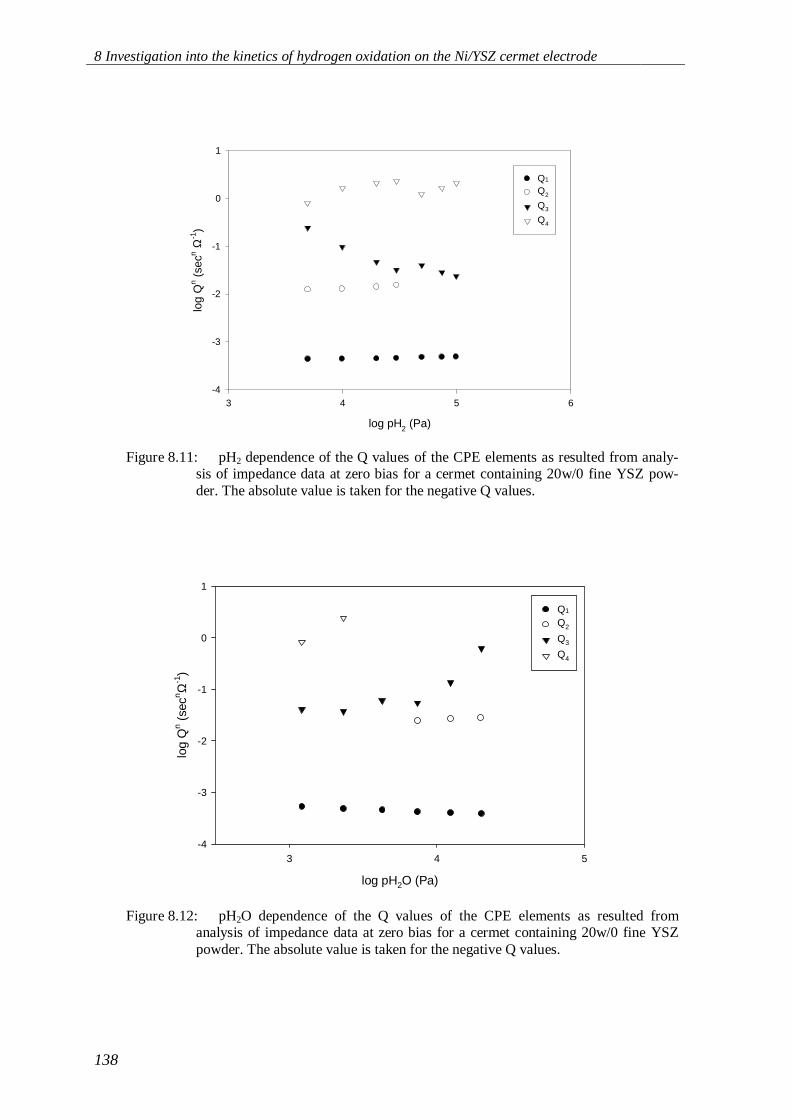
8 Investigation into the kinetics of hydrogen oxidation on the Ni/YSZ cermet electrode
138
log pH2 (Pa)
3 4 5 6
log
Qn (
secn
Ω-1
)
-4
-3
-2
-1
0
1
Q1
Q2
Q3
Q4
Figure 8.11: pH2 dependence of the Q values of the CPE elements as resulted from analy-sis of impedance data at zero bias for a cermet containing 20w/0 fine YSZ pow-der. The absolute value is taken for the negative Q values.
log pH2O (Pa)
3 4 5
log
Qn (
secn Ω
-1)
-4
-3
-2
-1
0
1
Q1
Q2
Q3
Q4
Figure 8.12: pH2O dependence of the Q values of the CPE elements as resulted fromanalysis of impedance data at zero bias for a cermet containing 20w/0 fine YSZpowder. The absolute value is taken for the negative Q values.
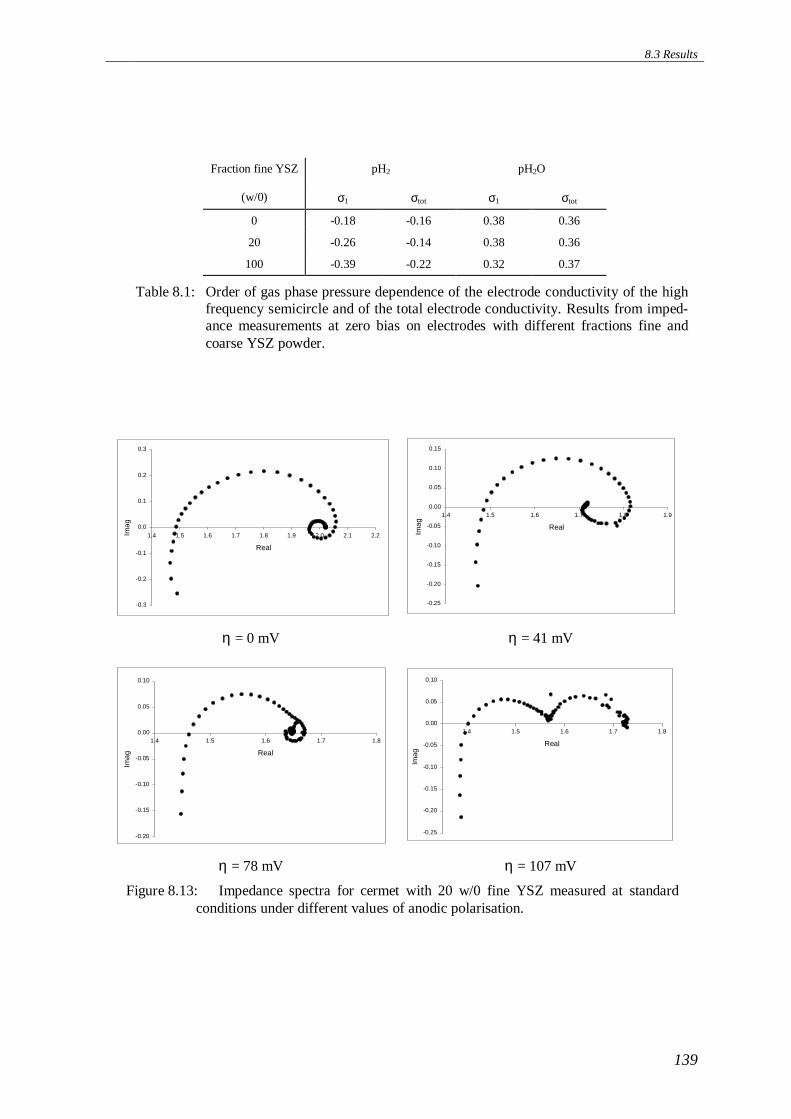
8.3 Results
139
Fraction fine YSZ pH2 pH2O
(w/0) σ1 σtot σ1 σtot
0 -0.18 -0.16 0.38 0.36
20 -0.26 -0.14 0.38 0.36
100 -0.39 -0.22 0.32 0.37
Table 8.1: Order of gas phase pressure dependence of the electrode conductivity of the highfrequency semicircle and of the total electrode conductivity. Results from imped-ance measurements at zero bias on electrodes with different fractions fine andcoarse YSZ powder.
Real
1.4 1.5 1.6 1.7 1.8 1.9 2.0 2.1 2.2Imag
-0.3
-0.2
-0.1
0.0
0.1
0.2
0.3
Real
1.4 1.5 1.6 1.7 1.8 1.9
Imag
-0.25
-0.20
-0.15
-0.10
-0.05
0.00
0.05
0.10
0.15
η = 0 mV η = 41 mV
Real
1.4 1.5 1.6 1.7 1.8
Imag
-0.20
-0.15
-0.10
-0.05
0.00
0.05
0.10
Real
1.4 1.5 1.6 1.7 1.8
Imag
-0.25
-0.20
-0.15
-0.10
-0.05
0.00
0.05
0.10
η = 78 mV η = 107 mV
Figure 8.13: Impedance spectra for cermet with 20 w/0 fine YSZ measured at standardconditions under different values of anodic polarisation.
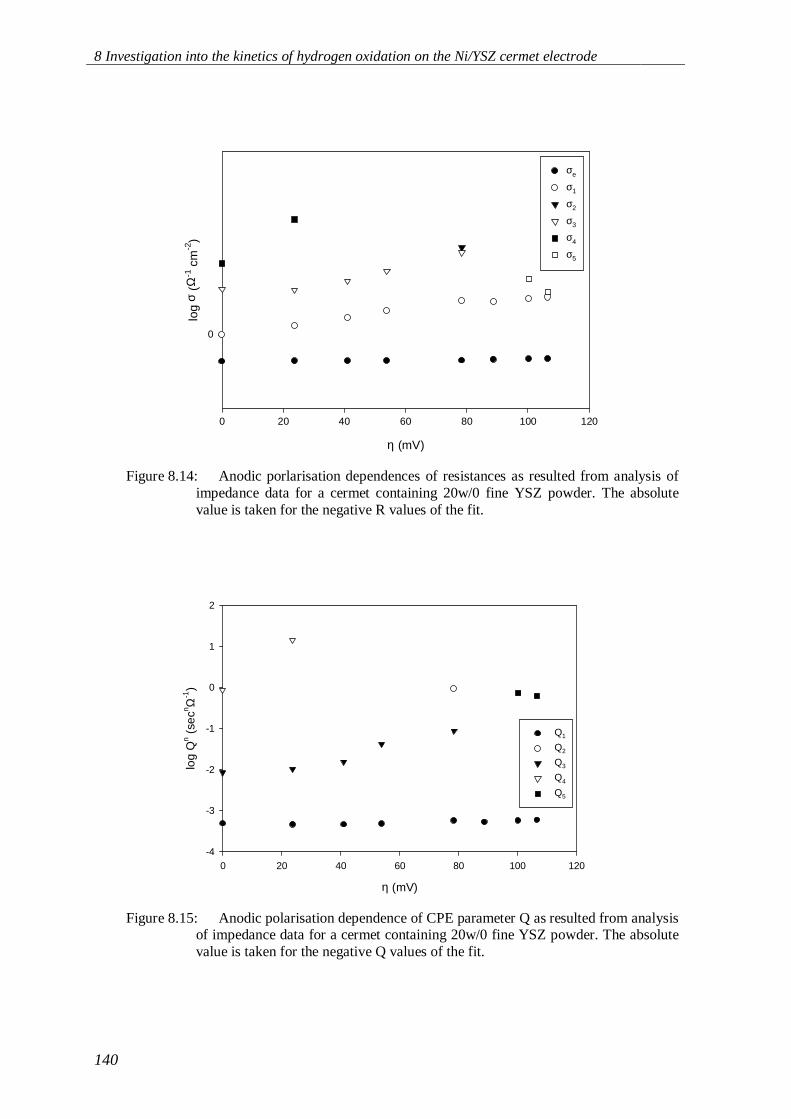
8 Investigation into the kinetics of hydrogen oxidation on the Ni/YSZ cermet electrode
140
η (mV)
0 20 40 60 80 100 120
log
σ (Ω
-1 c
m-2
)
0
σe
σ1
σ2
σ3
σ4
σ5
Figure 8.14: Anodic porlarisation dependences of resistances as resulted from analysis ofimpedance data for a cermet containing 20w/0 fine YSZ powder. The absolutevalue is taken for the negative R values of the fit.
η (mV)
0 20 40 60 80 100 120
log
Qn (
secn Ω
-1)
-4
-3
-2
-1
0
1
2
Q1
Q2
Q3
Q4
Q5
Figure 8.15: Anodic polarisation dependence of CPE parameter Q as resulted from analysisof impedance data for a cermet containing 20w/0 fine YSZ powder. The absolutevalue is taken for the negative Q values of the fit.
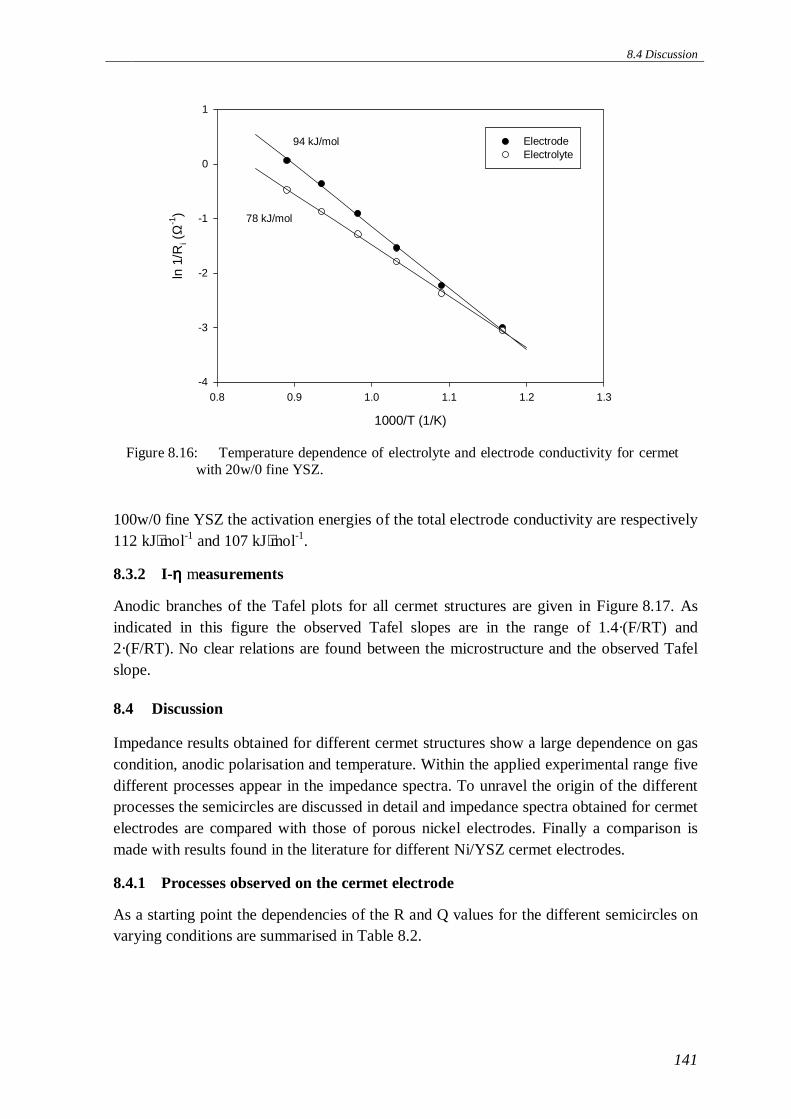
8.4 Discussion
141
100w/0 fine YSZ the activation energies of the total electrode conductivity are respectively112 kJ⋅mol-1 and 107 kJ⋅mol-1.
8.3.2 I- ηηηη measurements
Anodic branches of the Tafel plots for all cermet structures are given in Figure 8.17. Asindicated in this figure the observed Tafel slopes are in the range of 1.4·(F/RT) and2·(F/RT). No clear relations are found between the microstructure and the observed Tafelslope.
8.4 Discussion
Impedance results obtained for different cermet structures show a large dependence on gascondition, anodic polarisation and temperature. Within the applied experimental range fivedifferent processes appear in the impedance spectra. To unravel the origin of the differentprocesses the semicircles are discussed in detail and impedance spectra obtained for cermetelectrodes are compared with those of porous nickel electrodes. Finally a comparison ismade with results found in the literature for different Ni/YSZ cermet electrodes.
8.4.1 Processes observed on the cermet electrode
As a starting point the dependencies of the R and Q values for the different semicircles onvarying conditions are summarised in Table 8.2.
1000/T (1/K)
0.8 0.9 1.0 1.1 1.2 1.3
ln 1
/Ri (
Ω-1
)
-4
-3
-2
-1
0
1
ElectrodeElectrolyte
78 kJ/mol
94 kJ/mol
Figure 8.16: Temperature dependence of electrolyte and electrode conductivity for cermetwith 20w/0 fine YSZ.
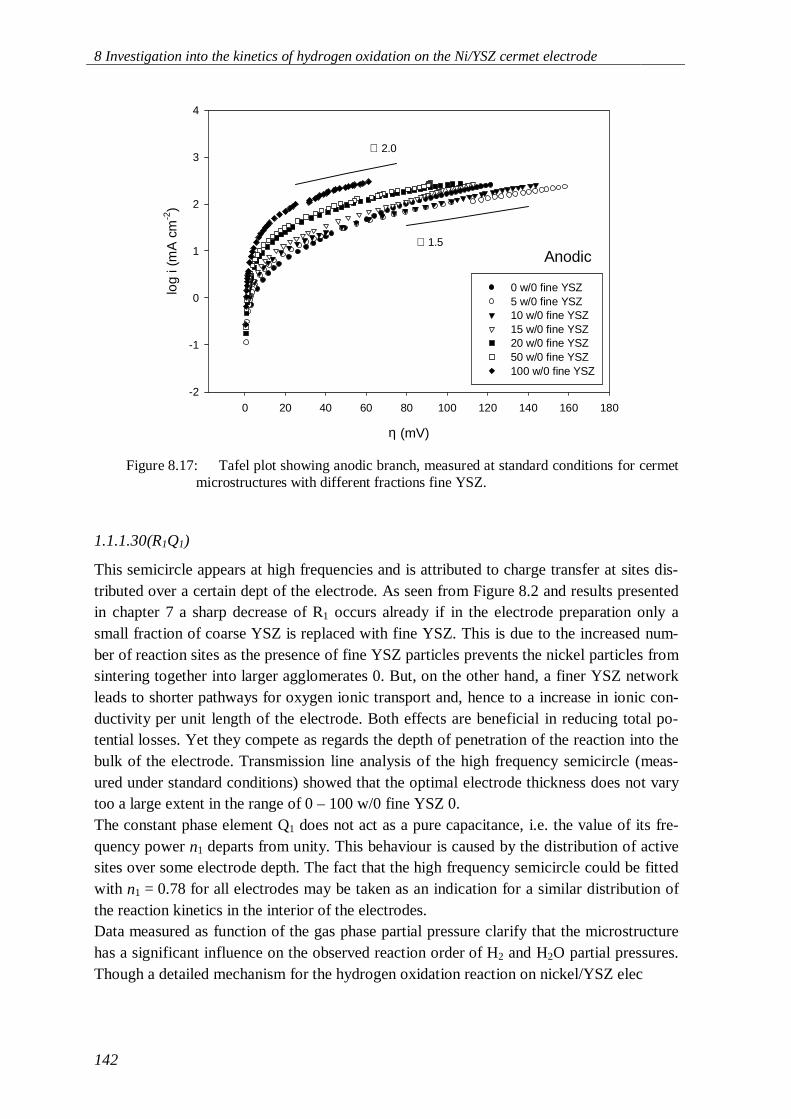
8 Investigation into the kinetics of hydrogen oxidation on the Ni/YSZ cermet electrode
142
1.1.1.30 (R1Q1)
This semicircle appears at high frequencies and is attributed to charge transfer at sites dis-tributed over a certain dept of the electrode. As seen from Figure 8.2 and results presentedin chapter 7 a sharp decrease of R1 occurs already if in the electrode preparation only asmall fraction of coarse YSZ is replaced with fine YSZ. This is due to the increased num-ber of reaction sites as the presence of fine YSZ particles prevents the nickel particles fromsintering together into larger agglomerates 0. But, on the other hand, a finer YSZ networkleads to shorter pathways for oxygen ionic transport and, hence to a increase in ionic con-ductivity per unit length of the electrode. Both effects are beneficial in reducing total po-tential losses. Yet they compete as regards the depth of penetration of the reaction into thebulk of the electrode. Transmission line analysis of the high frequency semicircle (meas-ured under standard conditions) showed that the optimal electrode thickness does not varytoo a large extent in the range of 0 – 100 w/0 fine YSZ 0.The constant phase element Q1 does not act as a pure capacitance, i.e. the value of its fre-quency power n1 departs from unity. This behaviour is caused by the distribution of activesites over some electrode depth. The fact that the high frequency semicircle could be fittedwith n1 = 0.78 for all electrodes may be taken as an indication for a similar distribution ofthe reaction kinetics in the interior of the electrodes.Data measured as function of the gas phase partial pressure clarify that the microstructurehas a significant influence on the observed reaction order of H2 and H2O partial pressures.Though a detailed mechanism for the hydrogen oxidation reaction on nickel/YSZ elec
η (mV)
0 20 40 60 80 100 120 140 160 180
log
i (m
A c
m-2
)
-2
-1
0
1
2
3
4
0 w/0 fine YSZ5 w/0 fine YSZ10 w/0 fine YSZ15 w/0 fine YSZ20 w/0 fine YSZ50 w/0 fine YSZ100 w/0 fine YSZ
Anodic∠ 1.5
∠ 2.0
Figure 8.17: Tafel plot showing anodic branch, measured at standard conditions for cermetmicrostructures with different fractions fine YSZ.
8.4 D
iscussion
14
3
R5
high η ↑ → appears& R5 ↑
Q5 (n = 0.85)
high η ↑ → Q5
slight↓
R4
Constant
0: constant
20: no clear dependence
100: pH2 ↓ → R4 ↓
0: constant
20:pH2O↑→R4↓ & disappear
100:pH2O↑→R4↓&disappear
η ↑ → R4 ↓ & disappear
Q4 (n = 0.85)
fine YSZ ↑ → Q3 ↓
pH2 ↓ → Q4 slight ↓(some scatter)
pH2O ↑ → Q4 ↑ and disappear
η ↑ → Q4 ↑ & disappears
R3
Only for fine YSZ
fine YSZ ↑ → R3 ↓
0: does not appear
20: high pH2 constant
low pH2 R3 ↓100: goes through max
0: does not appear
20: pH2O ↑ → R3 ↓
100 pH2O ↑ → reaches max
low η ↑ → R3 ↑
high η ↑ → R3 ↓& disappear
Q3 (n = 1)
low fine YSZ → Q3 ↑
high fine YSZ → constant
pH2 ↓ → Q3 ↑
low pH2O ↑ → constant
high pH2O ↑ → Q3 ↑
η ↑ → Q3 ↑
R2
Does not appear
0: does not appear
20: pH2 ↓ → R2↑
100: pH2 ↓ → R2↑
0: does not appear
20: pH2O ↑ → R2↓
100: pH2O ↑ → R2 ↓20&100 only for high pH2O
η ↑ → R2 appears
Q2 (n = 1)
pH2 ↓ → appears and Q2
slight ↓
pH2O ↑ → appears &
constant
R1
strong
R1 ↓ → fine YSZ↑
0: m=-0.18
20: m=-0.26
100: m=-0.39
n larger if fine YSZ↑
0: m=0.38
20: m=0.38
100: m=0.32
n independent of pH2O
η ↑ → R1 ↓
Q1 (n = 0.78)
low fine YSZ → constant
high fine YSZ → Q1 ↑
constant
pH2O ↑ → Q1 slight ↓
constants
Microstructure
pH2
pH2O
Anodic
polarisation
Microstructure
pH2a
pH2Oa
Anodic
polarisationb
Table 8.2: Summary of the observed results out of impedance analysis for the different cermet structures; aas found for 20 and 100w/0 fineYSZ, no dependences where found for 0w/0 fine YSZ. b as found for 20 w/0 fine YSZ.
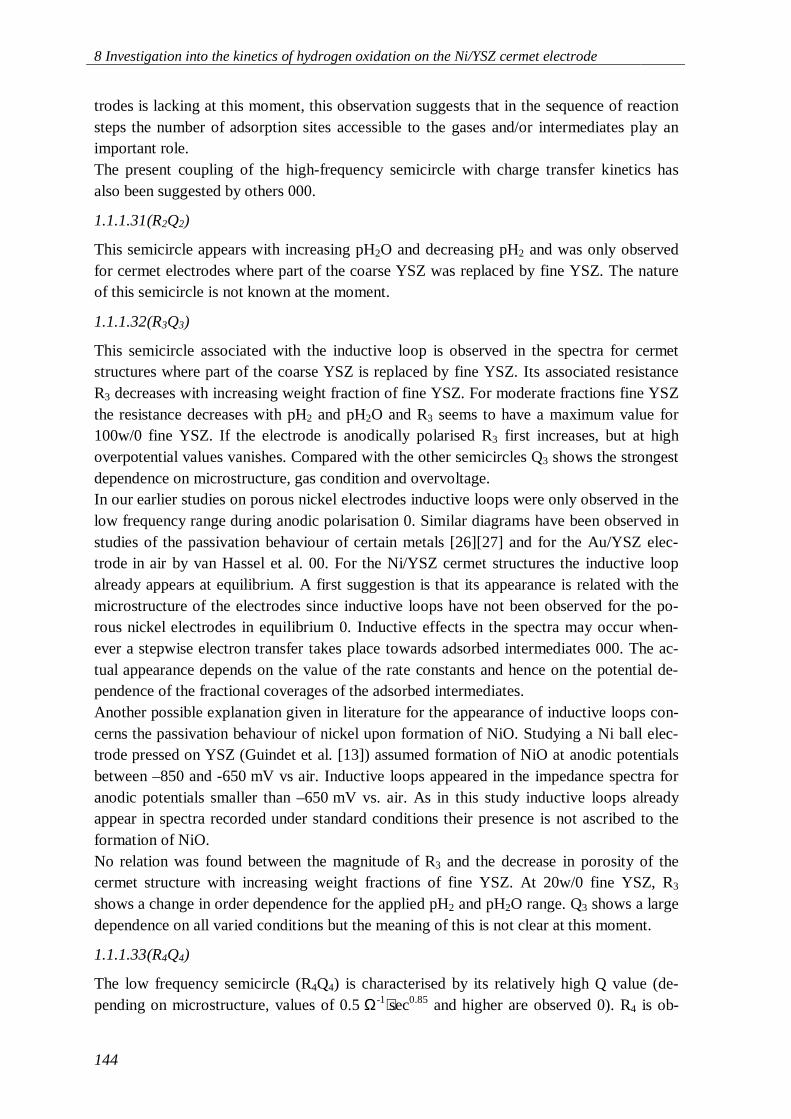
8 Investigation into the kinetics of hydrogen oxidation on the Ni/YSZ cermet electrode
144
trodes is lacking at this moment, this observation suggests that in the sequence of reactionsteps the number of adsorption sites accessible to the gases and/or intermediates play animportant role.The present coupling of the high-frequency semicircle with charge transfer kinetics hasalso been suggested by others 000.
1.1.1.31 (R2Q2)
This semicircle appears with increasing pH2O and decreasing pH2 and was only observedfor cermet electrodes where part of the coarse YSZ was replaced by fine YSZ. The natureof this semicircle is not known at the moment.
1.1.1.32 (R3Q3)
This semicircle associated with the inductive loop is observed in the spectra for cermetstructures where part of the coarse YSZ is replaced by fine YSZ. Its associated resistanceR3 decreases with increasing weight fraction of fine YSZ. For moderate fractions fine YSZthe resistance decreases with pH2 and pH2O and R3 seems to have a maximum value for100w/0 fine YSZ. If the electrode is anodically polarised R3 first increases, but at highoverpotential values vanishes. Compared with the other semicircles Q3 shows the strongestdependence on microstructure, gas condition and overvoltage.In our earlier studies on porous nickel electrodes inductive loops were only observed in thelow frequency range during anodic polarisation 0. Similar diagrams have been observed instudies of the passivation behaviour of certain metals [26][27] and for the Au/YSZ elec-trode in air by van Hassel et al. 00. For the Ni/YSZ cermet structures the inductive loopalready appears at equilibrium. A first suggestion is that its appearance is related with themicrostructure of the electrodes since inductive loops have not been observed for the po-rous nickel electrodes in equilibrium 0. Inductive effects in the spectra may occur when-ever a stepwise electron transfer takes place towards adsorbed intermediates 000. The ac-tual appearance depends on the value of the rate constants and hence on the potential de-pendence of the fractional coverages of the adsorbed intermediates.Another possible explanation given in literature for the appearance of inductive loops con-cerns the passivation behaviour of nickel upon formation of NiO. Studying a Ni ball elec-trode pressed on YSZ (Guindet et al. [13]) assumed formation of NiO at anodic potentialsbetween –850 and -650 mV vs air. Inductive loops appeared in the impedance spectra foranodic potentials smaller than –650 mV vs. air. As in this study inductive loops alreadyappear in spectra recorded under standard conditions their presence is not ascribed to theformation of NiO.No relation was found between the magnitude of R3 and the decrease in porosity of thecermet structure with increasing weight fractions of fine YSZ. At 20w/0 fine YSZ, R3
shows a change in order dependence for the applied pH2 and pH2O range. Q3 shows a largedependence on all varied conditions but the meaning of this is not clear at this moment.
1.1.1.33 (R4Q4)
The low frequency semicircle (R4Q4) is characterised by its relatively high Q value (de-pending on microstructure, values of 0.5 Ω-1⋅sec0.85 and higher are observed 0). R4 is ob-
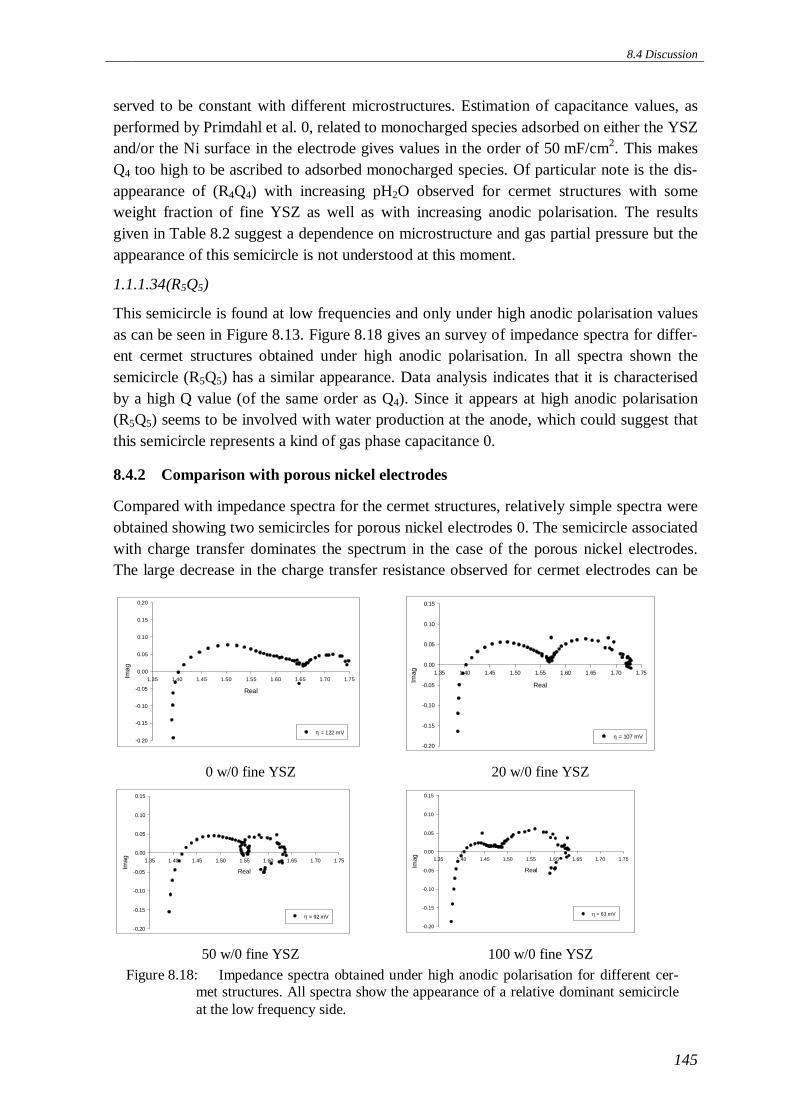
8.4 Discussion
145
served to be constant with different microstructures. Estimation of capacitance values, asperformed by Primdahl et al. 0, related to monocharged species adsorbed on either the YSZand/or the Ni surface in the electrode gives values in the order of 50 mF/cm2. This makesQ4 too high to be ascribed to adsorbed monocharged species. Of particular note is the dis-appearance of (R4Q4) with increasing pH2O observed for cermet structures with someweight fraction of fine YSZ as well as with increasing anodic polarisation. The resultsgiven in Table 8.2 suggest a dependence on microstructure and gas partial pressure but theappearance of this semicircle is not understood at this moment.
1.1.1.34 (R5Q5)
This semicircle is found at low frequencies and only under high anodic polarisation valuesas can be seen in Figure 8.13. Figure 8.18 gives an survey of impedance spectra for differ-ent cermet structures obtained under high anodic polarisation. In all spectra shown thesemicircle (R5Q5) has a similar appearance. Data analysis indicates that it is characterisedby a high Q value (of the same order as Q4). Since it appears at high anodic polarisation(R5Q5) seems to be involved with water production at the anode, which could suggest thatthis semicircle represents a kind of gas phase capacitance 0.
8.4.2 Comparison with porous nickel electrodes
Compared with impedance spectra for the cermet structures, relatively simple spectra wereobtained showing two semicircles for porous nickel electrodes 0. The semicircle associatedwith charge transfer dominates the spectrum in the case of the porous nickel electrodes.The large decrease in the charge transfer resistance observed for cermet electrodes can be
Real
1.35 1.40 1.45 1.50 1.55 1.60 1.65 1.70 1.75Imag
-0.20
-0.15
-0.10
-0.05
0.00
0.05
0.10
0.15
0.20
η = 122 mV
Real
1.35 1.40 1.45 1.50 1.55 1.60 1.65 1.70 1.75
Imag
-0.20
-0.15
-0.10
-0.05
0.00
0.05
0.10
0.15
η = 107 mV
0 w/0 fine YSZ 20 w/0 fine YSZ
Real
1.35 1.40 1.45 1.50 1.55 1.60 1.65 1.70 1.75
Imag
-0.20
-0.15
-0.10
-0.05
0.00
0.05
0.10
0.15
η = 92 mV
Real
1.35 1.40 1.45 1.50 1.55 1.60 1.65 1.70 1.75
Imag
-0.20
-0.15
-0.10
-0.05
0.00
0.05
0.10
0.15
η = 63 mV
50 w/0 fine YSZ 100 w/0 fine YSZ
Figure 8.18: Impedance spectra obtained under high anodic polarisation for different cer-met structures. All spectra show the appearance of a relative dominant semicircleat the low frequency side.
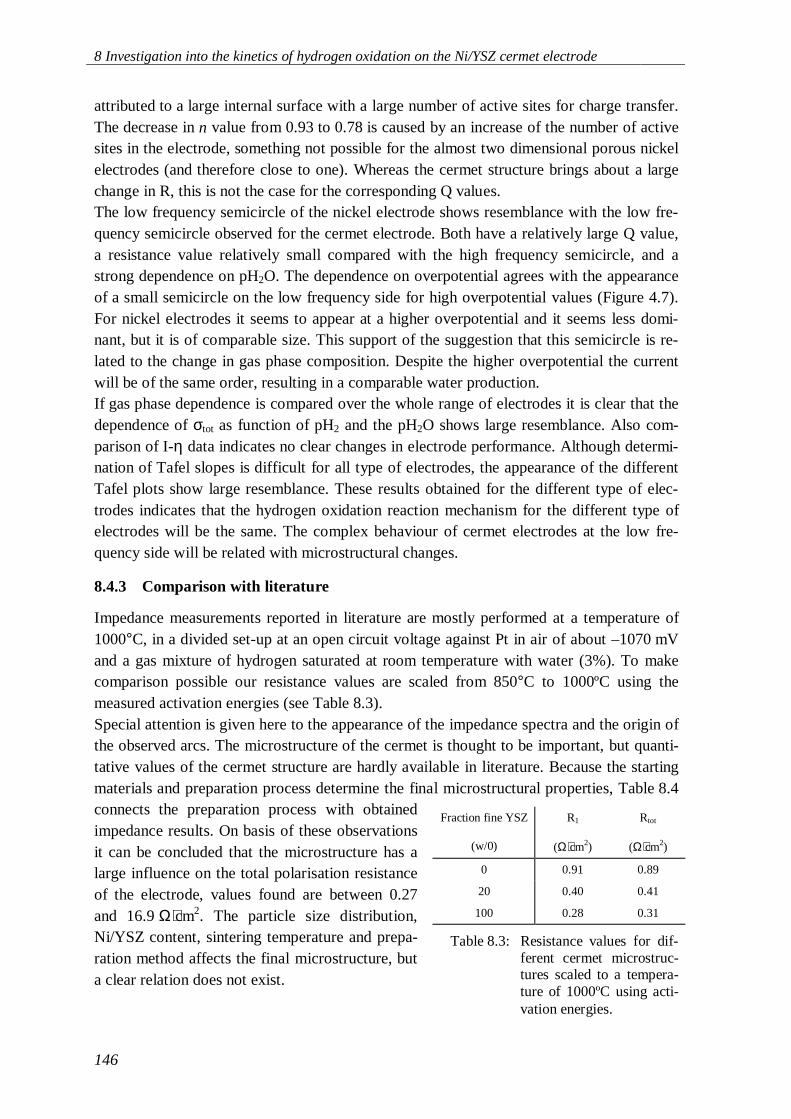
8 Investigation into the kinetics of hydrogen oxidation on the Ni/YSZ cermet electrode
146
attributed to a large internal surface with a large number of active sites for charge transfer.The decrease in n value from 0.93 to 0.78 is caused by an increase of the number of activesites in the electrode, something not possible for the almost two dimensional porous nickelelectrodes (and therefore close to one). Whereas the cermet structure brings about a largechange in R, this is not the case for the corresponding Q values.The low frequency semicircle of the nickel electrode shows resemblance with the low fre-quency semicircle observed for the cermet electrode. Both have a relatively large Q value,a resistance value relatively small compared with the high frequency semicircle, and astrong dependence on pH2O. The dependence on overpotential agrees with the appearanceof a small semicircle on the low frequency side for high overpotential values (Figure 4.7).For nickel electrodes it seems to appear at a higher overpotential and it seems less domi-nant, but it is of comparable size. This support of the suggestion that this semicircle is re-lated to the change in gas phase composition. Despite the higher overpotential the currentwill be of the same order, resulting in a comparable water production.If gas phase dependence is compared over the whole range of electrodes it is clear that thedependence of σtot as function of pH2 and the pH2O shows large resemblance. Also com-parison of I-η data indicates no clear changes in electrode performance. Although determi-nation of Tafel slopes is difficult for all type of electrodes, the appearance of the differentTafel plots show large resemblance. These results obtained for the different type of elec-trodes indicates that the hydrogen oxidation reaction mechanism for the different type ofelectrodes will be the same. The complex behaviour of cermet electrodes at the low fre-quency side will be related with microstructural changes.
8.4.3 Comparison with literature
Impedance measurements reported in literature are mostly performed at a temperature of1000°C, in a divided set-up at an open circuit voltage against Pt in air of about –1070 mVand a gas mixture of hydrogen saturated at room temperature with water (3%). To makecomparison possible our resistance values are scaled from 850°C to 1000ºC using themeasured activation energies (see Table 8.3).Special attention is given here to the appearance of the impedance spectra and the origin ofthe observed arcs. The microstructure of the cermet is thought to be important, but quanti-tative values of the cermet structure are hardly available in literature. Because the startingmaterials and preparation process determine the final microstructural properties, Table 8.4connects the preparation process with obtainedimpedance results. On basis of these observationsit can be concluded that the microstructure has alarge influence on the total polarisation resistanceof the electrode, values found are between 0.27and 16.9 Ω⋅cm2. The particle size distribution,Ni/YSZ content, sintering temperature and prepa-ration method affects the final microstructure, buta clear relation does not exist.
Fraction fine YSZ R1 Rtot
(w/0) (Ω⋅cm2) (Ω⋅cm2)
0 0.91 0.89
20 0.40 0.41
100 0.28 0.31
Table 8.3: Resistance values for dif-ferent cermet microstruc-tures scaled to a tempera-ture of 1000ºC using acti-vation energies.
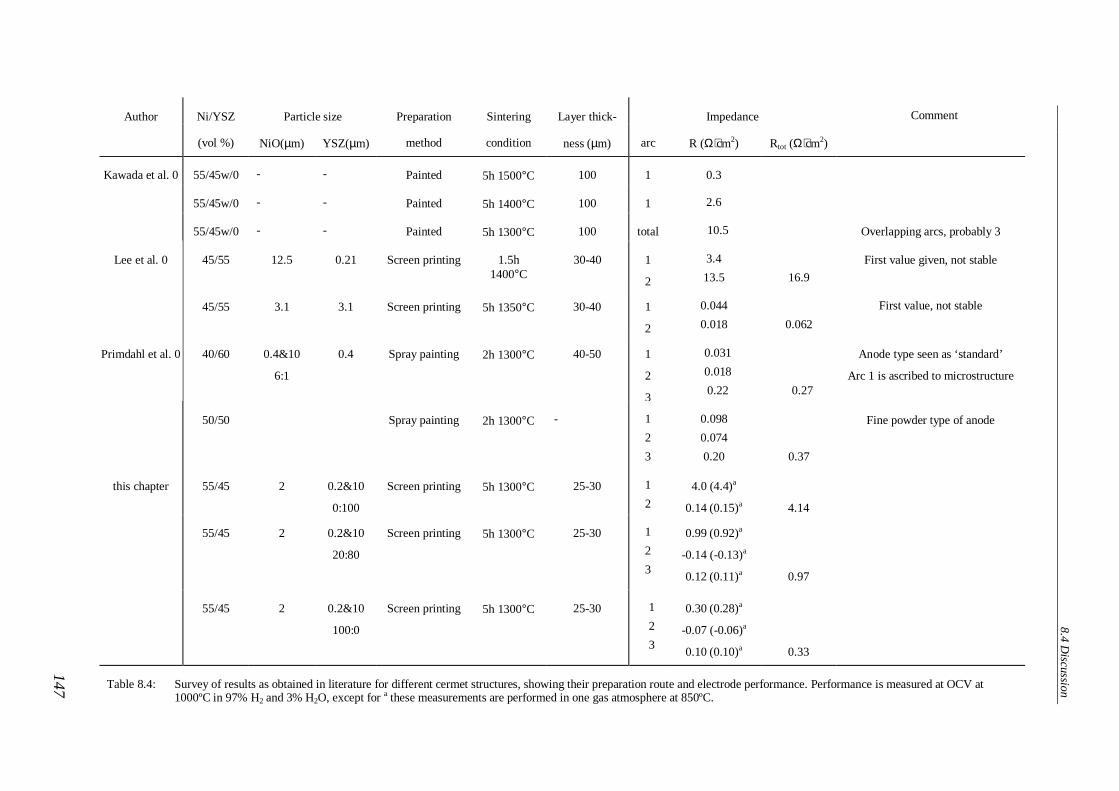
8.4 D
iscussion
14
7
Comment
Overlapping arcs, probably 3
First value given, not stable
First value, not stable
Anode type seen as ‘standard’
Arc 1 is ascribed to microstructure
Fine powder type of anode
Rtot (Ω⋅cm2)
16.9
0.062
0.27
0.37
4.14
0.97
0.33
R (Ω⋅cm2)
0.3
2.6
10.5
3.4
13.5
0.044
0.018
0.031
0.018
0.22
0.098
0.074
0.20
4.0 (4.4)a
0.14 (0.15)a
0.99 (0.92)a
-0.14 (-0.13)a
0.12 (0.11)a
0.30 (0.28)a
-0.07 (-0.06)a
0.10 (0.10)a
Impedance
arc
1
1
total
1
2
1
2
1
2
3
1
2
3
1
2
1
2
3
1
2
3
Layer thick-
ness (µm)
100
100
100
30-40
30-40
40-50
-
25-30
25-30
25-30
Sintering
condition
5h 1500°C
5h 1400°C
5h 1300°C
1.5h1400°C
5h 1350°C
2h 1300°C
2h 1300°C
5h 1300°C
5h 1300°C
5h 1300°C
Preparation
method
Painted
Painted
Painted
Screen printing
Screen printing
Spray painting
Spray painting
Screen printing
Screen printing
Screen printing
YSZ(µm)
-
-
-
0.21
3.1
0.4
0.2&10
0:100
0.2&10
20:80
0.2&10
100:0
Particle size
NiO(µm)
-
-
-
12.5
3.1
0.4&10
6:1
2
2
2
Ni/YSZ
(vol %)
55/45w/0
55/45w/0
55/45w/0
45/55
45/55
40/60
50/50
55/45
55/45
55/45
Author
Kawada et al. 0
Lee et al. 0
Primdahl et al. 0
this chapter
Table 8.4: Survey of results as obtained in literature for different cermet structures, showing their preparation route and electrode performance. Performance is measured at OCV at1000ºC in 97% H2 and 3% H2O, except for a these measurements are performed in one gas atmosphere at 850ºC.

8 Investigation into the kinetics of hydrogen oxidation on the Ni/YSZ cermet electrode
148
The total polarisation resistance may be based on one, two or three different contributions,where one can even have an 'inductive' behaviour. The relative importance of the observedarcs depends on microstructure.Kawada et al. 0 reported that a higher sinter temperature resulted in a lower total polarisa-tion resistance of the electrode and impedance spectra dominated by one arc, where threearcs were observed for lower sinter temperatures.The particle size of the starting materials seems important. Lee et al. 0 showed that a toolarge NiO particle size compared with YSZ leads to high polarisation resistances. Betterresults were obtained for particles of the same size. Primdahl et al. 0 reported polarisationresistances for 8 different types of cermet electrodes (two are given in Table 8.4). They ob-served a tendency towards higher polarisation resistances when finer powders (both Ni andYSZ) or coarser YSZ was used. Three semicircles where observed and their contribution tothe total polarisation resistance was found to be dependent on microstructure.In this study higher polarisation resistances are also observed for higher fractions of coarseYSZ, but here the polarisation resistance decreased towards finer YSZ particles. The num-ber of different contributions to the total polarisation resistance is comparable to that foundby Primdahl et al. although the individual contributions show large discrepancies. Com-parison can only be made for the high frequency semicircle, which is in both cases ascribedto the microstructure. For our electrodes a relatively large part of the total polarisation isascribed to microstructure, but our ‘rest’ potential (related to (R2Q2)(R3Q3) is small com-pared to the one observed by Primdahl et al. This lead to the overall conclusion thatsomething can still be ‘gained’ by improving the cermet microstructure.
8.4.4 Overall comparison
In this study 'inductive loops' are observed in impedance spectra for cermet electrodes atzero bias. This is generally not found for porous nickel electrodes, nor has it been reportedfor cermet electrodes in literature. This strongly indicates that the appearance of the induc-tive loop is related to the complex microstructure of porous cermet electrodes.Parameters that characterise the cermet structure are porosity, pore diameter, tortuousity,particle size and surface area of nickel as well as YSZ. Because the inductive loop is alsoaffected by gas composition and anodic polarisation it should also be related to the hydro-gen oxidation reaction that occuring at the anode. A possible reaction mechanism is pro-posed in chapter 4. The charge transfer step is already related to the high frequency semi-circle. Gas phase diffusion of H2 to the active sites and H2O in the opposite direction arerelated to porosity and pore diameter. But the Faradaic impedance of such a process doesnot result in an inductive loop. In addition vacant sites on the nickel as well as on the YSZsurface together with adsorbed species as H on the nickel and H2O and OH- on the YSZ(based on the reaction mechanism proposed in chapter 4 0) are related with the micro-structure. The surface area of nickel and YSZ determines the number of available sites.This returns us to the hypothesis of heterogeneous reaction mechanisms due to adsorbedintermediates 0. The Faradaic impedance that can be derived for such processes requiresinformation about the potential dependence of the rate constants involved, the fractionalcoverage of the surface and of free and blocked sites (in case there are two or more ad-
8.5 Conclusions
149
sorbed intermediates), and the total number of active sites available. If one of these pa-rameters is critical and if it is sensitive to small variations in potential it is believed thatinductive loops can appear. Evidence for this model should be obtained by applying nu-merical calculation for this type of reaction mechanisms, with the amount of active sitesand surface coverages as variables. From the experimental side it will be useful to obtainmore quantitative information about the microstructure.
8.5 Conclusions
The observed behaviour for cermet electrodes with different microstructures is complex.For a cermet electrode with only coarse YSZ two semicircles could give an appropriate fitof the impedance spectra. Replacing part of the coarse YSZ by fine YSZ made three semi-circles necessary. Changing the gas partial pressure or polarising the electrode madeequivalent circuits with 5 semicircles necessary. Despite the increasing complexity of im-pedance behaviour, the total polarisation resistance decreases for finer cermet microstruc-tures. This makes the microstructure an important research tool for further development ofthe anode performance.Despite an enormous amount of measurements the nature of the rate-limiting processes isnot yet completely understood. The dominating part of the electrode response, appearing atthe high frequencies, can be ascribed to charge transfer in the electrode. It is believed thatthe characteristic inductive loop as it appears for our type of cermet electrodes is related toa relaxation process involving the surface coverage of an adsorbed intermediate speciesbound by two frequency-dependent rate processes.Further research is necessary to obtain a more complete understanding of the electrode be-haviour.
Acknowledgement
The Netherlands Energy Research Foundation (ECN) is thanked for the preparation of thecermet electrodes.
References
S.C. Singhal, ‘Status of Solid Oxide Fuel Cell Technology’, Proc. of the 17th Risø Int. Sym. on Materials Science, HighTemperature Electrochemistry: Ceramics and Metals, 123-38, 1996.
N.Q. Minh, ‘Ceramic Fuel Cells’, J. Am. Ceram. Soc., 76, 563-88, 1993.A. Hammou, J. Guindet, 'Solid Oxide Fuel Cells', Ch 12 of 'The CRC Handbook of Solid-State Electrochemistry', pp
409-445, CRC Press, Inc., 1997.H. Itoh, T. Yamamoto, M. Mori, T. Horita, N. Sakai, H. Yokokawa and M. Dokiya, ‘Configurational and Electrical Be-
havior of Ni-YSZ Cermet with Novel Microstructure for Solid Oxide Fuel Cell Anodes, J. Electrochem. Soc. 144,641-46, 1997.
F.P.F. van Berkel, F.H. van Heuveln and J.P.P. Huijsmans, ‘Characterisation of Solid Oxide Fuel Cell Electrodes by Im-pedance Spectroscopy and I-V Characteristics’, Solid State Ionics, 72, 240-47, 1994.
D.W. Dees, T.D. Claar, T.E. Easler, D.C. Fee and F.C. Mrazek, ‘Conductivity of Porous Ni/ZrO2-Y2O3 Cermets’, J.Electrochem. Soc., 134, 2141-46, 1987.
N.Q. Minh, ‘Ceramic Fuel Cells’, J. Am. Ceram. Soc., 76, 563-88, 1993.Chapter 6 of this thesis.Chapter 7 of this thesis.T. Kawada, N. Sakai, J. Yokokawa, M. Dokiya, M. Mori and T. Iwata, ‘Structure and Polarisation Characteristics of
Solid Oxide Fuel Cell Anodes’, Solid State Ionics, 40/41, 402-06, 1990.B.A. Boukamp, ‘A Nonlinear least squares fit procedure for analysis of immittance data of electrochemical systems,
Solid State Ionics, 20, 31-44, 1986.F.P.F. van Berkel, J.P. de Jong, ‘De Relatie tussen de Morfologie en de Electrochemische Eigenschappen van Ni/YSZ
Anodematerialen’, ECN Internal Report, 2918-GR14,1993.

8 Investigation into the kinetics of hydrogen oxidation on the Ni/YSZ cermet electrode
150
S. Primdahl and M. Mogensen, ‘Oxidation of Hydrogen on Ni/Yttria-Stabilized Zirconia Cermet Anodes’, J. Electro-chem. Soc., 144, 3409-19, 1997.
S. Primdahl and M. Mogensen, ‘Gas conversion impedance: SOFC anodes in H2/H2O atmospheres’, pp 530-39 in Elec-trochemical Proceedings Volume 97-18, Aachen, 1997.
Chapter 4 of this thesis.J.R. Macdonald, ‘Impedance Spectroscopy, John Wiley & Sons, Inc. New York, 1978.T. Norby, O.J. Velle, H. Leth-Olsen and R. Tunold, 'Reaction resistance in relation to three phase boundary length of
Ni/YSZ electrodes', pp.473-78 in: Proc. Of the 3rd Int. Symp. On Solid Oxide Fuel Cells, Honolulu, Hawaii, 1993.M. Mogensen and T. Lindegaard, 'The kinetics of hydrogen oxidation on a Ni/YSZ SOFC electrode at 1000ºC'; pp. 484-
93 in: Proc. Of the 3rd Int. Symp. On Solid Oxide Fuel Cells, Honolulu, Hawaii, 1993.B.A. van Hassel, B.A. Boukamp, and A.J. Burggraaf, ‘Electrode polarisation at the Au, O2(g) /Yttria Stabilised Zirconia
Interface I Theoretical Considerations of Reaction Model’, Solid State Ionics, 48, 139-54, 1991.B.A. van Hassel, B.A. Boukamp, and A.J. Burggraaf, ‘Electrode polarisation at the Au, O2(g) /Yttria Stabilised Zirconia
Interface II Electrochemical measurements and Analysis’, Solid State Ionics, 48, 155-71, 1991.I. Epelboin, M. Keddam, and J.C. Lestrade, ‘Faradaic Impedances and Intermediates in Electrochemical Reactions’,
Faradaic Impedances and Intermediates in Electrochemical Reactions, Disc. Faraday Soc. 56, 264-275, 1973.I. Epelboin, C. Gabrielli, M. Keddam and H. Takenouti, ‘The Study of the Passivation Process by the Electrode Imped-
ance Analysis’, Chapter 3 of Comprehensive Treatise of Electrochem., Ed. J. O’M Bockris, B.E. Conway, E. Yea-ger and R.E. White, 151-94, New York/London, Plenium 1981.
J. Guindet, C. Roux, and A. Hammou, 'Hydrogen oxidation at the Ni/Zirconia electrode', pp.553-58 in: Proc. of the 2nd
Int. Symp. on Solid Oxide Fuel Cells, Athens, Greece, July 2-5, 1991.T. Kawada, N. Sakai, H. Yokokawa, M. Dokiya, M. Mori and T. Iwata, ‘Characteristics of slurry-coated nickel zirconia
cermet anodes for solid oxide fuel cells, J. Electrochem. Soc. 137, 10 , 3042-47, 1990.C-H Lee, C-H Lee, H-Y Lee and S.M Oh, ‘ Microstructure and anodic properties of Ni/YSZ cermets in Solid Oxide Fuel
Cells’, Solid State Ionics 98, 39-48, 1997.
151
9 Evaluation
Abstract
To establish a high performance for a solid oxide fuel cell, the internal losses for the vari-ous elements should be as low as possible. For the anode this means that the electrode re-sistance should be minimised. A thorough understanding of the mechanism of the hydro-gen oxidation reaction as well as insight in the most important features of the microstruc-ture will assist further improvement of its performance.The four different types of electrodes studied in this thesis, i.e. from relatively simple pat-tern electrodes to very complex cermet structures, cover a broad range in microstructuretypes.The linear relationship between the Triple Phase Boundary (TPB) length and the electrodeconductivity, as observed for the nickel type of electrodes, indicates that the electrode re-action occurs in the near vicinity of the TPB. From this linear relationship we conclude thatin the cermets there is a significant contribution from accessible TPB area in the bulk ofthe electrode. The relative importance of this contribution increases with the fraction offine with respect to coarse YSZ powder used in the preparation of the cermets.The obtained results support the conclusion that the dominant semicircle in impedance dia-grams, recorded at equilibrium and under anodic polarisation, is due to charge transfer.Non-linear behaviour of the Tafelplots is attributed to changes in the fractional coverage ofadsorbed intermediates. Recommendations are given for further research.
9.1 Introduction
In this chapter the main results of this thesis are briefly evaluated. The effect of the micro-structure on the electrode performance is discussed. Some recommendations for furtherresearch are given.
9.2 Relationship of the microstructure with electrode resistance
It is generally accepted that the complex microstructure of the Ni/YSZ cermet electrodehas a large influence on its electrochemical performance. The near vicinity of the triplephase boundary, where the electronic conducting nickel, ionic conducting YSZ and the gasphase come together, would be the place where the electrode reaction proceeds. One of theprimary goals of the work presented in this thesis was to uncover this microstructure-
9 Evaluation
152
performance relationship for the Ni/YSZ electrode. To enable such a study quantitativedata are needed for the electrochemical performance as well as for the microstructure. Dif-ferent types of electrodes were therefore used, i.e. from relatively simple pattern electrodesto the complex cermet electrodes. Electrochemical characterisation was done using imped-ance and I-η type of measurements. The total electrode conductivity derived from imped-ance data obtained at equilibrium was used as a characteristic parameter, noting that onesemicircle was found to be dominant in the spectra of all electrodes studied. SEM picturesof the electrode were taken and analysed with image analysis techniques for characterisa-tion of the microstructure (see Chapters 3 to 6). Quantification of the microstructure inmeasurable parameters, however, appeared to be difficult. For the purpose of discussionthe electrodes are divided into two groups: the nickel electrodes, which for image analysiscan be considered as possessing a two dimensional structure, and the cermet electrodes,which possess a three dimensional structure. Nickel type electrodes were characterised bymeasuring the nickel perimeter and the area of the electrolyte covered with nickel. Char-acterisation of the cermet electrodes resulted in values for the porosity, the nickel particlesize and the surface coverage of the electrode / electrolyte interface.As mentioned above, changes in the characteristic TPB length are expected to have themost important effect on the electrochemical performance. For nickel type electrodes thelength of the nickel perimeter shows the closest resemblance with the length of the TPB.For the cermet electrodes it is less obvious how to obtain a reliable value for the length ofthe TPB. In a first approximation it is assumed that the active TPB is located at the imme-diate interface between electrode and electrolyte. A value for the TPB length can thus beobtained from the associated surface coverage.When results obtained from image analysis of the electrodes are used as described above,the following points should be noted:• The actual electrode area being studied with image analysis is very small (less than
0.01%). Therefore, if the image analyses results are taken as valid for the whole elec-trode area, for both nickel and cermet electrodes, the microstructure must be assumedto be homogeneous over the entire electrode area.
• By assuming a direct relation between the measured nickel perimeter and the length ofthe TPB a possible deviation on a scale not observable from SEM images is not ac-counted for. Furthermore, the diameter of the contact area of the nickel particles withthe electrolyte may differ from the observed diameter of the nickel particles due towetting.
• The assumption that the active TPB for the cermet electrodes is only located at theimmediate interface between electrode and electrolyte does not account for an activerole of the bulk of the electrode in the electrode reaction.
• By taking the TPB length as the descriptive parameter for the active area its width isassumed to be infinitely small. For reasons of current density it seems reasonable toassume that the active area related with the TPB has a certain width. It will depend onthe actual value of the width whether or not the TPB length can be used as an appro-priate parameter.
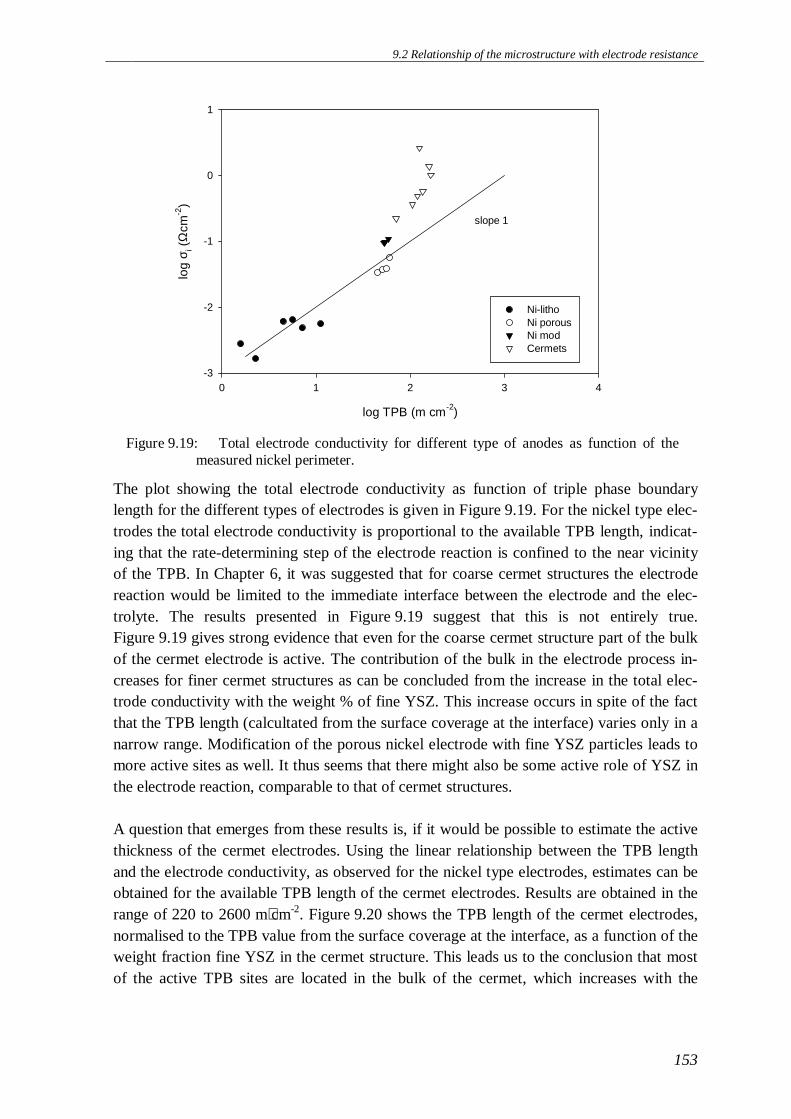
9.2 Relationship of the microstructure with electrode resistance
153
The plot showing the total electrode conductivity as function of triple phase boundarylength for the different types of electrodes is given in Figure 9.19. For the nickel type elec-trodes the total electrode conductivity is proportional to the available TPB length, indicat-ing that the rate-determining step of the electrode reaction is confined to the near vicinityof the TPB. In Chapter 6, it was suggested that for coarse cermet structures the electrodereaction would be limited to the immediate interface between the electrode and the elec-trolyte. The results presented in Figure 9.19 suggest that this is not entirely true.Figure 9.19 gives strong evidence that even for the coarse cermet structure part of the bulkof the cermet electrode is active. The contribution of the bulk in the electrode process in-creases for finer cermet structures as can be concluded from the increase in the total elec-trode conductivity with the weight % of fine YSZ. This increase occurs in spite of the factthat the TPB length (calcultated from the surface coverage at the interface) varies only in anarrow range. Modification of the porous nickel electrode with fine YSZ particles leads tomore active sites as well. It thus seems that there might also be some active role of YSZ inthe electrode reaction, comparable to that of cermet structures.
A question that emerges from these results is, if it would be possible to estimate the activethickness of the cermet electrodes. Using the linear relationship between the TPB lengthand the electrode conductivity, as observed for the nickel type electrodes, estimates can beobtained for the available TPB length of the cermet electrodes. Results are obtained in therange of 220 to 2600 m⋅cm-2. Figure 9.20 shows the TPB length of the cermet electrodes,normalised to the TPB value from the surface coverage at the interface, as a function of theweight fraction fine YSZ in the cermet structure. This leads us to the conclusion that mostof the active TPB sites are located in the bulk of the cermet, which increases with the
log TPB (m cm-2)
0 1 2 3 4
log
σ i (Ω
cm-2
)
-3
-2
-1
0
1
Ni-lithoNi porousNi modCermets
slope 1
Figure 9.19: Total electrode conductivity for different type of anodes as function of themeasured nickel perimeter.
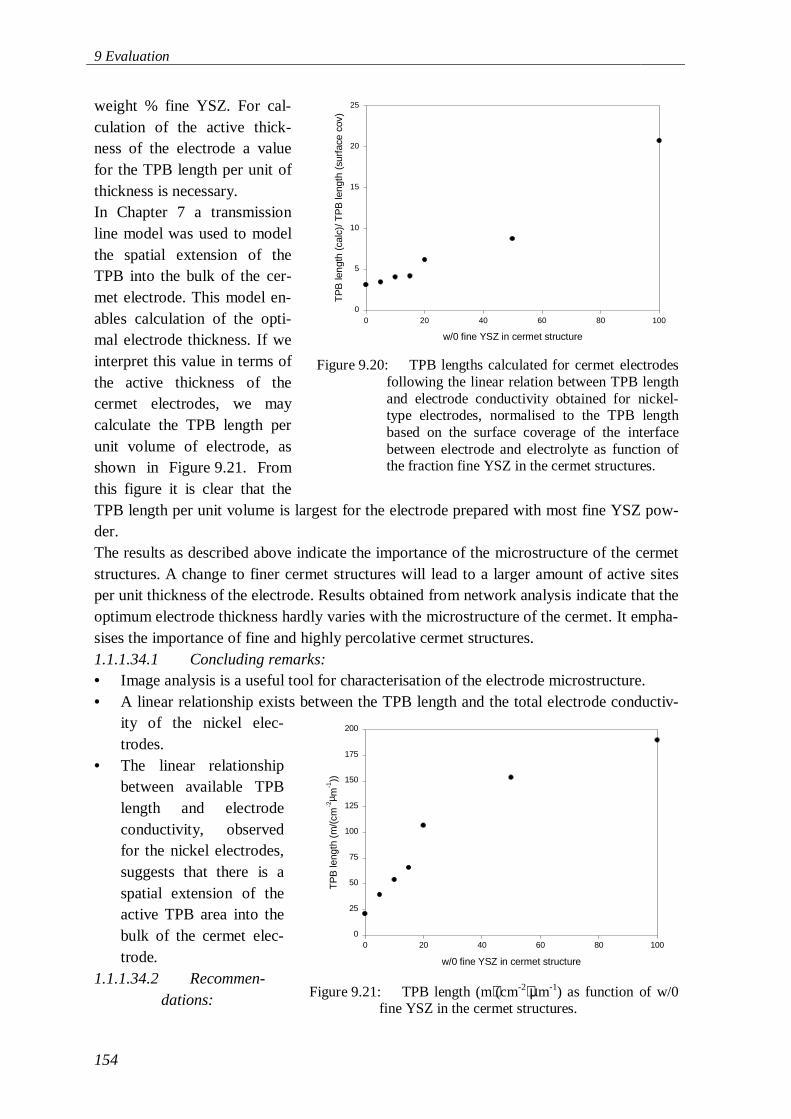
9 Evaluation
154
weight % fine YSZ. For cal-culation of the active thick-ness of the electrode a valuefor the TPB length per unit ofthickness is necessary.In Chapter 7 a transmissionline model was used to modelthe spatial extension of theTPB into the bulk of the cer-met electrode. This model en-ables calculation of the opti-mal electrode thickness. If weinterpret this value in terms ofthe active thickness of thecermet electrodes, we maycalculate the TPB length perunit volume of electrode, asshown in Figure 9.21. Fromthis figure it is clear that theTPB length per unit volume is largest for the electrode prepared with most fine YSZ pow-der.The results as described above indicate the importance of the microstructure of the cermetstructures. A change to finer cermet structures will lead to a larger amount of active sitesper unit thickness of the electrode. Results obtained from network analysis indicate that theoptimum electrode thickness hardly varies with the microstructure of the cermet. It empha-sises the importance of fine and highly percolative cermet structures.1.1.1.34.1 Concluding remarks:• Image analysis is a useful tool for characterisation of the electrode microstructure.• A linear relationship exists between the TPB length and the total electrode conductiv-
ity of the nickel elec-trodes.
• The linear relationshipbetween available TPBlength and electrodeconductivity, observedfor the nickel electrodes,suggests that there is aspatial extension of theactive TPB area into thebulk of the cermet elec-trode.
1.1.1.34.2 Recommen-dations:
w/0 fine YSZ in cermet structure
0 20 40 60 80 100
TP
B le
ngt
h (c
alc)
/ TP
B le
ngth
(su
rfac
e co
v)
0
5
10
15
20
25
Figure 9.20: TPB lengths calculated for cermet electrodesfollowing the linear relation between TPB lengthand electrode conductivity obtained for nickel-type electrodes, normalised to the TPB lengthbased on the surface coverage of the interfacebetween electrode and electrolyte as function ofthe fraction fine YSZ in the cermet structures.
w/0 fine YSZ in cermet structure
0 20 40 60 80 100
TP
B le
ngth
(m
/(cm
-2µ m
-1))
0
25
50
75
100
125
150
175
200
Figure 9.21: TPB length (m⋅(cm-2⋅µm-1) as function of w/0fine YSZ in the cermet structures.

9.3 Hydrogen oxidation reaction at the anode
155
• The width of the active TPB seems to be an interesting subject for further study. Thestrategy that should be followed to gain more insight in this issue is difficult to indi-cate. Lithographically prepared electrodes seem a good starting point, because in thiscase the nickel perimeter and the TPB width will scale linearly. It is, however, ques-tionable if lithographic samples can be made on the proper scale.
• There is an urgent need for a better quantification of the microstructure of cermetelectrodes. Information about the TPB length per volume unit of the electrode is con-sidered to be very useful in estimating the active thickness of the electrode.
• The results presented indicate that the electrode resistance decreases with decreasingparticle size of the YSZ used for the preparation of the cermets. It is a challenge tofurther decrease this particle size to improve the performance, or to look for othermorphologies. For other morphologies the use of micro emulsion systems could bestudied.
• Transmission line modelling of impedance data yields useful parameters that are con-sidered to be relevant for further optimisation of the microstructure of the cermets. It istherefore recommended to pay more attention to this approach.
9.3 Hydrogen oxidation reaction at the anode
The hydrogen oxidation reaction at the anode is generally recognised to be composed ofseveral sequential reaction steps. A better understanding of the reaction mechanism interms of rate-determining steps enables further optimisation of the electrode performance.Therefore unravelling of the hydrogen oxidation reaction is of great importance.Information on the kinetics of the electrode reaction can be obtained from impedance andI-η measurements, using gas phase conditions, temperature and overpotential as variables.For all different types of electrodes a similar experimental approach was used, as describedextensively in the previous chapters.In Chapter 4 a model is proposed for the hydrogen oxidation reaction at the anode. Al-though impedance measurements at equilibrium indicated that the electrode reaction wasgoverned by one dominating process, the assumption of one rate determining step with theother steps in virtual equilibrium did not hold. The H2 and H2O partial pressure depend-ency of the properties of the nickel electrodes varied with applied overpotential. These re-sults suggest that changes in the fractional coverage of adsorbed intermediates occur eitheron nickel or YSZ, invalidating a classical analysis of the electrode kinetics. The appear-ance of ‘inductive loops’ for cermet type of electrodes presents another indication that ad-sorbed intermediates might play an important role in the electrode reaction.Despite the fact that the proposed model can not easily be verified, it is useful to comparethe electrochemical performance for the different type of electrodes. Table 9.5 gives anoverview of the results obtained from impedance measurements under standard conditionsand as function of gas phase condition and temperature. The impedance behaviour, interms of the number of arcs, depends very much on the type of electrode. Porous nickeland modified nickel electrodes can be described with two arcs, where the high frequencyarc is clearly dominating. The impedance spectra of the pattern electrodes are fitted withthree arcs where the mid frequency arc dominates. The impedance spectra of the cermet
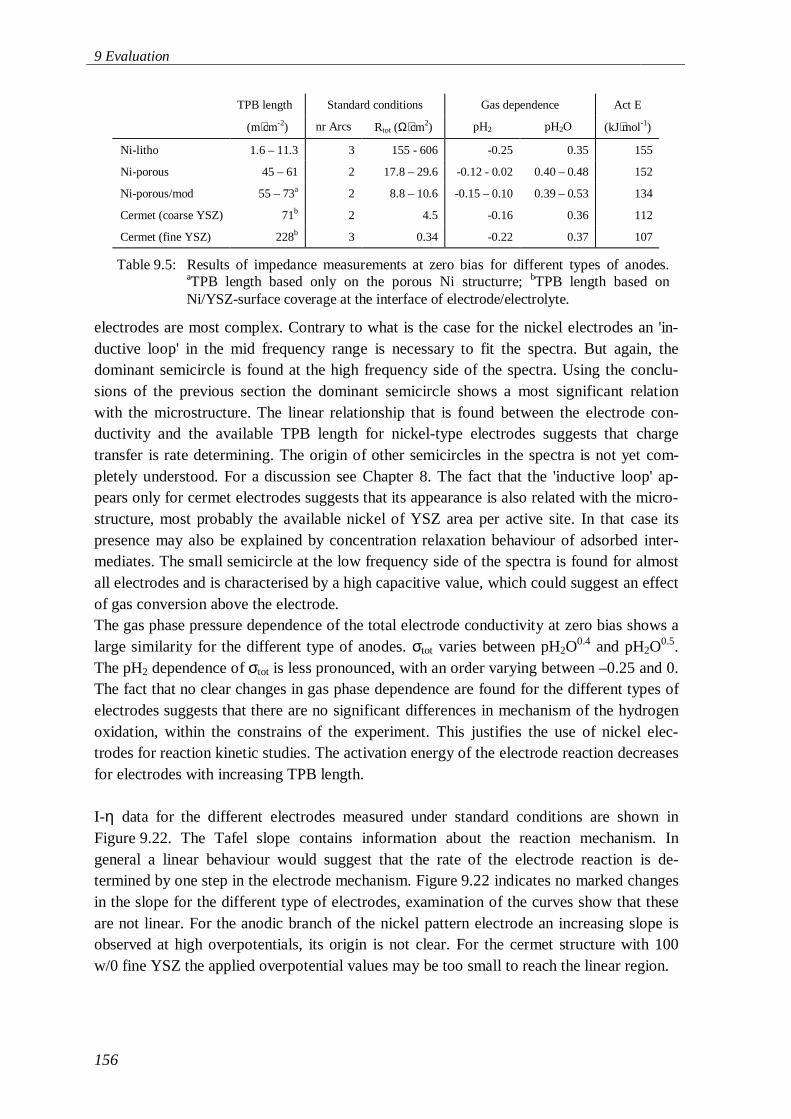
9 Evaluation
156
electrodes are most complex. Contrary to what is the case for the nickel electrodes an 'in-ductive loop' in the mid frequency range is necessary to fit the spectra. But again, thedominant semicircle is found at the high frequency side of the spectra. Using the conclu-sions of the previous section the dominant semicircle shows a most significant relationwith the microstructure. The linear relationship that is found between the electrode con-ductivity and the available TPB length for nickel-type electrodes suggests that chargetransfer is rate determining. The origin of other semicircles in the spectra is not yet com-pletely understood. For a discussion see Chapter 8. The fact that the 'inductive loop' ap-pears only for cermet electrodes suggests that its appearance is also related with the micro-structure, most probably the available nickel of YSZ area per active site. In that case itspresence may also be explained by concentration relaxation behaviour of adsorbed inter-mediates. The small semicircle at the low frequency side of the spectra is found for almostall electrodes and is characterised by a high capacitive value, which could suggest an effectof gas conversion above the electrode.The gas phase pressure dependence of the total electrode conductivity at zero bias shows alarge similarity for the different type of anodes. σtot varies between pH2O
0.4 and pH2O0.5.
The pH2 dependence of σtot is less pronounced, with an order varying between –0.25 and 0.The fact that no clear changes in gas phase dependence are found for the different types ofelectrodes suggests that there are no significant differences in mechanism of the hydrogenoxidation, within the constrains of the experiment. This justifies the use of nickel elec-trodes for reaction kinetic studies. The activation energy of the electrode reaction decreasesfor electrodes with increasing TPB length.
I-η data for the different electrodes measured under standard conditions are shown inFigure 9.22. The Tafel slope contains information about the reaction mechanism. Ingeneral a linear behaviour would suggest that the rate of the electrode reaction is de-termined by one step in the electrode mechanism. Figure 9.22 indicates no marked changesin the slope for the different type of electrodes, examination of the curves show that theseare not linear. For the anodic branch of the nickel pattern electrode an increasing slope isobserved at high overpotentials, its origin is not clear. For the cermet structure with 100w/0 fine YSZ the applied overpotential values may be too small to reach the linear region.
TPB length Standard conditions Gas dependence Act E
(m⋅cm-2) nr Arcs Rtot (Ω⋅cm2) pH2 pH2O (kJ⋅mol-1)
Ni-litho 1.6 – 11.3 3 155 - 606 -0.25 0.35 155
Ni-porous 45 – 61 2 17.8 – 29.6 -0.12 - 0.02 0.40 – 0.48 152
Ni-porous/mod 55 – 73a 2 8.8 – 10.6 -0.15 – 0.10 0.39 – 0.53 134
Cermet (coarse YSZ) 71b 2 4.5 -0.16 0.36 112
Cermet (fine YSZ) 228b 3 0.34 -0.22 0.37 107
Table 9.5: Results of impedance measurements at zero bias for different types of anodes.aTPB length based only on the porous Ni structurre; bTPB length based onNi/YSZ-surface coverage at the interface of electrode/electrolyte.
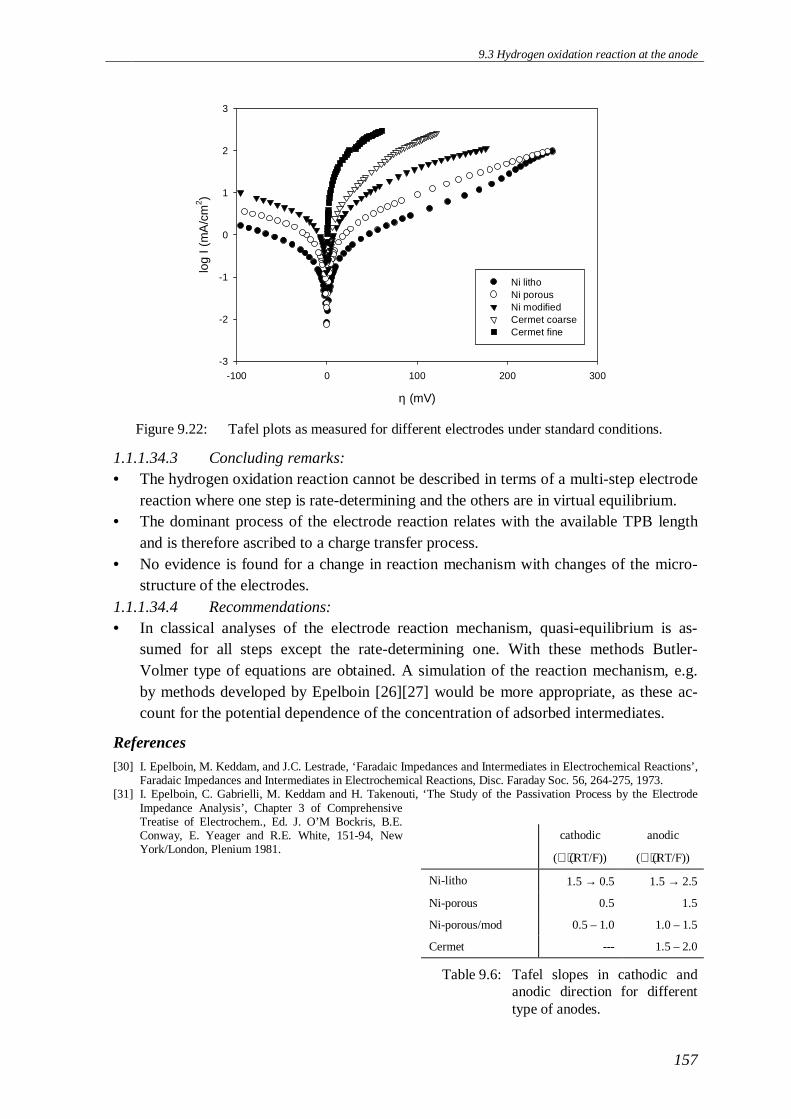
9.3 Hydrogen oxidation reaction at the anode
157
1.1.1.34.3 Concluding remarks:• The hydrogen oxidation reaction cannot be described in terms of a multi-step electrode
reaction where one step is rate-determining and the others are in virtual equilibrium.• The dominant process of the electrode reaction relates with the available TPB length
and is therefore ascribed to a charge transfer process.• No evidence is found for a change in reaction mechanism with changes of the micro-
structure of the electrodes.1.1.1.34.4 Recommendations:• In classical analyses of the electrode reaction mechanism, quasi-equilibrium is as-
sumed for all steps except the rate-determining one. With these methods Butler-Volmer type of equations are obtained. A simulation of the reaction mechanism, e.g.by methods developed by Epelboin [26][27] would be more appropriate, as these ac-count for the potential dependence of the concentration of adsorbed intermediates.
References
[30] I. Epelboin, M. Keddam, and J.C. Lestrade, ‘Faradaic Impedances and Intermediates in Electrochemical Reactions’,Faradaic Impedances and Intermediates in Electrochemical Reactions, Disc. Faraday Soc. 56, 264-275, 1973.
[31] I. Epelboin, C. Gabrielli, M. Keddam and H. Takenouti, ‘The Study of the Passivation Process by the ElectrodeImpedance Analysis’, Chapter 3 of ComprehensiveTreatise of Electrochem., Ed. J. O’M Bockris, B.E.Conway, E. Yeager and R.E. White, 151-94, NewYork/London, Plenium 1981.
cathodic
(∠⋅(RT/F))
anodic
(∠⋅(RT/F))
Ni-litho 1.5 → 0.5 1.5 → 2.5
Ni-porous 0.5 1.5
Ni-porous/mod 0.5 – 1.0 1.0 – 1.5
Cermet --- 1.5 – 2.0
Table 9.6: Tafel slopes in cathodic andanodic direction for differenttype of anodes.
η (mV)
-100 0 100 200 300
log
I (m
A/c
m2 )
-3
-2
-1
0
1
2
3
Ni lithoNi porousNi modifiedCermet coarseCermet fine
Figure 9.22: Tafel plots as measured for different electrodes under standard conditions.


159
Dankwoord
Het is gelukt! U bent bijna aan het einde gekomen van dit proefschrift en ook ik ben bijnabeland aan het einde van mijn loopbaan als AIO. Op zo’n moment krijgt de mens van natu-re de drang om de achterliggende periode te overdenken. Ik zal u daar niet te veel mee las-tig vallen. Echter wel met één punt, ik zou namelijk graag op deze plaats enige mensenwillen bedanken die hebben bijgedragen aan de totstandkoming van dit proefschrift.
• Henk Verweij voor het bieden van de mogelijkheid om binnen zijn groep als AIO tewerken. Ik heb er veel van geleerd.
• Henny Bouwmeester voor zijn enorme motivatie, het corrigeren van manuscripten ende vele discussies over anodes en hun werking. Ik heb bewondering voor het enthou-siasme wat jij hebt voor de wetenschap en ben er van overtuigd dat het grote invloedheeft gehad op de totstandkoming van dit proefschrift.
• Mijn (ex-)kamergenoten, Renate, Martijn, Balu, Marcel, Arian, Nieck en Marjan voorde gezellige sfeer, de vele kamer etentjes en alle andere zaken die zich binnenskamersafspelen. Renate, jou wil ik in het bijzonder bedanken voor je vriendschap in ‘zware’tijden. Martijn voor alle wetenschappelijke discussies, waar je altijd tijd voor maakte,natuurlijk voor ‘Hoofdstuk 7’ en niet te vergeten de gezelligheid.
• Bernard voor de ondersteuning in de eerste jaren en het kritisch lezen van dit manu-script.
• Sylvie Briot voor al het werk aan de dunne electrolyt cellen, honderden metingen waarik helaas weinig mee heb kunnen doen. Het schijnt te horen bij onderzoek, maar is nietleuk.
• Mercedes Gonzales voor je enorme inzet om in korte tijd zeer veel metingen uit te voe-ren en uit te werken en natuurlijk voor de gezellige gesprekken.
• Matthijs den Otter voor je onvermoeibare inzet om tot patroon electroden te komen.Het is gelukt!
• Wim Hoeyenbos voor het schrijven van de programmatuur voor de I-η metingen.
• André, Bas, Caroline, Cis, Claudia, Eddy, José, Matthijs, Nicole, René, Sven, Zeger enalle andere vakgroep genoten die niet met name zijn genoemd voor de prettige werk-sfeer in het lab en gezellige vakgroep activiteiten.

9 Evaluation
160
• De vakgroep technici voor alle ondersteuning in het lab en alle technici van ‘externe’werkplaatsen voor het maken dan wel repareren van meetcellen en apparatuur en pre-paratie van electrolyten en electroden.
• Frans van Berkel, voor je onvermoeibare inzet voor dit project, maar ook voor de velediscussies, de mogelijkheid om bij het ECN metingen uit te voeren en voor alle gepre-pareerde electroden en electrolyten. Gerard Schipper wil ik bedanken voor alle ge-maakte cermet electroden.
• Nieck, Peter, Edgard en prof P.J. Gellings voor het nauwkeurig corrigeren van dit ma-nuscript.
• Iedereen die ik vergeten ben.
• Mijn ouders, verdere familie en vrienden voor de steun die ik in de afgelopen jaren hebgekregen. En heit, nu is dan de tijd gekomen om écht aan het werk te gaan!
• Tot slot, André voor alles.
Baukje de Boer
161
Levensloop
De schrijver van dit proefschrift werd op 8 oktober 1968 geboren in Appelscha. In 1987behaalde zij aan het Ichthus College te Drachten het VWO diploma. In datzelfde jaar be-gon zij aan de studie Technische Natuurkunde aan de Universiteit Twente. De doctoraalstage verrichte zij in 1991 bij het Department of Crystallography aan de University ofPittsburgh. Onder begeleiding van prof. dr. B.M. Craven voerde zij een onderzoek uit naarde verfijning van de kristal structuur van beryllium acetaat op basis van Röntgen en neu-tronen diffractie data. In augustus 1993 studeerde zij af bij de vakgroep Chemische Fysicavan prof. dr. D. Feil. Het betrof een onderzoek waarbij door middel van Röntgen diffractieexperimenten en quantum mechanische berekeningen werd gekeken naar het effect van eenintern electrisch veld op de ladingsdichtheidsverdeling in een moleculair kristal. Vanafoktober 1993 was zij als Assistent in Opleiding werkzaam bij de groep Anorganische Ma-teriaalkunde binnen de faculteit Chemische Technologie aan de Universiteit Twente. Het indit proefschrift beschreven onderzoek werd uitgevoerd onder begeleiding van prof. dr. ir.H. Verweij en dr. H.J.M. Bouwmeester.


163


165

166


![Journal of Power Sourceswaiting/publication/2-long...infiltrated anode. For example, a rapid power degradation of a MS-SOFC with infiltrated Ni catalysts was found at 700 #C [9].Our](https://static.documents.pub/doc/80x56/5ea3e38dbc5ba4612d184824/journal-of-power-sources-waitingpublication2-long-iniltrated-anode-for-example.jpg)


