EUR xxxxx EN 2010 SOFC Single Cell Performance and Endurance Test Modules Test Modules TM SOFC 01-04LD / 05-08HD 30 April, 2010 G De Marco, A Pilenga, M. Honselaar, T Malkow, G Tsotridis European Commission, Joint Research Centre, Institute for Energy, Petten A Janssen, B Rietveld Energy Research Centre of the Netherlands, ECN I Vinke Forschungszentrum Juelich GmbH Jari Kiviaho VTT Technical Research Centre of Finland
Transcript
EUR xxxxx EN 2010
SOFC Single Cell Performance and Endurance Test Modules
Test Modules TM SOFC 01-04LD / 05-08HD
30 April, 2010
G De Marco, A Pilenga, M. Honselaar, T Malkow, G TsotridisEuropean Commission, Joint Research Centre, Institute for Energy, Petten
A Janssen, B RietveldEnergy Research Centre of the Netherlands, ECN
I Vinke Forschungszentrum Juelich GmbH
Jari Kiviaho
VTT Technical Research Centre of Finland
The mission of the JRC-IE is to provide support to Community policies
related to both nuclear and non-nuclear energy in order to ensure
sustainable, secure and efficient energy production, distribution and use.
Reproduction is authorised provided the source is acknowledged
Printed in the Netherlands
SOFC Performance &
Endurance Test Modules
Version 30 04 2010
iii
Preface
This report is part of a series of reports on harmonised testing procedures for SOFC Solid Oxide fuel cell. The testing procedures called Test Modules are originally developed under the Research & Training Network (RTN) FCTESTNET (Fuel Cells Testing & Standardisation NETwork). This project was partly funded by the 5th European Community Framework Programme on Research, Technological Development and Demonstration (FP5). The present report contains the following Performance and Endurance Test Modules for SOFC single cell operating with:
1. TM 01-LD hydrogen; Light Duty Test module
2. TM 02-LD internally steam reformed (ISR) methane pre-reformed at 10%; Light Duty Test module
3. TM 03-LD simulated fuel representative of externally stem reformed methane and steam reformed diesel (ESR); Light Duty Test module
4. TM 04-LD simulated fuel representative of partially oxidised (POX) and auto-thermally reformed diesel (ATR); Light Duty Test module
5. TM 05-HD hydrogen; Heavy Duty Test module
6. TM 06-HD internally steam reformed (ISR) methane pre-reformed at 10%; Heavy Duty Test module
7. TM 07-HD simulated fuel representative of externally stem reformed methane and steam reformed diesel (ESR); Heavy Duty Test module
8. TM 08-HD simulated fuel representative of partially oxidised (POX) and auto-thermally reformed diesel (ATR); Heavy Duty Test module
These Modules are a general characterization method used in research & development (R&D) of SOFC; for example, to perform baseline measurements for qualification of SOFC materials, components and designs in a given application. Also these modules can be part of a Quality Assurance process in cell production. The module character of this testing procedure makes it suitable to apply it as a part of an entire test programme. The present version of the modules is the result of an extensive review process carried out by the participating members to work package SOFC of the FCTESQA (Fuel Cell Systems Testing, Safety & Quality Assurance) Specific Targeted REsearch Project (STREP). FCTESQA is the successor project to FCTESTNET. It is in part funded by the Sixth Framework Programme of the European Community on Research, Technological development and Demonstration activities (FP6).
SOFC Performance &
Endurance Test Modules
Version 30 04 2010
iv
SOFC Performance &
Endurance Test Modules
Version 30 04 2010
v
Table of Contents
Preface iii
FCTESTNET vii
FCTESQA viii
SOFC Performance and Endurance Test Modules 1
1 Objective and scope 3
2 Terminology, definitions, and symbols 4 2.1 TERMINOLOGY AND DEFINITIONS 4 2.2 SYMBOLS 4
3 Test Inputs 7 3.1 VARIABLE TEST INPUTS 7 3.2 STATIC TEST INPUTS 8
3.2.1 TM 01-LD - LIGHT DUTY TEST MODULE WITH HYDROGEN 8 3.2.2 TM 02-LD - LIGHT DUTY TEST MODULE WITH ISR METHANE 9 3.2.3 TM 03-LD - LIGHT DUTY TEST MODULE WITH ESR METHANE OR DIESEL 10 3.2.4 TM 04-LD - LIGHT DUTY TEST MODULE WITH POX OR ATR DIESEL 11 3.2.5 TM 05-HD - HEAVY DUTY TEST MODULE WITH HYDROGEN 12 3.2.6 TM 06-HD - HEAVY DUTY TEST MODULE WITH ISR METHANE 13 3.2.7 TM 07-HD - HEAVY DUTY TEST MODULE WITH ESR METHANE OR DIESEL 15 3.2.8 TM 08-HD - HEAVY DUTY TEST MODULE WITH POX OR ATR DIESEL 16
6 Test Equipment and Setup 19 6.1 TEST SET-UP 19 6.2 SENSORS OR CONTROL/ACQUISITION EQUIPMENT NEEDED 20
7 Test Programme 21 7.1 ASSEMBLY AND PRE-CONDITIONING OF THE CELL 21 7.2 RECORDING OF THE INITIAL POLARISATION CURVES 22 7.3 STEADY-STATE OPERATION FOR PERFORMANCE EVALUATION 23 7.4 RECORDING OF THE SECOND SERIES OF POLARISATION CURVES 23 7.5 STEADY-STATE OPERATION FOR ENDURANCE EVALUATION 23 7.6 RECORDING OF THE LAST SERIES OF POLARISATION CURVES 24
Appendix A. SOFC single cell test report (template) 25
SOFC Performance &
Endurance Test Modules
Version 30 04 2010
vi
SOFC Performance &
Endurance Test Modules
Version 30 04 2010
vii
FCTESTNET
The 55 partner strong FCTESTNET thematic network was established to define harmonised test procedures applicable to the component level (single cells, fuel cell stacks, Balance-of-Plant or BoP), sub-systems, and entire fuel cell systems. The project started in January 2003 and presented its final results in December 2005. It targeted apart from PEFC two other major types of fuel cells namely solid oxide fuel cells (SOFC) and molten carbonate fuel cells (MCFC) in stationary, transport, and portable applications.
The main objectives of FCTESTNET were to compile already existing testing procedures and methodologies and to further develop harmonised testing procedures and methodologies applicable to transport applications, stationary power sources, and portable fuel cells, focusing on:
• fuel cells,
• fuel cell stacks and
• fuel cell systems. The main deliverables of the network were:
• Contribution to the FC glossary EUR 2295 EN
• Mapping of testing competencies and inventory of equipment around Europe;
• Compilation and further development of methodologies for testing procedures;
• Common measuring criteria;
• Agreement on and harmonisation of approaches;
• Release of testing procedures
• Establishing links between European, US and Japanese standardisation bodies in the frame of harmonising test procedures.
FCTESTNET had not a mandate to establish formal standards for fuel cell test procedures. Instead FCTESTNET strived to provide harmonisation of application and technology oriented to ensure the support and integration of European industrial interests. The idea was to start from an analysis of fuel cell applications to define test parameters, test methods and conditions that are relevant for testing of single cells, stacks, sub-systems, and systems. The project output is considered useful input for standard setting bodies, but also for definition of ad-hoc test procedures applied by R&D organisations and industry.
In fact various fuel cell test procedures were developed and compiled individually as Test Modules. These modules are accessible at the FCTESQA website.
SOFC Performance &
Endurance Test Modules
Version 30 04 2010
viii
FCTESQA
Started in May 2006, the FCTESQA project addresses pre-normative research, benchmarking, and experimental validation through Round Robin Testing of harmonised, industry wide test protocols and testing methodologies for three types of fuel cells: PEFC, SOFC, and MCFC in stationary applications. The main objective of the project is the validation and benchmarking - by means of experimental campaigns – of the results of FCTESTNET testing procedures for three different levels (single cells, fuel cell stacks, and entire systems). The Round Robin Testing campaigns of FCTESQA are carried out by world class laboratories from among the 27 European project participants and participants from China, Japan, Korea, and US.
The results of this four years project are discussed debated and agreed in cooperative progress meetings and dedicated international workshops under the auspices of the International Partnership for the Hydrogen Economy (IPHE) and the International Energy Agency (IEA). The outcome of FCTESQA will support to lessen the gap between individual and independent management decision making within companies and research groups as far as fuel cells are concerned following accepted international quality practices.
The flow chart below describes the methodology used to improve/validate the original FCTESTNET procedures up to the final release of the procedures. The same validation methodology has been considered for all the 3 technologies and for testing of fuel cells, fuel cell stacks and fuel cell systems.
Selection / Revision of Test Proceduresfrom FCTESTNET with FCTESQA partners
Validation of the selected ProceduresUsing single cells, stacks, systems
Review of Test Procedures
Validation of Reviewed Procedures
Final Release of Test Procedures
Definition of the validation process
The test procedures can be downloaded from the website and will feed into the appropriate standardization platforms for further consensus building and international approval (like IEC TC 105).
SOFC Performance &
Endurance Test Modules
Version 30 04 2010
1
FCTESQA
Fuel Cell Testing, Safety and Quality
Assurance
Programme: ENERGY 3 -Sustainable Energy Systems
SOFC Performance and Endurance Test Modules
Light Duty Test module with hydrogen; TM 01-LD Light Duty Test Module with ISR; TM 02-LD Light Duty Test Module with ESR; TM 03-LD
Light Duty Test Module with POX or ATR; TM 04-LD Heavy Duty Test module with hydrogen; TM 05-HD
Heavy Duty Test Module with ISR; TM 06-HD Heavy Duty Test Module with ESR; TM 07-HD
Heavy Test Module with POX or ATR; TM 08-HD
Version 30-04-2010
SOFC Performance &
Endurance Test Modules
Version 30 04 2010
2
SOFC Performance &
Endurance Test Modules
Version 30 04 2010
3
1 Objective and scope
Procedure for evaluation of performance and endurance at light-duty and/or heavy duty operating conditions, of SOFC single cells operated
with:
1. hydrogen; Light Duty Test module TM 01-LD
2. internally steam reformed (ISR) methane pre-reformed at 10%; Light Duty Test module TM 02-LD
3. simulated fuel representative of externally stem reformed methane and steam reformed diesel (ESR); Light Duty Test module TM 03-LD
4. simulated fuel representative of partially oxidised (POX) and auto-
thermally reformed diesel (ATR); Light Duty Test module TM 04-LD
5. hydrogen; Heavy Duty Test module TM 05-HD
6. internally steam reformed (ISR) methane pre-reformed at 10%; Heavy Duty Test module TM 06-HD
7. simulated fuel representative of externally stem reformed methane
and steam reformed diesel (ESR); Heavy Duty Test module TM 07-HD
8. simulated fuel representative of partially oxidised (POX) and auto-
thermally reformed diesel (ATR); Heavy Duty Test module TM 08-HD
The test procedure has no target application. However this procedure is a
general characterization method that is used in research and development of the SOFC and for quality assurance in cell production. The tests can be
used as a baseline measurement for the qualification of a SOFC and its components in a given application.
These modules are applied in combination with a test programme, which will describe the operating conditions of the cell.
Most important, the parameters, values and range of values including uncertainties used throughout this document are recommended only.
SOFC Performance &
Endurance Test Modules
Version 30 04 2010
4
2 Terminology, definitions, and symbols
2.1 Terminology and definitions
Terminology and definitions used in this document correspond to the European 5th FCTESTNET terminology document EUR 22295 EN (see
Section 5.1).
2.2 Symbols
Symbols used in this document are defined as follows: Table 1: Definition of symbols used.
Symbol Description
A Common active geometric area of each cell
F Faraday’s constant (F = 96485.3 C/mol)
I Electrical fuel cell current
Imax Maximum electrical fuel cell current
M Molar mass
P Electrical fuel cell power
Qv Volumetric flow rate
Qv, x Volumetric flow rate of fuel cell fluid x (i.e. dry reactant gas, fuel gas=fuel or oxidant
gas=ox) under STP conditions
X fuel Fuel composition
X Ox Oxidant composition
Qv, x, min Minimum volumetric flow rate of fuel cell fluid x
T Temperature
Tx, y Temperature of fuel cell fluid x at fuel cell location y (i.e. inlet=in or outlet=out)
TA Ambient temperature
Tdew x, y Dew point temperature of reactant gas x at fuel cell location y (i.e. inlet=in or outlet=out)
Tc Fuel cell temperature
Uf Fuel utilisation factor (0 < Uf ≤1)
V Fuel cell voltage
Vmin Minimum allowable fuel cell voltage
i Fuel cell current density ( i = I / A)
k Interval k belonging to current density set point k during the measurement of the test
outputs
l Data acquisition index or number of data points recorded during tacq
m Total number of data points per interval k
SOFC Performance &
Endurance Test Modules
Version 30 04 2010
5
Symbol Description
pA Ambient pressure (absolute)
px, y Pressure (gauge) of reactant gas x at fuel cell location y (i.e. inlet=in or outlet=out)
t Duration, period, or time
tacq Duration of data acquisition at interval k
thold hold time between two current density set points belonging respectively to interval k and
k+1
z Number of electrons exchanged in the fuel cell reaction for one mole of reactant
Greek symbols
∆ px Pressure drop in the flow path of fluid x (i.e. fuel, reactant gases) between fuel cell outlet
and inlet
∆ px, max Maximum allowable pressure drop in the flow path of the fluid x (e.g. fuel) or between fuel
and oxidant (fuel-to-ox) in the fuel cell (at a given instant or for a given duration)
∆Tx Temperature difference of fluid x between the fuel cell outlet and inlet
λ Excess oxidant (air or oxygen) coefficient (≥ 1)
ρ Density (i.e. dry reactant gas under STP1 conditions)
1 SATP = Standard Ambient Temperature and Pressure (298.15 K, 100 kPa or 1 bara)
STP = Standard Temperature and Pressure (273.15 K, 101.325 kPa).
SOFC Performance &
Endurance Test Modules
Version 30 04 2010
6
The volumetric flow rates of the reactant gases as function of the cell
active area can be calculated as follows:
f
xvUmkgmolCFz
cmAimolgMcmminmlQ
⋅⋅⋅
⋅⋅⋅⋅=⋅⋅
−−−
)/()/(
)()/(106)(
3
2421
,ρ
(Equation 1)
Note: F = 96485.3 C/mol
Table 2: Properties of reactant gases for calculating the volumetric flow rate, Qv,x of the reactant gases.
Reactant
gas
M z ρρρρ
[g/mol] [kg/Nm3]
H2 2.02 2 0.0898
O2 32.0 4 1.429
CH4 16.04 4 0.7168
Air 28.8 4 1.292
Using these values at STP (273.15K, 101.325kPa), the reactant gas flow rates can be calculated using the expressions given in Table 3.
Should in the fuel composition be there others hydrocarbons use the following equation to convert (reform) them into hydrogen; the Eq. 2 can
also be used to calculate the water content needs to complete the reaction: Cx Hy + 2x ·H2 O → (2x + y/2) · H2 + x · CO2 (Equation 2)
Table 3: Expressions for calculating the volumetric flow rate, Qv,x of the
reactant gases based on Eq. 1 and the data of Table 2.
Reactant
gas
Qv,x [Nml · min-1 · cm-2]
H2 6.97⋅ n ⋅ i / Uf
O2 3.35 ⋅ n ⋅ i / Uf
CH4 1.74 ⋅ n ⋅ i / Uf
Air (3.35/0.209) ⋅ n ⋅ i / Uf
Note: The reactant flow rates calculated using the expressions provided for in Table 3,
represent the actual flow rates applicable to measuring the test outputs. Other values may
be used for the fuel cell start-up and shut-down procedure as to the fuel cell manufacturer
recommendation or the common practice at the testing organisation.
The unit Nml/min reflects the volume flow under STP. In case of using Mass Flow
Controllers (MFC) to feed reactant gases to the fuel cell it is recommended to check
whether the MFC is calibrated to the same reference temperature and pressure like used in
this calculation.
SOFC Performance &
Endurance Test Modules
Version 30 04 2010
7
3 Test Inputs
There are two types of test inputs (test conditions) variable and static (see the tables in Sections 3.1 to 3.2). Tables below list all the test inputs
(operating conditions) that must be controlled in this testing procedure. Concerning the control accuracy, the measurement uncertainties and the
sample rates, the values given in the following tables are the values commonly available with most of the equipments in the middle of the
ranges but they can be too difficult to get in the extremities of the ranges or with particular operating conditions. Deviations from the test module should be reported in the test report.
The test is conducted at constant fuel and oxidant flows for all current density steps.
3.1 Variable Test Inputs
The variable test inputs applied during the test are given in Table 4. Table 4: Variable test inputs during the test.
Input Value / Range Control
accuracy
Sample
rate
t ≥ 3000 h (operating time) ± 1 hour ≥ 1 Hz
Tc 400 – 1050 °C ± 4oC ≥ 1 Hz
SOFC Performance &
Endurance Test Modules
Version 30 04 2010
8
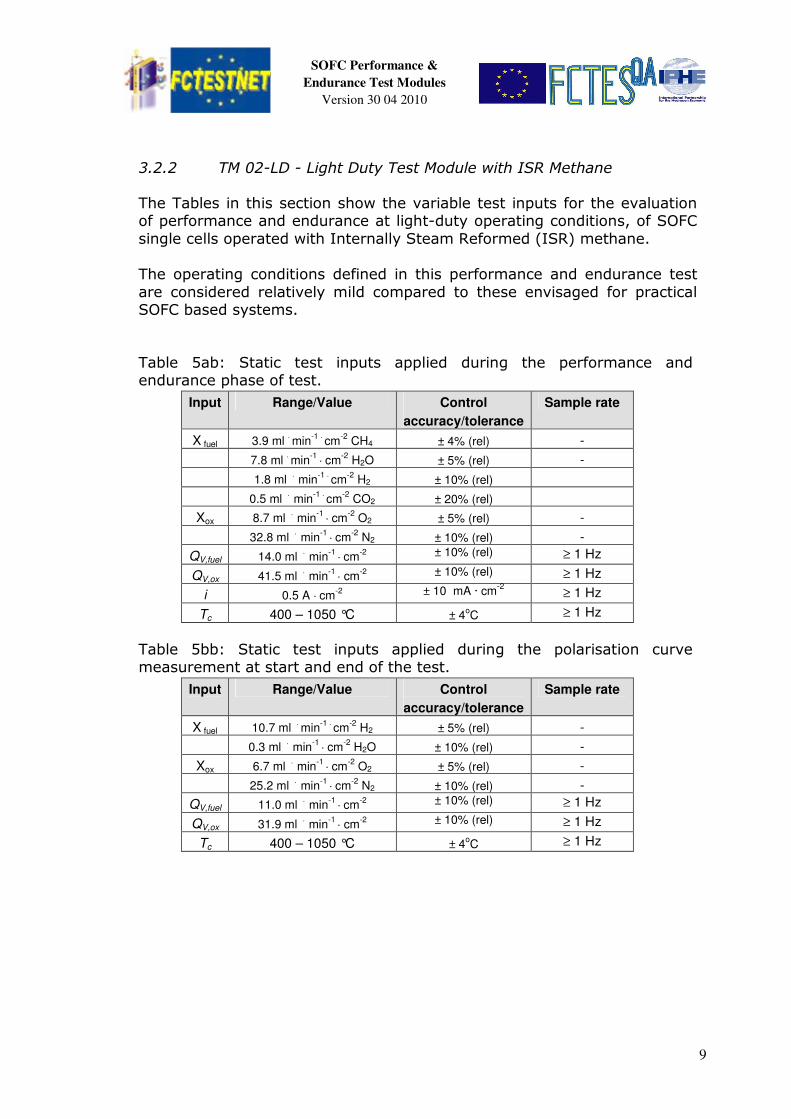
3.2 Static Test Inputs
The static inputs applied during performance and endurance phase, and during the polarisation curve phase of test procedure (see Section 7) are
given the following sections from Table 5aa up to Table 5bh.
3.2.1 TM 01-LD - Light Duty Test Module with Hydrogen
The Tables in this section show the variable test inputs for the evaluation
of performance and endurance at light-duty operating conditions, of SOFC single cells operated with hydrogen.
The operating conditions defined in this performance and endurance test are considered relatively mild compared to these envisaged for practical
SOFC based systems.
Table 5aa: Static test inputs applied during the performance and endurance phase of test.
Input Range/Value Control
accuracy/tolerance
Sample rate
X fuel 17.5 ml · min-1 · cm
-2 H2 ± 5% (rel) -
0.54 ml · min-1
· cm-2
H2O ± 10% (rel) -
Xox 8.7 ml · min-1
· cm-2
O2
± 5% (rel) -
32.8 ml · min-1
· cm-2
N2 ± 10% (rel) -
QV,fuel 18.0 ml · min-1
· cm-2 ± 10% (rel) ≥ 1 Hz
QV,ox 41.5 ml · min-1
· cm-2 ± 10% (rel) ≥ 1 Hz
i 0.5 A · cm-2
± 10 mA · cm-2
≥ 1 Hz
Tc 400 – 1050 °C ± 4oC ≥ 1 Hz
Table 5ba: Static test inputs applied during the polarisation curve measurement at start and end of the test.
Input Range/Value Control
accuracy/tolerance
Sample rate
X fuel 10.7 ml · min-1 · cm
-2 H2 ± 5% (rel) -
0.3 ml · min-1
· cm-2
H2O ± 10% (rel) -
Xox 6.7 ml · min-1
· cm-2
O2
± 5% (rel) -
25.2 ml · min-1
· cm-2
N2 ± 10% (rel) -
QV,fuel 11.0 ml · min-1
· cm-2 ± 10% (rel) ≥ 1 Hz
QV,ox 31.9 ml · min-1
· cm-2 ± 10% (rel) ≥ 1 Hz
Tc 400 – 1050 °C ± 4oC ≥ 1 Hz
SOFC Performance &
Endurance Test Modules
Version 30 04 2010
9
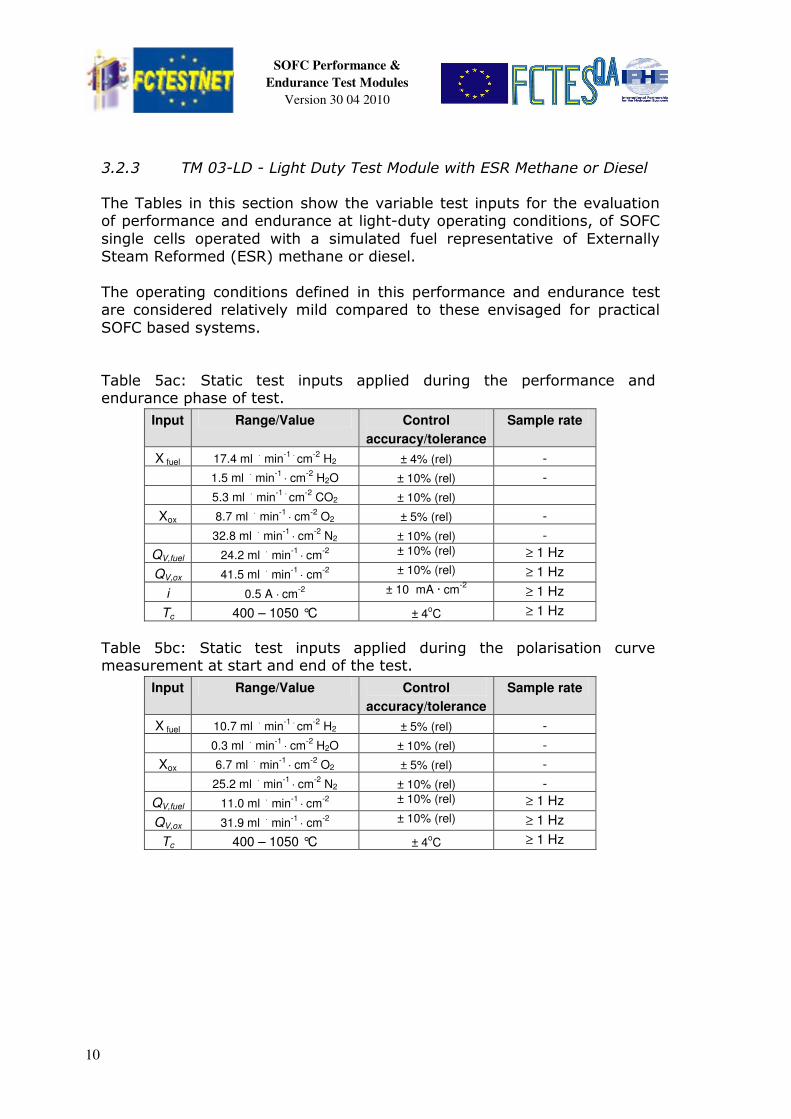
3.2.2 TM 02-LD - Light Duty Test Module with ISR Methane
The Tables in this section show the variable test inputs for the evaluation of performance and endurance at light-duty operating conditions, of SOFC
single cells operated with Internally Steam Reformed (ISR) methane. The operating conditions defined in this performance and endurance test
are considered relatively mild compared to these envisaged for practical SOFC based systems.
Table 5ab: Static test inputs applied during the performance and endurance phase of test.
Input Range/Value Control
accuracy/tolerance
Sample rate
X fuel 3.9 ml · min-1 · cm
-2 CH4 ± 4% (rel) -
7.8 ml · min-1
· cm-2
H2O ± 5% (rel) -
1.8 ml · min
-1 · cm-2
H2 ± 10% (rel)
0.5 ml · min
-1 · cm-2
CO2 ± 20% (rel)
Xox 8.7 ml · min
-1 · cm
-2 O2
± 5% (rel) -
32.8 ml · min
-1 · cm
-2 N2 ± 10% (rel) -
QV,fuel 14.0 ml · min
-1 · cm
-2 ± 10% (rel) ≥ 1 Hz
QV,ox 41.5 ml · min
-1 · cm
-2 ± 10% (rel) ≥ 1 Hz
i 0.5 A · cm-2
± 10 mA · cm-2
≥ 1 Hz
Tc 400 – 1050 °C ± 4oC ≥ 1 Hz
Table 5bb: Static test inputs applied during the polarisation curve measurement at start and end of the test.
Input Range/Value Control
accuracy/tolerance
Sample rate
X fuel 10.7 ml · min
-1 · cm-2
H2 ± 5% (rel) -
0.3 ml · min
-1 · cm
-2 H2O ± 10% (rel) -
Xox 6.7 ml · min
-1 · cm
-2 O2
± 5% (rel) -
25.2 ml · min
-1 · cm
-2 N2 ± 10% (rel) -
QV,fuel 11.0 ml · min
-1 · cm
-2 ± 10% (rel) ≥ 1 Hz
QV,ox 31.9 ml · min
-1 · cm
-2 ± 10% (rel) ≥ 1 Hz
Tc 400 – 1050 °C ± 4oC ≥ 1 Hz
SOFC Performance &
Endurance Test Modules
Version 30 04 2010
10
3.2.3 TM 03-LD - Light Duty Test Module with ESR Methane or Diesel
The Tables in this section show the variable test inputs for the evaluation of performance and endurance at light-duty operating conditions, of SOFC
single cells operated with a simulated fuel representative of Externally Steam Reformed (ESR) methane or diesel.
The operating conditions defined in this performance and endurance test are considered relatively mild compared to these envisaged for practical
SOFC based systems.
Table 5ac: Static test inputs applied during the performance and endurance phase of test.
Input Range/Value Control
accuracy/tolerance
Sample rate
X fuel 17.4 ml · min
-1 · cm-2
H2 ± 4% (rel) -
1.5 ml · min
-1 · cm
-2 H2O ± 10% (rel) -
5.3 ml · min
-1 · cm-2
CO2 ± 10% (rel)
Xox 8.7 ml · min
-1 · cm
-2 O2
± 5% (rel) -
32.8 ml · min
-1 · cm
-2 N2 ± 10% (rel) -
QV,fuel 24.2 ml · min
-1 · cm
-2 ± 10% (rel) ≥ 1 Hz
QV,ox 41.5 ml · min
-1 · cm
-2 ± 10% (rel) ≥ 1 Hz
i 0.5 A · cm-2
± 10 mA · cm-2
≥ 1 Hz
Tc 400 – 1050 °C ± 4oC ≥ 1 Hz
Table 5bc: Static test inputs applied during the polarisation curve measurement at start and end of the test.
Input Range/Value Control
accuracy/tolerance
Sample rate
X fuel 10.7 ml · min
-1 · cm-2
H2 ± 5% (rel) -
0.3 ml · min
-1 · cm
-2 H2O ± 10% (rel) -
Xox 6.7 ml · min
-1 · cm
-2 O2
± 5% (rel) -
25.2 ml · min
-1 · cm
-2 N2 ± 10% (rel) -
QV,fuel 11.0 ml · min
-1 · cm
-2 ± 10% (rel) ≥ 1 Hz
QV,ox 31.9 ml · min
-1 · cm
-2 ± 10% (rel) ≥ 1 Hz
Tc 400 – 1050 °C ± 4oC ≥ 1 Hz
SOFC Performance &
Endurance Test Modules
Version 30 04 2010
11
3.2.4 TM 04-LD - Light Duty Test Module with POX or ATR Diesel
The Tables in this section show the variable test inputs for the evaluation of performance and endurance at light-duty operating conditions, of SOFC
single cells operated with a simulated fuel representative of Partially Oxidised (POX) and Auto-thermally Reformed (ATR) diesel.
The operating conditions defined in this performance and endurance test are considered relatively mild compared to these envisaged for practical
SOFC based systems.
Table 5ad: Static test inputs applied during the performance and endurance phase of test.
Input Range/Value Control
accuracy/tolerance
Sample rate
X fuel 17.4 ml · min
-1 · cm-2
H2 ± 1.5% (rel) -
5.3 ml · min
-1 · cm
-2 H2O ± 5% (rel) -
7.8 ml · min
-1 · cm-2
CO2 ± 10% (rel)
17.9 ml · min
-1 · cm-2
N2 ± 5% (rel)
Xox 8.7 ml · min
-1 · cm
-2 O2
± 5% (rel) -
32.8 ml · min
-1 · cm
-2 N2 ± 10% (rel) -
QV,fuel 48.4 ml · min
-1 · cm
-2 ± 7.5% (rel) ≥ 1 Hz
QV,ox 41.5 ml · min
-1 · cm
-2 ± 10% (rel) ≥ 1 Hz
i 0.5 A · cm-2
± 10 mA · cm-2
≥ 1 Hz
Tc 400 – 1050 °C ± 4oC ≥ 1 Hz
Table 5bd: Static test inputs applied during the polarisation curve measurement at start and end of the test.
Input Range/Value Control
accuracy/tolerance
Sample rate
X fuel 10.7 ml · min
-1 · cm-2
H2 ± 5% (rel) -
0.3 ml · min
-1 · cm
-2 H2O ± 10% (rel) -
Xox 6.7 ml · min
-1 · cm
-2 O2
± 5% (rel) -
25.2 ml · min
-1 · cm
-2 N2 ± 10% (rel) -
QV,fuel 11.0 ml · min
-1 · cm
-2 ± 10% (rel) ≥ 1 Hz
QV,ox 31.9 ml · min
-1 · cm
-2 ± 10% (rel) ≥ 1 Hz
Tc 400 – 1050 °C ± 4oC ≥ 1 Hz
SOFC Performance &
Endurance Test Modules
Version 30 04 2010
12
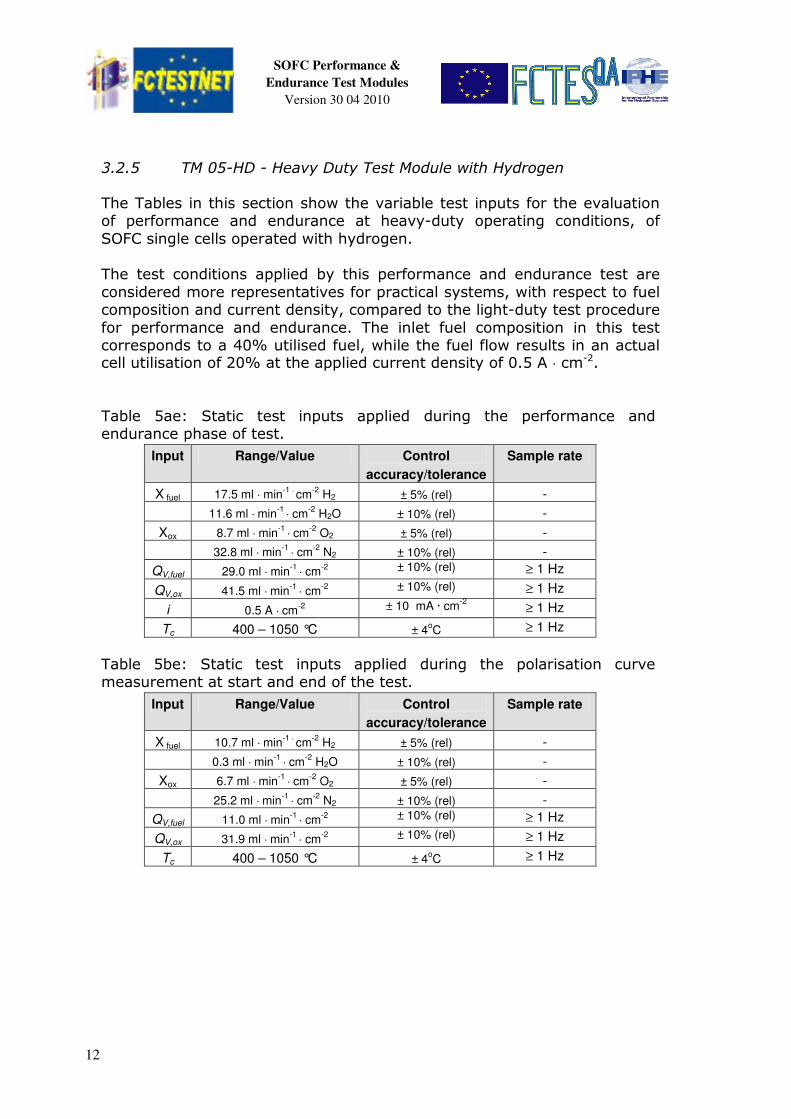
3.2.5 TM 05-HD - Heavy Duty Test Module with Hydrogen
The Tables in this section show the variable test inputs for the evaluation of performance and endurance at heavy-duty operating conditions, of
SOFC single cells operated with hydrogen. The test conditions applied by this performance and endurance test are
considered more representatives for practical systems, with respect to fuel composition and current density, compared to the light-duty test procedure
for performance and endurance. The inlet fuel composition in this test corresponds to a 40% utilised fuel, while the fuel flow results in an actual cell utilisation of 20% at the applied current density of 0.5 A · cm-2.
Table 5ae: Static test inputs applied during the performance and endurance phase of test.
Input Range/Value Control
accuracy/tolerance
Sample rate
X fuel 17.5 ml · min-1 · cm
-2 H2 ± 5% (rel) -
11.6 ml · min-1
· cm-2
H2O ± 10% (rel) -
Xox 8.7 ml · min-1
· cm-2
O2
± 5% (rel) -
32.8 ml · min-1
· cm-2
N2 ± 10% (rel) -
QV,fuel 29.0 ml · min-1
· cm-2 ± 10% (rel) ≥ 1 Hz
QV,ox 41.5 ml · min-1
· cm-2 ± 10% (rel) ≥ 1 Hz
i 0.5 A · cm-2
± 10 mA · cm-2
≥ 1 Hz
Tc 400 – 1050 °C ± 4oC ≥ 1 Hz
Table 5be: Static test inputs applied during the polarisation curve measurement at start and end of the test.
Input Range/Value Control
accuracy/tolerance
Sample rate
X fuel 10.7 ml · min-1 · cm
-2 H2 ± 5% (rel) -
0.3 ml · min-1
· cm-2
H2O ± 10% (rel) -
Xox 6.7 ml · min-1
· cm-2
O2
± 5% (rel) -
25.2 ml · min-1
· cm-2
N2 ± 10% (rel) -
QV,fuel 11.0 ml · min-1
· cm-2 ± 10% (rel) ≥ 1 Hz
QV,ox 31.9 ml · min-1
· cm-2 ± 10% (rel) ≥ 1 Hz
Tc 400 – 1050 °C ± 4oC ≥ 1 Hz
SOFC Performance &
Endurance Test Modules
Version 30 04 2010
13
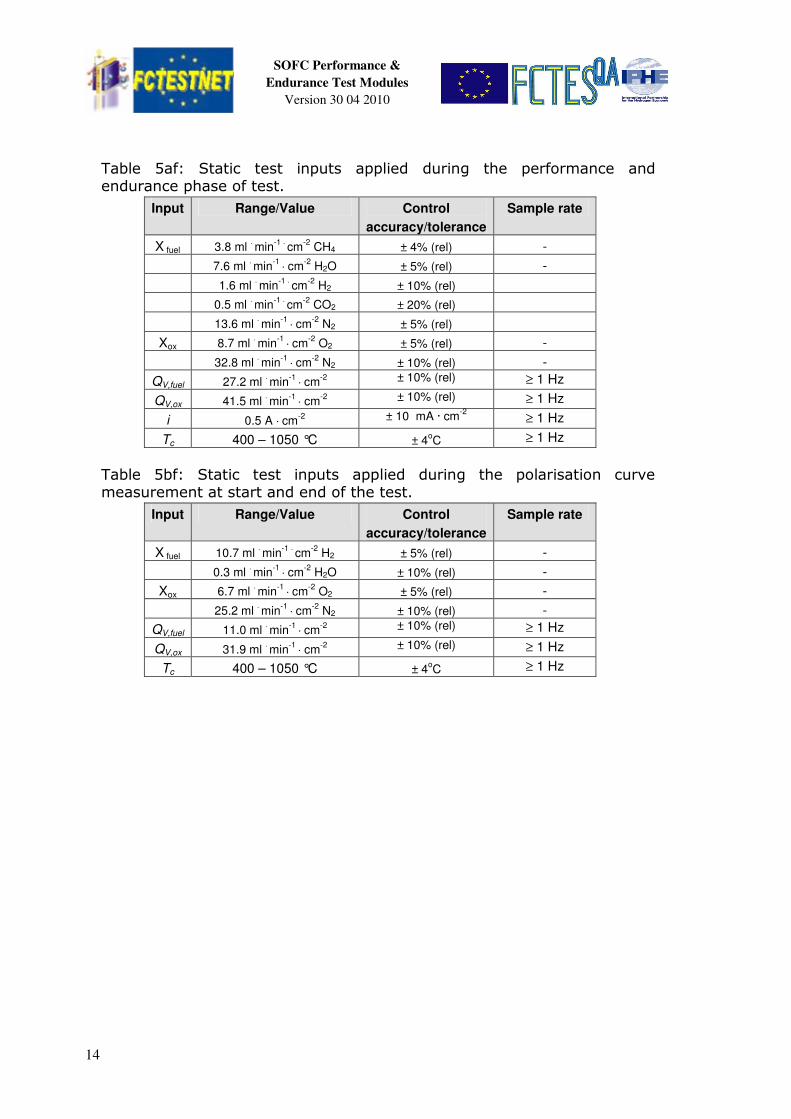
3.2.6 TM 06-HD - Heavy Duty Test Module with ISR Methane
The Tables in this section show the variable test inputs for the evaluation of performance and endurance at heavy-duty operating conditions, of
SOFC single cells operated with Internally Steam Reformed (ISR) methane. The test conditions applied by this performance and endurance test are
considered more representatives for practical systems, with respect to fuel composition and current density, compared to the light-duty test procedure
for performance and endurance. This test procedure deviates from the equivalent test procedures for
evaluation at heavy duty operating conditions with other fuels. An inlet fuel composition corresponding to a 40% utilised fuel of ISR-CH4 would actually
correspond to an external steam-reformed fuel (that is not containing any methane), and this should be considered a relatively mild condition. Therefore, in this case the inlet fuel composition corresponds to a 0%
utilised fuel mixture of methane and water, pre-reformed at 10%, and the actual cell fuel utilisation is 60%, instead of 20% in the comparable test
procedures. At a current density of 0.5 A.cm-2, this would imply a relatively low fuel flow, which might possibly introduce unwanted sensitivity for flow distribution and local leakage. For reducing this sensitivity, the fuel is
mixed with 50% N2, which is supposed to be only a diluent and not affecting the cell performance.
SOFC Performance &
Endurance Test Modules
Version 30 04 2010
14
Table 5af: Static test inputs applied during the performance and endurance phase of test.
Input Range/Value Control
accuracy/tolerance
Sample rate
X fuel 3.8 ml · min-1 · cm
-2 CH4 ± 4% (rel) -
7.6 ml · min-1
· cm-2
H2O ± 5% (rel) -
1.6 ml · min-1 · cm
-2 H2 ± 10% (rel)
0.5 ml · min-1 · cm
-2 CO2 ± 20% (rel)
13.6 ml · min-1
· cm-2
N2 ± 5% (rel)
Xox 8.7 ml · min-1
· cm-2
O2
± 5% (rel) -
32.8 ml · min-1
· cm-2
N2 ± 10% (rel) -
QV,fuel 27.2 ml · min-1
· cm-2 ± 10% (rel) ≥ 1 Hz
QV,ox 41.5 ml · min-1
· cm-2 ± 10% (rel) ≥ 1 Hz
i 0.5 A · cm-2
± 10 mA · cm-2
≥ 1 Hz
Tc 400 – 1050 °C ± 4oC ≥ 1 Hz
Table 5bf: Static test inputs applied during the polarisation curve measurement at start and end of the test.
Input Range/Value Control
accuracy/tolerance
Sample rate
X fuel 10.7 ml · min-1 · cm
-2 H2 ± 5% (rel) -
0.3 ml · min-1
· cm-2
H2O ± 10% (rel) -
Xox 6.7 ml · min-1
· cm-2
O2
± 5% (rel) -
25.2 ml · min-1
· cm-2
N2 ± 10% (rel) -
QV,fuel 11.0 ml · min-1
· cm-2 ± 10% (rel) ≥ 1 Hz
QV,ox 31.9 ml · min-1
· cm-2 ± 10% (rel) ≥ 1 Hz
Tc 400 – 1050 °C ± 4oC ≥ 1 Hz
SOFC Performance &
Endurance Test Modules
Version 30 04 2010
15
3.2.7 TM 07-HD - Heavy Duty Test Module with ESR Methane or Diesel
The Tables in this section show the variable test inputs for the evaluation of performance and endurance at heavy-duty operating conditions, of
SOFC single cells operated with a simulated fuel representative of Externally Steam Reformed (ESR) methane or diesel.
The test conditions applied by this performance and endurance test are considered more representatives for practical systems, with respect to fuel
composition and current density, compared to the light-duty test procedure for performance and endurance. The inlet fuel composition in this test corresponds to a 40% utilised fuel, while the fuel flow results in an actual
cell utilisation of 20% at the applied current density of 0.5 A.cm-2.
Table 5ag: Static test inputs applied during the performance and endurance phase of test.
Input Range/Value Control
accuracy/tolerance
Sample rate
X fuel 17.4 ml · min
-1 · cm-2
H2 ± 4% (rel) -
14.2 ml · min
-1 · cm
-2 H2O ± 10% (rel) -
8.9 ml · min
-1 · cm
-2 CO2 ± 10% (rel)
Xox 8.7 ml · min
-1 · cm
-2 O2
± 5% (rel) -
32.8 ml · min
-1 · cm
-2 N2 ± 10% (rel) -
QV,fuel 40.5 ml · min
-1 · cm
-2 ± 10% (rel) ≥ 1 Hz
QV,ox 41.5 ml · min
-1 · cm
-2 ± 10% (rel) ≥ 1 Hz
i 0.5 A · cm-2
± 10 mA · cm-2
≥ 1 Hz
Tc 400 – 1050 °C ± 4oC ≥ 1 Hz
Table 5bg: Static test inputs applied during the polarisation curve measurement at start and end of the test.
Input Range/Value Control
accuracy/tolerance
Sample rate
X fuel 10.7 ml · min
-1 · cm-2
H2 ± 5% (rel) -
0.3 ml · min
-1 · cm
-2 H2O ± 10% (rel) -
Xox 6.7 ml · min
-1 · cm
-2 O2
± 5% (rel) -
25.2 ml · min
-1 · cm
-2 N2 ± 10% (rel) -
QV,fuel 11.0 ml · min
-1 · cm
-2 ± 10% (rel) ≥ 1 Hz
QV,ox 31.9 ml · min
-1 · cm
-2 ± 10% (rel) ≥ 1 Hz
Tc 400 – 1050 °C ± 4oC ≥ 1 Hz
SOFC Performance &
Endurance Test Modules
Version 30 04 2010
16
3.2.8 TM 08-HD - Heavy Duty Test Module with POX or ATR Diesel
The Tables in this section show the variable test inputs for the evaluation of performance and endurance at light-duty operating conditions, of SOFC
single cells operated with a simulated fuel representative of Partially Oxidised (POX) and Auto-thermally Reformed (ATR) diesel.
The test conditions applied by this performance and endurance test are considered more representatives for practical systems, with respect to fuel
composition and current density, compared to the light-duty test procedure for performance and endurance. The inlet fuel composition in this test corresponds to a 40% utilised fuel, while the fuel flow results in an actual
cell utilisation of 20% at the applied current density of 0.5 A.cm-2.
Table 5ah: Static test inputs applied during the performance and endurance phase of test.
Input Range/Value Control
accuracy/tolerance
Sample rate
X fuel 17.4 ml · min-1 · cm
-2 H2 ± 1.5% (rel) -
19.8 ml · min-1
· cm-2
H2O ± 5% (rel) -
12.7 ml · min-1 · cm
-2 CO2 ± 10% (rel)
29.2 ml · min-1 · cm
-2 N2 ± 5% (rel)
Xox 8.7 ml · min-1
· cm-2
O2
± 5% (rel) -
32.8 ml · min-1
· cm-2
N2 ± 10% (rel) -
QV,fuel 79.1 ml · min-1
· cm-2 ± 7.5% (rel) ≥ 1 Hz
QV,ox 41.5 ml · min-1
· cm-2 ± 10% (rel) ≥ 1 Hz
i 0.5 A · cm-2
± 10 mA · cm-2
≥ 1 Hz
Tc 400 – 1050 °C ± 4oC ≥ 1 Hz
Table 5bh: Static test inputs applied during the polarisation curve measurement at start and end of the test.
Input Range/Value Control
accuracy/tolerance
Sample rate
X fuel 10.7 ml · min-1 · cm
-2 H2 ± 5% (rel) -
0.3 ml · min-1
· cm-2
H2O ± 10% (rel) -
Xox 6.7 ml · min-1
· cm-2
O2
± 5% (rel) -
25.2 ml · min-1
· cm-2
N2 ± 10% (rel) -
QV,fuel 11.0 ml · min-1
· cm-2 ± 10% (rel) ≥ 1 Hz
QV,ox 31.9 ml · min-1
· cm-2 ± 10% (rel) ≥ 1 Hz
Tc 400 – 1050 °C ± 4oC ≥ 1 Hz
SOFC Performance &
Endurance Test Modules
Version 30 04 2010
17
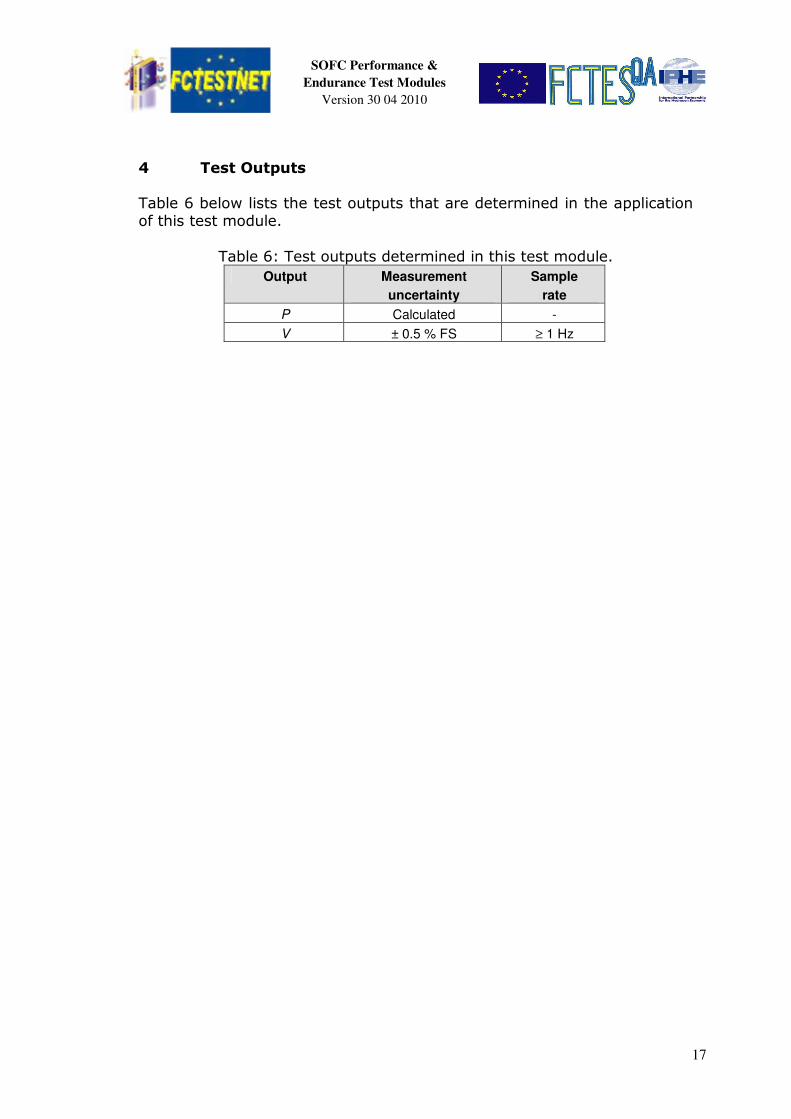
4 Test Outputs
Table 6 below lists the test outputs that are determined in the application of this test module.
Table 6: Test outputs determined in this test module.
Output Measurement
uncertainty
Sample
rate
P Calculated -
V ± 0.5 % FS ≥ 1 Hz
SOFC Performance &
Endurance Test Modules
Version 30 04 2010
18
5 References, required Documentation and Provisions
5.1 References
1. FCTESTNET Fuel Cells Glossary, EUR Report 22295 EN, Scientific and Technical Research Series, Office for Official Publications of the European
Communities, Luxembourg, ISBN 92-79-02747-6, 2006. 2. IEC 62282-2 Ed.1: Fuel cell technologies – Part 2: Fuel cell modules.
3. Test module M01 Polarisation curve for a SOFC single cell.
5.2 Required documentation
The following are required: 1. Documentation (including installation and safety instructions)
provided by the fuel cell test bench manufacturer or component manufacturers for a self-assembled test bench. 2. Calibration certificates of the fuel cell test bench instrumentation.
These documents will be necessary to determine the actual uncertainty of the measurements of the test inputs and outputs and to check whether
the requirements of this test module are met. 3. Test object or components documentation provided by the manufacturers including start-up, conditioning and shut-down procedures.
4. Safety instructions for the fuel cell.
5.3 Provisions
Standard local safety precautions for working with the fuels and oxidants used shall be followed. Standard local safety precautions for working with all the chemicals contained by the SOFC and the electrical installations
norms must be respected.
SOFC Performance &
Endurance Test Modules
Version 30 04 2010
19
6 Test Equipment and Setup
This test procedure does not prescribe the type, geometry and size of the single cell. Materials, design, geometry and sizes of the electrolyte,
current collectors and cell will have to be described in the test report (Cf. Appendix A).
To perform this test module will need at least the test set-up and the sensors described or listed below in order to apply and measure the test
inputs and outputs listed in sections 3 and 4.
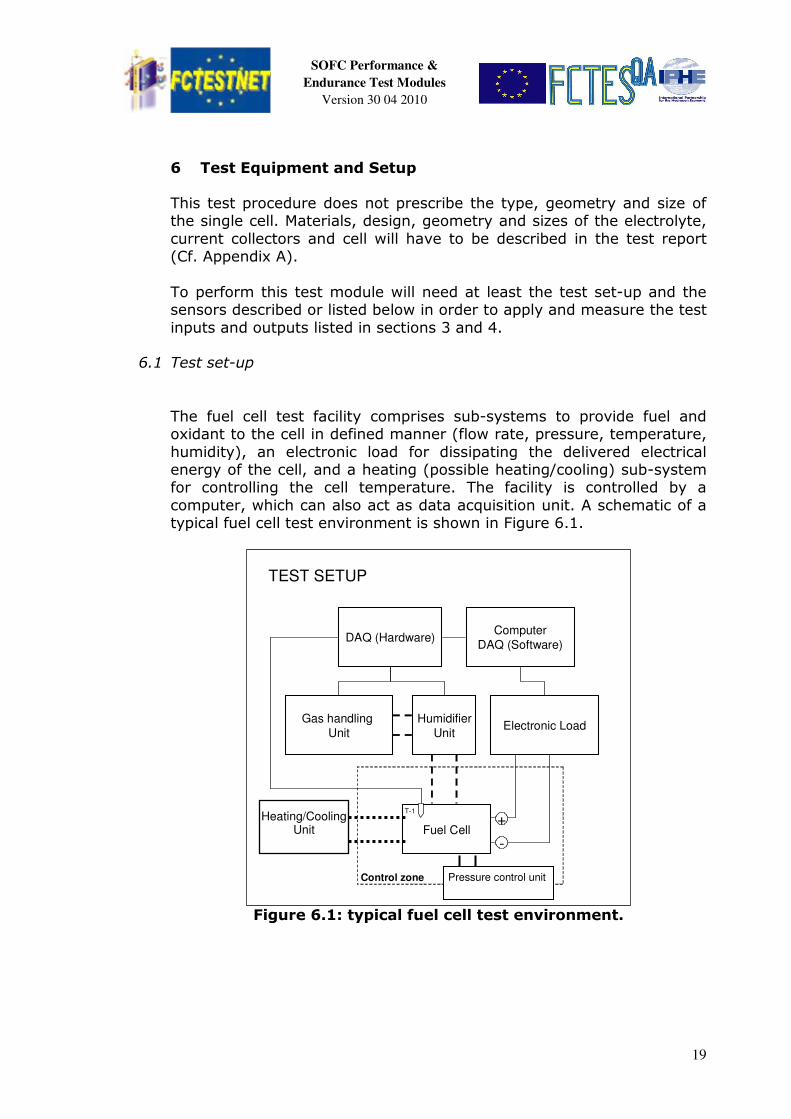
6.1 Test set-up
The fuel cell test facility comprises sub-systems to provide fuel and oxidant to the cell in defined manner (flow rate, pressure, temperature,
humidity), an electronic load for dissipating the delivered electrical energy of the cell, and a heating (possible heating/cooling) sub-system for controlling the cell temperature. The facility is controlled by a
computer, which can also act as data acquisition unit. A schematic of a typical fuel cell test environment is shown in Figure 6.1.
Figure 6.1: typical fuel cell test environment.
Electronic Load
DAQ (Hardware)Computer
DAQ (Software)
Gas handling
Unit
Humidifier
Unit
Fuel Cell+
-
T-1
Control zone
Heating/Cooling Unit
TEST SETUP
Pressure control unit
SOFC Performance &
Endurance Test Modules
Version 30 04 2010
20
6.2 Sensors or control/acquisition equipment needed
The needed test facility equipments are described in the following Table
with main specifications. Table 7: Test equipments and instruments.
Description Specifications Qty
Oxidant Gas back pressure
sensor
Pressure ambient to 4bar for the considered
range of Oxidant flow rates
1
Fuel Gas back pressure
sensor
Pressure ambient to 4bar for the considered
range of Fuel flow rates
1
Oxidant Gas flow meter Flow rates for the considered range of current 1
Fuel Gas flow meter Flow rates for the considered range of current 1
Oxidant Gas humidification
device *
Dew-point temperature from ambient
temperature to 90°C
1*
Fuel Gas humidification
device *
Dew-point temperature from ambient
temperature to 90°C
1*
Cell Temperature sensor Temperature ambient to 1050°C 1
minimum
Cell heating/cooling
devices
Temperature ambient to 1050°C 1
minimum
Electronic Load Max current reachable at 1.2 > U > 0 V -
Possible galvanostatic mode
1
Control and measurement
device (DAQ hardware and
software and computer)
The capacity of the data acquisition system has
to be sufficient to record all test variables with
the sample rates defined
1
* Note 1: one device includes sensors and equipment adapted to the temperature and
relative humidity ranges specified. For example: bubblers + heated lines equipped with
temperature sensors or water flow meters in case of water injection.
SOFC Performance &
Endurance Test Modules
Version 30 04 2010
21
7 Test Programme
Note: Deviations from the following recommended procedure shall be described in the test
report.
The test programme described here consists of three phases.
The first phase comprises the assembly and pre-conditioning of the cell. The degree of specification for this part is limited. Preferably the recommendations of the cell supplier are applied. This phase is concluded
with one polarisation curve measurement, as described in the test module M01, at the selected nominal operating temperature of this test and at the
gas conditions of Table 5ba to 5 bh. The second phase, the performance test, consists of a 20 hours period of
galvanostatic controlled, steady-state operation. This phase is started and concluded with a series of polarisation curve measurements at three or
five temperatures centred on the selected nominal operating temperature of this test. The polarisation curve measurement itself is described in the test module M01.
The third phase is the endurance test. The operating conditions are
identical to those of the performance test. Recommended duration of the endurance test is minimum 3000 hours. At each 500 hours interval during
the endurance test a single polarisation curve measurement is executed, that is only at the selected operating temperature. The endurance test is concluded with a series of polarisation curve
recordings at three or five temperatures, as described in the test module M01.
The test programme is concluded with one polarisation curve measurement, as described in the test module M01, at the selected
nominal operating temperature of this test and at the gas conditions of the Table5ba to 5bh.
7.1 Assembly and pre-conditioning of the cell
The applied mechanical clamping pressure of the cell is according to the
recommendations of the cell manufacturer or according to common practice at the testing organisation.
The start-up of the cell occurs according to the procedure recommended by the cell supplier or by the procedure that is common practice at the
testing organisation.
SOFC Performance &
Endurance Test Modules
Version 30 04 2010
22
The stabilisation of the cell can be part of the start-up procedure. If this is not the case it is recommended to follow either:
a) The recommendation of the cell supplier b) The common practice at the testing organisation
c) Galvanostatic operation of the cell at the selected operating temperature, at the gas conditions of Table 5ba to 5bh, for minimum 2
hours, at a current density of 0.3 A.cm-2. After the start-up and stabilisation of the cell one polarisation curve
measurement, as described in the test module M01, at the selected nominal operating temperature of this test and at the gas conditions of
Table 5ba to 5bh is performed. A second stabilisation period of minimum 2 hours galvanostatic operation
at the selected operating temperature, the gas conditions of 3.2 and a current density of 0.3 A.cm-2 is applied before the next phase starts.
Applied conditions and procedure for start-up and stabilisation should be described in the report of the test result.
7.2 Recording of the initial polarisation curves
After the start-up and stabilisation phase of 7.1, cell polarisation curves
have to be recorded according to the Test Module M01 cell polarisation curve.
The gas conditions as prescribed in Table 5aa to 5ah are constant during all phases of the polarisation curve measurements.
It is recommended to perform polarisation curve measurements at minimum three operating temperatures, preferably five, each differing
50°C. In that case the first polarisation measurement is at the selected operating temperature.
After completion of the first polarisation curve measurement the cell is brought to the nearest lower temperature. The new temperature is
reached if the actual registered cell temperature is within the interval ± 10°C of this new target temperature for 10 minutes. From that moment
on, the performance stabilisation period starts. At the new operating temperature, a performance stabilisation period of 2
hours at 0.3 A.cm-2 and at the gas conditions of table 5aa to 5ah is applied, after which the next procedure for recording the polarisation
curve as described in the test module M01 is executed. The consecutive phases of stabilisation and polarisation curve
measurement are repeated at the next 50°C lower temperature.
SOFC Performance &
Endurance Test Modules
Version 30 04 2010
23
After the polarisation measurement has been performed at the lowest temperature in the range, the temperature is ramped up to a temperature
50°C higher compared to the one of the first polarisation curve measurement. After the prescribed stabilisation procedure the polarisation
curve is recorded.
The next polarisation curve measurement will be at a 50°C higher temperature.
Example
Suppose the selected temperature for steady-state operation in this test is 750°C, then the temperature sequence at which the polarisation measurements are executed is:
− 750-700-650-800-850°C (in case of selecting five temperatures for polarisation measurements)
or − 750-700-800°C (in case of selecting three temperatures for polarisation measurements).
7.3 Steady-state operation for performance evaluation
This test phase starts immediately after completion of the polarisation
recordings described in 7.2. The performance test is under galvanostatic control at the selected
operating temperature, and the gas conditions and current density of Table 5aa to 5ah.
The duration of the steady-state operation is 20 hours.
7.4 Recording of the second series of polarisation curves
This series of polarisation curves make-up the conclusion of the short-term performance test, and the start of the long-term endurance test.
The measurement procedure for recording the second series of polarisation curves is exactly identical to the initial series described in 7.2.
7.5 Steady-state operation for endurance evaluation
This test phase starts immediately after completion of the polarisation recordings described in 7.4.
The performance test is under galvanostatic control at the selected
operating temperature, and the gas conditions and current density of Table 5aa to 5ah.
SOFC Performance &
Endurance Test Modules
Version 30 04 2010
24
The duration of the steady-state operation is minimum 3000 hours.
Every 500 hours a single polarisation curve, only at the selected operating temperature, is recorded according to the procedure described in the test
module M01 and at the gas conditions prescribed by Table 5aa to 5ah in this procedure.
7.6 Recording of the last series of polarisation curves
This series of polarisation curves make-up the conclusion of the long-term endurance test.
The measurement procedure for recording the last series of polarisation curves is exactly identical to the initial series described in 7.2.
A final stabilisation period of minimum 2 hours galvanostatic operation at
the selected operating temperature, the gas conditions of Tables 5ba to 5bh and a current density of 0.3 A.cm-2 is applied before the programme is ended.
One final polarisation curve measurement, as described in the test
module M01, at the selected nominal operating temperature of this test and at the gas conditions of Table 5aa to 5ah is performed.
The most important factor, regardless of conditioning procedure, is that the cell voltage be stable before the actual measurement step starts. A
stability criterion can be defined based on the deviation of the fuel cell voltage measured over a fixed period of time. It is recommended that the
variations in the cell voltage be lower than +/- 5 mV during the last hour before ending the conditioning step.
Ending criteria: for all the measurement methods, the test must be ended when the maximum current density is reached or if the cell voltage
goes below a pre-defined minimum voltage. It is recommended to use a minimum voltage of 0.6 V if the measurements should be repeated e.g. during a long term measurement; for research purposes e.g. testing
diffusion and water transport processes a minimum voltage not lower than 0.5 V is recommended to avoid irreversible damage of the cell
components.
SOFC Performance &
Endurance Test Modules
Version 30 04 2010
25
Appendix A. SOFC single cell test report (template)
1 General information
1.1 General information on the test report
Test report reference/identification
Test report title
Authors
1.2 General information concerning the test
Test module number Test date
Test version Company performing
test
Company requesting test Test location
Test Request Nr Test cell/equipment
2 Introduction and test planning
Here the authors should refer to
• the procedure applied and if relevant explain the choice of this procedure.
• the test plan between tester and customer which may also include acceptance criteria
• any other documentation used in the report or in the test (terminology document, symbols
harmonization, etc.)
For example:
The aim of this document is to provide a polarisation curve of the FCTESQA single cell using the
FCTESQA procedure TM SOFC 05-HD version…
3 Objective and scope of the test
The objective is to determine the polarization curve of a SOFC single cell operating under specified
operating conditions.
Here the authors should present further objectives and the scope of this test.
For example:
The test aims to qualify
...the generic performance of a solid oxide fuel cell single cell
...SOFC components such as YSZ electrolyte or current collectors or other sub-component materials or
design.
The operating conditions considered for this test correspond to
...the current conditions used by the members of the fuel cell community
...the application considered...
SOFC Performance &
Endurance Test Modules
Version 30 04 2010
26
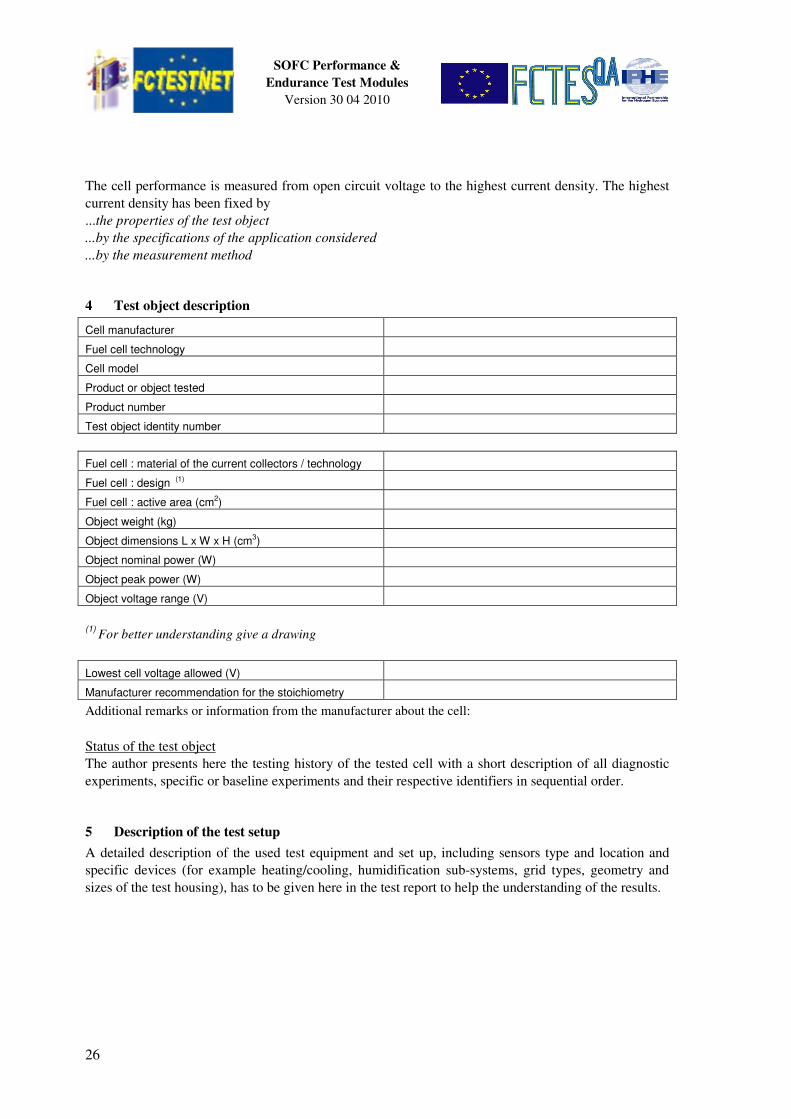
The cell performance is measured from open circuit voltage to the highest current density. The highest
current density has been fixed by
...the properties of the test object
...by the specifications of the application considered
...by the measurement method
4 Test object description
Cell manufacturer
Fuel cell technology
Cell model
Product or object tested
Product number
Test object identity number
Fuel cell : material of the current collectors / technology
Fuel cell : design (1)
Fuel cell : active area (cm2)
Object weight (kg)
Object dimensions L x W x H (cm3)
Object nominal power (W)
Object peak power (W)
Object voltage range (V)
(1)
For better understanding give a drawing
Lowest cell voltage allowed (V)
Manufacturer recommendation for the stoichiometry
Additional remarks or information from the manufacturer about the cell:
Status of the test object
The author presents here the testing history of the tested cell with a short description of all diagnostic
experiments, specific or baseline experiments and their respective identifiers in sequential order.
5 Description of the test setup
A detailed description of the used test equipment and set up, including sensors type and location and
specific devices (for example heating/cooling, humidification sub-systems, grid types, geometry and
sizes of the test housing), has to be given here in the test report to help the understanding of the results.
SOFC Performance &
Endurance Test Modules
Version 30 04 2010
27
6 Description of the operating conditions, inputs and outputs
In the following tables, “?” has to be changed by the values corresponding to the experimentation.
6.1 Test inputs and operating conditions
In tables below are listed all the test inputs and the operating conditions that have been controlled
during this test, with the measurement uncertainties and the sample rates.
Input Description Range/Value
(unit)
Measurement
uncertainty
Control
accuracy
Sample
rate (Hz)
i Current density (i= applied
current / active geometric
area)
(A/cm2) ± ?% for i < ?
A/cm²
± ?% for i > ?
A/cm²
± ?% for i < ?
A/cm²
± ?% for i > ?
A/cm²
Tc Cell temperature (°C) ± ?oC ± ?oC
Xfuel Fuel composition %H2; % other
gases
+?% / -?% +?% / -?% -
Xox Oxidant composition Air or O2; % other
gases
+?% / -?% +?% / -?% -
Pox Oxidant pressure at cell inlet
or outlet port
(kPa) ± ?% ± ?%
Pfuel Fuel back pressure at cell
inlet or outlet port
(kPa) ± ?% ± ?%
Qfuel Fuel flow rate (NTP) max (Qfuel,min) or
constant value
(Nl/min)
± ? % ± ? %
Qox Oxidant flow rate (NTP) max (Qox,min) or
constant value
(Nl/min)
± ? % ± ? %
T ox Oxidant dew point (°C) ± ?oC ± ?oC
T fuel Fuel dew point (°C) ± ?oC ± ?oC
Tb ox Oxidant bubbler temperature (°C) ± ?oC ± ?oC
Tb fuel Fuel bubbler temperature (°C) ± ?oC ± ?oC
Tl ox Oxidant line temperature (°C) ± ?oC ± ?oC
Tl fuel Fuel line temperature (°C) ± ?oC ± ?oC
Note: The method to humidify the reactants is not imposed by the test module. However, they have to be described in the
test report as the corresponding inputs (for example the temperatures of the water and of the lines in the case of bubblers
or the water flow rates in the case of injectors) – The dew points should also be given in the test report .
6.2 Test Outputs
Output Description Range/Value (unit) Measurement
uncertainty
Sample rate
(Hz)
V Cell voltage ? V ± ? mV ? Hz
P Cell power ? W Calculated
SOFC Performance &
Endurance Test Modules
Version 30 04 2010
28
7 Test procedure and results
7.1 Description of the start-up and pre-conditioning steps
o Detailed description of the setting of the conditions
o Measurements (description, tables or graphs giving the inputs and the outputs during these
steps)
o Applied clamping force
Table: Cell performance before the measurement step
hold time (sec.) Average current density
(A/cm²)
Average cell voltage over
the last XX sec. (V)
Average cell power over
the last XX sec. (W)
…… ± σ …… ± σ …… ± σ
Graphs: main test inputs and outputs versus time during start-up and conditioning should be included
here, in order to help the understanding of the main results.
For the polarisation curve: i, V, Tc, pox, pfuel, = f (time)
7.2 Description of the measurement step and results:
o Setting the test conditions (initial test inputs) if an additional step is performed after the
conditioning step and before setting the conditions for starting the test.
o Cause of the ending of the measurement step
o Measurements (description, tables or graphs giving the inputs and the outputs during the
measurement) (ex: table with hold time, current density, voltage and power for the
polarization curve)
Table: Functional performance during the polarisation steps
hold time
(sec)
Average current density
(A/cm²)
Average cell voltage over the last
XX sec (V)
Average cell power over the last
XX sec. (W)
…… ± σ …… ± σ …… ± σ
SOFC Performance &
Endurance Test Modules
Version 30 04 2010
29
The polarisation data should be presented by both:
• A two-dimensional graph with the current density on the abscissa (x-axis) and the cell voltage
and the cell inlet temperature on the ordinate (y-axis). In case a reverse scan is done, the
forward and backward scan should be plotted in the same graph.
• The following numeric data (see example table below):
- The open circuit voltage (OCV), i.e. the cell voltage at a current density of zero.
- The current density at 0.7 and 0.8 Volt.
- The Area Specific cell Resistance (ASR) which is defined by dV/di at 0.8 V and is
determined from the slope of the best fitting line over the measurement data within and
including the interval 0.75 - 0.85 V.
Performance test:
• Graph representing the cell voltage versus the operating time
• Table representing the OCV, the current density at 0.7 V and the ASR recorded by or
calculated from the polarisation curve measurements at all T and t.
Endurance test:
• Graph representing the cell voltage versus the operating time
• Table representing the OCV, the current density at 0.7 V and the ASR recorded by or
calculated from the polarisation curve measurements at all T and t.
7.3 Description of the shut-down (if relevant)
The author describes the procedure how the cell has been shut down (if relevant).
7.4 Deviations from the procedure
The author describes the deviations from the procedure (if relevant).
8 Data Post Processing
Optional if any further processing of the data was performed.
9 Conclusion and acceptance criteria
Here the results of the test have to be commented considering the objective of the test and the
acceptance criteria when they have been defined.
Acknowledgements
This report is part of the efforts made by and the result of the support of many individuals
and organisations from the participating members of FCTESTNET and FCTESQA
.
The editors of this report together with the Energy Research Centre of Netherlands (ECN)
and the Joint Research Centre (JRC) of the European Commission would like to express
their gratitude to the partners of both projects that have greatly contributed to the
development of the testing procedure under the FCTESTNET thematic network and to the
review of the procedure.
The funding by FP5 under contract # ENK5-CT-2002-20657 for FCTESTNET and by FP6
under contract # 020161 for FCTESQA
is appreciated by the project partners.
European Commission
EUR xxxxx EN – Joint Research Centre – Institute for Energy
Title: SOFC Single Cell Performance and Endurance Test Modules.
Version 30 04 2010.
Author(s): G De Marco, A Pilenga, M Honselaar, T Malkow, G Tsotridis, A Janssen, B
Rietveld.
Luxembourg: Office for Official Publications of the European Union
2010 – 42 pp. – 21 x 29.7 cm
EUR – Scientific and Technical Research series – ISSN xxxx-xxxx
ISBN xxx-xx-xx-xxxxx-x
DOI xx.xxxx/xxxxx
Abstract
This report contains the following SOFC Performance and Endurance Test Modules