Software Architecture Metrics Hany Ammar, Mark Shereshevsky, Ali Mili, Hany Ammar, Mark Shereshevsky, Ali Mili, Walid Rabie and Nicholay Gradetsky Walid Rabie and Nicholay Gradetsky Lane Department of Computer Science & Electrical Engineering [email protected]; (smark, amili, rabie, grani)@csee.wvu.edu
Transcript
Software Architecture Metrics
Hany Ammar, Mark Shereshevsky, Ali Mili,Hany Ammar, Mark Shereshevsky, Ali Mili,Walid Rabie and Nicholay GradetskyWalid Rabie and Nicholay Gradetsky
Project OverviewHub Control Software (HCS) case studyDefinition of the entropy based metrics Definition of the Quantitative FactorsInformational Integrity Coefficient (IIC)Conclusions (achievements)Papers submitted Work In Progress
Future work (2nd year plans)
Project Overview
Developing a class of architectural metrics that quantify information flow in the architecture. Different metrics reflect:
Coupling vs. cohesion; Data flow vs. control flow; Static measurement vs. dynamic measurement;
Introducing a group of quantitative factors: mathematically defined functions, that are relevant with respect to qualitative attributes of the architectureEstablishing analytical relationship between the metrics and the quantitative factors Automating computation of the metrics
Product Artifacts Architecture,
Design, Code,
External Attributes: Maintainability,Testability,
Reliability,
Computable Metrics: Coupling, cohesion,
complexity, etc.
Error Propagation, ChangePropagation,
Requirements Propagation
impacts
computed for
Analytical Definitions
Mathematical Formula
have
have
Historical Data
Measurement Values
produce
ValidationAnalytical
Derivations
Quantified
•McCall's model of software quality [McCall 1977],
Three-level hierarchy of software attributes
Project Overview
Project Overview McCall's model of software quality in UML
Dynamic(running actual instances of the architecture)
Control Entropy of set of methods, with statically computedprobabilities
Entropy of set of methods, with dynamically computedprobabilities
Data Entropy of set of parameter values, with statically computedprobabilities
Entropy of set of parameter values, with dynamically computedprobabilities
HCS case study :ITCS Dynamic Control Matrix
Scitcs Fritcs Pfmc mt pfmc lt lritcs ppa mon
Scitcs 3.31911948 1 1.5637897 1.19243058
Fritcs 1.53948476 3.65269014 0 0
Pfmc mt 0.73206669 1.46234979 1.9132505 0
pfmc lt 0.80580491 1.48343604 0 1.93555927
lritcs
ppa mon
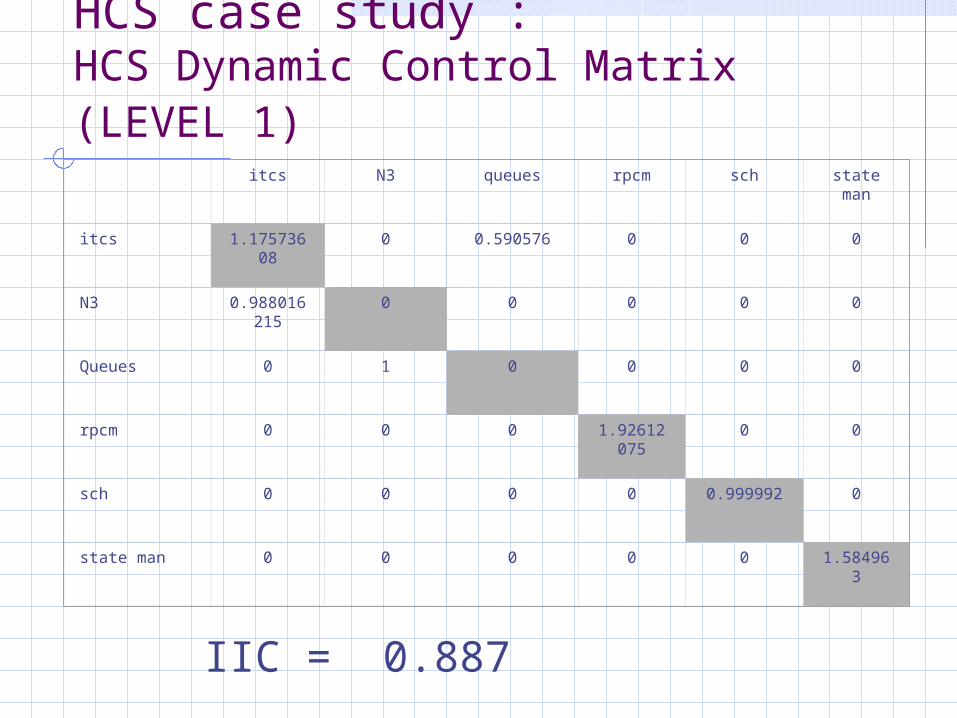
HCS case study : HCS Dynamic Control Matrix (LEVEL 1)
itcs N3 queues rpcm sch state man
itcs 1.17573608 0 0.590576 0 0 0
N3 0.988016215
0 0 0 0 0
Queues 0 1 0 0 0 0
rpcm 0 0 0 1.92612075 0 0
sch 0 0 0 0 0.999992 0
state man 0 0 0 0 0 1.584963
Definition of the Quantitative Factors
Quantitative Factors bridge the gap between qualitative attributes (which we want to assess) and computable metrics (which we can measure).
Some Quantitative Factors:• Error Propagation• Change Propagation• Requirements propagation
Definition of the Quantitative Factors: error propagation
B(x) is the state of B resulting from invoking B on input x. Suppose, due to a fault in A, the information transmitted from A to B is corrupted from the expected x to some erroneous x`.
The error propagation (EP) is a measure of the likelihood that an error in the message sent by A will propagate into B.
S
X
A B
xx` x` xOR
Error
Definition of the Quantitative Factors: error propagation
Continued
Definition 2:Error Propagation:The error propagation from A to B is defined as the following conditional probability:
Definition of the Quantitative Factors: error propagation
Continued
• From the analysis of the above equation: The higher the coupling from A to B – the higher is the
error propagation from A to B. The lower the cohesion of component B – the higher is
the error propagation from A to B.
• These observations, consistent with intuition, provide an analytical validation of our metrics. Our equation gives these relationships (which are not surprising by themselves) precise analytical form.
Informational Integrity Coefficient (IIC)
One of architecture quality guidelines is to maximize cohesion and minimize coupling of components.
We introduce a quantitative characteristic, which we call the informational integrity coefficient of an architecture which assesses its conformance to this guideline.
The coefficient is computed based on the information flow matrix.
IIC =
d
i
d
j
ij
d
i
ii
c
c
1 1
2
1
2
HCS case study :HCS-ITCS (flattened) Static Control Matrix
HCS case study : HCS Dynamic Control Matrix (LEVEL 1)
itcs N3 queues rpcm sch state man
itcs 1.17573608 0 0.590576 0 0 0
N3 0.988016215
0 0 0 0 0
Queues 0 1 0 0 0 0
rpcm 0 0 0 1.92612075 0 0
sch 0 0 0 0 0.999992 0
state man 0 0 0 0 0 1.584963
IIC = 0.887
HCS case study : IIC ComparisonFlattened Architecture Vs Hierarchical Architecture
Architecture Static Dynamic
HCS-ITCS (flattened) 0.749 0.773
HCS_ITCS (Level 1) 0.861 0.887
ITCS (Level 0) 0. 795 0.844
N3 (Level 0) 1 1
Queues (Level 0) 1 1
The flattened architecture shows a lower IIC than the hierarchical architecture, this proves that the hierarchical architecture is more cohesive and less coupled
Conclusions (achievements)
We defined coupling and cohesion metrics for hierarchical architectures based on the information theory. We introduced a normalized measure, the informational integrity coefficient (IIC) of an architecture based on the computed metricsWe derived the relationship between the coupling/cohesion metrics and the error propagation factor between components.
Papers submittedConferences
Annual International Computer Software and Applications Conference (COMPSAC 2001)Title: "Information-Theoretic Metrics for Software Architectures“– Status: Accepted for publicationAutomated Software Engineering Conference (ASE 2001) Title: "Quantifying Architectural Attributes of UML Specifications: A Framework and Its Automation" – Status: Submitted June 29, 2001
JournalsAutomated Software Engineering JournalTitle: "Quantifying Software Architectures: Definitions and Automation Plans“ – Status: submitted: May 11, 2001Transactions on Software Engineering JournalTitle: "Information Theoretic Metrics for Software Architectures" – Status: submitted: April, 2001
Future Work
Deriving a relationship between our coupling/cohesion metrics and the change propagation,Developing an automation methodology for computing the metrics given a UML description of the architecture,Validating the metrics using a NASA CASE Study