Software Performance Analysis UsingCodeAnalyst for Windows
Sherry HurwitzSW Applications [email protected] Micro Devices
Lei YuMember Technical [email protected] Micro Devices
Session OutlineSession Outline
Exploiting Performance OpportunitiesObvious Performance Potential
Hidden Performance Potential
Exposing Untapped Performance Potential
Analyzing Performance Improvement Trials
AMD CodeAnalyst Performance Analysis ToolCapabilities of CodeAnalyst
Functionality of CodeAnalyst
Profile Capabilities
Thread Analysis
Pipeline Simulation
Obvious Performance PotentialObvious Performance Potential
Processor Architecturex64 Processors
Extended Memory Addressing
Additional Registers
Deeper Execution Pipeline
Multi-Core ProcessorsMultiprocessing for the desktop system
Multiple processor platforms
64-bit Windows® operating systems
Compiler optimization switches
Optimized libraries (for example AMD ACML)
Hidden Performance PotentialHidden Performance Potential
Efficient algorithms
Cache friendly memory access
Branch Prediction friendly conditionals
Parallel work through Threads
Object Synchronization
Expose Untapped Performance PotentialExpose Untapped Performance Potential
Profile your application with the AMD CodeAnalyst Performance Analyzer
Timer-based sampling - identify time consuming or frequently executed code possibly pointing to algorithm issues (Hot Spots)
Opteron and Athlon 64 processor performance events - evaluate the applications use of architectural features
Thread View - evaluate effective use of multiple processors
Pipeline Simulation - understand how data dependencies can stall the processor execution
Iterate - between profiling and code modifications testing if there are performance benefits
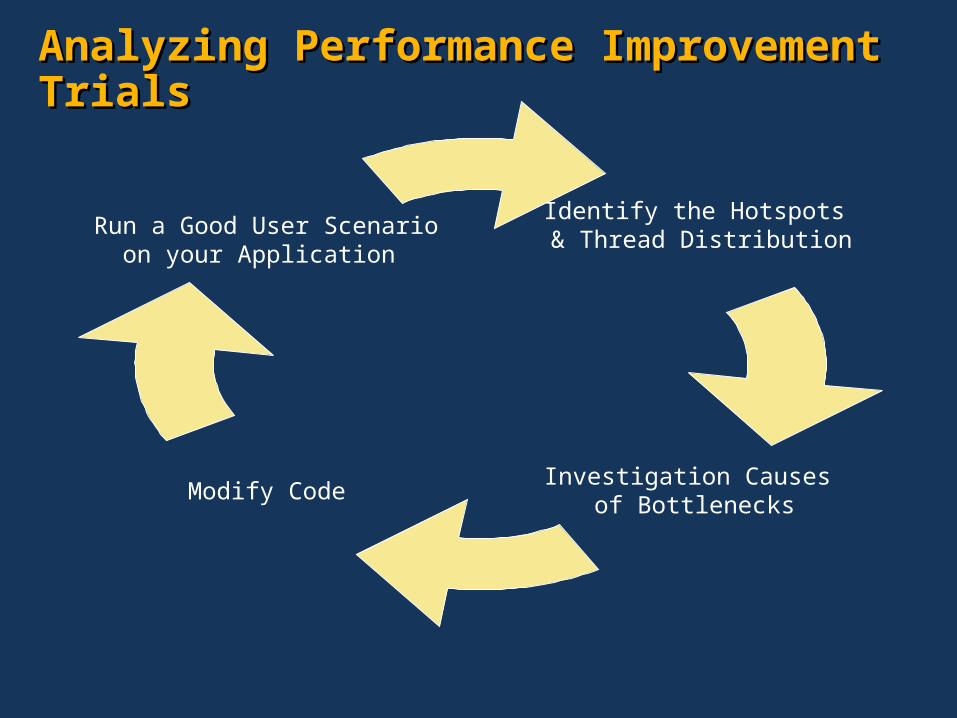
Analyzing Performance Improvement TrialsAnalyzing Performance Improvement Trials
Identify the Hotspots & Thread Distribution
Investigation Causes of Bottlenecks
Modify Code
Run a Good User Scenarioon your Application
Capabilities of AMD CodeAnalyst Capabilities of AMD CodeAnalyst
CodeAnalyst CAN:Assist in optimizing your application
Identify program bottlenecks
Monitor and Analyze software performance
CodeAnalyst CANNOT:Identify defects in your program
(Profile a functioning stable application.)
CodeAnalyst RUNS ON:Windows: WinNT, Win2K , WinXP, 64-bit Windows® operating systems
Key Functionality of AMD CodeAnalystKey Functionality of AMD CodeAnalyst
ProfilingTimer-based sampling
Event-based sampling
Thread analysis
Execution Pipeline Simulation
Profile CapabilitiesProfile Capabilities
Low overhead system-wide profile
Timer-based profile: 0.1 ms resolution on APIC enabled systems
1.0ms resolution on APIC disabled systems
Event-based profile:32 AMD Athlon™ and AMD Athlon™ XP performance events
78 AMD Opteron™ and AMD Athlon™ 64 performance events
Simultaneously profile up to 4 user selected performance events.
Profiles multiple processor systems up to 16 processor cores
Profile AnalysisProfile Analysis
Identifies all active Process Names, Process IDs, Thread IDs
Identifies the Process CPU affinity
Identifies performance event per CPU
Maps sample addresses to Process, Module, Function, Source Line, Assembly Instruction, Code Byte
Hierarchical Navigation of Data Views Hierarchical Navigation of Data Views
System Data View
System Graph View
Module Data View
Module Graph View
Source View
Disassembly View
Demo will show the details of each of these views and the navigation between the views.
Timer-based Profiling - the First Level of AnalysisTimer-based Profiling - the First Level of Analysis
Exposes areas of intense activity
Identifies the most likely suspects
Provides a sample distribution chart
Ability to drill down through several data views
View the source code on and around the sample
Algorithmic issues may be evident from the hot spot code
Hot spot code might suggest particular events to profile in next level of Analysis
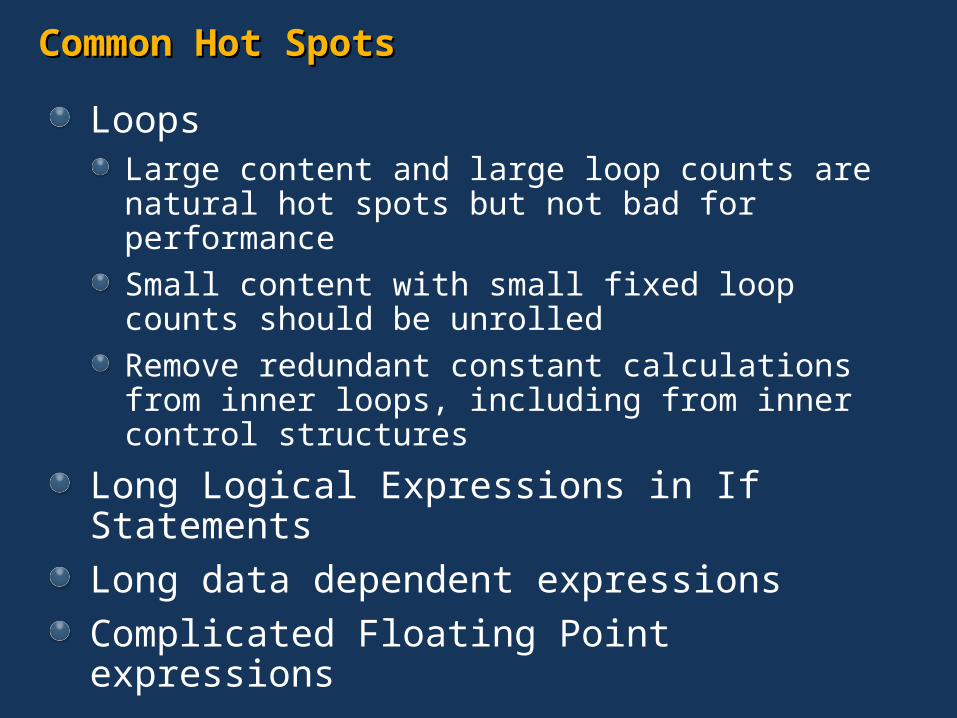
Common Hot SpotsCommon Hot Spots
Loops Large content and large loop counts are natural hot spots but not bad for performance
Small content with small fixed loop counts should be unrolled
Remove redundant constant calculations from inner loops, including from inner control structures
Long Logical Expressions in If Statements
Long data dependent expressions
Complicated Floating Point expressions
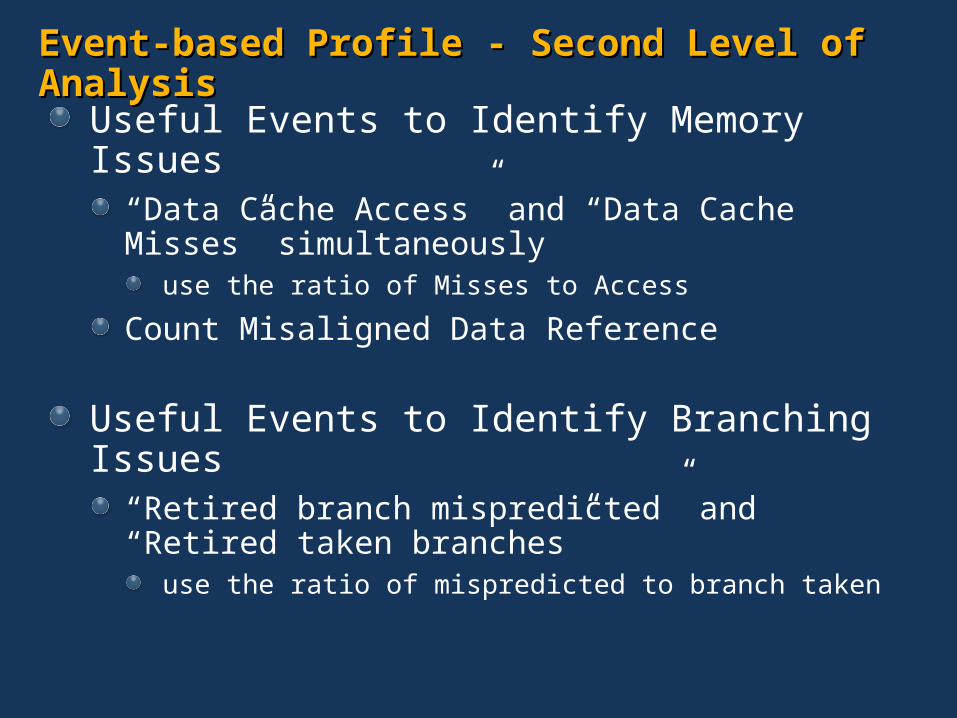
Event-based Profile - Second Level of AnalysisEvent-based Profile - Second Level of Analysis
Useful Events to Identify Memory Issues“Data Cache Access” and “Data Cache Misses” simultaneously
use the ratio of Misses to Access
Count Misaligned Data Reference
Useful Events to Identify Branching Issues“Retired branch mispredicted” and “Retired taken branches”
use the ratio of mispredicted to branch taken
Examples of Memory IssuesExamples of Memory Issues
Large data structures with variable size members not sorted by size
Use of pointer notation in manipulating large data arrays
Dereferenced pointer arguments inside a function
Large declarations of local variables declared randomly with respect to size
Memory buffers shared between threads
Examples of Branch Prediction IssuesExamples of Branch Prediction Issues
Order of the expressions in compound branch conditions
Order of operands in Logical expressions
Large switch statements with noncontiguous expressions
Large switch statements cases out of order in respect to probability
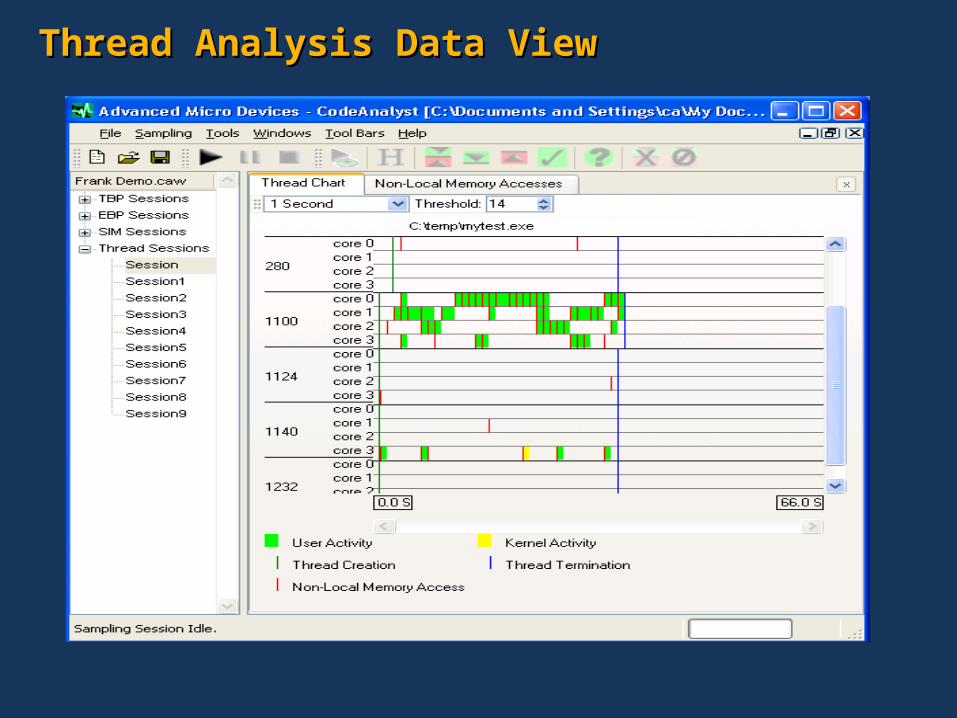
Thread AnalysisThread Analysis
Identities threads in the target application.
Shows Thread creation and termination
Monitors CPU affinity of each thread
Identifies Non-local memory access
Graphs thread activity on each CPU
Thread Analysis Data ViewThread Analysis Data View
Pipeline Simulation CapabilitiesPipeline Simulation Capabilities
CodeAnalyst can simulate a user specified block of code on AMD microprocessors and provide cycle-precise execution info.
Requirement:
Defining a code block to simulate, requires the user to provide debug info for the target module.
Limitation:
Cannot simulate instructions inside system space
Cannot simulate multi-thread
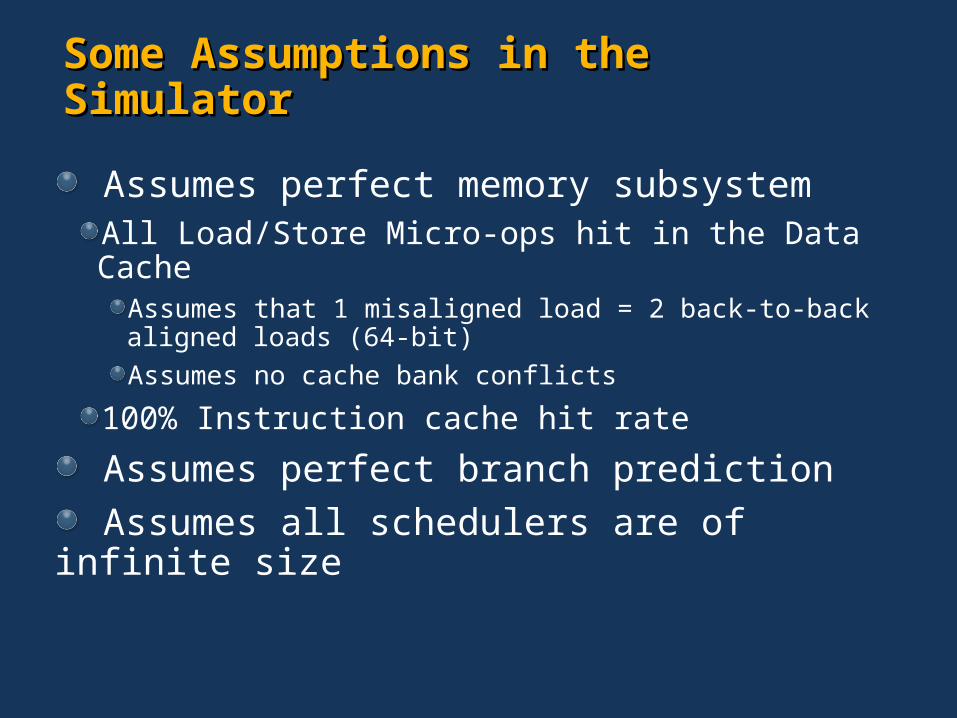
Some Assumptions in the SimulatorSome Assumptions in the Simulator
Assumes perfect memory subsystemAll Load/Store Micro-ops hit in the Data Cache
Assumes that 1 misaligned load = 2 back-to-back aligned loads (64-bit)
Assumes no cache bank conflicts
100% Instruction cache hit rate
Assumes perfect branch prediction
Assumes all schedulers are of infinite size
Pipeline Data ViewPipeline Data View
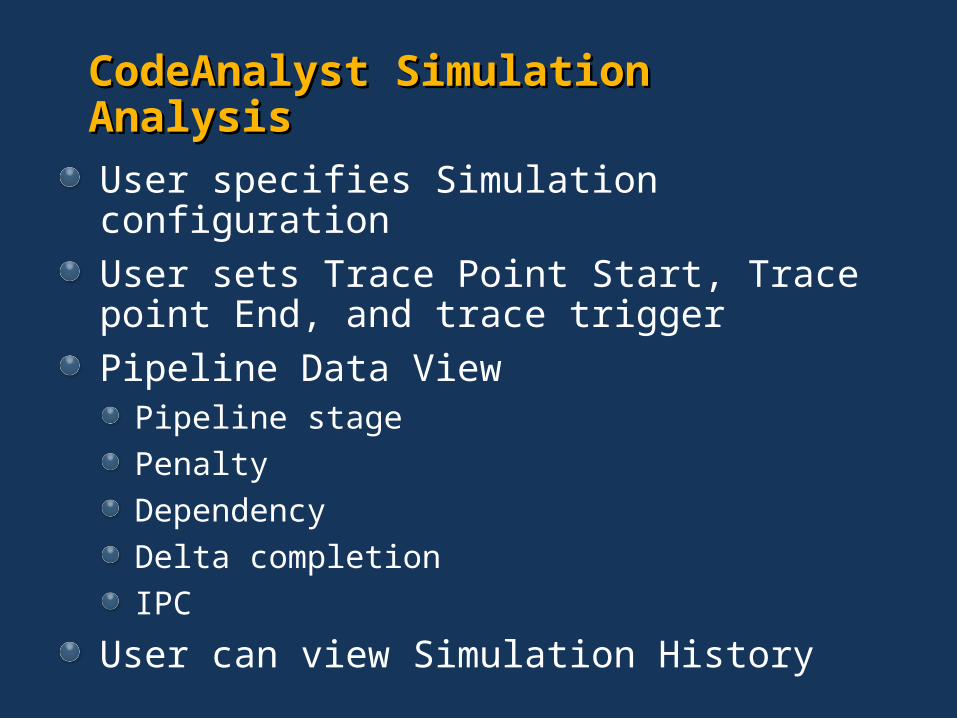
CodeAnalyst Simulation AnalysisCodeAnalyst Simulation Analysis
User specifies Simulation configuration
User sets Trace Point Start, Trace point End, and trace trigger
Pipeline Data ViewPipeline stage
Penalty
Dependency
Delta completion
IPC
User can view Simulation History
Call to ActionCall to Action
Download CodeAnalyst
Improve Your Software!
Additional ResourcesAdditional Resources
Web Resources at: http://www.developwithamd.com
Download CodeAnalyst Software Optimization Guide for AMD Athlon 64 and AMD Opteron AMD64 Architecture Programmer's Manual Volume 1: Application ProgrammingAMD64 Architecture Programmer's Manual Volume 2: System ProgrammingAMD64 Architecture Programmer's Manual Volume 3: General-Purpose and System InstructionsAMD64 Architecture Programmer's Manual Volume 4: 128-Bit Media InstructionsAMD64 Architecture Programmer's Manual Volume 5: 64-Bit Media and x87 Floating-Point Instructions
http://www.devx.comOptimizing Your C/C++ Applications, Part 1 & 2
Whitepapers:Porting and Optimizing Applications on 64-bit Windows for AMD64 Architecture, Winhec 2004 paper by Mike Wall