Software Process Measurement and Control A Measurement-Based Point of View of Software Processes Reiner Dumke, René Braungarten, Martina Blazey, Heike Hegewald, Daniel Reitz, Karsten Richter Otto-von-Guericke-Universität Magdeburg, Institut für Verteilte Systeme http://ivs.cs.uni-magdeburg.de/sw-eng/agruppe/ Contents 1 Software Process Descriptions ……..…………………………..…………………… 2 1.1 Software Process Modelling…… ………………………………………………………………....…. 2 1.2 The Process Formalization Approach by Wang and King …………….…………………………..… 6 1.3 The Business Process Modelling Notation (BPMN) ………………………...……………………… 9 1.4 Formal Characterization of Software Processes by Dumke, Schmietendorf and Zuse ……………... 11 2 Process Improvement and Evaluation Approaches ………………………………. 18 2.1 General Maturity Models ……………………………………………………………………………… 19 2.2 The CMMI Approach ……………………………………………………………………………..….. 20 2.3 The SPICE Approach…………………………………….…………………..…….…………………. 24 2.4 The Six Sigma Approach …………………………………………………………………………….. 25 2.5 The ITIL Approach …………………………………………………………………………………… 26 3 Process-Oriented Software Measurement ……..…..……………………………… 30 3.1 Software Process Indicators and Criteria ……………………………………………….………….… 31 3.2 Software Process Laws ………………………………………………….………………………….... 33 3.3 Software Process Principles and Rules ……………………………………………………………… 34 3.4 Software Process Rules of Thumb …………………………………………………………………… 43 3.5 Software Process Experiments ………………………………………………………………………. 44 3.6 Software Process Case Studies ………………………………………………………………………. 47 3.7 Software Process Metrics and Measures ………………………………………………………….…. 48 3.8 Process Metrics Repositories …………………………………………………………………………. 53 4 Holistic Process Measurement Approaches …………………………………….…. 58 4.1 The Metrics Set by Kupka and Johnson ………………………………………………………….…… 58 4.2 Statistical Software Process (SPC) by Pandian ………………………………………..……….... 64 4.3 Statistical Process Control by Florac and Carleton ………………………………...………………... 67 5 Open Questions and Future Directions ……………………………………….…… 68 6 References ………………………………………………………………………….… 70 Abstract The following preprint characterizes the area of software processes considering their modelling, formalization, evaluation and measurement. It describes the existing experiences (rules of thumb, laws, principles etc.) and metrics concept with the software management literature in background. Some essential results and open problems are discussed and defined as basis for future investigations in process measurement and evaluation. 1
Transcript
Software Process Measurement and Control
A Measurement-Based Point of View of Software Processes
Reiner Dumke, René Braungarten, Martina Blazey, Heike Hegewald, Daniel Reitz, Karsten Richter
Otto-von-Guericke-Universität Magdeburg, Institut für Verteilte Systeme
http://ivs.cs.uni-magdeburg.de/sw-eng/agruppe/ Contents 1 Software Process Descriptions ……..…………………………..…………………… 2 1.1 Software Process Modelling…… ………………………………………………………………....…. 2 1.2 The Process Formalization Approach by Wang and King …………….…………………………..… 6 1.3 The Business Process Modelling Notation (BPMN) ………………………...……………………… 9 1.4 Formal Characterization of Software Processes by Dumke, Schmietendorf and Zuse ……………... 11 2 Process Improvement and Evaluation Approaches ………………………………. 18 2.1 General Maturity Models ……………………………………………………………………………… 19 2.2 The CMMI Approach ……………………………………………………………………………..….. 20 2.3 The SPICE Approach…………………………………….…………………..…….…………………. 24 2.4 The Six Sigma Approach …………………………………………………………………………….. 25 2.5 The ITIL Approach …………………………………………………………………………………… 26 3 Process-Oriented Software Measurement ……..…..……………………………… 30 3.1 Software Process Indicators and Criteria ……………………………………………….………….… 31 3.2 Software Process Laws ………………………………………………….………………………….... 33 3.3 Software Process Principles and Rules ……………………………………………………………… 34 3.4 Software Process Rules of Thumb …………………………………………………………………… 43 3.5 Software Process Experiments ………………………………………………………………………. 44 3.6 Software Process Case Studies ………………………………………………………………………. 47 3.7 Software Process Metrics and Measures ………………………………………………………….…. 48 3.8 Process Metrics Repositories …………………………………………………………………………. 53 4 Holistic Process Measurement Approaches …………………………………….…. 58 4.1 The Metrics Set by Kupka and Johnson ………………………………………………………….…… 58 4.2 Statistical Software Process (SPC) by Pandian ………………………………………..……….... 64 4.3 Statistical Process Control by Florac and Carleton ………………………………...………………... 67 5 Open Questions and Future Directions ……………………………………….…… 68 6 References ………………………………………………………………………….… 70
Abstract The following preprint characterizes the area of software processes considering their modelling, formalization, evaluation and measurement. It describes the existing experiences (rules of thumb, laws, principles etc.) and metrics concept with the software management literature in background. Some essential results and open problems are discussed and defined as basis for future investigations in process measurement and evaluation.
1
1 Software Process Descriptions 1.1 Software Process Modelling The software process is one of the central components in the software engineering field of research, practice and application. Especially, the managerial foundations play an essential role in the nature of software processes. The following figure 1 shows some categories of managerial foundations of software engineering defined by Wang ([Wang 2000], see also [Boehm 2000b] and [Royce 2005]). Figure 1: Managerial foundations of software engineering
In following we will give some definitions in order to clarify the management and controlling background of the software processes considered in this preprint. The first (basic) definition of software processes was presented by Wang [Wang 2000] and characterizes the general software engineering process.
“The software engineering process is a set of sequential practices that are functionally coherent and reusable for software engineering organization, implementation, and management. It is usually referred to as the software process, or simply the process.”
An appropriate method for software process handling consists of creating and applying process models. Different implications for this kind of abstraction are shown in the following figure 2 based on [Deek 2005].
Figure 2: Context diagram for software process models
2
Software engineering processes exist in different kinds of context such as different technologies or systems like multimedia software engineering [Chang 2000] or Web engineering [Dumke 2003]. Software processes include a set of involvements which forms the special characteristics and directions of such operationalities. Therefore, we will use some appropriate definitions by Wang and King [Wang 2000].
“A practice is an activity or a state in a software engineering process that carries out a specific task of the process.” “A process is a set of sequential practices (or base process activities (BPAs)) which are functionally coherent and reusable for software project organization, implementation, and management.” “A process category is a set of processes that are functionally coherent and reusable in an aspect of software engineering.” “A process subsystem is a set of process categories that are functionally coherent and reusable in a main part of software engineering. “A process system is an entire set of structured software processes described by a process model.”
Considering the different process domains, we can establish the following kinds of processes cited from [Wang 2000].
“A domain of a process model is a set of ranges of functional coverage that a process model specifies at different levels of the process taxonomy.” “Organization processes are processes that belong to a top level administrative process subsystem, which are practiced above project level within a software development organization.” “Development processes are processes that belong to a technical process subsystem, which regulate the development activities in software design, implementation, and maintenance.” “Management processes are processes that belong to a supporting process subsystem, which control the development processes by means of resource, staff, schedule, and quality.”
Note that the software process could change in a dynamic environment itself. Therefore, a so-called software engineering process group (SEPG) must be established in order to maintain the change management. A SEPG (see [Kandt 2006]): “obtains support from all levels of management, facilitates process assessments, helps line managers define and set expectations for software processes, maintains collaborative working relationships with practitioners, arranges for software process improvement training, monitors and reports on the progress of specific software process improvements efforts, creates and maintains process definitions and a process database, and consults with projects on software development processes.” In order to characterize the different approaches and structures of process models we will use the helpful definitions by Wang [Wang 2000] as given below:
“A process model is a process of a model system that describes process organization, categorization, hierarchy, interrelationship, and tailor-ability.” “An empirical process model is a model that defines an organized and benchmarked software process system and best practices captured and elicited from the software industry.” “A formal process model is a model that describes the structure and methodology of a software process system with an algorithmic approach or by an abstractive process description language.” “A descriptive process model is a model that describes ‘what to do’ according to a certain software process system.” “A prescriptive process model is a model that describes ‘how to do’ according to a certain software process systems.”
3
Especially, the software process as defined by NASA Software Engineering Laboratory consists of a series of phases [Donzelli 2006]:
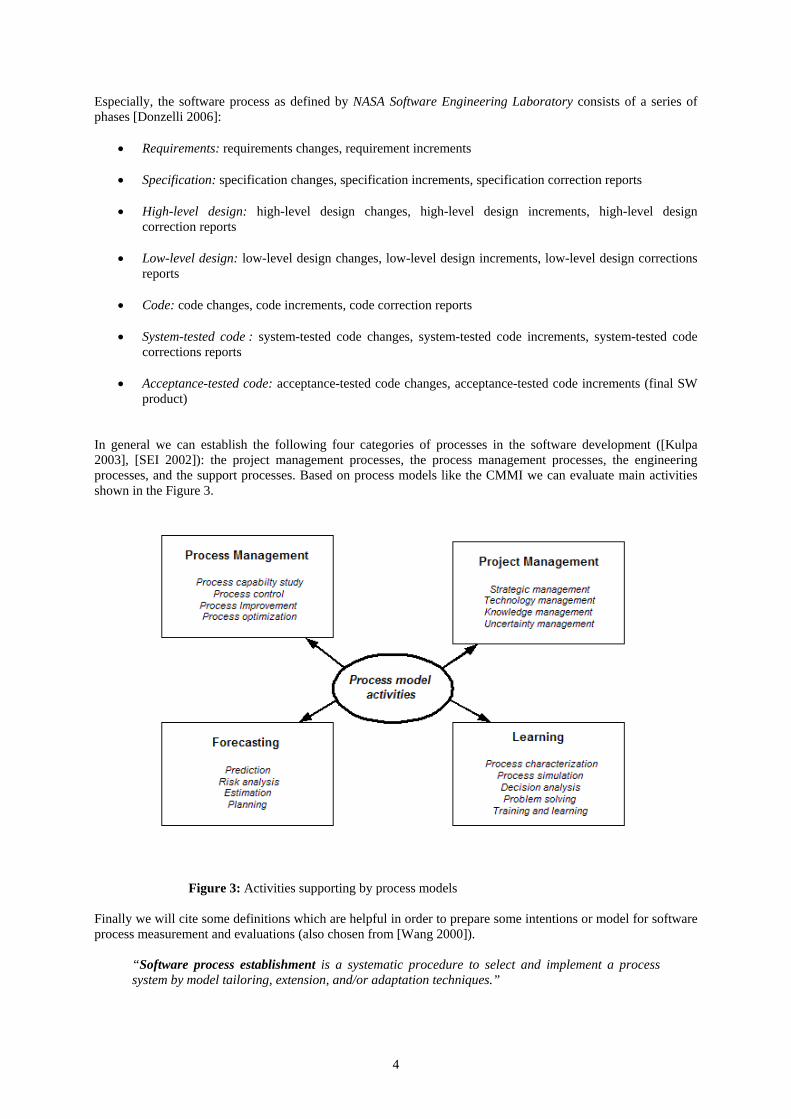
In general we can establish the following four categories of processes in the software development ([Kulpa 2003], [SEI 2002]): the project management processes, the process management processes, the engineering processes, and the support processes. Based on process models like the CMMI we can evaluate main activities shown in the Figure 3. Figure 3: Activities supporting by process models Finally we will cite some definitions which are helpful in order to prepare some intentions or model for software process measurement and evaluations (also chosen from [Wang 2000]).
“Software process establishment is a systematic procedure to select and implement a process system by model tailoring, extension, and/or adaptation techniques.”
4
“Software process assessment (SPA) is a systematic procedure to investigate the existence, adequacy, and performance of an implemented process system against a model, standard, or benchmark.” “Process capability determination is a systematic procedure to derive a capability level for a process, and/or organization based on the evidence of existence, adequacy, and performance of the required practices defined in a software engineering process system.” “Software process improvement (SPI) is a systematic procedure to improve the performance of an existing process system by changing the current processes or updating new processes in order to correct or avoid problems identified in the old process system by means of a process assessment.”
Based on these aspects of evaluation are defined the following concepts, methods and models of process evaluations (see [Wang 2000]).
“A generic model of the software development organization is a high-level process model of an organization which is designed to regulate the functionality and interactions between the roles of developers, managers, and customers by a software engineering process system.” “A process reference model is an established, validated, and proven software engineering process model that consists of a comprehensive set of software processes and reflects the benchmarked best practices in the software industry.” “A process capability model (PCM) is a measurement scale of software process capability for quantitatively evaluating the existence, adequacy, effectiveness, and compatibility of a process.” “A process capability scope is an aggregation of all the performing ratings, such as existence, adequacy, and effectiveness, of the practice which belong to the process.” “A project process capability scope is an aggregation of all process capability levels of processes conducted in a project.” “An organization process capability scope is an aggregation of the process capability levels from a number of sampled projects carried out in a software development organization.” “A process capability determination model is an operational model that specifies how to apply the process capability scales to measure a given process system described by a process model.” “A process improvement model (PIM) is an operational model that provides guidance for improving a process system’s capability by changing, updating, or enhancing existing processes based on the findings provided in a process assessment.” “A model-based process improvement model is an operational model that describes process improvement based on model- or standard-based assessment results.” “A benchmark-based process improvement model is an operational model that describes process improvement methods based on benchmark-based assessment results.”
A general software process improvement cycle is defined by Lepasaar et al. [Lepasaar 2001] in the following manner:
5
Figure 4: The software process improvement cycle by Lepasaar et al. In this preprint we will characterize a software project as an instance of a software process. Hence, we must consider the detailed aspects of project management in the process domain also. Typical project management phases are project definition, project planning, and project control which involves the process measurement, communication and the corrective actions [Verzuh 2005]. 1.2 The Process Formalization Approach by Wang and King A special approach by Wang and King uses the process algebra based on the CSP (communicating sequential processes) description [Milner 1989]. The basics of this concept are [Wang 2000]:
• Formally, a process is defined as a set of activities associated with a set of events E={e1, …, en} where an event ei is an internal or external signal, message, variable, scheduling, conditional change, or timing that is specified in association with specific activities in a process.
• Meta processes could be a
o system dispatch (that acts at the top level of a process system for dispatching and/or
executing a specific process according to system timing or a redefined event table),
SYSTEM ≜ {ti ⇒ Pj ∨ ei ⇒ Pj } o assignment (that assigns a variable x with a constant value),
x := c
o get system time (that reads the system clock and assigns the current system time ti to a
system time variable t), @T ≜ t := tI
6
o synchronization (that holds a process’s execution until moment t o the system clock (time
synchronization) or holds a process’s execution until event e occur (event synchronization)),
SYN-T ≜ @(t) or SYN-E ≜ @(e)
o read and write (which gets or outs a message from or into a memory location or system port),
READ ≜ l ? m or WRITE ≜ l ! m
o input and output (which receives or send a message from or into system I/O channel),
IN ≜ c ? m or OUT ≜ c ! m
o stop (that terminates a system’s operation.
STOP
• Process relations such as
o serial (as a process relation in which a number of processes are executed one by one),
P ; Q
o pipeline (a process relation in which number of processes are interconnected to each other),
P >> Q
o event-driven-choice (as a process relation in which the execution of a process is determined
by the event corresponding to the process),
(a → P | b → Q)
o deterministic choice (a process relation in which a set of processes are executed in an externally determinable order),
P [] Q
o nondeterministic choice (a process relation in which a set of processes are executed in a
non determined or random order dependent on run-time conditions),
P ⊓ Q
o synchronous parallel (a process relation in which a set of processes are executed simultaneously according to a common timing system),
P || Q
o asynchronous parallel or concurrency (a process relation in which a set of processes are
executed simultaneously according to independent timing system, and each such process is executed as a complete task),
P ⌠⌡ Q
o asynchronous parallel or interleave (process relation in which a set of processes are executed simultaneously according to independent timing system and the execution of each such process would be interrupted by other processes),
P ||| Q
7
o repeat (is a process relation in which a process is executed for a certain times),
(P)n
o while-do (a process relation in which a process is executed repeatedly when a certain
condition is true),
γ * P
o interrupt (a process relation in which a running process is temporarily held before termination by another process that has higher priority, and the interrupted process will be resume when the high priority process has been completed),
P ↗ Q
o interrupt return (a process relation in which an interrupted process resumes its running
from the point of interruption),
P ↘ Q
o generic recursive process (a process relation in which a set of processes is build by recursion and communicate by guarded expressions).
P ≜ μX • F(X)
This approach considers the different process quality standards: CMM, ISO 9001, Bootstrap and SPICE. Examples of the CSP-based model description are
• CMM: The Capability Maturity Model description includes the different CMM levels (CLi) based on the typical key process area (KPAj,k) in the following manner:
In the same manner like in the CMM performance evaluation, the general evaluation algorithm is defined and is used to compare the ISO 9001 evaluation with the other ones.
• BOOTSTRAP: This evaluation considers three process areas (PAi) divided in nine process categories (PCj,k) based on 35 process evaluations (PRl,m,n). The first simple evaluation level can be characterized as
The PC2,2 for example consists of the process sequence PC2,2,1 ∥ PC2,2,2 ∥ … ∥ PC2,2,10. The algorithmic-based description helps to estimate the evaluation performance effort.
• SPICE: The SPICE process evaluation considers the process categories (PCi) divided in customer supplier criteria (CUSi,j), engineering criteria (ENGi,j), project criteria (PROi,j), support criteria (SUPi,j), and organization criteria (ORGi,j). The evaluation can be described as
In the same manner are defined general algorithms for the application of different process evaluation standards which help to compare the efficiency of different approaches. Another formal approach using process algebra is based on the π-calculus [Bergstra 2001]. It is a mathematical model of processes whose interconnections change as they interact. The basic computational step is the transfer of a communication link between two processes: the recipient can then use the link for further interactions with other parties. For this reason the π-calculus has been called a calculus of mobile processes. Basics of this process algebra are prefixes for I/O description, agents for the different kinds of interaction description, and definitions which specify the processes. 1.3 The Business Process Modelling Notation (BPMN) The Business Process Modelling Notation (BPMN) was introduced in order to visualize the business processes as business process diagrams (BPD) [White 2004]. The BPD is based on different graphical elements. The four basic categories of elements are: flow objects (entity, activity, gateway), connecting objects (sequence flow, message flow, association), swimlanes (pool, lane), and artefacts (data object, group, annotation). The following figure gives a short overview about the basic elements of BPMN notation.
9
Figure 5: Basics of the BPMN Notations A simple example describing the ISO 15939 processes and sub processes of the measurement process installation is given in the following figure [Kunz 2006]. Figure 6: The ISO 15939 processes in the BPMN Notation
10
1.4 Formal Characterization of Software Processes by Dumke, Schmietendorf and Zuse The main intention of software engineering is to create/produce software products with a high quality for the customers [Dumke 2005]. A software system or software product SP is developed by the software process SD and is based on the supporting resources SR. At first, we will define the software product as a (software) system:
SP = (MSP, RSP) = ({programs, documentations}, RSP) where the two sets are divided in the following elements or components (without achieving completeness)
documentations = {userManual, referenceManual, developmentDocumentation} and RSP describes the set of the relations over the SP elements. The given subsets could be described in following
developmentManagement, lifecycleModel} Here, we can define a software product as a software system as following ([Chung 2000], [Dumke 2003], [Horn 2002], [Maciaszek 2001], [Marciniak 1994], [Mikkelsen 1997]) SE-SoftwareSystems ⊆ {informationSystem, constructionSystem, embeddedSystem, communicationSystem, distributedSystem, knowledgeBasedSystem} Relations involving general aspects of software products are [Messerschmitt 2003]: software is different, software is ubiquitous, software makes our environment interactive, software is important, software is about people, software can be better, software industry is undergoing radical changes, creating software is social, software is sophisticated and complex, and software can be tamed. We can derive some of the examples of the relations in RSP as given next:
• The process of the software testing on some software product components:
1 The kind of the functional requirements depends on the kind of the software system which we characterize later. 2 This set of quality characteristics is related to the ISO 9126 product quality standard.
11
r ∈ R)test(SP SP: sourceCode × verificationScript × testScript→ testDescription
• The elements of the product design considering the necessary components:
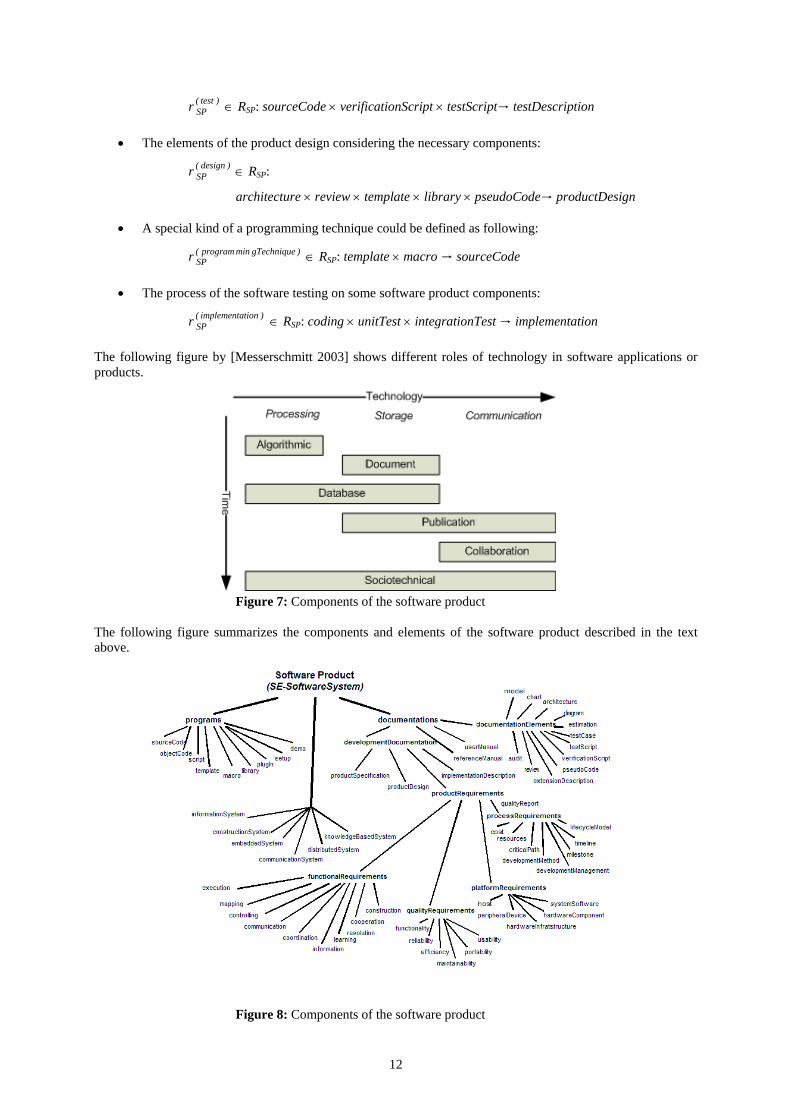
The following figure by [Messerschmitt 2003] shows different roles of technology in software applications or products.
Figure 7: Components of the software product The following figure summarizes the components and elements of the software product described in the text above. Figure 8: Components of the software product
12
Now, we will define the software development process SD itself (note, that the concrete software process is known as software project). So, we can define the software process SD as following (including the essential details of every development component)
SD = (MSD, RSD) = ({developmentMethods, lifecycle, softwareManagement} ∪ MSR, RSD) developmentMethods ⊆ {formalMethods, informalMethods} = SE-Methods formalMethods ∈ {CSP, LOTOS, SDL, VDM, Z} We can see a plenty of “classical” informal development methods as structured methods SAM. Actually, the informal methods are based on the objects OOSE, the components CBSE, or the agents AOSE. Therefore, we can define informalMethods ∈ {SAM, OOSE, CBSE, AOSE} and especially SAM ∈ {SA/SD, Jackson, Warnier, HIPO} OOSE ∈ {UML, OMT, OOD, OOSE, RDD, Fusion, HOOD, OOSA} CBSE ∈ {DCOM, EJB, CURE, B-COTS, SanFrancisco} AOSE ∈ {AAII, AUML, DESIRE, IMPACT, MAS, MaSE, MASSIVE, SODA} The life cycle aspects could be explained by the following descriptions lifecycle = {lifecyclePhase, lifecycleModel} lifecyclePhase ∈ {problemDefinition3, requirementAnalysis, specification, design, implementation, acceptanceTest, delivering} lifecycleModel ∈ {waterfallModel, Vmodel, evolutionaryDevelopment, prototyping, incrementalDevelopment, spiralModel, …, winWinModel} Finally, the software management component of the MSD could be described in the following manner softwareManagement = developmentManagement ⊆ {projectManagement, qualityManagement, configurationManagement } Note that the software development process could be addressed as a special kind of a software system. Hence, we can make the following characterization SDinformationSystem ≠ SDembeddedSystem ≠ SDdistributedSystem ≠ SDknowledgeBased System Furthermore, some of the examples of the relations in RSD could be derived in the following manner
• The process of building an appropriate life cycle model:
r ∈ R)lifecycle(SD SD: lifecyclePhase
1i × … × lifecyclePhase → lifecycleModel
ni
• The defining of software development based on the waterfall model:
r ∈ R)waterfall(SD SD: problemDefinition × specification × design
• The characterization of the tool-based software development based on UML:
r ∈ R)UMLdev(SD SD: UML × developmentEnvironmentUML × systemOfMeasuresUML
× experienceUML × standardUML → developmentInfrastructureUML These descriptions lead us to the following general model of the software engineering considering the three dimensions of the software methodology, the software technology and the related application domains or kinds of systems.
AOSE
CBSE
OOSE
Life cycleBased methods
Developmentresources
Kinds ofmanagement
Information systems
Embedded systems
Knowledge-basedsystems
SE technology
SE methodology
SE applicationsystems
SAM
Distributed systems
Construction systems
Communicationsystems
Figure 9: Dimensions of the software engineering Finally, the components and aspects of the software development process are shown in the following Figure 10.
Figure 10: Components of the software process In order to develop a software product we need resources such as developers, CASE tools and variants of hardware. Therefore, we define the software development resources SR as following
14
SR = (MSR, RSR) = ({personnelResources, softwareResources, platformResources}, RSR)
where the software resources play a dual role in the software development: as a part of the final system (as COTS or software components) and as the support for the development (as CASE or integrated CASE as ICASE). We continue our definition as follows
softwareResources = {COTS} ∪ {ICASE} ICASE = CASE ∪ CARE ∪ CAME
where CARE stands for computer-aided reengineering and CAME means computer-assisted measurement and evaluation tools. Considering the WWW aspects and possibilities for software development infrastructures based on CASE environments, the set of CASE tools could be divided as following
compiler, debugger, analysisTool, configurationTool} Especially, we can describe the following incomplete list of personnel resources as personnelResources = {analyst, designer, developer, acquisitor, reviewer, programmer, tester, administrator, qualityEngineer, systemProgrammer, chiefProgrammer, customer} SE-Communities = {personnelDevelopmentResources, ITadministration, softwareUser, computerSociety} Accordingly, some of the examples of the relations in RSR could be derived in the following manner
• The process of building an appropriate development environment:
r ∈ R)devEnv(SR SR: ICASE × platformResources → developmentEnvironment
• The defining of software developer teams for the agile development:
Now, we summarize different elements and components of the resources as the basics of the software development and maintenance in the following figure. Figure 11: Components of the software development resources
15
The different aspects and characteristics of the software maintenance are summarized by the following formulas [April 2005]
SM = (MSM, RSM) = ({maintenanceTasks, maintenanceResources} ∪ SP) where maintenanceTasks = {extension, adaptation, correction, improvement, prevention} maintenanceResources = ICASE ∪ {maintenancePersonnel, maintenancePlatform} maintenancePersonnel = {maintainer, analyst, developer, customer, user} Accordingly, some of the examples of the relations in RSM could be derived in the following manner
• The process of building the extension activity of the maintenance:
r ∈ R)extension(SM SM: SP × functionalRequirements → SP(extended)
• The defining of software correction:
r ∈ R)correction(SM SM : SP × qualityRequirements → SP(corrected)
• The defining of software adaptation:
r ∈ R)adaptation(SM SM : SP × platformRequirements → SP(adapted)
• The defining of software improvement:
r ∈ R)perform(SM SM : SP × performanceRequirements → SP(improved)
• The defining of software prevention:
r ∈ R)prevention(SM SM : SP × preventionRequirements → SP(modified)
• The characterization of a special kind of software maintenance as remote maintenance:
r ∈ Rint)remoteMa(SM SM : ICASEremote × maintenanceTasks
× maintenancePersonnel → remoteMaintenance Figure 12: Components of the software maintenance After the software development, the software product goes in two directions: first ( in the original sense of a software product) to the software application SA, and second in the software maintenance SM. We define the different aspects in the following
16
SA = (MSA, RSA) = ({applicationTasks, applicationResources, applicationDomain} ∪ MSP, RSA) where
Figure 13: Components of the software product application This formal concept demonstrates the wide area of the software process artefacts and involvements which must be considered in order to analyse, measure, evaluate, improve and control software development and maintenance.
17
2 Process Improvement and Evaluation Approaches Examples of software process improvement standards and approaches are summarized as following (described in [Emam 1998], [Garcia 2005], [Royce 1998] and [Wang 2000])
• ISO 9001:2000 as a standard for process assessment and certification comparable to other business areas and industries.
• TickIT inform the developer about the actual quality issues and best practices considering the process
improvement.
• ISO 12207 defines the software life cycle processes for a general point of view and involves the process quality implicitly.
• ISO 15504 is also known as SPICE (Software Process Improvement and Capability Determination) and
was described shortly later in this preprint.
• Bootstrap process evaluation is based on the assessment process, the process model (including the evaluation as incomplete, performed, managed, established, predictable and optimising), the questionnaires and the scoring, rating and result presentation .
• SEI-CMMI is the well-known capability maturity model which integrated some of other process
improvement standards and approaches (see below).
• Trillium is a Canadian initiative for software process improvement and provides to initiate and guide a continuous improvement program.
• EFQM as European Foundation of Quality Management considers soft factors like customer
satisfaction, policy and strategy, business results, motivation, and leading in order to evaluate the process effectiveness and success.
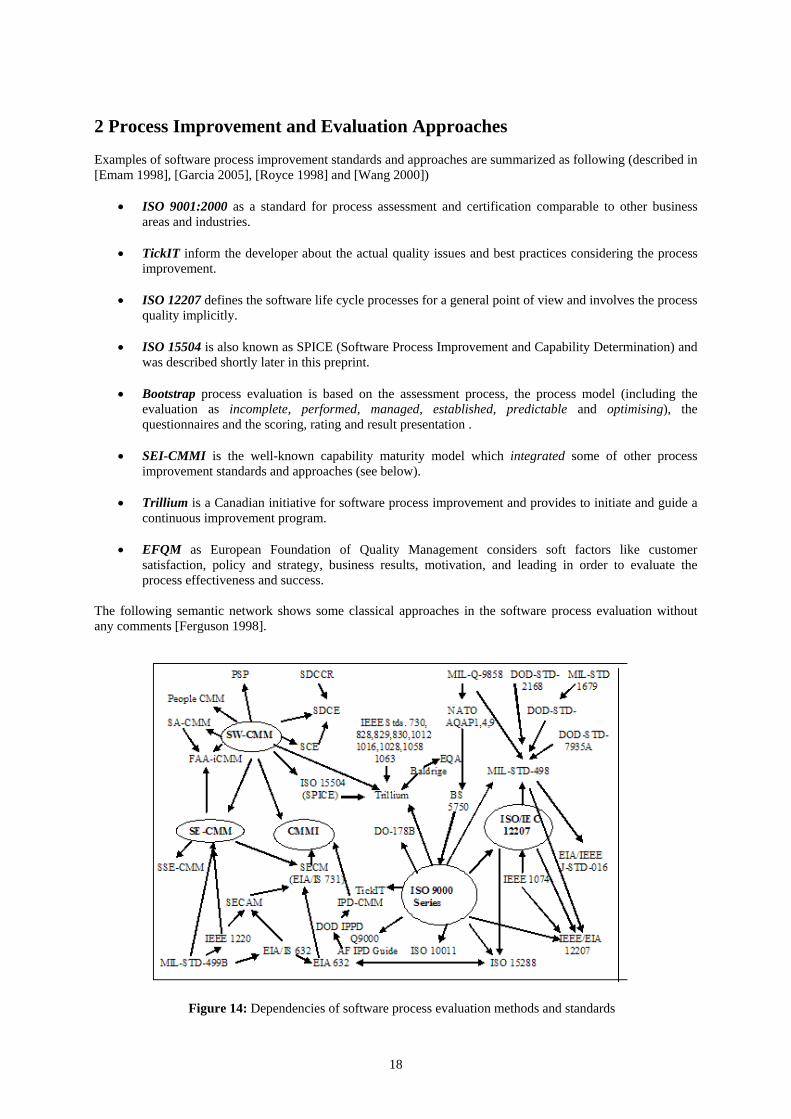
The following semantic network shows some classical approaches in the software process evaluation without any comments [Ferguson 1998]. Figure 14: Dependencies of software process evaluation methods and standards
18
2.1 General Maturity Models Based on the idea of process improvement, a lot of maturity models (MM) were defined and implemented in order to classify different aspects of software products, processes and resources. Some of these maturity evaluation approaches are described in the following table (see [April 2005] and [Braungarten 2005])
Model Description Model Description PEMM Performance Engineering MM CM3 Configuration Management MM TMM Testing Maturity Model ACMM IT Architecture Capability MM
ITS-CMM IT Service Capability MM OMMM Outsourcing Management MM iCMM Integrated CMM PM2 Project Management Process Model TCMM Trusted CMM IMM Internet MM
SSE-CMM System Security Engineering CMM IMM Information MM OPM3 Organizational Project Management
MM PMMM Program Management MM
OMM Operations MM PMMM Project Management MM M-CMM Measurement MM IPMM Information Process MM SAMM Self-Assessment MM CPMM Change Proficiency MM UMM Usability MM ASTMM Automated Software Testing MM ECM2 E-Learning CMM LM3 Learning Management MM
WSMM Web Services MM ISM3 Information Security Management MM
eGMM e-Government MM TMM Team MM EVM3 Earned Value Management MM SRE-MM Software Reliability Engineering
MM WMM Website MM EDMMM Enterprise Data Management MM
DMMM Data Management MM S3MM Software Maintenance MM Table 1: Chosen maturity models The following figure summarizes some of these maturity models and chosen improvement models in a layer structure of software process evaluation.
Figure 15: Overview of chosen process maturity and improvement models In following we will consider some of the essential approaches of software process evaluation and improvement.
19
2.2 The CMMI Approach CMMI stands for Capability Maturity Model Integration and is an initiative for changing the general intention of an assessment view based on the “classical” CMM or ISO 9000 to an improvement view integrating the System Engineering CMM (SE-CMM), the Software Acquisition Capability Maturity Model (SA-CMM), the Integrated Product Development Team Model (IDP-CMM), the System Engineering Capability Assessment Model (SECAM), the Systems Engineering Capability Model (SECM), and basic ideas of the new versions of the ISO 9001 and 15504 [Chrissis 2003]. The CMMI is structured in the five maturity levels, the considered process areas, the specific goals (SG) and generic goals (GG), the common features and the specific practices (SP) and generic practices (GP). The process areas are defined as follows [Kulpa 2003]:
“The Process Area is a group of practices or activities performed collectively to achieve a specific objective.”
Such objectives could be the part of requirements management at the level 2, the requirements development at the maturity level 3 or the quantitative project management at the level 4. The difference between the “specific” and the “general” goals, practices or process area is the reasoning in the special aspects or areas which are considered in opposition to the general IT or company-wide analysis or improvement. There are four common features:
The commitment to perform (CO) The ability to perform (AB) The directing implementation (DI) The verifying implementation (VE).
The CO is shown through senior management commitment, the AB is sown through the training personnel, the DI is demonstrated by managing configurations, and the VE is demonstrated via objectively evaluating adherence and by reviewing status with higher-level management. The following Figure 11 shows the general relationships between the different components of the CMMI approach.
Generic Practices
Generic Goals
Process Area 2Process Area 1 Process Area n
Specific Goals
Specific Practices Capability LevelsGeneric Practices
Generic Goals
Process Area 2Process Area 1 Process Area n
Specific Goals
Specific Practices Capability Levels
Figure 16: The CMMI model components The CMMI gives us some guidance as to what is a required component, an expected component, and simply informative. There are six capability levels (but five maturity levels), designated by the numbers 0 through 5 [SEI 2002], including the following process areas:
0. Incomplete: -
1. Performed: best practices;
2. Managed: requirements management, project planning, project monitoring and control, supplier agreement management, measurement and analysis, process and product quality assurance;
3. Defined: requirements development, technical solution, product integration, verification, validation, organizational process focus, organizational process definition, organizational training,
20
integrated project management, risk management, integrated teaming, integrated supplier management, decision analysis and resolution, organizational environment for integration;
4. Quantitatively Managed: organizational process performance, quantitative project management;
5. Optimizing: organizational innovation and deployment, causal analysis and resolution. Addressing the basics of the project management CMMI considers the following components for the management of the IT processes [SEI 2002]:
Process Performance objectives, baselines, models
QPM
Organization’s standard processes and supporting assets IPM
forIPPD
RSKMLessons Learned,
Planning and Performance Data
Project’sdefinedprocess
Statistical Mgmt Data
Risk status
Risk mitigation plans
Corrective action
Risk taxonomies
& parametersProcess Management
process areas
BasicProject Management
process areas
Risk exposure due to unstable processes
Quantitative objectivesSubprocesses to statistically manage
Identified risks
Engineering and Supportprocess areas
Coordination,commitments,issues to resolve
IT
Coordination and collaborationamong project stakeholders
Shared visionand integrated teamstructure for the project
Configuration management,verification, and integrationdata
Figure 17: The CMMI project management process areas where QPM stands for Quantitative Project Management, IPM for Integrated Project Management, IPPD for Integrated Product and Process Development, RSKM for risk management, and ISM for Integrated Supplier Management. In order to manage the software process quantitatively, CMMI defines a set of example metrics. Some of these appropriate software measurement intentions are [SEI 2002]:
Examples of quality and process performance attributes for which needs and priorities might be identified include the following: Functionality, Reliability, Maintainability, Usability, Duration, Predictability, Timeliness, and Accuracy; Examples of quality attributes for which objectives might be written include the following: Mean time between failures, Critical resource utilization, Number and severity of defects in the released product, Number and severity of customer complaints concerning the provided service; Examples of process performance attributes for which objectives might be written include the following: Percentage of defects removed by product verification activities (perhaps by type of verification, such as peer reviews and testing), Defect escape rates, Number and density of defects (by severity) found during the first year following product delivery (or start of service), Cycle time, Percentage of rework time;
21
Examples of sources for objectives include the following: Requirements, Organization's quality and process-performance objectives, Customer's quality and process-performance objectives Business objectives, Discussions with customers and potential customers, Market surveys; Examples of sources for criteria used in selecting sub processes include the following: Customer requirements related to quality and process performance, Quality and process-performance objectives established by the customer, Quality and process-performance objectives established by the organization, Organization’s performance baselines and models, Stable performance of the sub process on other projects, Laws and regulations; Examples of product and process attributes include the following: Defect density, Cycle time, Test coverage; Example sources of the risks include the following: Inadequate stability and capability data in the organization’s measurement repository, Sub processes having inadequate performance or capability, Suppliers not achieving their quality and process-performance objectives, Lack of visibility into supplier capability, Inaccuracies in the organization’s process performance models for predicting future performance, Deficiencies in predicted process performance (estimated progress), Other identified risks associated with identified deficiencies; Examples of actions that can be taken to address deficiencies in achieving the project’s objectives include the following: Changing quality or process performance objectives so that they are within the expected range of the project’s defined process, Improving the implementation of the project’s defined process so as to reduce its normal variability (reducing variability may bring the project’s performance within the objectives without having to move the mean), Adopting new sub processes and technologies that have the potential for satisfying the objectives and managing the associated risks, Identifying the risk and risk mitigation strategies for the deficiencies, Terminating the project; Examples of sub process measures include the following: Requirements volatility, Ratios of estimated to measured values of the planning parameters (e.g., size, cost, and schedule), Coverage and efficiency of peer reviews, Test coverage and efficiency, Effectiveness of training (e.g., percent of planned training completed and test scores), Reliability, Percentage of the total defects inserted or found in the different phases of the project life cycle Percentage of the total effort expended in the different phases of the project life cycle; Sources of anomalous patterns of variation may include the following: Lack of process compliance, Undistinguished influences of multiple underlying sub processes on the data, Ordering or timing of activities within the sub process, Uncontrolled inputs to the sub process, Environmental changes during sub process execution, Schedule pressure, Inappropriate sampling or grouping of data; Examples of criteria for determining whether data are comparable include the following: Product lines, Application domain, Work product and task attributes (e.g., size of product), Size of project; Examples of where the natural bounds are calculated include the following: Control charts, Confidence intervals (for parameters of distributions), Prediction intervals (for future outcomes); Examples of techniques for analyzing the reasons for special causes of variation include the following: Cause-and-effect (fishbone) diagrams, Designed experiments, Control charts (applied to sub process inputs or to lower level sub processes), Sub grouping (analyzing the same data segregated into smaller groups based on an understanding of how the sub process was implemented facilitates isolation of special causes); Examples of when the natural bounds may need to be recalculated include the following: There are incremental improvements to the sub process, New tools are deployed for the sub process, A new sub process is deployed, The collected measures suggest that the sub process mean has permanently shifted or the sub process variation has permanently changed; Examples of actions that can be taken when a selected sub process’ performance does not satisfy its objectives include the following: Changing quality and process-performance objectives so that they are within the sub process’ process capability, Improving the implementation of the existing
22
sub process so as to reduce its normal variability (reducing variability may bring the natural bounds within the objectives without having to move the mean), Adopting new process elements and sub processes and technologies that have the potential for satisfying the objectives and managing the associated risks, Identifying risks and risk mitigation strategies for each sub process’ process capability deficiency; Examples of other resources provided include the following tools: System dynamics models, Automated test-coverage analyzers, Statistical process and quality control packages, Statistical analysis packages Examples of training topics include the following: Process modelling and analysis, Process measurement data selection, definition, and collection; Examples of work products placed under configuration management include the following: Sub processes to be included in the project’s defined process, Operational definitions of the measures, their collection points in the sub processes, and how the integrity of the measures will be determined, Collected measures; Examples of activities for stakeholder involvement include the following: Establishing project objectives, Resolving issues among the project’s quality and process-performance objectives, Appraising performance of the selected sub processes, Identifying and managing the risks in achieving the project’s quality and process-performance objectives, Identifying what corrective action should be taken; Examples of measures used in monitoring and controlling include the following: Profile of sub processes under statistical management (e.g., number planned to be under statistical management, number currently being statistically managed, and number that are statistically stable), Number of special causes of variation identified; Examples of activities reviewed include the following: Quantitatively managing the project using quality and process-performance objectives, Statistically managing selected sub processes within the project’s defined process; Examples of work products reviewed include the following: Sub processes to be included in the project’s defined process Operational definitions of the measures, Collected measures;
Based on these quantifications CMMI defines: “A `managed process` is a performed process that is planned and executed in accordance with policy; employs skilled people having adequate resources to produce controlled outputs; involves relevant stakeholders; is monitored, controlled, and reviewed; and is evaluated for adherence to its process description“. The following section includes the main activities for defining and implementing measurement repositories using in an organizational context. The repository contains both product and process measures that are related to an organization's set of standard processes ([SEI 2002]). It also contains or refers to the information needed to understand and interpret the measures and assess them for reasonableness and applicability. For example, the definitions of the measures are used to compare similar measures from different processes. Typical Work Products:
1. Definition of the common set of product and process measures for the organization's set of standard processes
2. Design of the organization’s measurement repository 3. Organization's measurement repository (i.e., the repository structure and support environment) 4. Organization’s measurement data
Sub practices:
1. Determine the organization's needs for storing, retrieving, and analyzing measurements.
2. Define a common set of process and product measures for the organization's set of standard processes. The measures in the common set are selected based on the organization's set of standard processes. The common set of measures may vary for different standard processes. Operational definitions for
23
the measures specify the procedures for collecting valid data and the point in the process where the data will be collected. Examples of classes of commonly used measures include the following:
Estimates of work product size (e.g., pages) Estimates of effort and cost (e.g., person hours) Actual measures of size, effort, and cost Quality measures (e.g., number of defects found, severity of defects) Peer review coverage Test coverage Reliability measures (e.g., mean time to failure).
Refer to the Measurement and Analysis process area for more information about defining measures.
3. Design and implement the measurement repository.
4. Specify the procedures for storing, updating, and retrieving measures.
5. Conduct peer reviews on the definitions of the common set of measures and the procedures for storing and retrieving measures. Refer to the Verification process area for more information about conducting peer reviews.
6. Enter the specified measures into the repository. Refer to the Measurement and Analysis process area for more information about collecting and analyzing data.
7. Make the contents of the measurement repository available for use by the organization and projects as appropriate.
8. Revise the measurement repository, common set of measures, and procedures as the organization’s needs change. Examples of when the common set of measures may need to be revised include the following:
New processes are added Processes are revised and new product or process measures are needed Finer granularity of data is required Greater visibility into the process is required Measures are retired.
Especially the CMMI level four involves a metrics-based management of all parts and elements of software product, processes and resources. 2.3 The SPICE Approach The Software Process Improvement and Capability dEtermination (SPICE) is defined as an ISO/IEC standard TR 15504 [Emam 1998]. The SPICE process model considers the following process activities
• Customer – supplier: acquire software product, establish contract, identify customer needs, perform joint audits and reviews, package, deliver ad install software, support operation of software, provide customer service, assess customer satisfaction
• Organization: engineer the business, define the process, improve the process, perform training, enable
reuse, provide software engineering environment, provide work facilities
24
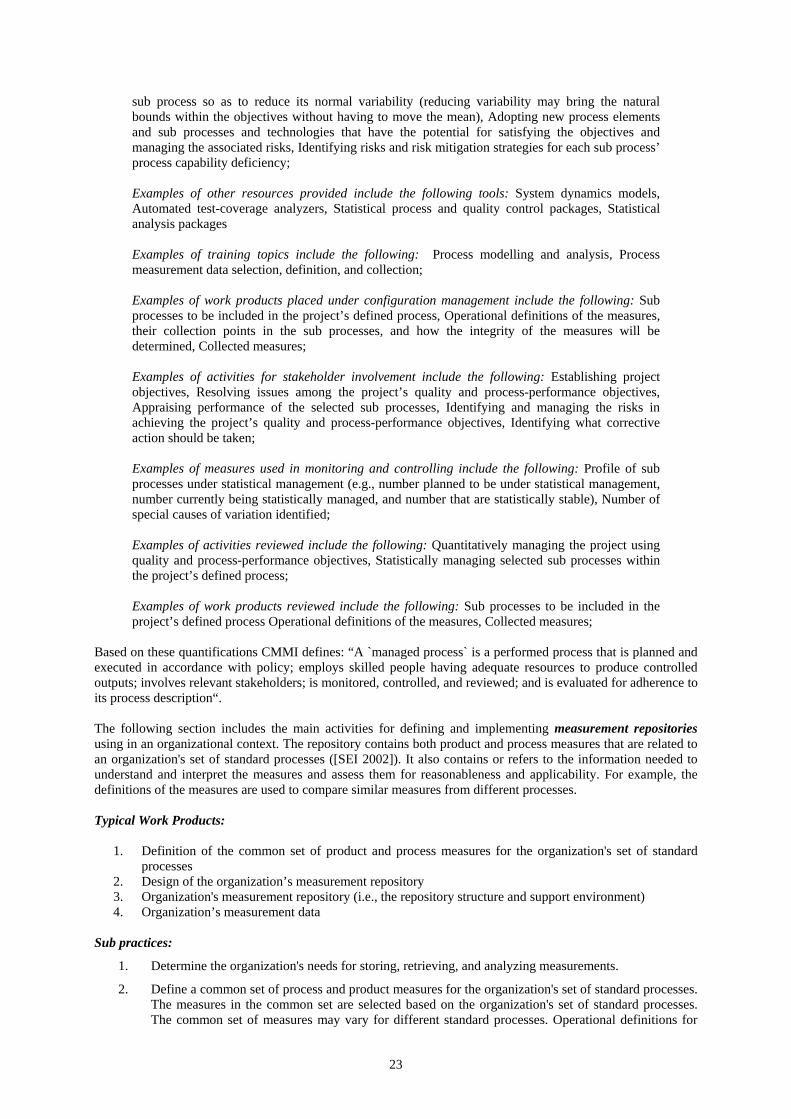
Based in these process activities, SPICE defines the different capability levels such as incomplete, performed, managed, established, predictable, and optimizing. The principles of the process assessment of SPICE are given in the following semantic network [SPICE 2006].
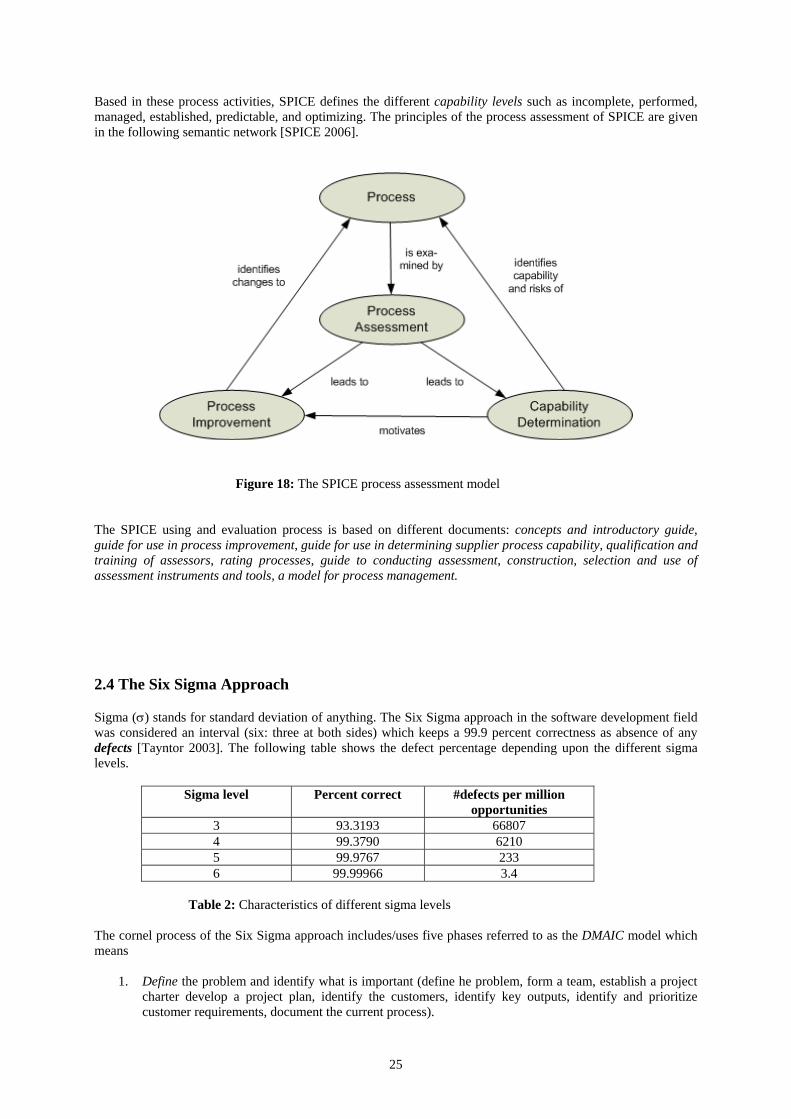
Figure 18: The SPICE process assessment model The SPICE using and evaluation process is based on different documents: concepts and introductory guide, guide for use in process improvement, guide for use in determining supplier process capability, qualification and training of assessors, rating processes, guide to conducting assessment, construction, selection and use of assessment instruments and tools, a model for process management. 2.4 The Six Sigma Approach Sigma (σ) stands for standard deviation of anything. The Six Sigma approach in the software development field was considered an interval (six: three at both sides) which keeps a 99.9 percent correctness as absence of any defects [Tayntor 2003]. The following table shows the defect percentage depending upon the different sigma levels.
Sigma level Percent correct #defects per million opportunities
Table 2: Characteristics of different sigma levels The cornel process of the Six Sigma approach includes/uses five phases referred to as the DMAIC model which means
1. Define the problem and identify what is important (define he problem, form a team, establish a project charter develop a project plan, identify the customers, identify key outputs, identify and prioritize customer requirements, document the current process).
25
2. Measure the current process (determine what to measure, conduct the measurements, calculate the current sigma level, determine the process capability, benchmark the process leaders).
3. Analyze what is wrong and potential solutions (determine what cause the variation, brainstorm ideas for
process improvements, determine which improvements would have the greatest impact on meeting customer requirements, develop a proposed process map, and assess the risk associated with the revised process).
4. Improve the process by implementing solutions (gain approval for the proposed changes, finalize the
implementation plan, implement the approved changes).
5. Control the improved process by ensuring that the changes are sustained (establish key metrics, develop the control strategy, celebrate and communicate success, implement the control plan, measure and communicate improvements).
The general aspects of the Six Sigma approach are shown in the following figure [Dumke 2005]. Figure 26: Basic characteristics of the Six Sigma approach Figure 19: Basic characteristics of the Six Sigma approach Furthermore, the Six Sigma approach is available for [Tayntor 2003] traditional software development life cycle, legacy systems, package software implementation, and outsourcing. 2.5 The ITIL Approach ITIL (the IT Infrastructure Library) is a set of documents that are used to aid the implementation of a framework for IT Service Management [ITIL 2006]. This framework characterises how Service Management is applied within an organisation. ITIL was originally created by the CCTA, a UK Government agency, it is now being adopted and used across the world as the de facto standard for best practice in the provision of IT Service. ITIL is organized into a series of sets as a best practice approach, which themselves are divided into eight main areas
1. Service Support is the practice of those disciplines that enable IT Services to be provided effectively (service-desk, incident management, problem management, change management, configuration management, release management).
26
2. Service Delivery covers the management of the IT services themselves (service level management, financial management for IT services, capacity management, service continuity management, availability management).
3. Security Management considers the installation and realization of a security level for the IT
4. ICT Infrastructure Management describes four management areas: design and planning, deployment,
operations, technical support.
5. Application Management describes the service life cycle as requirements – design – build- deploy – operate – optimise.
6. Planning to Implement Service Management defines a guide in order to deploy the ITIL approach in a
concrete IT environment.
7. The Business Perspective describes the relationships of the IT to the customers and users.
8. Software Asset Management defines the processes and the life cycles for managing the software assets. The following triangle characterizes the different relationships between the service management standards and ITIL. Figure 20: The relationship between the service standards and ITIL where BS 15000 is the service management standard, ISO 20000 describes the specification for service management, and PD 0005 stands for code of practice for the IT service management (ITSM). Usually, the implementation of the ITIL approach is supported by any ITIL toolkits.
27
Further process measurement approaches are addressed to special process aspects or IT characteristics such us
• Assessment software processes for small companies [Wangenheim 2006] considering CMMI, ISO 9001 and SPICE and definition of a Métodode Avaliacao de Processo de Software (MARES) that includes that assessment phases planning, contextualization, execution, monitoring and control, and post-mortem which will be applied continuously.
• The agile process management could be described as follows (see [Augustine 2005] and [Boehm
2005])
o The agile methods are lightweight processes that employ short iterative cycles, actively involve users to establish, prioritize, and verify requirements and rely on a team’s tacit knowledge as opposed to documentation
o The ability to manage and adapt to change
o A view of organization’s fluid, adaptive systems composed of intelligent people
o Recognition of the limits of external control in establishing order
o An overall humanistic problem-solving approach (considers all members to be skilled and valuable stakeholders in team management, relies on the collective ability of autonomous teams as the basic problem-solving mechanism, minimizes up-front planning, stressing instead adaptability to changing conditions)
• Management issues of internet/Web systems [Walter 2006] which defines the priority of management aspects as
1. protecting information about consumers, 2. holistic thinking of company activities, 3. linking internet strategic planning with corporate strategic planning, 4. aligning internet development projects with corporate strategies, 5. prioritizing company’s internet objectives, 6. providing adequate reassurance to consumers that information is fully protected, 7. recruiting trained internet personnel, 8. intranets remain security problems, 9. retaining trained internet personnel, 10. making company logistics system compatible with the internet, 11. providing data privacy and data security to costumer companies, 12. providing adequate firewall,s 13. the site objectives requires definition, 14. recognizing potential benefits available from the internet, 15. intellectual property rights have become a major concern, 16. internet personnel should be strategists, 17. making WWW sites user friendly, 18. costs/benefits analyses fir internet systems are difficult, 19. keeping up to the dynamism of the internet-based marketplace, 20. providing quality customer service through interne systems, 21. the speed of change makes internet technology forecasting difficult, 22. integrating internet systems across multiple sites within a company, 23. linking internet systems to other internet systems 24. distribution channel conflicts inhibit more widespread use of e-commerce, 25. developing new cots/benefits analysis methodologies to evaluate internet project, 26. competitors may be leaping ahead.
• Product line project management [Clements 2005] is based on the product line development phases as core asset development, product development, and management. This management involves the typical project input as products requirements, product line scope, core assets, and a production plan. The following figure shows the “What to Build” pattern used in this management area.
28
, Figure 21: The “What to Build” pattern for product line project management
• Personal Software Process (PSP) considers the quality of the IT personnel themselves by analysis, evaluation and improvement of their activities [Humphrey 2000]. The following figure shows the essential steps of the PSP.
Figure 22: The PSP approach
Based on the Telemetry project from Johnson et al. [Johnson 2005] Ullwer has defined and implemented a background measurement and repository in order to automate the PSP using the so called Hackystat technology for Open Office [Ullwer 2006].
Currently, an experience in the industrial area is available and shows the relevance of this approach ([Kamatar 2000], [Zhong 2000]).
29
3 Process-Oriented Software Measurement Process metrics or measures are involved in software measurement processes and are based on process experiences. Therefore, we will define these activities and information basics at first. The measurement methods M could be classified as following [Dumke 2005]
M = {artefactBasedOperation, quantificationBasedOperation, valueBasedOperation, experienceBasedOperation}
interpretation, evaluation, application} The measurement experiences summarize the general aspects of the concrete measurement results in different forms of aggregation, correlation, interpretation and conclusion based on a context-dependent interpretation. Note that the measurement experience is divided in the experiences of the measurement results and the (evaluated-based) experience of the measurement itself. In following we only consider the first aspect. Some kinds of measurement experience are ([Armour 2004], [Davis 1995], [Endres 2003], [Kenett 1999])
Some examples of these kinds of experience are (see also [Basili 2001], [Boehm 1989], [Dumke 2003], [Halstead 1977] and [Putnam 2003]) analogies ∈ {analogicalEstimation, systemAnalogy, hardwareSoftwareAnalogy} criteria ∈ {fulfilCondition, qualityAspect, minimality, maximality} laws ∈ {BrooksLaw, DijkstraMillsWirthLaw, FagansLaw, GlassLaw,
GraySerlinLaw, McIlroysLaw, MooresLaw, SimonsLaw} lemmas ∈ {‘any system can be tuned’, ‘installability must be designed in’, ‘human-based methods can only be studied empirically’} methodologies ∈ {agileMethodology, cleanroomMethodology, empiricalBasedMethodology} principles ∈ {‘don’t set unrealistic deadlines’, ‘evalvate alternatives’,
‘manage by variance’, ‘regression test after every change’} rulesOfThumb ∈ {‘one dollar in development leads to two dollars maintenance’, ‘1 KLOC professional developed programs implies 3 errors’, ‘more than 99 percent of all executing computer instructions come from COTS’, ‘more than the half of the COTS features go unused’} On the other hand, there are three different types of empirical strategies: survey, case study and experiment (see [Juristo 2003], [Kitchenham 1997]). In following we will cited some examples from the literature for these kinds of measurement and experience addressed to the software process.
30
3.1 Software Process Indicators and Criteria Special indicators or criteria for project management are defined by [Lecky-Thompson 2005] in the following manner:
Specification project management: invoice generation, reporting, payment tracking, order processing, account maintenance, customer management, stock management, and tax return; Promoting corporate quality: projecting quality (communicating quality, documentation, rewarding quality), managing quality (quality reviews, quality checklists, total quality management, quality circles), document quality (process description documents, benchmark reporting, badges); Feedback techniques: reporting line (documenting the reporting line, the reporting line document, specification, design, implementation, integration), central communication (quality management, change management, quality measurement), supporting the reporting process (external documentation, motivation via improvement), Client satisfaction: pre- and post-project surveys, planning for failure, poor quality requirements capture, poor quality implementation, managing client dissatisfaction, poor quality specifications.
Another taxonomy of project management considers the special aspects of managing virtual teams [Haywood 1998]. These are
Virtual team characteristics: geographical separation of team members, skewed working hours, temporary or matrix reporting structures, multi-corporation or multi-organizational teams Virtual team members: individual located at other corporate site, joint venture partners, telecommuters, consultants, third-party developers, vendors, suppliers, offshore development and manufacturing groups, satellite work groups, customers, clients; Factors driving the prevalence of distributed teams: mergers, acquisitions, downsizing, outsourcing, technology, clean air laws, offshore development and manufacturing, technical specialization; Manager’s perspective of the advantages of a distributed team: access to a less expensive labor pool, reduced office space, greater utilization of employees, round-the-clock work force, greater access to technical experts, larger pool of possible job candidates;
Team member’s perspective of the advantages of a distributed team: increased independence, less micro management, larger pool of jobs to choose from, greater flexibility, opportunity for travel; Expectations to research: increased productivity, improved disaster recovery capabilities, increased employee satisfaction and retention, reduced office space requirements, environmental benefits, closer proximity to customers, increased flexibility, greater access to technical experts, larger pool of potential job candidates; Manager’s perspective of the challenges of distributed teams: team building, cultural issues, cost and complexity of technology, process and workflow;
Team member’s perspective of the challenges of distributed teams: communication, technical support, recognition, inclusion vs. isolation, management resistance.
As key success factors for software process improvement (SPI) identify Lepasaar et al. [Lepasaar 2001] the following:
1. SPI related training;
2. External guidance of the SPI work;
3. Company’s commitment to SPI activities;
4. External support for SPI activities;
5. Managements support for SPI;
31
6. SPI environment support for a sufficiently long period of time (external mentoring);
7. Availability of company’s own resources;
8. Measurable targets set to SPI work. Kandt gives a summarizing about different software quality drivers shown in the following table [Kandt 2006].
volatility Application experience Use of automated
fracas 10 Virtual machine
experience Platform volatility Use of simulation
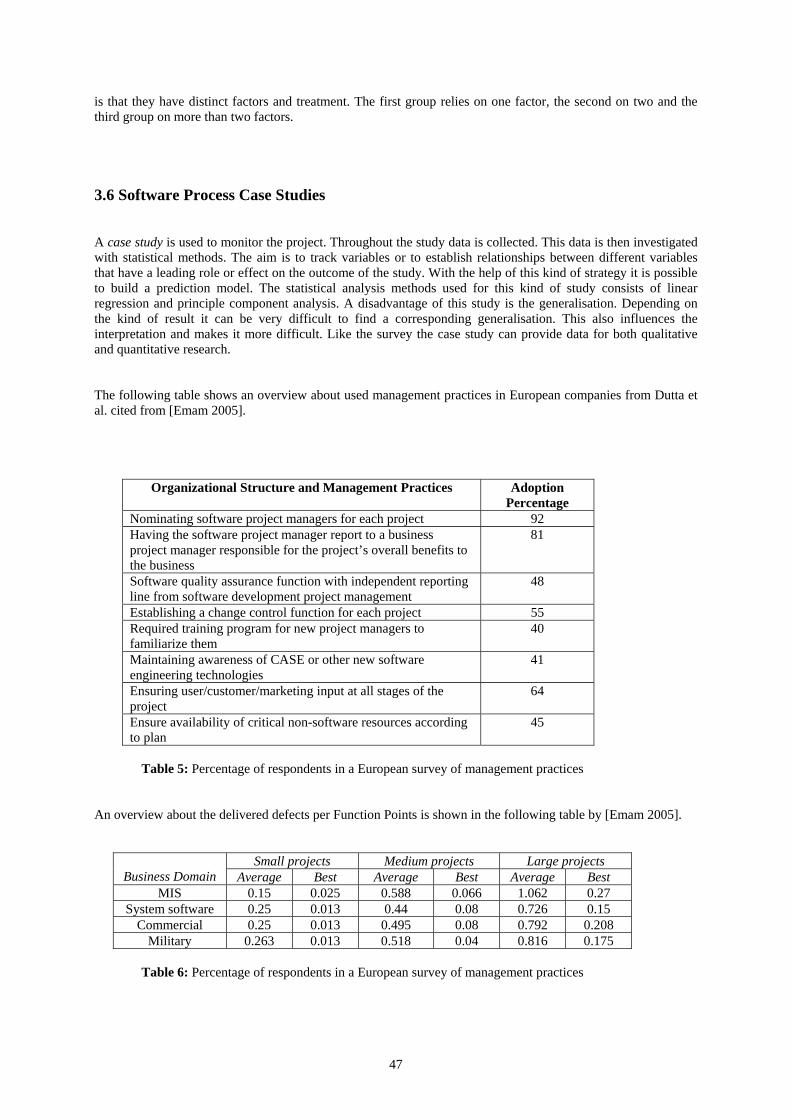
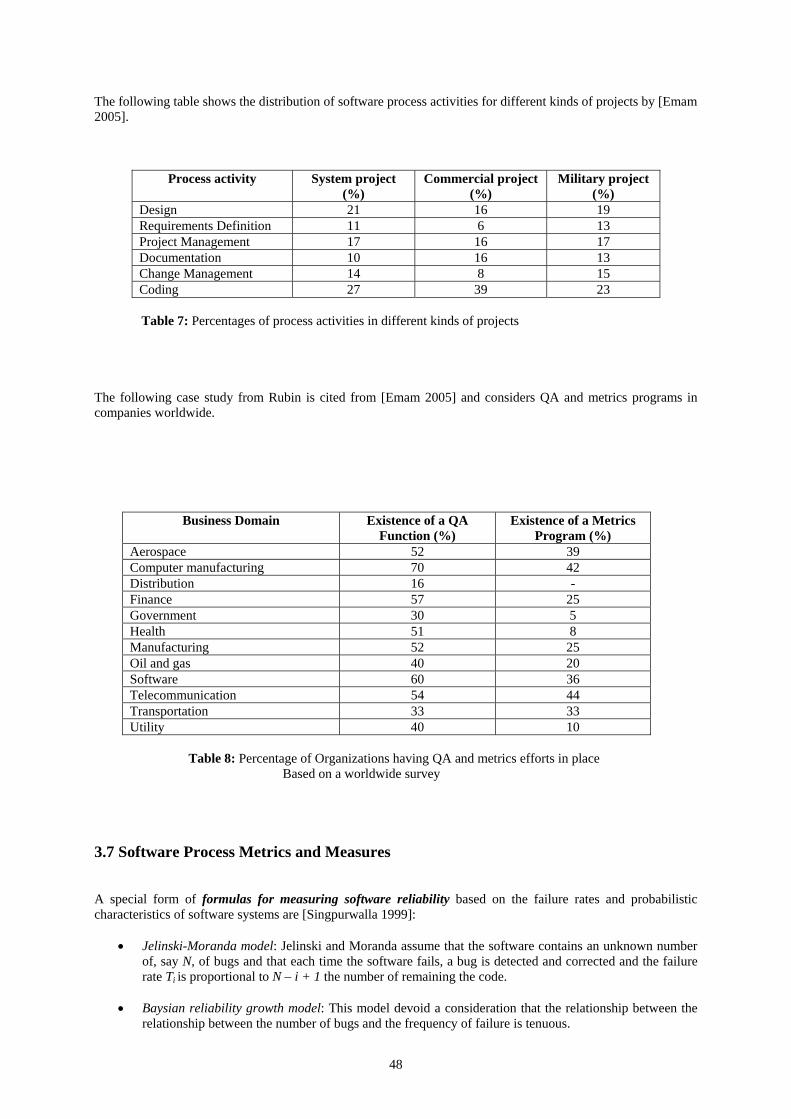
Table 3: Software Quality Drivers An overview about the essential indicators in order to characterize defects is given in [Emam 2005] as following:
• Defects and usage: usage is a function of the number of end users using the product, the number of actual machines executing the product, the time since release
• Raw defect counts: defect density = (number of defects found)/size
• Adjusted defect density: e. g. adjusted by comparisons to “standard company”
• Defect classification: as defect priorities, defect severities, classification by problem type A stage model applying the defect analysis is shown in the following figure [Emam 2005].
Figure 23: A model showing the stages of measurement that organizations typically go through
32
The IT controlling could be classified in the following sub processes defined by Gadatsch and Mayer [Gadatsch 2005]: ADV controlling, DV controlling, EDV controlling, INF controlling, IV controlling, IS controlling, IT controlling. Typical tools in order to support these processes are the IT strategy, IT standards, IT portfolio management, and IT analysis and indicators. A simple classification of IT indicators by [Gadatsch 2005] is
• Absolute indicators: as counting of anything, • Relative indicators: as structural indicators, relational indicators, and index indicators.
Putnam and Meyers define the Five Core Metrics for software process analysis, improvement and controlling in the following manner [Putnam 2003]
1. quantity of function, usually measured in terms of size (such as source lines of code or function points), that ultimately execute on the computer
2. productivity, as expressed in terms of the functionality produced for the time and effort expended
3. time, the duration of the project in calendar months
4. effort, the amount of work expended in person-months
5. reliability, as expressed in terms of defect rate (or its reciprocal, mean time effort)
The relationship of these core metrics are described by Putnam and Meyers as follows [Putnam 2003, p. 34]
“People, working at some level of productivity, produce a quantity of function or a work product at a level of reliability by the expenditure of effort over a time interval.”
Another relationship between the five core metrics defined by Putnam and Meyers characterizes a first level with the time and effort metric, a second level including the quality and productivity and a third (highest) level considering the function. 3.2 Software Process Laws The following kinds of laws and hypothesis are cited from [Endres 2003]: Fagan’s law: “Inspections significantly increase productivity, quality, and project stability”. There are three kinds of inspection: design, code, and test inspection. They are applicable in the development of all information or knowledge intensive products. This form of inspection is wide spread throughout the industry today. Inspection also has a key role in the Capability Maturity Model (CMM). The benefit of inspections can be summarized as followed: they “create awareness for quality that is not achievable by any other method”. Porter-Votta law: “Effectivness of inspections is fairly independent of its organizational form”. A. Porter and L. Votta investigated the inspection process introduced by Fagan and came up with the following results: physical meetings are overestimated. It can be helpful while introducing the inspection process to new people. When education and experience are extant it is not that important anymore. Another point revealed was that it is not true that adding more persons to the inspection team increases the detection rate. Hetzel-Myers law: “A combination of different Verification and Validation methods outperforms any single method alone”. W. Hetzel and G. Myers claim that it is better to use all three methods in combination to gain better results at the end. This is due to the fact that design, code and test inspection are not competitors. Mills-Jones hypothesis: “Quality entails productivity”. It is also known as “the optimist’s law” and can be seen as a variation of P. Cosby’s proverb “quality is free”. It is a very intuitive hypothesis: on the one hand, when the quality is high, less rework has to be done which results in better productivity. On the other hand, when quality is poor more rework has to be considered. Therefore productivity rate drops, as well.
33
Mays’ hypothesis: “Error prevention is better than error removal”. No matter when an error is detected a certain amount of rework has to be done (this amount increases the later it is detected). Therefore it is better to prevent errors. To be able to do so, the circumstances of errors have to be investigated, identified and then removed. It is still a hypothesis because it is extremely difficult to prove.
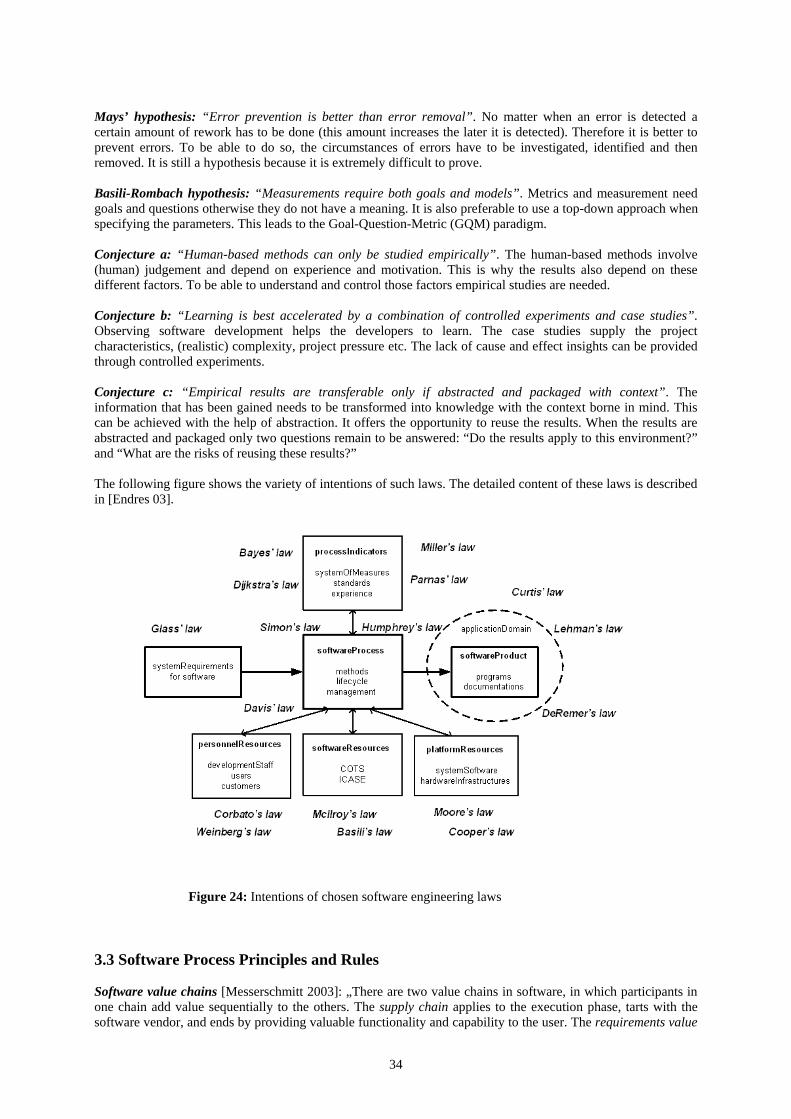
Basili-Rombach hypothesis: “Measurements require both goals and models”. Metrics and measurement need goals and questions otherwise they do not have a meaning. It is also preferable to use a top-down approach when specifying the parameters. This leads to the Goal-Question-Metric (GQM) paradigm. Conjecture a: “Human-based methods can only be studied empirically”. The human-based methods involve (human) judgement and depend on experience and motivation. This is why the results also depend on these different factors. To be able to understand and control those factors empirical studies are needed. Conjecture b: “Learning is best accelerated by a combination of controlled experiments and case studies”. Observing software development helps the developers to learn. The case studies supply the project characteristics, (realistic) complexity, project pressure etc. The lack of cause and effect insights can be provided through controlled experiments. Conjecture c: “Empirical results are transferable only if abstracted and packaged with context”. The information that has been gained needs to be transformed into knowledge with the context borne in mind. This can be achieved with the help of abstraction. It offers the opportunity to reuse the results. When the results are abstracted and packaged only two questions remain to be answered: “Do the results apply to this environment?” and “What are the risks of reusing these results?” The following figure shows the variety of intentions of such laws. The detailed content of these laws is described in [Endres 03]. Figure 24: Intentions of chosen software engineering laws 3.3 Software Process Principles and Rules Software value chains [Messerschmitt 2003]: „There are two value chains in software, in which participants in one chain add value sequentially to the others. The supply chain applies to the execution phase, tarts with the software vendor, and ends by providing valuable functionality and capability to the user. The requirements value
34
chain applies to the software implementation phase, starts with the business and application ideas, gathers and adds functional and performance objectives from user, and finally end with a detailed set of requirements for implementation. Many innovations starts with software developers, who can better appreciate the technical possibilities but nevertheless require end-user involvement for their validation and refinement.” A cognitive structure of software evaluation is defined by [Wong 2001] shown in the following figure and consider the developer side as an essential software development resources. Figure 25: User’s cognitive structure of software evaluation by Wong and Jeffery The organizational and management-oriented activities of a lightweight process on extreme programming (LIPE) are defined by Zettel et al. [Zettel 2001] in the following manner:
Figure 26: The LIPE activities and product flow among them by Zettel et al.
35
The typical issues of software evaluation in the IT area is shown in the following figure defined by [Ebert 2004]
Metrics
Engineers:Immediate access to team planning and progressGet visibility into own performance and how it can be improvedIndicators that show weak spots in deliverables Focus energy on software development (instead of rework or reports)
Project Management:Immediate project reviewsStatus and forescasts for
quality, schedule and budgetFollow-up of action pointsReports based on consistent
raw data
Senior Management:
Easy and reliable visibility on business performanceForecasts and indicators where action is needed Drill-down into underlying information and commitmentsFlexible resource refocus
Figure 27: Metrics depends on stakeholder needs A set of principles for the different areas of software quality are defined by Kandt in the following manner [Kandt 2006]:
• Practice for Management Personnel to Follow o Inculcate an organizational vision o Commit to a software process improvement program o Create a software engineering steering group o Create a software engineering process group o Align the human resources organization o Assess the maturity of the organizational development processes o Identify changes and their scope o Demonstrate a quantitative financial benefit for each change o Obtain the commitment of practitioners o Measure personnel productivity and product quality
• Practice for Staffing an Organization o Define minimal standards of knowledge for software personnel o Use a defined process to evaluate a candidate’s knowledge o Hire summer interns and contractors a short-term basis o Hire personnel who have actually delivered software systems o Define graduated career opportunities to support growth in workface competencies o Define an orientation program for new personnel o Specify the number of days each year that people are expected to further develop their skills o Provide recent hires with on-the-job training o Train developers in the application domain o Relate skill development activities to the needs of individuals and projects o Reward outstanding accomplishments o Define individuals performance goals and objects with each employee o Provide small meeting rooms that can hold ten people o Provide private, noise-free office space for software professionals o Control problem employees o Remove poor performers o Challenge personnel o Motivate employees o Foster team cohesion o Do not allow software engineers to work overtime beyond 40 consecutive days
36
• Practice for Planning a Project
o Conduct feasibility studies o Develop a project schedule following a defined procedure o Perform a risk assessment of a project following a defined procedure o Estimate the effort and cost of a software project following a defined procedure o Use metrics to manage a software project o Track milestones for large projects o Establish a project office for large projects o Use a hierarchical organizational structure for software projects o Collocate teams and the resources allocated to them o Assign personnel to projects ho are expects in key technology areas o Never add developers to a late project o Place an operational infrastructure into the work environment before the real work starts
• Practices for Managing Versions of Software Artifacts o All sources artefacts should be under configuration control o All artefacts used to produce an artefact of a delivery should be under configuration control o Work within managed, private workspace o Save artefacts at the completion of intermediate steps of a larger change o Regularly synchronize development with the work of others o Define policies for branches, codelines, and workspaces o Document identified software defects o Create a defined process for requesting and approving changes o Apply defect repairs to existing releases and ongoing development efforts o Use shared, static build processes and tools o Build software on a regular, preferable daily, basis o Maintain a unique read-only copy of each release o A version manifest should describe each software release o Software artefacts that comprise a release should adhere to defined acceptance criteria o Configuration management tools should provide release updates o Use a software tool perform configuration management functions o Repositories should exist on reliable physical storage elements o Configuration management repositories should undergo periodic backups o Test and confirm the backup process
• Practice for Eliciting Requirements o Identify and involve stakeholders o Identify the reason for developing a system o Define a clear, crisp project vision o Identify applicable operational policies o Identify user roles and characteristics o Describe systems similar to the “to be” system o Identify all external interfaces and enabling systems o Define a concept of operations o Emphasize the definition of vital non-functional requirements o Include specific quality targets in the requirements o Classify requirements using multidimensional approach o Verify the source of a requirement o Develop conceptual models o Record assumptions o Prioritize software requirements o Capture requirements rationales and discussions of them o Analyze the risk of each requirement o Allocate requirements in a top-down manner o Define a glossary o Uniquely identify each requirement and ensure its uniqueness o Differentiate between requirement, goal, and declaration statements o Use good writing style o Write consistent statements o Define a verification method for each requirement
37
o Identify the relationships among requirements o Do not exclude higher-level requirements o Write requirements that are independent of each other o Fully specify all requirements o Assess the quality of each requirement o Validate the completeness of the defined requirements o Inspect requirements using a defined process o Use bilateral agreements o Monitor the status of software requirements following a defined procedure o Measure the number and severity of defects in the defined requirements o Control how requirements are introduced, changed, and removed
• Practices for Designing Architectures o Reduce large systems into module realized by 5,000 to 10,000 lines of source code o Use different views to convey different ideas o Separate control logic from functions that provide services o Define and use common protocols for common operations o Provide models of critical system-level concepts o Use functions to encapsulate individual behaviours o Minimize the use of goto statements o Use program structuring techniques that optimize locality of reference o Avoid creating and using redundant data o Design and implement features that only satisfy the needed requirements o Periodically analyze and simplify software systems o Create prototype of critical components to reduce risk o Use a notation having precise semantics to describe software artefacts o Define and use criteria and weightings for evaluating software design decisions o Record the rationale for each design decision o Compute key design metrics
• Practice for General-Purpose Programming o Use the highest-level programming language possible o Use integrated development environments o Adopt a coding standard that prevents common types of defects o Prototype user interfaces and high-risk components o Define critical regions
• Practices for Inspecting Artifacts o Provide explicit training in software inspection techniques o Require that the appropriate people inspect artefacts o Use checklist-based inspection techniques o Use two people to inspect artefacts o Conduct meeting-less inspections o Generate functional test cases from defined scenarios o Use a code coverage tool o Perform basis path testing o Examine the boundary conditions affecting the control flow of a program o Verify data and file usage patterns of a program o Verify that invalid and unexpected inputs are handled, as well as valid and expected ones o Verify all critical timing modes and time-out conditions o Verify that systems work in a variety of configurations o Verify the accuracy of the documentation
• Practice for Writing Useful User Documentation o Orient the documentation around descriptions of real tasks o Organize the presentation of information o Provide an overview of the information of each major section of a document o Clearly present information o Use visual techniques to effectively convey information o Provide accurate information o Provide complete information
38
Verzuh suggests that an essential part of project management consists in the project rules such as [Verzuh 2005]
1. Agreement on the goals of the project among all parties involved 2. Control over the scope of the project
3. Management support
A responsibility matrix should be helpful in order to avoid communication breakdowns between departments and organizations. The steps for setting a responsibility matrix are [Verzuh 2005]
1. List the major activities of the project 2. List the stakeholder groups
3. Code the responsibility matrix
4. Incorporate the responsibility matrix into the project rules
Project start should be based on the following steps [Verzuh 2005]
1. The project proposal assembles the information necessary for a sponsor of project selection board. 2. A project sponsor can use the charter template to formally authorize the project and project manager.
3. The statement of work represents the formal agreement between project stakeholders about the goals
and constraints of the project.
4. The responsibility matrix clarifies the role and authority of each project stakeholder.
5. Effective communication is no accident. Use the communication planning matrix to identify who needs what information and how you’ll sure to get it to them. Remember that having more mediums of communication increases the likelihood your message will get through.
6. As you initiate the project, use the definition checklist to guide the team.
In order to develop the detailed project plan it must consider the following steps [Verzuh 2005]: create the project definition, develop a risk management strategy, build a work breakdown structure, identify task relationships, estimate work packages, calculate initial schedule, assign and level resources. The process of resource levelling also defined by Verzuh should keep the following: forecast the resource requirements throughout the project for the initial schedule, identify the resource peaks, at each peak, delay non-critical tasks within their float, eliminate the remaining peaks by re-evaluating the work package estimates. The typical project constraints are the time, money and resources [Verzuh 2005]. Furthermore, for balancing the project level these steps should be taken: re-estimate the project, change task assignments to take advantage of schedule float, add people to the project increase productivity by using experts from within the firm, increase productivity by using experts from outside the firm, outsourcing the entire project or a significant portion of it, crashing the schedule, working overtime. Besides, some rules for effective communication in project teams are defined by Verzuh in the following manner [Verzuh 2005]:
1. Responsibility. Each team member needs to know exactly what part of the project he or she is responsible for.
39
2. Coordination. As team members carry out their work, he relies on each other. Coordination information enables them to work together efficiently.
3. Status. Meeting the goal requires tracking progress along the way to identify problems and take corrective action. The team members must be kept up to seed in the status of the project.
4. Authorization. Team members need to know about all the decisions made by customers, sponsors, and management that relate to the project and its business environment. Team members need to know these decisions to keep all project decisions synchronized.
The measurement of progress is one of the essential aspects for controlling the software project. Some rules are [Verzuh 2005]:
• Measuring schedule performance: using the 0-50-100 rule, take completion criteria seriously, schedule performance measures accomplishment, measuring progress when there are many similar tasks
• Measuring cost performance: every work package has cost estimates for labour, equipment, and
materials; as each one is executed, be sure to capture the actual costs
• Earned value reporting: calculating the cost variance using earned value, us the cost variance to identify problems early.
Finally, Verzuh defines the following project management model (ERM) [Verzuh 2005].
Figure 28: The enterprise project management model The Zachman’s Framework includes a two-dimensional classification of the various components of an information system in the following manner [Keyes 2003]
• First framework dimension: scope description, business model, information-system model, technology model, detailed description
• Second framework dimension: data description, process description, and network description
The following figure shows the essential components of the IT Balanced Scorecard defined by Gadatsch and Mayer [Gadatsch 2005].
40
Figure 29: Schema of a IT Balanced Scorecard The Corbin’s Methodology for Establishing a Software Development Environment (SDE) includes the following procedures and issues (see [Keyes 2003])
• The elements of SDE: project management, business plan, architecture, methodologies, techniques, tools, metrics, policies and procedures, technology platform, support, standards, education and training
• The benefits of SDE: improved problem definition, selection of the “right” problem according to the
customer, joint customer and IS responsibilities and accountability, acknowledgement of customer ownership of system, reduced costs of system development and maintenance, reusability of software, models, and data definitions, acceptance of the disciplined approach to software engineering using a consistent methodology, productivity improvements through team efforts and tools such as CASE
• Sample goals of SDE: reduce system development costs, reduce maintenance costs, reduce MIS
turnover rate The Shetty’s Seven Principles of Quality Leaders are the following (see [Keyes 2003])
1. Establish and communicate a clear vision of corporate philosophy, principles, and objectives relevant of product and service quality
2. Quality is a strategic issue
3. Employees are the key to consistent quality
4. Quality standards and measurement must be customer-driven
5. Many programs and techniques can be used to improve quality
6. All company activities have potential for improving product quality
7. Quality is a never-end process
The Kemayel’s Controllable Factors in Programmer Productivity consists of the following principles and issues (see [Keyes 2003])
1. Programmer productivity paradoxes: There is enormous variance in the productivity of programmers, productivity invariance with respect to experience, productivity invariance with respect to tools, suitability of motivation factors
41
2. The 33 productivity factors that are proposed can be divided into three categories: factors related to personnel, factors related to the software process, factors related to the user community
3. Personnel factors: two sets of controllable factors are likely to affect the productivity of data processing
personnel: motivation factors and experience factors
4. Personnel motivation consists of many factors, 16 derive from research appear below: recognition, achievement, the work, responsibility, advancement, salary, possibility of growth, interpersonal relations with subordinates, status, interpersonal relations: superiors, interpersonal relations: peers, technical supervision, company policy and administration, working conditions, factors interpersonal life, job security
5. Personal experience is equally important.
6. Two classes of controllable factors pertaining to the software process have been identified by the
authors: project management and programming environments
7. Project management consists of four controllable factors: using a goal structure, adherence to a software life cycle, adherence to an activity distribution, usage of cost estimation procedures
8. Programming environment is composed of four controllable factors: programming tools, modern
programming practice, programming standards, power of equipment used
9. The participation of users has been found to have an important impact on programmer productivity. The Redmill’s Quality Considerations in the Management of software-based development projects was defined in five steps as following (see [Keyes 003])
1. Most common reasons given by project managers for failure to meet budget, time scale, and specification are as follows: incomplete and ambiguous requirements, incomplete and imprecise specifications, difficulties in modelling systems, uncertainties in cost and resource estimation, general lack of visibility, difficulties with progress monitoring, complicated error and change control, lack of agreed-upon metrics, difficulties in controlling maintenance, lack of terminology, uncertainties in software or hardware apportionment, raid changes in technology, determining suitability of languages, measuring and predicting reliability, problems with interfacing, problems with integration
2. Audits of systems development efforts reveal shortcomings in projects: lack of standards, failure to
comply with existing standards, non-adherence to model in use, no sin-off at end of stages, lack of project plans, no project control statistics recorded or stored, no quality assurance procedures, no change-control procedures, no configuration control procedures, no records of test data and results
3. The three causes for the lack of control of projects: attitude to quality, attitude to management, attitude
to project
4. In finding solutions, the principal reasons for project management shortcomings should be reviewed.
5. Solutions: Training, management, standards, guidelines, procedures, and checklists, quality assurance (QA), QA team, audits, planning, reporting, feedback, continuo review, project manager, non-technical support team.
The Hewlett Packard’s TQC Guidelines for Software Engineering Productivity involves the following procedures and policies (se [Keyes 2003])
• The HP’s productivity equation
Productivity = function_of_doing_the_right_things × function_of_doing_things_right • Cultural organizational issues are addressed to be able to motivate support positive changes.
Productivity managers are used in each division: understand productivity and quality issues, evaluate,
42
select, and install CASE tools, communicate best software engineering practices, training, establish productivity and quality metrics, a group productivity council created to share the best R&D practices across divisions, metrics definition, metrics tracing, productivity councils, software quality and productivity assessment, communication best practices
• A software metrics council was created consisting of QA managers and engineers whose objective was
to identify key software metrics and promote their use.
• Project/product quality metrics: break-even time measures return on investment, time-to-market measures responsiveness and competitiveness, kiviat diagram measures variables that affect software quality and productivity.
• Progress quality metrics: turnover rate measures morale, training measures investment in career
development.
• Basic software quality metrics: Code size (KNCSS which is thousands of lines noncomment source statements), number of pre-release defects requiring fix, pre-release defect density, calendar months for pre-release QA, total pre-release QA test hours, number of post-release defect reported after one year, post-release defect density, calendar months from investigation checkpoint to release.
• The system software certifications program was established to ensure measurable, consistent, high-
quality software. The four metrics chosen were: breadth (measures the testing coverage of user-accessible and internal functionality of the product), depth (measures te proportion of instructions or blocks of instructions executed during the testing process), reliability (measures the stability and robustness of a product and its ability to recover gracefully from error conditions, defect density (measures the quantity and severity of reported defects found and a product’s readiness for use).
3.4 Software Process Rules of Thumb Considering the process related aspects in requirements engineering, Ebert has founded the following general experience about the project phases [Ebert 2005].
Figure 30: Project definition, priorities and incremental development
43
An estimation of the expenditures based on activity for a conventional project is given by [Royce 1998] shown in the following table.
ACTIVITY COST Management 5% Requirements 5%
Design 10% Code and unit testing 30% Integration and test 40%
Deployment 5% Environment 5%
Total 100% Table 4: Expenditures by activity for a conventional software project Two examples of the rules of thumb are given by Verzuh in [Verzuh 2005] considering the cost of mistakes in a project:
“If a defect caused by incorrect requirements is fixed in the construction of maintenance phase, it can cost 50 to 200 times as much to fix as it would have in the requirements phase.” “Each hour spent on quality assurance activities such as design reviews saves 3 to 10 hours on downstream costs.”
Experiences related to the function points (FP) are summarized by Sneed [Sneed 2005] and consider the “produced” FP per hour during the software development in different industrial domains shown in the following diagram.
0
50
100
150
200
250
300
350
Ban
king
Ass
uran
ce
Gov
erna
nce
Trad
ing
Indu
stry
Figure 31: Function Points per hour in different IT domains 3.5 Software Process Experiments Experiments are usually performed in an environment resembling a laboratory to ensure a high amount of control while carrying out the experiment. The assignments of the different factors for the experiment are allotted totally at random. More about this random assignment can be found in the following sections. The main task of an experiment is to manipulate variables and to measure the effects they cause. This measurement data is the basis for the statistical analysis that is performed afterwards. In case that it is not possible to assign the factors through random assignment, so-called quasi-experiments can be used instead of the experiments described above.
44
Experiments are used for instance to confirm existing theories, to validate measures or to evaluate the accuracy of models [Wohlin 2000]. Other than surveys and case studies the experiments only provide data for a quantitative study. The difference between case studies and experiments is that case studies have a more observational character. They track specific attributes or establish relationships between attributes but do not manipulate them. In other words they observe the on-going project. The characteristic of an experiment in this case is that control is the main aspect and that the essential factors are not only identified but also manipulated. It is also possible to see a difference between case studies and surveys. A case study is performed during the execution of a project. The survey looks at the project in retrospect. Although it is possible to perform a survey before starting a project as a kind of prediction of the outcome, the experience used to do this is based on former knowledge and hence based on those experiences gained in the past. Carrying out experiments in the field of Software Engineering is different from other fields of application [Juristo 2003]. In software engineering several aspects are rather difficult to establish. These are: Find variable definitions that are accepted by everyone, Prove that the measures are nominal or ordinal scale, Validation of indirect measures: models and direct measures have to be validated. To be able to carry out an experiment several steps have to be performed [Basili 1986]: The definition of the experiment, The planning, Carrying out the experiment, Analysis and Interpretation of the outcomes, Presentation of the results. Now we take a more detailed look on the different steps mentioned above. The Experiment definition is the basis for the whole experiment. It is crucial that this definition is performed with some caution. When the definition is not well founded and interpreted the whole effort spent could have been done in vain and one worse thing to happen is that the result of the experiment is not displaying what was intended.The definition sets up the objective of the experiment. Following a framework can do this. The GQM templates could supply such a framework for example [Solingen 1999]. After finishing the definition, the planning step has to be performed. While the previous step was to answer the question why the experiment is performed, this step answers the question how the experiment will be carried out. 6 different stages will be needed to complete the planning phase [Wohlin 2000]. Context selection: The environment in which the experiment will be carried out is selected. Hypothesis formulation and variable selection: Hypothesis testing is the main aspect for statistical analysis when carrying out experiments. The goal is to reject the hypothesis with the help of the collected data gained through the experiment. In the case that the hypothesis is rejected it is possible to draw conclusion out of it. More details about hypothesis testing can be read in the following sections. The selection of variables is a difficult task.Two kinds of variables have to be identified: dependent and independent ones. This also includes the choice of scale type and range of the different variables. The section above also contains more information about dependent and independent variables. Subject selection: It is performed through sampling methods. Different kinds of sampling can be found at the end of this chapter. This step is the fundament for the later generalisation. Therefore the selection chosen here has to be representative for the whole population. The act of sampling the population can be performed in two ways either probabilistic or non-probabilistic. The difference between those two methods is that in the latter the probability of choosing a sample of the selection is not known. Simple random sampling and systematic sampling, just to name two, are probability-sampling techniques. Those and other methods can be found at the end of this chapter. The size of the sample also has influence on the generalisation. A rule of thumb is that the larger the sample is the lower the error in generalising the results will be. There are some general principles described in [Juristo 2003]:
• If there is large variability in the population, a large sample size is needed.
• The analysis of the data may influence the choice of the sample size. It is therefore needed to consider how the data shall be analysed already at the design stage of the experiment.
Experiment design: The design tells how the tests are being organized and performed. An experiment is so to speak a series of tests. A close relationship between the design and the statistical analysis exists and they have effect on each other. The choices taken before (measurement scale, etc.) and a closer look at the null-hypothesis help to find the appropriate statistical method to be able to reject the hypothesis. The following sections provide a deeper view into the subject described shortly above.
45
Instrumentation: In this step the instruments needed for the experiment are being developed. Therefore three different aspects have to be addressed: experiment objects (i.e. specification and code documents), guidelines (i.e. process description and checklists) and measurement. Using instrumentation does not affect the outcome of the experiment. It is only used to provide means for performing and to monitor experiments [Wohlin 2000]. Validity evaluation: After the experiments are carried out the question arises how valid the results are. Therefore, it is necessary to think of possibilities to check the validity.
The following components are an important vocabulary needed for the software engineering experimentation process: Dependent & Independent variables: Variables that are being manipulated or controlled are called independent variables. When variables are used to study the effects of the manipulation etc. they are called dependent; Factors: independent variables that are used to study the effect when manipulating them. All the other independent variables remain unchanged; Treatment: a specific value of a factor is called treatment; Object & Subject: an example for an object is a review of a document. A subject is the person carrying out the review. Both can be independent variables; Test (sometimes referred to as Trial): an experiment is built up using several tests. Each single test is structured in treatment, objects and subjects. However, these tests should not be mixed up with statistical tests, Experimental error: gives an indication of how much confidence can be put in the experiment. It is affected by how many tests have been carried out; Validity: there are four kinds of validity: internal validity (validity within the environment and reliability of the results), external validity (how general are the findings), construct validity (how does the treatment reflects the cause construct) and conclusion validity (relationship between treatment and outcome), Randomisation: the analysis of the data has to be done from independent random variables. It can also be used to select subjects out of the population and to average out effects, Blocking: is used to eliminate effects that are not desired, Balancing: when each treatment has the same number of subjects it is called balanced. Software engineering experimentation could be supported by the following sampling methods [Wohlin 2000]: Simple random sampling: the subjects that are selected are randomly chosen out of a list of the population. Systematic sampling: only the first subject is selected randomly out of the list of the population. After that every n-the subject is chosen. Stratified random sampling: first the population is divided into different strata, also referred to as groups, with a known distribution between the different strata. Second the random sampling is applied to every stratum. Convenience sampling: the nearest and most convenient subjects are selected. Quota sampling: various elements of the population are desired. Therefore convenience sampling is applied to get every single subject. CONTROLLED EXPERIMENTS: The advantage of this approach is that it promotes comparison and statistical analysis. Controlled here means that the experiment follows the steps as mentioned above (Basili 1986], [Zelkowitz 1997]): Experiment definition: it should provide answers to the following questions: “what is studied?” (object of study),”what is the intention?” (purpose), “which effect is studied?” (quality focus), “whose view is represented?” (perspective) and “where is the study conducted?” (context). Experiment planning: null hypothesis and alternative hypothesis is formulated. The details (personnel, environment, measuring scale, etc.) are determined and the dependent and independent variables are chosen. First thoughts about the validity of the results. Experiment realization: the experiment is carried out according to the baselines established in the design and planning step. The data is collected and validated. Experiment analysis: the data collection gathered during the realization is the basis for this step. First descriptive statistics are applied to gain an understanding of the submitted data. The data is informally interpreted. Now the decision has to be made how the data can be reduced. After the reduction the hypothesis test is performed. More about hypothesis testing can be found in the following sections. Portrayal of the results and conclusion about the hypothesis: the analysis provides the information that is needed to decide whether the hypothesis was rejected or accepted. These conclusions are collected and documented. This paper comprises the lessons learned. The quality of the design decides whether the study is a success or a failure. So it is very important to meticulously design the experiment [Juristo 2003]. Several principles of how to design an experiment are known. Those are randomisation, blocking and balancing. In general a combination of the three methods is applied. The experimental design can be divided into several standard design types. The difference between them
46
is that they have distinct factors and treatment. The first group relies on one factor, the second on two and the third group on more than two factors. 3.6 Software Process Case Studies A case study is used to monitor the project. Throughout the study data is collected. This data is then investigated with statistical methods. The aim is to track variables or to establish relationships between different variables that have a leading role or effect on the outcome of the study. With the help of this kind of strategy it is possible to build a prediction model. The statistical analysis methods used for this kind of study consists of linear regression and principle component analysis. A disadvantage of this study is the generalisation. Depending on the kind of result it can be very difficult to find a corresponding generalisation. This also influences the interpretation and makes it more difficult. Like the survey the case study can provide data for both qualitative and quantitative research. The following table shows an overview about used management practices in European companies from Dutta et al. cited from [Emam 2005].
Organizational Structure and Management Practices Adoption Percentage
Nominating software project managers for each project 92 Having the software project manager report to a business project manager responsible for the project’s overall benefits to the business
81
Software quality assurance function with independent reporting line from software development project management
48
Establishing a change control function for each project 55 Required training program for new project managers to familiarize them
40
Maintaining awareness of CASE or other new software engineering technologies
41
Ensuring user/customer/marketing input at all stages of the project
64
Ensure availability of critical non-software resources according to plan
45
Table 5: Percentage of respondents in a European survey of management practices
An overview about the delivered defects per Function Points is shown in the following table by [Emam 2005].
Small projects Medium projects Large projects Business Domain Average Best Average Best Average Best
MIS 0.15 0.025 0.588 0.066 1.062 0.27 System software 0.25 0.013 0.44 0.08 0.726 0.15
Table 7: Percentages of process activities in different kinds of projects
The following case study from Rubin is cited from [Emam 2005] and considers QA and metrics programs in companies worldwide.
Business Domain Existence of a QA Function (%)
Existence of a Metrics Program (%)
Aerospace 52 39 Computer manufacturing 70 42 Distribution 16 - Finance 57 25 Government 30 5 Health 51 8 Manufacturing 52 25 Oil and gas 40 20 Software 60 36 Telecommunication 54 44 Transportation 33 33 Utility 40 10
Table 8: Percentage of Organizations having QA and metrics efforts in place Based on a worldwide survey 3.7 Software Process Metrics and Measures A special form of formulas for measuring software reliability based on the failure rates and probabilistic characteristics of software systems are [Singpurwalla 1999]:
• Jelinski-Moranda model: Jelinski and Moranda assume that the software contains an unknown number of, say N, of bugs and that each time the software fails, a bug is detected and corrected and the failure rate Ti is proportional to N – i + 1 the number of remaining the code.
• Baysian reliability growth model: This model devoid a consideration that the relationship between the
relationship between the number of bugs and the frequency of failure is tenuous.
48
• Musa-Okumoto models: These models are based on the postulation a relationship between the intensity
function and the mean value function of a Poisson process that has gained popularity with users.
• General order statistics models: This kind of models is based on statistical order functions. The motivation for ordering comes from many applications like hydrology, strength of materials and reliability.
• Concatenated failure rate model: These models introduce the infinite memories for storage the failure
rates where the notion infinite memory is akin to the notion of invertibility in time series analysis. A simple evaluation of the priorities of the requirements based on a relationship matrix is defined by Kandt in the following manner [Kandt 2006]:
pi = n
n
jjia∏
=1,
The priorities of each attribute ai,j were executed as an approximation by computing pi. Another formula by Kandt helps to evaluate the SQA situation as Requirements coverage = (Number of Requirements traced to functional test cases)/
(Number of requirements) System architecture statement coverage = (Executed SLOC of system architecture)/
(Total SLOC of system architecture) System architecture edge coverage = (Executed decision outcomes of system architecture)/ (Total decision outcomes of system architecture) System Statement coverage = (Executed SLOC of system)/(Total SLOC of system) System edge coverage = (Executed decision outcomes of system)/
(Total decision outcomes of system)
Otherwise, the defect estimation techniques are summarized by Kandt in the following manner [Kandt 2006]
D1 = (l × d) - Dd where D1 stands for the number of remaining defects in a module, l is the number code lines, d is the typical number of defects per source line of code, and Dd is the number of detected defects.
D2 = ((N1 + N2)log(n1 + n2))/3000 - Dd
as an estimation based on the Halstead’s software science. Finally as a capture-recapture technique for defect estimation the formula
D3 = (m1 × m2)/( m12 - (m1 + m2 – m12) where m1 and m2 are the number of defects found in these research groups and m12 denotes the common defects found in both groups. The customer cost of a software product was executed by Emam [Emam 2005] in the following manner. Customer Cost = Defect_density × KLOC × Cost_per_defect × Defects_find_by_customer The return on investment (ROI) was executed by Emam as [Emam 2005] as ROI1 = (Cost saved – Investment)/ Investment
ROI2 = (Cost saved – Investment)/ Original cost
49
New cost= Original cost × (1- ROI2)
Schedule reduction = (Original schedule – New schedule)/ Original schedule [personal month] The general relationship between different indicators of quality, quantity, effort and productivity are defined by Sneed in the following manner [Sneed 2005]:
Especially, different kinds of software process effort estimation are using the point approach [Lother 2001]. Some of these point metrics are:
(IFPUG) Function Points: The function point method is based on counting system components relating to their functionality such as input, output, inquiries, files, and interfaces ([Albrecht 1983], [Dreger 1989]). These characteristics were weighted by a classification of simple, average and complex (s, a, c) and leads to the (unadjusted) function points (UFP) as
UFP = a × inputs + b × outputs + c × requires + d × files + e × interfaces with the (s, a, c) for a =(3,4,6), b=(4,5,7), c=(3,4,6), d=(7,10,15), and e=(5,7,10). The adjusted function points (FP) are executed by application of a weighted number (0 … 5) for every 14 factors (cost drivers) as data communication, distributed functions, performance requirement, hardware configuration, high transaction rate, online data entry, end-user efficiency, online update, complex processing, reusable requirements, ease of installation, operational ease, multiple sites, and ease of modification. The special kind of execution is
FP = 0.65 + 0.01 × cost drivers The effort estimation is based on experience data and could be executed by [Bundschuh 2000]
Person month ≈ 0.015216 FP1.29 The IFPUG Function Point method is well-established and was supported by the International Function Point User Group (IFPUG). Mark II Function Points: This method is modification of the function point method described above by changing the viewpoint to the data-based system approach [Symons 1993]. The counting characteristics are input, entities referenced, and output. The weight factors are quite different to the FP method (0.58 for inputs, 1.66 for entities referenced and 0.26 for outputs).
FP = 0.58 Wi + 1.66 We + 0.26 Wo The 14 FP adjustment factors were extended by six other factors considering actual system aspects and leads to the possibility of effort estimation. Data Points: The data point method was created by Sneed and is based on the analysis of information systems [Sneed 1990]. The general execution of the data point is
Data point = information points + communication points The information points are counted from the data model and the communication points evaluate the user interface. The estimation process was supported by different weight factors for the different system
50
Object Points: One of the objects point method was defined by Sneed and consider the different characteristics of OO system design [Sneed 1996]. The counted elements for object points (OP) are
• in the class diagram: class=4, non inherited attribute: 1, non inherited method: 3, class association: 2
• in the sequence diagram: message: 2, parameter: 1,sender: 2, potential receiver: 2
• in the use case diagram: online use case: 2×#outputs, batch use case: 4×#outputs, system use
case: 8×#outputs
The consideration of the complexity leads a classification of low (75 percent of the OP), average complexity (100 percent of the OP), and high complexity (12 percent of the OP).
Feature Points: The feature point method (FPM) was defined by Jones considers the other/new kinds of systems like real time, embedded or communication software [Jones 1991]. The execution of the unadjusted feature points is
FPM =#algorithms×3 + #inputs×4 + #outputs×5 + #inquiries×4 + #data_files×7 + #interfaces×7 In order to estimate the effort adjustment principle was used like in the IFPUG FP methodology described above.
3-D Function Points: This point metric considers the following three evaluation areas (dimensions) and was defined by Whitmire [Whitmire 1992]:
• the data model according to IFPUG FP), • the functional model considering the number of functions and their complexity
• the process model counting the control statements as system states and state transitions
Use Case Points: The use case point metric is addressed to UML-based software modelling and implementing (see [Sneed 2005]). The use case points (UCP) are computed as
UCP = TCP × ECF × UUCP × PF where TCP stands for the technical complexity factors which evaluate by weights the technological type of the system such as distributed system, reusability, concurrent etc., ECF the environmental complexity factors which characterize the system background like stability of the requirements, experience in OO and UML etc., UUCP the unadjusted use case points which counts the different use case diagram components, PF the productivity factors which weights the UCP considering the person hours per use case. COSMIC FFP: The COSMIC Full Function Point (FFP) method was developed in the Common Software Measurement International Consortium (COSMIC) and is established as ISO/IEC 19761 (see [Ebert 2004]). A full function point only considers a data movement which means that there are not a (weighted) difference between inputs, outputs etc. The Cfsu (COSMIC functional size unit) is the FFP measurement unit. The basic for COSMIC FFP counting is
FFP = counting(((entry,exits),(reads,writes))archictureLevel i ) [Cfsu]
The COSMIC FFP measurement method is designed to be independent of the implementation decisions embedded in the operational artefacts of the software to be measured. To achieve this characteristic, measurement is applied to the (functional user requirement) FUR of the software to be measured expressed in the form of the COSMIC FFP generic software model. This form of the FUR is obtained by
51
a mapping process from the FUR as supplied in or implied in the actual artefacts of the software. The architectural reasoning of boundaries is given through the software layers such as tiers, service structures or component deployments. The functional size of software is directly proportional to the number of its data transactions. All data movement sub processes move data contained in exactly one data group. Entries move data from the users across the boundary to the inside of the functional process; exits move data from the inside of the functional process across the boundary to the users; reads and writes move data from and to persistent storage.
An overview about the history of function points is shown in the following figure created in [Fetcke 1999], [Lother 2001] and [Dumke 2005a].
Figure 32: The history of function point methods development
DeMarco'sBang Metric
ISO FSMStandardsData Points Object Points
ISO1996and 14143
DeMarco 1982 Sneed 1989 Sneed 1994
Full FunctionPoints (FFP)
1.0
FeaturePoints
3-D FunctionPoints
St.Pierre et al.1997
Jones 1986 Boeing 1991
Function PointAnalysis (FPA)
Function PointAnalysis
Function PointAnalysis 3.4
Function PointAnalysis 4.0
Function PointAnalysis 4.1
COSMICFFP 2.0
COSMIC-FFP2.2 Standard
IBM Albrecht1979
Albrecht1984
IFPUG1990
COSMIC1999
COSMIC2003IFPUG 1994 IFPUG 19991975
Mark II FPA1.3.1Mark II FPA
Symons 1988 UKSMA 1996
Further methods of estimation are based on the size of the developed software system. Examples of these estimation methods are (see also [Bielak 2000], [Boehm 2000a], and [Hale 2000]):
COCOMO: The Constructive Cost Model (COCOMO) was defined by Boehm [Boehm 1984] and is based on the formula
Personal effort = scale_factors × KDSItype_of_project [PM] where KDSI means Kilo Delivered Source Instruction that must be estimated at the beginning. The scale factors define the cost drivers Boehm classify three types of projects: organic, semidetached, and embedded. COCOMO II: The COCOMO II approach extends the set of cost drivers and considers the different/new aspects of software systems like code adaptation, reuse and maintenance. Furthermore, it is possible to execute/estimate the development time TDEV as
TDEV = scale_factors × PMcalibration
Helpful variants of COCOMO II are COPSEMO (Constructive Phased Schedule and Effort Model), CORADMO (Constructive Rapid Application Development cost Model), COCOTS (Constructive COTS cost model), COQUALMO (Constructive Quality cost Model) and COPROMO (Constructive Productivity cost Model). A special kind of COCOMO is called as early design model equation and was executed by (see also [Keyes 2003])
Effort = KLOC × adjustment_factor
52
SLIM: Considering the Software Life Cycle Management (SLIM) Putnam adapted the Rayleigh curve for the software development area in the following manner [Putnam 1992]
Current_effort = (Total_effort/duration)× t × e(-t×t/2×duration)
where duration stands for the square of total duration of the development and t means the time point of evaluation. The current effort was measured in personal years. Another kind of estimation based on the Rayleigh formula is known as software equation (see also [Keyes 2003]) as
where the technology_constant depends on the development methodology. WOA: The Weighted Average of Individual Offsets (WOA) model supports the defect estimation based on inspection data [Biffl 2000]. The WOA model uses weights for individual estimation contributions and calculates the number of unique defects found by e team as
#defects = D + Σ((defect_before-inspection – exported_defects)×weights)/ Σ weights A special method of project visualization is defined by Hansen and uses different colours in order to mark different levels of development like implementation proposal, function description, design description, code and test [Hansen 2006]. 3.8 Process Metrics Repositories During software process measurement the results are stored in different kinds of metrics databases and metrics repositories [Braungarten 2005]. Special kinds of metrics exploration lead to experience bases known as experience factories. The following figure shows some layers about metrics data bases (MDB). Figure 33: Layers of metrics data bases
53
MDB’s are built from any kind of measurement and evaluation. A special kind of process-related MDB, the International Software Benchmarking Standards Group (ISBSG), maintains a repository of data from numerous organizations’ completed software projects ([Hill 1999], [Lokan 2001]). The ISBSG database includes the following parameters of a project [Braungarten 2005].
Project Data Parameters
Project ID (A primary key, for identifying projects.)
Count Approach (A description of the technique used to count the function points; e.g. IFPUG, MKII, NESMA, COSMIC-FFP etc.)
Function Points (The adjusted function point count number. Adjusted by the Value Adjustment Factor.)
Function Size Metric Used (The functional size metric used to record the size of the project, e.g.. IFPUG3, IFPUG4, in-house etc.)
Value Adjustment Factor (The adjustment to the function points, applied by the project submitter, that takes into account various technical and quality characteristics e.g.: data communications, end user efficiency etc. This data is not reported for some projects, (i.e. it equals 1).)
Counting Technique (The technology used to support the counting process. Certain technologies used in function point counting can impact on the count’s potential accuracy.)
Development Platform (Defines the primary development platform, (as determined by the operating system used). Each project is classified as either, a PC, Mid Range or Mainframe.)
Summary Work Effort (Provides the total effort in hours recorded against the project by the development organization. The three methods provided for are A, B and C.)
Resource Level (Data is collected about the people whose time is included in the work effort data reported. Four levels (1 to 4) are identified in the data collection instrument.)
Data Quality Rating (This field contains an ISBSG rating code of A, B, C or D applied to the project data by the ISBSG quality reviewers.)
Max Team Size (The maximum number of people that worked at any time on the project, (peak team size).)
Development Type (This field describes whether the development was a new development, enhancement or re-development.)
Reference Table Approach (This describes the approach used to handle counting of tables of code or reference data, (a comment field).)
Architecture (Defines the architecture type of the project. e.g.: Client/Server, LAN, WAN etc.)
Language Type Defines the language type used for the project: e.g. 3GL, 4GL, Application Generator etc.
Primary Programming Language The primary language used for the development: JAVA, C++, PL/1, Natural, Cobol etc.
DBMS Used (Whether the project used a DBMS.)
Upper CASE Used (Whether project used upper CASE tool.)
Lower CASE Used (with code generator) (Whether project used lower CASE tool with code generator.)
Integrated CASE Used (Whether project used integrated CASE tool.)
Used Methodology (States whether a methodology was used.)
Project Elapsed Time (Total elapsed time for project in months.)
Development Techniques (Techniques used during development. (e.g.: JAD, Data Modeling, OO Analysis etc.).)
How Methodology Acquired (Describes whether the methodology was purchased or developed in-house.)
Project Inactive Time (This is the number of months in which no activity occurred, (e.g. awaiting client sign off, awaiting acceptance test data). This time, subtracted from Project Elapsed Time, derives the elapsed time spent working on the project.)
Implementation Date (Actual date of implementation. (Note: the date is shown in the data in date format 1/mm/yy).)
Defects Delivered (Defects reported in the first month of system use. Three columns in the data covering the number of Extreme, Major and Minor defects reported.)
User Base – Business Units (Number of business units that the system services, (or project business stakeholders).)
User Base – Locations (Number of physical locations being serviced/supported by the installed system.)
User Base – Concurrent Users (Number of users using the system concurrently.)
54
Organization Type (This identifies the type of organization that submitted the project. (e.g.: Banking, Manufacturing, and Retail).)
Business Area Type (This identifies the type of business area being addressed by the project where this is different to the organization type. (e.g.: Manufacturing, Personnel, and Finance).)
Application Type (This identifies the type of application being addressed by the project. (e.g.: information system, transaction/production system, process control.))
Package Customization (This indicates whether the project was a package customization. (Yes or No).)
Degree of Customization (If the project was based on an existing package, this field provides comments on how much customization was involved.)
Project Scope (This data indicates what tasks were included in the project work effort data recorded. These are: Planning, Specify, Design, Build, Test, and Implement.)
Work Effort Breakdown (When provided in the submission, these fields contain the breakdown of the work effort reported by five categories: Plan, Specify, Build, Test and Implement.)
Ratio of Project Work Effort to Non-Project Activity (The ratio of Project Work Effort to Non-Project Activities.)
Percentage of Uncollected Work Effort (The percentage of Work Effort not reflected in the reported data. i.e. an estimate of the work effort time not collected by the method used.)
Function Point Categories (When provided in the submission, the following five fields which breakdown the Function Count are provided: external Inputs, external Outputs, external Enquiries, internal logical files, and external interface files.)
Enhancement Data (When provided in the submission, for enhancement projects the three fields Additions, Changes, and Deletions, which breakdown the Function Point Count are provided.)
Total Defects Delivered (Defects reported in the first month of system use. This column shows the total of Extreme, Major and Minor defects reported. Where no breakdown is available, the single value is shown here.)
Source Lines of Code (SLOC) (A count of the SLOC produced by the project.)
Unadjusted Function Points (The unadjusted function point count (before any adjustment by a Value Adjustment Factor if used).)
Normalized Work Effort (For projects covering less than a full development life-cycle, this value is an estimate of the full development life-cycle effort. For projects covering the full development life-cycle, and projects where development life-cycle coverage is not known, this value is the same as Summary Work Effort.)
Work Effort Unphased (Where no phase breakdown is provided in the submission, this field contains the same value as the Summary Work Effort. Where phase breakdown is provided in the submission, and the sum of that breakdown does not equal the Summary Work Effort, the difference is shown here.)
Unadjusted Function Point Rating (This field contains an ISBSG rating code of A, B, C or D applied to the unadjusted function point count data by the ISBSG quality reviewers.)
Productivity Rates Parameters
Project ID (The primary key, for identifying projects.)
Normalized Productivity Delivery Rate (Project productivity delivery rate in hours per function point calculated from Normalized Work Effort divided by Unadjusted Function Point count. Use of normalized effort and unadjusted count should render more comparable rates.)
Project Productivity Rate (Project productivity delivery rate in hours per function point calculated from Summary Work Effort divided by Unadjusted Function Point count.)
Normalized Productivity Delivery Rate (adjusted) (Project productivity delivery rate in hours per function point calculated from Normalized Work Effort divided by Adjusted Function Point count.)
Reported Productivity Delivery Rate (adjusted) (Project productivity delivery rate in hours per function point calculated from Summary Work Effort divided by Adjusted Function Point count.)
Table 9: Attributes of the ISBSG Benchmarking Data CD Release 8
The following diagram shows the distribution of projects (stored in the ISBSG repository 2003) considering provided defect data [Emam 2005].
55
0,00
2,00
4,00
6,00
8,00
10,00
12,00
14,00
Figure 34: Distribution by business domain of ISBSG projects that provided defect data in percentage Currently, it is possible to use the ISBSG data repository in the Web showing the following component of the Functional Size e-Measurement Portal (FSeMP) [Lother 2004]. Figure 35: The ISBSG repository using in the Web
56
Aiming at the development of higher quality software systems at lower costs complying with the Quality Improvement Paradigm (QIP), this challenge leads to the development of so called Experience Factories incorporating repositories, which Basili defines as following (see [Braungarten 2005]):
“The Experience Factory is the organization that supports reuse of experience and collective learning by developing, updating and delivering upon request to the project organizations clusters of competencies [..] as experience packages.”
“The Experience Factory is a logical and/or physical organization that supports project developments by analyzing and synthesizing all kinds of experience, acting as a repository for such experience, and supplying that experience to various projects on demand.”
EXPERIENCE
BASE (EB)
ANALYZE
Project
Management (Execute process)
Project Planning (characterize,
set goals, choose process)
PACKAGE
Generalize
Tailor
Formalize
PROJECT SUPPORT
Execution plans
Environment characteristics
Project analysis
Goals, processes,tools, products,
resource models, defect models
Data, lessons learned
Experience Factory (EF) Project Organization (PO)
Figure 36: The concept of Basili’s Experience Factory
Finally, we will characterize very shortly three approaches of measurement repositories described in [Braungarten 2006] and [Wille 2006].
• Measurement Data Warehouse
o Data Integration Approach: Data Consolidation o Data Integration Technology: ETL o Storage: Analytical Transactional-processing databases, DW
Spreadsheets
CASE tool‘smeasurement stores /
Operational DB
DataWarehouse
Data Marts
Serve
OLAP Servers Tools
ExtractTransform
LoadTools
Analysis
Reporting
Data Mining
MetadataRepository
Administration
Integrator
Spreadsheets
CASE tool‘smeasurement stores /
Operational DB
DataWarehouse
Data Marts
Serve
OLAP Servers Tools
ExtractTransform
LoadTools
Analysis
Reporting
Data Mining
MetadataRepository
Administration
Integrator
Figure 37: The measurement data warehouse approach
57
• Mediated Measurement Repository:
o Data Integration Approach: Data Federation o Data Integration Technology: EII o Storage: Mediated schema provides access to measurement data sources (type does not
matter)
Measurement Data Integration(Mediator-based system)
Measurement Storage
(type does notmatter)
Analysis
Mediator
Tools
Analysis
Reporting
Data Miningquery
query
Wrapper
Wrapper query
query
CASE tool‘smeasurement stores /
Operational DB
Spreadsheets
MetadataRepository
query
Measurement Data Integration(Mediator-based system)
Measurement Storage
(type does notmatter)
Analysis
Mediator
Tools
Analysis
Reporting
Data Miningquery
query
Wrapper
Wrapper query
query
CASE tool‘smeasurement stores /
Operational DB
Spreadsheets
MetadataRepository
query
Figure 38: The mediated measurement repository
• Service Bus-oriented Measurement Repository:
o Data Integration Approach: Data Propagation o Data Integration Technology: EAI o Storage: propagation from measurement application via service bus to storage or analysis
Figure 39: The service bus-oriented measurement repository
58
4 Holistic Process Measurement Approaches 4.1 The CMMI Metrics Set by Kulpa and Johnson The following set of metrics is defined by Kulpa and Johnson in order to keep the quantified requirements for the different CMMI levels [Kulpa 2003]. ================================================================== CMMI LEVEL 2: ================================================================== Requirements Management
1. Requirements volatility- (percentage of requirements changes) 2. Number of requirements by type or status (defined, reviewed. approved. and implemented) 3. Cumulative number of changes to the allocated requirements, including total number of changes
proposed, open, approved, and incorporated into the system baseline 4. Number of change requests per month, compared to the original number of requirements for the
project 5. Amount of time spent, effort spent, and cost of implementing change requests 6. Number and size of change requests after the Requirements phase is completed 7. Cost of implementing a change request 8. Number of change requests versus the total number of change requests during the life of the
project 9. Number of change requests accepted but not implemented 10. Number of requirements (changes and additions to the baseline)
Project Planning
11. Completion of milestones for the project planning activities compared to the plan (estimates versus actuals)
12. Work completed, effort and funds expended in the project planning activities compared to the plan
13. Number of revisions to the project plan 14. Cost, schedule, and effort variance per plan revision 15. Replanning effort due to change requests 16. Effort expended over time to manage the hmject compared to the plan 17. Frequency, causes, and magnitude of the replanning effort
Project Monitoring and Control
18. Effort and other resources expended in performing monitoring and oversight activities 19. Change activity for the project plan, which includes changes to size estimates of the work
products, cost/resource estimates, and schedule 20. Number of open and closed corrective actions or action items 21. Project milestone dates (planned versus actual) 22. Number of project milestone dates made on time 23. Number and types of reviews performed 24. Schedule, budget, and size variance between planned and actual reviews 25. Comparison of actuals versus estimates for all planning and tracking items
Measurement and Analysis
26. Number of projects using progress and performance measures 27. Number of measurement objectives addressed
Supplier Agreement Management
28. Cost of the COTS (commercial off-the-shelf) products 29. Cost and effort to incorporate the COTS products into the project 30. Number of changes made to the supplier requirements 31. Cost and schedule variance per supplier agreement 32. Costs of the activities for managing the contract compared to the plan 33. Actual delivery dates for contracted products compared to the plan 34. Actual dates of prime contractor deliveries to the subcontractor compared to the plan
59
35. Number of on-time deliveries from the vendor, compared with the contract 36. Number and severity of errors found after delivery 37. Number of exceptions to the contract to ensure schedule adherence 38. Number of quality audits compared to the plan 39. Number of Senior Management reviews to ensure adherence to hudget and schedule versus the
plan 40. Number of contract violations by supplier or vendor
Process and Product Quality Assurance (QA)
41. Completions of milestones for the QA activities compared to the plan 42. Work completed, effort expended in the QA activities compared to the plan 43. Number of product audits and activity reviews compared to the plan 44. Number of process audits and activities versus those planned 45. Number of defects per release and/or build 46. Amount of time/effort spent in rework 47. Amount of QA time/effort spent in each phase of the life cycle 48. Number of reviews and audits versus number of defects found 49. Total number of defects found in internal reviews and testing versus those found by the customer or end
user after delivery 50. Number of defects found in each phase of the life cycle 51. Number of defects injected during each phase of the life cycle 52. Number of noncompliances written versus the number resolved 53. Number of noncompliances elevated to senior management 54. Complexity of module or component (McCabe, MeClure, and Halstead metrics)
Configuration Management (CM)
55. Number of change requests or change board requests processed per unit of time 56. Completions of milestones for the CM activities compared to the plan 57. Work completed, effort expended, and funds expended in the CM activities 58. Number of changes to configuration items 59. Number of configuration audits conducted 60. Number of fixes returned as "Not Yet Fixed" 61. Number of fixes returned as "Could Not Reproduce Error" 62. Number of violations of CM procedures (non-compliance found in audits) 63. Number of outstanding problem reports versus rate of repair 64. Number of times changes are overwritten by someone else (or number of times people have the wrong
initial version or baseline) 65. Number of engineering change proposals proposed, approved, rejected, and implemented 66. Number of changes by category to code source, and to supporting documentation 67. Number of changes by category, type, and severity 68. Source lines of code stored in libraries placed under configuration control
================================================================== CMMI LEVEL 3: ================================================================== Requirements Development
69. Cost, schedule, and effort expended for rework 70. Defect density of requirements specifications 71. Number of requirements approved for build (versus the total number of requirements) 72. Actual number of requirements documented (versus the total number of estimated requirements) 73. Staff hours (total and by Requirements Development activity) 74. Requirements status (percentage of defined specifications out of the total approved and proposed;
number of requirements defined) 75. Estimates of total requirements, total requirements definition effort, requirements analysis effort, and
schedule 76. Number and type of requirements changes
Technical Solution
77. Cost, schedule, and effort expended for rework 78. Number of requirements addressed in the product or productcomponent design
60
79. Size and complexity of the product, product components, interfaces, and documentation 80. Defect density of technical solutions work products (number of defects per page) 81. Number of requirements by status or type throughout the life of the project (for example, number
defined, approved, documented, implemented, tested, and signed-off by phase) 82. Problem reports by severity and length of time they are open 83. Number of requirements changed during implementation and test 84. Effort to analyze proposed changes for each proposed change and cumulative totals 85. Number of changes incorporated into the baseline by category (e.g., interface, security, system
configuration, performance, and useability) 86. Size and cost to implement and test incorporated changes, including initial estimate and actual size
and cost 87. Estimates and actuals of system size, reuse, effort, and schedule 88. The total estimated and actual
staff hours needed to develop the system by job category and activity 89. Estimated dates and actuals for the start and end of each phase of the life cycle 90. Number of diagrams completed versus the estimated total diagrams 91. Number of design modules/units proposed 92. Number of design modules/units delivered 93. Estimates and actuals of total lines of code - new, modified, and reused 94. Estimates and actuals of total design and code modules and units 95. Estimates and actuals for total CPU hours used to date 96. The number of units coded and tested versus the number planned 97. Errors by category, phase discovered, phase injected, type, and severity 98. Estimates of total units, total effort, and schedule 99. System tests planned, executed, passed, or failed 100. Test discrepancies reported, resolved, or not resolved 101. Source code growth by percentage of planned versus actual
Product Integration
102. Product-component integration profile (i.e., product-component assemblies planned and performed, and number of exceptions found)
103. Integration evaluation problem report trends (e.g., number written and number closed) 104. Integration evaluation problem report aging (i.e., how long each problem report has been open)
Verification
105. Verification profile (e.g., the number of verifications planned and performed, and the defects found; perhaps categorized by verification method or type)
106. Number of defects detected by defect category 107. Verification problem report trends (e.g., number written and number closed) 108. Verification problem report status (i.e., how long each problem report has been open) 109. Number of peer reviews performed compared to the plan 110. Overall effort expended on peer reviews compared to the plan 111. Number of work products reviewed compared to the plan
Validation
112. Number of validation activities completed (planned versus actual) 113. Validation problem reports trends (e.g., number written and number closed) 114. Validation problem report aging (i.e., how long each problem report has been open)
Organizational Process Focus 115. Number of process improvement proposals submitted, accepted, or implemented 116. CMMI maturity or capability level 117. Work completed, effort and funds expended in the organization's activities for process assessment,
development, and improvement compared to the plans for these activities 118. Results of each process assessment, compared to the results and recommendations of previous
assessments Organizational Process Definition
119. Percentage of projects using the process architectures and process elements of the organization's set of standard processes
120. Defect density of each process element of the organization's set of standard processes 121. Number of on-schedule milestones for process development and maintenance 122. Costs for the process definition activities
61
Organizational Training
123. Number of training courses delivered (e.g., planned versus actual) 124. Post-training evaluation ratings 125. Training program quality surveys 126. Actual attendance at each training course compared to the projected attendance 127. Progress in improving training courses compared to the organization's and projects' training plans 128. Number of training waivers approved over time
Integrated Project Management for IPPD
129. Number of changes to the project's defined process 130. Effort to tailor the organization's set of standard processes 131. Interface coordination issue trends (e.g., number identified and closed)
Risk Management
132. Number of risks identified, managed, tracked, and controlled 133. Risk exposure and changes to the risk exposure for each assessed risk, and as a summary percentage
of management reserve 134. Change activity for the risk mitigation plans (e.g., processes, schedules, funding) 135. Number of occurrences of unanticipated risks 136. Risk categorization volatility 137. Estimated versus actual risk mitigation effort 138. Estimated versus actual risk impact 139. The amount of effort and time spent on risk management activities versus the number of actual risks 140. The cost of risk management versus the cost of actual risks 141. For each identified risk, the realized adverse impact compared to the estimated impact
Integrated Teaming
142. Performance according to plans, commitments, and procedures for the integrated team, and deviations from expectations
143. Number of times team objectives were not achieved 144. Actual effort and other resources expended by one group to support another group or groups, and
vice versa 145. Actual completion of specific tasks and milestones by one group to support the activities of other
groups, and vice versa Integrated Supplier Management
146. Effort expended to manage the evaluation of sources and selection of suppliers 147. Number of changes to the requirements in the supplier agreement 148. Number of documented commitments between the project and the supplier 149. Interface coordination issue trends (e.g., number identified and number closed) 150. Number of defects detected in supplied products (during integration and after delivery)
Decision Analysis and Resolution
151. Cost-to-benefit ratio of using formal evaluation processes Organizational Environment for Integration
152. Parameters for key operating characteristics of the work environment ================================================================== CMMI LEVEL 4: ================================================================== Organizational Process Performance
153. Trends in the organization's process performance with respect to changes in work products and task attributes (e.g., size growth, effort, schedule, and quality)
Quantitative Project Management
154. Time between failures 155. Critical resource utilization 156. Number and severity of defects in the released product
62
157. Number and severity of customer complaints concerning the provided service 158. Number of defects removed by product verification activities (perhaps by type of verification, such
as peer reviews and testing) 159. Defect escape rates 160. Number and density of defects by severity found during the first year following product delivery or
start of service 161. Cycle time 162. Amount of rework time 163. Requirements volatility (i.e., number of requirements changes per phase) 164. Ratios of estimated to measured values of the planning parameters (e.g., size, cost, and schedule) 165. Coverage and efficiency of peer reviews (i.e., number/amount of products reviewed compared to
total number, and number of defects found per hour) 166. Test coverage and efficiency (i.e., number/amount of products tested compared to total number, and
number of defects found per hour) 167. Effectiveness of training (i.e., percent of planned training completed and test scores) 168. Reliability (i.e., mean time-to-failure usually measured during integration and systems test) 169. Percentage of the total defects inserted or found in the different phases of the project life cycle 170. Percentage of the total effort expended in the different phases of the project life cycle 171. Profile of subprocesses under statistical management (i.e., number planned to be under statistical
management, number currently being statistically managed, and number that are statistically stable)
172. Number of special causes of variation identified 173. The cost over time for the quantitative process management activities compared to the plan 174. The accomplishment of schedule milestones for quantitative process management activities
compared to the approved plan (i.e., establishing the process measurements to be used on the project, determining how the process data will be collected, and collecting the process data)
175. The cost of poor quality (e.g., amount of rework, re-reviews and re-testing) 176. The costs for achieving quality goals (e.g., amount of initial reviews, audits, and testing)
================================================================== CMMI LEVEL 5: ================================================================== Organizational Innovation and Deployment
177. Change in quality after improvements (e.g., number of reduced defects) 178. Change in process performance after improvements (e.g., change in baselines) 179. The overall technology change activity, including number, type, and size of changes 180. The effect of implementing the technology change compared to the goals (e.g., actual cost saving to
projected) 181. The number of process improvement proposals submitted and implemented for each process area 182. The number of process improvement proposals submitted by each project, group, and department 183. The number and types of awards and recognitions received by each of the projects, groups, and
departments 184. The response time for handling process improvement proposals 185. Number of process improvement proposals accepted per reporting period 186. The overall change activity including number, type, and size of changes 187. The effect of implementing each process improvement compared to its defined goals 188. Overall performance of the organization's and projects' processes, including effectiveness, quality,
and productivity compared to their defined goals 189. Overall productivity and quality trends for each project 190. Process measurements that relate to the indicators of the customers' satisfaction (e.g., surveys results,
number of customer complaints, and number of customer compliments)
Causal Analysis and Resolution 191. Defect data (problem reports, defects reported by the customer, defects reported by the user, defects
found in peer reviews, defects found in testing, process capability problems, time and cost for identifying the defect and fixing it, estimated cost of not fixing the problem)
192. Number of root causes removed 193. Change in quality or process performance per instance of the causal analysis and resolution process
(e.g., number of defects and changes in baseline)
63
194. The costs of defect prevention activities (e.g., holding causal analysis meetings and implementing action items), cumulatively
195. The time and cost for identifying the defects and correcting them compared to the estimated cost of not correcting the defects
196. Profiles measuring the number of action items proposed, open, and completed 197. The number of defects injected in each stage, cumulatively, and over-releases of similar products 198. The number of defects
================================================================== Now, we will describe some statistical methods supporting the Statistical Process Control especially (see [Dumke 2004] , [Pandian 2004], [Putnam 2003], [Zelkowitz 1997] and [Zuse 2003]). 4.2 Statistical Software Process (SPC) Approach by Pandian Statistical Process Control provides a way of handling the increasing complexity of software engineering. In this preprint the statistical basics were introduced and an example was provided to show how this approach is practically applied. To be able to use it in a profitable way it is necessary to gain experience with this approach. With the oblige experience it is a very powerful tool for controlling the software processes being developed at the moment but also for the planning of future projects. This means that the overall effort decreases while the quality increases [Dumke 2004]. The following SPC approach of Pandian [Pandian 204] is based on main principles as
• metrics application structure based on a management perspective considering the
o process management (control management, capability, knowledge engineering, characterization, modelling, prediction, simulation, optimization)
balanced scorecard, information system, decision making, decision analysis, problem solving, resource balancing, skill mapping, training, assets management)
o engineering management estimation, requirement, design, coding, effort profile, time analysis,
test, review)
o support process management (defect control, defect management, defect prevention, reliability modelling, causal models, defect classification, defect database, defect signature, process goal setting, process QFD)
• designing a metrics system is based on a general metrics system architecture including the following levels
1. goals (goal definition and deployment) 2. decisions (application of models, decision making, decision centers)
3. models (knowledge capsules as metrics data analysis and model building)
4. metrics (indicators or signals involving the metrics construction)
5. measurement (based on sensor systems producing data collections
64
• metrics data visualization involving the use of different diagrams and relationship visualization. There are several control chart forms in use. The following charts may be useful:
o X-bar chart with UCL and LCL o X-bar - R chart with UCL and LCL o X-bar - S chart with UCL and LCL o p Chart (percentage defectives) with UCL and LCL o u Chart (defects per unit size) with UCL and LCL o c Chart (defect counts per module) with UCL and LCL
where UCL stands for upper control limit and LCL means lower control limit.
• metrics data analysis in frequency domain investigates that all processes show variations that will
become evident if a frequency distribution is drawn on the process metric. Helpful considerations are
o central tendency of processes o process spread o measure of dispersion o descriptive statistics o frequency distribution o six sigma analysis
• metrics data analysis in time domain present a “window” in the real world and considers temporal
patterns in metrics. Interesting aspects are
Tests for Control Charts as o Test #1: Any point outside one of the control limits is an indication of a special cause and
needs to be investigated. o Test #2: A run of seven points in succession, either all above the central line or below the
central line or all increasing or all decreasing, is an indication of a special cause and needs to be investigated.
o Test #3: Any unusual pattern or trend involving cyclic or drift behaviour of the data is an indication of a special cause and needs to be investigated.
o Test #4: The proportion of points in the middle-third zone of the distance between the control limits should be about two thirds of all the points under observation.
Control Chart in the Presence of Trend: If the metric shows trend, such as delivered defect density (DDD), the control charts may be partitioned to make a clearer presentation of the problem. The trend line helps in forecasting and risk estimation. The baseline helps in process analysis, estimation, and setting process guidelines. Dual Process Control Charts: Sometimes the metric is a product of two major components, each showing its own independent characteristics. Defects found by design review, for instance, are a product of defect injected and review effectiveness, shown in the following equation.
Defects Found = Defects Injected * Review Effectiveness
From Dual Limits to Single Limits: The control chart in Figure 54 is cluttered, and one has to strain to read, analyze, and interpret the chart. When the chart is used to give process feedback, some process owners may mix signals, one demanding a minimum production of defects, another may demand just the opposite. Multi-Process Tracking Model: A simple way to take a holistic and balanced view of processes is to track all related process metrics on a radar chart, marking the target values and the achieved values. Cost drivers, performance drivers, and defect drivers in software development can be plotted on the radar chart for effective process control. The following is a list of metrics used to represent and measure goals:
o Customer satisfaction index (CUST SAT) o Productivity index (PROD) o Employee satisfaction index (EMP SAT) o Right first time index (RFT) o Defect removal effectiveness (DRE) o Training need fulfilment index (TNF)
65
Dynamic Model - Automated Control Charts: Control charts in modern times have taken a totally new form. They are embedded in metric databases and analysis modules, which perform dynamic functions. Control Chart for Effective Application: Most software development processes follow the learning curve, both first order and second order. Before process stability is achieved, the learning curve is encountered. Chronological order gives control charts the vital meaning and power. A decision rule must be provided to enable problem recognition. The rule could be expressed in the following ways:
o Control limits o Specification limits o Baseline references o Estimated values o Process goals o Process constraints o Benchmark values o Expected trend o Zones
Modernism in Process Control - Decision Support Charts: Metrics data, when presented in time series, offers a new form that helps to understand the process. A well-structured time series chart could emerge into a model once it captures a pattern that can be applied as a historic lesson. The time series analysis for trend or process control is also a time series model of the process, inasmuch as it can increase one's understanding of the process behaviour and forecast.
• metrics data analysis in relationship domain is based on the process network and can be symbolically
represented as a map of relationships between metrics. Helpful methods are correlation and regression. Example of these methods application are
o Regression Model Application - Causal Analysis: Regression models are naturally poised for causal analysis application. The x-y relationship is a cause-effect relationship (in the predictor-predicted sense).
o Regression Model Application - Optimum Team Size: A regression model of team size on productivity reveals the real picture. The nonlinear model does permit optimization of team size; it imposes a constraint equation on software projects.
o Regression Model Application - Building an Effort Estimation Model: Predicting effort from size has been a favourite game for several researchers. They go by the name of cost models and estimation models. Our objective here is to apply regression modelling to design an effort estimation model from data commonly available in projects, namely, effort and size.
• process models leads us from analysis to system thinking. The Pandian approach describes the following activities which will be supported by process models
o process management (process capability study, process control, process improvement,
process optimization) o project management (strategic management, technology management, knowledge
management, uncertainty management) o Forecasting (prediction, risk analysis, estimation, planning) o Learning (process characterization, process simulation, decision analysis, problem solving,
training and learning). Further considerations in the Pandian approach are addressed to estimation models, metrics for defect management, online use of metrics (as a kind of e-measurement), and metrics-based decision support systems.
66
4.3 Statistical Process Control Approach by Florac and Carleton The application of the Statistical Software Process (SPC) by Florac and Carleton ([Florac 1999] and [Florac 2000]) is based on the following general characterization of software process management:
• Define the process as
o Design processes that can meet or support business and technical objectives o Identify and define the issues, models, and measures that relate to the performance of the
processes
• Measuring the process as
o Collect data that measure the performance of each process o Analyze the performance of each process
o Retain und use the data as follows: to assess process stability and capability, to interpret the
results of observations and analyses, to predict future costs and performance, to provide baselines an benchmarks, to plot trends, to identify opportunities for improvement
• Controlling the process as
o Determine whether or not the process is under control (is stable with respect to the inherent variability of measured performance)
o Identify performance variations that are caused by process anomalies (assignable causes)
o Eliminate the sources of assignable causes so as to stabilize the process
• Improve the process as
o Understand the characteristics of existing processes and the factors that affect process capability
o Plan, justify, and implement actions that modify the processes so as to better meet business
needs
o Assess the impacts and benefits gained, and compare these to the costs of changes made to the processes
The Florac/Carleton approach is addressed to the beginning of process measurement and explains the different steps using statistics in the process measurement, data collection and behaviour description especially.
67
5 Open Questions and Future Directions Further software process approaches that must be evaluated exist and are being developed. We will describe some of these as follows
• Multi project management suggest a single goal set for managing mega projects [Venugopal 2005] and leads to high complex analysis, evaluation and controlling.
• Distributed project management can lead to the following problems [Nidiffer 2005]
o Strategic: difficulty leveraging available resources,
o Project and process management: difficulty synchronizing work between distributed sites,
o Communication: lack of effective communication mechanism,
o Cultural: conflicting behaviours, processes, and technologies,
o Technical: incompatible data formats and exchanges,
o Security: ensuring electronic transmissions’ confidentiality and privacy.
• The Grid Software Process considers software systems like desktop supercomputing, smart instruments, collaborative environments, distributed supercomputing, and high throughput [Aloisio 2006]. This approach includes grid design pattern such as authorization service pattern, grid executable catalog pattern, grid store pattern, replica location service pattern, and grid credential repository.
Furthermore, we can establish the following/future directions in software process analysis, measurement and evaluation:
Software Process Repositories: This aspect of processes considers the complexity and quality of metrics databases and repositories. Essential investigations should be addressed to ([Braungarten 2005], [Braungarten 2005a], [Dumke 2000], [Wille 2006])
• Deriving the software measurement process from the IT process explicitly (note that the
most improvement standards like CMMI and ISO 9001 describes the measurement processes implicitly or use a general characteristic such as assessment (SPICE) or examination (V quality process model) only)
• Describing the (process) measurement considering the data, experience and information
background stored in metrics databases and repositories and in experience factories
• Deriving a maturity description for metrics repositories in order to keep a successful introduction/installation of metrics repositories which are manageable and meaningful.
ITIL-based Process Effectiveness: Investigating the software processes like CBSE the process improvement for small IT companies should be analyzed involving ([Blazey 2002], [Dumke 2004])
• The analysis of supporting methods and tools for the IT processes and their complexity and
appropriateness • The adaptation of the ITIL approach in order to fulfil the IT process network of activities
and sub processes
• The concept of effective workflow in the project management considering the small companies characterizations.
68
Multi Project Management: The research considering this theme should involve the following aspects
• Multi project management considering different kinds of development systems, different teams and process areas
• Adaptation of EAI intentions to the SOA paradigm in an industrial environment of
telecommunication
• Automating project planning and monitoring using Web-based simulation system EAI-SIM.
Causalities in Process Measurement and Evaluation: Software process maturity levels including more or less software (process) measurement activities and structures. The relationships between the different activities and (quality) results could be analyzed in the following manner ([Dumke 2004], [Dumke 2005a], [Dumke 2006], [Richter 2005]),
• Considering the different parts and components of the software process under different
process maturity levels • Analysis of the relationships between these process components and artefacts based on a
general causal model as a semantic network
• Conception of quality assessment methodology based on the quality causalities in order to achieve different process maturity levels.
Appropriateness of Process Evaluation Models: The IT processes under market constraints are more and more evolutionary processes. Hence, we establish more and more process evaluation models (CMMI, SPICE etc.) adaptations and modifications. The appropriateness of such models in industrial environments could be considered as follows ([Hegewald 1991], [Dumke 2005b])
• scalability and granularity of software process evaluation approaches based on an explicit
process description model • analysis of the industrial, technological, and system-related appropriateness of such process
evaluation models
• Conception of a scalable process evaluation model and validation in a chosen industrial IT area.
69
6 References [Albrecht 1983] Albrecht, A. J.; Gaffney, J. E.: Software Function, Source Lines of Code, and Development
Effort Prediction. IEEE Transactions on Software Engineering, 9(183)6, pp. 639-648
[Aloisio 2006] Aloisio, G.; Caffaro, M.; Epicoco, I. : A Grid Software Process. In: Cunha/Rana: Grid Computing – Software Environments and Tools, Springer Publ., 2006, pp. 75-98
[April 2005] April, A.: S3m-Model to Evaluate and Improve the Quality of Software Maintenance Process. Shaker Publ., Aachen, Germany 2005
[Armour 2004] Armour, P. G.: The Laws of Software Process – A New Model for the Production and Management of Software. CRC Press, 2004
[Augustine 2005] Augustine, S.; Payne, B.; Sencindiver, F.; Woodcock, S.: Agile Project Management: Steering from the Edges. Comm. Of the ACM, 8(2005)12, pp. 85-89
[Basili 2001] Basili, V. R.; Boehm, B. W.: COTS-Based Systems Top 10 List. IEEE Computer, May 2001, pp. 91-95
[Basili 1986] Basili, V. R.; Selby, R. W.; Hutchens, D. H.: Experimentation in Software Engineering. IEEE Transactions on Software Engineering, 12(1986)7, pp. 733-743
[Bergstra 2001] Bergsta, J. A.; Ponse, A.; Smolka, S. .: Handbook of Process Algebra. Elsevier Publ., 2001
[Bielak 2000] Bielak, J.: Improving Size Estimate Using Historical Data. IEEE Software, Nov./Dec. 2000, pp. 27-35
[Biffl 2000] Biffl, S.: Using Inspection Data for Defect Estimation. IEEE Software, Nov./Dec. 2000, pp. 36-43
[Blazey 2002] Blazey, M.: Softwaremessansätze für komponentenbasierte Produkttechnoogien am Beispiel der EJB. Diploma Thesis, University of Magdeburg, Dept. of Computer Science, 2002
[Boehm 2000] Boehm, B. W.: Software Cost Estimation with COCOMO II. Prentice Hall, 2000
[Boehm 1984] Boehm, B. W.: Software Engineering Economics. IEEE Transactions on Software Engineering, 10(19841, pp. 4-21
[Boehm 2000a] Boehm, B. W.: Software Estimation Perspectives. IEEE Software, Nov./Dec. 2000, pp. 22-26
[Boehm 2000b] Boehm, B. W.; Basili, V. R.: Gaining Intellectual Control of Software Development. IEEE Software, May 2000, pp. 27-33
[Boehm 2005] Boehm, B. W.; Turner, R.: Management Challenges to Implementing Agile Processes in Traditional Development Organizations. IEEE Software, Sept./Oct. 2005, pp. 30-39
[Braungarten 2006] Braungarten, R.; Kunz, R.; Dumke, R.: Service-orientierte Software-Messinfrastrukturen. Presentation at the Bosch Metrics Community, Stuttgart, March 2006
[Braungarten 2005] Braungarten, R.; Kunz, M.; Dumke, R.: An Approach to Classify Software Measurement Storage Facilities. Preprint No 2, University of Magdeburg, Dept. of Computer Science, 2005
[Braungarten 2005a] Braungarten, R.; Kunz, M.; Farooq, A.; Dumke, R.: Towards Meaningful Metrics Data Bases. Proc. of the 15th IWSM, Montreal, Sept. 2005, pp. 1-34
[Chrissis 2003] Chrissis, M. B.; Konrad, M.; Shrum, S.: CMMI – Guidelines for Process Integration and Product Improvement. Addison-Wesley 2003
[Chung 2000] Chung, L.; Nixon, B. A.; Yu, E.; Mylopoulos, J.: Non-Functional Requirements in Software Engineering. Kluwer Academic Publ., 2000
[Clements 2005] Clements, P. C.; Lawrence, G. J.; Northop, L. M.; McGregor, J. D.: Project Management n a Software Product Line Organization,. IEEE Software, Sept./Oct. 2005, pp. 54-62
[Davis 1995] Davis, A. M.: 201 Principles of Software Development. McGraw Hill Publ., 1995
70
[Deek 2005] Deek, F. P.; McHugh, J. A. M.; Eljabiri, O. M.: Strategic Software Engineering – An Interdisciplinary Approach. Auerbach Publications, Boca Raton London New York, 2005
[Donzelli 2006] Donzelli P.: A Decision Support System for Software Project Management. IEEE Software July/August 2006, pp. 67-74
[Dreger 1989] Dreger, J. B.: Function Point Analysis. Prentice Hall, 1989
[Dumke 2003] Dumke, R.: Software Engineering – Eine Einführung für Informatiker und Ingenieure. (4th edn) Vieweg Publ., 2003
[Dumke 2005b] Dumke, R.: Software Measurement Frameworks. Proc. of the 3rd World Congress on Software Quality, Munich, Sept. 2005, Online Proceedings
[Dumke 2006] Dumke, R.; Blazey, M.; Hegewald, H.; Reitz, D.; Richter, K.: Causalities in Software Process Measurement. Accepted to the MENSURA 2006, Cardiz, Spain, Nov. 2006
[Dumke 2004] Dumke, R.; Cotè, I.; Andruschak, O.: Statistical Process Control (SPC) – A Metrics-Based Point of View of Software Processes Achieving the CMMI Level Four. Preprint No. 7, University of Magdeburg, Fakultät für Informatik, 2004
[Dumke 1999] Dumke, R.; Foltin, E.: An Object-Oriented Software Measurement and Evaluation Framework. Proc. of the FESMA, October 4-8, 1999, Amsterdam, pp. 59-68
[Dumke 2000] Dumke, R.; Foltin, E.; Schmietendorf, A.: Metriken-Datenbanken in der Informations-verarbeitung. Preprint No 8 University of Magdeburg, Dept. of Computer Science, 2000
[Dumke 2003] Dumke, R.; Lother, M.; Wille, C.; Zbrog, F.: Web Engineering. Pearson Education Publ., 2003
[Dumke 2005b] Dumke, R.; Kunz, M.; Hegewald, H.; Yazbek, H.: An Agent-Based Measurement Infrastructure. Proc. of the IWSM 2005, Montreal, Sept. 2005, pp. 415-434
[Dumke 2005a] Dumke, R.; Richter, K.; Fetcke, T.: FSM Influences and Requirements in CMMI-Based Software Processes. In: Abran et al.: Innovations in Software Measurement. Shaker Publ., 2005, pp. 179-194
[Dumke 2005] Dumke, R.; Schmietendorf, A.; Zuse, H.: Formal Descriptions of Software Measurement and Evaluation - A Short Overview and Evaluation. Preprint No. 4, Fakultät für Informatik, University of Magdeburg, 2005
[Ebert 2004] Ebert, C.; Dumke, R.; Bundschuh, M.; Schmietendorf, A.: Best Practices in Software Measurement. Springer Publ., 2004
[Emam 2005] Eman, K. E.: The ROI from Software Quality. Auerbach Publ., 2005
[Emam 1998] Emam, K. E.; Drouin, J. N.; Melo, W.: SPICE – The Theory and Practie of Software Process Improvement and Capability Determination IEEE Computer Society Press, 1998
[Endres 2003] Endres, Albert; Rombach, D.: A Handbook of Software and System Engineering. Pearson Education Limited, 2003
[Ferguson 1998] Ferguson, J.; Sheard, S.: Leveraging Your CMM Efforts for IEEE/EIA 12207. IEEE Software, September/October 1998, pp. 23-28
[Fetcke 1999] Fetcke, T.: A Generalized Structure for Function Point Analysis. Proc. of the 11th IWSM, Lac Superieur, Canada, Sept. 1999, pp. 143-153
[Florac 1999] Florac, W. A.; Carleton, A. D.: Measuring the Software Process – Satistical Process Conrol for Software Process Improvement. Addison-Wesley Publ., 1999
[Florac 2000] Floac, W. A.; Carleton, A. D.; Barnard, J. R.: Statistical Process Control: Analyzin a Spac Shuttle Onboard Software Process. IEEE Software, July/August 2000, pp. 97-106
[Garcia 2005] Garcia, S.: How Standards Enable Adoption of Project Management Practice. IEEE Software, Sept./Oct. 2005, pp. 22-29
[Hale 2000] Hale, J.; Parrish, A.; Dixon, B.; Smith, R. K.: Enhancing the Cocomo Estimation Models. IEEE Software, Nov./Dec. 2000, pp. 45-49
[Halstead 1977] Halstead, M. H.: Elements of Software Science. Prentice Hall, New York, 1977
71
[Hansen 2006] Hansen, K. T.: Project Visualization for Software. IEEE Software, July/August 2006, pp. 84-92
[Haywood 1998] Haywood, M.: Managing Virtual Teams – Practical Techniques for High-Technology Project Managers. Artech House, Boston, London, 1998
[Hegewald 1991] Hegewald, H.: Implementation des Prototyps eines Softwarebewertungsplatzes. Diploma Thesis, University of Magdeburg, Dept. of Computer Science, 1991
[Horn 2002] Horn, E.; Reinke, T.: Softwarearchitektur und Softwarebauelemente. Hanser Publ., 2002
[Humphrey 2000] Humphrey, W. S.: The Personal Software Process: Status and Trends. IEEE Software, Nov/Dec. 2000, pp. 71-75
[ITIL 2006] The ITIL Home Page, http://www.itil.org.uk/what.htm, (see July 24, 2006)
[Johnson 2005] Johnson, P. M.; Kou, H.; Paulding, M.;Zhang, Q.; Kagaw, A.; Yamashita, T.: Improving Software Development Management through Software Project Telemetry. IEEE Software, July/August 2005, pp. 78-85
[Jones 1991] Jones, C.: Applied Software Measurement – Assuring Productivity and Quality McGraw Hill Publ., 1991
[Juristo 2003] Juristo, N.; Moreno, A. M.: Basics of Software Engineering Experimentation. Kluwer Academic Publishers, Boston, 2003
[Kamatar 2000] Kamatar, J.; Hayes, W.: An Experience Report on the Personal Software Process. IEEE Software, Nov/Dec. 2000, pp. 85-89
[Kandt 2006] Kandt, R. K.: Software Engineering Quality Practices. Auerbach Publications, Boca Raton New York, 2006
[Kenett 1999] Kenett, R. S.; Baker, E. R.: Software Process Quality – Management and Control. Marcel Dekker Inc., 1999
[Kitchenham 1997] Kitchenham et al.: Evaluation and assessment in software engineering. Information and Software Technology, 39(1997), pp. 731-734
[Kulpa 2003] Kulpa, M. K.; Johnson, K. A.: Interpreting the CMMI – A Process Improvement Approach. CRC Press Company, 2003
[Kunz 2006] Kunz, M.; Schmietendorf, A.; Dumke, R.; Wille, C.: Towards a Service-Oriented Measurement Infrastructure. Proc. of the 3rd Software Measurement European Forum (SMEF), May 10-12, 2006, Rome, Italy, pp. 197-207
[Lecky-Thompson 2005] Lecky-Thompson, G. W.: Corporate Software Project Management. Charles River Media Inc., USA, 2005
[Lepasaar 2001] Lepasaar, M.; Varkoi, T.; Jaakkola, H.: Models and Succes Factors of Process Change. In: Bomarius/Komi-Sirviö: Product Focused Software Process Improvement. PROFES 2001, Kaiserslautern, Sept. 2001, LNCS 2188, Springer Publ., 2001, pp. 68-77
[Lokan 2001] Lokan, C.; Wright, T.; Hill, P. R; Stringer, M.: Organizational Benchmarking Using the ISGSG Data Repository. IEEE Software, Sept./Oct. 2001, pp. 26-32
[Lother 2004] Lother, M.; Braungarten, R.; Kunz, M.; Dumke, R.: The Functional Size e-Measurement Portal (FSeMP). In: Abran et al: Software Measurement – Research and Application, Shaker Publ., 2004, pp.27-40
[Lother 2001] Lother, M.; Dumke, R.: Point Metrics – Comparison and Analysis. In Dumke/Abran: Current Trend in Software Measurement, Shaker Publ., 2001
[Maciaszek 2001] Maciaszek, L. A.: Requirements Analysis and System Design – Development Informatik Systems with UML. Addison Wesley Publ., 2001
[Marciniak 1994] Marciniak, J. J.: Encyclopedia of Software Engineering. Vol. I and II, John Wiley & Sons Inc., 1994
[Messerschmitt 2003] Messerschmitt, D. G.; Szyperski, C.: Software Ecosystem – Understanding an Indispensable Technology and Industry. MIT Press, 2003
[Milner 1989] Milner, R.: Communication and Concurrency. Prentice Hall Publ., 1989
[Nidiffer 2005] Nidiffer, K. .; Dolan, D.: Evolving Distributed Project Management. IEEE Software, Sept./Oct. 2005, pp. 63-72
[Pandian 2004] Pandian, C. R.: Software Metrics – A Guide to Planning, Analysis, and Application. CRC Press Company, 2004
[Putnam 2003] Putnam, L. H.; Myers, W.: Five Core Metrics – The Intelligence Behind Successful Software Management. Dorset House Publishing, New York, 2003
[Putnam 1992] Putnam, L. H.; Myers, W.: Measures for Excellence – Reliable Software in Time, within Budgets. Yourdon Press Publ., 1992
[Reitz 2005] Reitz, D.; Schmietendorf, A.; Dumke, R.: Tool supported monitoring and estimations in EAI multi projects. Proc. of the IWSM 2005, Montreal, Sept. 2005, pp. 53-66
[Reitz 2003] Reitz, D.; Schmietendorf, A.; Dumke, R.; Lezius, J.; Schlosser, T.: Aspekte des empirischen Software Engineering im Umfeld von Enterprise Application Integration. Preprint No 5, University of Magdeburg, Dept. of Computer Science, 2003
[Richter 200] Richter, K.: Softwaregrößenmessug im Kontext von Software-Prozessbewertungsmodellen. Diploma Thesis, University of Magdeburg, 2005
[Royce 2005] Royce, W.: Successful Software Management Style: Steering and Balance. IEEE Software, Sept./Oct. 2005, pp. 40-47
[Schmietendorf 2003] Schmietendorf, A.; Dumke, R.: Performance analysis of an EAI application integration. Proc. of the UKPE, Warwick, July 2003, pp. 218-230
[Schmietendorf 2004] Schmietendorf, A.; Reitz D.; Dumke, R.: Project reporting in the context of an EAI project with the aid of Web-based portal. Proc. of the CONQUEST 2004, Nuremberg, Sept. 2004, pp. 47-57
[SEI 2002] SEI: Capability Maturity Model Integration (CMMISM), Version 1.1, Software Engineering Institute, Pittsburgh, March 2002, CMMI-SE/SW/IPPD/SS, V1.1
[Singpurwalla 1999] Singpurwalla, N. D.; Wilson, S. P.: Statistical Methods in Software Engineering. Springer Publ., 1999
[Sneed 1990] Sneed, H.: Die Data-Point-Methode. Online, DV Journal, May 1990, pp.48
[Sneed 1996] Sneed, H.: Schätzung der Entwicklungskosten von objektorientierter Software. Informatik-Spektrum, 19(1996)3, pp. 133
[Solingen 1999] Solingen, v. R.; Berghout, E.: The Goal/Question/Metric Method. McGraw Hill Publ., 1999
[SPICE 2006] The SPICE Web Site, http://www.sqi.gu.edu.au/spice/ (seen July 24, 2006)
[Ullwer 2006] Ullwer, C.: Konzeption und prototypische Realisierung einer Telemetrie-basierten Mess-Architektur. Diploma Thesis, University of Magdeburg, Dept. of Computer Science, July 2006
[Venugopal 2005] Venugopal, C.: Single Goal Set: A New paradigm for IT Megaproject Success. IEEE Software, Sept./Oct. 2005, pp. 48-53
[Verzuh 2005] Verzuh, E.: The Fast Forward MBA in Project Management. John Wiley & Sons, 2005
[Walter 2006] Walter, Z.; Scott, G.: Management Issues of Internet/Web Systems. Comm. of the ACM, 49(2006)2, pp.87-91
[Wang 2000] Wang, Y.; King, G.: Software Engineering Processes – Principles and Applications. CRC Press, Boca Raton London New York, 2000
[Wangenheim 2006] Wangenheim, C. .v.; Anacleto, A.; Saliano, C. F.: Helping Small Companies Assess Software Processes. IEEE Software, Jan./Febr. 2006, pp. 91-98
[White 2004] White, S.A.: Introduction to the BPMN. IBM Corporation, 2004
73
[Whitmire 1992] Whitmire, S.: 3-D Function Points: Scientific and Real-time Extensions of Function Points. Proc. of the Pacific Northwest Software Quality Conference, 1992
[Wille 2006] Wille, C.; Braungarten, R.; Dumke, R.: Addressing Drawbacks of Software Measurement Data Integration. Proc. o the SMEF 2006, Rome, Italy, May 2006
[Wohlin 2000] Wohlin, C, Runeson, P, Höst, M, Ohlsson, M, Regnell, B, Wesslén, A.: Experimentation in Software Engineering: An Introduction. Kluwer Academic Publishers, Boston, 2000
[Wong 2001] Wong, B. Jefferey, R.: Cognitive Structures of Software Evaluation: A Means-End Chain Analysis of Quality. . In: Bomarius/Komi-Sirviö: Product Focused Software Process Improvement. PROFES 2001, Kaiserslautern, Sept. 2001, LNCS 2188, Springer Publ., 2001, pp. 6-26
[Zelkowitz 1997] Zelkowitz, M. V.; Wallace, D. R.: Experimental Models for Validating Technology. IEEE Computer, May 1998, pp. 23-31
[Zettel 2001] Zettel, J.; Maurr, F.; Münch, J.; Wong, L.: LIPE: A Lightweight Process for E-Business Startup Companies Based on Extreme Programming. In: Bomarius/Komi-Sirviö: Product Focused Software Process Improvement. PROFES 2001, Kaiserslautern, Sept. 2001, LNCS 2188, Springer Publ., 2001, pp. 255-270
[Zhong 2000] Zhong, X.; Madhavji, N. H. Emam, K. E.: Critical Factors Affecting Personal Software Processes. IEEE Software, Nov./Dec. 2000, pp. 76-83
[Zuse 2003] Zuse, H.: What can Practioneers learn from Measurement Theory. In: Dumke et al.: Investigations in Software Measurement, Proc. of the IWSM 2003, Montreal, September 2003, pp. 175-176