35
Soil & Water Management Plan Hybrid Solar Power Station Jabiru, Northern Territory Draft Interim Report 24 March 2021

Soil & Water Management Plan Hybrid Solar Power Station Jabiru, Northern Territory Draft Interim Report 24 March 2021

Soil & Water Management Plan Hybrid Solar Power Station Jabiru, Northern Territory Draft Interim Report 24 March 2021
RELIANCE, USES, and LIMITATIONS
This document is copyright and is to be used only for its intended purpose by the intended recipient and is not to be copied or used in any other way. The document may be relied upon for its intended purpose within the limits of the following disclaimer.
This document and analysis are based on the information available to EnviroConsult Australia Pty Ltd registered business name Surface Water & Erosion Solutions at the time of preparation. EnviroConsult Australia Pty Ltd accepts responsibility for the document to the extent that the information was enough and accurate at the time of preparation. EnviroConsult Australia Pty Ltd does not take responsibility for errors and omissions due to incorrect information or information not available at the time of preparation of the proposal and any initial analysis undertaken.

Page 1
Table of Contents List of Tables ....................................................................................................................................... 2
List of Figures ...................................................................................................................................... 2
1. Introduction .......................................................................................................................... 3
Purpose of this report ............................................................................................................. 3
Erosion and Sediment Control Requirements ........................................................................ 3
Surface Hydrology & Erosion Risk ......................................................................................... 3
Location .................................................................................................................................. 4
Rainfall and evaporation ......................................................................................................... 5
Site Inspection ........................................................................................................................ 6
2. Static Flood Assessment Update ....................................................................................... 16
3. Erosion Risk & Sediment Basin Assessment .................................................................... 18
4. Site Hydrology .................................................................................................................... 19
5. Soil and Water Management Plan ..................................................................................... 20
Site Description .................................................................................................................... 20
Soils Information ................................................................................................................... 20
Sediment Control Standards ................................................................................................ 21
Site access ........................................................................................................................... 21
Stormwater Drainage and Type 3 Sediment Trap Design. .................................................. 22
SWMP installation sequence ................................................................................................ 22
Management Responsibilities............................................................................................... 23
Training and Awareness ....................................................................................................... 23
Monitoring and Maintenance ................................................................................................ 23
Plan updates and Variations................................................................................................. 23
6. References ......................................................................................................................... 24
7. Appendices ........................................................................................................................ 25
Appendix A ................................................................................................................................. 26
Appendix B ................................................................................................................................. 27
Appendix C ................................................................................................................................. 28
Appendix D ................................................................................................................................. 29

Page 2
List of Tables
Table 1. Study region stream catchment properties. ........................................................................ 17
List of Figures
Figure 1 Location of the proposed hybrid solar power station at Jabiru. Map grid of Australia zone 53. ............................................................................................................................................................. 4
Figure 2 Mean monthly rainfall and mean daily evaporation for BOM station 14198, Jabiru Airport. . 5
Figure 3. Location of site visit photographs ......................................................................................... 6
Figure 4 Vegetation in eastern panels area ........................................................................................ 7
Figure 5. Bund East boundary road west side .................................................................................... 8
Figure 6. Road north boundary. No sign of flow across road to site ................................................... 9
Figure 7 Open woodland vegetation with annual spear grass near proposed thermal plant ............ 10
Figure 8. Quarry. Looking northwest ................................................................................................. 11
Figure 9. Looking south across water collection resulting from sprinkler runoff ............................... 12
Figure 10. Sewage pond land application area ................................................................................. 13
Figure 11. High point on the west road looking north........................................................................ 14
Figure 12. Erosion feature, east corner. ............................................................................................ 15

Page 3
1. Introduction
Purpose of this report
The Northern Territory’s Department of the Chief Minister (DCM) has commissioned EDL Energy to construct a hybrid solar power station (HSPS) at Jabiru, NT.
This is the soil and water management plan (SWMP) developed in accordance with best practice methods as recommended by the International Erosion Control Association Australasia (IECA 2008) and the Northern Territory Government.
Erosion and Sediment Control Requirements
Erosion and sediment control should follow the specifications of the Northern Territory Government (NTG) relative to the project as stated in the Scope of Works provided by EDL.
Design of the site drainage should have regard to:
• Post-development peak flows from the site do not exceed the pre-development flows for both the minor (10% AEP) and major (1% AEP) design storm events;
• Minimal disturbance to natural waterways and stormwater discharge, both during construction and operation;
• Maintaining adequate soil cover over the tracker foundations; • Drainage risk should be considered and if necessary, temporary drainage shall be provided
by the Generator to prevent erosion and to control sedimentation in accordance with the CEMP. Facilities shall be provided to ensure that flooding and ponding of water caused by construction works is prevented at the Site and surrounding properties.
• EDL is to ensure the design is compliant with recommendations within the Flood Impact Assessment Report.
Surface Hydrology & Erosion Risk
This report is to be read in conjunction with the Surface Hydrology and Erosion Risk Assessment (SWES 2020). Summary findings from that report are as follows.
Surface Hydrology
The site is in the 27.8 km2 Baralil Creek catchment.
Conservative estimates using regional flood frequency estimation methods using a 30m x 30m digital elevation model (DEM) indicated a probable maximum static flood level of ≈17.5m AHD in Baralil Creek at Lot 2303. This is ≈9.5m below the average site level of ≈27 m AHD and based on these estimations, it is considered it is unlikely flood will affect the proposed power station. Conversely it is unlikely that flows, even though increased due to the impervious nature of the power station infrastructure, from the site will adversely affect the flow regimes in Baralil Creek.
Erosion Risk
The site lies on the Koolpinyah Surface, an extensive sandy plain with open woodland vegetation. Surface slopes on the site range from effectively 0% to 2%. The majority of the HSPS site has surface

Page 4
slopes >0.75% and is classified as Class C3 erosion risk which makes the land marginally suitable for development. The remainder of the area is Class S2 making it moderately suitable for development. Soil loss rates determined using the RUSLE had a mode of approximately 16 Tha-1y-1 and range from 0.05 T ha-1 y-1 to 100 T ha-1 y-1.
Location
The proposed HSPS site is on Lot 2303, subdivision of N.T. Portion 2272 Town of Jabiru (Figure 1).
Figure 1 Location of the proposed hybrid solar power station at Jabiru.
Map grid of Australia zone 53.

Page 5
Rainfall and evaporation
Bureau of Meteorology (BOM) daily rainfall records are available for station 14198 at the Jabiru Airport where data have been collected since 1971. This region has a distinct wet season and dry season with an average annual rainfall of 1553.7 mm. Cyclones and monsoons can occur during the wet season from October to April and very little rain falls during the dry season from May to September. Mean monthly rainfalls and evaporation rates are shown in Figure 2.
Figure 2 Mean monthly rainfall and mean daily evaporation for BOM station 14198, Jabiru Airport.

Page 6
Site Inspection
A site inspection was conducted on 17 March 2021. Observations and photographs are given in the following figures. Locations of the photographs are shown in Figure 3
Principal observations are:
• There is little erosion on the site. A number of small rills/gullies were observed in the quarry area (Figure 8) and a small gully developing in the north east corner (Figure 12)
• The sewage land application area will act as a significant vegetation buffer between the site and Baralil Creek (Figure 10)
• The boundary roads act as bunds preventing water flow on and off the site (Figure 5, Figure 6, Figure 11).
• There is a significant northwest / southeast drainage feature through the site (Appendix C). At the time of this site visit this area did not appear to be actively eroding. The road in this area is in a low point and needs to be bunded should water cross the road and cause erosion in the proposed bare earth under the north-south orientated solar panels.
Figure 3. Location of site visit photographs

Page 7
Figure 4 Vegetation in eastern solar panels area
Easting (m), Northing (m):
267242.4, 8600314.4
Description:
Open woodland with wet season spear grass. Located in the east of the site.
17 March 2021

Page 8
Figure 5. Bund East boundary road west side
Easting (m), Northing (m):
267369.7 mE, 8600274.3 mN
Description:
Gravel bund along the fence line on the east boundary road west side.
The wheel tracks show sand accumulation.
17 March 2021
Page 9
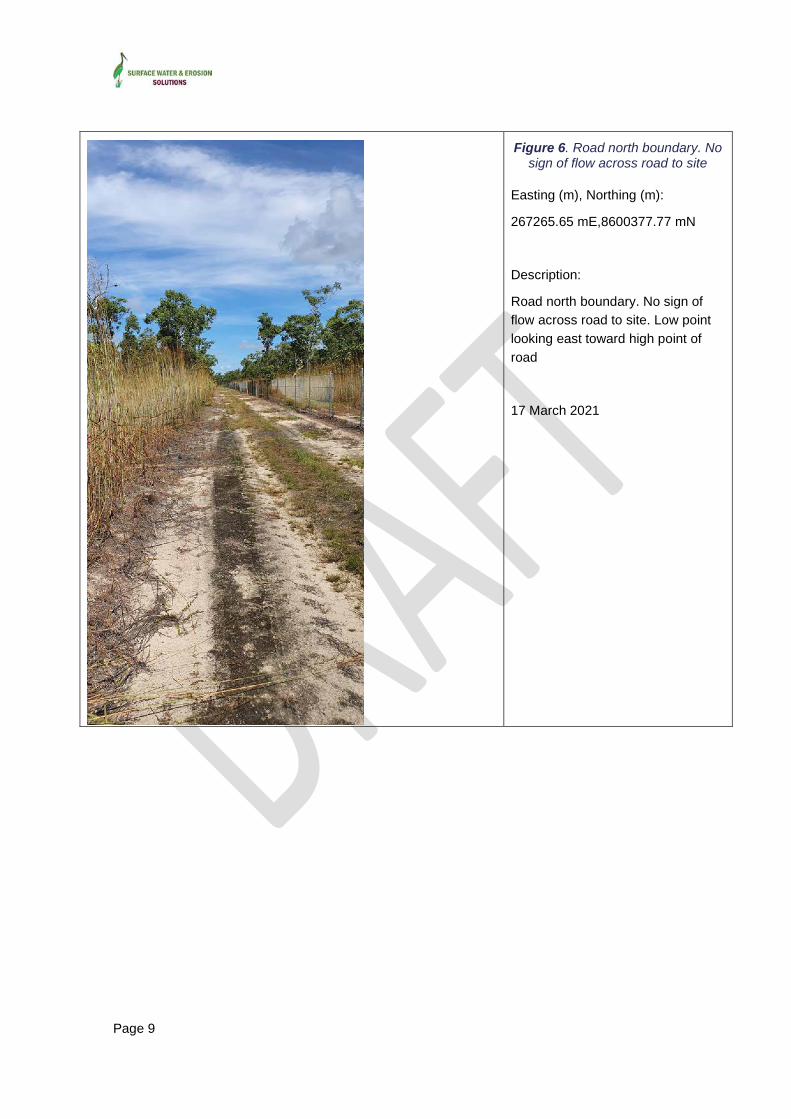
Figure 6. Road north boundary. No sign of flow across road to site
Easting (m), Northing (m):
267265.65 mE,8600377.77 mN
Description:
Road north boundary. No sign of flow across road to site. Low point looking east toward high point of road
17 March 2021

Page 10
Figure 7 Open woodland vegetation with annual spear grass near
proposed thermal plant
Easting (m), Northing (m):
266883.99 mE,8600314.31 mN
Description:
Open woodland vegetation with annual spear grass near proposed thermal plant.
17 March 2021

Page 11
Figure 8. Quarry. Looking northwest
Easting (m), Northing (m):
692948.9, 8600106
Description:
Quarry looking northwest. There are rills present, and a vegetation buffer should be maintained between the solar panels and this area to protect the solar panels should gully erosion develop in the quarry back uphill towards the panels.
17 March 2021

Page 12
Figure 9. Looking south across water collection resulting from
sprinkler runoff
Easting (m), Northing (m):
267365.93 mE,8599834.06 mN
Description:
Southern road acting as bund where water from the waste water application area to the north drains and is retained by road bunding.
17 March 2021

Page 13
Figure 10. Sewage pond land application area
Easting (m), Northing (m):
267087.09 mE,8600101.05 mN
Description:
Sewage Ponds land application area draining south to access road which acts as a bund. This area provides a suitable vegetation buffer between the HSPS site and Baralil Creek.
23 February 2018

Page 14
Figure 11. High point on the west road looking north.
Site: High point west road look North
Easting (m), Northing (m):
266806.13 mE,8600214.02 mN
Description:
High point west road looking North
The road surface is constructed from local material and the road acts as a bund preventing flow on to and flow off the site
17 March 2021

Page 15
Figure 12. Erosion feature,north east corner.
Easting (m), Northing (m):
267360.43 mE,8600376.93 mN
Description:
There very few erosion features on site. This small developing gully in the northeast corner of the perimeter is easily repaired. Features like this should be repaired immediately after the regular inspection.
17 March 2021

Page 16
2. Static Flood Assessment Update
It is a requirement that EDL is to ensure the design of the SWMP is compliant with recommendations within the Flood Impact Assessment Report. The relative recommendation in the Notice of Intent Surface Water & Erosion report (SWES 2020) was,
1. Detailed hydrologic and 2-dimentional hydraulic modelling is required to confirm the impacts of the development, particularly if there will be infrastructure changes in Jabiru.
It is understood that there will be no infrastructure changes in Jabiru therefore, the original static flood level assessment was updated using the 2.5m x 2.5 m digital elevation model (DEM) available for this study.
The original static flood assessment (SWES 2020) was based on aerial photograph interpretation and GIS analysis using Quantum GIS (QGIS.org 2020), ESRI imagery, BOM Geofabric data and GeoScience Australia’s 1’ SRTM digital elevation data. The 1’ SRTM data were provided as a 30 x 30m DEM.
The static flood levels in Baralil Creek were updated using the 2.5m x 2.5m DEM available from the NTG. Flood study accuracy improves with increasing DEM resolution.
Flood peak discharges in Baralil Creek were estimated using Regional Flood Frequency Estimation (RFFE) methods (Rahman, et al. 2015) for a 1% Annual Exceedance Probability (AEP) event (Table 1).
The probable maximum flood (PMF) peak discharge was derived through extrapolation of the RFFE curves to a 2000-year event peak discharge (Ball, et al. 2019) using the best-fit equation for the expected quantiles of the RFFE (Table 1).
Flood inundation levels were derived by iteratively fitting velocity and hydraulic radius in Manning’s equation (Manning 1891) and cross-sectional area to obtain the peak discharges similar to the RFFE-derived peak discharges. Updated cross-sections were obtained for the 2.5m DEM and used for fitting new static flood levels. The new levels for the 1% AEP and the 0.05% AEP events were plotted as static flood levels and are shown in Appendix A. These updated levels, based on the higher resolution 2.5m DEM, are significantly lower than the 30m DEM-derived levels indicating little impact on the site. Conversely the 1% AEP peak discharge from the HSPS catchment is 15.45 m3s-1, derived through Monte Carlo simulation in the RORB hydrologic model, is only 5.6% of the catchment discharge of 278 m3s-1 from the Baralil catchment. Increased discharges due to the HSPS represent 0.16% of total discharge in Baralil Creek at the HSPS outlet for the 1% AEP event. Since stormwater drainage controls will be implemented to manage increased discharges from the HSPS there is little risk of adverse impact due to flooding.

Page 17
Table 1. Study region stream catchment properties.
Catchment Unit Baralil Creek at HSPS
catchment outlet HSPS1 catchment
Area km2 23.77 0.62
Stream slope m/m 0.003 0.010
Catchment Outlet
Easting (m)
267499.7 267499.7
Northing (m)
8599602.0 8599602.0
Catchment Centroid
Easting (m)
265351.0 267110.0
Northing (m)
8596566.8 8600118.8
RFFE Peak Q 1% AEP m3s-1 278 15.452
PMF Peak Q m3s-1 1980 -
1 HSPS = hybrid solar power station 2 The HSPS catchment was too small to get reliable results from the RFFE site so these values were determined using Monte Carlo simulations in RORBwin with local loss parameters from the Australian Rainfall & Runoff data hub site (https://data.arr-software.org/).

Page 18
3. Erosion Risk & Sediment Basin Assessment
The existing conditions and the initial assessment of risk of potential erosion at the HSPS site are described in SWES (2020).
The Revised Universal Soil Loss Equation (RUSLE) (Renard, et al. 1997) was used to determine annual erosion rate distribution on the HSPS site.
Geotechnical study results (Construction Sciences 2020) were used to derive parameter values for the RUSLE. Post-construction catchments and sampling locations are shown in Appendix B. The catchments were delineated using the 0.1m x 0.1m DEM provided by the NTG.
The RUSLE is:
A = R K LS P C
where,
A = computed soil loss (T ha-1 y-1),
R = rainfall erosivity factor,
K = soil erodibility factor,
LS = slope length/gradient factor
P = erosion control practice factor, and
C = ground cover and management factor.
Parameter values and erosion rates were derived using the Strategic Environmental & Engineering Consultancy sizing sediment basins tool (SSBT) (www.seec.com.au) in accordance with current International Erosion Control Association guidelines (IECA 2018). Local R and K values were determined using the methods described by Evans et al (2004).
Analysis of the three largest post-construction catchments and access road indicated sandy soils with low erosion rates and that sediment basins were not required. The analysis is shown in Appendix B.

Page 19
4. Site Hydrology
A RORB hydrologic model was developed for the site and sub-catchments delineated for the pre-construction state and the post-construction state (Figures C.1 and C.2, Appendix C).
Stream flow data are not available to calibrate site specific RORB input parameter values Therefore, loss parameter values were obtained from the Australian Rainfall and Runoff Data Hub (https://data.arr-software.org/). The routing parameters, kc, and the fitted exponent, m, were obtained from the RORB model. The constant loss, CL, value is from the ARR Data Hub. IL was fitted by the RORB model during Monte Carlo simulations.
Monte Carlo simulations were conducted within the RORB model to determine the most probable peak discharges for the major 1% AEP design event for the pre- and post-construction states. Implementing discharge controls for the 1% AEP event will also control peak discharge changes for the minor 10% AEP event so no further analysis was conducted for the 10% AEP event.
Peak discharges for the pre- and post-construction conditions were determined at catchment outlets at Junctions B1 outlet, B8, B9 (Table C.1, Appendix C) and access road catchments R 1 and R 2.
These results will be used to design stormwater drainage infrastructure, sediment traps and size flow retardation structures to reduce post-construction peak discharges as required by the NTG.

Page 20
5. Soil and Water Management Plan
The SWMP was prepared in accordance with the IECA guidelines (IECA 2008) and NTG’s technical notes and fact sheets for erosion and sediment control.
Site constraints are:
• The area of the site is >2500m2, • Run off from the site may reach wet land areas of Gulungul Creek and Magela Creek, and • the site’s location is in a region with high intensity rainfalls,
therefore, a SWMP is required.
This plan does not include a water quality monitoring programme or a design and management plan for fuel and oil storage areas. Therefore, it is assumed the site drainage will only convey “clean water”.
All on-site soil erosion and release of sediment-laden stormwater should be minimised at all times through compliance with a current and approved SWMP as amended from time to time.
In circumstances where additional or alternative erosion and sediment control measures are required on site, or a revised SWMP needs to be prepared, then only those works necessary to minimise or prevent environmental harm must be conducted prior to preparation of a revised SWMP.
Site Description
The site is covered with mature and dense open savanna woodland vegetation including annual spear grass species (Figure 4).
Drainage of the site is from north to south. The northern boundary receives flow-on water from the north but, does not seem to have caused erosion in that area. If large volumes of flow entering the site from across the northern boundary road and flowing south under the north-south orientated solar panels, there is potential for erosion damage. This should be inspected regularly, and should erosion be occurring under the panels, water should be prevented from entering the site from across the northern boundary road by raising the road surface.
Soils Information
Geotechnical investigations found that the Emerson Number of soils across the site is 5 indicating the soils are non-dispersive. This also indicates “…a medium potential for erosion and a high potential to cause environmental harm if disturbed” (Construction Sciences 2020).
The surface soils are generally gravelly sand with fine to medium rounded grey gravel with organics and rocks.
The erosion risk analyses indicated erodibilities ranging from 0.007 to 0.016 Mg.h.MJ-1.mm-1. RUSLE-calculated soil loss ranges from 19 to 41 t.ha-1.y-1 giving a soil loss class of 1. Analysis indicated that sediment basins are not required. (Appendix B).

Page 21
Sediment Control Standards
The SWMP should be implemented prior to construction or contemporaneously at the start of construction.
Construction activities should take place during the dry season from April to October. The erosion risk assessment (Appendix C) indicated that sediment basins are not required since the calculated soil loss is < 75 t.ha-1.y-1, a type 3 sediment trap is suitable (Catchment & Creeks 2010).
Type 3 Sediment Trap:
• Under typical flow conditions the traps is capable of capturing and holding 90% of material > 0.42mm.
• Sufficient sediment retention capacity (volume) to capture and hold one (1) month’s sediment runoff from the catchment in question under average annual conditions.
• Has acceptable capability to sustain its hydraulic and structural integrity under normal site conditions. A sediment trapping system that is highly likely to experience performance-affecting damage within a given work site due to such things as vandalism, and foot or construction traffic, cannot be classified as a Type 3 sediment trap.
Type 3 sediment control techniques
• Sheet flow treatment techniques o Buffer zones, o Filter fence, o Modular sediment traps, o Straw bale barriers, o Sediment fences, o Grass filter strips, o Fibre rolls, and o Stiff grass barriers.
• Concentrated flow treatment techniques o Coarse Sediment Traps, o Modular sediment traps, o U-shaped sediment traps, o Check dam sediment traps, o Straw bale barriers.
Site access
Prior to commencement of site works, the location of all site access points must be verified with the regulator.
Site access is to be via a new entry point from Garbage Dump Road (Appendix B) at the southern end of the western boundary road. Road drainage design and erosion management is to comply with the NTG’s Road Drainage Fact Sheet (https://nt.gov.au/__data/assets/pdf_file/0004/212269/road-drainage.pdf).
Site access must be stabilised and confined to the minimum practicable number of locations.

Page 22
Vehicular access into the site must be appropriately managed to minimise the risk of sediment being tracked or washed into adjoining sealed roadways. A stabilised entry and exit point must be implemented.
All reasonable and practicable measures must be taken to ensure stormwater runoff from access roads and stabilised entry/exit systems, drains to an appropriate sediment control device.
Stormwater Drainage and Type 3 Sediment Trap Design.
Drainage and sediment trap design was conducted using the 1% AEP design storm as stated in the NTG’s specifications. It was considered not necessary to design for a 10% AEP storm as 10% AEP flows will be managed by the 1% AEP design.
For this interim report typical drainage components are presented in Appendix D. Detailed engineering drawings are currently being produced and the SWMP will be updated accordingly.
SWMP installation sequence
The SWMP installation sequence is:
1 Obtain all necessary permits, licences and approvals before site establishment, 2 Establish a single, stabilised entry/exit point, 3 Install sheet flow sediment retention devices down-slope of the site. A vegetation buffer
left between the site and downslope collection drains (Appendix C) may suffice. However, control features should be installed if regular inspections indicate the vegetation buffer is not controlling sediment movement into the drains.
4 Divert upslope water around the work site and stabilise any drainage channels. The current perimeter road is suitable as a diversion bund and should be upgraded if inspections reveal water is entering the work area across the road and causing erosion.
5 Clear only those areas necessary for building works to occur, 6 Strip and stockpile the topsoils before earthworks or excavations and stabilise stockpiles
to prevent wind-blown dust (Appendix B). 7 Stockpile erodible material within the sediment control zone (Appendix B). 8 Stabilise exposed earth banks (e.g. mulch, turf, erosion control blankets) 9 Install on-site waste receptors (e.g. Mini-skips, bins, wind-proof litter receptors). 10 A suitable ground cover is to be sown between the solar panels extending under the drip
line of each panel. Should erosion occur on the bare earth areas under the panels, appropriate sediment control and stabilisation methods must be implemented.
11 Regularly inspect all drainage, erosion and sediment control measures and maintain all measures in proper working order at all times.
12 Progressively revegetate/stabilise the site, 13 Remove any remaining temporary drainage, erosion and sediment control measures
upon complete stabilisation of the site. 14 Drainage design structures in place to control increased peak discharges from the site
are considered to be permanent.

Page 23
Management Responsibilities
Site staff should be given specific responsibilities for installing and maintaining soil and water management features. Designated staff will also have responsibility for ensuring the effective operation and maintenance of the sediment traps, flow retardation features, and vegetation buffer zones.
Contractors undertaking site clearing will have responsibility for completing the works using appropriate vegetation clearing features to minimise erosion risk.
Training and Awareness
All staff and contractors should be required to undertake an environmental awareness induction. There should be specific training of personnel responsible for supervising, installing and maintaining erosion and sediment control measures.
Monitoring and Maintenance
Site inspections should be conducted twice weekly during the rehabilitation phase in the 2021 to 2022 wet season; within 24 hrs of expected rainfall; and as soon as reasonably practical after receiving significant rainfall events (i.e. >10 mm in 24 hr period). Visual assessment will be carried out of surface water runoff structures, drainage structures and erosion control structures to ensure they are operating efficiently. An inspection checklist should be developed and completed during inspections.
As indicated by inspections:
• The sediment traps should be cleared of sediment and the sediment stored or disposed of appropriately,
• Damage to drainage features should be repaired immediately,
Plan updates and Variations
The SWMP is dynamic and may require changes through the construction and rehabilitation phases. Alterations to the implementation of the plan should be recorded and outlined in updated plans. Updated plans will be submitted with revisions for approval by the appropriate authority.

Page 24
6. References
Ball, J, M Babister, R Nathan, W Weeks, E Weinmann, M Retallick, and I Testoni. 2019. Australian Rainfall and Runoff: A Guide to Flood Estimation. Commonwealth of Australia.
Catchment & Creeks. 2010. Sediment Control Classification Systems. Sediment Control Techniques. Version. Catchment and Creeks. https://www.catchmentsandcreeks.com.au/docs/SCC-1.pdf.
Construction Sciences. 2020. “Geotechnical Investigation Report. Jabiru Redevelopment - Report No. 1. Power Station - Lot 2303. 5057P027. Prepared for the Territory Government (NTG). 4 July 2020.”
Evans, KG, P Martin, DR Moliere, MJ Saynor, JB Prendergast, and WD Erskine. 2004. “Erosion Risk Assessment of the Jabiluka Mine Site, Northern Territory, Australia.” Journal of Hydrologic Engineering 9 (6): 512-522.
IECA. 2018. Appendix B Sediment Basin Design and Operation. Picton, NSW: Internation Erosion Control Association Australasian Chapter.
IECA. 2008. Best Practice Erosion and Sediment Control. Picton NSW: International Erosion and Sediment Control Association (Australasia).
Manning, R. 1891. “On the flow of water in open channels and pipes.” Transactions of the Institution of Civil Engineers of Ireland 20: 161-207.
QGIS.org. 2020. “QGIS Geographic Information System. Gepspatial Foundation Project.” http://qgis.org.
Rahman, A, K Haddad, M Haque, G Kuczera, and E Weinmann. 2015. Australian Rainfall and Runoff. Project 5: Regional Flood Methods: Stage 3 Report. Barton, ACT: Engineers Australia.
Renard, KG, GR Foster, GA Weesies, DK McCool, and DC Yoder. 1997. Predicting soil erosion by water: A guide to conservation planning with the Revised Universal Soil Loss Equation (RUSLE). Agriculture Handbook No 703, Phoenix: US Dept of Agriculture.
SWES. 2020. Notice of Intent, Darwin - Consultancy - Provision of Environmental Approvals for the Construction and Operations of a Hybrid Power Station in Jabiru. Surface Water & Erosion. Version 4 - 17 November 2020. Consultancy, Darwin: Surface Water & Erosion Solutions.

Page 25
7. Appendices

Page 26
Appendix A
Proposed Jabiru Hybrid Power Station Static Flood Assessment Update.

0.1
2.6
3.0
4.0
5.0 m
1% AEP static flood level 2.5m DEM
0.1
0.2
0.4
0.6
0.8
1.0
1.2 m
PMF 30m DEM
1% AEP flood 30m DEM
HSPS Catchment
Compound road
Solar Array
Thermal Plant Compound
Access Road
Legend
0.05% AEP static flood level 2.5m DEM
Appendix A. Proposed Jabiru Hybrid Power Station Static Flood Assessment Update. Surface Water & Erosion Solu ons
Baralil Catchment
HSPS Catchment
Baralil Creek
Legend
Figure A.1. The Baralil Creek catchment upstream from the study stream cross-section showing the extent of the HSPS catchment upstream of the cross-section.
Baralil Creek cross-section
Figure A.3. The flood inundation extent of the 0.05% AEP flood and the 1% AEP flood comparing the inundation extent determined using the 30m DEM and the 2.5m DEM. There is little risk of adverse impact on flood levels resulting from the HSPS.
Figure A.2. Cross-section showing the comparison between the 30m DEM and the 2.5m DEM. Flood levels based on the 2.5m DEM are much lower than those based on the 30m DEM

Page 27
Appendix B
Proposed Jabiru Hybrid Power Station Erosion Risk Assessment, Top Soil and Erodible Material Management and Site Clearing.

RUSLE sample locations
RUSLE Risk catchments and
sediment control zone
Thermal Plant Compound
Legend
Appendix B. Proposed Jabiru Hybrid Power Station Erosion Risk Assessment, Top Soil and Erodible Material Management and Site Clearing Surface Water & Erosion Solu ons
Figure B.1. Proposed HSPS location with catchment delineation for erosion risk assessment. Sub-catchments SBP2.1, 2.5, 2.6.2.4, 2.7 and D1 are combined for the West catchment. The land application area acts as a significant vegetation buffer for the HSPS site.
Access Road
Compound Road
Compound
Solar array
Figure B.2. Left. Proposed HSPS access road location with catchment delineation for erosion risk assessment. Sub-catchments are R1 and R2.
Table B.1. Left. Erosion risk analysis. Parameter values were derived using the Strategic Environmental & Engineering Consultancy sizing sediment basins tool (SSBT) (www.seec.com.au) in accordance with current International Erosion Control Association guidelines (Appendix B. IECA 2018). Local R and K values were determined using the methods described by Evans et al (2004). This analysis showed that sediment basins are not required.
NOTES1. Site clearing shall be conducted in accordance with the Construction Environmental Management Plan (CEMP) and no clearing
shall be commenced prior to approval of a CEMP.
2. All reasonable and practicable measures must be taken to obtain maximum benefit from existing topsoil, including where the disturbance exceeds 0.25ha and the topsoil does not contain undesirable weed seed, the top 100mm of topsoil, excluding subsoil must be stripped and stockpiled separately and spread as a final surface soil
3. Stockpiles of erodible material, if present, must be;a. appropriately protected from wind, rain, concentrated surface flow, and excessive up-slope stormwater flows,b. located at least 2m from any hazardous areas, retained vegetation, or concentrated drainage line; andc. located upslope of an appropriate sediment control system,d. provided with appropriate covers depending on period of stockpiling.
INTERIM
DRAFT

Page 28
Appendix C
Proposed Jabiru Hybrid Power Station Hydrologic Modelling

RORB undisturbed sub-catchments
RORB sub-catchments post-construction
Thermal Plant Compound
Access Road
Compound Road
Compound
Vegetation Buffer
Solar array
Open Drain
Diversion bund
Junctions
Centroid Reaches
Road Bund
Flow Accumulation
Low
High
Legend
Appendix C. Proposed Jabiru Hybrid Power Station Hydrologic Modelling Surface Water & Erosion Solu ons
Figure C.1. RORB model sub-catchments for proposed HSPS site prior to construction. Flow accumulation represents the principal flow paths on the original landform prior to clearing and reshaping. Vegetation clearing should be minimal and a buffer maintained where possible. The vegetation buffer may be suitable as sheet flow type 3 sediment control technique. Peak discharges for the 1% AEP design event were determined at the outlets B1 outlet, B8 and B9 (Table C.1).
Figure C.2. RORB sub-catchments and stormwater management drainage layout for the thermal power plant and solar array. Vegetation clearing should be minimal and a buffer maintained where possible. The vegetation buffer may be suitable as sheet flow type 3 sediment control technique. The RORB model was used to calculated the 1% AEP design event peak discharges at outlet B1 outlet, B8 and B9 (Table C.1).
Figure C.3. Stormwater management drainage layout for the access road location (See Appendix B). There are no changes in peak discharge from the sub-catchments with R1 Peak Q = 0.024 m3s-1 and R2 Peak Q = 0.027 m3s-1. See the NTG’s Road Drainage Fact Sheet (https://nt.gov.au/__data/assets/pdf_file/0004/212269/road-drainage.pdf) for design details.
Table C.1. The increased post-construction discharges will be reduced using rock check dams. Quantification of the effects of rock check dams on post-construction Peak Q is underway and will be included in the final report. The outlet junctions where discharges will be controlled are B1 Outlet, B8 and B9. DRAFT

Page 29
Appendix D
Drainage Design Components

Existing surface
Swale Design Surface
Swale width varies
Varies 1:4 Varies 1:4
Y
Z4
1
4
1
Scale N.T.S.Typical Swale Detail (Type 1)
Grass Lining
0.5m Varies 1:4Varies 1:4
414
1
Bank Design SurfaceExisting surface
Scale N.T.S.
Typical Diversion Bank Detail
A3Title
Sections of Swale, Bank and Solar Farm
KGE KGE
DrawnDesigned Checked Sheet Size
Sheet No
JS
Date:
Project
Jabiru Hybrid Power Station, Jabiru,NT
Appendix D Diversion Bank & Swale Detail
Diversion Banks
• The installer is referred to NTG Technical Note 8 Diversion Banks. Erosion and Sediment Control (https://nt.gov.au/__data/assets/pdf_file/0015/212253/diversion-banks.pdf)
• Diversion banks should be part of regular inspections to ensure they are performing the function they weredesigned to do.
• Traffic should not use the diversion bank.• Signs of failure should be repaired immediately.
Typical Rock Check Dam
Check Dam Notes (Catchment & Creeks 2010)
• Dams should not be constructed from straw bales.• Since these are permanent structure to control peak discharge of the 1% AEP, consideration should be given to
using rock.
• Materialso Rock: 150 to 300 mm nominal diameter, hard, erosion resistant rock.
• Installationo Refer to approved plans. Changes in locations or methods of construction should be discuss with the
engineer or responsible on-site officer.o Locate first check dam at the downstream end of the channel. Construct successive dams upstream so
that the toe of the upstream dam is level with the crest of the downstream dam.o Construct the check dam in accordance with the approved plans.


