36
SOIL AND TERRAIN DATABASE OF MOZAMBIQUE Scale 1:1,000,000 Consultant Report by Abdelghani Souirji Land Resources Consultant February 1997

SOIL AND TERRAIN DATABASE OF MOZAMBIQUE
Scale 1:1,000,000
Consultant Report
by
Abdelghani Souirji Land Resources Consultant
February 1997
ACKNOWLEDGEMENT The author wishes to thank Mr. Zandamela, Director of the National Institute of Agronomic Research (INIA) of Mozambique, and the following staff of the Land and Water Department (DTA) of INIA.
Mr. Feliciano Mazuze, Chief of DTA, Mr. Mosés Vilanculos, soil scientist, Mr. Mario Ruy Marques, soil scientist, Mr. Jacinto Mafalacusser, soil scientist, Mr. Lázaro Amós, soil scientist, Mr. Marten Westerinck, soil scientist, Mr. Vincent Lefebvre, soil scientist
They all facilitated the author’s mission in Maputo in February 1997, and have provided him with data and verbal information. This work would have been impossible without their assistance and active participation. The author wishes also to thank Dr. Freddy Nachtergaele, of FAO and Professor Jan Feyen, of the Catholic University of Leuven, for their guidance and support.

3
TABLE OF CONTENTS
1. INTRODUCTION 1 2. MATERIALS AND METHODS 1
2.1 Materials 1 2.1.1 The 1 :1,000,000 scale soil map 1 2.1.2 The Mozambican soil database 4 2.1.3 The soil survey report of the provinces of Maputo and Gaza 4 2.1.4 The land resources appraisal report of the district of Xai-Xai 4
2.2 Methods 4 3. RESULTS 6 4. CONCLUSIONS 7
BIBLIOGRAPHY 8 APPENDICES 9
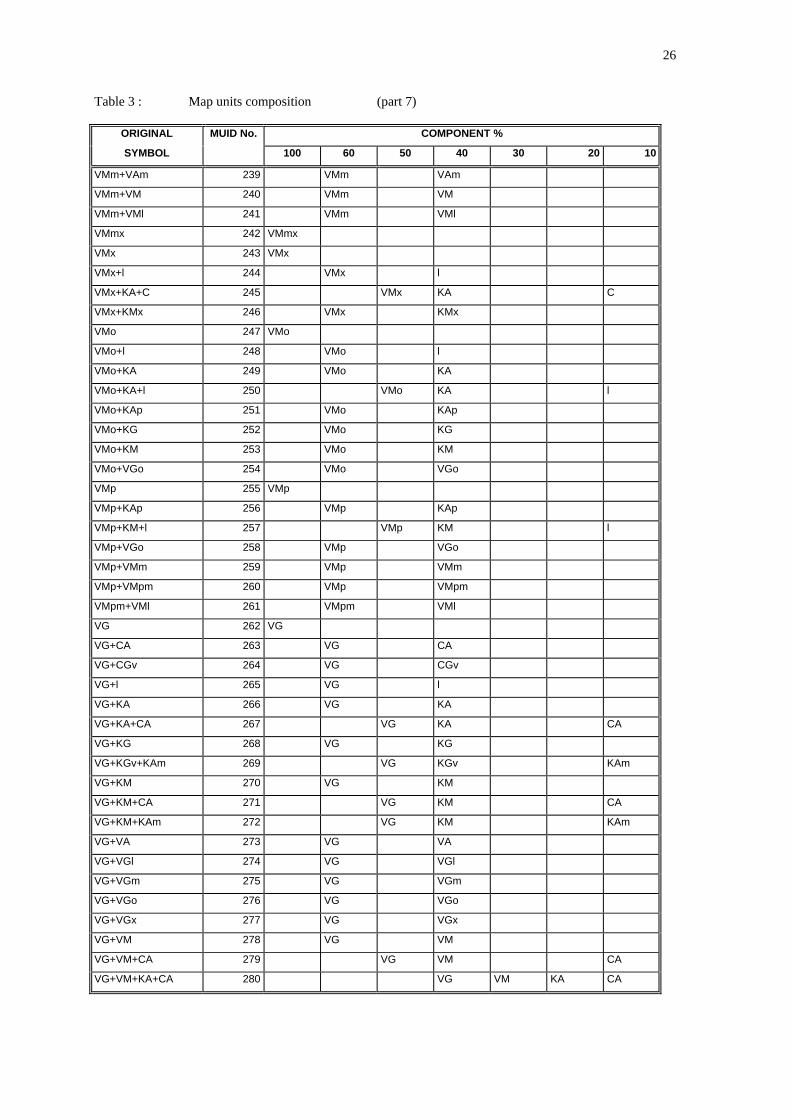
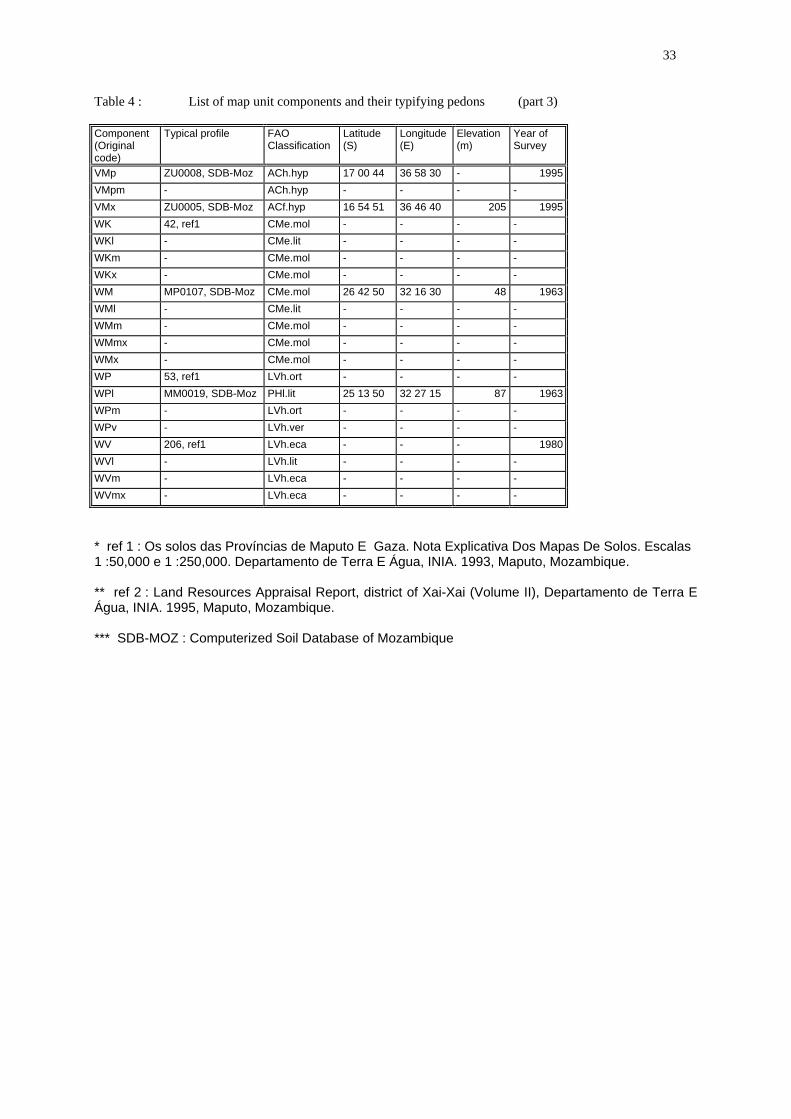
LIST OF TABLES Table 1. Soil classification key 2 Table 2. Map legend (part 1-6) 11-16 Table 3. Map units composition (part 1-10) 19-28 Table 4 List of map unit components and their typifying pedons (part 1-3) 30-32

1
1. INTRODUCTION The Food and Agriculture Organization of the United Nations (FAO) has published in 1996 a computer database for the Soils of East Africa (SEA). The following countries were covered : Burundi, Djibouti, Egypt, Eritrea, Ethiopia, Kenya, Rwanda, Somalia, Sudan and Uganda. FAO has recently contracted the Institute for Land and Water Management of the Catholic University of Leuven (KUL) to expand the SEA database to include Angola and Mozambique. In this context, the author was contracted by the KUL to construct the Mozambique database. The author travelled to Maputo, Mozambique, in February 1997 and collected all available documents and held discussions on related issues with the management and the staff of the Mozambique Land and Water Department. The author’s task was greatly facilitated by the fact that there was already an available recently completed 1 : 1, 000, 000 scale soil map of the country. 2. MATERIALS AND METHODS 2.1 Materials The 1 :1,000,000 scale soil map of Mozambique (in PC Arc/Info GIS format) and it’s legend (DTA,
1995a) and an internal document of DTA’s GIS section (Frenckel, 1992) have been the main sources of information for map unit description.
The national soil database of Mozambique, the soil survey report of the provinces of Maputo and
Gaza (DTA, 1993) and the land resources appraisal report of the district of Xai-Xai (DTA, 1995b) were used to identify and describe representative profiles. 2.1.1 The 1 :1,000,000 scale soil map This map was compiled by DTA from existing soil maps at various scales, from a database of
800 soil profiles and from complementary interpretation of satellite imagery and of the 1 :1,000,000 scale geological and geomorphological maps of Mozambique (DTA, 1995a, Marques, 1995a, 1995b). The civil war situation which prevailed during much of the 1980s and the early 1990s made large areas inaccessible for field checking of the map.
DTA soil scientists built the map legend according to the national soil classification key shown in
table I. It appears from this table that geology, parent material, soil texture, soil colour, soil depth, base saturation (dystric units), clay cation exchange capacity (oxic units), drainage and topography are the factors that are taken into account in defining soil units.
The booklet that accompanies the map provides definitions of lower categories named phases.
The following soil phases are recognised : d dune topography z saline (FAO) : ECo > 15 dS/m within upper 1 m s sodic (FAO) : ESP > 6% within upper 1 m g mottled l lithic : depth < 50 cm m moderately deep (50-100 cm) h hydromorphic (watertable within 50 cm)

2
Table 1 : Soil classification key
GEOLOGY PARENT MATERIAL SOIL DIFFERENTIATING CRITERIA SOIL PHASE SYMBOL
Alluvial and fluvio-marine areas
alluvial sediments - clayey soils - sandy soils - soils with peaty layer
- - -
- FG - FS - FT
estuarine marine sediments clayey soils - FE Sedimentary basin coastal dunes sandy soils - DC cover sands and interior
dunes - yellow sandy soils - orange sandy soils - white sandy soils - unspecified sandy soils
- - dune topography - - dune topography - - - dune topography * - hydromorphic
- AA - dAA - AJ - dAJ - AB - A - dA * - Ah
red sandstone sandy soils - G Mananga sediments - soils with sand cover < 50 cm
- soils with sand cover 50-100 cm - unspecified soils
- - -
- MM - MA - M
clayey colluvial soils - MC Post-Mananga deposits - coarse-textured soils
- fine- and medium-textured soils - -
- PA - PM
pebbles deposits - moderately deep soils - shallow soils < 30 cm
- - lithic
- SC - Sl
calcareous sedimentary rocks - red soils - brown soils
- -
- WV - WK
Other sedimentary rocks - deep soils - moderately deep soils
- -
- WM - WP
Igneous rocks areas
Rhyolites - depth < 30 cm - depth > 30 cm
- lithic -
- Rl - RV
basalts depth < 30 cm lithic - Bl depth > 30 cm - black soils
- red soils - colluvial soils
- - -
- BP - BV - BC
Precambrian shield
Acid rocks shallow soils - l
red soils coarse texture - - dystric
- VA - VAp
medium texture - - oxic - dystric
- VM - VMo - VMp
fine texture - - oxic - dystric
- VG - VGo - VGp
brown soils coarse texture - - mottled - dystric
- KA - KAg - KAp
medium texture - - oxic
- KM - KMo
fine texture - - oxic
- KG - KGo
colluvial soils - coarse texture - medium texture - fine texture - unspecified texture
- - - -
- CA - CM - CG - C
Basic rocks red soils basic parent rock VGb brown soils basic parent rock ** KGb **
* Forgotten in the original table but included in the published map legend (see table 2, appendix 1) ** Not included by DTA in the published map legend (see table 2, appendix 1)

3
o oxic : CEC < 16 meq./100 g of clay p dystric : base saturation < 50% in B horizon b formed on basic igneous rock x stoniness > 25% v vertic The vertic phase was forgotten in the printed legend of the 1 :1,000,000 though it was used in
the soil map. This soil classification key does not take into account genetic horizons in the definition of soil
units. These may therefore be quite heterogeneous in terms of soil types as defined by the FAO legend or the US Soil Taxonomy. For example a red clayey soil will be classified the same way whether it has a Cambic or a Argilic horizon.
The printed map legend provides information on 53 units (soil groupings). This number includes
all the ‘primary soil units’ and some of their phases e.g. dAA, VAp, VGo etc. However when the author extracted the full list of map units from the GIS soil polygons attribute files (of the soil map) they numbered 404 (see table 3, appendix 2) and the actual number of different map units components was found to be 117 (see table 4, appendix 3) instead of the 53 that are described in the map legend.
Map units may have up to 4 soil components, e.g. VM + KM+KA +CG (see table 3, appendix 2).
The respective percentage of each component is neither indicated in the map legend nor in the GIS files.
The printed map legend provides 19 different types of information for 53 map units :
the symbol of the unit the full name of the unit the dominant soil characteristics geomorphology and geology landform topography and slope gradient (%) texture of topsoil/subsoil soil depth (cm) drainage acidity and alkalinity (soil pH) of topsoil/subsoil organic matter % of topsoil salinity of topsoil/subsoil (EC of saturated paste extract) Sodicity of topsoil/subsoil (%) dominant soil classification according to FAO (1988), major soil groups and soil units level dominant soil classification according to US Soil Taxonomy (1992), subgroup level (natural) vegetation types main limitations for agriculture land capability (SCS) land suitability for irrigation (modified USBR)
It must be noted that both the printed and GIS versions of the 1/1,000,000 soil map exist only in
10 separate map sheets, each corresponding to one of the ten provinces forming Mozambique.

4
2.1.2 The Mozambican soil database The personnel and management of DTA consider as a high priority the construction and
maintenance of a computer soil database, using FAO’s SDB software, to collate and make available to users the considerable amount of georeferenced soil information produced in the country. To this effect, a new soil description manual, inspired by FAO’s (1990) guidelines, was elaborated and published (1995c) by DTA and the Agronomy and Forestry department of the Eduardo Mondlane University.
As it was supplied by DTA to the author in February 1997, the English version of the
Mozambican SDB contained about 4,300 soil observations, out of which about one quarter have analytical data. The following general remarks can be made about this soil database :
a majority of the soil descriptions are incomplete there are many data entry errors most base saturation ratios in the analytical data are wrong the clay cation exchange (CEC) was calculated from the CEC of the whole soil with a
formula which includes a correction for the CEC of organic matter. This formula is doubtful since it often gives negative figures for clay CEC
the printouts of the soil description come in a mixture of English and Portuguese terms.
Though good progress has been achieved by DTA in cleaning the database, further efforts are required. However, in spite of the above mentioned limitations, there is such a large quantity of useful data in this database that it could be used by the author as the main source for representative profiles for this work.
2.1.3 The soil survey report of the provinces of Maputo and Gaza The soil survey of the southern provinces of Maputo and Gaza was published by DTA in 1993.
The legend of the soil maps of this soil survey, which were published, with the same legend, at scales 1 : 50,000 and 1 : 250,000, was used by DTA as a model for the construction of the legend of the national soil map at scale 1 : 1, 000, 000. Moreover, this soil survey report is the main source of information for soil units that are present in the south of the country.
The author used this report as a source for some of the representative profiles. Some of them
have no analytical data and/or no geographic co-ordinates for location. 2.1.4 The land resources appraisal report of the district of Xai-Xai
This recent report (DTA, 1995) presents the results of the soil survey of the district of Xai-Xai, in
the Province of Gaza. It’s volume II includes 47 detailed profiles description and analytical data. Furthermore, the profiles are classified according to the FAO legend at the subunit level.
The author used this report as a source for some of the representative profiles. Unfortunately,
the soil’s electrical conductivity is only given for the 1 :2.5 extract. The author had therefore to use this data to estimate the EC of the paste extract.
2.2 Methods Dr. Freddy Nachtergaele, Technical Officer at FAO’s AGLS service, provided the author with a copy of FAO’s SEA database software in which the 1 :1,000,000 scale soil map of Mozambique is to be incorporated. The author prepared the Mozambique material according to the instructions of the User’s Guide manual included in the SEA software. The author exported the data records of Uganda from the SEA database to a spreadsheet (Lotus 123W) to provide the database structure. Thereafter the Ugandan data was deleted and that of Mozambique was codified, according to SEA guidelines, and entered in the same database structure.

5
A major difficulty has been that the concepts of mapunit and map unit component in the Mozambique soil map differ dramatically from international practice. If we see for example the map unit (soil grouping as it is named in the map legend) BV : according to DTA (1993, p 151-152) it may include (no percentages are given):
Calcic Vertisols (dominant) Vertic Cambisols Calcaric Phaeozems Haplic Phaeozems Luvic Chernozems (Saline-sodic phase) Calcic Chernozems (Saline-sodic phase) Haplic Chernozems (Saline-sodic phase)
this soil unit exist on its own as a map unit, but also as a mapunit component in 7 other mapunits: BP+Bl BP+BPm BP+BV BP+BV+Bl Bl+BP BV+BP BV+BP+Bl
Therefore the components of map units are themselves map units ! On the other hand, a list of soil taxa present in map units is only available for a small minority of map units that are described in the soil survey report of the provinces of Maputo and Gaza (DTA, 1993). Therefore the author had to consider that all map units having only one component (e.g. FT, KA, l etc.) are assimilated to their main soil component. The respective percentage of each component of compound map units was estimated according to an internal DTA document (Frenkel, 1992) which says that « it is assumed that, in case a compound unit has two constituents, the percentages are 60/40, and in the case of three constituents 50/40/10 ». Since there are three map units with four constituents, and no composition is defined by DTA for them, the author used the composition 40/30/20/10. The characteristics of compound map units were considered to be the same as those of their dominant component. Representative profiles were selected from over 4300 profiles in the soil database and the two above mentioned soil survey reports. Each profile was screened and checked for completeness, correctness and correspondence with the original definition of each soil unit. Soil classification according to the FAO legend had often to be done or corrected at the unit level and always to be completed to the subunit level. Table 4, in appendix 3, gives the list of map units components (117) and the number, FAO classification, co-ordinates, altitude and year of survey of their representative profile. No adequate typical profiles were found for about 35 mapunit components (out of 117). The FAO classification at the subunit level was made according to Nachtergaele et al. (1994). The following abbreviations were used : alb albi- acr acri- are areni- calc calci- chr chromi- dys dystri- eca endocalcari- epigle epigleyi- eut eutri- fer ferri- gle gleyi- hyp hyperferrali- lix lixi-

6
lit lithi- mol molli- ort orthi- pel pelli- rho rhodi- sal sali- salsod sali- & sodi- sod sodi- ver verti- Soil classification according to the US Soil Taxonomy was not included as reliable data on moisture and temperature regimes and soil mineralogy is not available. The manual Users’ Guide of SEA does not indicate a ‘control section’ for soil texture. This could mean that it is the upper 30 cm, as in the FAO soil map of the world. However, at scale 1 :1,000,000 and at the subunit level, the author believes that subsoil texture should also be indicated. Since this information is available in the Mozambican map legend, the author used the following procedure to indicate texture : for homogeneous soils one Arabic figure indicates the texture e.g. 1, for heterogeneous soils, topsoil texture, or range of textures, is indicated first between brackets
followed by a slash, then by subsoil texture or range of textures, between brackets e.g. (3,4,5)/(2,3).
It was also needed to add some classes to SEA data classes : in geology subclasses, the symbol Mn was added for the well-known Mananga deposits which
consist of a layer of < 20 m thick of hard sodic Pleistocene sediments. The symbol AMn was used to designate colluvium derived from Mananga sediments,
in vegetation units, the symbols R and V were added to respectively represent shrubland and savannah.
3. RESULTS The results are provided as 5 computer files enclosed in diskette n°1: origincode.wk4 : this file gives the correspondence between the original map units symbols and
their new numerical symbol. All the map units were given a number from 1 to 404 and this number is indicated in all files as the Muidsheet number.
muid.wk4 : this file includes a table which presents all the general information concerning map units. It corresponds to the table called General Info in SEA.
soil1.wk4 : this file includes a table which provides all the information concerning the dominant soil in each map unit. It corresponds to the table called Soil 1 in SEA.
soil2.wk4 : this file includes a table which provides all the information concerning the second dominant soil in each map unit. It corresponds to the table called Soil 2 in SEA.
soil3.wk4 : this file includes a table which provides all the information concerning the third dominant soil in each map unit. It corresponds to the table called Soil 3 in SEA.
report.doc : this file includes the present report. There are 4 more diskettes : Diskettes n° 2, 3, 4 : contain all the original zipped GIS files of the 1 :1,000,000 scale soil map of
Mozambique (as 10 separate provincial maps) in PC Arc/Info format. Diskette n° 5 : contains the zipped files of the original soil database of Mozambique (to start up the
programme, once it is unzipped, type sdb2enin and press enter). 4. CONCLUSIONS
7
The 1 :1,000,000 scale soil map and the associated database, though perfectible, give a good idea of the nature of Mozambican soils and of their distribution. The staff of the Land and Water Department are strongly encouraged to pursue their efforts in cleaning, maintaining and expanding the soil database.

8
BIBLIOGRAPHY DTA (1993). Os solos das províncias de Maputo e Gaza. Nota explicativa dos mapas de solos. Escalas 1 :50,000 e 1 :250,000. INIA. Maputo, Mozambique. DTA (1995a). Legenda da carta national de solos (escal 1 :1,000,000). Serie Terra E Água, Comunicação No. 73. INIA. Maputo, Mozambique. DTA (1995b). Land Resources Appraisal Report. District of Xai-Xai. Vol. II. INIA. Maputo, Mozambique. DTA (1995c). Manual para a descrição do solo e codificação para o banco de dados (SDB). Serie Terra E Água, Comunicação No. 74. DTA e Faculdade de Agronomia e Engenharia Florestal da Universidade Eduardo MondlaneINIA. Maputo, Mozambique. FAO (1990a). Soil map of the world, revised legend. World Soil Report 60. FAO, Rome. FAO (1990b). Guidelines for soil profile description. FAO. Rome. FAO (1996) Soils of East Africa ; User’s Guide. FAO, Rome. Frenkel J. (1992). Note on the evaluation of compound mapping units. FAO/MOZ/86/010. DTA. INIA. Maputo, Mozambique. Marques, M. R. (1995a). Carta dos solos de Mozambique (ESC. 1 :1000 000). Nota interna, DTA. INIA. Maputo, Mozambique. Marques, M. R. (1995b). Soil Science Activities In Mozambique, A Progress Report. Paper presented at the 21th meeting of the SARCCUS Standing Committee for Soil Science. Inhaca Island, Mozambique. DTA. INIA. Maputo, Mozambique. Nachtergaele, F., A. Remmelzwaal, J. Hof, J. van Wambeke, A. Souirji and R. Brinkman (1994). Guidelines for distinguishing soil subunits. Proceedings of the 15th congress of the International Soil Science Society in Mexico.

9
APPENDICES

10
APPENDIX 1.

11
Table 2 : Map legend (part 1)
SYMBOL
SOIL GROUPING DOMINANT SOIL CHARACTERISTICS
GEOMORPHOLOGY &
GEOLOGY
LANDFORM
TOPOGRAPHY Slope (%)
TEXTURE Topsoil
/ Subsoil
DEPTH (cm)
DRAINAGE ACIDITY & ALKALINITY Topsoil
/ Subsoil
(pH-H2o)
ALLUVIAL AND FLUVIO-MARINE AREAS (Units F) FT
Soils of peaty alluvium
Peaty layer over dark grey soils, deep
Holocene alluvium Valleys and plains
level 0-1
peat layer SL
> 100 poor-very poor strong.-mod. acid (4-5.5) mod. acid ( 5-6)
FG
Soils of clayey alluvium
Clayey, dark greyish brown, deep
level 0-1
SCL-C siC-C
> 100 moderate-poor sl. acid-sl. alkaline (6-8) sl. acid-sl. alkaline (6-8.5)
FS
Soils of coarse or medium- textured stratified alluvium
Sandy loam, greyish brown, deep
nearly level 0-2
S-siCL S-SCL
> 100 imperfect-poor sl. acid-sl. alkaline (6-7.5) mod. acid-sl. alkaline (6.5-7.5)
FE
Soils of estuarine marine sediments
Clayey, grey, deep and frequently saturated
Holocene estuarine marine sediments
Estuarine plains
level 0-1
siCL-C siC-C
> 100 poor-very poor sl. alkaline (7.5-8) sl.-mod. alkaline (7.5-9)
SEDIMENTARY BASIN (Units D, A, G, M, P, S, W) DC
Soils of coastal dunes
Sand, greyish brown, deep
Coastal dunes, Holocene sands
Coastal dunes
hilly (0-35) S S
generally > 180
excessive mod. acid (5-6) mod. acid - strong. alkaline (5-9.5)
AA
Yellow sandy soils Sand, yellowish brown, very deep
Pleistocene cover sands and aeolian sands
Sand plains nearly level (0-2) S-LS S-LS
> 180 good-excessive strong.-mod. acid (4-6) strong.-sl. acid (4-6.5)
dAA
Yellow sandy soils, dune phase
Interior dunes
undulated (> 2)
AJ
Orange sandy soils
Sand, orange, very deep
Sand plains nearly level (0-2) S-LS S-LS
> 180 good-excessive mod.-sl. acid (5-6.5) mod.-sl. acid (5-6.5)
dAJ
Orange sandy soils, dune phase
Interior dunes
undulated (> 2)
AB
White sandy soils Sand, white, very deep Sand plains nearly level (0-2) S-LS S
> 180 Imperfect -moderate
mod.-sl. acid (5-7) mod. acid-mod. alkaline (5.5-8.5)
Ah
Hydromorphic sandy soils
Sand, brown, very deep Hydromor-phic sandy depressions
level (0-1) S-LS S
> 180 poor-very poor mod.-sl. acid (5-7) mod.-sl. acid (5.5-7)
A
Unspecified sandy soils
Sand, very deep Sand plains nearly level (0-2) S-LS S
> 180 good-excessive strong.-sl. acid (4-7) strong. acid -mod. alkaline
dA
Unspecified sandy soils, dune phase
Interior dunes
undulated (> 2) (4-8.5)
G
Soils derived from red sandstone
Coarse sand, dark reddish brown, deep
Tertiary sandstone hills and red sands
Low hills undulated (0-8) S-SL S-LS (60-90% coS)
> 100 excessive mod. acid (5-6) mod.-sl. acid (5.5-7)
MA
Soils of Mananga with sand cover of varying thickness
Sandy clay loam, yellowish brown, moderately thick surface sand layer
Mananga sediments : layer of < 20 m of hard sodic Pleistocene deposits
Plains, valley bottoms in cover sands area
nearly level (0-2) S-SL (50-100 cm) SL-SC
> 100 moderate mod. acid-sl. alkaline (5-7.5) mod. acid-sl. alkaline (5-8)
MM
Sandy clay loam, yellowish brown, thin surface sand layer
nearly level (0-2) S-SL (0-50 cm) SL-SC
> 100 imperfect mod. acid-sl. alkaline (5-8) mod. acid-mod. alkaline (5.5-8.5)
M
Unspecified Mananga soils (MM or MA)
nearly level (0-2) see MM/MA > 100 imperfect -moderate
see MM/MA
MC
Soils of clayey Mananga colluvium
Clayey, dark greyish brown, deep
Colluvium derived from Mananga
Circular depressions at the foot of side slopes, drainage ways
level (0-1) siL-C siC-C
> 100 imperfect-poor sl. acid-mod. alkaline (6.5-8.5) sl.-strong. alkaline (7-9)
PA
Coarse-textured soils of Post-Mananga **
Sandy loam, reddish brown, deep and moderately deep
Red upper Pleistocene Post-Mananga deposits (0.5-10 m) of valleys’ side slopes,
Colluvial slopes
gently undulated (0-5)
S-SL LS-SL
70-120 good mod. acid-sl. alkaline (5.5-7.5) mod. acid-sl. alkaline (5.5-7.5)
PM
Medium-textured soils of Post-Mananga
Sandy clay loam, reddish brown, deep and moderately deep
gently undulated (0-5)
LS-SCL SL-SCL
70-25 good sl. acid-sl. alkaline (6-7.5) mod. acid-sl. alkaline (5.5-7.5)
Mananga : deposits Post-Mananga :

12
Table 2 : Map legend (part 2)
SYMBOL ORGANIC SALINITY SODICITY DOMINANT CLASSIFICATION VEGETATION MAIN LAND LAND SUITABILITY
MATTER TopsoilL
(%)
Topsoil /
Subsoil ECo (mS/cm)
Topsoil /
Subsoil ESP (%)
FAO 1988 USDA 1992 TYPE LIMITATIONS FOR
AGRICULTURE
CAPABILITY (USDA)
FOR IRRIGATION (USBR)
ALLUVIAL AND FLUVIO-MARINE AREAS (Units F) FT
very high (>5) non saline (0-1) non saline (0-1)
non sodic (0-1) non-sl. sodic (0-8)
Umbric Fluvisols
Fluvaquentic Humaquepts
hydrophilous forest, grassland
drainage, flooding V di V-VI di
FG
high (3-4.5) non saline (0.5-3) non-sl. saline (1-8)
non sodic (1-4) non-mod. sodic (1-20)
Mollic Fluvisols
Fluventic Haplustolls
grassland, shrubland
drainage, sometimes salinity & sodicity
II (III-V) dsni
II-III ds
FS
low-high (0.5-3.5)
non saline (0-2) non saline (0-2)
non sodic (1-4) non-mod. sodic (1-15)
Eutric Fluvisols
Mollic Ustifluvents forest and open bushland
sometimes drainage & sodicity
I (II-III) d(n)
I-IV sd
FE
moderate (1-3) non saline (0-4) non -strong. saline (2-44)
non-strong. sodic (6-45) mod.-strong. sodic (15-80)
Salic Fluvisols
Mollic Fluvaquents halophilous grassland, mangrove
salinity, sodicity, drainage, flooding
V-VII dn IV-VI nd VI ndi
SEDIMENTARY BASIN (Units D, A, G, M, P, S, W) DC
low (0.2-1) non saline (0-1) non saline (0-1)
non sodic (1-5) non-sl. sodic (1-15)
Haplic Arenosols
Ustic quartzipsamments
shrubland water holding capacity, fertility
VII fs (IV+VII+VIII) fs
V-VI sdt
AA
low to moderate (0-3)
non saline (0-1.5) non saline (0-2)
non sodic (0-2) non sodic (1-12)
Ferralic Arenosols
Ustoxic Quartzipsamments
residual forest and open bushland or
water holding capacity, fertility
IV fs (VII) fs
IV sd
dAA
grassland
AJ
low to moderate (0.5-2)
non saline (0-1) non saline (0-1)
non sodic (0-1) non sodic (0-2)
Ferralic Arenosols
Ustoxic Quartzipsamments
residual forest and open bushland or
water holding capacity, fertility
IV fs IV sd
dAJ
grassland IV tfs (VII) tfs
V sdt
AB
low to moderate (0-2)
non saline (0-2) non saline (0-2)
non sodic (0-3) non-mod. sodic (0-21)
Albic Arenosols
Ustoxic Quartzipsamments
open or closed bushland, wooded savannah, shrubland
fertility, water holding capacity
IV fs (VII fs)
V sd
Ah
low to high (0-5)
non saline (0-2) non saline (0-2)
non sodic (0-3) non-mod. sodic (1-25)
Gleyic Arenosols
Aquic Quartzipsamments
savannah or grassland
drainage, flooding, sometimes sodicity
V di (n) V-VI di
A
moderate (0-3) non saline (0-2) non saline (0-2)
non sodic (0-3) non-mod. sodic (0-21)
Arenosols Psamments savannah or grassland
water holding capacity, fertility
IV fs (VII) fs
IV sd
dA
G
low-moderate (0-2)
non saline (0-1) non saline (0-1)
non sodic (0-2) non-sl. sodic (0-10)
Ferralic Arenosols
Ustoxic Quartzipsamments
closed or open bushland
water holding capacity, fertility
IV sf V sd
MA
low-moderate (0.5-3)
non saline (0.5-1) non-sl. saline (0.5-7)
non-strong. sodic (5-40) non-strong. sodic (1-45)
Ferralic Arenosols
Thapto-Camborthidic Quartzipsamments
open bushland, shrubland
water holding capacity, fertility
III dn (II-IV) dn
V dns IV dns
MM
low-high (0.5-5) non saline (0.5-2) non-sl. saline (0.5-9)
non-sl. sodic (1-8) sl.-strong. sodic (10-40)
Stagnic or Haplic Luvisols
Aquic or Typic Haplustalfs
grassland and open bushland
soil hardness and permeability, sodicity, sometimes salinity
IV dn III dn (VII-V) dn
M
see MM/MA see MM/MA see MM/MA see MM/MA see MM/MA see MM/MA see MM/MA see MM/MA see MM/MA
MC
moderate-high (2-4.5)
non-sl. saline (0.5-7.5) non-mod. saline (3-15)
non-mod sodic (1-21) non-mod sodic (2-26)
Mollic Solonchaks
Salorthidic Haplustolls
grassland and bushland
salinity, sodicity, drainage, flooding
IV dn (III-IV) dn
III dn (II-V) dtni
PA
low-moderate (0.5-2.5)
non saline (0.5-1) non saline (0.5-1)
non sodic (0-6) non sodic (1-7)
Chromic Cambisols
Typic Ustochrepts open bushland fertility, water holding capacity
II sf (I-III) snf
I-II tsp(n) III tsp
PM
mod-high (1-4) non saline (0-1) non saline (0-1.5)
non sodic (0-2) non-sl. sodic (0-15)
Haplic Lixisols or Chromic Luvisols
Kanhaplic Haplustalfs or Typic Haplustalfs
open or closed bushland
sometimes soil depth (<1 m), erosion (on slopes), salinity, sodicity
II st (III) tpf
I-II t(n)p
13
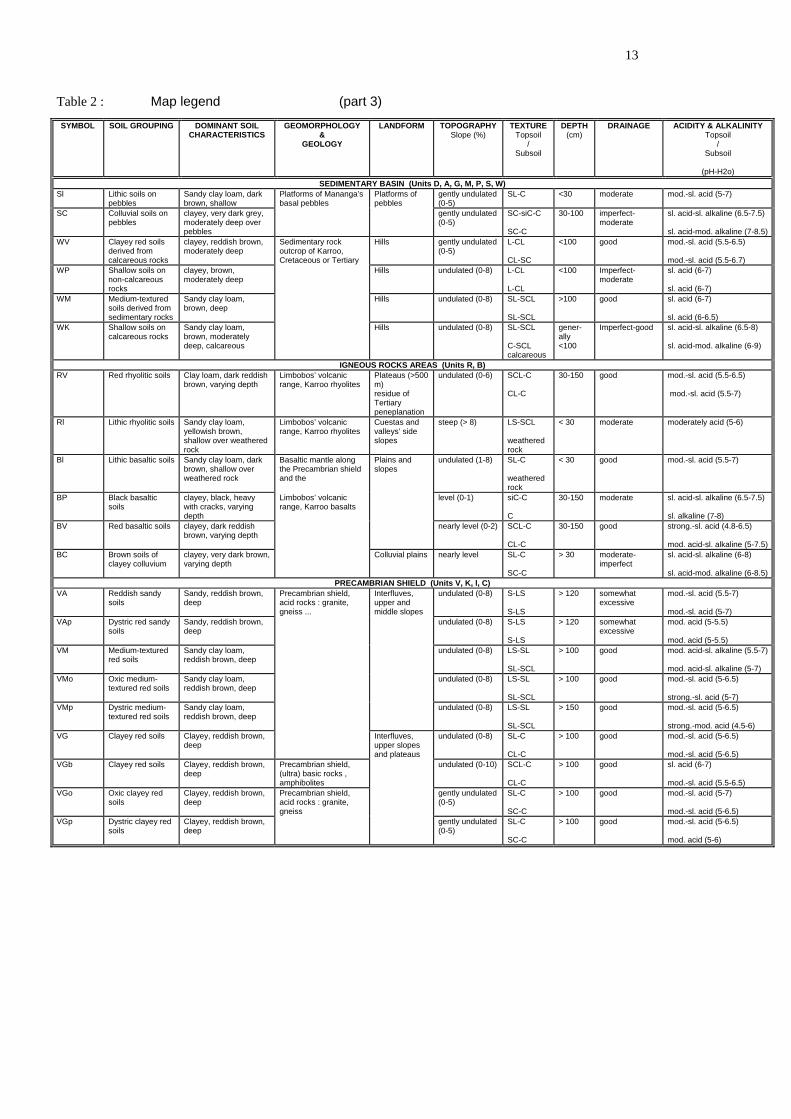
Table 2 : Map legend (part 3)
SYMBOL
SOIL GROUPING DOMINANT SOIL CHARACTERISTICS
GEOMORPHOLOGY &
GEOLOGY
LANDFORM TOPOGRAPHY Slope (%)
TEXTURE Topsoil
/ Subsoil
DEPTH (cm)
DRAINAGE ACIDITY & ALKALINITY Topsoil
/ Subsoil
(pH-H2o)
SEDIMENTARY BASIN (Units D, A, G, M, P, S, W) Sl
Lithic soils on pebbles
Sandy clay loam, dark brown, shallow
Platforms of Mananga’s basal pebbles
Platforms of pebbles
gently undulated (0-5)
SL-C <30 moderate mod.-sl. acid (5-7)
SC
Colluvial soils on pebbles
clayey, very dark grey, moderately deep over pebbles
gently undulated (0-5)
SC-siC-C SC-C
30-100 imperfect-moderate
sl. acid-sl. alkaline (6.5-7.5) sl. acid-mod. alkaline (7-8.5)
WV
Clayey red soils derived from calcareous rocks
clayey, reddish brown, moderately deep
Sedimentary rock outcrop of Karroo, Cretaceous or Tertiary
Hills gently undulated (0-5)
L-CL CL-SC
<100 good mod.-sl. acid (5.5-6.5) mod.-sl. acid (5.5-6.7)
WP
Shallow soils on non-calcareous rocks
clayey, brown, moderately deep
Hills undulated (0-8) L-CL L-CL
<100 Imperfect-moderate
sl. acid (6-7) sl. acid (6-7)
WM
Medium-textured soils derived from sedimentary rocks
Sandy clay loam, brown, deep
Hills undulated (0-8) SL-SCL SL-SCL
>100 good sl. acid (6-7) sl. acid (6-6.5)
WK
Shallow soils on calcareous rocks
Sandy clay loam, brown, moderately deep, calcareous
Hills undulated (0-8) SL-SCL C-SCL calcareous
gener-ally <100
Imperfect-good sl. acid-sl. alkaline (6.5-8) sl. acid-mod. alkaline (6-9)
IGNEOUS ROCKS AREAS (Units R, B) RV
Red rhyolitic soils Clay loam, dark reddish brown, varying depth
Limbobos’ volcanic range, Karroo rhyolites
Plateaus (>500 m) residue of Tertiary peneplanation
undulated (0-6) SCL-C CL-C
30-150 good mod.-sl. acid (5.5-6.5) mod.-sl. acid (5.5-7)
Rl
Lithic rhyolitic soils Sandy clay loam, yellowish brown, shallow over weathered rock
Limbobos’ volcanic range, Karroo rhyolites
Cuestas and valleys’ side slopes
steep (> 8) LS-SCL weathered rock
< 30 moderate moderately acid (5-6)
Bl
Lithic basaltic soils Sandy clay loam, dark brown, shallow over weathered rock
Basaltic mantle along the Precambrian shield and the
Plains and slopes
undulated (1-8) SL-C weathered rock
< 30 good mod.-sl. acid (5.5-7)
BP
Black basaltic soils
clayey, black, heavy with cracks, varying depth
Limbobos’ volcanic range, Karroo basalts
level (0-1) siC-C C
30-150 moderate sl. acid-sl. alkaline (6.5-7.5) sl. alkaline (7-8)
BV
Red basaltic soils clayey, dark reddish brown, varying depth
nearly level (0-2) SCL-C CL-C
30-150 good strong.-sl. acid (4.8-6.5) mod. acid-sl. alkaline (5-7.5)
BC
Brown soils of clayey colluvium
clayey, very dark brown, varying depth
Colluvial plains nearly level SL-C SC-C
> 30 moderate-imperfect
sl. acid-sl. alkaline (6-8) sl. acid-mod. alkaline (6-8.5)
PRECAMBRIAN SHIELD (Units V, K, l, C) VA
Reddish sandy soils
Sandy, reddish brown, deep
Precambrian shield, acid rocks : granite, gneiss ...
Interfluves, upper and middle slopes
undulated (0-8) S-LS S-LS
> 120 somewhat excessive
mod.-sl. acid (5.5-7) mod.-sl. acid (5-7)
VAp
Dystric red sandy soils
Sandy, reddish brown, deep
undulated (0-8) S-LS S-LS
> 120 somewhat excessive
mod. acid (5-5.5) mod. acid (5-5.5)
VM
Medium-textured red soils
Sandy clay loam, reddish brown, deep
undulated (0-8) LS-SL SL-SCL
> 100 good mod. acid-sl. alkaline (5.5-7) mod. acid-sl. alkaline (5-7)
VMo
Oxic medium-textured red soils
Sandy clay loam, reddish brown, deep
undulated (0-8) LS-SL SL-SCL
> 100 good mod.-sl. acid (5-6.5) strong.-sl. acid (5-7)
VMp
Dystric medium-textured red soils
Sandy clay loam, reddish brown, deep
undulated (0-8) LS-SL SL-SCL
> 150 good mod.-sl. acid (5-6.5) strong.-mod. acid (4.5-6)
VG
Clayey red soils Clayey, reddish brown, deep
Interfluves, upper slopes and plateaus
undulated (0-8) SL-C CL-C
> 100 good mod.-sl. acid (5-6.5) mod.-sl. acid (5-6.5)
VGb
Clayey red soils Clayey, reddish brown, deep
Precambrian shield, (ultra) basic rocks , amphibolites
undulated (0-10) SCL-C CL-C
> 100 good sl. acid (6-7) mod.-sl. acid (5.5-6.5)
VGo
Oxic clayey red soils
Clayey, reddish brown, deep
Precambrian shield, acid rocks : granite, gneiss
gently undulated (0-5)
SL-C SC-C
> 100 good mod.-sl. acid (5-7) mod.-sl. acid (5-6.5)
VGp
Dystric clayey red soils
Clayey, reddish brown, deep
gently undulated (0-5)
SL-C SC-C
> 100 good mod.-sl. acid (5-6.5) mod. acid (5-6)

14
Table 2 : Map legend (part 4)
SYMBOL ORGANIC SALINITY SODICITY DOMINANT CLASSIFICATION VEGETATION MAIN LAND LAND SUITABILITY
MATTER TopsoilL
(%)
Topsoil /
Subsoil ECo (mS/cm)
Topsoil /
Subsoil ESP (%)
FAO 1988 USDA 1992 TYPE LIMITATIONS FOR AGRICULTURE
CAPABILITY (USDA)
FOR IRRIGATION (USBR)
SEDIMENTARY BASIN (Units D, A, G, M, P, S, W) Sl
moderate-high (2-6)
non saline (0-4) non-sl. sodic (0-10)
Mollic Leptosols
Lithic Haplustolls
xerophylous open bushland, shrubland and savannah
shallow depth, erosion (on slopes)
VII-VIII p V-VI p
SC
moderate-high (3-4.5)
non saline (0-1.5) non-sl. saline (0-6.5)
non-sl. sodic (0-11) non-mod. sodic (0-30)
Luvic Chernozems
Calciustolls xerophylous open bushland, shrubland and savannah
shallow depth, erosion (on slopes)
III-IV pd(n) III-IV pd(n)
WV
moderate (1-1.5) non saline (0-0.5) non saline (0-0.5)
non sodic (1-2) non sodic (1-3)
Chromic Luvisols or Haplic Lixisols
Typic Haplustalfs or Kanhaplic Haplustalfs
open bushland and wooded savannah
sometimes soil depth (<1 m), erosion (on slopes)
II pt II tsp
WP
low-moderate (0-2.5)
non saline (0-3) sl. saline (0-5)
non sodic (1-3) non sodic (1-6)
Eutric Cambisols
Typic Ustochrepts
open bushland or wooded savannah
soil depth, drainage, soil fertility
III pt (II-IV) pfd
III-IV pn
WM
moderate (1-3) non saline (0-1) non saline (0-1)
non sodic (0-2) non sodic (0-3)
Eutric Cambisols
Typic Ustochrepts
dense forest or open woodland
soil fertility II-III tf II-III pt
WK
moderate (1-3) non saline (0.1-1) non-mod. saline (0.5-15)
non-sl. sodic (2-8) mod. sodic (15-25)
Calcaric Cambisols or Eutric Cambisols
Typic Ustochrepts
bushland soil depth, sodicity, sometimes salinity
IV pfdn (III-IV) dpfn
III-IV pn
IGNEOUS ROCKS AREAS (Units R, B) RV
moderate-high (2-6)
non saline (0-1.5) non saline (0-1)
non sodic (0-1) non sodic (0-5)
Ferric Lixisols Kanhaplic Rhodustalfs
open forest and wooded savannah
erosion (on slopes), soil depth (<1 m)
II tp (I-III) tp
III pt (II-IV) pt
Rl
moderate-high (2-6)
non saline (0-1) non sodic (0-2) Eutric Leptosols
Typic and Lithic Ustorthents
wooded savannah or open shrubland
soil depth VII-VIII tp V-VI ptcb
Bl
moderate-high (1-6)
non saline (0-2) non-sl. sodic (0-8)
Eutric Leptosols
Lithic Ustorthents
wooded savannah, grassland
soil depth, erosion VII-VIII tp V-VI pcb
BP
moderate-high (1.5-6)
non saline (0-2) non saline (0-2)
non-sl. sodic (2-8) non-mod. sodic (4-20)
Calcic Vertisols Typic Calciusterts
wooded savannah, grassland
sodicity, sometimes depth, land preparation
III snp II-III spd (n)
BV
moderate-high (2-6)
non saline (0-1) non saline (0-1)
non sodic (1-3) non sodic (1-6)
Ferric Lixisols Kanhaplic Rhodustalfs
wooded savannah, grassland
sometimes soil depth I-III p I-III ps
BC
moderate-high (2-5.5)
non-sl. saline (0.5-4.5) non-mod. saline (0.5-15)
non-mod. sodic (1-25) non-strong. sodic (1-35)
Haplic Chernozems
Vertic Haplustolls
grassland, open bushland
soil depth, sometimes sodicity and salinity, drainage
III sp(n) (II-IV) sp(n)
II-IV p(n)
PRECAMBRIAN SHIELD (Units V, K, l, C) VA
low-high (0.5-4) non saline (0-1) non saline (0-1)
non sodic (0-2) non sodic (0-4)
Ferralic Arenosols
Ustic Quartzi-psamments
wooded savannah and open forest
water holding capacity, fertility
III-IV stf II-III st
VAp
low-moderate (0.5-1.5)
non saline (0-1) non saline (0-1)
non sodic (0-1) non sodic (0-1)
Ferralic Arenosols
Ustic Quartzi-psamments
wooded savannah and open forest
water holding capacity, fertility
III-IV stf II-III st
VM
low-high (0.9-4.5) non saline (0-1) non saline (0-1)
non sodic (0-5) non sodic (0-5)
Ferric Lixisols Rhodustalfs Kanhaplic Rhodustalfs
open forest, bushland
germination conditions, erosion hazard
I-III tf II-III pt
VMo
low-moderate (0.5-3)
non saline (0-2) non saline (0-1)
non sodic (0-2) non sodic (0-1)
Rhodic Ferralsols
Rhodic Haplustox
open forest, bushland
fertility, erosion hazard
II-III tf II-III pt
VMp
moderate-high (1-10)
non saline (0-1) non saline (0-1)
non sodic (0-1) non sodic (0-3)
Haplic Acrisols Paleustults wooded savannah, open bushland
fertility, erosion hazard
II-IV f II-III pt
VG
moderate-high (1-6)
non saline (0-1) non saline (0-2)
non sodic (0-2) non sodic (0-5)
Ferric Lixisols Paleustults open forest germination conditions, erosion hazard
I-III tf II-III tp
VGb
moderate-high (1.5-6)
non saline (0-1) non saline (0-2)
non sodic (0-1) non sodic (0-5)
Rhodic Nitisols Rhodic/Ultic Paleustalfs
savannah and mixed bushland
- I-III tsf II-III tsp
VGo
low-very high (0.5-6)
non saline (0-1) non saline (0-1)
non sodic (0-2) non sodic (0-3)
Rhodic Ferralsols
Rhodic Eutrustox
open forest, wooded savannah
phosphorus fixation, fertility
II-III s II pst
VGp
low-high (0.5-6) non saline (0-1) non saline (0-1)
non sodic (0-5) non sodic (0-3)
Ferric Acrisols Paleustults wooded savannah
fertility, erosion hazard
III tsf I-III ts

15
Table 2 : Map legend (part 5)
SYMBOL
SOIL GROUPING DOMINANT SOIL CHARACTERISTICS
GEOMORPHOLOGY &
GEOLOGY
LANDFORM
TOPOGRAPHY Slope (%)
TEXTURE Topsoil
/ Subsoil
DEPTH (cm)
DRAINAGE ACIDITY & ALKALINITY Topsoil
/ Subsoil
(pH-H2o)
PRECAMBRIAN SHIELD (Units V, K, l, C) KA
Grey brown sandy soils
Sandy, greyish brown, deep
Precambrian shield, acid rocks : granite, gneiss...
Lower slopes of interfluves
undulated (0-8) S-LS S-LS
> 100 somewhat excessive
sl. acid-sl. alkaline (6-7.5) mod.-sl. acid (5.5-7)
KAg
Mottled grey brown sandy soils
Sandy, greyish brown, deep
gently undulated (0-4)
S-LS S-LS
> 100 moderate-imperfect
sl. acid (6-6.5) mod.-sl. acid (5.5-6.5)
KAp
Dystric brown sandy soils
Sandy, greyish brown, deep
undulated (0-6) S-LS S-LS
> 100 somewhat excessive
strong.-sl. acid (4.5-6.5) strong.-sl. acid (4.5-6.5)
KM
Medium-textured brown soils
Sandy clay loam, brown, deep
Interfluves, middle and lower slopes
undulated (0-8) S-LS SL-SCL
> 100 moderate sl. acid (6-7) mod.-sl. acid (5-7)
KMo
Oxic dystric medium-textured brown soils
Sandy clay loam, brown, deep
Interfluves, plateaus
nearly level (0-2) LS-SL SL-SCL
> 100 good sl. acid (6-6.5) sl. acid (6-6.5)
KG
Grey brown clayey soils
Clayey, greyish brown, deep
Interfluves, middle and lower slopes
undulated (0-8) LS-SCL SC-C
> 100 moderate mod. acid (5-6) mod.-sl. acid (5-6.5)
KGo
Oxic grey brown clayey soils
Clayey, greyish brown, deep
Interfluves, upper slopes
gently undulated (0-5)
SL-C SC-C
> 200 good mod.-sl. acid (5-6.5) strong.-sl. acid (4.5-6.5)
l
Lithic soils Sandy loam, brown, shallow over weathered rock
Inselbergs, eroded areas, rock outcrop
mountainous (> 30)
LS-SL weathered rock
0-30 excessive mod.-sl. acid (5.5-6.5)
CA
Soils of sandy colluvium
Sandy, mottled grey, deep
Dambos colluvium, derived from Precambrian rocks : gneiss, granite
Dambos, river beds, flat valley bottoms
nearly level (0-2) S-LS S-LS
> 180 imperfect-poor mod.-sl. acid (5.5-6.5) mod.acid-sl. alkaline (5.5-7.5)
CM
Soils of medium-textured colluvium
Sandy clay loam, greyish brown, deep
Dambos, flat valley bottoms
nearly level (0-2) LS-SL SL-SCL
> 150 imperfect-poor mod.-sl. acid (5-7) strong.-sl. acid (4.5-7)
CG
Soils of clayey colluvium
clayey, greyish brown, deep
without river bed
gently undulated (0-3)
SCL-SL SC-C
> 120 imperfect-moderate
sl. acid (6-7) mod.acid-sl. alkaline (5.5-7.5)
C
Unspecified colluvial soils
Greyish brown of varying texture
Dambos nearly level (0-2) unspecified > 100 imperfect-poor unspecified

16
Table 2 : Map legend (part 6)
SYMBOL ORGANIC SALINITY SODICITY DOMINANT CLASSIFICATION VEGETATION MAIN LAND LAND SUITABILITY
MATTER TopsoilL
(%)
Topsoil /
Subsoil ECo (mS/cm)
Topsoil /
Subsoil ESP (%)
FAO 1988 USDA 1992 TYPE LIMITATIONS FOR
AGRICULTURE
CAPABILITY (USDA)
FOR IRRIGATION (USBR)
PRECAMBRIAN SHIELD (Units V, K, l, C) KA
low-moderate (0.5-2.5)
non saline (0-2) non saline (0-1)
non sodic (0-3) non sodic (0-6)
Cambic Arenosols
Ustic Quartzi-psamments
open forest, shrubland
water holding capacity, fertility
III-IV st II-III st
KAg
moderate-high (1-5)
non saline (0-1) non saline (0-1)
non sodic (0-1) non sodic (0-1)
Albic and Cambic Arenosols
Ustic Quartzi-psamments
open bushland water holding capacity, fertility
III-IV sd III-IV s
KAp
low-high (1-3.5)
non saline (0-1) non saline (0-1)
non sodic (0-3) non sodic (0-6)
Ferralic Arenosols
Ustic Quartzi-psamments
open bushland, wooded savannah
water holding capacity, fertility
III-IV sf II-III st
KM
low-high (0.5-4)
non saline (0-1) non saline (0-1)
non sodic (0-2) non sodic (0-4)
Haplic Acrisols Paleustults open bushland or open forest
erosion hazard, germination conditions
II-IV tfs II-III pts
KMo
moderate (1-2)
non saline (0-1) non saline (0-1)
non sodic (0-2) non sodic (0-2)
Ferralsols Typic Kandiustults
open bushland fertility, erosion hazard
II-III ps II-III ps
KG
moderate (1.5-2.5)
non saline (0-1) non saline (0-1)
non sodic (0-1) non sodic (0-1)
Haplic Lixisols Kandic Paleustalfs
wooded savannah or open bushland
germination conditions, erosion hazard
II-III tp II-III stp
KGo
moderate (1-2)
non saline (0-1) non saline (0-1)
non sodic (0-1) non sodic (0-1)
Haplic Ferralsols
Kandiustalfic Eutrustox
open Forest fertility II-III s II st
l
low-moderate (0.5-2)
non saline (0-1) non saline (0-1)
non sodic (0-3) Eutric Leptosols
Lithic Ustorthents
open bushland or grassland
depth, erosion hazard
VII-VIII p VI p
CA
low-moderate (0.5-2.5)
non saline (0-1) non saline (0-1)
non sodic (0-3) non sodic (0-6)
Eutric Fluvisols, Gleyic Arenosols
Psamments grassland drainage, fertility IV id III-V sd
CM
moderate-high (1-3.5)
non saline (0-1) non saline (0-1)
non sodic (0-2) non sodic (0-6)
Gleyic Phaeozems
Tropaquents, Tropaqualfs
open bushland or grassland
drainage III d III d
CG
moderate-high (1-5.5)
non saline (0-1) non saline (0-1)
non sodic (0-2) non sodic (0-5)
Gleysols, Fluvisols
Aquepts, Aquents
grassland drainage IV d III d
C
unspecified unspecified, probably non saline
unspecified, probably non sodic
Gleysols Fluvaquents unspecified drainage IV d III d

17
EXPLANATION OF THE SYMBOLS USED IN THE MAP LEGEND TEXTURE S sand LS loamy sand SL sandy loam SCL sandy clay loam CL clay loam C clay SC sandy clay siC silty clay siCL silty clay loam L loam siL silt loam
LAND SUITABILITY CLASSIFICATION
CLASS LAND CAPABILITY (USDA * )
LAND SUITABILITY FOR IRRIGATION (Adapted from USBR)
I excellent very suitable II good moderately suitable III moderate marginally suitable IV marginal special use (overhead irrigation, rice) V good for pasture not recommended, potentially suitableVI marginal for
pasture not recommended
VII forests - VIII natural reserves -
* Actually it is the USDA-SCS land capability system. Specific limitations are indicated with the following indices : b surface stoniness c stoniness inside the soil profile t topography i flooding d drainage s soil texture n salinity and sodicity f fertility p soil depth Parentheses ( ) are used to indicate the variability of soil suitability/land capability within the soil grouping Additional symbols used in the legend : CEo electrical conductivity of saturated paste extract sl. slightly mod. moderately strong. strongly Remark : the range of values indicated for specific soil characteristics are the actual ranges observed in available data.

18
APPENDIX 2.

19
Table 3 : Map units composition (part 1)
ORIGINAL MUID No. COMPONENT %
SYMBOL 100 60 50 40 30 20 10
FT 1 FT
FT+A 2 FT A
FT+dA 3 FT dA
FG 4 FG
FG+FE 5 FG FE
FG+FGvg 6 FG FGvg
FG+FGz 7 FG FGz
FG+FS 8 FG FS
FG+MC+MM 9 FG MC MM
FG+M+MC 10 FG M MC
FGg 11 FGg
FGg+FGh 12 FGg FGh
FGgz 13 FGgz
FGh 14 FGh
FGhz 15 FGhz
FGv 16 FGv
FGv+FGvz 17 FGv FGvz
FGv+KM 18 FGv KM
FGv+MM 19 FGv MM
FGv+VM 20 FGv VM
FGvg 21 FGvg
FGvh+FGgz 22 FGvh FGgz
FGvs 23 FGvs
FGvsg+FGvsz 24 FGvsg FGvsz
FGvz+FGh 25 FGvz FGh
FGx+FS 26 FGx FS
FGz 27 FGz
FGz+FS 28 FGz FS
FGz+VM 29 FGz VM
FS 30 FS
FS+FG 31 FS FG
FS+FGh 32 FS FGh
FS+FGvs 33 FS FGvs
FS+KM 34 FS KM
FS+PA 35 FS PA
FS+PM 36 FS PM
FSg 37 FSg
FSh 38 FSh
FSm 39 FSm
FE 40 FE
FE+DC 41 FE DC
FE+FG 42 FE FG

20

21
Table 3 : Map units composition (part 2)
ORIGINAL MUID No. COMPONENT %
SYMBOL 100 60 50 40 30 20 10
DC 43 DC
DC+Ah 44 DC Ah
A 45 A
A+AA 46 A AA
A+Ah 47 A Ah
A+M 48 A M
A+MC 49 A MC
dA 50 dA
dA+M 51 dA M
AA 52 AA
AA+AB 53 AA AB
AA+Ah 54 AA Ah
AA+Ah+M 55 AA Ah M
AA+AJ 56 AA AJ
AA+G 57 AA G
AA+MA 58 AA MA
AA+MA+MC 59 AA MA MC
AA+WKl 60 AA WKl
AA+WM 61 AA WM
AA+WP 62 AA WP
dAA 63 dAA
dAA+Ah 64 dAA Ah
AB 65 AB
AB+AA 66 AB AA
AB+MA 67 AB MA
AB+MM 68 AB MM
AB+PM 69 AB PM
AB+WPl 70 AB WPl
Ah 71 Ah
Ah+DC 72 Ah DC
AJ 73 AJ
AJ+AB 74 AJ AB
AJ+MA 75 AJ MA
AJ+WP 76 AJ WP
dAJ 77 dAJ
dAJ+Ah 78 dAJ Ah
G 79 G
Gl 80 Gl
22
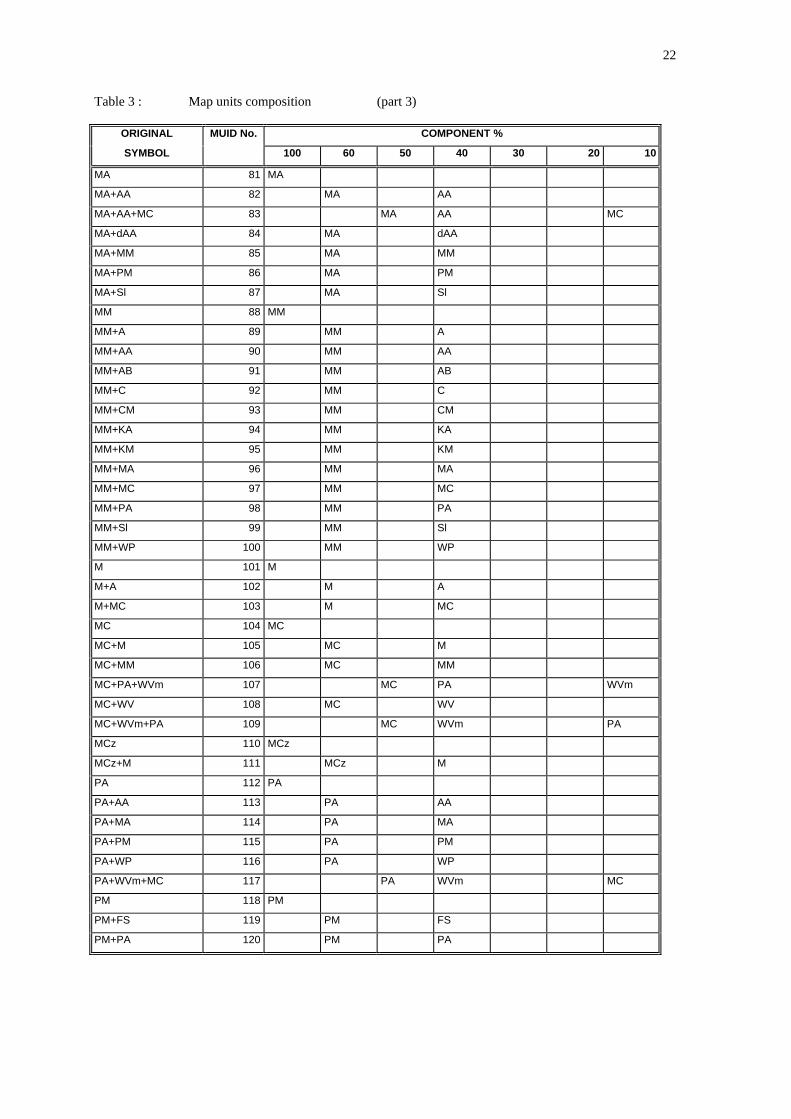
Table 3 : Map units composition (part 3)
ORIGINAL MUID No. COMPONENT %
SYMBOL 100 60 50 40 30 20 10
MA 81 MA
MA+AA 82 MA AA
MA+AA+MC 83 MA AA MC
MA+dAA 84 MA dAA
MA+MM 85 MA MM
MA+PM 86 MA PM
MA+Sl 87 MA Sl
MM 88 MM
MM+A 89 MM A
MM+AA 90 MM AA
MM+AB 91 MM AB
MM+C 92 MM C
MM+CM 93 MM CM
MM+KA 94 MM KA
MM+KM 95 MM KM
MM+MA 96 MM MA
MM+MC 97 MM MC
MM+PA 98 MM PA
MM+Sl 99 MM Sl
MM+WP 100 MM WP
M 101 M
M+A 102 M A
M+MC 103 M MC
MC 104 MC
MC+M 105 MC M
MC+MM 106 MC MM
MC+PA+WVm 107 MC PA WVm
MC+WV 108 MC WV
MC+WVm+PA 109 MC WVm PA
MCz 110 MCz
MCz+M 111 MCz M
PA 112 PA
PA+AA 113 PA AA
PA+MA 114 PA MA
PA+PM 115 PA PM
PA+WP 116 PA WP
PA+WVm+MC 117 PA WVm MC
PM 118 PM
PM+FS 119 PM FS
PM+PA 120 PM PA

23
Table 3 : Map units composition (part 4)
ORIGINAL MUID No. COMPONENT %
SYMBOL 100 60 50 40 30 20 10
Sl 121 Sl
SC+Sl 122 SC Sl
WV 123 WV
WV+BC 124 WV BC
WV+CG 125 WV CG
WV+CG+AA 126 WV CG AA
WV+WKl 127 WV WKl
WV+WVl 128 WV WVl
WVl 129 WVl
WVl+Bl 130 WVl Bl
WVl+l 131 WVl l
WVl+MC+PA 132 WVl MC PA
WVl+WV 133 WVl WV
WVm 134 WVm
WVm+PA+MC 135 WVm PA MC
WVm+WV 136 WVm WV
WVm+WVl 137 WVm WVl
WVmx 138 WVmx
WVmx+WV 139 WVmx WV
WP 140 WP
WP+A 141 WP A
WP+MM 142 WP MM
WP+WK 143 WP WK
WP+WM 144 WP WM
WPl 145 WPl
WPl+FG 146 WPl FG
WPl+Rl 147 WPl Rl
WPl+WPm 148 WPl WPm
WPv 149 WPv
WPv+A 150 WPv A
WM 151 WM
WM+AA 152 WM AA
WMl 153 WMl
WMl+WV+PA 154 WMl WV PA
WMl+WVm+PA 155 WMl WVm PA
WMm 156 WMm
WMmx 157 WMmx
WMx 158 WMx

24
Table 3 : Map units composition (part 5)
ORIGINAL MUID No. COMPONENT %
SYMBOL 100 60 50 40 30 20 10
WK 159 WK
WKl 160 WKl
WKl+FG 161 WKl FG
WKm 162 WKm
WKm+WKl 163 WKm WKl
WKx 164 WKx
Rl 165 Rl
Rl+Bl 166 Rl Bl
Rl+RV 167 Rl RV
Bl 168 Bl
Bl+BP 169 Bl BP
Bl+Rl 170 Bl Rl
Bl+Sl 171 Bl Sl
BP 172 BP
BP+Bl 173 BP Bl
BP+BPm 174 BP BPm
BP+BV 175 BP BV
BP+BV+Bl 176 BP BV Bl
BV 177 BV
BV+BC+Bl 178 BV BC Bl
BV+Bl 179 BV Bl
BV+BP 180 BV BP
BV+BP+Bl 181 BV BP Bl
BV+PA 182 BV PA
BC 183 BC
BC+MM 184 BC MM
VA 185 VA
VA+KA 186 VA KA
VA+KAm+l 187 VA KAm l
VA+KAp 188 VA KAp
VA+KG 189 VA KG
VA+KM 190 VA KM
VA+VAl+VMp 191 VA VAl VMp
VA+VAm 192 VA VAm
VA+VAmp+VAp 193 VA VAmp VAp
VA+VM 194 VA VM
VA+VMm+KAp 195 VA VMm KAp
VA+VMp 196 VA VMp
VAl+VAm 197 VAl VAm

25
Table 3 : Map units composition (part 6)
ORIGINAL MUID No. COMPONENT %
SYMBOL 100 60 50 40 30 20 10
VAm+VAl 198 VAm VAl
VAm+VAl+VMm 199 VAm VAl VMm
VAm+VMo 200 VAm VMo
VAm+VMpm 201 VAm VMpm
VApx 202 VApx
VM 203 VM
VM+C 204 VM C
VM+CA 205 VM CA
VM+CG+VMm 206 VM CG VMm
VM+C+l 207 VM C l
VM+l 208 VM l
VM+KA 209 VM KA
VM+KAl 210 VM KAl
VM+KAm 211 VM KAm
VM+KG 212 VM KG
VM+KM 213 VM KM
VM+KM+C 214 VM KM C
VM+KM+CA 215 VM KM CA
VM+KM+l 216 VM KM l
VM+KM+KA 217 VM KM KA
VM+KM+KA+CA 218 VM KM KA CA
VM+KM+KA+CG 219 VM KM KA CG
VM+VA 220 VM VA
VM+VG 221 VM VG
VM+VGm 222 VM VGm
VM+VGo 223 VM VGo
VM+VMm+VG 224 VM VMm VG
VMb+KAp 225 VMb KAp
VMb+VGb 226 VMb VGb
VMl 227 VMl
VMl+l 228 VMl l
VMl+KMl 229 VMl KMl
VMl+VA+l 230 VMl VA l
VMl+VMm 231 VMl VMm
VMm 232 VMm
VMm+l 233 VMm l
VMm+KA 234 VMm KA
VMm+KAm 235 VMm KAm
VMm+KAm+l 236 VMm KAm l
VMm+KMm 237 VMm KMm
VMm+KMm+KA 238 VMm KMm KA
26
Table 3 : Map units composition (part 7)
ORIGINAL MUID No. COMPONENT %
SYMBOL 100 60 50 40 30 20 10
VMm+VAm 239 VMm VAm
VMm+VM 240 VMm VM
VMm+VMl 241 VMm VMl
VMmx 242 VMmx
VMx 243 VMx
VMx+l 244 VMx l
VMx+KA+C 245 VMx KA C
VMx+KMx 246 VMx KMx
VMo 247 VMo
VMo+l 248 VMo l
VMo+KA 249 VMo KA
VMo+KA+l 250 VMo KA l
VMo+KAp 251 VMo KAp
VMo+KG 252 VMo KG
VMo+KM 253 VMo KM
VMo+VGo 254 VMo VGo
VMp 255 VMp
VMp+KAp 256 VMp KAp
VMp+KM+l 257 VMp KM l
VMp+VGo 258 VMp VGo
VMp+VMm 259 VMp VMm
VMp+VMpm 260 VMp VMpm
VMpm+VMl 261 VMpm VMl
VG 262 VG
VG+CA 263 VG CA
VG+CGv 264 VG CGv
VG+l 265 VG l
VG+KA 266 VG KA
VG+KA+CA 267 VG KA CA
VG+KG 268 VG KG
VG+KGv+KAm 269 VG KGv KAm
VG+KM 270 VG KM
VG+KM+CA 271 VG KM CA
VG+KM+KAm 272 VG KM KAm
VG+VA 273 VG VA
VG+VGl 274 VG VGl
VG+VGm 275 VG VGm
VG+VGo 276 VG VGo
VG+VGx 277 VG VGx
VG+VM 278 VG VM
VG+VM+CA 279 VG VM CA
VG+VM+KA+CA 280 VG VM KA CA

27
Table 3 : Map units composition (part 8)
ORIGINAL MUID No. COMPONENT %
SYMBOL 100 60 50 40 30 20 10
VGl+l 281 VGl l
VGm 282 VGm
VGm+C 283 VGm C
VGm+KMm 284 VGm KMm
VGm+VGl 285 VGm VGl
VGm+VMm 286 VGm VMm
VGm+VMm+VGl 287 VGm VMm VGl
VGx+VMx 288 VGx VMx
VGb 289 VGb
VGb+CG 290 VGb CG
VGb+KGb 291 VGb KGb
VGo 292 VGo
VGo+CG 293 VGo CG
VGo+CM 294 VGo CM
VGo+l 295 VGo l
VGo+KGo 296 VGo KGo
VGo+KM 297 VGo KM
VGo+KMo 298 VGo KMo
VGo+KM+l 299 VGo KM l
VGo+VGb 300 VGo VGb
VGo+VGm 301 VGo VGm
VGo+VGx 302 VGo VGx
VGo+VMm 303 VGo VMm
VGo+VMo 304 VGo VMo
VGo+VMom 305 VGo VMom
VGo+VMo+CA 306 VGo VMo CA
VGo+VMo+KA 307 VGo VMo KA
VGo+VMp 308 VGo VMp
VGom 309 VGom
VGom+VMo 310 VGom VMo
VGom+VMom 311 VGom VMom
VGomx+VMom+l 312 VGomx VMom l
VGp 313 VGp
VGp+KM 314 VGp KM
VGp+KMx 315 VGp KMx
VGp+VGo 316 VGp VGo
VGp+VMp 317 VGp VMp
VGp+VMp+KA 318 VGp VMp KA

28
Table 3 : Map units composition (part 9)
ORIGINAL MUID No. COMPONENT %
SYMBOL 100 60 50 40 30 20 10
KA 319 KA
KA+l 320 KA l
KA+KAm 321 KA KAm
KA+KM 322 KA KM
KA+VG 323 KA VG
KA+VM 324 KA VM
KA+VM+C 325 KA VM C
KAg 326 KAg
KAg+CG 327 KAg CG
KAg+CM 328 KAg CM
KAg+VA 329 KAg VA
KAg+VM 330 KAg VM
KAl 331 KAl
KAl+KMl 332 KAl KMl
KAl+KMo 333 KAl KMo
KAl+VM 334 KAl VM
KAl+VMl 335 KAl VMl
KAl+VMm 336 KAl VMm
KAm 337 KAm
KAm+KA 338 KAm KA
KAm+KAl 339 KAm KAl
KAmp+VM 340 KAm VM
KAx+KMx 341 KAx KMx
KAx+KMx+CA 342 KAx KMx CA
KAp 343 KAp
KAp+VA 344 KAp VA
KAp+VAp 345 KAp VAp
KAp+VM 346 KAp VM
KAp+VMm 347 KAp VMm
KAp+VMo 348 KAp VMo
KAp+VMp 349 KAp VMp
KM 350 KM
KM+C 351 KM C
KM+CA 352 KM CA
KM+l 353 KM l
KM+KA 354 KM KA
KM+KAg 355 KM KAg
KM+KAp 356 KM KAp
KM+KG 357 KM KG
KM+VM 358 KM VM
KM+VM+CA 359 KM VM CA
KMl+KAl 360 KMl KAl
KMm 361 KMm

29
Table 3 : Map units composition (part 10)
ORIGINAL MUID No. COMPONENT %
SYMBOL 100 60 50 40 30 20 10
KMm+KMl 362 KMm KMl
KMm+VMm 363 KMm VMm
KMp+l 364 KMp l
KMx 365 KMx
KMx+C 366 KMx C
KMx+KA 367 KMx KA
KMx+VMx+C 368 KMx VMx C
KMo 369 KMo
KG 370 KG
KG+KA 371 KG KA
KG+VG 372 KG VG
KGm+KG 373 KGmx
KGmx 374 KGmx KG
KGmx+KG 375 KGmx KMl
KGmx+KMl 376 KGmx VGo
KGmx+VGo 377 KGm KG
KGx 378 KGx
KGx+KGm 379 KGx KGm
KGo 380 KGo
KGo+VGo 381 KGo VGo
l 382 l
l+Bl 383 l Bl
l+KMmx 384 l KMmx
l+VG 385 l VG
l+VGom+VMom 386 l VGom VMom
l+VGomx+VMom 387 l VGomx VMom
l+VMm 388 l VMm
l+VMmx 389 l VMmx
l+VMm+KA 390 l VMm KA
CA 391 CA
CA+VG 392 CA VG
CA+VM 393 CA VM
CM 394 CM
CM+CG 395 CM CG
CG+CM 396 CG CM
CG+CM+VGo 397 CG CM VGo
CGm 398 CGm
C 399 C
C+KA 400 C KA
C+KAg 401 C KAg
C+KM 402 C KM
C+VA 403 C VA
C+VM 404 C VM

30
APPENDIX 3.

31
Table 4 : List of map unit components and their typifying pedons (part 1) Component (Original code)
Typical profile FAO Classification
Latitude (S)
Longitude (E)
Elevation (m)
Year of Survey
A - AR - - - -
AA 896, ref1 * ARb.dys 26 28 30 32 41 20 30 1962
AB 173, ref1 ARa.dys 26 06 50 32 24 15 35 1961
Ah GX00628, ref2 ** ARg.eut 25 04 23 33 41 59 7 1994
AJ 893, ref1 ARo.dys 26 25 50 32 43 20 9 1962
BC 18, ref1 PHl.ort 26 03 55 32 17 00 38 1980
Bl 970, ref1 LPe.ort 26 03 20 32 16 20 30 1963
BP MA0178, SDB-Moz *** VRe.cal 25 45 19 32 18 15 58 1962
BPm MO0058, SDB-Moz VRe.cal 25 21 30 32 06 50 117 1962
BV 87, ref1 PHl.rho 26 09 00 32 13 30 58 1961
C - GLm/PHg/ARg - - - -
CA PI0168, SDB-Moz ARg.alb 14 24 27 38 54 29 420 1994
CG ZU0033, SDB-Moz GLm.eut 16 49 20 37 09 34 - 1995
CGm PA0052, SDB-Moz GLm.eut 13 43 35 39 44 30 265 1994
CGv - GLm.ver - - - -
CM CH0103, SDB-Moz PHg.eut 13 17 45 39 48 50 380 1994
dA - AR - - - -
dAA GX00616, ref2 ARb.dys 25 09 37 33 21 48 55 1994
dAJ GX0003, SDB-Moz ARo.chr 25 04 20 33 47 30 23 1982
DC GX00627, ref2 ARh.dys 25 06 33 33 43 41 56 1994
FE GX00643, ref2 FLs.epigle 25 08 57 33 30 05 0.5 1994
FG MT0143, SDB-Moz FLm.ver 26 48 00 32 27 30 18 1962
FGg GH0017, SDB-Moz FLm.gle 24 31 55 33 02 10 22 1982
FGgz - FLs.gle - - - -
FGh GX00609, ref2 FLm.epigle 24 52 33 33 27 13 12 1994
FGhz GX00641, ref2 FLs.epigle 25 08 46 33 32 08 1 1994
FGv GX00631, ref2 VRe.pel 24 48 50 33 30 00 13 1994
FGvg GX0033, SDB-Moz VRe.gle 24 47 45 33 33 10 8 1980
FGvh GH0051, SDB-Moz VRe.epigle 24 28 29 32 54 57 31 1988
FGvs GX00633, ref2 VRe.sod 24 49 47 33 27 52 12 1994
FGvsg GX0027, SDB-Moz VRe.sodgle 24 51 45 33 34 50 7 1980
FGvsz - VRe.salsod - - - -
FGvz - VRe.sal - - - -
FGx - FLm.ort - - - -
FGz MA0343, SDB-Moz FLs.ver 26 09 40 32 24 40 9 1961
FS MT0124, SDB-Moz FLe.ort 26 50 30 32 20 57 28 1961
FSg MO0001, SDB-Moz FLe.gle 25 15 30 32 16 20 - 1990
FSh MT0105, SDB-Moz FLe.epigle 26 22 45 32 40 15 2 1962
FSm MO0078, SDB-Moz FLe.ort 25 21 50 32 14 15 66 1962
FT T159, ref1 FLu.epigle - - 7 1982
G 532, ref1 ARo.dys 26 44 25 32 28 45 120 1961
Gl - ARo.dys - - - -
KA PA0024, SDB-Moz ARb.ort 13 56 15 39 50 15 300 1983
KAg - ARb.ort - - - -
KAl AO0147, SDB-Moz LPe.ort 19 11 04 33 50 15 290 1994
KAm PA0031, SDB-Moz ARb.ort 13 59 58 39 40 38 360 1983
KAmp PP0004, SDB-Moz ARb.dys 14 42 05 39 55 46 315 1993
KAp PW0015, SDB-Moz ARl.dys 14 57 30 38 08 38 590 1982
KAx - ARb.ort - - - -

32
Table 4 : List of map unit components and their typifying pedons (part 2) Component (Original code)
Typical profile FAO Classification
Latitude (S)
Longitude (E)
Elevation (m)
Year of Survey
KG ZU0002, SDB-Moz LVf.ort 16 57 53 36 57 14 100 1995
KGb CH0024, SDB-Moz LXh.hyp 13 34 94 39 49 53 236 1994
KGm - LVf.ort - - - -
KGmx - LVf.ort - - - -
KGo CN0075, SDB-Moz FRh.lix 13 36 17 38 47 35 495 1994
KGv ZU0024, SDB-Moz LVv.ort 16 38 00 37 06 11 - 1995
KGx CP0074, SDB-Moz LXh.ort 13 07 32 40 15 32 200 1994
KM PW0030, SDB-Moz LXh.ort 14 54 24 38 28 17 620 1982
KMl AO0150, SDB-Moz LPe.ort 19 12 03 33 53 06 245 1994
KMm PL0001, SDB-Moz LXh.ort 14 25 08 38 11 15 420 1979
KMmx - LXh.ort - - - -
KMo PA0101, SDB-Moz LXh.hyp 14 03 25 40 02 32 275 1994
KMp PI0042, SDB-Moz LXh.are 14 47 04 38 46 30 560 1982
KMx - LXh.ort - - - -
l ZU00137, SDB-Moz LPe.ort 16 46 00 36 47 16 - 1995
M - SNh/PLe - - - -
MA 686, ref1 PLe.are 26 05 30 32 39 45 4 1961
MC 30, ref1 SNg.ver 26 02 30 32 24 55 2.5 1980
MCz - SNg.ver - - - -
MM 138, ref1 SNh.ort 26 08 30 32 19 20 35 1961
PA 153, ref1 LVx.ort 26 05 20 32 26 50 20 1961
PM 735, ref1 LXh.ort 26 14 40 32 24 10 20 1961
Rl 1965, ref1 LPe.ort 26 56 00 32 00 15 600 1963
RV 1100, ref1 LXh.ort 25 57 20 32 01 15 450 1962
SC 28, ref1 CHl.ver 32 06 15 32 17 00 32 1980
Sl 363, ref1 LPm.ort 26 36 55 32 18 40 50 1961
VA ZU0009, SDB-Moz ARo.chr 17 04 08 37 00 09 - 1995
VAl AO0133, SDB-Moz LPe.ort 19 04 16 33 46 10 340 1994
VAm CA0155, SDM-Moz ARo.chr 13 07 11 39 50 31 355 1994
VAmp - ARo.chr - - - -
VAp - ARo.chr - - - -
VApx - ARo.chr - - - -
VG ZU0001, SDB-Moz LVf.chr 16 59 07 36 57 53 110 1995
VGb ZU0012, SDB-Moz PHl.chr 16 47 59 37 04 44 165 1995
VGl PN0561, SDB-Moz LPe.chr 15 09 09 39 18 09 - 1993
VGm PN0536, SDB-Moz LVf.chr 15 09 09 39 18 09 - 1993
VGo ZU0020, SDB-Moz FRh.acr 16 51 11 36 50 13 - 1995
VGom CN0064, SDB-Moz FRh.lix 13 53 21 38 38 08 390 1994
VGomx - FRh.lix - - - -
VGp ZU0021, SDB-Moz ACh.hyp 16 52 04 36 47 40 - 1995
VGx - ACh.hyp - - - -
VM PA0019, SDB-Moz LXh.hyp 13 55 55 39 48 50 357 1983
VMb PI0192, SDB-Moz LXh.hyp 14 01 36 39 03 18 320 1994
VMl AO0152, SDB-Moz LXh.fer - - 510 1994
VMm AO0187, SDB-Moz LXh.hyp 19 25 05 33 34 12 500 1994
VMmx AO0141, SDB-Moz LXh.hyp 19 07 20 33 43 05 500 1994
VMo ZU0016, SDB-Moz LXh.hyp 17 02 11 37 10 23 130 1995
VMom CN0188, SDB-Moz LXh.hyp 13 34 00 39 14 00 400 1994
33
Table 4 : List of map unit components and their typifying pedons (part 3) Component (Original code)
Typical profile FAO Classification
Latitude (S)
Longitude (E)
Elevation (m)
Year of Survey
VMp ZU0008, SDB-Moz ACh.hyp 17 00 44 36 58 30 - 1995
VMpm - ACh.hyp - - - -
VMx ZU0005, SDB-Moz ACf.hyp 16 54 51 36 46 40 205 1995
WK 42, ref1 CMe.mol - - - -
WKl - CMe.lit - - - -
WKm - CMe.mol - - - -
WKx - CMe.mol - - - -
WM MP0107, SDB-Moz CMe.mol 26 42 50 32 16 30 48 1963
WMl - CMe.lit - - - -
WMm - CMe.mol - - - -
WMmx - CMe.mol - - - -
WMx - CMe.mol - - - -
WP 53, ref1 LVh.ort - - - -
WPl MM0019, SDB-Moz PHl.lit 25 13 50 32 27 15 87 1963
WPm - LVh.ort - - - -
WPv - LVh.ver - - - -
WV 206, ref1 LVh.eca - - - 1980
WVl - LVh.lit - - - -
WVm - LVh.eca - - - -
WVmx - LVh.eca - - - -
* ref 1 : Os solos das Províncias de Maputo E Gaza. Nota Explicativa Dos Mapas De Solos. Escalas 1 :50,000 e 1 :250,000. Departamento de Terra E Água, INIA. 1993, Maputo, Mozambique. ** ref 2 : Land Resources Appraisal Report, district of Xai-Xai (Volume II), Departamento de Terra E Água, INIA. 1995, Maputo, Mozambique. *** SDB-MOZ : Computerized Soil Database of Mozambique


![The Status of Soil Resources in Mozambique - fao.org · The Status of Soil Resources in Mozambique ... History of Soil Surveys in Mozambique ... Mozambique.ppt [Compatibility Mode]](https://static.documents.pub/doc/80x56/5ae7146b7f8b9a8b2b8e2256/the-status-of-soil-resources-in-mozambique-fao-status-of-soil-resources-in-mozambique.jpg)


