AGRICULTURE 4. AGRICULTURE 4.1 Soil Classification 4.2 Land Utilisation 4.3 Area, Production and Productivity of Principal Crops 4.4 Area under Principal Crops by Districts 4.5 Area under Principal Crops as Percentages to the Total Area Sown by Districts 4.6 Production of Principal Crops by Districts 4.7 Agricultural Machinery and Implements 4.8 Consumption of Chemical Fertilizers and Pesticides 4.9 Number of Operational Holdings 4.10 Area of Operational Holdings 4.11 Index Numbers of Agricultural Production and Productivity 4.12 Time Series Data - Area of Important Crops in Tamil Nadu 4.13 Time Series Data - Productivity and Production of Important Crops in Tamil Nadu 4.14 Micro-Nutrient Mixtures Capacity, Production and Distribution 4.15 Distribution of Quality Seeds 4.16 Seed Replacement by Crops 4.17 Coconut Development Programmes 69
Transcript
AGRICULTURE
4. AGRICULTURE
4.1Soil Classification
4.2Land Utilisation
4.3Area, Production and Productivity of Principal Crops
4.4Area under Principal Crops by Districts
4.5Area under Principal Crops as Percentages to the Total Area Sown by Districts
4.6Production of Principal Crops by Districts
4.7Agricultural Machinery and Implements
4.8Consumption of Chemical Fertilizers and Pesticides4.9Number of Operational Holdings
4.10Area of Operational Holdings
4.11Index Numbers of Agricultural Production and Productivity
4.12Time Series Data - Area of Important Crops in Tamil Nadu
4.13Time Series Data - Productivity and Production of Important Crops in Tamil Nadu
4.14Micro-Nutrient Mixtures Capacity, Production and Distribution
4.15Distribution of Quality Seeds
4.16Seed Replacement by Crops
4.17Coconut Development Programmes
69
AGRICULTURE
4.18Integrated Cotton Development Scheme
4.19Sugarcane Development Scheme
4.20Production and Distribution of Breeder Seeds from Tamil Nadu Agricultural University
4.21Regulated Markets, Check Posts, Rural Godowns, Commercial Grading Centres and Kapas Grading Centres in Tamil Nadu
4.22National Agricultural Insurance Scheme4.23Area and Production of Horticultural Crops by Districts
70
AGRICULTURE
4. AGRICULTURE4.1 SOIL CLASSIFICATION 2010-11
Type of Soil Areas in Tamil Nadu
Red Loam Erode, Namakkal, Salem, Dindigul and Coimbatore
Laterite Soil Dharmapuri, Kancheepuram, Tiruvannamalai, Thiruvallur and Vellore
Black Soil Thoothukkudi, Virudhunagar, Pudukkottai, Madurai, Dindigul, Tiruchirappalli, Ramanathapuram, Karur, Namakkal, Theni and Salem
Sandy Coastal Alluviam Pudukkottai, Madurai, Dindigul, Perambalur, Thanjavur and Tiruchirappalli
Red Sandy Soil Coimbatore, Tiruchirappalli, Karur, Theni, Madurai, Kancheepuram, Tiruvannamalai, Thiruvallur and Vellore
Source: Commissioner of Agriculture, Department of Agriculture, Chennai-600 005
71
AGRICULTURE
4.2 LAND UTILISATION(Area in Hec.)
Classification 2009-10 2010-11
A. Total Geographical Area
1. By Professional Survey 13033072 13033116
2. By Village Papers 13033072 13033116
B. Classification
1. Forests 2126672 2125475
2. Barren and Unculturable land 490335 489253
3. Land put to Non-agricultural uses 2175608 2177034
4. Culturable Waste 326445 330938
5. Permanent Pastures and other grazing lands 109924 109568
6. Land under misc. tree crops and groves not included in the net area sown 252828 252080
7. Current fallow lands 1116981 1014937
8. Other fallow lands 1542137 1580173
9. Net area sown 4892142 4953658
Area sown more than once 679576 799006
Gross Area Sown 5571710 5752664
Source: Department of Economics and Statistics, Chennai-6
72
AGRICULTURE
4.3 AREA, PRODUCTION AND PRODUCTIVITY OF PRINCIPAL CROPS 2010-11
D. OTHER CROPS22. Cotton # 120765 247930 34923. Sugarcane ** 315961 34251796 10824. Tobacco 5366 8209 153025. Chillies 53626 21690 40426. All other crops 1217554 -- --
27. Total (Other Crops) 1713272 -- --28. Total Crops (B+C+D) 5752664 -- --
Production & Yieldrate* Paddy - In terms of Rice; **Sugarcane - In terms of Cane, Yield rate in tonnes per hectare@ Coconut – Production in lakh nuts, Yield rate in Lakh Nuts per ha # Cotton – Production in Bales of 170 Kg lint each
Source: Department of Economics and Statistics, Chennai-600 006
73
AGRICULTURE
4.4 AREA UNDER PRINCIPAL CROPS BY DISTRICTS 2010-11 (Area in Hectares)
District Paddy Cholam Cumbu Ragi Maize1 2 3 4 5 6
1. Kancheepuram 95739 4 43 324 5
2. Thiruvallur 83219 63 280 112 2
3. Cuddalore 115815 61 1731 150 12158
4. Villupuram 149929 1743 10727 588 3015
5. Vellore 43222 6888 1855 4595 336
6. Tiruvannamalai 125490 639 3331 1229 225
7. Salem 33296 20702 1933 8142 24143
8. Namakkal 14058 19800 93 274 9097
9. Dharmapuri 22862 15696 1377 12508 645
10. Krishnagiri 16337 5116 442 40298 233
11. Coimbatore 2666 30562 52 57 3847
12. Thiruppur 11797 19972 88 0 24537
13. Erode 36659 2 241 6441 12575
14. Tiruchirappalli 67165 22795 1892 8 4751
15. Karur 14808 20581 1550 7 789
16. Perambalur 14245 3195 287 2 32108
17. Ariyalur 25211 3520 693 42 9996
18. Pudukkottai 92901 407 0 38 2888
19. Thanjavur 166209 2 0 4 1090
20. Thiruvarur 160237 0 0 0 0
21. Nagapattinam 156049 0 0 0 24
22. Madurai 61064 9846 5187 51 3848
23. Theni 15355 10092 3203 44 9006
24. Dindigul 18349 28679 1985 9 39629
25. Ramanathapuram 131397 1771 464 370 216
26. Virudhunagar 30568 10465 2475 128 10775
27. Sivaganga 83927 45 0 62 1
28. Tirunelveli 79764 1860 163 58 7055
29. Thoothukkudi 20007 8959 9390 109 17495
30. The Nilgiris 392 0 0 0 0
31. Kanniyakumari 16989 0 0 0 0
STATE 1905726 243465 49482 75650 230489
74
AGRICULTURE
4.4 AREA UNDER PRINCIPAL CROPS BY DISTRICTS 2010-11 - (Contd.)(Area in Hectares)
District Other Cereals
Total Cereals
BengalGram
Red gram
Green Gram
1 7 8 9 10 11
1. Kancheepuram 0 96115 1 28 554
2. Thiruvallur 0 83676 1 593 8433
3. Cuddalore 4802 134717 0 115 2911
4. Villupuram 2361 168363 37 117 147
5. Vellore 2853 59749 410 9975 712
6. Tiruvannamalai 4369 135283 3 1335 545
7. Salem 1781 89997 100 2312 12194
8. Namakkal 280 43602 66 889 6941
9. Dharmapuri 8012 61100 425 1954 694
10. Krishnagiri 1182 63608 8 6837 790
11. Coimbatore 2 37186 1619 316 1485
12. Thiruppur 4 56398 3773 125 4104
13. Erode 38 55956 0 1330 636
14. Tiruchirappalli 152 96763 44 1194 360
15. Karur 1 37736 0 2544 95
16. Perambalur 319 50156 6 320 22
17. Ariyalur 456 39918 0 209 4
18. Pudukkottai 6 96240 0 451 116
19. Thanjavur 0 167305 6 23 5157
20. Thiruvarur 0 160237 0 0 37662
21. Nagapattinam 0 156073 0 0 28761
22. Madurai 2119 82115 59 1626 3355
23. Theni 77 37777 50 1560 673
24. Dindigul 17 88668 552 1334 2951
25. Ramanathapuram 794 135012 1 2 482
26. Virudhunagar 1497 55908 93 371 11533
27. Sivaganga 40 84075 12 116 22
28. Tirunelveli 94 88994 3 39 4914
29. Thoothukkudi 970 56930 27 35 35410
30. The Nilgiris 2 394 0 0 3
31. Kanniyakumari 0 16989 0 1 0
STATE 32228 2537040 7296 35751 171666
75
AGRICULTURE
4.4 AREA UNDER PRINCIPAL CROPS BY DISTRICTS 2010-11 -(Contd.)(Area in Hectares)
District BlackGram
Horse gram
Other Pulses
Total Pulses
Total Food
Grains1 12 13 14 15 16
1. Kancheepuram 1831 10 30 2454 98569
2. Thiruvallur 1300 28 64 10419 94095
3. Cuddalore 50098 22 455 53601 188318
4. Villupuram 20144 266 1490 22201 190564
5. Vellore 1527 4080 1683 18387 78136
6. Tiruvannamalai 4758 2233 830 9704 144987
7. Salem 6084 3084 18392 42166 132163
8. Namakkal 1692 739 1295 11622 55224
9. Dharmapuri 2274 8136 6586 20069 81169
10. Krishnagiri 508 14502 4467 27112 90720
11. Coimbatore 994 1649 4799 10862 48048
12. Thiruppur 2626 5625 5889 22142 78540
13. Erode 977 997 1763 5703 61659
14. Tiruchirappalli 6407 462 377 8844 105607
15. Karur 716 1884 717 5956 43692
16. Perambalur 102 4 7 461 50617
17. Ariyalur 1526 0 1 1740 41658
18. Pudukkottai 835 39 313 1754 97994
19. Thanjavur 28843 13 0 34042 201347
20. Thiruvarur 56051 0 0 93713 253950
21. Nagapattinam 51549 0 0 80310 236383
22. Madurai 1036 20 1835 7931 90046
23. Theni 289 358 4503 7433 45210
24. Dindigul 4700 3038 12270 24845 113513
25. Ramanathapuram 3232 1 181 3899 138911
26. Virudhunagar 5156 28 571 17752 73660
27. Sivaganga 305 34 332 821 84896
28. Tirunelveli 10459 67 987 16469 105463
29. Thoothukkudi 37923 1 387 73783 130713
30. The Nilgiris 0 0 0 3 397
31. Kanniyakumari 490 0 46 537 17526
STATE 304432 47320 70270 636735 3173775
76
AGRICULTURE
4.4 AREA UNDER PRINCIPAL CROPS BY DISTRICTS 2010-11 - (Concld.)
(Area in Hectares)
District Sugar-cane Cotton Ground
nutGingell
y Castor
1 17 18 19 20 21
1. Kancheepuram 1039 1 16327 434 0
2. Thiruvallur 6698 0 10348 522 15
3. Cuddalore 30798 6242 9881 3368 19
4. Villupuram 64348 5489 39556 2959 19
5. Vellore 14034 5713 43182 494 150
6. Tiruvannamalai 31435 1191 62296 907 6
7. Salem 12339 14322 21900 4041 899
8. Namakkal 18445 2188 32639 496 2438
9. Dharmapuri 18351 7444 9746 650 287
10. Krishnagiri 2342 1592 14652 553 474
11. Coimbatore 1505 878 6440 456 32
12. Thiruppur 6878 398 7871 2551 123
13. Erode 34479 1347 19895 10960 575
14. Tiruchirappalli 4817 14479 10584 511 204
15. Karur 5837 82 6359 4271 11
16. Perambalur 5316 27263 1417 271 96
17. Ariyalur 7500 5684 12058 1228 27
18. Pudukkottai 7858 12 16459 451 0
19. Thanjavur 8817 518 7522 4565 2
20. Thiruvarur 846 880 1892 363 0
21. Nagapattinam 3046 261 2495 914 0
22. Madurai 3571 6896 2960 693 76
23. Theni 5979 1456 2616 808 104
24. Dindigul 5256 1559 11173 725 171
25. Ramanathapuram 550 1167 3856 774 67
26. Virudhunagar 3314 7904 5837 2248 20
27. Sivaganga 5219 132 4012 100 5
28. Tirunelveli 4776 2432 1011 756 77
29. Thoothukkudi 562 3230 517 1120 75
30. The Nilgiris 0 5 3 0 0
31. Kanniyakumari 6 0 5 0 0
STATE 315961 120765 385509 48189 5972Source: Department of Economics & Statistics, Chennai-600 006
77
AGRICULTURE
4.5 AREA UNDER PRINCIPAL CROPS AS PERCENTAGES TO THE TOTAL AREA SOWN BY DISTRICTS 2010-11
DistrictPaddy Cholam
% to District
% to State
% to District
% to State
1 2 3 4 5
1 Kancheepuram 72.74 5.02 0.00 0.00
2 Thiruvallur 63.5 4.37 0.05 0.03
3 Cuddalore 40.64 6.08 0.02 0.03
4 Villupuram 40.39 7.87 0.47 0.72
5 Vellore 20.39 2.27 3.25 2.83
6 Tiruvannamalai 46.89 6.58 0.24 0.26
7 Salem 12.84 1.75 7.98 8.50
8 Namakkal 7.68 0.74 10.81 8.13
9 Dharmapuri 13.24 1.20 9.09 6.45
10 Krishnagiri 8.97 0.86 2.81 2.10
11 Coimbatore 1.39 0.14 15.99 12.55
12 Thiruppur 5.84 0.62 9.89 8.20
13 Erode 15.35 1.92 0.00 0.00
14 Tiruchirappalli 34.7 3.52 11.78 9.36
15 Karur 14.95 0.78 20.78 8.45
16 Perambalur 14.07 0.75 3.16 1.31
17 Ariyalur 21.76 1.32 3.04 1.45
18 Pudukkottai 60.23 4.87 0.26 0.17
19 Thanjavur 60.97 8.72 0.00 0.00
20 Thiruvarur 60.96 8.41 0.00 0.00
21 Nagapattinam 52.18 8.19 0.00 0.00
22 Madurai 40.57 3.20 6.54 4.04
23 Theni 12.17 0.81 8.00 4.15
24 Dindigul 7.81 0.96 12.21 11.78
25 Ramanathapuram 69.68 6.89 0.94 0.73
26 Virudhunagar 21.84 1.60 7.48 4.30
27 Sivaganga 74.4 4.40 0.04 0.02
28 Tirunelveli 41.14 4.19 0.96 0.76
29 Thoothukkudi 10.83 1.05 4.85 3.68
30 The Nilgiris .51 0.02 0.00 0.00
31 Kanniyakumari 19.13 0.89 0.00 0.00
STATE 32.72 100.00 4.18 100.00
78
AGRICULTURE
4.5 AREA UNDER PRINCIPAL CROPS AS PERCENTAGES TO THE TOTAL AREA SOWN BY DISTRICTS 2010-11 - (Contd.)
DistrictCumbu Ragi
% to District
% to State
% to District
% to State
1 6 7 8 9
1 Kancheepuram 0.03 0.09 0.25 0.43
2 Thiruvallur 0.21 0.57 0.09 0.15
3 Cuddalore 0.61 3.50 0.05 0.20
4 Villupuram 2.89 21.68 0.16 0.78
5 Vellore 0.88 3.75 2.17 6.07
6 Tiruvannamalai 1.24 6.73 0.46 1.62
7 Salem 0.75 3.91 3.14 10.76
8 Namakkal 0.05 0.19 0.15 0.36
9 Dharmapuri 0.80 2.78 7.24 16.53
10 Krishnagiri 0.24 0.89 22.12 53.27
11 Coimbatore 0.03 0.11 0.03 0.08
12 Thiruppur 0.04 0.18 0.00 0.00
13 Erode 0.10 0.49 2.70 8.51
14 Tiruchirappalli 0.98 3.82 0.00 0.01
15 Karur 1.56 3.13 0.01 0.01
16 Perambalur 0.28 0.58 0.00 0.00
17 Ariyalur 0.60 1.40 0.04 0.06
18 Pudukkottai 0.00 0.00 0.02 0.05
19 Thanjavur 0.00 0.00 0.00 0.01
20 Thiruvarur 0.00 0.00 0.00 0.00
21 Nagapattinam 0.00 0.00 0.00 0.00
22 Madurai 3.45 10.48 0.03 0.07
23 Theni 2.54 6.47 0.03 0.06
24 Dindigul 0.85 4.01 0.00 0.01
25 Ramanathapuram 0.25 0.94 0.20 0.49
26 Virudhunagar 1.77 5.00 0.09 0.17
27 Sivaganga 0.00 0.00 0.05 0.08
28 Tirunelveli 0.08 0.33 0.03 0.08
29 Thoothukkudi 5.08 18.98 0.06 0.14
30 The Nilgiris 0.00 0.00 0.00 0.00
31 Kanniyakumari 0.00 0.00 0.00 0.00
STATE 0.85 100.00 1.30 100.00
79
AGRICULTURE
4.5 AREA UNDER PRINCIPAL CROPS AS PERCENTAGES TO THE TOTAL AREA SOWN BY DISTRICTS 2010-11 - (Contd.)
DistrictSugarcane Cotton
% to District
% to State
% to District
% to State
1 10 11 12 13
1 Kancheepuram 0.79 0.33 0.00 0.00
2 Thiruvallur 5.11 2.12 0.00 0.00
3 Cuddalore 10.81 9.75 2.19 5.17
4 Villupuram 17.33 20.37 1.48 4.55
5 Vellore 6.62 4.44 2.69 4.73
6 Tiruvannamalai 11.74 9.95 0.44 0.99
7 Salem 4.76 3.91 5.52 11.86
8 Namakkal 10.07 5.84 1.20 1.81
9 Dharmapuri 10.62 5.81 4.31 6.16
10 Krishnagiri 1.29 0.74 0.87 1.32
11 Coimbatore 0.79 0.48 0.46 0.73
12 Thiruppur 3.41 2.18 0.20 0.33
13 Erode 14.43 10.91 0.56 1.12
14 Tiruchirappalli 2.49 1.52 7.48 11.99
15 Karur 5.89 1.85 0.08 0.07
16 Perambalur 5.25 1.68 26.92 22.58
17 Ariyalur 6.47 2.37 4.91 4.71
18 Pudukkottai 5.09 2.49 0.01 0.01
19 Thanjavur 3.23 2.79 0.19 0.43
20 Thiruvarur 0.32 0.27 0.33 0.73
21 Nagapattinam 1.02 0.96 0.09 0.22
22 Madurai 2.37 1.13 4.58 5.71
23 Theni 4.74 1.89 1.15 1.21
24 Dindigul 2.24 1.66 0.66 1.29
25 Ramanathapuram 0.29 0.17 0.62 0.97
26 Virudhunagar 2.37 1.05 5.65 6.54
27 Sivaganga 4.63 1.65 0.12 0.11
28 Tirunelveli 2.46 1.51 1.25 2.01
29 Thoothukkudi 0.30 0.18 1.75 2.67
30 The Nilgiris 0.00 0.00 0.01 0.00
31 Kanniyakumari 0.01 0.00 0.00 0.00
STATE 5.42 100.00 2.07 100.00
80
AGRICULTURE
4.5 AREA UNDER PRINCIPAL CROPS AS PERCENTAGES TO THE TOTAL AREA SOWN BY DISTRICTS 2010-11 (Concld.)
DistrictGroundnut Gingelly
% to District
% to State
% to District
% to State
1 14 15 16 17
1 Kancheepuram 12.40 4.24 0.33 0.90
2 Thiruvallur 7.90 2.68 0.40 1.08
3 Cuddalore 3.47 2.56 1.18 6.99
4 Villupuram 10.66 10.26 0.80 6.14
5 Vellore 20.37 11.20 0.23 1.03
6 Tiruvannamalai 23.28 16.16 0.34 1.88
7 Salem 8.44 5.68 1.56 8.39
8 Namakkal 17.83 8.47 0.27 1.03
9 Dharmapuri 5.64 2.53 0.38 1.35
10 Krishnagiri 8.04 3.80 0.30 1.15
11 Coimbatore 3.37 1.67 0.24 0.95
12 Thiruppur 3.90 2.04 1.26 5.29
13 Erode 8.33 5.16 4.59 22.74
14 Tiruchirappalli 5.47 2.75 0.26 1.06
15 Karur 6.42 1.65 4.31 8.86
16 Perambalur 1.40 0.37 0.27 0.56
17 Ariyalur 10.41 3.13 1.06 2.55
18 Pudukkottai 10.67 4.27 0.29 0.94
19 Thanjavur 2.76 1.95 1.67 9.47
20 Thiruvarur 0.72 0.49 0.14 0.75
21 Nagapattinam 0.83 0.65 0.31 1.90
22 Madurai 1.97 0.77 0.46 1.44
23 Theni 2.07 0.68 0.64 1.68
24 Dindigul 4.76 2.90 0.31 1.50
25 Ramanathapuram 2.04 1.00 0.41 1.61
26 Virudhunagar 4.17 1.51 1.61 4.66
27 Sivaganga 3.56 1.04 0.09 0.21
28 Tirunelveli 0.52 0.26 0.39 1.57
29 Thoothukkudi 0.28 0.13 0.61 2.32
30 The Nilgiris 0.00 0.00 0.00 0.00
31 Kanniyakumari 0.01 0.00 0.00 0.00
STATE 6.62 100.00 0.83 100.00Source: Department of Economics and Statistics, Chennai-600 006
81
AGRICULTURE
4.6 PRODUCTION OF PRINCIPAL CROPS BY DISTRICTS 2010-11 (in Tonnes)
District
Paddy(in terms of Rice) Cholam
Production % to State
Production
% to State
1 2 3 4 5
1 Kancheepuram 378628 6.54 5 0.00
2 Thiruvallur 250210 4.32 52 0.02
3 Cuddalore 301506 5.21 56 0.02
4 Villupuram 512013 8.84 1553 0.63
5 Vellore 152825 2.64 4028 1.63
6 Tiruvannamalai 357692 6.18 565 0.23
7 Salem 147778 2.55 19459 7.88
8 Namakkal 53956 0.93 13817 5.59
9 Dharmapuri 93207 1.61 12545 5.08
10 Krishnagiri 70126 1.21 14703 5.95
11 Coimbatore 10419 0.18 20146 8.16
12 Tiruppur 46945 0.81 4791 1.94
13 Erode 154538 2.67 2 0.00
14 Tiruchirappalli 268136 4.63 13258 5.37
15 Karur 56991 0.98 7246 2.93
16 Perambalur 54714 0.94 4296 1.74
17 Ariyalur 97869 1.69 2514 1.02
18 Pudukkottai 208874 3.61 328 0.13
19 Thanjavur 476793 8.23 2 0.00
20 Thiruvarur 285589 4.93 0 0.00
21 Nagapattinam 321506 5.55 0 0.00
22 Madurai 260055 4.49 12052 4.88
23 Theni 74010 1.28 31617 12.80
24 Dindigul 98053 1.69 46017 18.63
25 Ramanathapuram 253999 4.39 3442 1.39
26 Virudhunagar 94515 1.63 13959 5.65
27 Sivaganga 188417 3.25 53 0.02
28 Tirunelveli 351822 6.07 1604 0.65
29 Thoothukkudi 89442 1.54 18871 7.64
30 The Nilgiris 1400 0.02 0 0.00
31 Kanniyakumari 80387 1.39 0 0.00
STATE 5792415 100.00 246981 100.00
82
AGRICULTURE
4.6 PRODUCTION OF PRINCIPAL CROPS BY DISTRICTS 2010-11 (Contd.)(in Tonnes)
DistrictCumbu Ragi
Production % to State Production % to
State1 6 7 8 9
1 Kancheepuram 59 0.08 990 0.58
2 Thiruvallur 373 0.48 325 0.19
3 Cuddalore 3615 4.67 332 0.19
4 Villupuram 12889 16.66 1259 0.74
5 Vellore 1695 2.19 14543 8.50
6 Tiruvannamalai 2154 2.78 3409 1.99
7 Salem 2775 3.59 22054 12.89
8 Namakkal 128 0.17 573 0.33
9 Dharmapuri 1897 2.45 21620 12.64
10 Krishnagiri 567 0.73 94143 55.02
11 Coimbatore 74 0.10 137 0.08
12 Tiruppur 126 0.16 0 0.00
13 Erode 304 0.39 9950 5.82
14 Tiruchirappalli 1276 1.65 17 0.01
15 Karur 719 0.93 15 0.01
16 Perambalur 379 0.49 4 0.00
17 Ariyalur 890 1.15 109 0.06
18 Pudukkottai 0 0.00 80 0.05
19 Thanjavur 0 0.00 8 0.00
20 Thiruvarur 0 0.00 0 0.00
21 Nagapattinam 0 0.00 0 0.00
22 Madurai 10111 13.07 118 0.07
23 Theni 10363 13.39 96 0.06
24 Dindigul 3209 4.15 19 0.01
25 Ramanathapuram 818 1.06 529 0.31
26 Virudhunagar 6134 7.93 358 0.21
27 Sivaganga 0 0.00 191 0.11
28 Tirunelveli 341 0.44 178 0.10
29 Thoothukkudi 16473 21.29 39 0.02
30 The Nilgiris 0 0.00 0 0.00
31 Kanniyakumari 0 0.00 0 0.00
STATE 77369 100.00 171096 100.00@-negligible
83
AGRICULTURE
4.6 PRODUCTION OF PRINCIPAL CROPS BY DISTRICTS 2010-11 (Contd.)
(in Tonnes)
DistrictMaize Other Cereals
Production
% to State
Production
% to State
1 10 11 12 13
1 Kancheepuram 19 0.00 0 0.00
2 Thiruvallur 8 0.00 0 0.00
3 Cuddalore 17927 1.74 8335 24.86
4 Villupuram 14227 1.38 2686 8.01
5 Vellore 1593 0.16 3317 9.89
6 Tiruvannamalai 842 0.08 4342 12.95
7 Salem 122867 11.96 1618 4.83
8 Namakkal 65298 6.35 249 0.74
9 Dharmapuri 2519 0.25 6858 20.45
10 Krishnagiri 915 0.09 1426 4.25
11 Coimbatore 22512 2.19 0 0.00
12 Tiruppur 121374 11.81 0 0.00
13 Erode 74744 7.27 37 0.11
14 Tiruchirappalli 23544 2.29 147 0.44
15 Karur 3044 0.30 2 0.01
16 Perambalur 89070 8.67 443 1.32
17 Ariyalur 8630 0.84 831 2.48
18 Pudukkottai 20732 2.02 10 0.03
19 Thanjavur 6241 0.61 0 0.00
20 Thiruvarur 0 0.00 0 0.00
21 Nagapattinam 93 0.01 0 0.00
22 Madurai 15238 1.48 1258 3.75
23 Theni 58382 5.68 48 0.14
24 Dindigul 216794 21.10 15 0.05
25 Ramanathapuram 1178 0.11 448 1.34
26 Virudhunagar 55456 5.40 787 2.35
27 Sivaganga 5 0.00 57 0.17
28 Tirunelveli 22468 2.19 65 0.20
29 Thoothukkudi 61816 6.02 554 1.65
30 The Nilgiris 0 0.00 0 0.00
31 Kanniyakumari 0 0.00 0 0.00
STATE 1027536 100.00 33533 100.00
84
AGRICULTURE
4.6 PRODUCTION OF PRINCIPAL CROPS BY DISTRICTS 2010-11 (Contd.)(in Tonnes)
DistrictTotal Cereals Total Pulses
Production % to State Productio
n % to State1 14 15 16 17
1 Kancheepuram 379701 5.17 1061 0.43
2 Thiruvallur 250968 3.42 4242 1.73
3 Cuddalore 331771 4.51 25593 10.44
4 Villupuram 544627 7.41 17423 7.11
5 Vellore 178001 2.42 7162 2.92
6 Tiruvannamalai 369004 5.02 5177 2.11
7 Salem 316551 4.31 22645 9.24
8 Namakkal 134021 1.82 5236 2.14
9 Dharmapuri 138646 1.89 10225 4.17
10 Krishnagiri 181880 2.47 12659 5.16
11 Coimbatore 53288 0.73 4272 1.74
12 Tiruppur 173236 2.36 9874 4.03
13 Erode 239575 3.26 2709 1.10
14 Tiruchirappalli 306378 4.17 4889 1.99
15 Karur 68017 0.93 2807 1.14
16 Perambalur 148906 2.03 275 0.11
17 Ariyalur 110843 1.51 881 0.36
18 Pudukkottai 230024 3.13 630 0.26
19 Thanjavur 483044 6.57 13535 5.52
20 Thiruvarur 285589 3.89 21500 8.77
21 Nagapattinam 321599 4.38 29931 12.21
22 Madurai 298832 4.07 3078 1.26
23 Theni 174516 2.37 3929 1.60
24 Dindigul 364107 4.95 11268 4.60
25 Ramanathapuram 260414 3.54 1441 0.59
26 Virudhunagar 171209 2.33 3850 1.57
27 Sivaganga 188723 2.57 316 0.13
28 Tirunelveli 376478 5.12 5465 2.23
29 Thoothukkudi 187195 2.55 12914 5.27
30 The Nilgiris 1400 0.02 2 0.00
31 Kanniyakumari 80387 1.09 201 0.08
STATE 7348930 100.00 245191 100.00
85
AGRICULTURE
4.6 PRODUCTION OF PRINCIPAL CROPS BY DISTRICTS 2010-11 (Contd.)(in Tonnes)
District GROUNDNUT GINGELLYProduction % to State Production % to State
1 18 19 20 21
1 Kancheepuram 72969 8.15 228 0.90
2 Thiruvallur 36400 4.06 379 1.49
3 Cuddalore 30563 3.41 1540 6.07
4 Villupuram 94634 10.57 1810 7.13
5 Vellore 97821 10.92 228 0.90
6 Tiruvannamalai 115184 12.86 635 2.50
7 Salem 48011 5.36 2656 10.46
8 Namakkal 76371 8.53 261 1.03
9 Dharmapuri 19768 2.21 342 1.35
10 Krishnagiri 34790 3.88 224 0.88
11 Coimbatore 13090 1.46 203 0.80
12 Tiruppur 15363 1.72 1368 5.39
13 Erode 37026 4.13 7823 30.81
14 Tiruchirappalli 19115 2.13 317 1.25
15 Karur 11817 1.32 1518 5.98
16 Perambalur 1963 0.22 160 0.63
17 Ariyalur 37266 4.16 663 2.61
18 Pudukkottai 25748 2.87 277 1.09
19 Thanjavur 28286 3.16 1734 6.83
20 Thiruvarur 9537 1.06 199 0.78
21 Nagapattinam 7894 0.88 338 1.33
22 Madurai 5410 0.60 312 1.23
23 Theni 4985 0.56 460 1.81
24 Dindigul 31948 3.57 511 2.01
25 Ramanathapuram 5121 0.57 158 0.62
26 Virudhunagar 6398 0.71 444 1.75
27 Sivaganga 4757 0.53 42 0.17
28 Tirunelveli 2237 0.25 250 0.98
29 Thoothukkudi 1151 0.13 307 1.21
30 The Nilgiris 6 0.00 0 0.00
31 Kanniyakumari 9 0.00 0 0.00
STATE 895638 100.00 25387 100.00
86
AGRICULTURE
4.6 PRODUCTION OF PRINCIPAL CROPS BY DISTRICTS 2010-11 (Contd.)(in Tonnes)
District
SUGAR CANE(in term of Cane)
COTTON(in bales of
170 k.g lint each)Productio
n% to State
Production
% to State
1 22 23 24 25
1 Kancheepuram 132576 0.39 2 0.00
2 Thiruvallur 737531 2.15 0 0.00
3 Cuddalore 3315905 9.68 3532 1.42
4 Villupuram 7236792 21.13 13300 5.36
5 Vellore 1267726 3.70 13102 5.28
6 Tiruvannamalai 2949680 8.61 2544 1.03
7 Salem 1302343 3.80 35674 14.39
8 Namakkal 2393368 6.99 7930 3.20
9 Dharmapuri 1611784 4.71 19187 7.74
10 Krishnagiri 189702 0.55 3686 1.49
11 Coimbatore 175225 0.51 2269 0.92
12 Tiruppur 841168 2.46 973 0.39
13 Erode 4115118 12.01 4552 1.84
14 Tiruchirappalli 493673 1.44 28519 11.50
15 Karur 641085 1.87 155 0.06
16 Perambalur 567404 1.66 42145 17.00
17 Ariyalur 739006 2.16 9361 3.78
18 Pudukkottai 853814 2.49 22 0.01
19 Thanjavur 1184908 3.46 1407 0.57
20 Thiruvarur 91711 0.27 2495 1.01
21 Nagapattinam 289076 0.84 763 0.31
22 Madurai 363436 1.06 12119 4.89
23 Theni 715878 2.09 5907 2.38
24 Dindigul 694262 2.03 4327 1.75
25 Ramanathapuram 59623 0.17 1613 0.65
26 Virudhunagar 287655 0.84 14022 5.66
27 Sivaganga 456131 1.33 317 0.13
28 Tirunelveli 483642 1.41 7151 2.88
29 Thoothukkudi 60924 0.18 10847 4.38
30 The Nilgiris 0 0.00 9 0.00
31 Kanniyakumari 650 0.00 0 0.00
STATE 34251796 100.00 247930 100.00
Source: Department of Economics and Statistics, Chennai-6
87
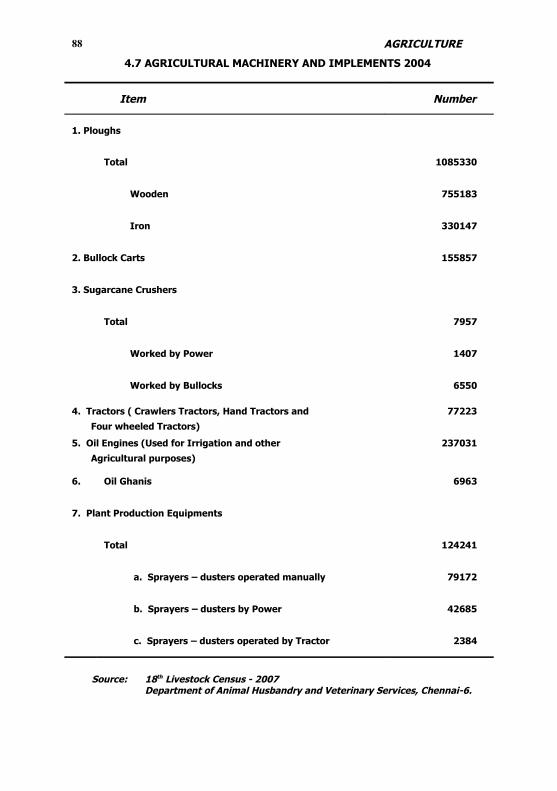
AGRICULTURE
4.7 AGRICULTURAL MACHINERY AND IMPLEMENTS 2004
Item Number
1. Ploughs
Total 1085330
Wooden 755183
Iron 330147
2. Bullock Carts 155857
3. Sugarcane Crushers
Total 7957
Worked by Power 1407
Worked by Bullocks 6550
4. Tractors ( Crawlers Tractors, Hand Tractors and
Four wheeled Tractors)
77223
5. Oil Engines (Used for Irrigation and other
Agricultural purposes)
237031
6. Oil Ghanis 6963
7. Plant Production Equipments
Total 124241
a. Sprayers – dusters operated manually 79172
b. Sprayers – dusters by Power 42685
c. Sprayers – dusters operated by Tractor 2384
Source: 18th Livestock Census - 2007Department of Animal Husbandry and Veterinary Services, Chennai-6.
88
AGRICULTURE
4.8 CONSUMPTION OF CHEMICAL FERTILIZERS AND PESTICIDES 2010-11