The Science of Soil Health and Value of Soil Stewardship Francisco J. Arriaga, PhD Soil Management State Specialist Dept. of Soil Science & UW-Extension [email protected]608-263-3913 SWCS Conference, Greensboro NC July 28, 2015
Transcript
The Science of Soil Health andValue of Soil Stewardship
Francisco J. Arriaga, PhDSoil Management State Specialist
• “The capacity of a soil to function within ecosystem boundaries to sustain biological productivity, maintain environmental quality, and promote plant and animal health.”
(Doran and Parkin, 1994)
• Abbreviated version: Ability of a soil to function in a way that benefits both humans and the environment.
[Note this assumes there is a baseline (i.e. maximum potential) for different soils]
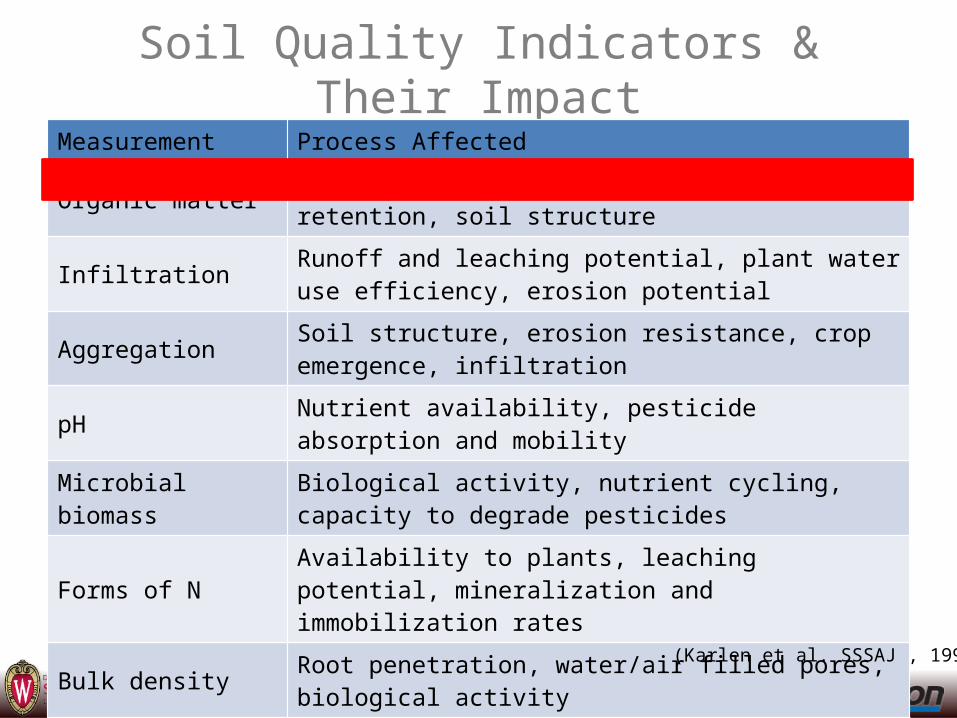
Soil Health Indicators(or Soil Properties that Influence Productivity)
Continuous Corn System with Residue Harvest (32 years)
• Most sensitive indicators were: Db, AWC, OM, Decomp and TG• Tillage had a lager positive impact on improving indicators than
returning corn residue to soil
0
500
1000
1500
2000
2500
0 10 20 30 40 50 60 70 80
Time Since Plowing (days)
Cu
mu
lati
ve C
O2 (
kg C
/ha)
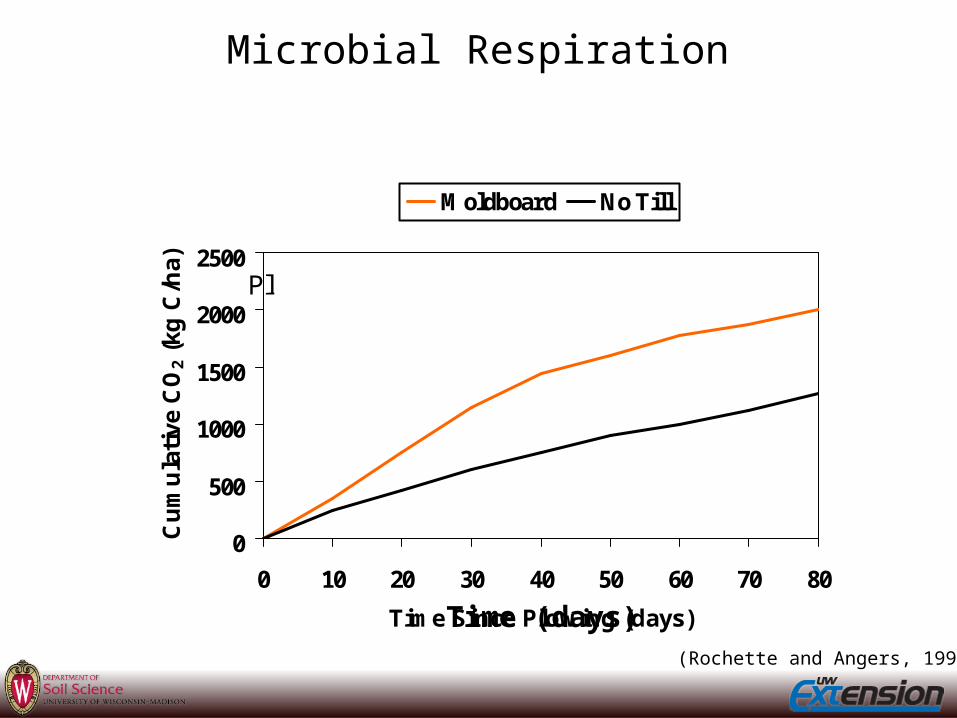
Moldboard No Till
Microbial Respiration
Plowed July 23, 1997
(Rochette and Angers, 1999)
Time (days)
Property SH Assessment SH Rank State Based State Based Recom.
pH 6.5 ok 7.3 ok
Phosphorus (ppm) 6.7 ok 34 High (ok)
Potassium (ppm) 153.9 ok 90 Very low/low (ADD)
OM (%) 3.4 ok 4.2
Score YES NO, but gives nutrient recommendations
based on field trials (CALIBRATION WITH
CROP RESPONSE)
The Potential Issue with Some SH Assessments
The “New” Frontier
• Microbiological assessments (e.g. metagenomics)
• Linking soil quality indicators to crop performance
• New statistical approaches to develop a robust SH/SQ Index
(Stine & Weil, 2002)
Tillage:conventionalreducedno-till
Corn Yield &Soil HealthIndicators
The “New” Frontier
• Microbiological assessments (e.g. metagenomics)
• Linking soil quality indicators to crop performance; new statistical approaches
(Dorr de Quadros et al., 2012)
Closing Remarks
• The science of SH/SQ assessment has been moving slowly from qualitative to quantitative, as new knowledge is developed by scientists and implemented by practitioners.
• Care should be taken not to “over sell” a specific SH metric or procedure, as this can turn the end-user away.
• Microbial community composition and function assessments, and linking soil indicators to crop and environmental performance is the current focus and next “frontier”.
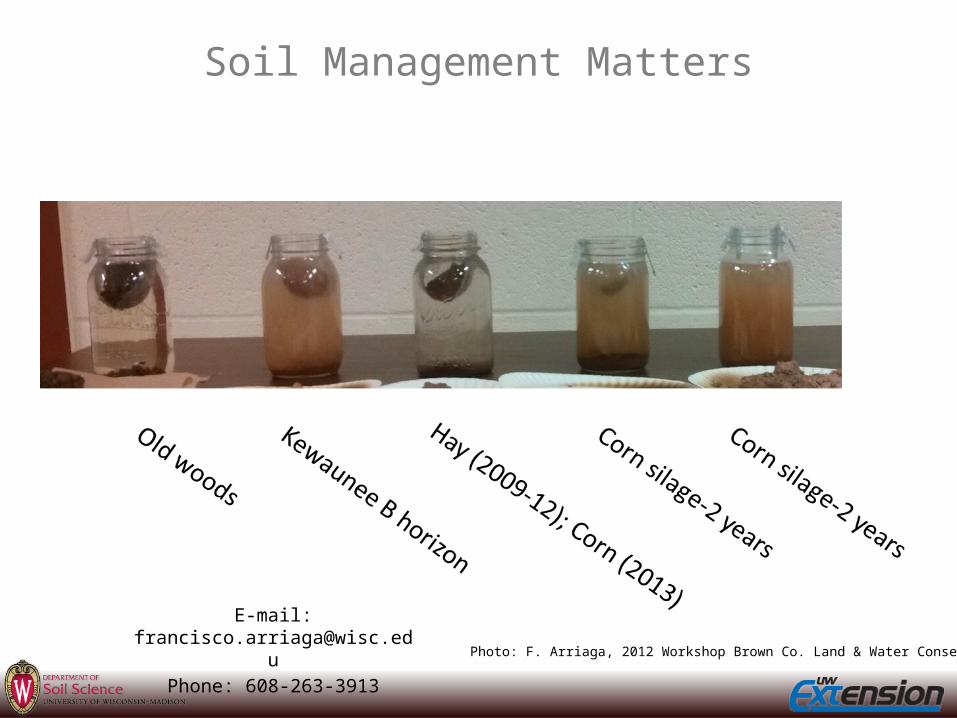
Photo: F. Arriaga, 2012 Workshop Brown Co. Land & Water Conservation