Page 1
BUET-Japan Institute of Disaster Prevention and Urban Safety
Bangladesh University of Engineering and Technology (BUET), Dhaka-1000, Bangladesh.
Email: [email protected] , Phone: +8802-9662975, Fax: +8802-9662975
Soil Investigation Report
November, 2014
Page 2
i
BUET-Japan Institute of Disaster Prevention and Urban Safety
TABLE OF CONTENTS
Page No.
Table of Contents i
List of Tables ii
List of Figures ii-iii
1.1 TERMINOLOGY 1
1.1.1 Representative Soil Sample 1
1.1.2 Disturbed Soil Sample: 1
1.1.3 Undisturbed Soil Sample 1
1.1.4 Hand Auger 2
1.1.5 Shelby Tube 2
1.2 PROCEDURE OF COLLECTING SOIL SAMPLES 3
1.2.1 Classification of the Chittagong Metropolitan Area
(CMA) into Different Clusters
3
1.2.2 Collection of Soil Samples from Several Clusters 3
1.2.3 Procedure for Collecting Disturbed Soil Sample 7
1.2.4 Procedure for Collecting Undisturbed Soil Sample 8
1.3: TESTS PERFORMED ON DISTURBED SOIL SAMPLES 10
1.3.1 Determination of Atterberg Limits 10
1.3.2 Determination of specific gravity 18
1.3.3 Sample calculation for grain size analysis
20
Page 3
ii
BUET-Japan Institute of Disaster Prevention and Urban Safety
LIST OF TABLES AND FIGURES
LIST OF TABLES
LIST OF FIGURES
Table No. Title Page No.
1.1 Data of Lal Pahar (Akbar Shah Mazar Cluster) 16
1.2 Data for Tankir Pahar (Moti Jharna Cluster) 17
1.3 Data for determining the specific gravity 19
1.4 Data for determining the grain size 20
1.5 Index proportion of soil sample collected from hill top sites 21
Figure No. Title Page No.
1.1 A typical hand auger 2
1.2 Extracting soil from bore-hole 2
1.3 Shelby Tube used for Collecting Undisturbed Soil Sample 3
1.4 Cluster- 1 (Moti Jharna Area) 4
1.5 Cluster-5 (Akbar Shah Mazar Area) 4
1.6 View from top of Golpahar (Cluster- 5), the densely packed
human settlement can be seen who are living constantly under
the risk of an imminent landslide
5
1.7 Closely packed temporary houses, narrow muddy pathways and
settlements built on dangerous slopes
5
1.8 Lal Pahar/ Kata Pahar (Cluster- 5); Clear signs of illegal hill
cutting can easily be seen leading to the risk of a probable
landslide any time - local authorities remain unaware of such
problems
6
1.9 Cluster - 9 (Panchlaish Area) 6
Page 4
iii
BUET-Japan Institute of Disaster Prevention and Urban Safety
1.10 (a) Removing the top layer of soil cover,
(b) Using rotating device to dig the auger deep into the ground,
(c) Extraction of soil from the bore hole
7
1.11 Collection of disturbed soil samples into separate polythene bags 8
1.12 Inserting the Shelby tube deep into the ground by means of a 10
lb modified proctor hammer, blows were at a constant rate
8
1.13 (a) Extracting the Shelby tube from the ground with the help
of a twisted steel rod
(b) Waxing both the ends of the Shelby tube after soil sample
collection.
9
1.14 A vertical profile of a hill (Goachibagan Medical Hill,
Panchlaish, Cluster-9) showing different slopes of it (Top,
Middle and Bottom)
10
1.15 Liquid limit device 12
1.16 Determination of liquid limit 13
1.17 Determination of plastic limit 14
1.18 Flow curve- percentage of water content and number of blow
Akbar Shah Mazar Cluster)
16
1.19 Flow curve- percentage of water content and number of blow
(Moti Jharna Cluster)
17
Page 5
1
BUET-Japan Institute of Disaster Prevention and Urban Safety
OBSERVING THE CONDITIONS AND COLLECTING
REPRESENTATIVE SOIL SAMPLES AT LOCATIONS OF
SEVERAL CLUSTERS (FIELD STUDY)
1.1 TERMINOLOGY:
1.1.1 Representative Soil Sample:
A soil sample that represents the constituents of the soil as in the field defined as a
representative soil sample. A representative soil sample is essential in order to conduct
laboratory tests.
1.1.2 Disturbed Soil Sample:
Disturbed soil sample is broken-up soil but representative soil, disturbed during the process
of collection. Geotechnical engineers do not consider them to be representative of
underground soils unless they're for tests that don't depend on the soil structure. Usually,
scientists test the disturbed samples of soil for texture, soil type, moisture content, as well as
the nutrient and contaminant analysis. Most of the soil samples that engineers and geologists
collect are disturbed samples since they're a lot easier to collect and the need for obtaining an
undisturbed sample isn't required for many soil tests.
For the purpose of collecting disturbed soil sample in this study a hand auger was
used.
1.1.3 Undisturbed Soil Sample:
Undisturbed soil samples keep the structural integrity of the in-situ soil and they have a
higher recovery rate in the sampler. It's actually tough to gather a perfectly undisturbed
sample and the samplers may contain a small portion of disturbed soil at the top as well as the
bottom of the sample length. Undisturbed samples allow the engineer to identify the
properties of strength, permeability, compressibility, as well as the fracture patterns among
others.
Page 6
2
BUET-Japan Institute of Disaster Prevention and Urban Safety
For the purpose of collecting undisturbed soil sample in this study, Two (2) feet long ‘Shelby
Tubes’ were used.
1.1.4 Hand Auger:
The hand auger is suitable for unconsolidated soil formations: sand, silt and soft clay. The
hand auger consists of extendable steel rods, rotated by a handle (Figure 1.1). A number of
different steel augers (drill bits) can be attached at the bottom end of the drill rods. The
augers are rotated into the ground until they are filled, and then lifted out of the borehole to
be emptied (Figure 1.2).
Figure 1.1: A typical hand auger.
Figure 1.2: Extracting soil from bore-hole.
Source: Field Survey, September, 2014
1.1.5 Shelby Tube:
Shelby tube samplers are thin-walled, hollow steel tubes, which are driven into the ground to
extract a relatively undisturbed soil sample for use in laboratory tests used to determine
density, permeability, compressibility and strength. Each tube has one end that is chamfered
to form a cutting edge and the upper end includes holes for securing the tube to a drive head
(Figure 1.3). Shelby tubes are useful for collecting soils that are particularly sensitive to
sampling disturbance, including fine cohesive soils and clays. The tubes can also be used to
transport samples back to the lab as well.
Page 7
3
BUET-Japan Institute of Disaster Prevention and Urban Safety
Figure 1.3: Shelby Tube used for Collecting Undisturbed Soil Sample.
1.2 PROCEDURE OF COLLECTING SOIL SAMPLES
1.2.1 Classification of the Chittagong Metropolitan Area (CMA) into Different Clusters
In Inventory Report, the Chittagong Metropolitan Area (CMA) was divided into 10 clusters
initially taking into consideration the landslide hazard locations, tentative similarity of the
surroundings and landslide mechanisms (Chapter-2, Inventory Report). After the preparation
of landslide inventory, it was necessary to collect representative soil samples from different
clusters.
1.2.2 Collection of Soil Samples from Several Clusters
In the conducted field study both disturbed and undisturbed soil samples were collected from
3 different clusters namely Cluster-l (Moti Jharna), Cluster-5 (Akbar Shah Mazar) and
Cluster-9 (Panchlaish) (Figure 1.4, Figure 1.5 and Figure 1.9). For Cluster-l soil samples
were collected from „Tankir Pahar‟, for Cluster-5 soil samples were collected from Two (2)
hills namely „Golpahar and Lal Pahar/ Kata Pahar‟ and for Cluster-9 soil samples were
collected from „Medical Hill (Goachibagan)‟.
Page 8
4
BUET-Japan Institute of Disaster Prevention and Urban Safety
Figure 1.4: Cluster- 1 (Moti Jharna Area).
Source: Google earth and field survey August, 2014
Figure 1.5: Cluster-5 (Akbar Shah Mazar Area)
Source: Google earth and field survey August, 2014
Tiger pass Hill
Batali Hill-2
Batali Hill-1
A.K Khan Hill
Motijharna-1 Motijharna-2
Chanmari bi lane
Tankir Pahar-1
Tankir Pahar-3
Tankir Pahar-2
Akbar Shah Mazar Hill
Lal pahar
Golpahar
Golpahar
Golpahar
Foy’s Lake
Page 9
5
BUET-Japan Institute of Disaster Prevention and Urban Safety
Figure 1.6: View from top of Golpahar (Cluster- 5), the densely packed human settlement can
be seen who are living constantly under the risk of an imminent landslide.
Source: Field Survey, August, 2014
Figure 1.7: Closely packed temporary houses, narrow muddy pathways and settlements built
on dangerous slopes.
Source: Field Survey, August, 2014
Page 10
6
BUET-Japan Institute of Disaster Prevention and Urban Safety
Figure 1.8: Lal Pahar/ Kata Pahar (Cluster- 5); Clear signs of illegal hill cutting can easily be
seen leading to the risk of a probable landslide any time - local authorities remain unaware of
such problems.
Source: Field Survey, August, 2014
Figure 1.9: Cluster - 9 (Panchlaish Area).
Source: Google earth and field survey, August, 2014
The King of Chittagong Hill
Medical Hill
(Guachi Bagan)
K.B. Fazlul kader Road
Page 11
7
BUET-Japan Institute of Disaster Prevention and Urban Safety
1.2.3 Procedure for Collecting Disturbed Soil Sample
1) Digging and removing the top cover of the soil surface with a Shovel initially. Even while
taking disturbed soil sample at the surface level, soil sample cannot be taken from the very
top. After removing almost 6 inches of soil (eye estimation) from the top considering for
weeds and withering, soil sample for top surface was collected (Figure 1.10-a and Figure
1.10-b).
2) After collecting disturbed soil sample at the surface level, the hand auger was used to go
down the soil surface, bore a hole in the process and dig into the soil gradually (Figure 1.10-
c). A 3-feet long iron tube was attached with the auger and with that iron tube a rotating
device was also incorporated. By means of the rotating arrangement, the auger gradually dug
deep into the soil. After going certain depths into the ground, the excavated depth was
measured with the measuring tape, the auger was taken out of the bore-hole and soil sample
was extracted from the auger and kept inside a polythene bag (Figure 1.11). For most of the
cases, e.g., the four hills that were studied, at a particular slope, 3 samples were collected at 3
different depths i.e. at the surface level, below 1.5 feet of surface, below 3 feet of surface.
Figure 1.10: (a) Removing the top layer of soil cover,
(b) Using rotating device to dig the auger deep into the ground,
(c) Extraction of soil from the bore hole
Source: Field Survey, September, 2014
(a) (b) (c)
Page 12
8
BUET-Japan Institute of Disaster Prevention and Urban Safety
Figure 1.11: Collection of disturbed soil samples into separate polythene bags.
Source: Field Survey, September, 2014
1.2.4 Procedure for Collecting Undisturbed Soil Sample:
A Two (2) feet long Shelby Tube was used to collect undisturbed soil sample. First, it was
placed on the ground vertically and above it a square wooden plate was placed so that the
blows from modified proctor hammer get distributed properly and also do not damage the
steel Shelby tube (Figure 1.12).
Figure 1.12: Inserting the Shelby tube deep into the ground by means of a 10 lb modified
proctor hammer, blows were at a constant rate.
Source: Field Survey, September, 2014
Page 13
9
BUET-Japan Institute of Disaster Prevention and Urban Safety
Figure 1.13: (a) Extracting the Shelby tube from the ground with the help of a twisted
steel rod (b) Waxing both the ends of the Shelby tube after soil sample collection.
Source: Field Survey, September, 2014
(a) (b)
After that a 10 lb. modified proctor hammer was used to drive the Shelby tube vertically into
the ground. Blows from modified proctor hammer were at a constant rate and also the ball
was allowed to drop freely. The modified proctor hammer was placed just above the Shelby
tube.
In between the hammer and the tube a 1 inch thick wooden plate was placed.
After going into the ground as much as possible, the Shelby tube was extracted from the
ground. At the top of the Shelby tube, there are two holes. A twisted steel rod was entered
through both the holes and then by twisting the rod with pressure applied by the hand, the
Shelby tube was easily extracted from the ground (Figure 1.13).
After extracting the Shelby tube, with the soil sample still inside, both the ends of it were
waxed to retain the original moisture condition of the field.
Page 14
10
BUET-Japan Institute of Disaster Prevention and Urban Safety
Figure 1.14: A vertical profile of a hill (Goachibagan Medical Hill, Panchlaish, Cluster-9)
showing different slopes of it (Top, Middle and Bottom).
Source: Field Survey, September, 2014
1.3 TESTS PERFORMED ON DISTURBED SOIL SAMPLES
1.3.1 Determination of Atterberg Limits
Purpose:
This laboratory test is performed to determine the plastic and liquid limits of a fine-grained
soil. The liquid limit (LL) is arbitrarily defined as the water content, in
percent, at which a part of soil in a standard cup and cut by a groove of standard
dimensions will flow together at the base of the groove for a distance of 13 mm (1/2 in.)
when subjected to 25 blows from the cup being dropped 10 mm in a standard liquid limit
apparatus operated at a rate of two shocks per second. The plastic limit (PL) is the water
content, in percent, at which a soil can no longer be deformed by rolling into 3.2 mm (1/8 in.)
diameter threads without crumbling.
Standard Reference:
ASTM D 4318 - Standard Test Method for Liquid Limit, Plastic Limit, and Plasticity Index
of Soils.
Page 15
11
BUET-Japan Institute of Disaster Prevention and Urban Safety
Significance:
The Swedish soil scientist Albert Atterberg originally defined seven “limits of
consistency” to classify fine-grained soils, but in current engineering practice only
two of the limits, the liquid and plastic limits, are commonly used. (A third limit,
called the shrinkage limit, is used occasionally.) The Atterberg limits are based on
the moisture content of the soil. The plastic limit is the moisture content that
defines where the soil changes from a semi-solid to a plastic (flexible) state. The
liquid limit is the moisture content that defines where the soil changes from a plastic to a
viscous fluid state. The shrinkage limit is the moisture content that defines where the soil
volume will not reduce further if the moisture content is reduced. A wide variety of soil
engineering properties have been correlated to the liquid and plastic limits, like “Atterberg
Indices” namely Plasticity Index, Flow Index, Toughness Index.
Plastic Limit:
The plastic limit is the threshold point at which soil begins to behave as a plastic material. At
plastic limit the soil must gain some minimum strength. According to Skempton and Northey
(1953) the shear strength at plastic limit is about 100 times that at liquid limit.
Plasticity Index:
Plasticity Index is an indication of plasticity of soils. Plasticity Index greater than 20 indicates
high plastic soil, 10-20 indicates medium plastic and less than 10 indicates non-plastic soils.
It is known that high percentage of clay exhibit high plastic properties. Plasticity Index also a
measure of the range of water content for which it remains plastic. The table below shows the
quality of soil based on the vulnerability to landslides.
Test Procedure:
Liquid Limit:
(1) Soil was pulverized, passed through a No. 40 sieve, air-dried. The soil was thoroughly
mixed with a small amount of distilled water until it appears as a smooth uniform paste.
(2) The liquid limit apparatus was adjusted by checking the height of drop of the cup. The
point on the cup that comes in contact with the base should rise to a height of 10 mm.
The block on the end of the grooving tool is 10 mm high and should be used as a gage.
Page 16
12
BUET-Japan Institute of Disaster Prevention and Urban Safety
It was practiced to rotate the cup and the correct rate to rotate the crank was determined
so that the cup drops approximately two times per second.
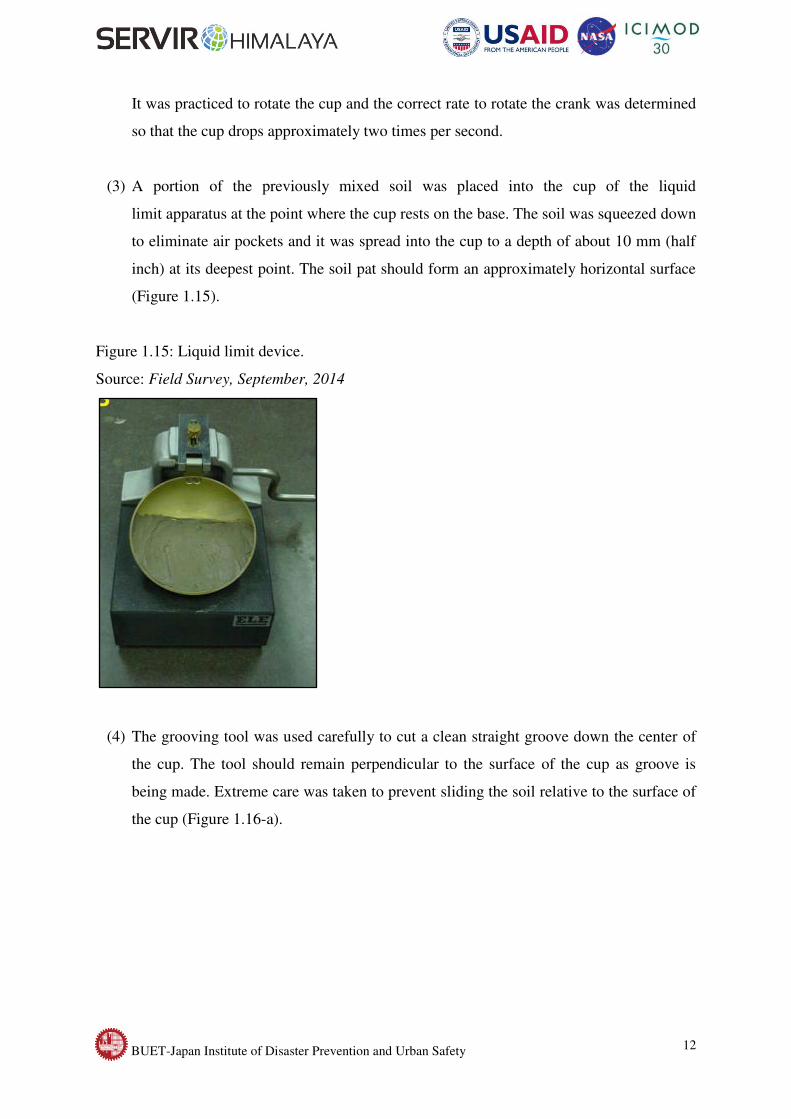
(3) A portion of the previously mixed soil was placed into the cup of the liquid
limit apparatus at the point where the cup rests on the base. The soil was squeezed down
to eliminate air pockets and it was spread into the cup to a depth of about 10 mm (half
inch) at its deepest point. The soil pat should form an approximately horizontal surface
(Figure 1.15).
Figure 1.15: Liquid limit device.
Source: Field Survey, September, 2014
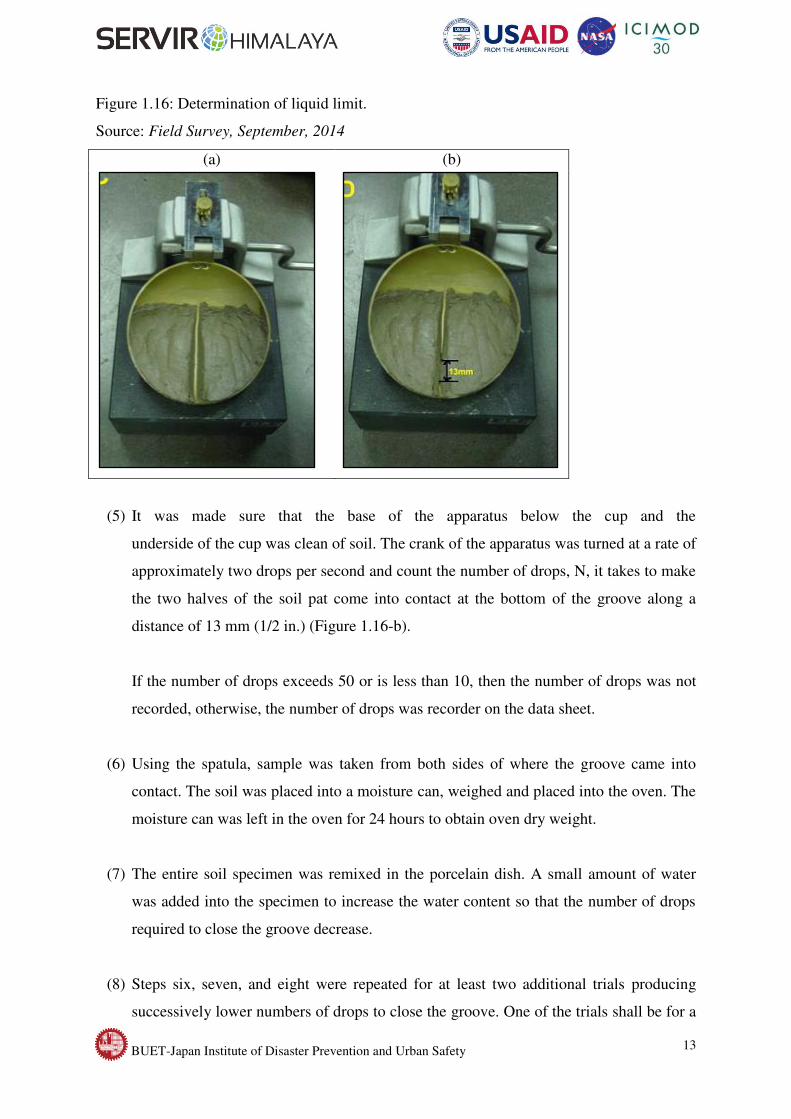
(4) The grooving tool was used carefully to cut a clean straight groove down the center of
the cup. The tool should remain perpendicular to the surface of the cup as groove is
being made. Extreme care was taken to prevent sliding the soil relative to the surface of
the cup (Figure 1.16-a).
Page 17
13
BUET-Japan Institute of Disaster Prevention and Urban Safety
Figure 1.16: Determination of liquid limit.
Source: Field Survey, September, 2014
(a) (b)
(5) It was made sure that the base of the apparatus below the cup and the
underside of the cup was clean of soil. The crank of the apparatus was turned at a rate of
approximately two drops per second and count the number of drops, N, it takes to make
the two halves of the soil pat come into contact at the bottom of the groove along a
distance of 13 mm (1/2 in.) (Figure 1.16-b).
If the number of drops exceeds 50 or is less than 10, then the number of drops was not
recorded, otherwise, the number of drops was recorder on the data sheet.
(6) Using the spatula, sample was taken from both sides of where the groove came into
contact. The soil was placed into a moisture can, weighed and placed into the oven. The
moisture can was left in the oven for 24 hours to obtain oven dry weight.
(7) The entire soil specimen was remixed in the porcelain dish. A small amount of water
was added into the specimen to increase the water content so that the number of drops
required to close the groove decrease.
(8) Steps six, seven, and eight were repeated for at least two additional trials producing
successively lower numbers of drops to close the groove. One of the trials shall be for a
Page 18
14
BUET-Japan Institute of Disaster Prevention and Urban Safety
closure requiring 25 to 35 drops, one for closure between 20 and 30 drops, and one trial
for a closure requiring 15 to 25 drops. The water content from was determined for each
trial. The same balance was used for all weighing.
(9) From plot of number of blows versus water content, the flow curve is obtained. Number
of blows corresponding to 25 blows is the liquid limit.
Plastic Limit:
(1) Empty moisture cans were weighed.
(2) The soil sample was taken and water was added until the soil is at a consistency where it
can be rolled into a thread without sticking to the hands.
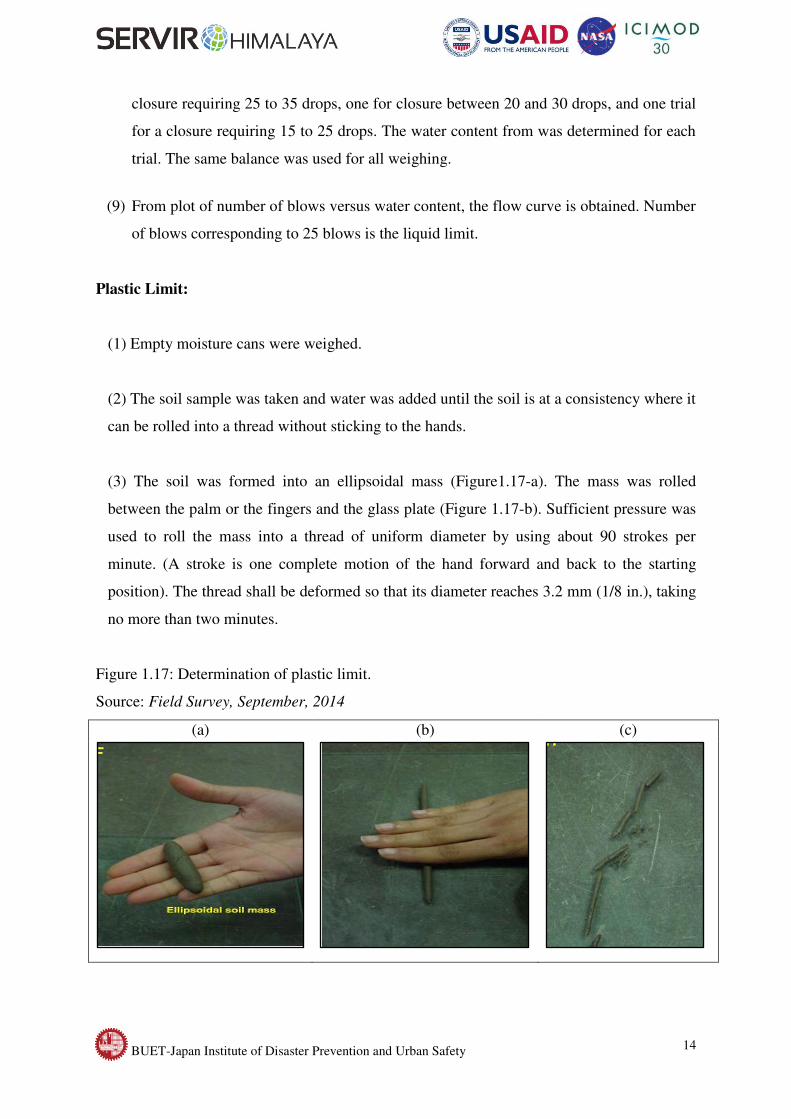
(3) The soil was formed into an ellipsoidal mass (Figure1.17-a). The mass was rolled
between the palm or the fingers and the glass plate (Figure 1.17-b). Sufficient pressure was
used to roll the mass into a thread of uniform diameter by using about 90 strokes per
minute. (A stroke is one complete motion of the hand forward and back to the starting
position). The thread shall be deformed so that its diameter reaches 3.2 mm (1/8 in.), taking
no more than two minutes.
Figure 1.17: Determination of plastic limit.
Source: Field Survey, September, 2014
(a) (b) (c)
Page 19
15
BUET-Japan Institute of Disaster Prevention and Urban Safety
(4) The pieces were kneaded and reformed into ellipsoidal masses and rolled and re-rolled
into threads. This alternate rolling, gathering together, kneading and re-rolling were
continued until the thread crumble just begins to reaching a 3.2 mm diameter size (Figure
1.17-c).
(5) The portions of the crumbled thread were gathered together and the soil were placed
into a moisture can, and then covered. If the can does not contain at least 6 grams of soil,
soil was added to the can from the next trial (Step 6). Finally, the moisture can was left in
the oven for 24 hours.
(6) Steps three, four, and five were repeated at least one more time.
Analysis:
Liquid Limit:
(1) The water content of each of the liquid limit moisture cans was calculated after they have
been in the oven for 24 hours.
(2) The number of drops, N, (on the log scale) versus the water content (w) was plotted. Draw
the best-fit straight line through the plotted points and the liquid limit (LL) as the water
content at 25 drops was determined.
Plastic Limit:
(1) The water content of each of the plastic limit moisture cans was calculated after they have
been in the oven for at 24 hours.
(2) The average of the water contents was calculated to determine the plastic
limit, PL. If the difference between the water contents is greater than the acceptable range of
two results (2.6 %) was checked.
(3) The plasticity index, PI=LL-PL was calculated. The liquid limit, plastic limit, and
plasticity index were calculated to the nearest whole number, omitting the percent
designation.
Page 20
16
BUET-Japan Institute of Disaster Prevention and Urban Safety
Table 1.1: Data of Lal Pahar (Akbar Shah Mazar Cluster)
Source: Field Survey, September, 2014
Result:
Liquid Limit: 42%
Plastic Limit: 23%
Plasticity Index: 42-23 = 19%
Figure 1.18: Flow curve- percentage of water content and number of blow Akbar Shah Mazar
Cluster).
Source: Field Survey, September, 2014
Liqiud Limit and Plastic Limit Determination
Liquid Limi Determination
blow number Can Number Can wt Can+wt soil Can+dry soil Water Dry soil w% Liquid Limit (graph)
10 809 6.4 16.5 13.1 3.4 6.7 50.75
25 2233 10.5 21.6 18.3 3.3 7.8 42.31 42.31
28 2007 10.4 18.9 16.3 2.6 5.9 44.07
32 2232 10.4 25.1 21 4.1 10.6 38.68
Plastic Limit Determnation
Can number Can weight Can+ wet soil Can+Dry soil Water Dry soil w% Plastic Limit
203 6.4 9.6 9 0.6 2.6 23.08 22.93
832 11.3 21 19.2 1.8 7.9 22.78
y = -0.500x + 55.83
0
10
20
30
40
50
60
1 10 100
Per
cen
tag
e o
f W
ate
r C
on
ten
t
Number of Blows
Flow curve
Flow
curve
Linear
(Flow
curve)
Page 21
17
BUET-Japan Institute of Disaster Prevention and Urban Safety
Table 1.2: Data for Tankir Pahar (Moti Jharna Cluster)
Source: Field Survey, September, 2014
Result:
Liquid Limit = 37%
Plastic Limit = 23%
Plasticity Index = 37-23 = 14%
Figure 1.19: Flow curve- percentage of water content and number of blow (Moti Jharna
Cluster).
Source: Field Survey, September, 2014
Liquid Limit and Plastic Limit Determination
(soil sample from Tankipahar)
Liquid Limit determination
No. of blow can number can wt can+ wet soil can+dry soil water dry soil moisture content w% Liquid Limit
17 2120 9.7 24.6 20 4.6 10.3 44.66
27 2047 9.1 23.9 20.3 3.6 11.2 32.14 36.57
31 2186 9.3 25.6 21.8 3.8 12.5 30.40
40 2199* 9 21.6 18.8 2.8 9.8 28.57
Plastic Limit Determination
Can number Can Wt. can+ wet soil can+ dry soil water dry soil moisture content w% plastic limit
2244 8.7 27.7 24.1 3.6 15.4 23.38 23.10
2080 10.8 22.1 20 2.1 9.2 22.83
y = -0.700x + 54.09
0
5
10
15
20
25
30
35
40
45
50
1 10 100
Per
cen
tag
e o
f W
ate
r C
on
ten
t
Number of Blows
Flow Curve
Flow Curve
flow curve
Page 22
18
BUET-Japan Institute of Disaster Prevention and Urban Safety
1.3.2 Determination of specific gravity
Purpose:
This laboratory test is performed to determine the specific gravity of soil by using a
pycnometer. Specific gravity is the ratio of the mass of unit volume of soil at a stated
temperature to the mass of the same volume of gas-free distilled water at a stated
temperature.
Standard Reference:
ASTM D 854-00 – Standard Test for Specific Gravity of Soil Solids by water Pycnometer.
Significance:
The specific gravity of a soil is used in the phase relationship of air, water, and solids in a
given volume of the soil.
Equipment:
Pycnometer, Balance, Vacuum pump, Funnel, Spoon.
Test Procedure:
(1) 50g of soil sample (passed through the sieve No. 10) was placed in the pycnometer.
Distilled water was added to fill about three-fourth of the pycnometer. The sample was
soaked for 10 minutes.
(2) A partial vacuum was applied to the contents for 10 minutes, to remove the entrapped air.
(3) The vacuum was stopped and the vacuum line was carefully removed from pycnometer.
(4) The pycnometer was filled with distilled (water to the mark), the exterior surface of the
pycnometer was cleaned with a clean, dry cloth. The weight of the pycnometer and
contents (W1) was determined.
(5) 4 separate bowls were cleaned and their weights were determined.
(6) The pycnometer was left like this for about 24 hours. Then it was emptied and cleaned.
Page 23
19
BUET-Japan Institute of Disaster Prevention and Urban Safety
The soaked soil was placed in bowls and then put into oven for 24 hours to be oven dried.
Then the pycnometer was filled with distilled water only (to the mark). The exterior
surface of the pycnometer was cleaned with a clean, dry cloth. The weight of the
pycnometer and distilled water (W2) was determined.
(7) The Oven dry sample was taken out after 24 hours and the weights was determined (Ws).
Data Analysis Procedure:
Specific gravity of the soil solids were calculated using the following formula:
Gs= GTWs / (Ws– W1 + W2)
Where,
W1 = Wt. of pycnometer + water + soil
W2 = Wt. of pycnometer + water
Ws = Wt. of soil
GT = Specific gravity of water at room temperature (ToC)
Table 1.3: Data for determining the specific gravity.
Source: Field Survey, September, 2014
The room temperature was 27oC and specific gravity of water at that temperature was 0.9965.
Result:
The specific gravities for the four hills are given below.
LalPahar: 2.69
GuachiBagan: 2.71
GolPahar: 2.62
Tankir Pahar: 2.71
Sample Name Bottle+water+soil (W1) Bottle+water (W2) wt. of dish Dish+dry soil Dry soil (Ws) Specific Gravity
Lalpahar 377.1 346.2 82.1 131.2 49.1 2.69
GuachiBagan 373.2 341.8 71 120.7 49.7 2.71
Golpahar 376.3 345.5 75.2 124.9 49.7 2.62
Tankiapahar 372.2 341.2 79.8 128.8 49 2.71
Page 24
20
BUET-Japan Institute of Disaster Prevention and Urban Safety
1.3.3 Sample calculation for grain size analysis
Selection of “Wash Sieve” over normal Sieve Analysis
Soil samples of four different hills (Lal Pahar, Golpahar, Tankir Pahar, Goachibagan) were
collected and tested for grain size analysis which will facilitate the classification of those
soils. From observation it was understood that two of the hills had predominantly sandy soil
(Golpahar, Goachibagan) whereas the rest of the two had a mixture of sand, silt and clayey
soil. Because of the presence of cohesive material “Wash Sieve” was performed.
Wash Sieve Procedure:
1) For each of the hills, 100g of soil sample was taken at first. All of them were crushed
and ground into very fine powder like substances. All the lumps were powdered too.
2) Then it was sieved only with #200 sieve (opening 0.075mm). Then the sieve was
shaken manually with hands and the soil that passed the #200 sieve and retained on
the pan was weighed.
3) The sample that was retained over the #200 sieve was subjected to “Wash Sieving”,
whereby clay lumps can be broken.
The grain size from field survey is given in table 1.3
Table 1.4: Data for determining the grain size.
Source: Field Survey, September, 2014
Site Sand (%) Silt &
clay (%)
Lalpahar 34.1 65.9
Tankir Pahar 18.2 81.8
Golpahar 58.4 41.6
Goachibagan 64.5 35.5
Page 25
21
BUET-Japan Institute of Disaster Prevention and Urban Safety
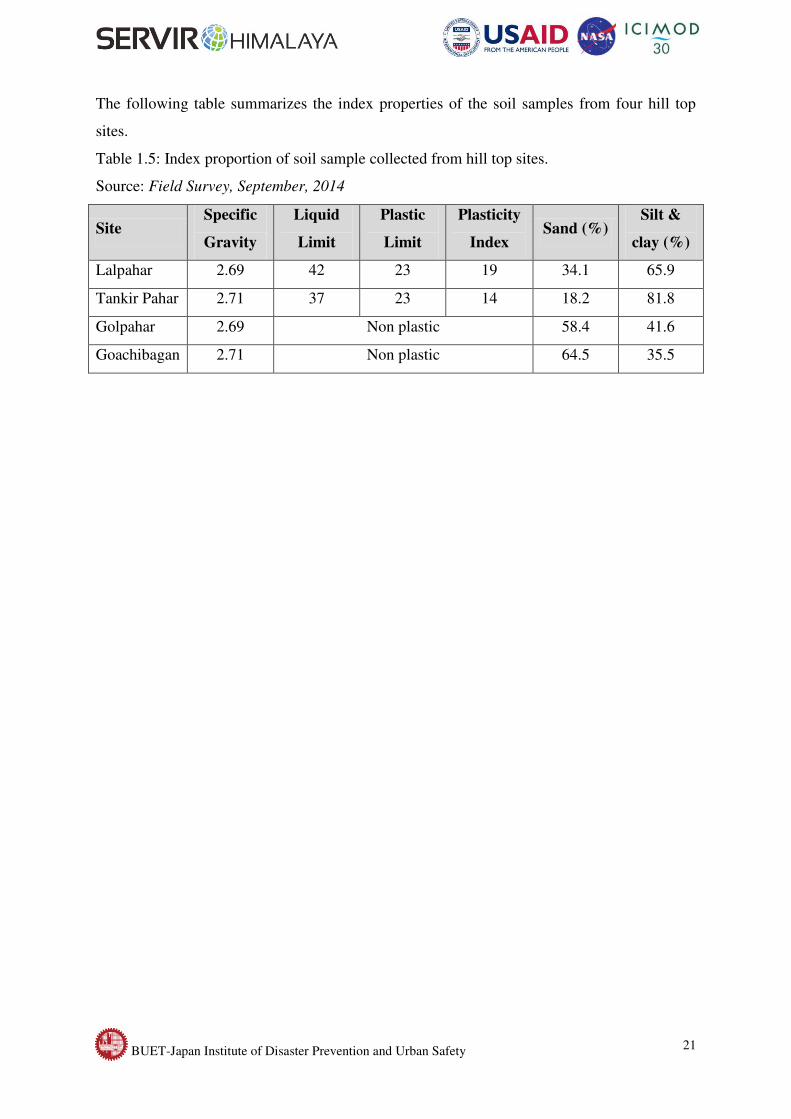
The following table summarizes the index properties of the soil samples from four hill top
sites.
Table 1.5: Index proportion of soil sample collected from hill top sites.
Source: Field Survey, September, 2014
Site Specific
Gravity
Liquid
Limit
Plastic
Limit
Plasticity
Index Sand (%)
Silt &
clay (%)
Lalpahar 2.69 42 23 19 34.1 65.9
Tankir Pahar 2.71 37 23 14 18.2 81.8
Golpahar 2.69 Non plastic 58.4 41.6
Goachibagan 2.71 Non plastic 64.5 35.5