Agronomy 541 : Lesson 13a Soil Moisture and Crop Yield Introduction Developed by E. Taylor and D. Todey It is suggested that you watch Video 13A and complete the exercise in the video before continuing with the lesson. Podcast Version Full Podcast List In this lesson, the student will: 1. Review a crop yield/water stress model (Shaw's Model). 2. Use an "Expert System/Knowledge-based" model to determine risk of reduced yield for years when initial soil moisture is at low, moderate, and high levels. 3. Estimate "pan evaporation" from temperature data to evaluate potential evaporation.
Transcript
Agronomy 541 : Lesson 13a
Soil Moisture and Crop Yield
Introduction
Developed by E. Taylor and D. Todey
It is suggested that you watch Video 13A and complete the exercise in the video before continuing with thelesson.
Podcast Version Full Podcast List
In this lesson, the student will:
1. Review a crop yield/water stress model (Shaw's Model).2. Use an "Expert System/Knowledge-based" model to determine risk of reduced yield for years when initial
soil moisture is at low, moderate, and high levels.3. Estimate "pan evaporation" from temperature data to evaluate potential evaporation.
Agronomy 541 : Lesson 13a
Soil Moisture and Crop Yield
Limiting Resource
The concept of a limiting factor in ecology or chemical reactions is useful if not universally applicable. Cropgrowth may be limited by temperature, light, carbon dioxide, nutrients, water, and numerous other resources. Inthe central U.S., water is the predominantly limiting resource. Crop yields have improved with modern geneticsand management techniques. Functionally, it may be assumed that the upper limit of yield, or the potential, isdetermined by genetics and management. The realized yield is something less than the potential, dependingupon weather conditions.
The premise that, if a crop consumes all the water that can be consumed, water will not be the limiting factor togrowth, is the basis of water resource capture yield modeling. The basic assumption of a water resourcecapture analysis is that water use, less than the potential, is indicative of strain that will reduce crop yields(Figure 13.1).
Fig. 13.1 Factors involved in resource capture.
Agronomy 541 : Lesson 13a
Soil Moisture and Crop Yield
Potential Water Use (Potential Evapotranspiration)
The heart of all water resource capture crop models is the determination of "Potential Evapotranspiration."There are numerous methods for estimating the potential. The details of such methods are treated in afundamental agricultural, rather than in an applied agricultural meteorology, course. One method that hasproved effective and simple to apply involves relating the use of water by a crop to evaporation from a pan ofwater (Figure 13.2).
Fig. 13.2 Evaporation pan for estimating water use.
Water use is not directly connected to plant growth and development. Clearly water is essential to the life of theplant, but the great bulk of water "consumed" in crop production does not directly contribute to plant growth.Although it may require one million gallons of water per acre to produce a "full" crop in one locality (such asIdaho), in another location (Iowa), the identical yield may be obtained from an identical variety for one-half thewater used in the growing cycle. If the crop has sufficient available water to meet the demand (or potentialwater consumption) in the locality, it may be expected to yield well if other factors (including fertilizer, light, etc.)are not limiting.
The resource associated with the greatest year-to-year variation of yield in the midwestern United States iswater. In some locations light may be the limiting resource; in others the availability of nitrogen may limit growth.In this lesson the contribution of water stress in reducing crop yield is evaluated. The fundamental premise is: Ifcrop water use is less than potential water use, the crop is experiencing yield reducing strain.
Agronomy 541 : Lesson 13a
Soil Moisture and Crop Yield
Heat Stress Misnomer
Crops do not normally experience temperature "stress" at any temperature below 35°C (95°F). However, waterstress is often associated with temperatures of only 30°C (86°F). Water stress is often coincident withincreasing temperatures because other factors such as relative humidity, dew point, wind and solar radiationshare some direct or indirect linkage to temperature. Increasing temperature by 4 - 5°C (10°F) will often beaccompanied by a 25 to 50% reduction in relative humidity. This factor alone may result in a three-fold increasein water use under some circumstances. High demand for water rather than high temperature results in cropstrain response.
Daily pan evaporation in Iowa may be approximated from observed daily temperature using the ANTALrelationship (Basnyat, 1987).
Close Window
IN DETAIL : ANTAL Equation
The ANTAL equation:
Example: for T = 10°C, es = 12.272 mb
for T = 20°C, es = 23.380 mb
E is estimated pan evaporation (mm/day), es is saturated vapor pressure (mbar), e is the actual atmospheric vapor
pressure (mbar), T is 24 hr average temperature (°C), Tmin is the daily minimum temperature (°C). Use this to
estimate evaporation unless you have dew point.
Agronomy 541 : Lesson 13a
Soil Moisture and Crop Yield
Subsoil Moisture
Crop yield as influenced by the weather is in large measure a function of the strain response of a crop to thestress of differential water availability and atmospheric evaporation demand. Evaluation begins with the subsoilmoisture. The relationship of crop yield to soil water was introduced in Lesson 2a. We make maps of the PlantAvailable Soil Moisture (Figure 13.9).
Fig 13.9 April plant-available soil moisture.
Subsoil moisture usually increases through June (the wettest month in Iowa), then decreases throughSeptember. Normally by October 1 or November 1, there is more moisture than on September 1 as rains beginto recharge the soil and evaporative demand decreases. September soil conditions are usually about as dry assoil gets during the season.
The long-term average amount of moisture in Iowa on September 1 is shown in Figure 13.10. Usually in thecenter of Iowa there is approximately 4 in. (102 mm) of plant-available water in the top 5 ft. (1.52 m) of soil. Weconsider that both corn and soybeans root to the 5 ft. depth. Therefore, we evaluate subsoil moisture in the top5 ft.
Fig. 13.10 Average plant available soil moisture on September 1
The moisture-holding capacity of our soils is around 10-12 in. (250-305 mm). On September 1 in the center ofthe state there will typically be 4-5 in. of subsoil moisture available to the crop. This is typical of much of thestate, except in the northwest where the amount will usually be closer to 3 in. (76 mm).
By the end of the growing season, subsoil moisture is often essentially expended in the northwest portion of thestate.
A serious drought developed in most of the U.S. Corn Belt in 1988. The subsoil reservoir of water has asignificant influence on the severity of drought. As we went into the winter of 1987, we had about 7 in. (178 mm)of subsoil moisture over much of Iowa (Figure 13.11). Part of the state had as little as 5 in. (127 mm). ThePocahontas area, Webster County, and the southeastern portion of the state were dry, with Lee County havingonly 3 1/3 in. (85 mm) of soil moisture. The rest of the state had 6-7 in. (152-178 mm) of moisture, and 10 in.(254 mm) of moisture in Audubon, Cass, and east Pottawattamie. With this amount of moisture in the state, agood crop year was anticipated in 1988, because subsoil moisture was good to start with.
Fig. 13.11 Measurements were made during the last two weeks of
October and were adjusted with rainfall to Nov. 1st. All values are
from fields under corn and soybeans unless values with *, which
are values under alfalfa.
We can make some estimate of what the crop for the coming year will be according to the subsoil moisture inNovember. There is seldom a significant change in soil moisture between the time the soil freezes and the timethat it thaws in the spring because water cannot infiltrate frozen soil. As soon as it hits the freezing point, waterfreezes near the surface ending infiltration.
What difference does it make if we get a lot of snow or a little bit of snow? The difference it makes is to the topinch or two of soil. After we get down into the soil five inches or so, the amount of snow doesn't really makemuch difference unless the snow happens to fall on unfrozen soil or soil that is barely frozen. Occasionally, thetop inch or two of the soil will be frozen with 55°F (13°C) temperatures deeper in the soil under a blanket ofinsulating snow. Heat will transfer upward causing the soil to thaw and begin melting the snow from the bottom,taking up the water. For the most part, assume that snow doesn't make any difference after the first inch or twoof soil. In the spring when the snow melts, the water from the snow melt runs off the frozen subsoil, leaving thesoil in the spring with the same amount of water as on November 1. A second point is the relatively low watercontent of snow. A 12-inch (305 mm) layer of snow often has a water content near 1 in. (25 mm).
Spring rain may increase soil moisture. Iowa averages about an inch of precipitation in December, January andin February. If that precipitation happens to fall as snow, it might be a foot of snow each time. An inch ofprecipitation may show up as snow a foot deep. Precipitation in March is 2 in., in April 3 in., in May 4 in., and inJune 5 in. June is normally the wettest month in Iowa.
Spring rains when soils have been dry in the fall, might raise the subsoil moisture up to normal levels or abovenormal. Historically, Iowa springs are not considered wet; however a number of years in the 1990's have beenabnormally wet and interfered somewhat with planting.
Over the long run, we can begin to make an estimate of what the yield next year may be from the amount ofmoisture in the fall at the 5 ft. profile. Consider the extreme northwest portion of Iowa, and start off with a "wetcase." A wet case is defined as 8-10 in. (203-254 mm) of water in the soil. A soil essentially filled with water,produces good chances that we will have high yield (Figure 13.12a).
Fig. 13.12a Yields in northwest Iowa when spring soils
contained 8-10 inches of water.
However, if we begin the growing season with 5-7 inches (127-128 mm) of moisture in the soil, it is almost rareto have a full yield. We expect yield to drop off by 30 percent on the average year starting off with half of aprofile of moisture. Some years we might do quite poorly. Most years we would have a significant reduction(Figure 13.12b).
Fig. 13.12b Yield with the soil profile 1/2 full starting the
season.
If we begin with only 3 in. of water in the soil at planting time, the expected yield is 1/10 to 1/2 of a full crop.Chance of a full crop is very slim (Figure 13.12c). The yield relationship to initial soil water is given by Shaw(1983). With low soil moisture in west Iowa, fields would only rarely yield their potential, and occasionally therewould be crop failure. Most often, substantial reduction in crop yield would result.
Fig. 13.12c Yield with 3 inches in profile.
Study Question 13.1
Starting the year dry, what percentage of the time would you expect western Iowa to yield less than 3700kg/ha?
% Check Answer
In the east part of Iowa, the probabilities are different. If we start off with the wet case, we will usually get thepotential yield for the field at Cedar Rapids (Figure 13.13a).
Fig. 13.13a Eastern Iowa yield with full moisture profile.
Try This! Selling Your CropYou are growing corn in Cedar Rapids, Iowa. You have just planted and the soil moisture is at field capacity.Quaker Oats offers you a price near at current Chicago price for your grain to be delivered at harvest. Shouldyou:
A: Take the offerB: Tell them to wait 45 days and ask again.C: Tell them to wait 90 days and ask again.D: Tell them they can buy your grain at harvest and pay the going price then.
Check Answer
Few people sell the entire crop in one deal. Suppose you sell 1/3 of your normal yield at a time. On a “great”year you may have a 4th lot of crop to sell at the very end. What offer do you need to sell some or your entirecrop? See how you would do on a deer hunt where you may shoot 3 deer and have 3 bullets, on this hunt youwill have 6 chances to “pull the trigger” on a deer… how will you score on your opportunities on the hunt and inthe markets?
-CLICK HERE for the DEER HUNT-:
If we start off with a moderate amount of soil moisture, slightly dry, we will still usually get a full yield, sometimesreduced, and rarely significantly reduced (Figure 13.13b).
Fig. 13.13b Yield with a slightly dry soil profile.
If we start out essentially under drought conditions, we still would likely do fairly well in east Iowa. They wouldhave had a failure if we would have included 1988 in this early prediction analysis.
Fig. 13.13c Yield with a dry profile
Having taken an assessment of the subsoil moisture initially available to the plant, the next concern is howmuch moisture the plant needs and when it needs it. The stage of the crop and the evaporative demand of theatmosphere determine the time and amount of crop water need. Both factors were discussed in lesson 1. Theatmospheric demand may be derived from pan evaporation (Figure 13.2). The average monthly panevaporation for each month was depicted earlier.
The total evaporation out of a pan totals 47 in. in the southwest and central portions of the state for thegrowing season. It is 43 in. in the northern portion of the state.
Pan evaporation tells us something about potential water loss and water use for a crop. It does not tell us theactual water use of the crop, just the potential. Who says that a crop should use water the same as a pond? Orthe same as an evaporation pan? Suppose a crop has perfectly good subsoil moisture, right up there at 10 in.of plant-available water in the top 5 ft. of soil. Will the plant be able to use the water as if it were a pond ofwater? Of course not.
When the crop is first planted, it draws little water from the soil. There is a little sprig of green when it firstemerges. That little sprig of green with a little root system that extends an inch or two is not drawing asignificant amount of water out of the large bulk land in the field. There is limited evaporation from the soilsurface. The total evapotranspiration is likely to be only a fraction of the pan evaporation.
When the crop is more than 6 ft. tall and has its maximum leaf area, it uses a great deal more water than it didbefore. A chart (Figure 13.14) gives an estimate of the amount of moisture used by the corn throughout theseason, as introduced in lesson 2 (Figure 2.3). According to Table 13.1, beginning at a planting date in earlyMay until June 5, most of the potential water use is evaporation from the soil.
Fig. 13.14 Ratio of corn use of water to open pan
evaporation through the growing season.
Table 13.1 Crop stage and relative water use (portion ofpan evaporation)
Crop Factor Date/Stage
Corn 0.3 emergence
0.6 July 1
0.75 July 15 to silk
0.83 after pollination
Soybean 0.6 40 days after planting
0.9 60 days after planting (when canopy closes)
1.1 70 days through leaf turning
The small plants transpire a limited amount. We assume that evapotranspiration is something less than .4 ofthe amount that is evaporating from the pan. If you know the evaporation from the pan, the amount of waterevaporated from the land in May is less than .4 of the amount that evaporates from the pan. On a day when thesoil surface is wet, the amount is greater and, when very dry, it is less.
Once the crop area begins to become substantial (approaching the end of June or early July), it uses half asmuch water as would be used by the pan. On August 1, corn reaches its maximum use, about 0.82. If a panused 0.33 in. of water during a hot August day, which is not uncommon, the crop would use something on theorder of 0.25 inch of water.
As the crop begins to senesce, the water use drops back to under 0.4 again. The only water used aftermaturity is evaporating from the soil itself with none being lost by the crop.
Soybeans produce a similar picture. Ten days after planting soybeans, total water use is mostly evaporationfrom the soil (around 0.3 of the pan evaporation). This increases linearly up until 60 or 65 days after plantingwhen it peaks at about 105 percent of pan evaporation. Soybeans use more water than corn at the peak of the
year If you take a circular plot of soybeans that's 6 ft across it will use more water than a pan of water 6 ft
year. If you take a circular plot of soybeans that's 6 ft. across, it will use more water than a pan of water 6 ft.across. In other words, it will use about 5 percent more water from about day 65 through about day 95. Then,as the leaves begin to turn, soybean water use drops off substantially. By comparison, corn can use 82 percentof the water that is evaporating from a pan. Soybeans can use 105 percent of the amount of water evaporatingfrom a pan.
I've been consistently saying "can" use. They will only use that amount of water if that amount of water isavailable to them. If the water is not available, they can't use it. Actual use will vary somewhere between 0 and82 percent of the pan's evaporation for corn. The charts that we've been looking at give what is known as thepotential evapotranspiration. This is expressed often if you see it written in the literature, as just PET, potentialevapotranspiration. The ideal total (life cycle) water use for corn and soybean is almost identical, but the timeof use differs (lesson 2, and the crop calendar introduced in lessons 1 and 2 provides confirming data).
The potential evapotranspiration must be evaluated if environmental stress and resulting strain on theproductive system is to be anticipated. The PET in relation to realized or actual evapotranspiration (AET or justET) is a well-known measure of strain in the production system.
If you know both PET and AET, theoretically you know the crop production. This theory is based on the conceptthat if the plant is evaporating water at the rate of the actual evapotranspiration ratio to the potentialevapotranspiration equals 1 (AET/PET = 1), there is no stress. If the actual and the potential are the same, thecrop will grow at its optimum rate, assuming that you have good soil, fertilized properly, and good pest control.Growth is not being reduced from the potential by what we would call water-stress induced yield loss. But theactual evapotranspiration, as you remember from our very first discussion, is seldom equal to the potential. TheIowa crop calendar charts PET and AET in the various districts in Iowa (Shaw and Benson, 1987).
When a yield estimate is made, based on the water stress method, it is by taking this ratio of actualevapotranspiration to potential evapotranspiration. Why would actual be less than potential? If there is no soilwater there, the actual is 0, whereas the potential is still based on what would evaporate out of a pan of water.The amount of moisture in the soil has some control over the AET.
When subsoil moisture becomes limiting, and the potential to use water is fairly high, the plant that would beusing one-quarter to one-third of an inch of water on a stressful day, does not have that much water availableto it. So it can't use it. If that water is not available, what is going to happen to the plant? The atmosphere isdemanding one-quarter inch of water. The roots cannot supply that to the plant. What happens to the plant? Itwilts. Or the plant has some adaptation to overcome the wilting.
The soybean plant is well adapted to water stress. When the soil cannot provide the water at the rate theatmosphere is demanding it from the leaves, the leaflets will often fold together. Sometimes all three leafletsfold together so it almost looks as if there is only one. They are vertical rather than horizontally displayed. Sothere is a change of display of the leaf. Also, if the leaflets are tightly put together, we have the effect of areduction of leaf area. Instead of having three leaflets, we have the equivalent of one or two.
Corn does a similar thing with its individual leaves. If the leaf is not supplied with the water equal to the demandof the atmosphere, the wilting on the leaf does not cause the entire leaf to wilt initially, but just a few cells knownas buloform cells. As these cells wilt along straight lines going the length of the leaf, the leaf begins to curl intoa cylinder. Some say it looks like a pineapple field when corn leaves all over the field have entered incipientwilting. In this case the buloform cells have wilted to the point the leaves are rolling.
That is one of the functions that we have with the crop adjusting so that the actual transpiration is less than thepotential. If it cannot meet it, rather than just wilt, dry up and die, the leaves may change their exposure to thesun and the leaf area may change by rolling and moving together.
The bluegrass in lawns typically folds in half with just one set of buloform cells. Rather than roll up into acylinder as a corn leaf does, they fold in half displaying in the gray outsides rather than the green inside.
Corn does somewhat has this same thing. Many times you'll say, "Oh, the field is looking gray and it's gettinggrayer." Then you know you're close to having leaves at the firing point if you haven't already reached it. Thatis, that they're not going to recover from that day's wilting episode.
(1) Leaf Area and Exposure. That's mechanism number one, if we want to look at it that way. When the actualevapotranspiration is not going to meet the potential, the leaf area and/or exposure may adjust in some way.
(2) Stomata. Number two is the apertures in the leaf; that is, the holes that let the moisture out. They are calledstomata and were described in lessons 7 and 9 and in Agronomy 501.
In every leaf surface there are a certain number of pores in that leaf that can only be seen with highmagnification. In most plants, stomata influence water loss. Very little water escapes from the waxy leaf surface.Most of the water lost by a leaf diffuses as a vapor through these pores (stomates).
Stomates on most plants exhibit an evaporation control mechanism. They are an anatomical device on a plantthat can open and close. The stomate aperture can change. On more than half of the plants in nature, if theroots cannot provide the water at the rate that the atmosphere is demanding it, the stomates begin to close.The aperture in them begins to constrict to become very narrow. With closed stomates, water loss may be lessthan if the stomates are open. The stomates can be open, or they can close. For the most part, this appears tobe a turgor response. That is, as the leaf begins to wilt, one of the first responses is that stomatal aperturebegins to restrict water loss.
The restriction of water loss from the stomate is called resistance and will often be indicated by an "r",sometimes an rs, meaning the resistance to water loss by the stomates.
More than half of the plants in nature have stomates that seem to restrict as water becomes limiting. In the Iowawoods on a hot spring day, there are many little plants which at midday will often wilt. Although there is amplemoisture at their roots, they're not used to as much sun as gets through the canopy before the leaves arethere. They don't have stomata control, so the plants wilt. That changes the leaf angle from horizontal display.Quite often they'll lose leaves during the day because they are not provided with the amount of water that theyneed. They don't have a well-developed stomate control mechanism to control water loss from the plant.
Most agricultural plants, including alfalfa, corn and soybeans, have effective stomate control of resistance towater loss. The two mechanisms are in place, the changing of the leaf area and display in some way, and thecontrol of water loss by the stomates.
If the stomates become restricted and resist water vapor loss, then the plant may not wilt as readily and maysurvive through stressful times of day when the potential for water loss is high. The stomatal resistance is notalways the factor most limiting to water loss and thus may not always influence water loss.
IN DETAIL : Maps of The Plant Available Soil Moisture
Fig. 13.3
Fig. 13.4
Fig. 13.5
Fig. 13.6
Fig. 13.7
Close Window
Fig. 13.8
Agronomy 541 : Lesson 13a
Soil Moisture and Crop Yield
Water Loss and Yield
So far we are talking about the water loss from the plant. It should be obvious that the water loss from the plantshould have something to do with the yield of the plant. Let's look at it a little bit.
Figure 13.15 represents a cut on the edge of the leaf. A little hole in the bottom of the leaf represents astomate, maybe a hole in the top also. At the stomate water vapor comes out of the leaf.
Fig. 13.15 Stomatal adjustment to restrict
water loss when the plant is under stress.
Inside the leaf are cells, not necessarily organized as in the figure. At the top of the leaf they are organizedmore as a palisade layer. Near the bottom of the leaf a spongy configuration might be typical leaves. The cellsare inside of the leaves. We assume that the cell surfaces are wet, or essentially wet, and evaporating freely.As the water evaporates from the surface of the cell, it can escape through the stomate and out into theatmosphere. Second, it is assumed that the relative humidity within the leaf is 100%. Neither assumption isstrictly correct.
When a plant is growing (adding dry weight), it is taking carbon dioxide from the atmosphere, which enters theplant through these same stomates. The carbon dioxide finds its way to the edge of a cell that has chloroplastsin the cell. The carbon dioxide is absorbed and converted into sugars and eventually starches, proteins, and allof the things that are important to plant growth.
Much of the path of the carbon dioxide coming into the plant is identical to the path of water getting out. In theair spaces inside this thin leaf, the water and the carbon dioxide are moving in opposite directions through thestomates. Carbon dioxide from the atmosphere gets inside the leaf and finally into the cells. Water from thesurface of the cell ultimately gets out of the plant.
In the past, physiologists actually said that water loss is "just a necessary evil", that the water loss doesn't reallydo any good for the plant. That is not strictly true. But there is still some measure of accuracy to this. All thiswater loss by the plant doesn't have much direct effect on the plant under most cases. It's just that water isgoing to get out if we're going to let carbon dioxide in. I guess physiologists were justified in saying that it is justan unfortunate circumstance that to get carbon dioxide in, you have to let water out.
Not all plants do this, of course. Plants adapt. Some plants do not open their stomates in the daytime. Theykeep them closed so that the water can't get out. Then they open the stomates at night and let in the carbon
dioxide. Of course, that doesn't do much good because photosynthesis can only occur when there is light.These plants take in some carbon dioxide at night and store it away in some manner. Then the next morningthey close the stomates as the sun comes up. That first little bit of light lets photochemistry occur and use thecarbon dioxide that the plant brought in during the night, and the plant grows a little.
Plants that have adapted to not lose water by closing their stomates during the day and instead let the carbondioxide in at night usually grow quite slowly. Of course the plant that would be familiar as a general group wouldbe cacti. Many cacti do this. Crasula is another group of plants, as could be told from the name, that does thesame thing. These are usually succulent plants with thick leaves, maybe with photosynthetic thick stems. The"hen-n-chicks" plant common to flower gardens is an example of this group of plants (Figure 13.16).
Fig. 13.16 Hen-n-chick plants.
Agricultural crops don't do this. A plant that "just survives" is not useful in agriculture; a highly productive one isneeded. Plant stomates need to be open in the daytime when the light is available to grow rapidly. Hence,these plants use a great deal of water.
The amount of water that the plant uses depends on the demand of the atmosphere. The demand of theatmosphere is indicated by the amount of water evaporating from a pan. That's an indirect measure, but agood one.
A more theoretical measurement is to say that when the relative humidity of the atmosphere is low, theatmospheric demand will be high. If the atmosphere was full of water, there would be a water moleculeoccasionally headed into the leaf. If the plant was full of water, there would be a water molecule occasionallyheaded out. These would balance. That's what's happening with those plants that open stomates at night whenthe humidity is high. But when the humidity is low, very rarely would there be a molecule of water from theatmosphere headed into the plant. Relative humidity inside of the leaf is assumed 100 percent. While the actualmight be 99.6 percent, the assumption is saturation.
In some plants, such as salt desert plants that grow in the deserts of Nevada, Idaho, China and Russia, therelative humidity inside the plant may be 85 percent. These are extraordinary plants that can grow in the desertwith their stomates open in the daytime and still not lose much water. Halogeton, introduced to the U.S. fromRussia, is such a plant.
If the humidity is 100 percent inside and the humidity is 50 percent on the outside of the leaf, which is typical formid-day in Iowa, moisture flows rapidly from the humid area inside to the dry outside. It is not just the differencein this humidity that drives the water. In fact, humidity is not a good measurement for understanding thisprocess because relative humidity is temperature dependent. The leaf and the air are seldom at the sametemperature. It is a rare thing for a leaf temperature and air temperature to be the same. In the sun, the leafmay be warmer than the air, particularly if its stomates are closed or partially closed. In the sun the leaf mightheat up several degrees (5°-10° C) warmer than the air.
If the leaf is a lot hotter than the air, this will drive the water off more effectively just as if you were boiling wateron the stove. The difference in temperature between the leaf and the air is of importance. An equation for theamount of water lost from a plant would consider the density of the water inside of the leaf (L), minus the
density of the water in the air (a). The air temperature and humidity determine the density of water vapor in
the air and the density of water vapor in the leaf. If the air is cold and the humidity is low, then a would be a
small number. If the leaf is hot, and we assume the humidity inside the leaf is 100 percent, L would be a large
number. At high leaf temperature, moisture loss will depend on the square root of the wind, which we will call V.The more wind there is, the less external resistance to water loss. The larger the leaf, the greater the externalresistance. This factor varies with the square root of the dimension of the leaf (D).
Leaf dimension was discussed in lesson 12. Corn leaves, soybean leaves, and alfalfa leaves are of differingshapes, not only different in size. If we calculate the leaf dimension, and put the dimension in the water lossequation for each crop, the equation is functional.
According to the leaf evaporation equation [Equation 13.1, same as Equation 12.4], larger leaves reduce themagnitude of the computed amount of evaporation.
and Equation 13.1
The larger the leaf is, the lower its evaporation per unit area, not the lower its total evaporation. If a leaf has anarea of 10 square centimeters, and using 10 grams of water, while another leaf is much larger, 100 squarecentimeters of leaf area, may only use 0.6 of the water. If the area is 100 times bigger, the leaf will use 60 timesthe water, not 100 times the water. The effect of dimension may be as biologically important as leaf area.
A large leaf "can be" more efficient on water use. Being a large leaf, it also heats up more in the sun becausethe larger the dimension. We have conflicting adaptations on the leaf, and mentioned in Lesson 12a. A leafexperiences different demands depending on the difference in temperature between the air and the leafaccording to the dimension, the wind speed, and the evaporation from the leaf. Under some conditions, thesmall leaf may have the greater efficiency of water use because of the leaf temperature functions.
That also explains the great argument that we had on the campus between Dr. Curtiss and Dr. Clumb. Onethought that wind made soybeans use more water. The other thought that wind made soybeans use less water.They were both correct because it was a function of the dimension and wind and the resistance of the leaf andall of these things happening at the same time.
If the plant is freely losing water, it is freely taking up carbon dioxide. The typical model that is used forestimating yield states, "When the stomates close so that the plant is not using water, it is also not gaining dryweight because it is not taking up CO2." The estimate is that the yield is approximately equal to (it would be
more mathematically correct to say "a function of") the actual evapotranspiration divided by the potentialevapotranspiration. This would be strictly true if the only thing affecting the actual was the stomate aperture. Tothe extent that the leaf angle and the rolling of the leaves influences this, it messes up the relationship.Nevertheless, this is the basic equation used in most yield estimates called physically based estimates of yield.
The actual evapotranspiration ratio to the potential determines what the yield will be. This value can beestimated very well.
The strain on the mature plant when it cannot meet its transpiration demand does not have any effect on yield.If the crop cannot meet the potential for evapotranspiration in the first few weeks of its life, it will have somedeleterious effect on the plant. But there is a long time for the plant to recover and compensate for the effectsof the early stress. Amount of stress produces several times the yield-reducing strain at pollination time asoccurs early or late in the crop cycle (Figure 13.17).
Fig. 13.17 Percent yield reduction for stress over the season for a corn
crop.
Stress level is computed for Figure 13.17 from atmospheric water demand and plant-available soil water. Thereis yield decrease for each day that the plant is under stress. Stress can be estimated from observed strain ofthe crop. The strain is observed as rolled up corn leaves or the folded leaflets of soybean. A stressful day fiftydays after planting (the corn is rolled up) will perhaps reduce the yield of the crop up to 3 percent. Stress mustoccur the entire daylight time. If the strain is evident for only 6 hours, one-half day of response would beassumed.
At silking, 7 percent or 8.5 percent of your corn yield can be lost per day that the leaves stay rolled.
You say, "Oh, yes. I can lose a lot more than that if the thing is wilted and rolled up right at the day that it'ssupposed to be pollinating. I might lose everything." That is true for a field; the stress response is the averagefor the county. If it's at silking time for the county...some fields aren't silking the same day as others, and someparts of your field aren't silking at the same time as others. We're not talking right now about the individualplant. We're talking about a large field or a county, township or something for the yield over a moderately largearea, or what a farmer would call a ridiculously large area.
The average response is shown by the center line of Figure 13.18.
Fig. 13.18 Iowa actual and trend corn yields.
The lowest loss is the lower line (Figure 13.18). The highest the loss could be is the upper line, at least that wehave observed. Of course, as the crop approaches maturity, this chart says it's 135 days after planting, or aftersilking we're some 50 or 60 days later, strain doesn't impact yield. At maturity, it doesn't make any difference ifwater is limited to the plant. It drops off to 0 yield reduction there.
Reduction in yield based on the stress can be quantified by the time that the stress occurs. Figure 13.19 is anaverage stress map between 1961 and 1980 (Shaw and Felch, 1972).
Fig. 13.19 Average soil moisture stress.
The 1954-1970 average was 22 units of stress in Lyon County, 9 in Lee County, and 6.7 or so in CedarCounty. By 1980 the averages were 20 in Lyon, 6.5 in Lee, and 3.5 in Cedar. The latter decade reduced stressbecause of increased precipitation.
The stress difference alone can account for the long-term yield differences between Cedar and O'BrienC t S il b d i O'B i d Cl C t B t th l th i ld hi t i ll ill b l
County. Soils can be good in O'Brien and Clay County. But over the long run, the yields historically will be lessbecause of these stress units that are accumulated in western Iowa as opposed to the stress units that areaccumulated in east-central Iowa.
A rule of thumb is, 50 accumulated stress units reduces your crop by 50%. One example might be to look atwhat some people in central Iowa will remember as a traumatic year --1977. Sixty-five stress units accumulatedin Greene County and slightly less in Boone, Story and Carroll. It was stressful in much of the state, butextremely stressful--crop failure stressful--in Greene and Boone County.
A few places didn't have stress. In Cedar County accumulated stress was 1, causing a near-record yield in1977. In fact, some fields had all-time record yields while other fields farther west experienced total crop failure.This was all nicely accounted for by the stress evaluation. It was accounted for by the ratio of the actualevapotranspiration to the potential evapotranspiration, adjusted by the time that it occurred. This value is calledthe weighted stress index. It is weighted by the time or date that it occurs. The amount of stress each daymultiplied by that number that would produce the cumulative stress value.
This method provides a pretty good model of what will happen to crop yield if the limiting factors aretemperature and water only. The effect of sunshine is not included in this evaluation. Crops need sun to grow,live, and do well.
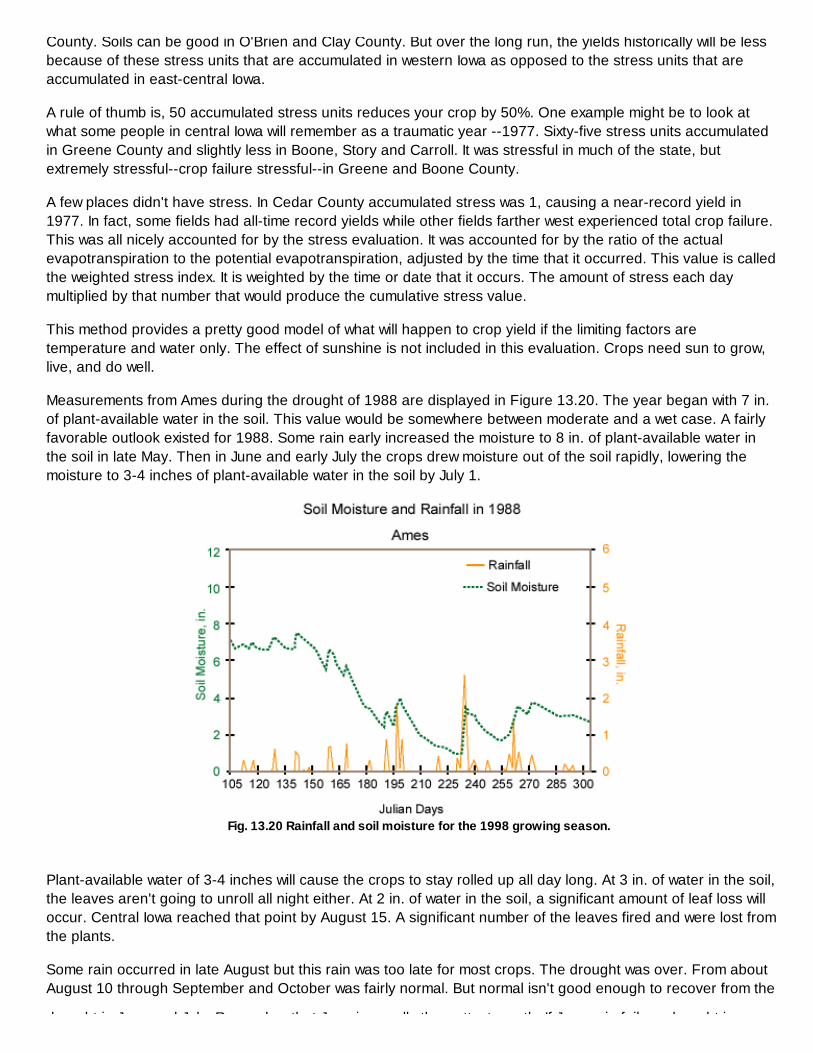
Measurements from Ames during the drought of 1988 are displayed in Figure 13.20. The year began with 7 in.of plant-available water in the soil. This value would be somewhere between moderate and a wet case. A fairlyfavorable outlook existed for 1988. Some rain early increased the moisture to 8 in. of plant-available water inthe soil in late May. Then in June and early July the crops drew moisture out of the soil rapidly, lowering themoisture to 3-4 inches of plant-available water in the soil by July 1.
Fig. 13.20 Rainfall and soil moisture for the 1998 growing season.
Plant-available water of 3-4 inches will cause the crops to stay rolled up all day long. At 3 in. of water in the soil,the leaves aren't going to unroll all night either. At 2 in. of water in the soil, a significant amount of leaf loss willoccur. Central Iowa reached that point by August 15. A significant number of the leaves fired and were lost fromthe plants.
Some rain occurred in late August but this rain was too late for most crops. The drought was over. From aboutAugust 10 through September and October was fairly normal. But normal isn't good enough to recover from the
d ht i J d J l R b th t J i ll th tt t th If J i f il d ht i
drought in June and July. Remember that June is usually the wettest month. If June rain fails, a drought isalmost inevitable.
In 1988 an El Niño had just ended (the 1987 El Niño). There was a post-El Niño drought condition. It was earlyin the spring. It was harsh. It removed subsoil moisture quite rapidly. A Corn Belt-wide drought disasterdeveloped.
In some of the places in Iowa, it wasn't a disaster. At a few locations in west Iowa, particularly in northwest Iowa,individual farmers reported the highest yields they'd ever had. There was an interesting weather pattern thatyear. What moisture was received in May and June came from the west. The western portion of Iowa had thefirst shot at it.
Shaw Stress Model
Dr. Shaw, from Iowa State University, developed a model called soil moisture and moisture stress prediction forcorn in a western Corn Belt state. Billed as predicting the stress, the paper predicts yields as well. The Shaw(1982) paper is a complete description of how to use water availability, water stress and evaporation tocalculate crop yield with plenty of sunshine. The paper and principles were previewed in Lesson 2.
Sometimes it would be desirable to learn how to work crop models in great detail. That is not intended in theselessons. It is, however, important to understand the mechanisms that are being modeled. By the time you get tothe last page of this model, you will be able to estimate crop yields with respect to the crop's exposure to stress.
Fig. 13.21 Actual vs. estimated yields using the
weighted stress (Shaw 1983).
Figure 13.21 gives estimated yields which are related to actual corn yields. The model data generally fall on astraight line. During the year of a blight, yield was sharply reduced. Except for the blight years, the water stressmodel gives a good result in Iowa.
Shaw (1983) gave a relationship of the weighted stress to corn yield. The relationship is not universal; that is, itchanges with location and soil type. For a Nicollet silt loam in Iowa, the equation is:
Yield = 9682 - 118.6ws Equation 13.2
Where yield is expressed as kg/ha and ws is the total weighted stress for the season The yield may be
Where yield is expressed as kg/ha and ws is the total weighted stress for the season. The yield may beconverted to bu/A by dividing yield by 62.73.
The expression (Equation 13.2) was valid in 1980. However, the yield potential has improved since that date.Accordingly, the expression should be used to find yield reduction, or the value 9682 should be changed toreflect current potential yield (in kg/ha). Also note that the term "118.6" is related to the stress resulting in noyield (9682 )/118.6 = 81.6 stress total for crop failure.
Study Question 13.2
Note the usual stress in East Iowa and in northwest Iowa from Figure 13.19. In northwest Iowa, what is the"expected" yield for an "average" year for corn grown on a Nicollet silt loam soil?
117 bu/A126 bu/A136 bu/A145 bu/A
Check Answer
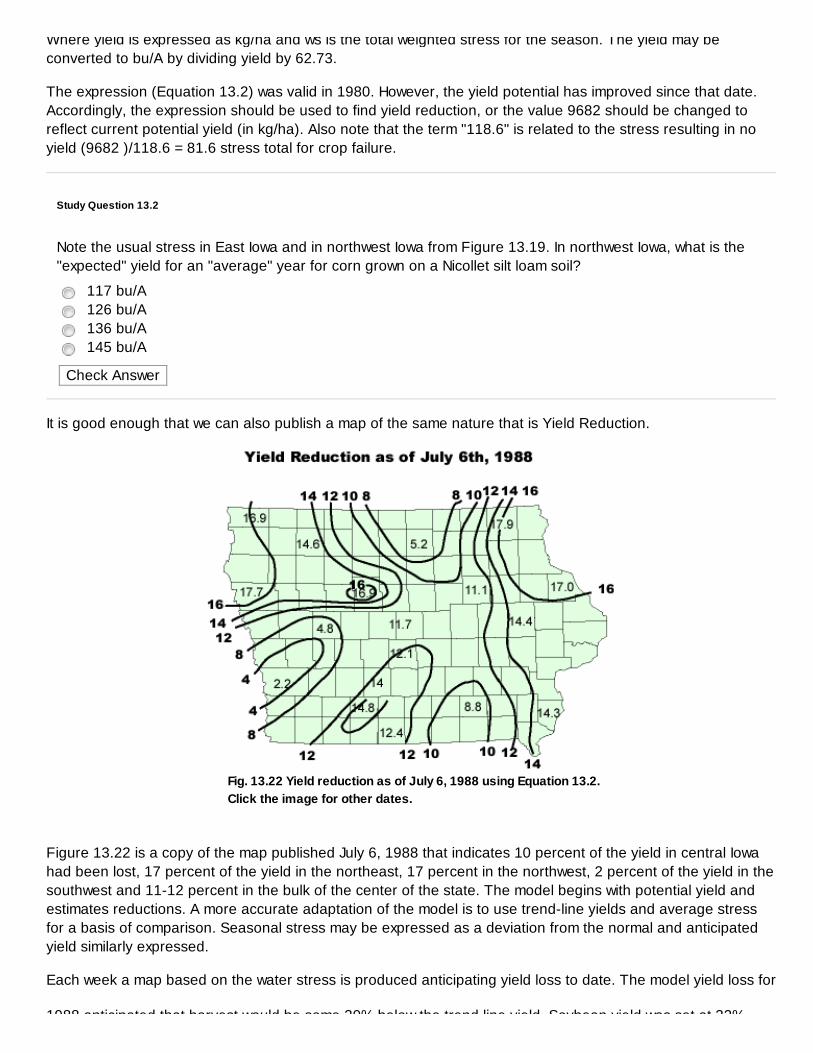
It is good enough that we can also publish a map of the same nature that is Yield Reduction.
Fig. 13.22 Yield reduction as of July 6, 1988 using Equation 13.2.
Click the image for other dates.
Figure 13.22 is a copy of the map published July 6, 1988 that indicates 10 percent of the yield in central Iowahad been lost, 17 percent of the yield in the northeast, 17 percent in the northwest, 2 percent of the yield in thesouthwest and 11-12 percent in the bulk of the center of the state. The model begins with potential yield andestimates reductions. A more accurate adaptation of the model is to use trend-line yields and average stressfor a basis of comparison. Seasonal stress may be expressed as a deviation from the normal and anticipatedyield similarly expressed.
Each week a map based on the water stress is produced anticipating yield loss to date. The model yield loss for
1988 anticipated that harvest would be some 30% below the trend line yield Soybean yield was set at 32%
1988 anticipated that harvest would be some 30% below the trend line yield. Soybean yield was set at 32%loss.
At the end of the season, the predicted loss was within 1% of the actual loss. This was desirable. It gave peoplesome advantage in knowing in August what the yield was going to be, not just for Iowa but in the Corn Belt. Thetragedy could be assessed on your farm. If you happened to have a fairly good yield, you could assess whatthe markets might do with 30 percent less corn available. People in Iowa, at least those who believed my radiobroadcasts and had faith in this model, knew what the yields were going to be on August 1 rather than wait untilharvest time. It turned out that the yields didn't degrade further because of the average weather thereafter.
Average rain in August is less than the crop needs. The crop has to rely on subsoil moisture to have actualevapotranspiration be anywhere near the potential. That is a point to keep in mind. If June rains fail, the crop ishurt, because July and August normally don't rain enough to compensate.
During the last five or six years, July and August have occasionally brought heavy rains. But these were El Niñoinfluenced years. This reduces much of the stress on the crop.
The Shaw paper begins with an understanding of how to picture plant-available moisture in the soil. Figure13.27, which you will find on page 1 of the Shaw handout, represents the moisture in the top 5 feet of soil.
Fig. 13.27 Normal Iowa soil at field
capacity.
At the left of Figure 13.27 is unavailable water. If soil was perfectly dry perhaps an inch of water in a foot of soilcould be added. In a pan with soil a foot deep, pour the equivalent of inch-deep water and the soil will take upthat water. The soil will still be dry. It will appear dry to your hand and to the plant. It can take up the first inch ofwater in a foot of soil and not have anything available at all to a plant.
Add another inch of water to the pan and perhaps the plant can get some. If the soil contains quite a bit oforganic matter, still there is none available to the plant. It will still, after the water has had time to distribute wellin that foot-deep soil in the pan, appear dry, almost powdery.
Add another inch of water (having added 3 in. of water into a pan that has 1-foot deep soil) and the soil will nowjust start to feel moist.
Add another inch, and the soil will become muddy. You can make a ball with your hand, and it will stay in themud ball. This is at field capacity. In this foot of topsoil, of the 4 in. of water, 2 in. is available to the crop. As the
crop grows it removes 1 in of water over a period of four or five days When the soil just begins to feel dry to
crop grows it removes 1 in. of water over a period of four or five days. When the soil just begins to feel dry toyou, it is half gone. The plant can then go on another four or five days, withdrawing the next inch of water andyou will think that it is bone dry. There are still 2 in. of water that could be driven out by heating in an oven.
Deeper into the soil, the subsoil, the water-holding capacity is less than the topsoil. The total plant-availablewater in the top 5 ft. usually is something on the order of the 10-11 in. (as discussed before).
A rainfall event that drops more water than the soil can hold, will introduce water which will sink down throughthe soil to a lower depth until it reaches the water table. Then, 5-6 in. of water per foot of soil will exist at thewater table. Hopefully, there will be a tile or something there draining this off.
Water will rise from the water table. This is called capillary water (Figure 13.27). If you have a pan of soil andthe soil slopes, you fill it with water until there is a puddle. The water will soak upward, making it extremely wetfor a little bit above the water level. It will make the soil moist, perhaps, all the way to the top. A capillary riseoccurs just because the soil particles are close enough to each other that you get a little capillary effect ofwater standing between the particles of the soil.
This is the picture of the soil condition. If the soil is dry, no plant-available water may exist except at 3-5 ft.where there are not many roots. An inch or two of rain might add some plant-available water at the top thatdoes not soak down. The roots soon use that or it evaporates out the top, and only the plant unavailable wateris left in the soil.
With that we will conclude our look at modeling the soil demand and atmospheric demand as they influence theplant. There is one last factor to keep in mind. If the subsoil moisture is less than field capacity, the plant undera high demand atmosphere, will not be able to get all of the water that it needs, and the stomates will restrict.The student will consider water stress and crop production risk in the following section.
IN DETAIL : Yield Reduction
Fig. 13.23
The completed percentage of yield reduction by the end of June was substantial in eastern Iowa. West central Iowareceived timely rain.
Fig. 13.24
The sub soil moisture was 60% to 70% depicted by July 6th and corn leaves stayed rolled throughout the 24 hr periodin some locations. lower leaves died in northwest and east central Iowa.
Close Window
Fig. 13.25
Yield reduction advanced significantly during early July.
Fig. 13.26
By the end of July 1988 weather patterns returned to near normal and the estimated yield loss as of July 29 was thefinal yield loss for the season.
Agronomy 541 : Lesson 13a
Soil Moisture and Crop Yield
Water Loss and Yield
Modeling Risk Analysis
Although weather patterns are erratic, they are not random. Accordingly, crop production risk can be assessedmore accurately than by simply using the distribution of “good and bad” years. The risk of a drought thatreduces crop yield to less than 90% of the trend yield is 1 in 6. However, during El Niño years, the risk is closerto 1 in 20. The risk of a yield-reducing drought is greater if subsoil moisture is lacking and the chance is less ifmoisture is plentiful at planting time. The risk of frost damage to a crop in the spring is less if the crop is plantedsomewhat “late.”
Decision risk analysis considers the changing chance of adverse conditions with time, place and circumstancefrom an economic standpoint with as many risk factors considered as practical. “RISK” is a demonstrationproduction risk analysis program developed as a thesis project by R. Stefanski (1988) at Iowa State University.The program is a knowledge-based system that considers observed crop water stress for Iowa during the past90 years. The risks associated with soil type and subsoil moisture at planting time are computed using the“Shaw ” water stress relationships. The effect of the planting date on expected yield and of hybrid maturityclass on yield are included according to “expert opinion” (Dr. G. Benson and others at Iowa State Universityserved as consultation experts in the development of the expert system).
The risk of fall frost damage is computed from the chance of a freezing temperature for any given location anddate. The yield loss because of late frost is computed according to crop development stage on the frost date(Ortiz-Valdez, 1983).
If the soil is dry at planting time, the risk of drought injury is naturally greater than if moisture is at favorablelevels. Very early planting makes possible a long growing season, but also increases the risk of spring freezedamage. A long-season hybrid planted late may not reach maturity by the end of the growing season, but if thefall frost is late it may yield very well.
The “expert” system program considers all of the risk factors and weighs them against one another. A 50%chance of freeze and a 60% chance of drought do not “add” to a 110% chance of crop failure. Risks do notsum directly. Consider the risk associated with a series of coin flips: There is a 50% chance of flipping a “tails,”but only a 12% or 13% chance of 3 tails in a row (Figure 13.28)
Fig. 13.28 If a coin is flipped three
times, there are 8 possible
outcome combinations: all H, all T,
and 6 HT combinations.
The chance of rain during the next 36 hours is related to the chance of rain during each of the three forecastperiods of 12 hours each. Naturally rain is more likely at some time during the 36-hour period than for any ofthe individual forecast periods. If the chance of rain is 50% tonight, 50% tomorrow, and 50% tomorrow night,the chances are much like that of the coin flip. There is a 1-in-8 chance that it will rain in all three periods and 1in 8 that it will not rain at all.
Study Question 13.3
Forecast: 30% chance of rain tonight, 40% tomorrow, 60% tomorrow night. What is the chance of rain atsome time during the next 36 hours? (Remember the 36-hour chance is greater than the chance for any oneperiod.)
% Check Answer
USING RISKTo use RISK you will need to connect remotely to one of our computers. First, you will need to connect to theIowa State network through use of a virtual private network (VPN). The first time you do this, you will need tofollow the installation instructions. Each subsequent use only requires you to login. Once you haveconnected to Iowa State's VPN, you will need to initiate the remote desktop connection by downloading,unzipping (extracting), and then launching the file provided here. Login using your ISU netID and password (thesame information used to access these materials or Blackboard Learn).
To start RISK, go to Start > All Programs > MS Agron Software > Risk > Risk. Follow the steps as theyappear on the screen.
When presented with a choice, run the “Risk” option.
Select “One Combination” of input options
Select “Northwest” Iowa
Select “soil Yield Potentials”
Select “Sac silty clay loam”
Select “2-5%” slope
Select “Field capacity” planting time moisture
Select “April 20th” as planting date
Select “Full” hybrid maturity class
Select “No” corn was not grown last year
Select “soybeans” as last year's crop
Enter “45” Bu/a soy yield
Enter “3” price of corn
Enter “.1” price of nitrogen
Enter “100” other production costs per acre
Enter “100” desired return
Select “No” do not print
Note: The chance of full yield (148 bu/A) is 13%. The “worst” (1-in-100 chance of doing worse) is 74 bu/A. Thelikely yield (67% choice) is better than 116 bu/A. This is found by punching “F3” twice to highlight “economic”,then tapping “F4”.
Study Question 13.4
Analyze the nature of the production risk for full, medium, and short season hybrids for years with plant-available moisture at 50% of field capacity and years with water at field capacity at planting time.
Tap “F10” to return to the main menu of RISK. Select all combinations, Northwest, soil yield, Marcus silty clayloam, soy last year @ 45 bu/A, corn @ $3, N @ $.1, additional @ $100, and $50 return.
Study Question 13.4 (a)
Identify the planting date and maturity with the highest expected $ return:
April 20 FullApril 20 MediumMay 29 ShortMay 16 Medium
Check Answer
Study Question 13.4 (b)
Identify the combination with the best chance of returning more than $329/A
May 16 FullApril 20 MediumApril 20 FullMay 3 Full
Check Answer
Study Question 13.4 (c)
The combination with greatest risk of losing $
June 10 FullMay 29 FullMay 16 FullJune 10 Medium
Check Answer
Study Question 13.4 (d)
The least chance of losing $
April 20 MediumApril 20 ShortMay 16 MediumMay 16 Short
Check Answer
Press “Space Bar” to continue. Then Return to change a variable. Select “Soil Moisture” and set it at 50%.
Study Question 13.4 (e)
Compare results-which combination now has “lowest risk” of loss?
April 20 MediumMay 3 Medium
Check Answer
Tap “Enter”.
At a soil moisture near 50% of field capacity, there is an 8% chance of 148 bu/A as opposed to the 13%chance when moisture at planting time was high. The lowest yield (1-in-100 chance) is only 30 bu/a asopposed to 74. The likely yield is better than 103 bu/A.
It is intended that you become fully comfortable with the concept of production risk analysis. You should identifythe maturity class that fits a given situation of the environment and is conducive to your “Risk Preference.”
If you buy lottery tickets, you don't object to a “long shot.” If you buy a lot of lottery tickets, you are a risk-lovingperson. Hopefully, your business decisions are based on the management of risk such that a worst case doesnot “cost the farm.” A risk-preferring producer may choose a maturity that could yield 165 bu/A or as low as 100bu/A with an expected yield of 140 bu/A. A risk-adverse person would prefer the 150 bu/A maximum cultivarthat would also be expected to yield 140 bu/A and not be as likely to fall below 120 bu/A.
Now proceed through the system to evaluate individual combinations. Select “Combinations,“One combination.”
Agronomy 541 : Lesson 13b
Lightning and Hurricanes
Introduction
Developed by E. Taylor and D. Todey
It is suggested that you watch Video 13B and complete the exercise in the video before continuing with thelesson.
Podcast Version Full Podcast List
Lightning is an extremely powerful force in the atmosphere. The consequences of a lightning strike areastounding. Consider that the temperature of lightning is approximately 10,000° C, while the surfacetemperature of the sun is 5500° C. The effect of a lightning strike is shown in Figure 13.29. A replacement flagis being held in the hole because the original flag exploded into several little bits of melted metal about the sizeof large buckshot. The causes of lightning and a discussion of hurricanes are included in this lesson.
Fig. 13.29 Golf course green after lightning strike.
What You Will Learn in This Lesson:
How lightning is formed.How lightning is monitored.About the climatology and details of hurricanes.
Reading Assignments:
pg. 287-293—Aguado and Burtpg. 323-333—Aguado and Burt
Agronomy 541 : Lesson 13b
Lightning and Hurricanes
Lightning
Lightning is associated with any thunder in a storm. It is produced by a charge difference within a cloud,between clouds, or between the clouds and the ground. This charge difference induces a flow of electronsfrom the negatively charged site to a positively charged one. A naturally occurring charge difference existsbetween the ground and the atmosphere.
Fig. 13.30 Ground-atmosphere charge
difference.
The charge difference does not produce lightning under normal conditions because the air is an excellentinsulator. During a thunderstorm, the charge difference is increased. The charge build-up is caused byinteraction of raindrops and ice in the cloud. This is not well understood, yet. But ice must occur in the cloudfor thunder and lightning to occur.
Fig. 13.32 Thunderstorm charge
difference.
Note that the charge difference is greatest where an object protrude higher into the air than other objects, suchas a trees, poles, or even a person standing in the middle of an open field. When a thunderstorm develops, thecharge difference increases to a point, overcoming the insulating effect of the air. A discharge occurs movingelectrons to balance the charge between different areas. This can occur in the cloud, between clouds, or withthe ground. About 65% of all discharges are between clouds. Of most interest and concern are those strokesthat strike the ground. These strokes follow a several step process. When the normal potential differenceincreases to about 3,000,000 volts/meter, the attraction between the oppositely-charged regions is overcome.
IN DETAIL : Ice and Storm Process
The formation of ice is necessary for rain to occur in the middle of the continent. Growth from a condensationnuclei to a cloud drop and rain drop is far too slow to form rain. Without ice formation, it would take days for cloudsand rain to form. But the formation of ice on freezing nuclei at very cold temperatures speeds the process to less thana few hours. Once ice begins to form in a cloud, rain can form.
When a cloud begins to glaciate (freezing) is easy to monitor. The cloud outlines go from a sharp contrast at the edgeof a cloud to less distinct. Ice will scatter light less effectively than the water in a cloud, producing the pictured effect(Figures 13.31a & 13.31b)
Fig. 13.31a Example of an ice cloud
Fig. 13.31b Example of a water cloud
Once the ice process starts, water vapor deposits on the crystal, usually forming snow. The growth of the crystalproceeds. Eventually, the crystal starts to fall colliding with other crystals and liquid water. The crystal grows withwater depositing and freezing on the crystal, forming hail. This can continue and form large hail, or it may fall and meltproducing rain. But all rain in the Midwest starts frozen.
Close Window
Rain in tropical climates can form without the ice process. Without the ice process, no thunder and lightning arecreated.
Agronomy 541 : Lesson 13b
Lightning and Hurricanes
Lightning
Lightning Discharge
Lightning to the ground starts with a relatively thin leader stroke from the cloud, which starts to branch outtoward the ground. When it reaches near the ground, surge of positive charge reaches out to the leader,producing the lightning stroke. Once the channel has been ionized, the actual flash of lightning may occurmany times. You can see this, looking at a lightning stroke. After the first strike, the channel will flash numeroustimes as the electrons flow in several distinct pulses differing by only hundredths of a second. If the wind isblowing, the charged path can move along with the wind. The distinct flashes will appear the move slightly.There may be a damage path on the ground where the lightning strike passed. The lightning will continue untilthe charge difference has been reduced. The total time included may be up to one-half a second for the lifecycle to transpire.
One of the features of lighting is that it can often be forked and have several branches. Sometimes thebranches extend to the ground; sometime they extend to the cloud during a cloud-ground strike. The directionof the stroke can change at times. Lightning can be described as going like a river. All the little tributaries drainto the main stem or all the branches drain electrons into the main stroke (Figure 13.33). If it is branched nearthe ground, it's ground-to-cloud lightning. The cloud is positively charged and the earth is negatively charged.This is the opposite of the usual condition depicted above. If the lightning is branched the other way, then thelightning is from the cloud to the ground, with a positively charged ground and negatively charged cloud. Theelectrons flow like a river downstream.
Fig. 13.33 Forked lightning progression.
Agronomy 541 : Lesson 13b
Lightning and Hurricanes
Lightning
Lightning Effects
Some of the effects of lightning are quite interesting. The golf course naturally renovated the green shown. Inrenovating it, they picked up everything off it, sifted it and rebuilt the green from scratch. Greens are primarilysand with fine grass growing on it. Several white lines are seen radiating from the pin in the figure. Part of oneof those lines from the green is displayed in Figure 13.34. The intense heat of the lightning melted the sand toa glass substance named fulgurite. ("Fulgu" means lightning) Fulgarites are found many places on the earth,where lightning strikes and passes through silicon dioxide (sand).
Fig. 13.34 Fulgurite
Lightning and thunder can be used to judge the distance to a thunderstorm. Judge the distance to athunderstorm by counting. The speed of sound is about 1,100 ft. per sec. or 1 mile in about 5 seconds. Foreach five seconds from the time you see the lightning flash until you hear the thunder, is a mile.
Agronomy 541 : Lesson 13b
Lightning and Hurricanes
Lightning
Lightning Safety
Lightning was, until recently, the primary hazardous severe weather in our country. The reduction in lightningdeaths is probably due to the reduction of people working outdoors. Still 75-100 people are killed annually bylightning. As mentioned, the greatest charge difference seems to occur with objects, which stand above theirsurroundings, poles, trees, housetops, and people in the middle of an open field. The idea is to stay undersome protection when lightning is around. But that protection must not be a potential lightning attraction, suchas a tree. If caught in the open, a person should crouch down in a ball. Spreading out flat increases the areayou are exposed to lightning. Farmers sitting on tractors used to be a prime candidate for being struck.Enclosed cabs and better forecasts are probably reasons for the decreased number of farm deaths.
To learn more about lightning safety go here.
Are cars or a metal building, a wise place to be? Yes, they are. It's the nature of electricity that it stays on theoutside of things. If you have a tin can with an electrical charge on it, the electrons, the negatively chargedparticles, repel each other. Excess electrons on the move as far away from each other as possible. As far awayfrom each other as possible is on the outside of the can. Electricity does not travel inside of a tin can. It travelson the outside of a tin can. Electricity does not travel through the center of a wire. It travels on the outside ofthe wire because it moves to get as far away from itself as it can. Electricity will not go inside of a metal building.It will stay on the outside. The only possible damage is if it was such a powerful bolt of lightning that it puncheda hole in the building, or burned some of the metal away.
The automobile is the same situation. The electrical charge will stay on the outside. The airplane is the samesituation. The electrical charge will stay on the outside of the metal container. You are, generally, safe from theelectrical discharge of lightning in an automobile.
A police car somewhere in Iowa was sitting still at the side of the road was struck by lightning. It destroyed theradio in the police car. It blew out all of the tires on the police car, and it gave the officer inside the car aheadache from the noise. He was not injured other than a headache and ringing ears. A car, which doesn'thave metal on the roof, such a true rag-top convertible does not provide the same safety.
If you live in a rural area that has aerial telephone lines, the most dangerous thing that you can do is call yourfriend over in the next section and say, "Isn't this a terrific lightning storm? Are you getting it over there too?"Lightning can enter your house through the wiring. Some of the lightning deaths, reported in our country, arepeople struck in the ear by talking on the telephone. Telephones do have lightning arresters on them by law toprotect against minor lightning discharges. A direct hit right outside your house will ignore the lightning arresterand will come right in the phone wire. The same can occur with electrical or cable TV wires. If the lightningcharge enters a line, it can travel a distance and damage electrical appliances or damage TVs through thecable.
There is a danger with the plumbing. During a storm is not necessarily the time to go take a shower. Housesused to have lightning rods on them. Very few homes have lightning rods any more that are formally installed.Why? Internal metal plumbing acts as a lightning rod. The lightning rod on the top of your house is the vent tothe plumbing, which comes to your sink, your bathtub or your commode, or whatever you have that is vented.The electricity will travel down the metal pipe past the sink as it follows the plumbing to the ground, where it will
harmlessly be dissipated. Still, you could be on the path if you are showering or using the water from the tap. Ifyou only have plastic pipes on the roof of your house, you don't have lightning rods.
One or two times people will find one or more large circles in a field, perhaps in an alfalfa field or a soybeanfield, where all the soybeans are dead. One place called out the newspaper and the sheriff, because clearlythey'd had a UFO land. The ground was obviously burned. Digging around in the ground produced somethings similar to the fulgurite. They were not exactly like it because, being a fairly good Iowa agricultural soil, ithad a low sand content. It isn't uncommon at all to find in fields a large necrotic place where the lightning hasdamaged the crop.
A few years ago beetles were destroying the pine trees in Florida. There was a great deal of concern aboutcontrolling them. They tried to control them, but there was concern about the use of chemicals. It turned outthat the beetles had always been there. It wasn't a big outbreak of beetles; it was a big outbreak of lightning.The lightning had damaged the pine trees. The pine trees, being almost dead, weren't producing a great dealof resin like healthy pine trees produce. When a beetle would dig a little hole in the bark, no resin would comeout to drown the beetle or to clog the hole. The beetles would live under the bark around the tree. Soon thetree would be dead and the beetles were blamed. However, they found a few trees that were just as dead andlooked just alike, except not having any beetles. Investigating them carefully indicated lightning in the area hadweakened the trees.
IN DETAIL : Field Lightning
Fig. 13.35
Fig. 13.36
Close Window
Fig. 13.37
Fig. 13.38
Agronomy 541 : Lesson 13b
Lightning and Hurricanes
Lightning
Lightning Detection
To observe and report lightning occurrence, a lightning detection network has been developed (Figure 13.39).The towers at these locations observe lightning strikes and detect the direction from the tower. Then by use oftriangulation, the site of a lightning strike is obtained. These are plotted on maps to depict the density andlocation of lightning strikes (Figure 13.40).
Fig. 13.39 Locations of lightning detection
stations.
Fig. 13.40 Lightning strike frequency over an hour period.
Satellites are even used in lightning detection. Discharges from storms can be tracked at night using visiblesatellite imagery (Figure 13.41)
Fig. 13.41 Satellite night detection image.
Agronomy 541 : Lesson 13b
Lightning and Hurricanes
Hurricanes
Another severe storm and great cause of life and property damage is hurricanes. Hurricanes are quite differentin their formation because of their tropical nature (as opposed to the extra-tropical storms in the Midwest). Thefloods that are associated with them cause the greatest loss of human life, probably not just in the UnitedStates but around the globe as well.
Hurricanes are named differently depending on where they occur. In the Western Hemisphere, they are calledhurricanes. In the Eastern Hemisphere they are called typhoons. This applies to Australia as well, where booksoften say they are called Willy-Willies. In the Indian Ocean, they are called cyclones. Hurricanes form in a singlewarm air mass. The particular areas have uniformly warm water and air. This combination of heat and highhumidity produces instability and rising motion. Tropical areas straddle the Equator in the easterly trade winds.Hurricanes do not form right on the equator because the Coriolis effect is minimal near the equator. If fact, theywill not form within 200 miles of the equator for this reason. The Coriolis effect causes them to spincounterclockwise in the northern hemisphere and clockwise in the southern hemisphere. Notice the rotation issimilar to the rotation around areas of low pressure.
In lesson 7, figure 7.30 depicted the general wind flows around the world. The greatest heating of the earth isover the equator, the rising air over the equator gives rise to low pressures there and high pressures in thesub-tropical highs. The air moving from the sub-tropical highs toward the equator turns easterly, becoming thetrade winds, converging at the equator. The convergence area is called the Inter-tropical Convergence Zone(ITCZ). The ITCZ is not always right on the equator. It is only over the equator a couple of times a year. Itfollows the sun, following the area of maximum heating, which is slightly north of the Equator during theNorthern Hemisphere summer. It is in this zone that you're most likely to have formation of hurricanes.
Thus, the tropics are the hurricane formation areas on the Earth. Your text (pg. 142) shows where hurricanesform around the globe. Of most concern to the United States are usually the hurricanes, which form in theAtlantic or Caribbean and move over southeastern and eastern parts of the country. The western part of thecountry can be susceptible at times. Usually, the colder water off the west coast defends the coast againsthurricane penetration there. The most numerous hurricane area and area of strongest hurricanes is over theWestern North Pacific.
Since the ITCZ follows the sun, the maximum time of hurricanes in the Northern Hemisphere would be summer.Since the heating of the ocean occurs very slowly, the time of maximum ocean temperature occurs in Augustand September. The time of Southern Hemisphere maximum would be six months later. The time of the greatestnumber of hurricanes corresponds with this (Figure 13.42) As mentioned, very warm water is necessary for theformation of hurricanes. Until the water temperatures reach critical levels, hurricane formation is less likely.
Fig. 13.42 Cumulative numbers of named tropical systems, hurricanes and
strong hurricanes averaged over 43 years.
Study Question 13.5
What is the earliest occurrence of a category 3 hurricane?
Check Answer
Study Question 13.6
What is the average number of hurricanes for the season?
Hurricanes Check Answer
Agronomy 541 : Lesson 13b
Lightning and Hurricanes
Hurricanes
Hurricane Structure
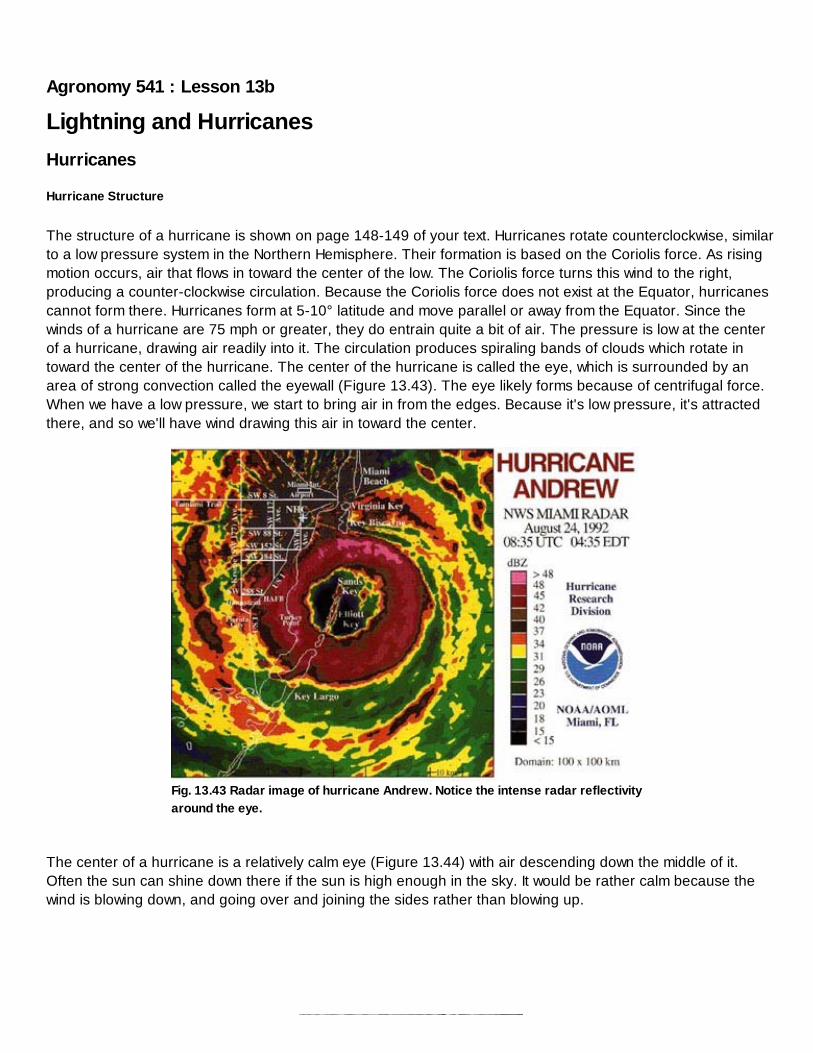
The structure of a hurricane is shown on page 148-149 of your text. Hurricanes rotate counterclockwise, similarto a low pressure system in the Northern Hemisphere. Their formation is based on the Coriolis force. As risingmotion occurs, air that flows in toward the center of the low. The Coriolis force turns this wind to the right,producing a counter-clockwise circulation. Because the Coriolis force does not exist at the Equator, hurricanescannot form there. Hurricanes form at 5-10° latitude and move parallel or away from the Equator. Since thewinds of a hurricane are 75 mph or greater, they do entrain quite a bit of air. The pressure is low at the centerof a hurricane, drawing air readily into it. The circulation produces spiraling bands of clouds which rotate intoward the center of the hurricane. The center of the hurricane is called the eye, which is surrounded by anarea of strong convection called the eyewall (Figure 13.43). The eye likely forms because of centrifugal force.When we have a low pressure, we start to bring air in from the edges. Because it's low pressure, it's attractedthere, and so we'll have wind drawing this air in toward the center.
Fig. 13.43 Radar image of hurricane Andrew. Notice the intense radar reflectivity
around the eye.
The center of a hurricane is a relatively calm eye (Figure 13.44) with air descending down the middle of it.Often the sun can shine down there if the sun is high enough in the sky. It would be rather calm because thewind is blowing down, and going over and joining the sides rather than blowing up.
Fig. 13.44 Satellite image of the
hurricane's eye.
Apparently quite a few people historically have said, "Oh, the storm's over." Going outside during this, theywere struck by the eyewall on the other side of the eye. The wind, coming from the other direction, has causedconsiderable loss of life since they did not realize that there is an eye associated with a hurricane.
The hurricane forms out of a single air mass. The warm, moist air mass is the driving force for the hurricane.The rising motion in the hurricane lifts warm moist air. As the warm air cools and condenses moisture into dropsit causes rain. The condensation of moisture releases heat that causes further lift in the atmosphere. The hugeamounts of energy released powers the hurricane. As soon as the hurricane goes over land, it will almostinstantly cease to be a hurricane. There is a little more friction as the hurricane goes over the land, but thelargest effect is that the hurricane no longer has the energy supply that it needs. A hurricane can causedamage over land, but it generally weakens its wind flow very quickly.
Fig. 13.45 A 60 hour
visible satellite loop of
Hurricane Bonnie (1998).
Hurricane formation goes through several stages. The typical path of the Atlantic hurricane is to generatesomewhere between Africa and the central Atlantic. The formation starts as a low pressure disturbance, calledan easterly wave. As it moves westward it may become a tropical depression. As the winds strengthen togreater than 34 mph it becomes a tropical storm. If it continues to strengthen to greater than 74 mph, it will be ahurricane. At any time crossing the Atlantic it may become caught in the westerlies and move into the centralAtlantic. It may continue a westward movement and cross the islands of the Caribbean. Hurricane tracks fromthe active year of 1995 are pictured in Figure 13.46.
Fig. 13.46 Life cycle and tracks of all named tropical systems of 1995.
At times they may continue west and hit Florida or over to hit Mexico rather than move and follow the warmwater. They may cross the Gulf of Mexico and hit locations on the Gulf Coast. More miss the United States thanhit the United States.
Agronomy 541 : Lesson 13b
Lightning and Hurricanes
Hurricanes
Hurricane Forecasting
In the early part of the century, hundreds and thousands of lives were lost in hurricanes in Galveston, TX, KeyWest, FL, and others. There was no hurricane warning system. The hurricane warning system was establishedby the military and the National Weather Service, (called the United States Weather Bureau) in 1938. Beforethat, about the only warning that a hurricane was coming was the barometer dropping, and the type of cloudsthat were showing up in an area. People had to learn to know if there was a severe storm coming by watchingthe signs around them. There was great loss of life because hurricane tracking was based on ship reports nearhurricanes and no warning system was in place. With the advent of satellites, observing hurricane formationand tracking became much easier as they were able to be tracked throughout their life-cycle.
Another major improvement in long-range forecasting was produced by Dr. William Gray of Colorado StateUniversity. His forecasting system is described, based on wet years in Africa and the state of the ENSO (Gray1998).
The main point of interest with his hurricane forecasting has to do with the rainfall in Africa. Numerous factorsare involved in what the hurricane season will bring (Figure 13.47). Two of the major ones are the state of theENSO and rainfall in Africa. El Niño conditions (lesson 10b) tend to suppress hurricanes while La Niñas tend topromote hurricane activity. Rainfall in the Sahel of Africa is very important, an extended drought during the1960's to 1980's limited the number of hurricanes. But rainfall has returned in the last 10 years assisting inproducing hurricanes.
Fig. 13.47 Factors involved in hurricane forecasting (Gray 1998).
We've had really an extended droughty time, the deserts have been extending in Africa, there have been a lotof problems happening of that nature, but in the meantime people had been noticing all the beautiful realestate available along the Gulf Coast and the Atlantic Coast, and nobody lived there. There are beautifulbeaches, a beautiful place, why don't we live there? Why don't we build a hotel? Why don't we build a summerhome there? Nobody could think of any reason not to except the people who had lived there back in the thirtiesand forties, and they said, "Well, the reason that nothing is there is that everything that was put there has beenwashed away."
During the dry period in Africa development along the coast of Florida and the Gulf Coast progressed rapidly.The land was inexpensive allowing rapid development. Meteorologists kept saying it was not wise thing to
develop flood-prone areas being concerned about hurricanes striking the area. There was little concernbecause few hurricanes were occurring. Rain has started in Africa again. People are starting to find out thatthey live in a hurricane-prone and flood-prone area along the coasts of Florida, along the Gulf Coast, along theAtlantic Coast. Much more damage will be seen in the near future if we indeed have seen a return to the normalrainfall or above normal rainfall in western Africa. Several recent large hurricanes have born this out.
Agronomy 541 : Lesson 13b
Lightning and Hurricanes
Hurricanes
Hurricane Dangers
Several dangerous conditions exist with a hurricane. Winds can be a problem with stronger hurricanes assustained winds of greater than 100 mph occur with much higher gusts. This is usually close to the center ofthe hurricane. Of more concern near where there hurricane make land fall is the storm surge. The strong windsbuild up water, sometime 10-15 ft. above normal tides pushing water inland. Often this surge with the heavyrains can cause severe flooding near land fall of the hurricane. Heavy rain can occur anywhere inland as thetropical system brings huge amounts of moisture inland. Even after the storm weakens in wind strength, it canproduces inches or feet of rain on occasion. Another problem, which is not minor, is the number of tornadoesspawned around the outside of the hurricane. As the hurricane comes to shore, they say, well the damage willbe...they always want to know right where it's coming ashore, in other words where the eye is coming. That isn'talways where the greatest damage is. Sometimes the greatest damage is 60-70 mile away from the eye wherethe tornadoes are. These things all need to be watched, not just where the hurricane comes ashore.
Assignment 13.1
Click here for Assignment 13.1
Lesson 13 Reflection
Why reflect?
Submit your answers to the following questions in the Student Notebook System.
1. In your own words, write a short summary (< 150 words) for this lesson.2. What is the most valuable concept that you learned from the lesson? Why is this concept valuable to
you?3. What concepts in the lesson are still unclear/the least clear to you?4. What learning strategies did you use in this lesson?
Agronomy 541 : Lesson 13b
Lightning and Hurricanes
References
Basnyat, M.B., 1987; Estimation of daily Class A pan evaporation from meteorological data. Master's thesis,Iowa State University.
Gray's hurricane data from National Hurricane Center. http://www.nhc.noaa.gov
Lightning detection map and lightning from space from Global Hydrology and Climate Center.http://thunder.msfc.nasa.gov/primer.html
Ortiz,-Valdez, M., 1983; Effects of freezing temperatures on grain yield and total dry matter of corn crops.Master's thesis, Iowa State University.
Stefanski, R.J., 1988: Determination of crop production risks using simulated yield distributions and an expertsystem shell. Master's thesis, Iowa State University.
Shaw, R.H. and R.E. Fetch, 1972; Climatology of a moisture-stress index for Iowa and its relationship to cornyields. Iowa State Journal of Sci., 46, 357-368.
Shaw, R.H., 1982: Soil Moisture and moisture stress prediction for corn in a western corn belt state. KoreanJournal of Crop Science, 28, 1-11.
Agronomy 541 : Lesson 13a
Soil Moisture and Crop Yield
Introduction
Developed by E. Taylor and D. Todey
It is suggested that you watch Video 13A and complete the exercise in the video before continuing with thelesson.
Podcast Version Full Podcast List
In this lesson, the student will:
1. Review a crop yield/water stress model (Shaw's Model).2. Use an "Expert System/Knowledge-based" model to determine risk of reduced yield for years when initial
soil moisture is at low, moderate, and high levels.3. Estimate "pan evaporation" from temperature data to evaluate potential evaporation.