Acta Scientiarum http://periodicos.uem.br/ojs/acta ISSN on-line: 1807-8621 Doi: 10.4025/actasciagron.v42i1.43518 AGRICULTURAL ENGINEERING Acta Scientiarum. Agronomy, v. 42, e43518, 2020 Soil water content and net precipitation spatial variability in an Atlantic forest remnant André Ferreira Rodrigues * , Carlos Rogério de Mello, Marcela de Castro Nunes Santos Terra, Vinicius Oliveira Silva, Gustavo Alves Pereira and Renato Antônio da Silva Departamento de Engenharia, Setor de Água e Solo, Universidade Federal de Lavras, Câmpus Universitário, s/n., 37200-000, Cx. Postal 3037, Lavras, Minas Gerais, Brazil. *Author for correspondence. E-mail: [email protected]ABSTRACT. This study was carried out in an Atlantic forest remnant in Southeastern Brazil and aimed to spatially model the soil water content (SWC) and net precipitation (NP) on a monthly time scale and to assess the spatial behavior of these hydrological variables in the different seasons. NP is defined by summing throughfall and stemflow, which have been collected after each rain event and accumulated monthly. Soil moisture measurements were carried out monthly up to a depth of 1.00 m and then integrated to obtain the SWC. The exponential semivariogram model was fitted for both hydrological variables, and the goodness-of-fit was assessed by a cross-validation procedure, spatial dependence degree (SDD) and spatial dependence index (SDI). This model provided adequate performance for SWC and NP mapping according to the cross-validation statistics. Based on the SDD, both variables have been classified as a ‘strong spatial dependence structure’. Nevertheless, when the SDI was assessed, NP showed less spatial dependence, while the SWC maintained almost the same performance. Kriging maps pictured the regional climate seasonality due to higher values of both variables in spring and summer than in autumn and winter seasons. However, correlations between NP and SWC are not expressive in the studied period. Keywords: geostatistics; latosol-semideciduous forest site; forest hydrology. Received on July 13, 2018. Accepted on September 26, 2018 Introduction The hydrological cycle is the set of stages and processes that water is subject to in nature, encompassing different forms of precipitation, infiltration, recharge of aquifers, generation of surface runoff and evapotranspiration. Among these factors, the response of each phase of the water cycle is closely related to the different land use, especially in forest ecosystems (Sari, Paiva, & Paiva, 2016). Due to the natural complexity of the hydrological cycle, it is necessary to deepen the knowledge of interactions between its phases, mainly the terrestrial phase. Soil water is one of the most important stages of the hydrological cycle. Its spatial and temporal distributions are fundamental for understanding hydrological processes, such as the generation of direct surface runoff, recharge of aquifers (percolation), evapotranspiration and soil erosion processes (Yang, Chen, Wei, Yu, & Zhang, 2014). With respect to native forests, soil moisture and its fluctuations throughout time are capable of promoting significant changes in the structure and dynamics of forests. Vale et al. (2013) observed an increase in basal area due to the rapid growth of many trees in three dry forests in the Araguari River Basin, Brazil, after increasing soil moisture due to the construction of two dams in the surrounding area. Forest ecosystems have a direct relationship with the hydrological cycle, having a special effect on the redistribution of gross precipitation and the increase of water infiltration capability (Xu et al., 2012; Terra et al., 2018). The rainfall interception takes place when the rainfall reaches the forest canopy. A portion is retained and then evaporated to the atmosphere, a portion flows through the trunks (stemflow) and another portion passes freely by the canopy into the ground (throughfall) (Ávila, Mello, Pinto, & Silva, 2014; Bialkowski & Buttle, 2015). The set formed by the throughfall and the stemflow is known as net precipitation. In this sense, several studies have focused on the measurement and modeling of rainfall interception in forest environments (Sato, Avelar, & Netto, 2011; Ávila et al., 2014; Sari et al., 2016; Junqueira Junior et al., 2019). However, there are a lack of studies that address the variations in the hydrological cycle elements in different forest stands and analyze the idiosyncrasies of each case.
Transcript
Acta Scientiarum
http://periodicos.uem.br/ojs/acta
ISSN on-line: 1807-8621
Doi: 10.4025/actasciagron.v42i1.43518
AGRICULTURAL ENGINEERING
Acta Scientiarum. Agronomy, v. 42, e43518, 2020
Soil water content and net precipitation spatial variability in
an Atlantic forest remnant
André Ferreira Rodrigues* , Carlos Rogério de Mello, Marcela de Castro Nunes Santos Terra,
Vinicius Oliveira Silva, Gustavo Alves Pereira and Renato Antônio da Silva
Departamento de Engenharia, Setor de Água e Solo, Universidade Federal de Lavras, Câmpus Universitário, s/n., 37200-000, Cx. Postal 3037, Lavras, Minas
Gerais, Brazil. *Author for correspondence. E-mail: [email protected]
ABSTRACT. This study was carried out in an Atlantic forest remnant in Southeastern Brazil and aimed to
spatially model the soil water content (SWC) and net precipitation (NP) on a monthly time scale and to assess
the spatial behavior of these hydrological variables in the different seasons. NP is defined by summing
throughfall and stemflow, which have been collected after each rain event and accumulated monthly. Soil
moisture measurements were carried out monthly up to a depth of 1.00 m and then integrated to obtain the
SWC. The exponential semivariogram model was fitted for both hydrological variables, and the goodness-of-fit
was assessed by a cross-validation procedure, spatial dependence degree (SDD) and spatial dependence index
(SDI). This model provided adequate performance for SWC and NP mapping according to the cross-validation
statistics. Based on the SDD, both variables have been classified as a ‘strong spatial dependence structure’.
Nevertheless, when the SDI was assessed, NP showed less spatial dependence, while the SWC maintained
almost the same performance. Kriging maps pictured the regional climate seasonality due to higher values of
both variables in spring and summer than in autumn and winter seasons. However, correlations between NP
Nevertheless, these hydrological components should not be treated as local information, which may lead to
errors with different degrees of relevance, since such quantities tend to have high spatial variability (Ávila, Mello,
Mello, & Silva, 2011; Zucco, Brocca, Moramarco, & Morbidelli, 2014). Therefore, it is important to use
procedures that seek to describe their spatial behavior, especially for soil water content (Liang, Hung, Chan, &
Lu, 2014) and net precipitation, both of which have been rarely studied in tropical forests.
The application of geostatistics to spatially model net precipitation and soil water content is an important
contribution for the acquisition of robust information for a better hydrological understanding of forest
environments in tropical regions. Such information may imply a better prediction of forest behavior in climatic
and/or land use change scenarios and culminate in better management and conservation strategies. This is
particularly relevant for the Brazilian Atlantic forest, a diversity hotspot (Gorenflo, Romaine, Mittermeier, &
Walker-Painemilla, 2012) that is increasingly threatened and requires special attention.
Therefore, the objectives of this study were (i) to apply geostatistical tools to study the spatial
distribution of soil water content (SWC) and net precipitation (NP) in an Atlantic forest remnant located in
southeastern Brazil and (ii) to investigate possible correlations between these variables of the hydrological
cycle in a forest site and seek a better understanding of the forest interference in these variables.
Material and methods
Study area and data collection
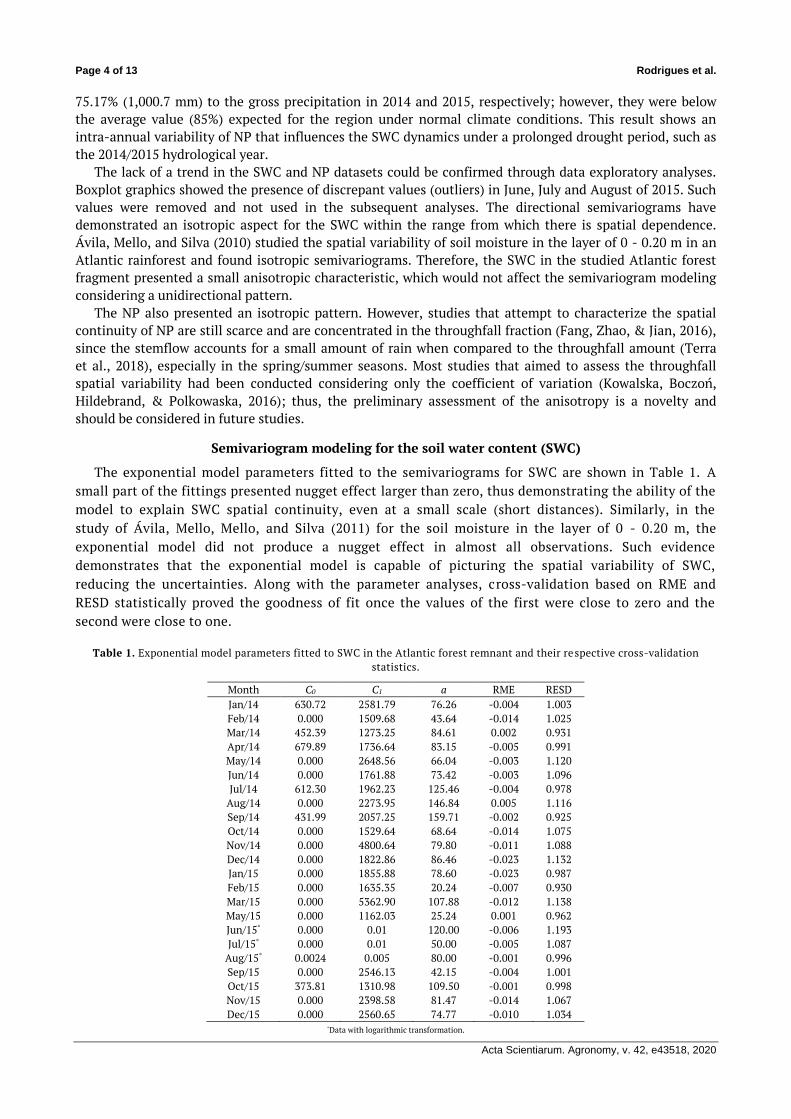
This study was carried out in a semideciduous seasonal forest of 6.54 ha at the coordinates of 21° 13’ 40’’ S
and 44° 57’ 50’’ W, in a Dystroferric Red Latosol (Junqueira Junior et al., 2017). The Köppen-type climate is Cwb,
with dry winters and rainy summers and strong seasonality of the rainfall (Junqueira Junior et al., 2017). The
rainy season comprises the months from October to March and the dry season lasts from April to September. The
mean annual precipitation is 1511 mm, with 85% concentrated in summer (Junqueira Junior et al., 2017).
Data collection was carried out in 2014 and 2015, and the total amount of rainfall was 1006.48 mm and
1,433.86 mm, respectively. The period of the study was characterized as an atypical drought period, since
the hydrological year 2014/2015 (October-September) was one of the driest years ever observed in the
region (Coelho et al., 2016).
Thirty-two measurement points were randomly distributed within the forest. Each monitoring point was
monitored with a manual rain gauge, stemflow measurement apparatus (Terra et al., 2018) and a profile
probe tube (PR2/6 capacitance probe from Delta-T Devices, Cambridge, UK) for soil moisture reading points
up to one meter in depth. Precipitation above the canopy was obtained by a rain gauge (manual and
automatic) located at the top of a 22-m high weather observation tower (Figure 1).
Figure 1. Atlantic forest remnant (study site) geographical location with the monitoring points.
Soil water and precipitation spatial behavior Page 3 of 13
Acta Scientiarum. Agronomy, v. 42, e43518, 2020
Throughfall (Tf) and stemflow (Sf) collections were made on the day following each precipitation event,
summed point to point and accumulated monthly, which resulted in the series of total NP (Tf + Sf). Soil
moisture was also measured monthly, with the exception of April (2015) due to problems with the
equipment, and integrated over the soil profile to obtain the SWC as follows Equation 1:
SW
(1)
where:
i is the soil profile layer; n is the number of depths sampled; θi and θi+1 are the volumetric moisture at the
adjacent depths; and h is the difference in depth between the points.
Data analysis
The SWC and NP of the two years under study were grouped and analyzed in accordance with the seasons
of year-spring (October - December), summer (January - March), autumn (April - June) and winter (July -
September) - since the region presents well-defined seasons and expressive differences of the variables.
The study of spatial dependence was conducted on the basis of the empirical semivariogram. For
databases that presented discrepant values, a logarithmic transformation of the variable was adopted
(Webster & Oliver, 2007). For an application of theoretical spatial models, anisotropy verification of the
data in the directions of 0, 45, 90, and 135° was performed (Isaaks & Srivastava, 1989). The exponential
model was then fitted using the weighted least squares method (Isaaks & Srivastava, 1989), since it
generates a better spatial behavior description of the studied hydrological variables, especially SWC and
precipitation (Mello et al., 2011; Mello, Viola, Curi, & Silva, 2012; Liang et al., 2014).
The quality of the fitted models was verified based on a cross-validation technique from which reduced
mean error (RME) and reduced error standard deviation (RESD) precision statistics were calculated. The
spatial dependence degree (SDD) was also calculated (Equation 2) and classified as weak (< 25%), moderate
(25 ≤ SDD ≤ 75%) and strong (> 75%) spatial structures (adapted from Cambardella et al., 1994).
SDD
(2)
where:
C1 is the sill and C0 is the nugget effect.
In addition, the spatial dependence degree was tested using the methodology proposed by Seidel and
Oliveira (2014) using the so-called spatial dependence index (SDI). These authors categorically
classified SDI as weak (≤ 6%), moderate (6% < SDI ≤ 13%) and strong (> 13%) (Seidel & Oliveira, 2016).
This new proposal adds the maximum distance between the points sampled, the practical range and the
respective fitted model to the SDD in order to seek a better characterization of the spatial dependence
(Equation 3).
SDI .317
.5 D 10 (3)
where:
r is the practical range and MD is the maximum distance between sampled points.
Subsequently, maps of the variables were compared visually and by the Pearson correlation of the data
extracted from the geostatistical interpolations. The mesh is composed of 5 × 5 m pixels, totaling 4697
points. Finally, to evaluate the correlation significance, the Student’s t-test was applied at 5% significance.
All statistical and geostatistical analyses were performed using the R package geoR (Ribeiro Júnior & Diggle,
2001). The interpolation maps were constructed with the aid of ArcGIS 10.1 (Environmental Systems
Research Institute [Esri], 2012).
Results and discussion
Exploratory analyses
The precipitation that reaches the canopy (gross precipitation) varied significantly throughout the year
following the seasonal behavior of the climate. Spring and summer contributed 78.23% (787.4 mm) and
Page 4 of 13 Rodrigues et al.
Acta Scientiarum. Agronomy, v. 42, e43518, 2020
75.17% (1,000.7 mm) to the gross precipitation in 2014 and 2015, respectively; however, they were below
the average value (85%) expected for the region under normal climate conditions. This result shows an
intra-annual variability of NP that influences the SWC dynamics under a prolonged drought period, such as
the 2014/2015 hydrological year.
The lack of a trend in the SWC and NP datasets could be confirmed through data exploratory analyses.
Boxplot graphics showed the presence of discrepant values (outliers) in June, July and August of 2015. Such
values were removed and not used in the subsequent analyses. The directional semivariograms have
demonstrated an isotropic aspect for the SWC within the range from which there is spatial dependence.
Ávila, Mello, and Silva (2010) studied the spatial variability of soil moisture in the layer of 0 - 0.20 m in an
Atlantic rainforest and found isotropic semivariograms. Therefore, the SWC in the studied Atlantic forest
fragment presented a small anisotropic characteristic, which would not affect the semivariogram modeling
considering a unidirectional pattern.
The NP also presented an isotropic pattern. However, studies that attempt to characterize the spatial
continuity of NP are still scarce and are concentrated in the throughfall fraction (Fang, Zhao, & Jian, 2016),
since the stemflow accounts for a small amount of rain when compared to the throughfall amount (Terra
et al., 2018), especially in the spring/summer seasons. Most studies that aimed to assess the throughfall
spatial variability had been conducted considering only the coefficient of variation (Kowalska, Boczoń,
Hildebrand, & Polkowaska, 2016); thus, the preliminary assessment of the anisotropy is a novelty and
should be considered in future studies.
Semivariogram modeling for the soil water content (SWC)
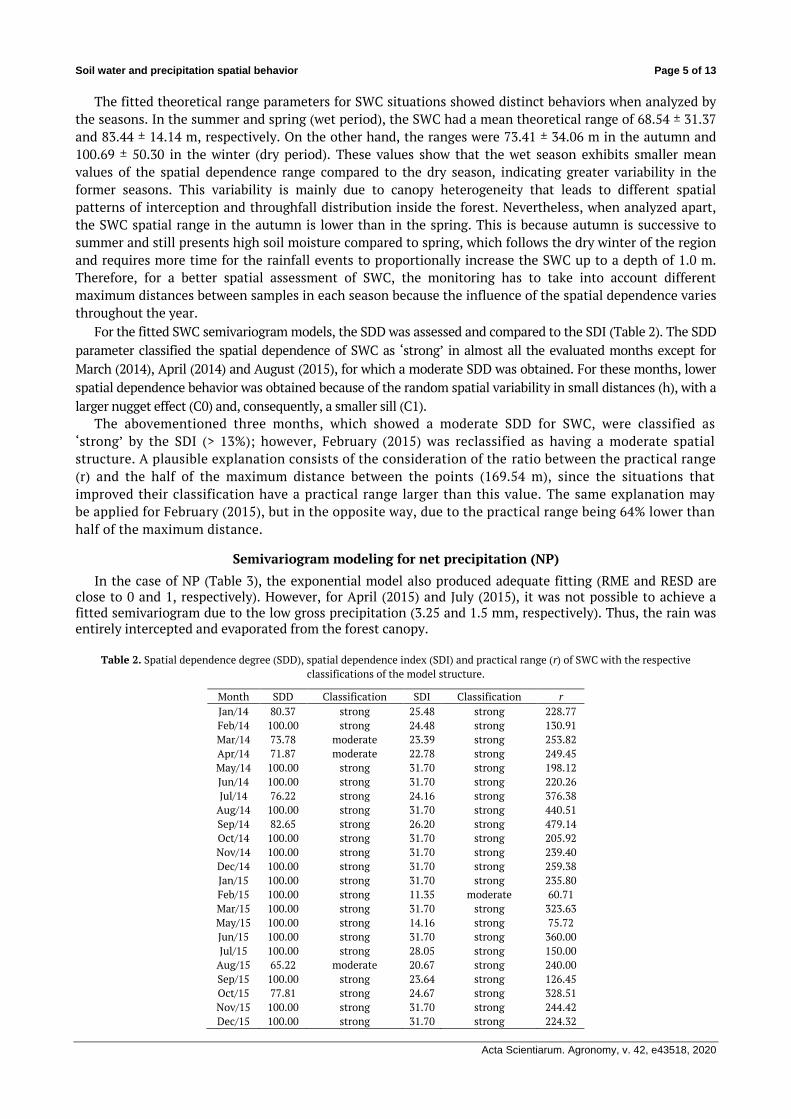
The exponential model parameters fitted to the semivariograms for SWC are shown in Table 1. A
small part of the fittings presented nugget effect larger than zero, thus demonstrating the ability of the
model to explain SWC spatial continuity, even at a small scale (short distances). Similarly, in the
study of Ávila, Mello, Mello, and Silva (2011) for the soil moisture in the layer of 0 - 0.20 m, the
exponential model did not produce a nugget effect in almost all observations. Such evidence
demonstrates that the exponential model is capable of picturing the spatial variability of SWC,
reducing the uncertainties. Along with the parameter analyses, cross-validation based on RME and
RESD statistically proved the goodness of fit once the values of the first were close to zero and the
second were close to one.
Table 1. Exponential model parameters fitted to SWC in the Atlantic forest remnant and their respective cross-validation
statistics.
Month C0 C1 a RME RESD
Jan/14 630.72 2581.79 76.26 -0.004 1.003
Feb/14 0.000 1509.68 43.64 -0.014 1.025
Mar/14 452.39 1273.25 84.61 0.002 0.931
Apr/14 679.89 1736.64 83.15 -0.005 0.991
May/14 0.000 2648.56 66.04 -0.003 1.120
Jun/14 0.000 1761.88 73.42 -0.003 1.096
Jul/14 612.30 1962.23 125.46 -0.004 0.978
Aug/14 0.000 2273.95 146.84 0.005 1.116
Sep/14 431.99 2057.25 159.71 -0.002 0.925
Oct/14 0.000 1529.64 68.64 -0.014 1.075
Nov/14 0.000 4800.64 79.80 -0.011 1.088
Dec/14 0.000 1822.86 86.46 -0.023 1.132
Jan/15 0.000 1855.88 78.60 -0.023 0.987
Feb/15 0.000 1635.35 20.24 -0.007 0.930
Mar/15 0.000 5362.90 107.88 -0.012 1.138
May/15 0.000 1162.03 25.24 0.001 0.962
Jun/15* 0.000 0.01 120.00 -0.006 1.193
Jul/15* 0.000 0.01 50.00 -0.005 1.087
Aug/15* 0.0024 0.005 80.00 -0.001 0.996
Sep/15 0.000 2546.13 42.15 -0.004 1.001
Oct/15 373.81 1310.98 109.50 -0.001 0.998
Nov/15 0.000 2398.58 81.47 -0.014 1.067
Dec/15 0.000 2560.65 74.77 -0.010 1.034 *Data with logarithmic transformation.
Soil water and precipitation spatial behavior Page 5 of 13
Acta Scientiarum. Agronomy, v. 42, e43518, 2020
The fitted theoretical range parameters for SWC situations showed distinct behaviors when analyzed by
the seasons. In the summer and spring (wet period), the SWC had a mean theoretical range of 68.54 ± 31.37
and 83.44 ± 14.14 m, respectively. On the other hand, the ranges were 73.41 ± 34.06 m in the autumn and
100.69 ± 50.30 in the winter (dry period). These values show that the wet season exhibits smaller mean
values of the spatial dependence range compared to the dry season, indicating greater variability in the
former seasons. This variability is mainly due to canopy heterogeneity that leads to different spatial
patterns of interception and throughfall distribution inside the forest. Nevertheless, when analyzed apart,
the SWC spatial range in the autumn is lower than in the spring. This is because autumn is successive to
summer and still presents high soil moisture compared to spring, which follows the dry winter of the region
and requires more time for the rainfall events to proportionally increase the SWC up to a depth of 1.0 m.
Therefore, for a better spatial assessment of SWC, the monitoring has to take into account different
maximum distances between samples in each season because the influence of the spatial dependence varies
throughout the year.
For the fitted SWC semivariogram models, the SDD was assessed and compared to the SDI (Table 2). The SDD
parameter classified the spatial dependence of SW as ‘strong’ in almost all the evaluated months except for
March (2014), April (2014) and August (2015), for which a moderate SDD was obtained. For these months, lower
spatial dependence behavior was obtained because of the random spatial variability in small distances (h), with a
larger nugget effect (C0) and, consequently, a smaller sill (C1).
The abovementioned three months, which showed a moderate SDD for SWC, were classified as
‘strong’ by the SDI (> 13%); however, February (2015) was reclassified as having a moderate spatial
structure. A plausible explanation consists of the consideration of the ratio between the practical range
(r) and the half of the maximum distance between the points (169.54 m), since the situations that
improved their classification have a practical range larger than this value. The same explanation may
be applied for February (2015), but in the opposite way, due to the practical range being 64% lower than
half of the maximum distance.
Semivariogram modeling for net precipitation (NP)
In the case of NP (Table 3), the exponential model also produced adequate fitting (RME and RESD are close to 0 and 1, respectively). However, for April (2015) and July (2015), it was not possible to achieve a fitted semivariogram due to the low gross precipitation (3.25 and 1.5 mm, respectively). Thus, the rain was entirely intercepted and evaporated from the forest canopy.
Table 2. Spatial dependence degree (SDD), spatial dependence index (SDI) and practical range (r) of SWC with the respective
classifications of the model structure.
Month SDD Classification SDI Classification r
Jan/14 80.37 strong 25.48 strong 228.77
Feb/14 100.00 strong 24.48 strong 130.91
Mar/14 73.78 moderate 23.39 strong 253.82
Apr/14 71.87 moderate 22.78 strong 249.45
May/14 100.00 strong 31.70 strong 198.12
Jun/14 100.00 strong 31.70 strong 220.26
Jul/14 76.22 strong 24.16 strong 376.38
Aug/14 100.00 strong 31.70 strong 440.51
Sep/14 82.65 strong 26.20 strong 479.14
Oct/14 100.00 strong 31.70 strong 205.92
Nov/14 100.00 strong 31.70 strong 239.40
Dec/14 100.00 strong 31.70 strong 259.38
Jan/15 100.00 strong 31.70 strong 235.80
Feb/15 100.00 strong 11.35 moderate 60.71
Mar/15 100.00 strong 31.70 strong 323.63
May/15 100.00 strong 14.16 strong 75.72
Jun/15 100.00 strong 31.70 strong 360.00
Jul/15 100.00 strong 28.05 strong 150.00
Aug/15 65.22 moderate 20.67 strong 240.00
Sep/15 100.00 strong 23.64 strong 126.45
Oct/15 77.81 strong 24.67 strong 328.51
Nov/15 100.00 strong 31.70 strong 244.42
Dec/15 100.00 strong 31.70 strong 224.32
Page 6 of 13 Rodrigues et al.
Acta Scientiarum. Agronomy, v. 42, e43518, 2020
The NP spatial dependence mean theoretical range parameter showed behavior similar to summer
(25.81 ± 14.91 m), winter (24.32 ± 8.47 m), spring (19.90 ± 11.90 m) and autumn (41.86 ± 41.46 m). The
lowest differences of the ranges among the seasons reveal that the influence of the seasonality of the
rainfall is not the main factor that affects the NP spatial variability, but rather, the semideciduous
behavior of the studied forest (up to 50% of the trees lose their leaves in the dry period) plays a large
role.
A strong spatial dependence for NP based on the SDD for all months could be observed (Table 4).
However, considering only the sill and nugget effect overestimated the spatial dependence structure in
this case.
Table 3. Exponential model parameters fitted to NP in the Atlantic forest remnant and their respective cross-validation
statistics.
Month C0 C1 a RME RESD
Jan/14 0.000 767.84 14.62 -0.0041 0.8785
Feb/14 0.000 34.77 13.53 -0.0004 0.9397
Mar/14 0.000 105.88 9.93 0.0003 0.9179
Apr/14* 0.000 0.01 25.00 -0.0041 0.9575
May/14 0.000 19.82 115.88 -0.0238 1.1196
Jun/14 0.000 0.64 23.76 0.0061 0.8952
Jul/14 0.000 68.65 25.34 -0.0034 0.9049
Aug/14 0.000 1.99 26.57 -0.0066 0.9751
Sep/14 0.000 9.77 21.58 0.0028 0.9726
Oct/14 0.000 153.98 43.15 0.0000 0.8576
Nov/14 0.000 699.30 18.01 -0.0017 0.8948
Dec/14 0.000 864.54 17.77 -0.0015 0.9141
Jan/15 0.000 169.43 33.50 -0.0030 0.9841
Feb/15 0.000 1621.42 45.07 0.0031 0.9240
Mar/15 0.000 671.24 38.22 -0.0143 1.0428
May/15 0.000 187.51 25.69 -0.0068 0.9099
Jun/15 0.000 27.90 18.99 -0.0009 0.8993
Aug/15 0.000 13.23 12.46 -0.0031 0.8704
Sep/15 0.000 634.06 35.85 0.0057 0.9631
Oct/15 0.000 8.17 15.83 -0.0034 0.9166
Nov/15 0.000 954.45 8.57 -0.0007 0.9154
Dec/15 0.000 1099.57 16.08 -0.0041 0.9380 *Data with logarithmic transformation.
Table 4. Spatial dependence degree (SDD), spatial dependence index (SDI) and practical range (r) of NP with the respective
classifications of the model structure.
Month SDD Classification SDI Classification r
Jan/14 100.00 strong 8.20 moderate 43.85
Feb/14 100.00 strong 7.59 moderate 40.58
Mar/14 100.00 strong 5.57 weak 29.79
Apr/14 100.00 strong 14.02 strong 75.00
May/14 100.00 strong 31.70 strong 115.88
Jun/14 100.00 strong 13.33 strong 71.29
Jul/14 100.00 strong 14.21 strong 76.01
Aug/14 100.00 strong 14.90 strong 79.71
Sep/14 100.00 strong 12.10 moderate 64.73
Oct/14 100.00 strong 24.20 strong 129.45
Nov/14 100.00 strong 10.10 moderate 54.03
Dec/14 100.00 strong 9.97 moderate 53.31
Jan/15 100.00 strong 18.79 strong 100.51
Feb/15 100.00 strong 25.28 strong 135.22
Mar/15 100.00 strong 21.44 strong 114.67
May/15 100.00 strong 14.41 strong 77.07
Jun/15 100.00 strong 10.65 moderate 56.96
Aug/15 100.00 strong 6.99 moderate 37.38
Sep/15 100.00 strong 20.11 strong 107.55
Oct/15 100.00 strong 8.88 moderate 47.48
Nov/15 100.00 strong 4.81 weak 25.71
Dec/15 100.00 strong 9.02 moderate 48.25
Soil water and precipitation spatial behavior Page 7 of 13
Acta Scientiarum. Agronomy, v. 42, e43518, 2020
The SDI better explained the spatial dependence of this hydrological variable. Therefore, a reduction of the spatial dependence degree structure based on SDI was predominately observed because nine situations were reclassified as ‘moderate’ and two as ‘weak’. This occurred because the practical range reached by the models is smaller than half of the maximum distances among points, showing that even though the spatial structure was well explained in the beginning of the semivariogram, the dependence relationship between the points does not reach large distances. Thus, the assessment of the spatial structure degree of the NP was more affected when considering the SPI formulation, since it accounts for more parameters that directly influence the spatial dependence. This result reinforces the need to increase the number of collectors, which should be made in shorter distances in the experimental area.
Mapping of the SWC and NP inside the Atlantic forest remnant
Table 5 presents the SWC and NP mean values calculated by the ordinary kriging procedure. Changing SWC values demands more time than NP because the former is influenced by several intrinsic factors, such as soil physical properties and water uptake by the plant roots, i.e., the influence of the climatic seasonality throughout the years is not a unique element to be taken into consideration. This is notable when one observes the relative variation of SWC and NP during the monitoring period (SWC and NP coefficients of variation among seasons were 12.11 and 66.45%, respectively). Furthermore, the summer of 2014 was severely affected by the weather anomalous period that affected southeastern Brazil (Coelho et al., 2016), which could be detected by the geostatistical study for SWC applied here. The maps generated by the ordinary kriging procedure are grouped in accordance with the season to compare their patterns of spatial distribution: summer (Figures 2 and 3), autumn (Figures 4 and 5), winter (Figures 6 and 7) and spring (Figures 8 and 9).
Table 5. Average SWC and NP for each season calculated by the ordinary kriging procedure.
Year Season SWC (mm) NP (mm)
2014
Summer 287.61±23.30 92.84±5.50
Autumn 268.84±23.78 41.24±2.98
Winter 252.15±23.83 21.01±1.17
Spring 279.11±27.73 134.32±6.76
2015
Summer 291.51±23.62 140.33±9.82
Autumn 210.72±16.66 21.88±2.04
Winter 217.17±17.75 44.66±3.69
Spring 241.75±23.71 132.32±7.35
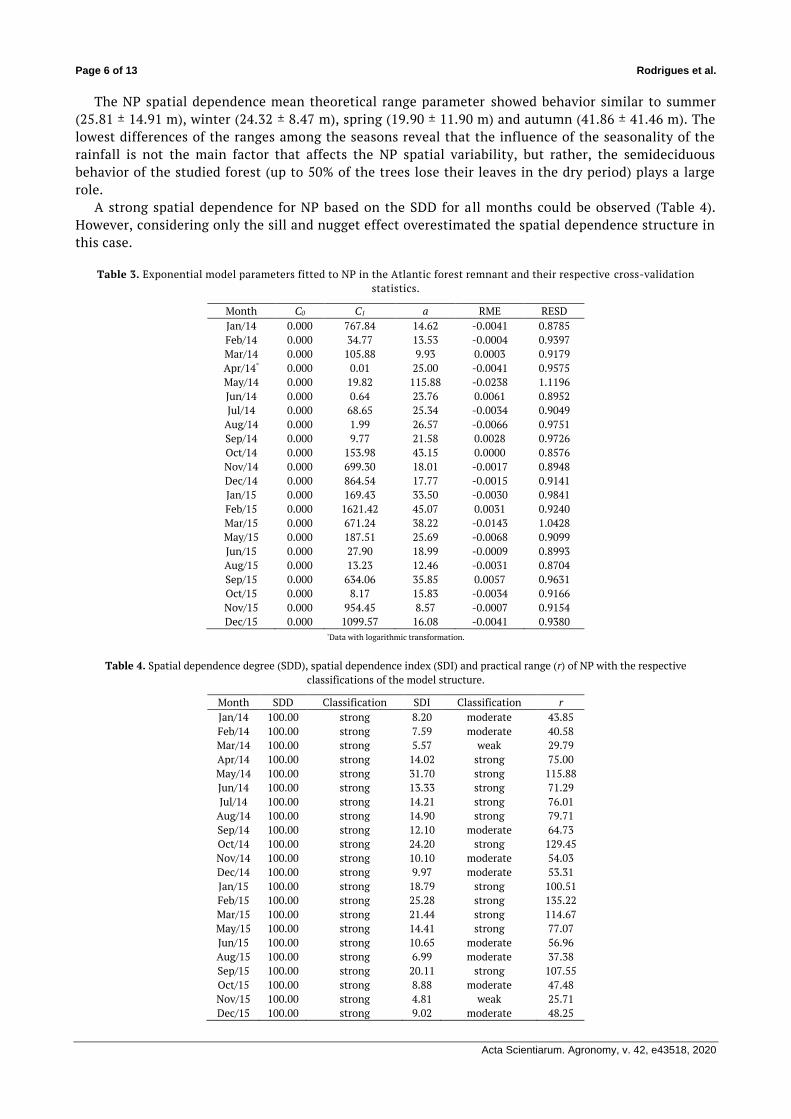
Figure 2. Soil water content (SWC) and net precipitation (NP) geostatistical interpolation (ordinary kriging map) for the summer of
2014. (a and d) January; (b and e) February; (c and f) March of SWC and NP, respectively, in an Atlantic forest remnant, Brazil.
Page 8 of 13 Rodrigues et al.
Acta Scientiarum. Agronomy, v. 42, e43518, 2020
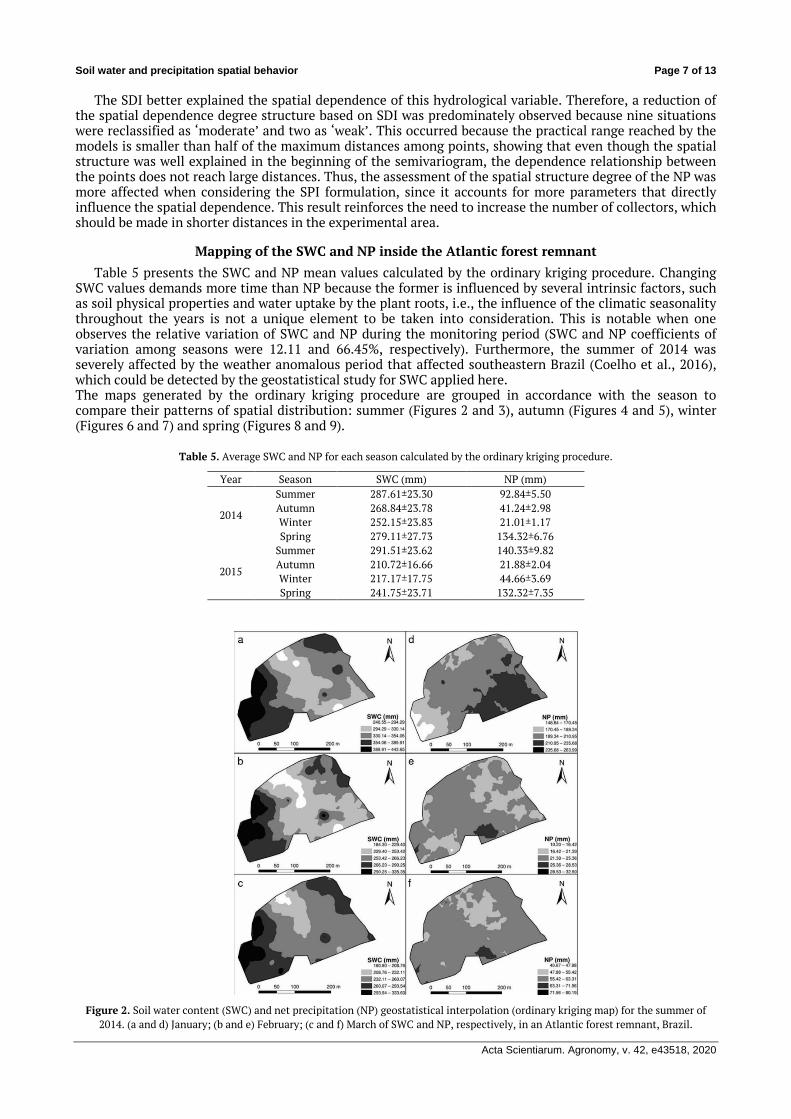
Figure 3. Soil water content (SWC) and net precipitation (NP) interpolation (ordinary kriging map) for the summer of 2015. (a and d)
January; (b and e) February; (c and f) March of SWC and NP, respectively, in an Atlantic forest remnant, Brazil.
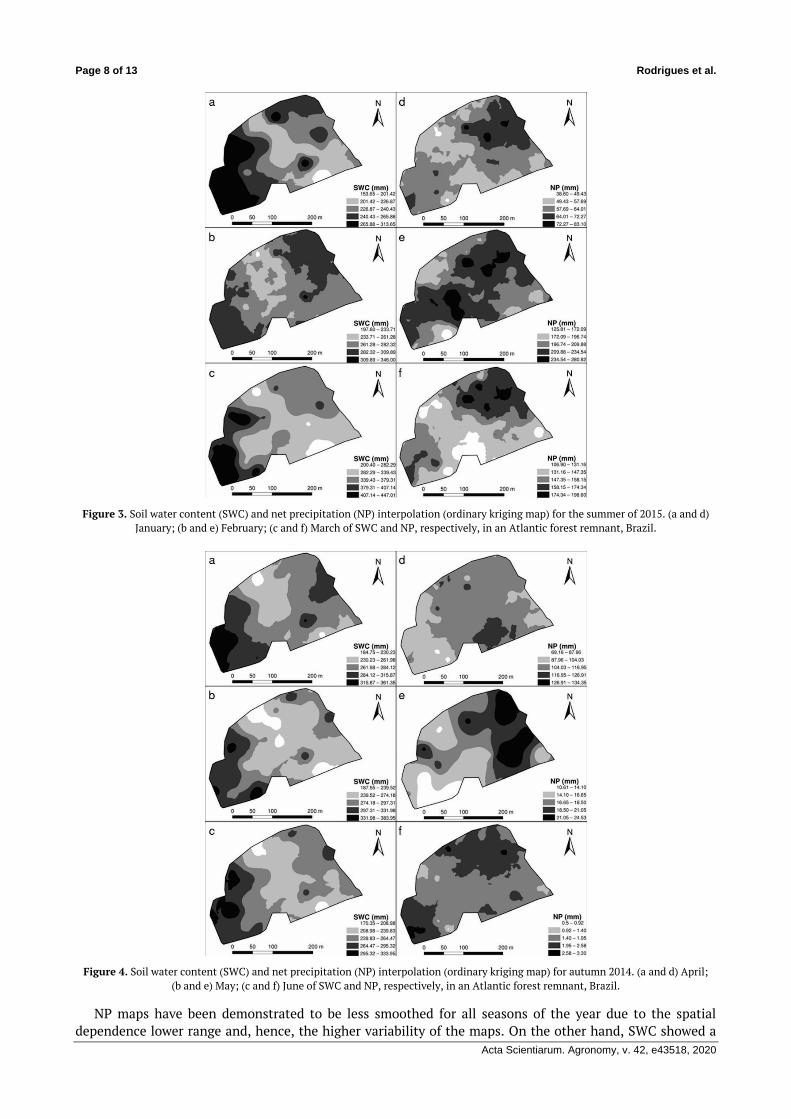
Figure 4. Soil water content (SWC) and net precipitation (NP) interpolation (ordinary kriging map) for autumn 2014. (a and d) April;
(b and e) May; (c and f) June of SWC and NP, respectively, in an Atlantic forest remnant, Brazil.
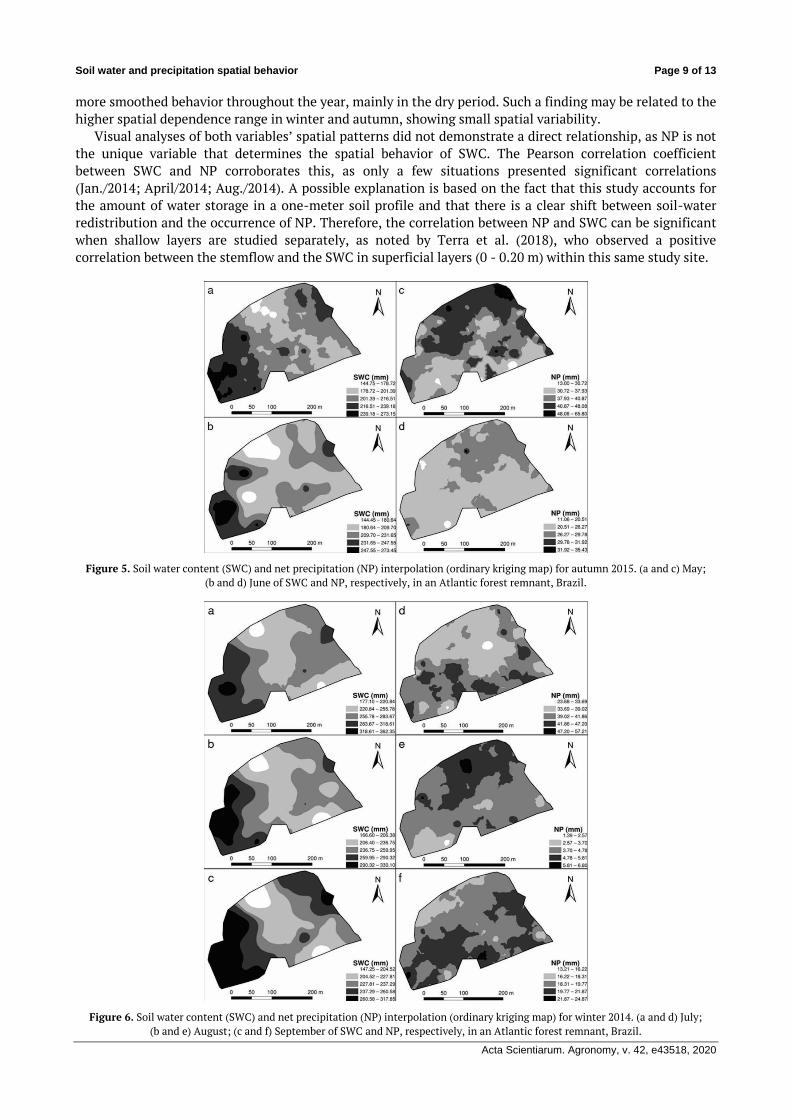
NP maps have been demonstrated to be less smoothed for all seasons of the year due to the spatial
dependence lower range and, hence, the higher variability of the maps. On the other hand, SWC showed a
Soil water and precipitation spatial behavior Page 9 of 13
Acta Scientiarum. Agronomy, v. 42, e43518, 2020
more smoothed behavior throughout the year, mainly in the dry period. Such a finding may be related to the
higher spatial dependence range in winter and autumn, showing small spatial variability.
Visual analyses of both variables’ spatial patterns did not demonstrate a direct relationship, as NP is not
the unique variable that determines the spatial behavior of SWC. The Pearson correlation coefficient
between SWC and NP corroborates this, as only a few situations presented significant correlations
(Jan./2014; April/2014; Aug./2014). A possible explanation is based on the fact that this study accounts for
the amount of water storage in a one-meter soil profile and that there is a clear shift between soil-water
redistribution and the occurrence of NP. Therefore, the correlation between NP and SWC can be significant
when shallow layers are studied separately, as noted by Terra et al. (2018), who observed a positive
correlation between the stemflow and the SWC in superficial layers (0 - 0.20 m) within this same study site.
Figure 5. Soil water content (SWC) and net precipitation (NP) interpolation (ordinary kriging map) for autumn 2015. (a and c) May;
(b and d) June of SWC and NP, respectively, in an Atlantic forest remnant, Brazil.
Figure 6. Soil water content (SWC) and net precipitation (NP) interpolation (ordinary kriging map) for winter 2014. (a and d) July;
(b and e) August; (c and f) September of SWC and NP, respectively, in an Atlantic forest remnant, Brazil.
Page 10 of 13 Rodrigues et al.
Acta Scientiarum. Agronomy, v. 42, e43518, 2020
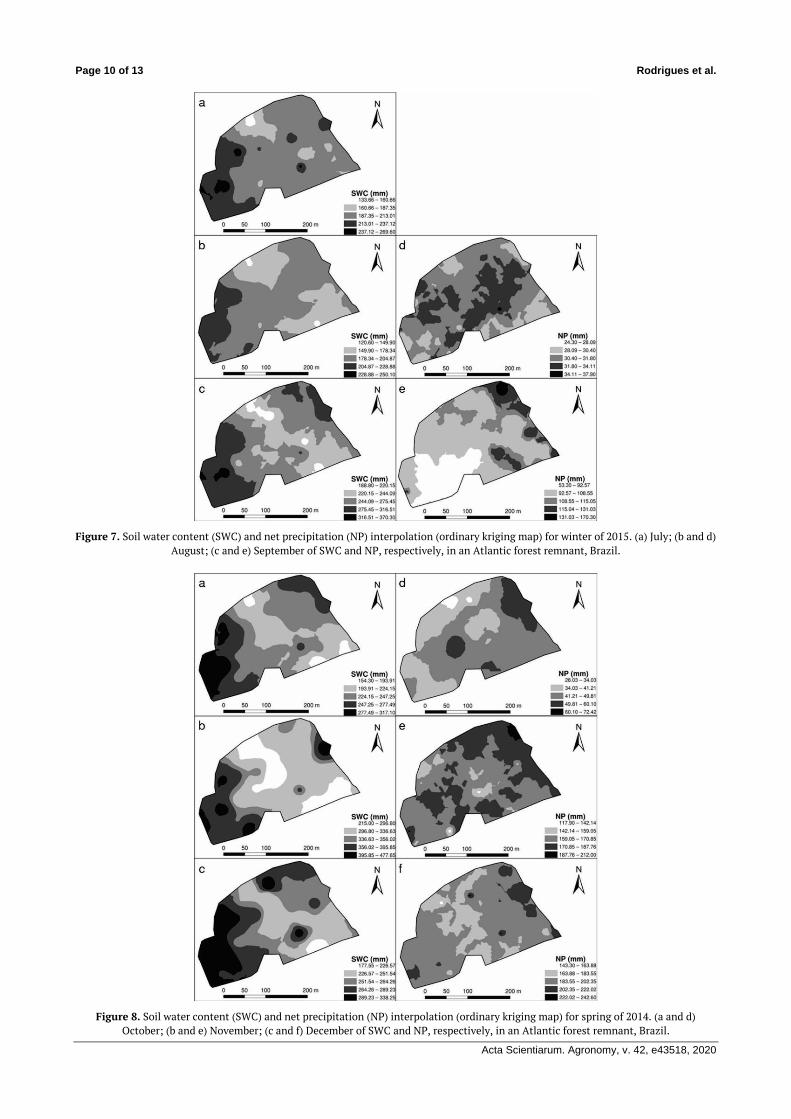
Figure 7. Soil water content (SWC) and net precipitation (NP) interpolation (ordinary kriging map) for winter of 2015. (a) July; (b and d)
August; (c and e) September of SWC and NP, respectively, in an Atlantic forest remnant, Brazil.
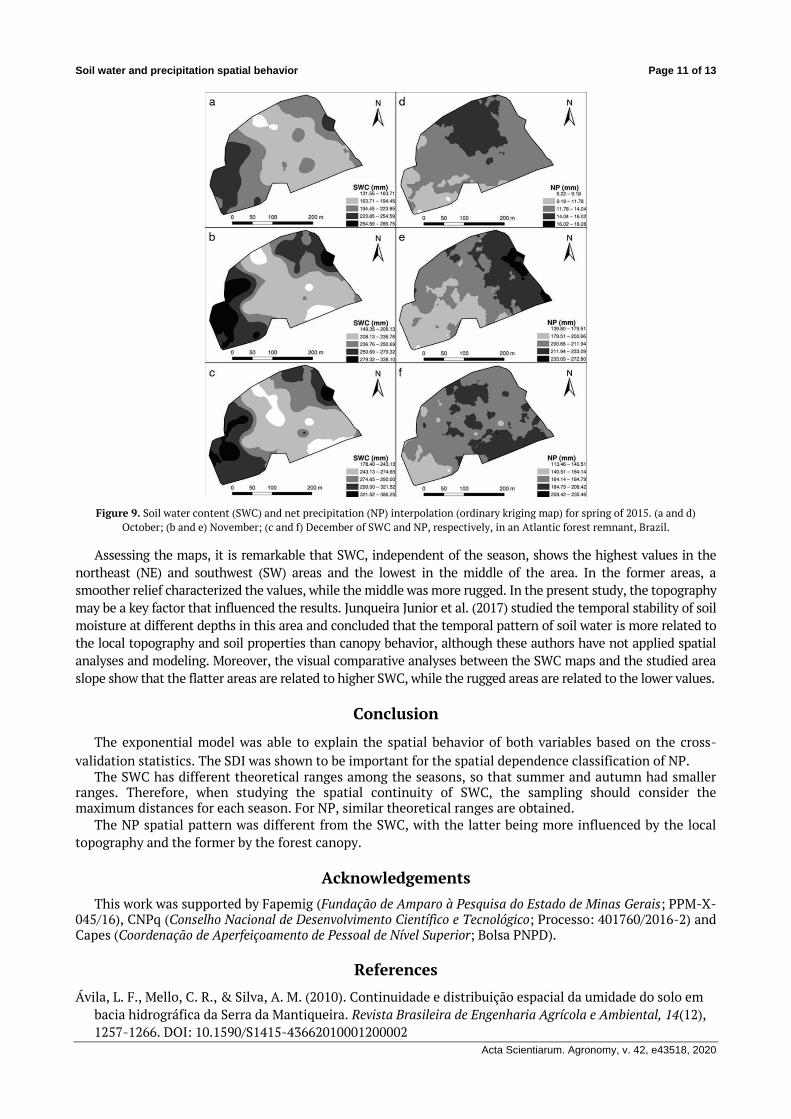
Figure 8. Soil water content (SWC) and net precipitation (NP) interpolation (ordinary kriging map) for spring of 2014. (a and d)
October; (b and e) November; (c and f) December of SWC and NP, respectively, in an Atlantic forest remnant, Brazil.
Soil water and precipitation spatial behavior Page 11 of 13
Acta Scientiarum. Agronomy, v. 42, e43518, 2020
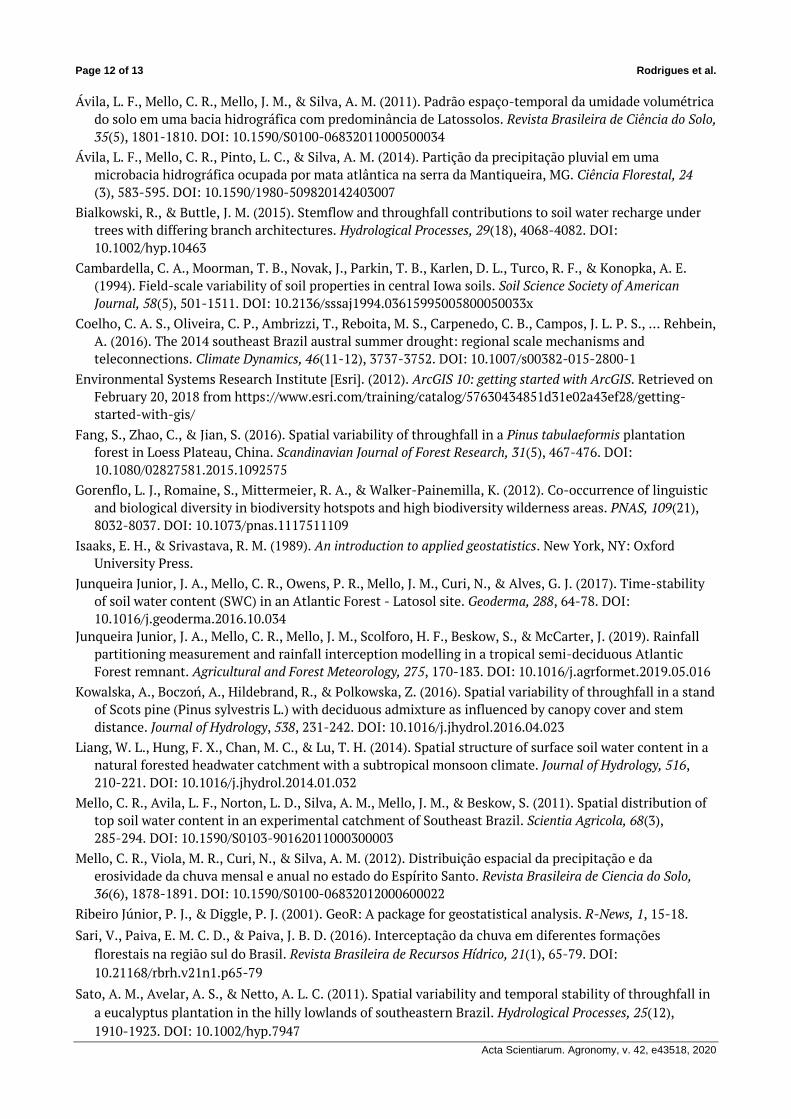
Figure 9. Soil water content (SWC) and net precipitation (NP) interpolation (ordinary kriging map) for spring of 2015. (a and d)
October; (b and e) November; (c and f) December of SWC and NP, respectively, in an Atlantic forest remnant, Brazil.
Assessing the maps, it is remarkable that SWC, independent of the season, shows the highest values in the
northeast (NE) and southwest (SW) areas and the lowest in the middle of the area. In the former areas, a
smoother relief characterized the values, while the middle was more rugged. In the present study, the topography
may be a key factor that influenced the results. Junqueira Junior et al. (2017) studied the temporal stability of soil
moisture at different depths in this area and concluded that the temporal pattern of soil water is more related to
the local topography and soil properties than canopy behavior, although these authors have not applied spatial
analyses and modeling. Moreover, the visual comparative analyses between the SWC maps and the studied area
slope show that the flatter areas are related to higher SWC, while the rugged areas are related to the lower values.
Conclusion
The exponential model was able to explain the spatial behavior of both variables based on the cross-
validation statistics. The SDI was shown to be important for the spatial dependence classification of NP. The SWC has different theoretical ranges among the seasons, so that summer and autumn had smaller
ranges. Therefore, when studying the spatial continuity of SWC, the sampling should consider the maximum distances for each season. For NP, similar theoretical ranges are obtained.
The NP spatial pattern was different from the SWC, with the latter being more influenced by the local
topography and the former by the forest canopy.
Acknowledgements
This work was supported by Fapemig (Fundação de Amparo à Pesquisa do Estado de Minas Gerais; PPM-X- 045/16), CNPq (Conselho Nacional de Desenvolvimento Científico e Tecnológico; Processo: 401760/2016-2) and Capes (Coordenação de Aperfeiçoamento de Pessoal de Nível Superior; Bolsa PNPD).
References
Ávila, L. F., Mello, C. R., & Silva, A. M. (2010). Continuidade e distribuição espacial da umidade do solo em
bacia hidrográfica da Serra da Mantiqueira. Revista Brasileira de Engenharia Agrícola e Ambiental, 14(12),
1257-1266. DOI: 10.1590/S1415-43662010001200002
Page 12 of 13 Rodrigues et al.
Acta Scientiarum. Agronomy, v. 42, e43518, 2020
Ávila, L. F., Mello, C. R., Mello, J. M., & Silva, A. M. (2011). Padrão espaço-temporal da umidade volumétrica
do solo em uma bacia hidrográfica com predominância de Latossolos. Revista Brasileira de Ciência do Solo,