94
Volume 34, N. 2 May-August 2011 Soils and Rocks An International Journal of Geotechnical and Geoenvironmental Engineering Soils and Rocks Volume 34, N.2 2011 ISSN 1980-9743 B M S

Volume 34, N. 2May-August 2011
Soils and RocksAn International Journal of Geotechnical
and Geoenvironmental Engineering
SOILS and ROCKS An International Journal of Geotechnical and Geoenvironmental Engineering
Volume 34, N. 2, May 2011-August
Table of Contents
Soils and R
ocks Volume 34, N
.2 2011
ISSN 1980-9743
BMS
ARTICLES
TECHNICAL NOTE
Kinetic Mass Transfer Model for Contaminant Migration in Soils
A Study on the Effects of MSW Fiber Content and Solid Particles Compressibilityon its Shear Strength Using a Triaxial Apparatus
Long-Term Efficiency of Zero-Valent Iron - Pumice Granular Mixturesfor the Removal of Copper or Nickel From Groundwater
Settlement of Floating Bored Piles in Brasília Porous Clay
Adriana de Souza Forster Araújo, Izabella Christynne Ribeiro Pinto Valadão,José Adilson de Castro, Alexandre José da Silva, Elizabeth Ritter 101
Sandro Lemos Machado, Mehran Karimpour-Fard 115
N. Moraci, P.S. Calabrò, P. Suraci 129
W. Patrick Stewart, Renato P. Cunha, Neusa M.B. Mota 153
Back Analysis of a Landslide in a Residual Soil Slope in Rio de Janeiro, Brazil
Evaluation of Rockfall Hazard Along Brazil Roads
Denise Maria Soares Gerscovich, Eurípedes do Amaral Vargas Jr., Tacio Mauro Pereira de Campos 139
Guilherme José Cunha Gomes, Frederico Garcia Sobreira, Milene Sabino Lana 163
CASE HISTORY

Executive BoardLuís N. Lamas Lázaro V. Zuquette Fernando SchnaidLNEC, Portugal University of São Paulo, Brazil Federal Univ. Rio Grande do Sul, Brazil
José M.M.Couto MarquesUniversity of Porto, Portugal
Associate EditorsH. Einstein E. Maranha das Neves Harry G. PoulosMIT, USA Lisbon Technical University, Portugal University of Sidney, Australia
John A. Hudson Nielen van der Merve Niek RengersImperial College, UK University of Pretoria, South Africa ITC, The Netherlands
Kenji Ishihara Paul Marinos Fumio TatsuokaUniversity of Tokyo, Japan NTUA, Greece Tokyo University of Science, Japan
Michele Jamiolkowski James K. Mitchell Luiz González de VallejoStudio Geotecnico Italiano, Italy Virginia Tech., USA UCM, Spain
Willy A. Lacerda Lars PerssonCOPPE/UFRJ, Brazil SGU, Sweden
Editorial Board MembersClaudio P. Amaral R. Jonathan Fannin João MarcelinoPontifical Catholic University, Brazil University of British Columbia, Canada LNEC, Portugal
Roberto F. Azevedo Manuel M. Fernandes António C. MineiroFederal University of Viçosa, Brazil University of Porto, Portugal New University of Lisbon, Portugal
Nick Barton Sérgio A.B. Fontoura Teruo NakaiConsultant, Norway Pontifical Catholic University, Brazil Nagoya Inst. Technology, Japan
Richard J. Bathurst Roger Frank Claudio OlallaRoyal Military College of Canada LCPC, France CEDEX, Spain
Frederick Baynes Maria H.B.O. Frascá Antonio M.S. OliveiraBaynes Geologic Ltd., Australia IPT, Brazil University of Guarulhos, Brazil
Pierre Bérest Carlos D. Gama Ennio M. PalmeiraLCPC, France Lisbon Technical University, Portugal University of Brasilia, Brazil
Omar Y. Bitar Vinod Garga José D. RodriguesIPT, Brazil University of Ottawa, Canada Consultant, Portugal
Helmut Bock Nuno Grossmann R. Kerry RoweQ+S Consult, Germany LNEC, Portugal Queen’s University, Canada
Laura Caldeira Richard J. Jardine Rodrigo SalgadoLNEC, Portugal Imperial College, UK University of Purdue, USA
Tarcisio Celestino Milton Kanji Sandro S. SandroniUniversity of São Paulo-SC, Brazil University of São Paulo, Brazil Consultant, Brazil
António S. Cardoso Peter Kaiser Luís R. SousaUniversity of Porto, Portugal Laurentian University, Canada University of Porto, Portugal
Chris Clayton Luís L. Lemos Fabio TaioliUniversity of Surrey, UK University of Coimbra, Portugal University of São Paulo, Brazil
António G. Coelho José V. Lemos Luis ValenzuelaConsultant, Portugal LNEC, Portugal Consultant, Chile
Nilo C. Consoli Willy A. Lacerda Ricardo VedovelloFederal Univ. Rio Grande do Sul, Brazil COPPE/UFRJ, Brazil São Paulo Geological Institute, Brazil
António G. Correia Serge Leroueil Andrew WhittleUniversity of Minho, Portugal University of Laval, Canada MIT, USA
Rui M. Correia Robert Mair Jorge G. ZornbergLNEC, Portugal University of Cambridge, UK University of Texas/Austin, USA
Roberto Q. Coutinho Mario ManasseroFederal Univ. of Pernambuco, Brazil Politécnico di Torino, Italy
António P. Cunha He ManchaoLNEC, Portugal CUMT, China
SOILS and ROCKSAn International Journal of Geotechnical and Geoenvironmental Engineering
Editor André Pacheco de Assis - University of Brasilia, Brazil
Co-editor Ricardo Oliveira - COBA, Portugal

Soils and Rocks
1978, 1 (1, 2)1979, 1 (3), 2 (1,2)1980-1983, 3-6 (1, 2, 3)1984, 7 (single number)1985-1987, 8-10 (1, 2, 3)1988-1990, 11-13 (single number)1991-1992, 14-15 (1, 2)1993, 16 (1, 2, 3, 4)1994-2010, 17-33 (1, 2, 3)2011, 34 (1, 2
ISSN 1980-9743 CDU 624.131.1
Soils and Rocks publishes papers in English in the broad fields of Geotechnical Engineering, Engineering Geology and Geo-environmental Engineering. The Journal is published in April, August and December. Subscription price is US$ 90.00 per year. The jour-nal, with the name “Solos e Rochas”, was first published in 1978 by the Graduate School of Engineering, Federal University of Rio deJaneiro (COPPE-UFRJ). In 1980 it became the official magazine of the Brazilian Association for Soil Mechanics and Geotechnical Engi-neering (ABMS), acquiring the national character that had been the intention of its founders. In 1986 it also became the official Journal ofthe Brazilian Association for Engineering Geology and the Environment (ABGE) and in 1999 became the Latin American GeotechnicalJournal, following the support of Latin-American representatives gathered for the Pan-American Conference of Guadalajara (1996). In2007 the journal acquired the status of an international journal under the name of Soils and Rocks, published by the Brazilian Associationfor Soil Mechanics and Geotechnical Engineering (ABMS), Brazilian Association for Engineering Geology and the Environment(ABGE) and Portuguese Geotechnical Society (SPG). In 2010, ABGE decided to publish its own journal and left the partnership.

ARTICLESKinetic Mass Transfer Model for Contaminant Migration in SoilsAdriana de Souza Forster Araújo, Izabella Christynne Ribeiro Pinto Valadão, José Adilson de Castro,
Alexandre José da Silva, Elizabeth Ritter 101
A Study on the Effects of MSW Fiber Content and Solid Particles Compressibility on its Shear Strength Usinga Triaxial Apparatus
Sandro Lemos Machado, Mehran Karimpour-Fard 115
Long-Term Efficiency of Zero-Valent Iron - Pumice Granular Mixtures for the Removal of Copper or NickelFrom Groundwater
N. Moraci, P.S. Calabrò, P. Suraci 129
Back Analysis of a Landslide in a Residual Soil Slope in Rio de Janeiro, BrazilDenise Maria Soares Gerscovich, Eurípedes do Amaral Vargas Jr., Tacio Mauro Pereira de Campos 139
TECHNICAL NOTESettlement of Floating Bored Piles in Brasília Porous ClayW. Patrick Stewart, Renato P. Cunha, Neusa M.B. Mota 153
CASE HISTORYEvaluation of Rockfall Hazard Along Brazil RoadsGuilherme José Cunha Gomes, Frederico Garcia Sobreira, Milene Sabino Lana 163
ISSN 1980-9743
SOILS and ROCKSAn International Journal of Geotechnical and Geoenvironmental Engineering
Publication ofABMS - Brazilian Association for Soil Mechanics and Geotechnical Engineering
SPG - Portuguese Geotechnical SocietyVolume 34, N. 2, May-August 2011
Table of Contents


Articles
Soils and Rocksv. 34, n. 2


Kinetic Mass Transfer Model for Contaminant Migrationin Soils
Adriana de Souza Forster Araújo, Izabella Christynne Ribeiro Pinto Valadão,José Adilson de Castro, Alexandre José da Silva, Elizabeth Ritter
Abstract. This work studied the transport phenomena in the soil of the Gramacho MSW landfill located in Rio de Janeiro,Brazil. A model was proposed to determine the mass transfer rate of the leachate contaminant ions to the soil particles.Previous researchers have focused on the diffusion and sorption phenomena using simple relations that do not completelyexplain the data of overall mass transfer obtained by laboratory experiments. Thus, this work proposes a modified rateequation implemented into MPHMTP software that takes into account the combined mechanisms of advection anddiffusion in the leachate and sorption at the particle surface followed by diffusion in the interior of the soil particle. Themodel predictions were compared with laboratory-measured data and presented better agreement compared to thoseobtained using the commercial POLLUTE software.Keywords: diffusion, sorption, chemical kinetic, leachate, landfill, mass transfer.
1. Introduction
In Brazil, the system of management for urban solidresidue uses the landfill as an economically suitable solu-tion for the final solid waste disposal. Landfill leachate isproduced by the degradation of waste and the movement ofrainwater that occurs within disposed layers. When it isdrained from the landfill, the leachate contains dissolvedand suspended materials that interact with soil particles, de-pending on the soil physical and chemical characteristics.The leachate properties vary depending on the waste andthe age of the landfill, which makes it difficult to treat be-cause it may contain many chemical compounds that, underthe influence of natural agents (rain and microorganisms),generate contaminants that are difficult to mitigate.
According to some authors (Bear, 1972; Gelhar,1993; Domenico & Schwartz, 1998; Fetter, 1999), thegroundwater transport of contaminants has been one of themost important research topics in hydrology and engineer-ing in the recent decades. Such studies aimed to find meth-odologies able to reduce possible social and ecologicalimpacts due to waste disposal. To date, the fate of contami-nants into soil is still receiving considerable attention due tothe impact on several ecosystems.
The migration of contaminant ions into the soil is in-fluenced by several processes that can be physical (advec-tion and hydrodynamic dispersion), chemical (sorption,complexation and precipitation) and biological (degrada-tion by biotic or abiotic factors). Several researchers have
addressed the contamination phenomenon by differenttechniques (Goodall & Quigley, 1977, Rowe, 1988, Baroneet al., 1989, Schakelford & Daniel, 1991, Mitchell, 1994,Ehrlich et al., 1994, Barbosa et al., 1996, Boscov et al.,1999, Leite & Paraguassu, 2002, Azevedo et al., 2003).Mostly, the focus of these studies has been the pollutanttransport mechanisms through artificial barriers or naturalsoil with the aims of elucidating the complex phenomenaand developing new technologies to mitigate or minimizeenvironmental impacts.
The study of contaminant transport into the soil has,so far, been carried out based on the assumption that hy-draulic conductivity is the main phenomenon responsiblefor the infiltration of the contaminant. However, experi-mental investigations have evidenced that the moleculardiffusion process is a significant transport mechanism and,for practical applications, cannot be neglected (Crooks &Quigley, 1984, Quigley et al., 1987, Johnson et al., 1989).Depending on the contaminant species, the chemical pro-cess may be relevant, and complex chemical reactions willtake place. To take into consideration and identify the rele-vant phenomena coupled with fluid flow and mass transfer,comprehensive mathematical models have been developed.However, most of the models treat individual and simpli-fied phenomena (Liu et al., 2000). Therefore, mathematicalformulations that consider complex transport mechanismsand chemical kinetics (Ehrlich and Ribeiro, 1995) have yetto be developed. In this paper a mathematical model to pre-
Soils and Rocks, São Paulo, 34(2): 101-113, May-August, 2011. 101
Adriana de Souza Forster Araújo, D.SC., Fellow of the National Post Doctorate/CAPES, Universidade Federal Fluminense, Volta Redonda, RJ, Brazil. e-mail:[email protected] Christynne Ribeiro Pinto Valadão, D.SC., Fellow of the National Post Doctorate/CAPES, Universidade Federal Fluminense, Volta Redonda, RJ, Brazil. e-mail:[email protected]é Adilson de Castro, Ph.D., Associate Professor, Universidade Federal Fluminense, Volta Redonda, RJ, Brazil. e-mail: [email protected] José da Silva, Dr. Ing., Associate Professor, Universidade Federal Fluminense, Volta Redonda, RJ, Brazil. e-mail: [email protected] Ritter, D.SC., Associate Professor, Universidade do Estado do Rio de Janeiro, Rio de Janeiro, RJ, Brazil. [email protected] on April 30, 2010; Final Acceptance on October 27, 2010; Discussion open until December 30, 2011.

dict the mass transport within the landfill soil is proposedand validated with experimental data.
Studies carried out on the soil and leachate of theGramacho Municipal solid waste (MSW) located at Duquede Caxias city, Rio de Janeiro State, Brazil, have consid-ered only the mechanisms of sorption and diffusion of ionsfrom leachate to the soil and vice versa (Barbosa, 1994;Ritter, 1998, Ritter et al., 1999, Ritter & Campos, 2006).The experimental data from diffusion tests with non-reactive chloride and sodium ions and reactive potassiumand ammonium ions have shown a good fit with thePOLLUTE software (Rowe & Booker, 1994), which basesthe calculations on isothermal sorption theory. In contrast,experiments carried out with calcium ion have not yielded agood fit, indicating that these mechanisms are not the pre-dominant ones.
This research focuses on the transport process andaims to predict the kinetics of mass transfer in a landfill soil(Araújo, 2006). It is expected that phenomenological mod-els will better reproduce the behavior of contaminants inthese environments. A software termed MPHMTP (MultiPhase Heat and Mass Transfer Program), developed byCastro (2000), was used in this study. The software allowsthe implementation of transport equations of contaminantsin the soil, taking into consideration the coupled mass trans-fer phenomena (advection, diffusion, sorption and chemi-cal reactions).
The model proposed in this work was applied to theexperimental data obtained by Ritter & Gatto (2003) andcompared with simulation results presented by Pinto(2004).
2. Experimental Data
2.1. Experimental program history
The Gramacho Metropolitan Landfill occupies anarea of 1.2 km2 and is situated in a region of mangroves onthe shores of the Guanabara Bay, close to the Sarapuí andIguaçu rivers, over an organo-saline clay deposit, perma-nently submerged. The Gramacho MSW has been under re-cuperation since 1996, and several remediation actions toavoid contamination have been implemented. These ac-tions are mainly a lateral channel that receives the leachateand a lateral trench, filled with the local organic clay, in theperimeter of the landfill, to compose a leachate collectionsystem (Ritter & Campos, 2006). The trench was excavatedvery deeply to reach the local foundation organic clay. Ta-bles 1 and 2 show, respectively, the experimentally deter-mined parameters for the soil and leachate from the landfill(Barbosa, 1994, Ritter et al, 2004).
Previous studies emphasized the importance of salin-ity on the transport of contaminants through the landfillfoundation (Barbosa, 1994 and Barbosa et al. 1996). It wasidentified by diffusion experiments with leachate that theleachate establishes a flow of chemical species in both di-
rections (for the soil leachate and vice versa). Chloride, so-dium, calcium and magnesium diffuse from soil to leachatebecause these ions have high concentrations in the salineorganic soil (see Table 2); conversely, potassium has ahigher concentration in the leachate compared to landfillsoil. Barbosa (1994) evaluated the diffusion process in thesoil of Gramacho’s landfill using the software POLLUTE,where the effective diffusion coefficients of most importantions were estimated. It was verified that the Cl- and SO4
2-
anions can be considered conservative species. The resultsfor Na+ and Mg2+, assuming no sorption for these ions,agreed well with experimental data obtained in sorptionand diffusion experiments carried on a laboratory scale. ForK+ and Ca2+, using Pollute software, the model predictionsshowed large divergence from experimental ones, indicat-ing that sorption theory may not be applicable to predict themigration of these ions.
3. Model Formulation
In a multiphase flow, the chemical species are mixed,and thus, it is possible to describe the presence of each ionby its molar or mass fractions. A general transport equationthat takes into account the contaminant concentrationwithin the soil and leachate is presented by Eq. (1):
� � � �
��
�� � �
��
��
��
( )( )i i k
j
i i j k
j
k
jt xu
x xS
k� �
�
�
�
�� � k(1)
102 Soils and Rocks, São Paulo, 34(2): 101-113, May-August, 2011.
Araújo et al.
Table 1 - Characterization of soil.
Fraction < 5 �m (%) 70
Moisture content (%) 140 a 170
Liquid limit (%) 167
Plasticity limit (%) 77
Porosity ~0.70 a 0.80
Density of grains 2.41
Plasticity index (PI) (%) 90
Table 2 - Chemical composition of the leachate and pore water.
Chemical analysis Leachate Pore water
pH 7.9 8.26
Conductivity (mS.cm-1) 24.4 22.1
Cl- (mg.L-1) 4367 6105
Na+ (mg.L-1) 3089 4475
K+ (mg.L-1) 1681 543
NH4
+ (mg/L) 1815 92
Ca+2 (mg/L) 203 365
Mg+2 (mg/L) 92 850
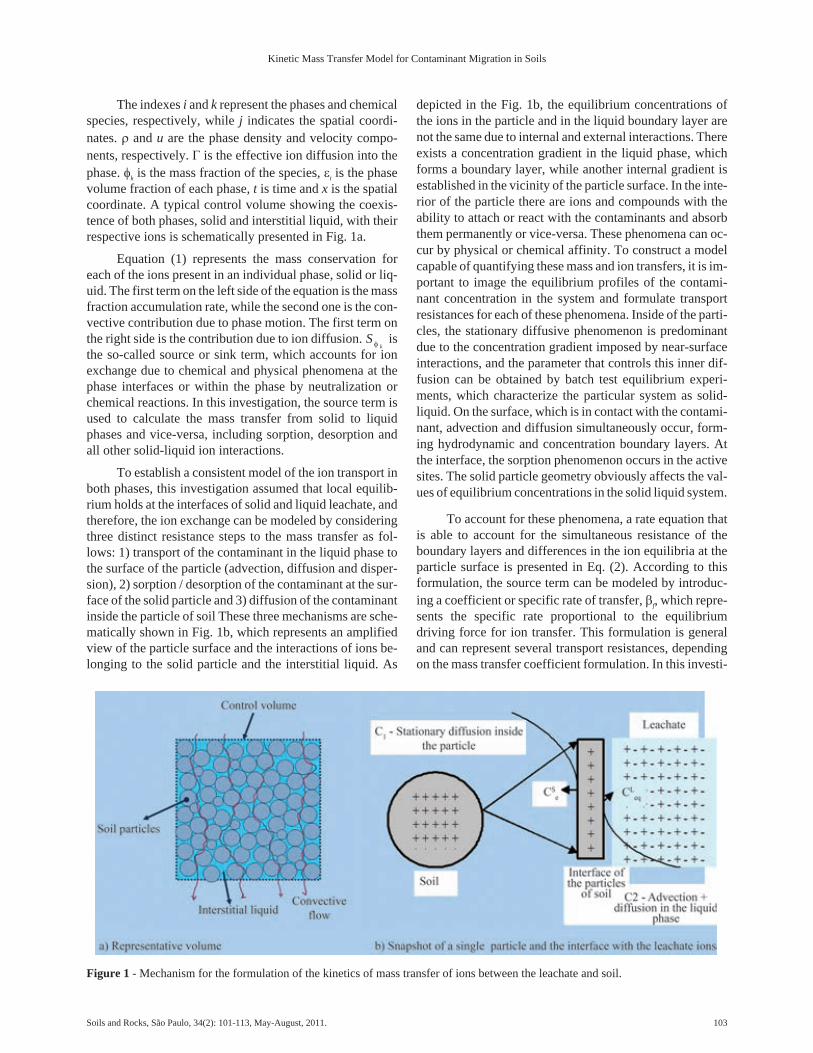
The indexes i and k represent the phases and chemicalspecies, respectively, while j indicates the spatial coordi-nates. � and u are the phase density and velocity compo-nents, respectively. � is the effective ion diffusion into thephase. �k is the mass fraction of the species, �i is the phasevolume fraction of each phase, t is time and x is the spatialcoordinate. A typical control volume showing the coexis-tence of both phases, solid and interstitial liquid, with theirrespective ions is schematically presented in Fig. 1a.
Equation (1) represents the mass conservation foreach of the ions present in an individual phase, solid or liq-uid. The first term on the left side of the equation is the massfraction accumulation rate, while the second one is the con-vective contribution due to phase motion. The first term onthe right side is the contribution due to ion diffusion. S
k� isthe so-called source or sink term, which accounts for ionexchange due to chemical and physical phenomena at thephase interfaces or within the phase by neutralization orchemical reactions. In this investigation, the source term isused to calculate the mass transfer from solid to liquidphases and vice-versa, including sorption, desorption andall other solid-liquid ion interactions.
To establish a consistent model of the ion transport inboth phases, this investigation assumed that local equilib-rium holds at the interfaces of solid and liquid leachate, andtherefore, the ion exchange can be modeled by consideringthree distinct resistance steps to the mass transfer as fol-lows: 1) transport of the contaminant in the liquid phase tothe surface of the particle (advection, diffusion and disper-sion), 2) sorption / desorption of the contaminant at the sur-face of the solid particle and 3) diffusion of the contaminantinside the particle of soil These three mechanisms are sche-matically shown in Fig. 1b, which represents an amplifiedview of the particle surface and the interactions of ions be-longing to the solid particle and the interstitial liquid. As
depicted in the Fig. 1b, the equilibrium concentrations ofthe ions in the particle and in the liquid boundary layer arenot the same due to internal and external interactions. Thereexists a concentration gradient in the liquid phase, whichforms a boundary layer, while another internal gradient isestablished in the vicinity of the particle surface. In the inte-rior of the particle there are ions and compounds with theability to attach or react with the contaminants and absorbthem permanently or vice-versa. These phenomena can oc-cur by physical or chemical affinity. To construct a modelcapable of quantifying these mass and ion transfers, it is im-portant to image the equilibrium profiles of the contami-nant concentration in the system and formulate transportresistances for each of these phenomena. Inside of the parti-cles, the stationary diffusive phenomenon is predominantdue to the concentration gradient imposed by near-surfaceinteractions, and the parameter that controls this inner dif-fusion can be obtained by batch test equilibrium experi-ments, which characterize the particular system as solid-liquid. On the surface, which is in contact with the contami-nant, advection and diffusion simultaneously occur, form-ing hydrodynamic and concentration boundary layers. Atthe interface, the sorption phenomenon occurs in the activesites. The solid particle geometry obviously affects the val-ues of equilibrium concentrations in the solid liquid system.
To account for these phenomena, a rate equation thatis able to account for the simultaneous resistance of theboundary layers and differences in the ion equilibria at theparticle surface is presented in Eq. (2). According to thisformulation, the source term can be modeled by introduc-ing a coefficient or specific rate of transfer, �f, which repre-sents the specific rate proportional to the equilibriumdriving force for ion transfer. This formulation is generaland can represent several transport resistances, dependingon the mass transfer coefficient formulation. In this investi-
Soils and Rocks, São Paulo, 34(2): 101-113, May-August, 2011. 103
Kinetic Mass Transfer Model for Contaminant Migration in Soils
Figure 1 - Mechanism for the formulation of the kinetics of mass transfer of ions between the leachate and soil.
gation a kinetic rate constant is introduced to account forthe mass transfer resistance at the particle surface andchemical control. This is equivalent to the linear sorptionisotherm when the exponent of the driving concentration isunitary and the equilibrium concentration at the interface isconstant. Thus, it is possible to consider a general isothermformulation. Therefore, in this model, the general rateequation for mass transfer is proposed, as follows:
S k Ak k k s l l l k k
n� � �� � � � �� �� [ ][ ]* (2)
where kk� is the kinetic constant for the transfer of k ion, As-l
is the interfacial area between solid and liquid,�� kis the ef-
fective mass transfer coefficient of the k ion and �k* is the in-
terface equilibrium concentration of the k ion. The expo-nent coefficient in Eq. (2) represents a generalization forthe description of the equilibrium behavior at the interface;in the particular case where n = 1 it will represent the classi-cal formulation for the linear sorption rate. These parame-ters can be numerically optimized to reproduce the experi-mental data and thus can be used to predict temporal andspatial contamination profiles. The contact between solidparticles and interstitial liquid and the effective mass trans-fer coefficient can be determined by Eqs. (3) and (4):
Ads l
s
s s� �
6�
�(3)
���
�
k
kShD
d
l
s s
� (4)
in which, Sh, the Sherwood number, is given by
Sh R Sce k�117 0 585 1 3. ( ) ( ). /
� (5)
with Reynolds and Schmidt numbers given by Eqs.(6) and (7),
RU U d
el l l s s s
l
��� � �
�
| | ( )� �
(6)
ScDk
k
l
ll�
�
�
�� (7)
The variables and symbols used in the above equa-tions are listed in Table 3.
3.1. MPHMTP Software
The software (MPHMTP – Multi Phase Heat andMass Transfer Program) was developed by Castro (2000),coded in Fortran 90/95. The software uses different moduleinterfaces for input data, geometry construction, phaseproperties, boundary, initial condition settings and outputdata customizations. The rate transfer equations are imple-mented into a specific module with flexibility for user sup-ply expression for rate transfer depending on the ionconsidered. The user interfaces are subroutines that must beimplemented and customized by the user. The software
solves the complete transport equation for a generic speciesor ion, and the transfer coefficients together with the sourceterms are calculated interactively by an external subroutinefurnished by the user. The numerical solution is based onthe Finite Volume Method (FVM), and the time integrationis based on the fully implicit formulation (Patankar, 1985).The solution is obtained for a generalized coordinate sys-tem, which allows perfect adjustment of the calculation do-main to complex geometries of the soil layers in thelandfill. The discrete algebraic equations are solved usingthe ADI-TDMA algorithm (Alternate Direction IterationTri-Diagonal Matrix algorithm). The properties and sourceterm definitions subroutine allows the user to consider ev-ery kind of media, such as non-uniform soil or differentconfigurations of soils layers with different properties. Inthe source term module, the user can add new routines tocalculate the local mass transfer rates of each control vol-ume within the domain.
4. Results and Discussions
As discussed in the model features, experimental datawere used to determine the model parameters accountingfor the mass transfer phenomena. Two laboratory scale ex-periments were performed: the equilibrium batch tests anddiffusion tests. The equilibrium experiments were used todetermine the equilibrium concentration of each soil-lea-chate system. Using the MPHMTP software, the input pa-rameters obtained from laboratory diffusion tests, the ge-ometry of the experimental apparatus and the initialconditions, the simulations were carried out for each ion toobtain the best fit for the model parameters. Table 4 pres-ents the results of the equilibrium tests and model parame-ters determined in this study. The results presented in Table4 were obtained by iterative refinement until the numerical
104 Soils and Rocks, São Paulo, 34(2): 101-113, May-August, 2011.
Araújo et al.
Table 3 - Variables and symbols used in the above equations.
Variables Units
�sSolid phase volumetric fraction
�iLiquid phase volumetric fraction
ds m Soil particles average diameter
�s Soil particles form factor
��km.s-1 Mass transfer coefficient
Dk
l� m2.year-1 Chemical species diffusion coefficient
i, in the liquid phase
Re Reynolds number changed betweenthe liquid and solid phases
Sck� Schmidt number
�lkg.m-3 Liquid phase density
Ul m.s-1 Velocity in the liquid phase
Us m.s-1 Velocity in the solid phase
�lPa.s Liquid phase viscosity

and experimental results showed close agreement, with theexception of De, which assumed the values of D0 for a freedilute solution in water (Lerman, 1979). Therefore, in thismodel effective diffusion coefficients were not used; on thecontrary, all the effects of ions interactions with the mediawere regarded as source terms. This was done due to theability of the model to deal with specific phenomena. Thisapproach has the advantage of quantifying the separate pro-cess. In the numerical procedure, the criterion used to stopthe calculations was the lowest global error for all speciesconsidered. The experiments were carried out for 72 h fordiffusion cells and 48 h for bath equilibrium experiments.The model was used to reproduce the whole experimentalprocedure, and the final concentrations were compared foreach ion prediction.
The model predictions were divided into reactive andnon-reactive ones. The non-reactive ions can be accuratelypredicted by linear sorption isotherms, while the reactiveones usually present a complex behavior. This model wasintended to show that both behaviors can be accurately pre-dicted by this formulation.
4.1. Non-reactive ions
Figures 2a and 2b show the profiles of ion diffusion inthe experimental Barone cell for Cl- and Na+, regarded asnon-reactive ions for comparisons with experimental dataand previous models used in POLLUTE software and sorp-tion isotherms. In these figures are also shown the referenceconcentration values for soil and leachate that are assumedas initial conditions for the calculations. The POLLUTEsoftware can predict only the soil domain; in contrast, theMPHMTP considers both connected domains, the soil andreservoir, and does not need to impose boundary conditionson the soil reservoir interface, as required by POLLUTE.This software feature avoids additional assumptions re-garding the surface boundary conditions. Although in thecase of non-reactive ions the formulations for both softwareare essentially the same, due to the more realistic treatmentof the interface between soil and reservoir, the MPHMTPpresents closer agreement with the experimental data con-sidering both formulations, sorption isotherms (UFF sorp-tion model) and present formulation (UFF kinetic model).Inside of the reservoir, the diffusion of ions occurs in freesolution, and the ion concentration profile is determined bythe diffusion into the liquid phase until the equilibrium con-dition is achieved at the soil reservoir interface. Althoughthe liquid concentration gradients were not measured, thepresent model seemed to better reproduce the liquid con-centration profile and did not present discontinuity in theinterstitial liquid concentrations at the soil reservoir inter-face. For the chloride ion, the value of the effective diffu-sion coefficient (De) was assumed to be equal the diffusioncoefficient in free solution (D0) for ions in aqueous solutionat 25 °C, according to the literature (0.064 m2/year). In this
Soils and Rocks, São Paulo, 34(2): 101-113, May-August, 2011. 105
Kinetic Mass Transfer Model for Contaminant Migration in Soils
Table 4 - Best fitting of model parameters obtained by numericalsimulations.
Ion k �k* (mg/L) n De (m2/year)
Cl- 2*10-6 5372.4 1.05 0.064
Na+ 3*10-9 5012.0 1.50 0.035
Ca+2 9.58*10-8 332.15 1.54 / 1.51 0.025
Mg+2 8*10-6 467.5 2.00 0.086
K+ 1.05*10-5 434.4 1.32 0.062
NH4
+ 2.50*10-2 754.4 1.75 0.062
Figure 2 - Profile of molecular diffusion for chloride ions (a) and sodium (b) using the experimental results of 2003 (duration of test72 h).

study the diffusion coefficient for sodium ions assumed thevalue of 0.035 m2/year.
Figures 3 (a) and (b) show the comparison for modelpredictions and experimental data for the Ca2+ and Mg2+
ions. For both ions, the present model showed closer agree-ment with experimental measurements. The experimentalmeasurements for Ca2+ showed an atypical behavior thatcannot be represented by sorption isotherms and distribu-tion coefficients, kd, because the intrinsic solution for thesemodels does not allows signal changes in the derivative ofthe concentration curves. This atypical behavior can onlybe traced by a kinetic model, as presented in this study. Forthe Mg2+ ion, all models presented the same pattern; how-ever, the present model was able to get closer to the experi-mental results. An excellent agreement was obtained withthe kinetic model, which is credited to its ability to considerlocal changes in the mass transfer rates depending upon lo-cal non-equilibrium conditions, which is not possible byconstant effective diffusion coefficients formulations orretardations terms, as considered in the partition coeffi-cients formulations such as kd. The diffusion coefficientsassumed those values for aqueous solution at 25 °C, ac-cording to the literature (0.025 m2/year for Ca2+ and0.086 m2/year for Mg2+). For these four ions, both the mea-sured and calculated results indicated that the ions aretransferred from soil to the leachate liquid because the land-fill soil is rich in these ions and allows leaching phenom-ena, as can be observed in Figs. 2 and 3.
4.2. Reactive ions
The NH4
+ and K+ ions are usually referred to as reac-tive ones due to their typical behavior in the equilibriumbatch tests. Figure 4 shows the profiles for ammonium(Fig. 4a) and potassium (Fig. 4b) with the soil and leachate
reference values shown as constants, as used in the settinginitial conditions for all models. It was observed that themass transfer model presented better agreement with exper-imental measurements compared with both POLLUTE andUFF- sorption predictions. For both ions, the De value usedin the simulation was 0.010 m2/year for K+ and0.020 m2/year for NH4
+. In contrast to the ions presented inthe last section, ammonium and potassium were transferredfrom the leachate to the soil with consequent contaminationof the soil landfill.
Table 5 presents a comparison of values for the effec-tive diffusion coefficients, De, used in the simulations andthe reference values for the aqueous solution at 25 °C, D0,according to the literature (Lerman, 1979). In this table, theDe values estimated by Pinto, 2004 (UFF sorption model),by Ritter and Gatto (2003) using Pollute and by the presentmodel are presented. Notably, the effective coefficients farfrom the reference values usually indicate strong interac-tions of the ions and the solid leachate system and usuallycause larger deviations for the isotherm sorption models ordistribution coefficients formulations. In this study, onlyCl- did not confirm this general trend because the experi-mental profile presented a typical behavior for diffusion-like phenomena; therefore, for this particular behavior it isalways possible to represent the concentration curves by anequivalent solution of the diffusion equation, as the litera-ture indicates (Incropera, & Wiit, 1990).
4.3. Transient results
Figures 5, 6 and 7 show the profiles of transient iondiffusion considered in the leachate and soil landfill used inthis study. The figures present the temporal evolution of theconcentration profiles numerically predicted (18, 36, 54and 72 h). The numerical values at 72 h, which are coinci-
106 Soils and Rocks, São Paulo, 34(2): 101-113, May-August, 2011.
Araújo et al.
Figure 3 - Profile of molecular diffusion for calcium (a) and magnesium (b) ions using the experimental results of 2003.

dent with the measured time, were those used to validate themodel. It is interesting to note the behavior of calcium,which indicated that the ion transfer mechanism changedwith time, evidenced by the changing the sign of the curvesderivatives. For Na+, the experimental results showedlarger variations probably due to inaccurate measurements;however, it was possible to get intermediate predictionsacross the measured results.
Figures 8 to 10 show the average concentration tem-poral evolution for interstitial leachate throughout the ex-perimental procedure. The predicted results show thechanges in ions concentrations with time and represent ameasure of soil contamination with the ions and vice versa.It was observed that for Cl- the concentration profilereached a saturation point during the experiment time,while the same was not predicted for Mg2+, Ca2+ or Na+.
Figure 9 shows the profiles of calcium (Fig. 9a) andsodium (Fig. 9b) ions, in which it can be noticed that stabili-zation was not achieved.
Soils and Rocks, São Paulo, 34(2): 101-113, May-August, 2011. 107
Kinetic Mass Transfer Model for Contaminant Migration in Soils
Table 5 - Comparison of effective diffusion coefficients deter-mined in this simulation: UFF sorption model, POLLUTE, pres-ent model and D0 for ion in aqueous solution at 25 °C accordingthe literature.
Ion De
(m2/year)(a)
De
(m2/year)(b)
De
(m2/year)(c)
D0
(m2/year)(d)
Cl- 0.020 0.020 0.064 0.064
Na+ 0.040 0.040 0.035 0.042
Ca+2 0.040 0.040 0.025 0.025
Mg+2 0.040 0.060 0.086 0.086
K+ 0.020 0.020 0.010 0.062
NH4
+ 0.010 0.070 0.020 0.062
(a) UFF-sorption (b) POLLUTE (c) Present model and (d) thediffusion coefficient in free solution (D0) according to the litera-ture.
Figure 4 - Profile of molecular diffusion for ammonium ions (a) and potassium (b) using the experimental results of 2003.
Figure 5 - Profile of transient molecular diffusion for chloride ions (a) and sodium (b) using 18, 36, 54 and 72 h for simulation.

In contrast to the above ions, for NH4
+ and K+, the con-centrations in the soil increased with time, indicating thatthese ions were transferred from leachate to soil. For bothions, the model indicated that the experimental time wasnot sufficient to saturate the liquids.
According to the characterization tests of the soilfrom the Gramacho landfill (Ritter & Gatto, 2003), the am-monium and potassium ions are in lower concentration inthe soil, and the soil has large capability to absorb this ionscompared to calcium, sodium, chloride and magnesium.
108 Soils and Rocks, São Paulo, 34(2): 101-113, May-August, 2011.
Araújo et al.
Figure 6 - Profile of transient molecular diffusion for calcium (a) and magnesium (b) ions using 18, 36, 54 and 72 h for simulation.
Figure 7 - Profile of transient molecular diffusion for potassium (a) and ammonium (b) ions using 18, 36, 54 and 72 h for simulation.
Figure 8 - Profile of concentration versus time for chloride (a) and magnesium (b) ions.

Figures 11, 12 and 13 show the rate of mass transferof the soil interstitial liquid to the soil particles for chloride,sodium and magnesium ions. The figures show the totalrate of mass transfer (a) and in the medium point inside theexperimental cell (b). For both ions, the rate of mass trans-fer rapidly increased at the beginning of the experiment and
indicated that the maximum rate could not be achievedwithin the experimental time and that saturation conditionswere beyond of the experimental time in this study.
In contrast with Cl+ and Na+, presented in Figs. 11 and12, the Mg2+ rate of mass transfer reached the maximumvalues and slowly decreased. However, the saturation con-
Soils and Rocks, São Paulo, 34(2): 101-113, May-August, 2011. 109
Kinetic Mass Transfer Model for Contaminant Migration in Soils
Figure 9 - Profile of concentration versus time for calcium (a) and sodium (b) ions.
Figure 10 - Profile of concentration versus time for ammonium ions (a) and potassium (b).
Figure 11 - Profile of the rate of mass transfer for the (a) total and (b) medium point for chloride ion.

centration was still beyond the experimental time consid-ered in this study, although the results indicated that thebeginning of the saturation process was achieved (Figs. 13aand 13b).
Figures 14 and 15 show the rate of mass transfer ofthe soil particles to the interstitial liquid for the ammoniumand potassium ions. The figures show the calculated totalmass transfer rate (a) and the rate at the point inside the ex-perimental cell in the vicinity of the interface soil reservoirinterface (b). It can be observed that, at the beginning of thecalculation, the mass transfer rate was very rapid for NH4
+
and the inversion point was rapidly achieved, initiating thesaturation process. For K+, the initial stage was also rapid,and almost linear growth was observed. For both ions, thesaturation concentrations were not achieved in the intervalof the experimental time.
The transient calculations presented in this sectioncan be used to predict the long-term contamination profile,although it is not shown in this study. The rate of masstransfer predicted in these calculations could be used to es-timate plume contamination within the soil landfills, and
therefore it is a useful tool to analyze environmental im-pacts on the soil. The aim of this study was to estimatemodel parameters and confront model formulations withexperimental measurements. Features of the model such assoil saturation time and plume contamination were not ex-plored in this study. The next step of this study is underdevelopment and consists of the application of the formula-tion discussed here for large-scale landfills simulations.However, due to large computation times and a need to ac-curately represent large domains, the MPHMTP software isbeing improved by implementing parallel computationtechniques suitable for use in a computer cluster, which willprovide spatial and time-scale calculations compatible withlandfills with reasonable computation times.
5. Conclusions
In this paper, a model based on mass transfer formula-tions was presented and discussed in light of previous mod-els and experimental results for laboratory scale experi-mental procedures. The main features of MPHMTP(Multi-Phase Heat and Mass Transfer Program) were dis-
110 Soils and Rocks, São Paulo, 34(2): 101-113, May-August, 2011.
Araújo et al.
Figure 12 - Profile of the rate of mass transfer for the (a) total and (b) medium point for sodium ion.
Figure 13 - Profile of the rate of mass transfer for the (a) total and (b) medium point for magnesium ion.

cussed. The model was based on general transport equa-tions of ions within the soil media and can handle severalkinds of soil and barrier structures by considering the ionconcentration evolution in both soil and interstitial liquids.The model predictions were compared to previous modelsand showed closer agreements with experimental data ob-tained in the Barone experimental cell using soil from theGramacho landfill. As a baseline, the chloride, sodium, cal-cium, magnesium, ammonium and potassium ions were se-lected as representative of medium to high sorption rates inan organic soil such as that from the Gramacho landfill.
As a general trend, the model predicted results closerto the experimental measurements compared to the com-mercial POLLUTE software and a previously developedmodel based on distribution coefficients (UFF-sorptionmodel). In the specific case of the calcium ion, strongagreement was observed regardless of the atypical behaviorpresented by this ion in the experimental measurements.
The results of the simulation carried out in this workconfirmed that the migration process of inorganic ions fromthe leachate into the soil can be explained by taking into ac-
count three basic mechanisms: advection and diffusion inthe liquid phase (leachate), sorption in the soil/leachate in-terface and diffusion in the soil particles. In contrast withprevious models, this model accurately predicted the be-havior of all ions presented in the diffusion experimentsand showed potential for application to large time and spa-tial scale predictions of ion contamination in landfills.
Acknowledgments
The authors thank CAPES, CNPq and FAPERJ for fi-nancial support of this research.
References
Araújo, A.S.F. (2006) Simulação Computacional e Vali-dação da Migração de Íons do Chorume no Solo Atra-vés de um Modelo Baseado nos Fenômenos de Trans-ferência de Massa. Dissertação de Mestrado, Escola deEngenharia Industrial Metalúrgica de Volta Redonda,100 pp.
Azevedo, I.C.D.; Nascentes, C.R.; Azevedo, R.F.; Matos,A.T. & Guimarães, L.M. (2003) Coeficiente de difusão
Soils and Rocks, São Paulo, 34(2): 101-113, May-August, 2011. 111
Kinetic Mass Transfer Model for Contaminant Migration in Soils
Figure 15 - Profile of the rate of mass transfer for the (a) total and (b) medium point for potassium ion.
Figure 14 - Profile of the rate of mass transfer for the (a) total and (b) medium point for ammonium ion.

hidrodinâmico e fator de retardamento de metais pe-sados em solo residual compactado. Solos e Rochas, v.26:3, p. 229-249.
Barbosa, M.C. (1994) Investigação Geoambiental do De-pósito de Argila sob o Aterro de Resíduos Sólidos deGramacho-RJ. Tese de Doutorado, Programa de Enge-nharia Civil, Universidade Federal do Rio de Janeiro,342 pp.
Barbosa, M.C.; Almeida, M.S.S. & Ehrlich, M. (1996) Ionsdiffusion through an organic saline clay soil. Proceed-ings of the Second International Congress on Environ-mental Geotechnics, Osaka, Japan, pp. 7-12.
Barone, F.S., Yanful, E.K., Quigley R.M. & Rowe, R.K.(1989) Effect of multiple contaminant migration on dif-fusion and adsorption of some domestic waste contami-nants in a natural clay soil. Canadian GeotechnicalJournal, v. 26, p. 189-198, 10.1139/t89-028.
Bear, J. (1972) Dynamics of Fluids in Porous Media. Amer-ican Elsevier, American Elsevier Publishing Company,Inc., USA, 1972, 764 pp.
Boscov, M.E.; Oliveira, E.; Ghilardi, M.P. & Silva, M.M.(1999) Difusão de metais através de uma argila late-rítica compactada. Proc. 4° Congressso Brasileiro deGeotecnia Ambiental, REGEO’99, São José dos Cam-pos, pp. 323-330.
Castro, J.A. (2000) A Multi-Dimensional Transient Mathe-matical Model of Blast Furnace Based on Multi-FluidModel. Ph.D. Thesis, Institute for Advanced MaterialsProcessing, Tohoku University.
Crooks, V.E. & Quigley, R.M. (1984) Saline leachate mi-gration through clay: A comparative laboratory andfield investigation. Geotechnical Journal, Canadian, v.21, p. 349-362, 10.1139/t84-035.
Domenico, P.A. & Schwartz, F.W. (1998) Physical andChemical Hydrogeology. John Wiley & Sons, NewYork, 824 pp.
Ehrlich, M.; Almeida, M.S.S. & Barbosa, M.C. (1994) Pol-lution control of Gramacho Municipal landfill. Proc.First Int. Congress on Environmental Geotechnics, Ed-monton, Canadá, pp. 657-664.
Ehrlich, M. & Ribeiro, S.G.S. (1995) Análise numérica damigração de contaminantes no solo utilizando um mo-delo hidrogeoquímico. Anais do III Simpósio sobreBarragens de Rejeitos e Disposição de Resíduos,REGEO’95, Ouro Preto, pp. 441-452.
EPA (1992) Batch-Type Procedures for Estimating SoilAdsorption of Chemicals. Technical Resource Docu-ment, 100 pp.
Fetter, C.W. (1999) Contaminant Hydrogeology. 2nd ed.Prentice-Hall, Upper Saddle River, 501 pp.
Gelhar, L.G. (1993) Stochastic Subsurface Hydrology.Prentice-Hall, Englewood Cliffs.
Goodall, D.C. & Quigley, R.M. (1977) Pollutant migrationfor two sanitary landfill site near Sarnia, Ontário. Cana-
dian Geotechnical Journal, v. 14, p. 223-236,10.1139/t77-023.
Incropera, F.P. & Wiit, D.P. (1990) Fundamentos de Trans-ferência de Calor e de Massa. Livros Técnicos e Cientí-ficos Editora S.A., Rio de Janeiro, 494 pp.
Johnson, R.L.; Cherry, J.A. & Pankov, J.F. (1989) Diffu-sive contaminant transport in natural clay: a field exam-ple and implications for clay-lined waste disposal sites.Environmental Science Technology, v. 23:3, p. 340-349, DOI: 10.1021/es00180a012.
Kawasaki, N.; Kinoshita, H.; Oue, T.; Nakamura, T. &Tanada, S. (2004) Study on adsorption kinetic of aro-matic hydrocarbons onto activated carbon in gaseousflow method. Journal of Colloid and Interface Science,v. 275:1, p. 40-43.
Leite, A.L. & Paraguassu, A.B. (2002). Diffusion of inor-ganic chemicals in some compacted tropical. Proc. IVInternational Congress on Environmental Geotechnics,IV ICEG, Rio de Janeiro, pp. 39-45.
Lerman, A. (1979) Geochemical Process. Water and Sedi-ment Environments. John Wiley & Sons, New York,481 pp.
Liu, C.; Szecsody, J.E.; Zachara, J.M. & Ball, W.P. (2000)Use of the generalized integral transform method forsolving equations of solute transport in porous media.Advances in Water Resources, v. 23:5, p. 483-492.
Mitchell,J.K. (1994) Physical Barriers for waste contain-ment. First International Congress on EnvironmentalGeootechnics , Canada, pp. 951-961.
Patankar, S.V. (1985) Numerical Heat Transfer and FluidFlow. Hemisphere Publishing Company, Washington,197 pp.
Pinto, I.C.R. (2004) Modelamento e Simulação Compu-tacional da Migração dos Íons do Chorume em MeioPoroso. Dissertação de Mestrado, Universidade FederalFluminense, 81 pp.
Poirier, D.R. & Geiger, G.H. (1994) Transport Phenomenain Materials Processing, TMS, 509 pp.
Quigley, R.M.; Yanfull, E.K. & Fernandez, F. (1987). IonTransfer by Diffusion Trough Clay Barriers. In: Geo-technical Practice for Waste Disposal’87. ASCE, Geot.Spec. Publication, nº 13, pp. 137-158.
Ritter, E. (1998) Efeito da Salinidade na Difusão e Sorçãode Alguns Íons Inorgânicos em um Solo Argiloso Satu-rado. Tese de Doutorado, Universidade Federal do Riode Janeiro, 229 pp.
Ritter, E.; Ehrlich, M. & Barbosa, M.C. (1999) Difusão esorção em soluções simples e múltiplas em solos argi-losos salinos e não salinos. Anais do IV CongressoBrasileiro de Geotecnia Ambiental, REGEO’99, SãoJosé dos Campos, pp. 331-338.
Ritter, E.; Leite, A E.B. & Machado, V.F. (2001) Avaliaçãoda capacidade de mitigação da argila orgânica presentena fundação e nas valas de contenção lateral para ochorume gerado no Aterro Metropolitano de Gramacho
112 Soils and Rocks, São Paulo, 34(2): 101-113, May-August, 2011.
Araújo et al.

– Rio de Janeiro. Anais do XXVII Congresso Brasileirode Engenharia Sanitária e Ambiental, João Pessoa,CD-Rom, 9 pp.
Ritter, E.; Campos, J.C. & Giordano, G (2002) Sorption ofinorganic ions from leachateand organic soil of M.S.W.Gramacho Landfill. Proc. IV International Congress onEnvironmental Geotechnics, IV ICEG, Rio de Janeiro,pp. 165-170.
Ritter, E. & Gatto, R.L. (2003) Relatório Interno(PIBIC/UERJ), Rio de Janeiro.
Ritter, E.; Campos, J.C. & Gatto, R.L. (2004). The contami-nation level through an organic soil of GramachoMSW. Proc ISC-2 on Geotechnical and GeophysicalSite Characterization, Viana da Fonseca & Mayne(eds), Milpress, Rotterdam, pp. 1339-1343.
Ritter, E. & Campos, J.C. (2006) Avaliação da sorção edifusão molecular de íons inorgânicos do chorume e da
argila orgânica do aterro metropolitano de Gramacho(RJ). Solos e Rochas, v. 29:1, p. 77-88.
Rowe, R.K. (1988) Contaminant migration throughgroundwater – The role of modeling in the design ofbarriers. Canadian Geotecchnical Journal, v. 25:4,p. 778-798.
Rowe, R.W. & Booker, J.R. (1983) Program POLLUTE –ID Pollutant Migration Analysis Program. Geotech-nical Research Center, Faculty of Engineering Science,The University of Westem Ontario, London, Ont. Ca-nadá.
Schackelford, C. & Daniel, D. (1991) Diffusion in satu-rated soil II: Results for compacted clay. Journal ofGeotechnical Engineering, v. 117:3, p. 485-506.
Yagi, J.I. (1993) Mathematical modeling of the flow of fourfluids in a packed bed. ISIJ International, v. 33:6,p. 619-639.
Soils and Rocks, São Paulo, 34(2): 101-113, May-August, 2011. 113
Kinetic Mass Transfer Model for Contaminant Migration in Soils

A Study on the Effects of MSW Fiber Content and SolidParticles Compressibility on its Shear Strength
Using a Triaxial ApparatusSandro Lemos Machado, Mehran Karimpour-Fard
Abstract. It is commonly accepted that the shear strength of Municipal Solid Waste (MSW) is enhanced by thereinforcement effect of its fibrous constituents. However, most papers in the technical literature do not systematicallyevaluate the effect of the MSW fibers on its stress-strain-strength response. This paper presents results of a series oflaboratory triaxial tests performed to evaluate the effect of the MSW fiber content and solid particle compressibility on itsmechanical behavior. The variation in the MSW shear strength and shear strength parameters with fiber content and axialstrain are analyzed, the effective parameters obtained from CD and CU tests are compared and the applicability ofTerzaghi’s equation for MSW materials discussed. Test results were used to calculate the Factor of Safety, FS, for someslope geometrical configurations and the results were used to create some charts relating FS, fiber content and the slopegeometry. The authors believe this subject could be of interest to landfill management companies, especially consideringthe new trend in plastic material recycling for energy recovery purposes.Keywords: MSW, MSW fibers, solid particles compressibility, shear strength, triaxial tests, slope stability.
1. Introduction
The stress-strain-strength response of MunicipalSolid Waste (MSW) is a matter of concern for the designand operation of landfills as well as when post-closure be-havior and re-use or mining of old landfills areas are con-sidered. It is commonly stated that MSW can stand veryhigh values of shear stress due to the reinforcement effectof the fibrous materials it contains (Kavazanjian et al. 1999,Athanasopoulos et al. 2008). However, the number of pa-pers that have systematically evaluated the effect of the fi-brous waste components on the MSW mechanical responseof MSW is limited.
Landava and Clark (1990), as a part of their extensivework, performed direct shear tests using a large apparatuswith horizontal dimensions of 434 x 287 mm. According totheir findings, the shear strength of old waste is clearlyhigher than that of fresh waste. They concluded that the lowstrength of fresh waste, which was shredded, was becausefibrous and elongated particles have been found to alignthemselves in a horizontal direction, which is coincidentwith the shearing plane in direct shear tests. The presence ofthese sliding planes led to a reduction in the MSW shearstrength. In the case of natural and old waste, there is nopreferential alignment of the fibers which results in highershear strengths.
Kölsch (1995) stated that triaxial and direct sheartests do not describe adequately the MSW shearing behav-ior, because in these test arrangements the anisotropy of
waste is not sufficiently recorded. To quantify the tensilestrength of MSW and evaluate the reinforcement character-istics of MSW materials, he developed an equipment fortensile test which was enable to apply tensile stress to MSWsamples by pulling one half of the box and increasing thehorizontal deformation slowly until the applied tensileforce reaches a maximum. Typical results of tensile tests onMSW samples can be visualized in Fig. 1. In this figure theslope of the envelopes represents the angle of internal ten-sile forces. The higher this angle, the higher the reinforce-ment component in shearing behavior of MSW. As can beobserved in this graph, the angle of internal tensile forces inthe case of fresh waste is lower than aged waste, whichcould be attributed to the higher fiber content in old wastedue to decomposition processes.
Zekkos (2005) performed large triaxial tests on theMSW materials from San Francisco bay and showed thatthe effect of the waste composition on the stress-strain-strength response of the MSW materials is significant. Healso reported the results of large direct shear tests per-formed on the same materials by (2005) and showed thatthe type of mechanical response of MSW materials is de-pendent on the shear mechanisms. According to Georgio-poulos (2005), the direction of the fibers inside the samplescould affect the mechanical response of these materialsduring shearing. In the case of samples in which the direc-tion of the fibers were perpendicular to the shear plane, theresponse was similar to the samples sheared in triaxial ap-paratus, showing an upward concavity in their stress-strain
Soils and Rocks, São Paulo, 34(2): 115-127, May-August, 2011. 115
Sandro Lemos Machado, Ph.D., Associate Professor, Departamento de Ciência e Tecnologia de Materiais, Universidade Federal da Bahia, Salvador, BA, Brazil. e-mail:[email protected] Karimpour-Fard, Visiting Researcher, Departamento de Ciência e Tecnologia de Materiais, Universidade Federal da Bahia, Salvador, BA, Brazil.Submitted on June 8, 2010; Final Acceptance on November 23, 2010; Discussion open until December 30, 2011.

curves due to the reinforcement effect of the fibrous mate-rial (Fig. 2).
In a similar work, Athanasopoulos et al. (2008) per-formed several large direct shear tests on MSW materialswith varying fiber directions and concluded that the opti-mum angle of fiber which leads to a higher shear strength is60 degrees, taking the horizontal plane as reference (Fig. 3).
Despite these valuable contributions, the number ofexperimental works focusing on the effect of the fiber con-tent on the mechanical response of MSW remains incipient.One of the first attempts in this field was performed in theGeo-environmental Laboratory at the Federal University ofBahia (GEOAMB) by Karimpour-Fard (2009) using alarge triaxial apparatus which is presented in the followingsections.
2. Materials, Apparatus and ExperimentalWork
The MSW samples used in this research were col-lected at the disposal front of the Metropolitan Center
Landfill, MCL, located approx. 20 km from Salvador. Theresults of the composition analysis of the MSW in the MCLaccording to the reports represented by GEOAMB inMarch 2010, are presented in Table 1.
As can be observed, the main elements which couldact as a reinforcement element, plastic and textiles, makeup about 25% of all the waste (dry basis). Other planar ele-ments such as paper and cardboard, sometimes referred toas the fiber elements in the literature, in this research wereassumed paste material as as having a negligible influenceon MSW reinforcement.
This is justified by the high water content found inthis material (around 100%, dry basis) which leads to a lossof tensile strength of such waste components. All the sam-ples used in this work can be considered as fresh waste witha negligible soil content. Considering the data presented inTable 1 and the considerations made above, the maximumfiber content used in the compacted samples was assumedto be 25% by dry weight.
The water content of samples used in this work variedfrom 115 to 125%. Particles larger than 5 cm were removedfrom the waste or were reduced in size. Figure 4 illustratesthe stages of sampling and treatment.
Considering a maximum fiber content of 25%, inter-mediate fiber contents of 12.5, 6.25 and 0 percent were cho-sen to compact the samples. To reach the desired value offiber content in each sample the first step was to remove allthe plastics and textiles from the MSW. After that, the de-sired amount of fibers was added to the waste, which wasmixed and homogenized in order to obtain the samples tobe used in the tests.
Figure 5 shows the apparatus used and the preparationsteps of the sample. As can be seen, a large triaxial test ap-paratus was used to evaluate the mechanical behavior of theMSW materials. This apparatus includes a loading framewith a capacity of 300 kN and a set of hardware and soft-ware to perform stress/strain controlled triaxial tests. The
116 Soils and Rocks, São Paulo, 34(2): 115-127, May-August, 2011.
Machado and Karimpour-Fard
Figure 1 - MSW cohesion due to fiber reinforcement effect.Kölsch (1995).
Figure 2 - The effect of the direction of the fibers on the mechani-cal response of MSW materials Georgiopoulos (2005).
Figure 3 - Changing the shear strength of MSW materials withvariation in the direction of the fibers, Athanasopoulos et al.(2008).

size of the triaxial chamber and the nominal size of the sam-ples were 50x100 and 20x35 cm, respectively. Sampleswere compacted statically to reach a nominal density of8 kN/m3 similar to that obtained in field after waste dis-posal. The loading frame was used to compress the samplesto the height of 30 cm. Samples were left pressed for 2 h andthen released to rebound. The height of the samples at theend of the process was about 35 cm.
A test program was scheduled based on the short andlong term behavior of MSW materials so both drained andundrained tests were carried out to evaluate the effect of thefiber content on the waste shear strength. Table 2 lists thetests performed.
Samples were saturated with water. The saturationtechniques used were upward flow (using an effective con-fining pressure of 10 kPa) and back-pressure. The flowstage lasted for a minimum of two hours until stationary
flow was reached. The back-pressure technique used con-fining pressure increments of 50 kPa and a minimum valueof B = 0.9 was adopted.
After saturation, the samples were consolidated untila negligible rate of volume change was observed. To cor-rect the cross section of the samples after consolidation, anon-isotropic deformation assumption was used (Eq. (1)),
Soils and Rocks, São Paulo, 34(2): 115-127, May-August, 2011. 117
A Study on the Effects of MSW Fiber Content and Solid Particles Compressibility on its Shear Strength Using a Triaxial Apparatus
Table 1 - The composition of fresh MSW material in MCL (Machado et al., 2010).
Component Average composition – dry basis Average composition – wet basis
Average (%) S.D. (%) Cov. Average (%) S.D. (%) Cov.
Wood 5.92 3.04 0.51 5.19 3.39 0.65
Stone/Ceramic 10.89 6.56 0.60 5.88 3.84 0.65
Textile 3.66 1.78 0.49 4.19 2.25 0.54
Rubber 0.44 0.45 1.01 0.29 0.27 0.95
Plastic 20.11 4.92 0.24 18.74 3.99 0.21
Glass 3.78 1.55 0.41 1.65 0.75 0.46
Metal 2.90 1.59 0.55 1.49 0.71 0.48
Paper/Cardboard 17.12 5.17 0.30 19.70 4.27 0.22
Paste 35.18 6.64 0.19 42.86 7.27 0.17
S.D. : Standard Deviation, Cov. : Coefficient of variance.
Figure 5 - (a) Loading frame (b) and (c) control system (d) and (e)compacting the sample (f) triaxial chamber (g) sample after com-paction (h) Radial geotextile drains (i) sample before test.
Figure 4 - Sample preparation (a) Sampling (after quartering, par-ticles larger than 5 cm were removed) (b) removing plastic andtextiles (c) and (d) cutting and processing the particles larger than5 cm.

as suggested by Shariatmadari et al. (2009) who used sam-ples collected at the same place.
The recorded volume changes during the consolida-tion phase were used in conjunction with the changes in thesample height (measured using the free length of the load-ing ram) to calculate the sample radial strain and the samplecross section prior to shearing. According to the authors,the ratio of axial to radial strain (which should be equal toone in isotropic materials) varied from 1.65 to 3.48, with anaverage of 2.4. This means that the assumption of isotropicdeformation leads to a smaller cross section and thereforeto higher values of axial stress and shear strength. In Eq. (1)�r, �a and �v are the radial, axial and volumetric strains, re-spectively.
��
�rV
a
� ��
�1
1
1(1)
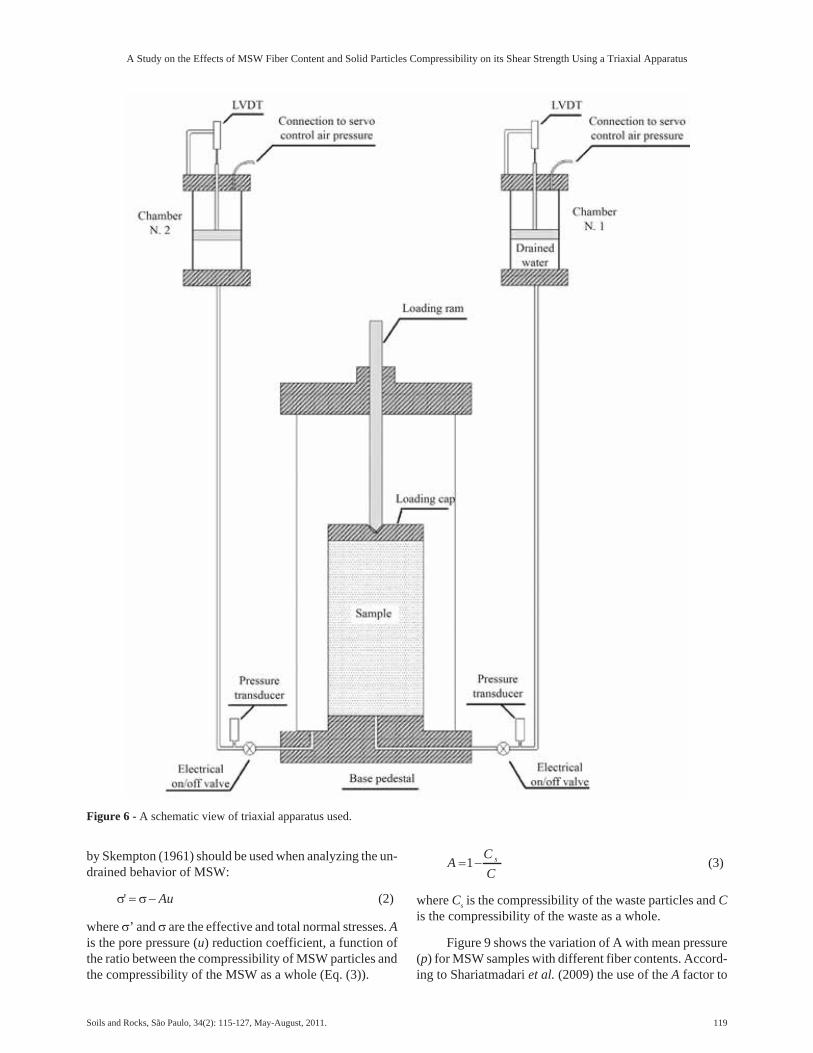
The apparatus shown in Fig. 5 had two differentchambers to measure volume change. The rst chamber(chamber No. 1), common in triaxial apparatus, measuresthe changes in the volume of water inside the samples (orthe changes in the volume of the samples, in the case of sat-
urated specimens with incompressible particles). The sec-ond one, chamber No. 2, connected to the conning stresswater supply line, was used to measure the overall samplevolume change (please refer to Fig. 6).
In the case of the second chamber, the measured vol-ume values were corrected in order to take into account thetriaxial cell deformation. Triaxial cell deformation wassmall compared to the volume change of the samples evenfor low conning pressures. Chamber 2 always showedhigher volume changes than chamber 1 and this differencewas believed to be due to the compressibility of the wasteparticles.
Tests were performed using a loading rate of0.8 mm/min. The shearing phase lasted until the samplereached 30% of axial strain. Tests were performed accord-ing to procedures suggested by Head (1986) and ASTMD4767 (2004).
3. Results and Analysis
Figures 7 and 8 present the results of the triaxial testsperformed using confining pressures of 50 and 300 kPa. Ascan be observed, almost all the curves are concave upward,without presenting any evidence of rupture, which is inagreement with the results presented by researchers such asGrisolia & Napoleoni (1995), Jessberger & Kockel (1993),Carvalho (1999), Machado et al. (2002, 2008), Towhata etal. (2004), Zekkos (2005), Nascimento (2007) and Karim-pour-Fard (2009). With increasing fiber content, the MSWshear strength increased in both drained and undrainedtests. Although not shown in this paper, even in the case ofthe use of the maximum obliquity criteria, (�’1/�’3)max, it isnot possible to detect failure of the MSW samples.
Analyzing Fig. 8b it is possible to observe that thepore water pressure at the end of the shearing phase is al-most equal to the confining stress. These results are similarto those obtained by Carvalho (1999) and Nascimento(2007). On the one hand, this means that if the effectivestress equation proposed by Terzagui is used, the effectiveconfining stress will approach zero. Despite this, however,the samples continue to present strain hardening, and abso-lutely no evidence of liquefaction can be found in the testsresults. On the other hand, the use of the Terzaghi equationin such conditions leads to very high friction angles and al-most null cohesion intercepts which is physically contra-dictory with the ability of the samples to sustain highdeviatoric stress levels in almost unconfined conditions.
Shariatmadari et al. (2009) analyzed the results ob-tained from drained and undrained triaxial tests and con-cluded that the compressibility of the MSW particles leadsto a contact area that is not negligible compared to the totalcross section area of the samples, which is the most impor-tant assumption of Terzaghi’s effective stress equation. Ac-cording to the authors, instead of the effective stressequation proposed by Terzaghi, Eq. (2) originally proposed
118 Soils and Rocks, São Paulo, 34(2): 115-127, May-August, 2011.
Machado and Karimpour-Fard
Table 2 - List of performed tests.
No. Test type F.C. (%) ��3 (kPa) �0 (kN/m3)
1 TX-CD 0 50 8.4
2 TX-CD 0 150 8.55
3 TX-CD 0 300 8.32
4 TX-CU 0 50 8.32
5 TX-CU 0 150 8.42
6 TX-CU 0 300 8.15
7 TX-CD 6.25 50 8.26
8 TX-CD 6.25 150 8.23
9 TX-CD 6.25 300 8.38
10 TX-CU 6.25 50 8.44
11 TX-CU 6.25 150 8.48
12 TX-CU 6.25 300 8.46
13 TX-CD 12.5 50 8.05
14 TX-CD 12.5 300 8.41
15 TX-CU 12.5 50 8.32
16 TX-CU 12.5 300 8
17 TX-CD 25 50 7.83
18 TX-CD 25 300 8.1
19 TX-CU 25 50 8.52
20 TX-CU 25 300 8.12
TX. Triaxial Test, CD. Consolidated-Drained. CU. Consoli-dated-Undrained, F.C. Fiber Content. ��3. Consolidation stress,�0. Initial density.
by Skempton (1961) should be used when analyzing the un-drained behavior of MSW:
� �' � � Au (2)
where �’ and � are the effective and total normal stresses. Ais the pore pressure (u) reduction coefficient, a function ofthe ratio between the compressibility of MSW particles andthe compressibility of the MSW as a whole (Eq. (3)).
AC
Cs� �1 (3)
where Cs is the compressibility of the waste particles and Cis the compressibility of the waste as a whole.
Figure 9 shows the variation of A with mean pressure(p) for MSW samples with different fiber contents. Accord-ing to Shariatmadari et al. (2009) the use of the A factor to
Soils and Rocks, São Paulo, 34(2): 115-127, May-August, 2011. 119
A Study on the Effects of MSW Fiber Content and Solid Particles Compressibility on its Shear Strength Using a Triaxial Apparatus
Figure 6 - A schematic view of triaxial apparatus used.

compute the pore water pressure contribution in the effec-tive stress equation resulted in a signicant improvement inthe compatibility between the effective parameters ob-tained from CU and CD tests.
Figure 10 presents the effective stress paths followedby the samples in CD and CU tests. In the case of the effec-tive stress paths obtained in CU tests, two equations wereused for effective stress calculation: one is the classic Ter-zaghi equation (A = 1) and the other is Eq. (2) (A < 1).
To evaluate the effect of the fiber content on theMSW shear strength parameters, the results were analyzedusing the Mohr-Coulomb shear strength envelope. Becauseof the strain hardening nature of MSW (it was not possibleto detect any trend of failure in the performed tests) theshear strength parameters were calculated for axial strainvalues of 5, 10, 15 and 20%.
The use of the Mohr-Coulomb shear strength enve-lope in MSW materials is a controversial. As presented by
120 Soils and Rocks, São Paulo, 34(2): 115-127, May-August, 2011.
Machado and Karimpour-Fard
Figure 7 - Typical CD triaxial test results. Figure 8 - Typical CU triaxial test results.
Figure 9 - Values of A parameter for varying fiber contents andmean stress.

Machado et al. (2002) and Machado et al. (2008), MSWshort and long term mechanical behavior can be modeled asa composite material of two phases each with its own con-stitutive model. However, the use of such complex elasto-plastic models is not possible in most of the availablecommercial slope stability software and these models re-quire a number of parameters which is not usually availablein the field. Besides this, the capacity of landfill structuressuch as gas and leachate collection systems and cover lay-ers to sustain horizontal and vertical displacements withoutlosing serviceability can be used to define maximum strainlevels and thus makes it possible and defensible to use theMohr-Coulomb shear strength envelope in slope stabilityanalysis in landfills.
Figure 11 presents the shear strength envelopesfor each fiber content and drainage condition adoptedin the experimental program (20% of axial strain). Ta-bles 3 and 4 present the obtained MSW friction angleand cohesion intercept for the different levels of axialstrain. Figure 12 summarizes the obtained resultsgraphically.
As can be noted, there are different patterns of shearstrength mobilization in the CU and CD tests. In the case ofthe CD tests, Fig. 12b and Table 4, fiber content affects co-hesion intercepts much more than friction angles. Despitethe 6.25% fiber content there is a decrease in the obtainedvalue of cohesion. After 6.25% the effect of the fiber con-tent on the friction angle seems negligible.
Soils and Rocks, São Paulo, 34(2): 115-127, May-August, 2011. 121
A Study on the Effects of MSW Fiber Content and Solid Particles Compressibility on its Shear Strength Using a Triaxial Apparatus
Figure 10 - Stress path of MSW samples with varying ber content (a) 0%, (b) 6.25%, (c) 12.5% and (d) 25%.

In the case of CU tests, there is a monotonic increasein the friction angle with fiber content and the effect of thefiber content on the cohesion intercept seems to reach amaximum for a fiber content of 12.5%. One of the possiblereasons for such behavior must be related to the high valuesof pore water pressure generated during the shear phase,which tends to reduce the anchoring conditions of the fibersinside the samples.
Figure 13 compares the effective stress results fromCU and CD tests using Eq. (2) and Terzaghi’s equation. Inorder to do this, shear strength envelopes were calculatedfor various levels of axial strain and fiber contents as well.Using the obtained shear strength envelopes and a 50 kPa of
normal stress increments, shear strength ratios (�) for sam-ples with the same fiber content were calculated as follows:
�
� p
r
(4)
where r is the shear strength based on stress analysis of CDtest results and p is the shear strength based on effectivestress analysis of CU tests.
The log normal distribution was used to perform astatistical analysis of the � values. The mean () and stan-dard deviation (��) were evaluated using the natural loga-rithm of strength ratio as follows:
122 Soils and Rocks, São Paulo, 34(2): 115-127, May-August, 2011.
Machado and Karimpour-Fard
Figure 11 - The effect of the fiber content on the shear strength (a) undrained conditions (b) drained conditions.
Table 3 - Evolution of the MSW shear strength parameters with axial strain for different fiber contents. CU tests.
Axial strain (%) Fiber content (%)
0 6.25 12.5 25
� C (kPa) � C (kPa) � C (kPa) � C (kPa)
5 9 9 10 9 10 10 14 6
10 11 9 12 12 12 16 17 10
15 11 11 13 15 13 20 20 14
20 12 14 14 21 15 26 22 17
Table 4 - Evolution of the MSW shear strength parameters with axial strain for different fiber contents. CD tests.
Axial strain (%) Fiber content (%)
0 6.25 12.5 25
� C (kPa) � C (kPa) � C (kPa) � C (kPa)
5 11 4 13 2 13 7 12 17
10 13 8 16 4 16 12 16 25
15 13 13 17 8 18 17 18 34
20 14 18 19 11 19 22 20 46

����1
1n ii
n
ln (5)
� � � ��
���1
12
1n ii
n
(ln ) (6)
the Log Normal distribution of the � values is given by
f ( ) expln( )
� � �
�
��
� ���
��
�
��
�
�
��
�
�
��
1
2
1
2
2
(7)
The function above produces a bell shaped distribu-tion with a constant area, therefore increasing the peakvalue of f(�) implies reducing the width and as a result thescatter of the prediction is lower. If the peak length is equalto 1, this means that the average value of shear strength isequal to unity or the average error is zero. If the peak lengthis greater than 1, the effective shear envelope derived fromCU tests leads to an over estimation of shear strength com-pared to CD ones and vice-versa.
As can be seen in Fig. 13, the error analysis per-formed using the results of effective stress from the CUtests and assuming the results of CD tests as a referenceshowed that ignoring particle compressibility could causean overestimation of up to 50% in the shear strength of
MSW. Using Eqs. (2) and (3) this error was reduced to lessthan 15%.
In this paper, effective stress parameters were ob-tained using the results of CD tests. Although not the casein this paper, in the absence of CD tests, the authors suggestthe use of Eq. (2) in order to obtain effective shear strengthparameters from CU tests. The use of Terzaghi’s equationmay lead to an unacceptable overestimation of the MSWshear strength.
For illustrative purposes, some slope stability calcu-lations were carried out to verify the effect of the fiber con-tent on the factor of safety (FS) of some hypotheticalslopes. The authors believe that this kind of information isworthwhile for designers as a preliminary approach to eval-uate the effect of fiber removal on the MSW shear strengthparameters and on the slope factor of safety. In this caseonly the shear parameters obtained for 20% of axial strainswere used. Slopes were defined considering their heightand inclination.
Due to the developments in computing, the use ofseveral relatively new numerical methods for slope stabil-ity analysis are increasing in popularity. One such is theshear strength reduction technique (SSR). In this method,the factor of safety of one slope is computed by reducingthe shear strength of soil, rock or any type of Geo-materials
Soils and Rocks, São Paulo, 34(2): 115-127, May-August, 2011. 123
A Study on the Effects of MSW Fiber Content and Solid Particles Compressibility on its Shear Strength Using a Triaxial Apparatus
Figure 12 - Variation of shear strength parameter of MSW materials with varying fiber contents (a) undrained conditions (b) drainedconditions.

in stages, until the slope fails. For Mohr-Coulomb materialshear strength is reduced by FS according to the equation:
�
FS
c
FS FS� �
' tan( ' )(8)
Eq. (8) can be re-written as
�
FSc� �* tan( *) (9)
In this case, c* = c’/FS and �* = arctan(�’)/FS are thereduced Mohr-Coulomb shear strength parameters andthese values can be input into an finite element or finite dif-ference model and analyzed. For Mohr-Coulomb materials,the main steps for systematically searching for the criticalFS, which brings a previously stable slope to the verge offailure, are described below:
Step 1: Develop a numerical model of a slope, usingappropriated boundaries and the deformation and strength
properties established for the slope materials. Run themodel obtaining the values of stress and strain and record-ing the maximum total deformation in the slope.
Step 2: Increase the value of FS and calculate the re-duced values of c’ and f ‘ as described above. Enter the newstrength properties into the slope model and repeat Step 1.
Step 3: Repeat Step 2, using systematic increments ofFS, until the numerical model does not converge with a so-lution (the displacement values become excessively high),i.e. continue to reduce material strength until the slope fails.The final FS value can be calculated as the one that leads tovirtually infinite displacements. The FS steps must be re-duced as the displacements become higher to approach anequilibrium limit situation.
The Finite Difference Method code FLAC (FLAC,2000) enables the analysis of slope stability using the SSRtechnique. To evaluate the effect of fiber content on theslope stability using FLAC software, about 150 combina-
124 Soils and Rocks, São Paulo, 34(2): 115-127, May-August, 2011.
Machado and Karimpour-Fard
Figure 13 - Error analysis. (a) 0%, (b) 6.25%, (c) 12.5% and (d) 25% fiber content.

tions of slope geometry and MSW shear strength parame-ters were used.
Figure 14 illustrates the general model of waste fillused for these analysis. It was assumed that the waste fillhad been constructed on a foundation of waste materials ofinfinite depth (this is reasonable in the MCL case, as thecells are part excavated and part above the ground level).Besides this, critical surfaces (assumed as the regions of themesh with higher displacements) were always located atshallow depths, passing near the toe of the slope. The modelboundaries extend to the left and right far enough to have noeffect on the values of the computed FS.
It was assumed that the leachate collection systemworks properly so that increasing levels of leachate (or gaspressure) inside the fill is not a matter concern. The authorsbelieve that these are reasonable assumptions only in wellmanaged landfills with the use of a compatible number ofdeep and superficial gas drains and an efficient leachatecollection system. In slope stability analysis of waste fills,the authors suggest that the use of undrained parametersmust be considered only in the absence of gas pressure orleachate level information.
According to the discussion presented above, only theresults of the CD tests were used in the performed calculus.As said above, other values of strain may be chosen by thestaff responsible for the landfill management, consideringthe interactions between the waste mass and the coverlayer, drainage system, etc. Values of k were chosen in or-der to cover MSW slope inclinations normally found in thefield for new and old MSW slopes. In the same way valuesof H cover most of the situations found in Brazilian land-fills.
Table 5 presents the FS factors calculated by the soft-ware for various geometry and strength conditions. As canbe observed, although most FSs are relatively high, there isa clear increase in FS values as the fiber content increases.The only exception occurs when comparing the results ofthe material without fibers with the results of the materialwith a fiber content of 6.5% for low slope heights. This canbe explained by observing Figure 7 and Table 4. Sampleswithout fibers presented higher cohesion and consequentlyhigher shear strengths for low levels of confining stress.This is possibly due to this fact that in the absence of plas-
tics, samples compact better (higher densities) resulting inbetter interlocking between particles which cause a higherstrength at lower confining pressures.
In Table 5 FS values lower than 1.6 were highlightedin order to make clear that these values are considered un-satisfactory by the authors to guarantee to the overall stabil-ity of the MSW mass.
Fig 15 presents some charts with the variation of FSas a function of the slope height and fiber content.
4. ConclusionsThe fibrous components of MSW play a key role in its
mechanical behavior. The reinforcement action of thesecomponents and their effect on the shear strength is themain reason why the MSW shear-strain curves are concaveupward and do not show evidence of failure even underhigh levels of stress and strain. Most of the fiber elementsinside the MSW materials are plastics and most of these areplastic bags used by the population to provisionally storetheir MSW until it is collected by the refuse collection ser-vices from their residences.
The results clearly show that with increasing fibercontent and/or plastic content the shear strength of MSWmaterials increases. This finding is compatible with the re-
Soils and Rocks, São Paulo, 34(2): 115-127, May-August, 2011. 125
A Study on the Effects of MSW Fiber Content and Solid Particles Compressibility on its Shear Strength Using a Triaxial Apparatus
Figure 14 - Hypothetical slope section adopted for slope stabilitycalculation.
Table 5 - Factor of safety of slopes with varying geometry andstrength.
Fiber content (%) k H (m)
5 7 10 12.5 15 17.5 20
0 1 2.35 1.92 1.41 1.21 1.08 0.99 0.91
2 2.94 2.33 1.86 1.64 1.49 1.37 1.28
3 3.42 2.76 2.26 2.01 1.84 1.71 1.62
4 3.90 3.17 2.63 2.38 2.19 2.06 1.96
5 4.26 3.54 2.97 2.71 2.52 2.38 2.27
6.25 1 1.84 1.42 1.20 1.06 0.96 0.89 0.83
2 2.49 1.99 1.72 1.56 1.44 1.36 1.29
3 3.09 2.52 2.21 2.02 1.89 1.79 1.72
4 3.58 2.97 2.69 2.48 2.34 2.23 2.15
5 4.01 3.40 3.07 2.85 2.71 2.60 2.52
12.5 1 3.08 2.26 1.85 1.60 1.38 1.26 1.17
2 3.83 2.92 2.45 2.16 1.96 1.81 1.70
3 4.47 3.84 2.97 2.66 2.44 2.28 2.16
4 5.05 4.03 3.49 3.16 2.93 2.75 2.62
5 5.58 4.53 3.97 3.62 3.36 3.19 3.04
25 1 5.53 3.92 3.12 2.63 2.31 2.08 1.90
2 6.56 4.53 3.92 3.62 3.01 2.76 2.53
3 7.14 5.50 4.72 3.99 3.60 3.26 3.09
4 8.05 6.13 5.38 4.72 4.49 3.84 3.61
5 8.51 6.82 5.80 5.15 4.70 4.38 4.11

sults of the constitutive model presented for MSW materi-als by Machado et al. (2008) and Machado et al. (2002) andmany other authors in the technical literature (Zekkos 2005,Georgiopoulos 2005, Athanasopoulos et al. 2008).
The error analysis performed using the results of ef-fective stress from CU tests and assuming the results of CDtests as a reference showed that ignoring particle compress-ibility could cause an overestimation of up to 50% in theshear strength of MSW. Using Eqs. (2) and (3) this errorwas reduced to less than 15%.
The results of waste fill stability analysis have shownthat decreasing the MSW fiber content the Factor of Safetyalso decreases. For a height of 20 m, reducing the fiber con-tent from 25% to 0% results in a decrease in the Factor ofSafety from 2.53 to 1.28, considering a slope of 1:2. For aslope of 1:3, these values change from 3.09 to 1.62.
Finally, there is a a new trend to recycle plastic mate-rial for energy recovery purposes instead of landfilling. Thestaff responsible for landfill management must be awarethat this practice will imply a reduction in the storage ca-pacity of the landfill in order to preserve adequate levels ofsecurity.
References
ASTM D4767 (2004) Standard Test Method for Consoli-dated Undrained Triaxial Compression Test for Cohe-sive Soils, doi:10.1520/D4767-04.
Athanasopoulos, G.; Grizi, A.; Zekkos, D.; Founta, P. &Zisimatou, E. (2008) Municipal solid waste as a rein-forced soil: Investigation using synthetic waste, Proc.ASCE-Geoinstitute Geocongress. The Challenge of
Sustainability in the Geoenvironment, GeotechnicalSpecial Publication, Pub. No. 177, pp. 168-175.
Carvalho, M.F. (1999) Comportamento mecânico de resí-duos sólidos urbanos. PhD Thesis. Geotechnical De-partment, University of São Paulo, 300 pp.
FLAC v. 4.0. (2000) Users Manual. Itasca ConsultingGroup Inc., Minneapolis, 124 pp.
Georgiopoulos, D. (2005) Direct Shear Tests on MSWSpecimens from Tri-Cities Landfill, California, USA,Using a Large Shear Box. Diploma Thesis, Universityof Patras, 260 pp.
Grisolia, M.; Napoleoni, Q.; & Tangredi, G. (1995) The useof triaxial tests for the mechanical characterization ofmunicipal solid waste. Proc. of the 5th InternationalLandfill Symposium – Sardinia 95, Sardinia, pp. 761-767.
Head, K.H. (1986) Manual of Soil Laboratory Testing, v. 3:Effective Stress Tests. Pentech Press, London, 442 pp.
Jessberger, H.L. & Kockel, R. (1993) Determination andassessment of the mechanical properties of waste.Sarsby, R.W. (ed) Waste Disposal by Landfill – Green‘93. Balkema, Rotterdam, pp. 313-322.
Karimpour-Fard, M. (2009) Mechanical behavior of MSWmaterials with different initial states. PhD Thesis, IranUniversity of Science and Technology. [in Persian].
Kavazanjian Jr., E.; Matasovic, N. & Bachus, R.C. (1999)Large-diameter static and cyclic laboratory testing ofmunicipal solid waste. Proc. Sardinia `99-7th Interna-tional Waste Management and Landfill Symposium,Cagliari, pp. 437-444.
126 Soils and Rocks, São Paulo, 34(2): 115-127, May-August, 2011.
Machado and Karimpour-Fard
Figure 15 - Stability chart of slopes with varying geometries and fiber contents.

Kölsch, F. (1995) Material values for some mechanicalproperties of domestic waste. Proc. of the 5th Inter-national Landfill Symposium in Sardinia, pp. 711-729.
Landva, A.O. & Clark, J.I. (1990) Geotechnics of waste fill.Geotechnics of waste fill, Theory and practice, STP1070. Landva and Knowles (eds), ASTM, pp. 86-103.
Machado, S.L; Carvalho, M.F.; Nascimento, J.C.F. &Santos A.C. (2010) Characterization of the MCLDomestic Waste. MCL internal report, Salvador,45 pp.
Machado, S.L.; Carvalho, M.F. & Vilar, O.M. (2002) Con-stitutive model for municipal solid waste. Journal ofGeotechnical and Geoenvironmental Engineering,v. 128:11, p. 940-951.
Machado, S.L.; Vilar, O.M. & Carvalho, M.F. (2008) Con-stitutive model for long term municipal solid waste me-chanical behavior. Computers and Geotechnics, v. 35:5,p. 775-790.
Nascimento, J.C.F. (2007) Comportamento mecânico deresíduos sólidos urbanos. Ms.C. Dissertation. Geo-technical Department, University of São Paulo,150 pp.
Shariatmadari, N.; Machado, S.L.; Noorzad, A. & Karim-pour-Fard, M. (2009) Municipal solid waste effectivestress analysis. Waste Management (Elmsford),v. 29:12, p. 2918-2930.
Towhata, I.; Kawano, Y.; Yonai, Y. & Koelsh, F. (2004)Laboratory tests on dynamic properties of municipalwastes. Proc. 11th Conference in Soil Dynamics andEarthquake Engineering and 3rd International Confer-ence on Earthquake Geotechnical Engineering, Berke-ley, California, v. 1, pp. 688-693.
Zekkos, D.P. (2005) Evaluation of Static and DynamicProperties of Municipal Solid-Waste. PhD Thesis, Uni-versity of California, Berkeley, 578 pp.
List of SymbolsA – Pore water pressure reduction factorB – Skempton pore water pressure parameter.c’ - MSW effective cohesionc* - MSW reduced or mobilized cohesionCs - Compressibility of the MSW the waste particlesC - Compressibility of the waste as a wholeCD – Consolidated DrainedCU – Consolidated UndrainedE – Modulus of elasticityF.C.- Fiber ContentFS – Factor of SafetyH - Slope heighk - Slope inclinationMSW – Municipal Solid Wastep - Mean normal stressSSR – Shear strength reduction techniqueTX – Triaxial Test� - Shear strength ratio - Mean of the natural logarithm values of ��� - Standard deviation of the natural logarithm values of ��0 - Initial density of the samples�a - axial strain�r - radial strain�v - volumetric strains�3 - Consolidation pressure� - Poisson coefficient�’- MSW effective friction angle�* - MSW reduced or mobilized friction angle - Shear strength, shear stress.r - Shear strength based on stress analysis of CD test resultsp - Shear strength based on effective stress analysis of CUtests�’ - Effective normal stresses� - Total normal stresses
Soils and Rocks, São Paulo, 34(2): 115-127, May-August, 2011. 127
A Study on the Effects of MSW Fiber Content and Solid Particles Compressibility on its Shear Strength Using a Triaxial Apparatus

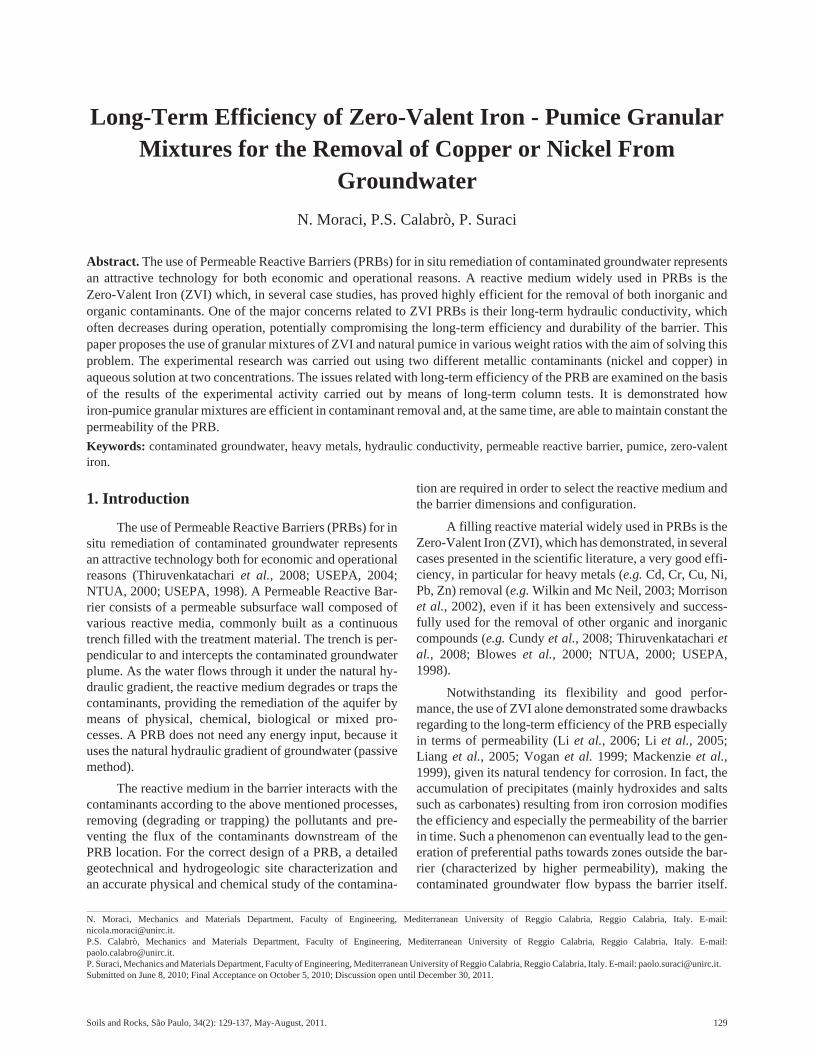
Long-Term Efficiency of Zero-Valent Iron - Pumice GranularMixtures for the Removal of Copper or Nickel From
Groundwater
N. Moraci, P.S. Calabrò, P. Suraci
Abstract. The use of Permeable Reactive Barriers (PRBs) for in situ remediation of contaminated groundwater representsan attractive technology for both economic and operational reasons. A reactive medium widely used in PRBs is theZero-Valent Iron (ZVI) which, in several case studies, has proved highly efficient for the removal of both inorganic andorganic contaminants. One of the major concerns related to ZVI PRBs is their long-term hydraulic conductivity, whichoften decreases during operation, potentially compromising the long-term efficiency and durability of the barrier. Thispaper proposes the use of granular mixtures of ZVI and natural pumice in various weight ratios with the aim of solving thisproblem. The experimental research was carried out using two different metallic contaminants (nickel and copper) inaqueous solution at two concentrations. The issues related with long-term efficiency of the PRB are examined on the basisof the results of the experimental activity carried out by means of long-term column tests. It is demonstrated howiron-pumice granular mixtures are efficient in contaminant removal and, at the same time, are able to maintain constant thepermeability of the PRB.
Keywords: contaminated groundwater, heavy metals, hydraulic conductivity, permeable reactive barrier, pumice, zero-valentiron.
1. Introduction
The use of Permeable Reactive Barriers (PRBs) for insitu remediation of contaminated groundwater representsan attractive technology both for economic and operationalreasons (Thiruvenkatachari et al., 2008; USEPA, 2004;NTUA, 2000; USEPA, 1998). A Permeable Reactive Bar-rier consists of a permeable subsurface wall composed ofvarious reactive media, commonly built as a continuoustrench filled with the treatment material. The trench is per-pendicular to and intercepts the contaminated groundwaterplume. As the water flows through it under the natural hy-draulic gradient, the reactive medium degrades or traps thecontaminants, providing the remediation of the aquifer bymeans of physical, chemical, biological or mixed pro-cesses. A PRB does not need any energy input, because ituses the natural hydraulic gradient of groundwater (passivemethod).
The reactive medium in the barrier interacts with thecontaminants according to the above mentioned processes,removing (degrading or trapping) the pollutants and pre-venting the flux of the contaminants downstream of thePRB location. For the correct design of a PRB, a detailedgeotechnical and hydrogeologic site characterization andan accurate physical and chemical study of the contamina-
tion are required in order to select the reactive medium andthe barrier dimensions and configuration.
A filling reactive material widely used in PRBs is theZero-Valent Iron (ZVI), which has demonstrated, in severalcases presented in the scientific literature, a very good effi-ciency, in particular for heavy metals (e.g. Cd, Cr, Cu, Ni,Pb, Zn) removal (e.g. Wilkin and Mc Neil, 2003; Morrisonet al., 2002), even if it has been extensively and success-fully used for the removal of other organic and inorganiccompounds (e.g. Cundy et al., 2008; Thiruvenkatachari etal., 2008; Blowes et al., 2000; NTUA, 2000; USEPA,1998).
Notwithstanding its flexibility and good perfor-mance, the use of ZVI alone demonstrated some drawbacksregarding to the long-term efficiency of the PRB especiallyin terms of permeability (Li et al., 2006; Li et al., 2005;Liang et al., 2005; Vogan et al. 1999; Mackenzie et al.,1999), given its natural tendency for corrosion. In fact, theaccumulation of precipitates (mainly hydroxides and saltssuch as carbonates) resulting from iron corrosion modifiesthe efficiency and especially the permeability of the barrierin time. Such a phenomenon can eventually lead to the gen-eration of preferential paths towards zones outside the bar-rier (characterized by higher permeability), making thecontaminated groundwater flow bypass the barrier itself.
Soils and Rocks, São Paulo, 34(2): 129-137, May-August, 2011. 129
N. Moraci, Mechanics and Materials Department, Faculty of Engineering, Mediterranean University of Reggio Calabria, Reggio Calabria, Italy. E-mail:[email protected]. Calabrò, Mechanics and Materials Department, Faculty of Engineering, Mediterranean University of Reggio Calabria, Reggio Calabria, Italy. E-mail:[email protected]. Suraci, Mechanics and Materials Department, Faculty of Engineering, Mediterranean University of Reggio Calabria, Reggio Calabria, Italy. E-mail: [email protected] on June 8, 2010; Final Acceptance on October 5, 2010; Discussion open until December 30, 2011.

The probability of this barrier bypass is increased by the re-cent trend of adopting semi-permeable funnels (hydraulicconductivity only two or three orders of magnitude lowerthan PRB) in funnel and gate configurations; in fact, inthese conditions, if gate permeability decreases, the plumeof contaminated groundwater can flow through the funnels.
Furthermore, when the barrier bypass is not possible,since the natural gradient of groundwater remains relativelyconstant, a decrease of hydraulic conductivity causes a par-allel reduction of discharge through the barrier, signifi-cantly modifying the hydrogeology downstream.
In this paper, in order to sustain hydraulic conductiv-ity in the long term and to optimize the use of ZVI, which israther expensive, the adoption in PRBs of granular mix-tures of zero-valent iron and pumice (a volcanic rock with aspongy, vitreous structure), in different weight ratios, isproposed.
The experimental research on the efficiency ofZVI-pumice granular mixtures in the removal of heavymetals was carried out by column tests, using an aqueoussolution of the nitrates of two different metallic contami-nants (nickel and copper) at various concentrations.
2. Contaminants Removal Mechanisms InZero-Valent Iron Permeable ReactiveBarriers
Iron (Fe) is a chemical element with three possibleoxidation states: 0, +2 and +3 (other oxidation states arerare); ZVI acts as a reducing agent (electron donor) andtends to be easily and quickly oxidized (Fe0/Fe2+ - E0 =-0,44 V), as outlined below, Fe2+ also, in certain conditions,can be further oxidized.
The groundwater contaminants passing through thebarrier, if their redox potential is higher than - 0.44 V, act aselectron acceptors and may be reduced.
For a generic metal (Me) the reactions involved are asfollows:
Fe0 � Fe2+ + 2e- oxidation
Me2+ + 2e- � Me reduction
Moreover, metallic contaminants may also be in-volved in reactions with other chemical compounds nor-mally present in groundwater (e.g. carbonates, sulphides,hydroxides) forming solid precipitates. However, since thesolubility of these compounds is strongly dependent on thepH value, the barrier should operate in a given pH range, sothat the precipitates formed are barely soluble and are notre-transformed in a soluble form. At the same time the ac-cumulation of precipitates in the barrier pores progres-sively reduce hydraulic conductivity (NTUA, 2000; Voganet al. 1999; Mackenzie et al., 1999).
If the ZVI oxidation takes place in anaerobic condi-tions (generally prevalent in groundwater) ferrous hydrox-ides are formed according to the following reactions:
Fe0 � Fe2+ + 2e-
2H2O + 2e- � H2 + 2OH-
Fe2++ 2OH- � Fe(OH)2
Fe0+ 2H2O � Fe2+ + H2 + 2OH-
However, the rate of this reaction is slower than thatinvolved in the removal of metallic cations (contaminants),while it is accelerated in aerobic conditions or when the me-tallic cations are removed from groundwater.
Furthermore, at high pH and high Fe2+concentration,the ferrous ion will be further oxidized to the ferric stateFe3+, precipitating as ferric hydroxide and potentially com-promising the hydraulic conductivity of the barrier, accord-ing to the reaction:
Fe3+ + 3OH- � Fe(OH)3
Therefore ZVI is easily corroded in an aqueous envi-ronment, even in the absence of contaminants; oxidation isnot strictly detrimental to PRB performance, in fact, as amatter of fact, the contaminants reducing reactions implyZVI corrosion.
Nevertheless, both iron corrosion and hydroxides for-mation have been generally believed to have a negative in-fluence on the long-term effectiveness of the barrier, be-cause corrosion implies a macroscopic dissolution of ZVI,thus reducing the reactive surface necessary to maintaincontact with the contaminants, and because of the forma-tion, on the reactive metal grains, of a thick layer of passi-vating oxidation products, the so-called “pseudo-pro-tection” layer. According to the “traditional view” on ZVIPRBs, considering contaminants removal mainly due to ox-idation-reduction reactions on the surface of ZVI grains,the presence of this “pseudo-protection” layer, preventingthe water from coming into contact with virgin ZVI, pre-vents further oxidation of iron and subsequent reduction ofmetallic contaminants. A more complex mechanism forcontaminants removal, directly involving corrosion prod-ucts, has been recently proposed (Noubactep, 2008; Nou-bactep, 2006). According this new view, the heavy metalspresent in the contaminated solution are thus removedmainly through three possible processes (Noubactep, 2008;Noubactep, 2006; Rangsivek and Jekel, 2005; Wilkin andMcNeil, 2003; Smith, 1996): reduction (direct reduction onthe surface of ZVI or reduction through Fe2+ at the surfaceof corrosion products); adsorption onto corrosion products;and coprecipitation (precipitating corrosion products thatcan capture contaminants into their structure). Thereforecontaminants removal is possible in three different places:on the ZVI surface, within the corrosion products film andon the surface of corrosion products.
According to Smith (1996), the SiOH sites that arepresent on the pumice surface are also able to remove themetals from the solution according to the reaction:
130 Soils and Rocks, São Paulo, 34(2): 129-137, May-August, 2011.
Moraci et al.

> SiOH + Me2+ � (> SiO- – Me2+)+ + H+
where > represents the pumice surface.Another mechanism for the removal of metals by
pumice is the ionic exchange with alkaline and alkaline-earth metals present in the pumice structure. In fact accord-ing to information provided by the supplier of the pumice(Pumex spa, 2008) the bonds – Si – O–Me, where Me is analkaline or alkaline-earth metal, are easily hydrolyzed toform the active group – Si – OH. Moreover, according tothe results of the research activity carried out on theZVI/Pumice granular mixtures (Moraci et al. 2010) itseems that Pumice can enhance ZVI performance due to itscapacity of storing corrosion products in its pores thus aug-menting the available reactive surface for the reactions and,at the same time, allowing the preservation of the hydraulicconductivity.
3. Materials and MethodsPumice is a volcanic rock with a spongy, vitreous
structure, characterized by a high internal porosity due tothe expansion of magmatic gases during the effusion pro-cess by which it was generated. The pumice used in this re-search comes from the quarries of Lipari (Aeolian Islands,Sicily – Italy); it is a natural complex silicate (Pumex spa,2008) constituted mainly by silica (SiO2 – 71.75%) and byoxides of various elements (e.g. Al2O3 – 12.33%, K2O –4.47%, Na2O – 3.59%, Fe2O3 – 1.98%, MgO – 0.12%, TiO2
– 0.11%, MnO – 0.07%, FeO – 0.02%). In terms of mor-phology, the pumice presents irregularly shaped grains;three different grain size distributions were tested in thepresent research.
The average micropore diameter of pumice grains islower than 5 �m (Rigano, 2007).
Pumice is generally considered chemically inert,since it is insoluble both in water and in acids or bases, ex-cept hydrofluoric acid (HF); it has, as already mentioned, asignificant surface chemical activity due to the presence of– OH groups and mono and polyvalent ions in its chemical
structure; therefore this material is able to form chemicalbonds with organic and inorganic compounds. The pumicefrom Lipari with two different grain size distributions(called 16/40 and 2B) was used (Fig. 1). The uniformity co-efficients, Cu = D60/D10, are, respectively, equal to 2.2 (Pum-ice 16/40) and 1.8 (Pumice 2B). The solid’s unit weight, �s,determined on the non-crushed grains of pumice was, re-spectively, equal to 16 kN/m3 (Pumice 16/40) and 20 kN/m3
(Pumice 2B). The same measurements carried out after thegrains crushing revealed a solid’s unit weight equal to26 kN/m3. The difference between the values is due to theinternal porosity of pumice.
The ZVI used in this research is of the typeFERBLAST RI 850/3.5, distributed by Pometon S.p.A.,Mestre – Italy. The powder is composed mainly of ZVI(> 99.74%), with impurities constituted mainly of Manga-nese (about 0.26%) and traces of oxygen, sulphur and car-bon. The grain size distribution is almost uniform (seeFig. 1) and the specific weight is of 78.5 kN/m3 and the uni-formity coefficients Cu is 2.4.
The solutions used in the column tests were obtainedby mixing either copper nitrate or nickel nitrate with dis-tilled water (Nickel(II) nitrate hexahydrate, purity 99.999;Copper(II) nitrate hydrate, purity 99.999; Sigma-Aldrich).
The assessment of the contaminant concentrations inthe samples collected during the column tests was carriedout by Atomic Absorption Spectrophotometry (AAS – Shi-madzu AA – 6701F – method CNR-IRSA Q.no 64).
To evaluate the performance of the ZVI-Pumice gran-ular mixtures column tests were carried out by letting acontaminated solution to flow through a polymethyl metha-crylate (PMMA – Plexiglas) column (internal diame-ter = 5 cm; height = 100 cm) filled with the reactivemedium. Each column had 9 sampling ports (Fig. 2), in cor-respondence with, respectively, the inlet and the outlet andthe other 7 in between (i.e. 3, 8, 18, 28, 38, 58, 78 cm fromthe inlet).
The columns tests were performed with a constant up-ward flow (equal to 0.5 mL/min) using either a copper or anickel solution. The constant flow was maintained duringthe test by using a precision peristaltic pump (Ismatec ISM930). Five reactive media were used: ZVI; Pumice 16/40;three granular mixtures of ZVI and Pumice 2B (50:50,30:70 and 10:90 weight ratio respectively). Pumice 2B wasselected for granular mixtures according to the results ofpreliminary batch tests (not reported in this paper). The ex-perimental program and the main characteristics of the dif-ferent tests are reported in Table 1.
To assess the capacity of the mixtures to maintain anadequate long-term permeability, in the column tests car-ried out using the 10:90 ZVI-Pumice granular mixture, hy-draulic conductivity was measured by constant headpermeability tests. To make a direct comparison of the hy-draulic performance of respectively ZVI and ZVI-Pumicegranular mixture PRBs, the hydraulic conductivity was also
Soils and Rocks, São Paulo, 34(2): 129-137, May-August, 2011. 131
Long-Term Efficiency of Zero-Valent Iron - Pumice Granular Mixtures for the Removal of Copper or Nickel From Groundwater
Figure 1 - Grain size distribution curves for Pumice and ZVI.

measured in two columns filled with ZVI only and fed withthe same contaminated solution of the 10:90 ZVI-Pumicegranular mixture columns (see Table 1). Aqueous samplesfor chemical analyses were not collected from iron filledcolumns since they were used only as a benchmark for hy-draulic conductivity tests.
In order to have a better understanding of the chemi-cal mechanisms involved in the heavy metal removal, at theend of the test carried out on the columns filled with a gran-ular mixture of ZVI and Pumice (weight ratio 10:90), asample of the reactive medium was collected from the col-umn inlet zone, the iron was magnetically separated frompumice and the two materials were dried in nitrogen atmo-sphere to prevent further reaction with the oxygen in the air.Nevertheless it was impossible to avoid air contact com-
pletely, especially during the extraction from the column,the drying and the preparation of the samples for the analy-ses. Furthermore, microscopic observation showed smallpumice grains merged on the surface of iron grains whilepumice samples appeared free of any iron inclusion.
Samples were analyzed using X-ray diffraction (XRD– Bruker D8 ADVANCE) and X-ray fluorescence (XRF –Bruker S2 RANGER).
4. Analysis of Experimental Results
The column tests results are shown in Table 2 and inFigs. 3 to 9. In particular, Figs. 3 to 6 present the tests re-sults in terms of relative concentration (C/C0, where C is themeasured contaminant concentration in the samples col-lected and C0 is the contaminant concentration at the inlet),
132 Soils and Rocks, São Paulo, 34(2): 129-137, May-August, 2011.
Moraci et al.
Figure 2 - Columns tests setup.
Table 1 - Column tests experimental program.
Contaminant Initial concentr.(mg/L)
Reactive medium Limit conc. Ground-water (mg/L)
ZVI(g)
Pumice(g)
PV(L)
Copper 50 ZVI 1 7850 - 0.97
Copper 50 Pumice 16/40 1 - 1015 1.33
Copper 50 ZVI-Pumice 2B; Weight Ratio 50:50 1 1240 1240 1.18
Copper 50 ZVI-Pumice 2B; Weight Ratio 30:70 1 595 1387 1.19
Copper 500 ZVI-Pumice 2B; Weight Ratio 10:90 1 155 1395 1.25
Nickel 5 ZVI 0.02 7850 - 0.97
Nickel 5 ZVI-Pumice 2B; Weight Ratio 50:50 0.02 1240 1240 1.18
Nickel 5 ZVI-Pumice 2B; Weight Ratio 30:70 0.02 595 1387 1.19
Nickel 40 ZVI-Pumice 2B; Weight Ratio 10:90 0.02 153 1374 1.26

in time for ZVI-Pumice granular mixtures (weight ratio30:70 and 10:90) for copper and nickel. Figures 7 and 8show the trend of the contaminant specific mass removal(mass of contaminant removed for each gram of reactivemedium) for the tests carried out using a granular mixturewith a weight ratio of 10:90 for copper and nickel respec-tively. Figure 9 shows the variation in the hydraulic con-ductivity for the tests carried out using either the ZVI/Pum-ice granular mixture (weight ratio 10:90) or ZVI only.
The column tests results confirmed that granular mix-tures of ZVI and Pumice, in different weight ratios (except-ing the 10:90 granular mixture for nickel) have a significantremediation capacity for groundwater contaminated by ei-ther copper or nickel, reaching results both in terms of con-centration and mass removed at the outlet of the columncomparable (concentrations and mass removal at the outletof the column are in the same order of magnitude) to thoseof the columns containing ZVI only but using a signifi-cantly lower amount of this reagent (see Table 2). In all col-umns tests the final pollutant concentration (CF) reachedvalues well below the limit stated in the Italian Regulation(Gazzetta Ufficiale della Repubblica Italiana, 2006); theonly exception being constituted by the tests carried out us-ing pumice alone or a granular mixture 10:90 and 40 mg/Lnickel (Table 2), due, in the former, to the limited pumiceefficiency and in the latter to the high contaminant concen-tration. The performance of granular mixtures with 30:70and 50:50 weight ratio is very similar notwithstanding thehigher ZVI content of the latter.
In the test carried out using a 50 mg/L Copper solu-tion or a 5 mg/L Nickel solution (Figs. 3 and 4), both for thecolumn using only ZVI as reactive medium and the mixturebetween ZVI and Pumice (weight ratio 30:70), the contami-nant was almost completely removed in the first 3 cm of thecolumn (Fig. 10). This circumstance is due to the fact thatthe mass of ZVI used in the columns greatly exceeds theamount necessary to remove the mass of contaminant flow-ing through the column during the test and to achieve thedesired final concentration. This fact is proven by the evi-dent corrosion only of the first layers of the filling materialof the column, up to the first sampling port.
The fact that Figs. 3 and 4 present a steady trend isdue to the limited duration of the transient period of the re-action that was probably already completed before the firstsampling.
Table 2 clearly shows that the removal capacity of thepumice is limited and not sufficient alone to remedy severecontamination; in fact the column removal capacity was al-ready exhausted after 528 h without reaching the allowedlimit concentration.
The column tests carried out using ZVI-Pumice gran-ular mixtures with weight ratio of 10:90 and highly contam-inated solutions (Copper 500 mg/L and Nickel 40 mg/L, seeFigs. 5 and 6) allowed the complete exhaustion of the reac-tive medium and the possibility to calculate the limit re-
Soils and Rocks, São Paulo, 34(2): 129-137, May-August, 2011. 133
Long-Term Efficiency of Zero-Valent Iron - Pumice Granular Mixtures for the Removal of Copper or Nickel From Groundwater
Tab
le2
-C
olum
nte
sts
resu
lts.
Con
tam
inan
t/In
itial
conc
.(m
g/L
)/R
eact
ive
m.
Tes
tdur
atio
n(h
)Po
lluta
ntm
ass
flow
ed(g
)M
assi
cdi
scha
rge
(mg/
s)C
F
(mg/
L)
Spec
ific
rem
oval
(gco
nt./
gre
ac.m
.)M
ass
rem
oval
Cop
per
/50
/ZV
I10
321.
548
4.17
*10-4
0.00
41.
97*1
0-499
.993
%
Cop
per
/50
/Pum
ice
16/4
052
80.
792
4.17
*10-4
50*
2.49
*10-4
§18
.970
%
Cop
per
/50
/Mix
ZV
I-Pu
mic
e2B
;W.R
atio
50:5
010
321.
548
4.17
*10-4
0.00
71.
25*1
0-399
.981
%
Cop
per
/50
/Mix
ZV
I-Pu
mic
e2B
;W.R
atio
30:7
010
321.
548
4.17
*10-4
0.04
2.6*
10-3
99.9
01%
Cop
per/
500
/Mix
ZV
I-Pu
mic
e2B
;W.R
atio
10:9
015
0022
.555
4.17
*10-3
0.5
1.45
*10-2
/1.1
9*10
-1§§
99.7
76%
Nic
kel/
5/Z
VI
1032
0.15
54.
17*1
0-50.
002
1.97
*10-5
99.9
45%
Nic
kel/
5/M
ixZ
VI-
Pum
ice
2B;W
.Rat
io50
:50
1032
0.15
54.
17*1
0-50.
003
6.24
*10-5
99.9
97%
Nic
kel/
5/M
ixZ
VI-
Pum
ice
2B;W
.Rat
io30
:70
1032
0.15
54.
17*1
0-50.
005
7.81
*10-5
99.9
95%
Nic
kel/
40/M
ixZ
VI-
Pum
ice
2B;W
.Rat
io10
:90
1500
1.61
23.
33*1
0-437
.14*
*3.
65*1
0-4/5
.19*
10-4§§
30.7
59%
*M
inim
umco
ncen
trat
ion
duri
ngth
ete
steq
ualt
o2.0
mg/
L(m
easu
red
atth
eou
tletf
orT
=24
h).
**M
inim
umco
ncen
trat
ion
duri
ngth
ete
steq
ualt
o0.
3m
g/L
(mea
sure
dat
the
outle
tfor
T=
80,7
5h)
.§
Lim
itre
mov
al.
§§L
imit
rem
oval
calc
ulat
edfo
rth
esa
mpl
ing
port
at8
cmfr
omth
ein
let.
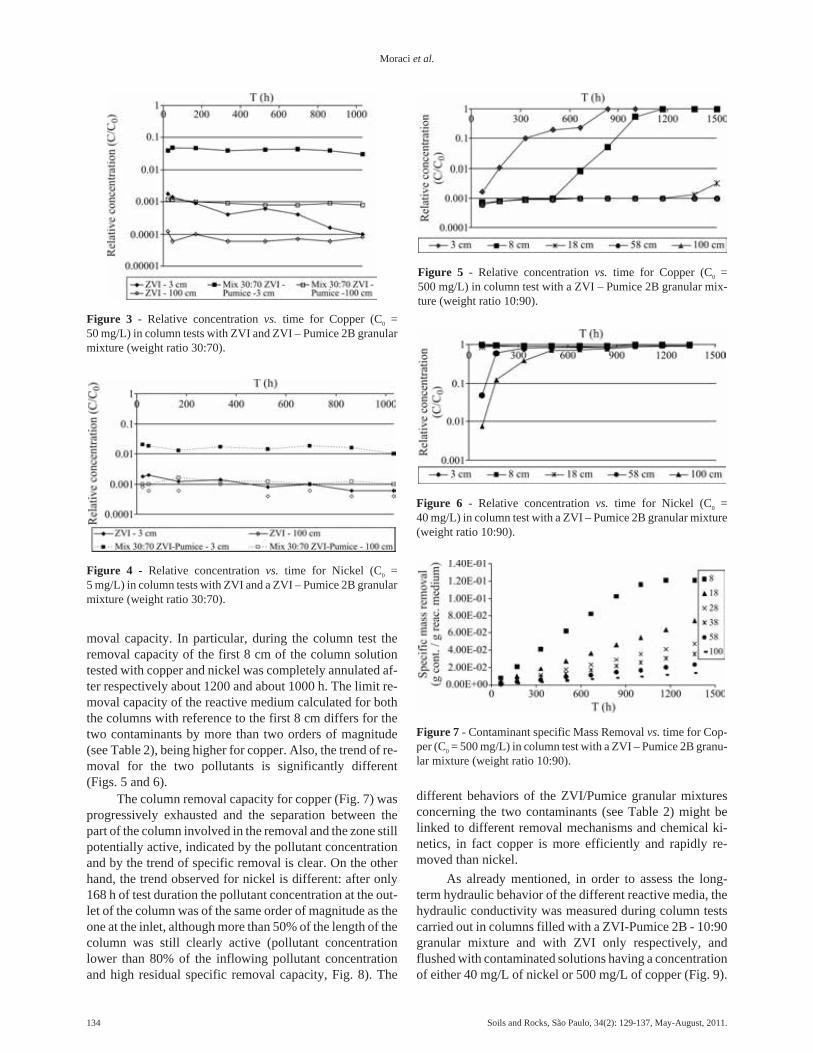
moval capacity. In particular, during the column test theremoval capacity of the first 8 cm of the column solutiontested with copper and nickel was completely annulated af-ter respectively about 1200 and about 1000 h. The limit re-moval capacity of the reactive medium calculated for boththe columns with reference to the first 8 cm differs for thetwo contaminants by more than two orders of magnitude(see Table 2), being higher for copper. Also, the trend of re-moval for the two pollutants is significantly different(Figs. 5 and 6).
The column removal capacity for copper (Fig. 7) wasprogressively exhausted and the separation between thepart of the column involved in the removal and the zone stillpotentially active, indicated by the pollutant concentrationand by the trend of specific removal is clear. On the otherhand, the trend observed for nickel is different: after only168 h of test duration the pollutant concentration at the out-let of the column was of the same order of magnitude as theone at the inlet, although more than 50% of the length of thecolumn was still clearly active (pollutant concentrationlower than 80% of the inflowing pollutant concentrationand high residual specific removal capacity, Fig. 8). The
different behaviors of the ZVI/Pumice granular mixturesconcerning the two contaminants (see Table 2) might belinked to different removal mechanisms and chemical ki-netics, in fact copper is more efficiently and rapidly re-moved than nickel.
As already mentioned, in order to assess the long-term hydraulic behavior of the different reactive media, thehydraulic conductivity was measured during column testscarried out in columns filled with a ZVI-Pumice 2B - 10:90granular mixture and with ZVI only respectively, andflushed with contaminated solutions having a concentrationof either 40 mg/L of nickel or 500 mg/L of copper (Fig. 9).
134 Soils and Rocks, São Paulo, 34(2): 129-137, May-August, 2011.
Moraci et al.
Figure 3 - Relative concentration vs. time for Copper (C0 =50 mg/L) in column tests with ZVI and ZVI – Pumice 2B granularmixture (weight ratio 30:70).
Figure 4 - Relative concentration vs. time for Nickel (C0 =5 mg/L) in column tests with ZVI and a ZVI – Pumice 2B granularmixture (weight ratio 30:70).
Figure 6 - Relative concentration vs. time for Nickel (C0 =40 mg/L) in column test with a ZVI – Pumice 2B granular mixture(weight ratio 10:90).
Figure 5 - Relative concentration vs. time for Copper (C0 =500 mg/L) in column test with a ZVI – Pumice 2B granular mix-ture (weight ratio 10:90).
Figure 7 - Contaminant specific Mass Removal vs. time for Cop-per (C0 = 500 mg/L) in column test with a ZVI – Pumice 2B granu-lar mixture (weight ratio 10:90).
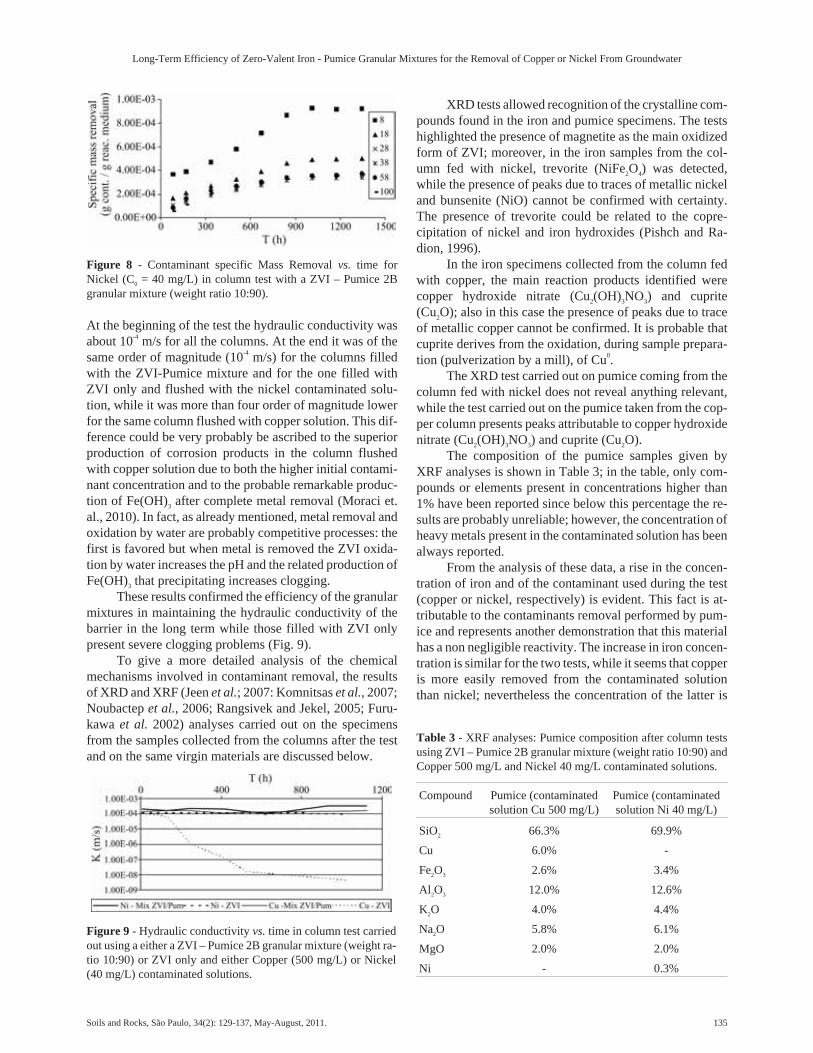
At the beginning of the test the hydraulic conductivity wasabout 10-4 m/s for all the columns. At the end it was of thesame order of magnitude (10-4 m/s) for the columns filledwith the ZVI-Pumice mixture and for the one filled withZVI only and flushed with the nickel contaminated solu-tion, while it was more than four order of magnitude lowerfor the same column flushed with copper solution. This dif-ference could be very probably be ascribed to the superiorproduction of corrosion products in the column flushedwith copper solution due to both the higher initial contami-nant concentration and to the probable remarkable produc-tion of Fe(OH)3 after complete metal removal (Moraci et.al., 2010). In fact, as already mentioned, metal removal andoxidation by water are probably competitive processes: thefirst is favored but when metal is removed the ZVI oxida-tion by water increases the pH and the related production ofFe(OH)3 that precipitating increases clogging.
These results confirmed the efficiency of the granularmixtures in maintaining the hydraulic conductivity of thebarrier in the long term while those filled with ZVI onlypresent severe clogging problems (Fig. 9).
To give a more detailed analysis of the chemicalmechanisms involved in contaminant removal, the resultsof XRD and XRF (Jeen et al.; 2007: Komnitsas et al., 2007;Noubactep et al., 2006; Rangsivek and Jekel, 2005; Furu-kawa et al. 2002) analyses carried out on the specimensfrom the samples collected from the columns after the testand on the same virgin materials are discussed below.
XRD tests allowed recognition of the crystalline com-pounds found in the iron and pumice specimens. The testshighlighted the presence of magnetite as the main oxidizedform of ZVI; moreover, in the iron samples from the col-umn fed with nickel, trevorite (NiFe2O4) was detected,while the presence of peaks due to traces of metallic nickeland bunsenite (NiO) cannot be confirmed with certainty.The presence of trevorite could be related to the copre-cipitation of nickel and iron hydroxides (Pishch and Ra-dion, 1996).
In the iron specimens collected from the column fedwith copper, the main reaction products identified werecopper hydroxide nitrate (Cu2(OH)3NO3) and cuprite(Cu2O); also in this case the presence of peaks due to traceof metallic copper cannot be confirmed. It is probable thatcuprite derives from the oxidation, during sample prepara-tion (pulverization by a mill), of Cu0.
The XRD test carried out on pumice coming from thecolumn fed with nickel does not reveal anything relevant,while the test carried out on the pumice taken from the cop-per column presents peaks attributable to copper hydroxidenitrate (Cu2(OH)3NO3) and cuprite (Cu2O).
The composition of the pumice samples given byXRF analyses is shown in Table 3; in the table, only com-pounds or elements present in concentrations higher than1% have been reported since below this percentage the re-sults are probably unreliable; however, the concentration ofheavy metals present in the contaminated solution has beenalways reported.
From the analysis of these data, a rise in the concen-tration of iron and of the contaminant used during the test(copper or nickel, respectively) is evident. This fact is at-tributable to the contaminants removal performed by pum-ice and represents another demonstration that this materialhas a non negligible reactivity. The increase in iron concen-tration is similar for the two tests, while it seems that copperis more easily removed from the contaminated solutionthan nickel; nevertheless the concentration of the latter is
Soils and Rocks, São Paulo, 34(2): 129-137, May-August, 2011. 135
Long-Term Efficiency of Zero-Valent Iron - Pumice Granular Mixtures for the Removal of Copper or Nickel From Groundwater
Figure 8 - Contaminant specific Mass Removal vs. time forNickel (C0 = 40 mg/L) in column test with a ZVI – Pumice 2Bgranular mixture (weight ratio 10:90).
Table 3 - XRF analyses: Pumice composition after column testsusing ZVI – Pumice 2B granular mixture (weight ratio 10:90) andCopper 500 mg/L and Nickel 40 mg/L contaminated solutions.
Compound Pumice (contaminatedsolution Cu 500 mg/L)
Pumice (contaminatedsolution Ni 40 mg/L)
SiO2 66.3% 69.9%
Cu 6.0% -
Fe2O3 2.6% 3.4%
Al2O3 12.0% 12.6%
K2O 4.0% 4.4%
Na2O 5.8% 6.1%
MgO 2.0% 2.0%
Ni - 0.3%
Figure 9 - Hydraulic conductivity vs. time in column test carriedout using a either a ZVI – Pumice 2B granular mixture (weight ra-tio 10:90) or ZVI only and either Copper (500 mg/L) or Nickel(40 mg/L) contaminated solutions.
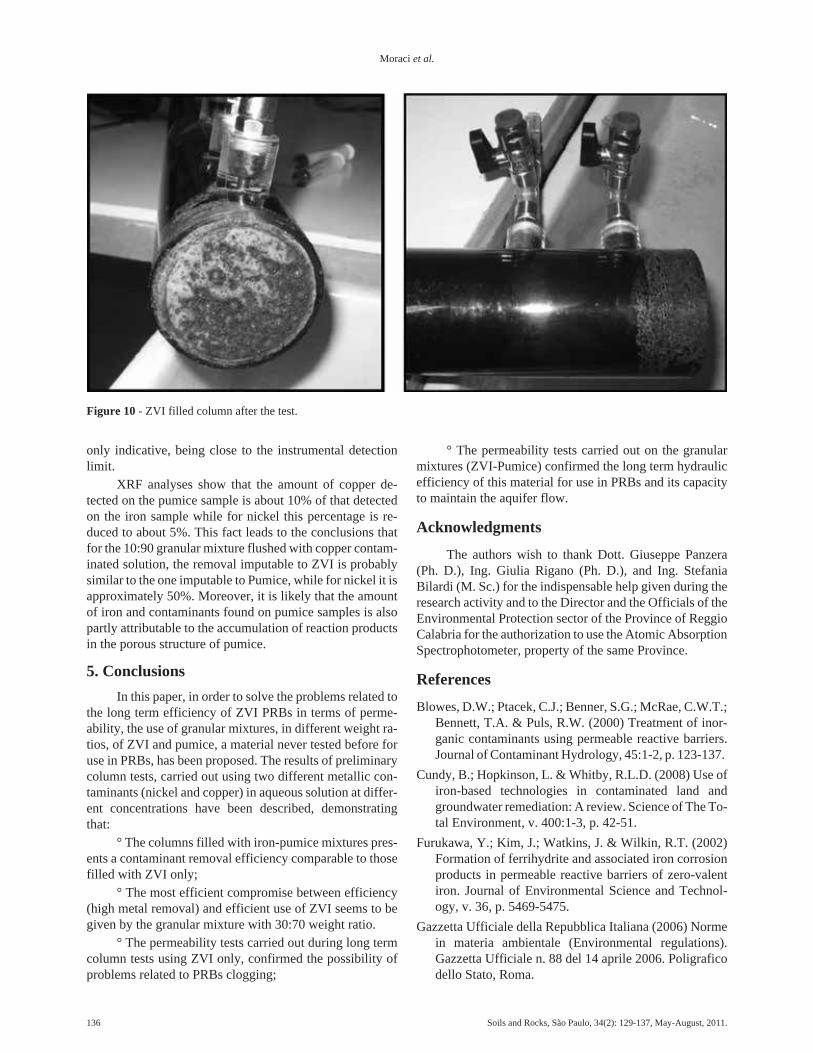
only indicative, being close to the instrumental detectionlimit.
XRF analyses show that the amount of copper de-tected on the pumice sample is about 10% of that detectedon the iron sample while for nickel this percentage is re-duced to about 5%. This fact leads to the conclusions thatfor the 10:90 granular mixture flushed with copper contam-inated solution, the removal imputable to ZVI is probablysimilar to the one imputable to Pumice, while for nickel it isapproximately 50%. Moreover, it is likely that the amountof iron and contaminants found on pumice samples is alsopartly attributable to the accumulation of reaction productsin the porous structure of pumice.
5. Conclusions
In this paper, in order to solve the problems related tothe long term efficiency of ZVI PRBs in terms of perme-ability, the use of granular mixtures, in different weight ra-tios, of ZVI and pumice, a material never tested before foruse in PRBs, has been proposed. The results of preliminarycolumn tests, carried out using two different metallic con-taminants (nickel and copper) in aqueous solution at differ-ent concentrations have been described, demonstratingthat:
° The columns filled with iron-pumice mixtures pres-ents a contaminant removal efficiency comparable to thosefilled with ZVI only;
° The most efficient compromise between efficiency(high metal removal) and efficient use of ZVI seems to begiven by the granular mixture with 30:70 weight ratio.
° The permeability tests carried out during long termcolumn tests using ZVI only, confirmed the possibility ofproblems related to PRBs clogging;
° The permeability tests carried out on the granularmixtures (ZVI-Pumice) confirmed the long term hydraulicefficiency of this material for use in PRBs and its capacityto maintain the aquifer flow.
Acknowledgments
The authors wish to thank Dott. Giuseppe Panzera(Ph. D.), Ing. Giulia Rigano (Ph. D.), and Ing. StefaniaBilardi (M. Sc.) for the indispensable help given during theresearch activity and to the Director and the Officials of theEnvironmental Protection sector of the Province of ReggioCalabria for the authorization to use the Atomic AbsorptionSpectrophotometer, property of the same Province.
References
Blowes, D.W.; Ptacek, C.J.; Benner, S.G.; McRae, C.W.T.;Bennett, T.A. & Puls, R.W. (2000) Treatment of inor-ganic contaminants using permeable reactive barriers.Journal of Contaminant Hydrology, 45:1-2, p. 123-137.
Cundy, B.; Hopkinson, L. & Whitby, R.L.D. (2008) Use ofiron-based technologies in contaminated land andgroundwater remediation: A review. Science of The To-tal Environment, v. 400:1-3, p. 42-51.
Furukawa, Y.; Kim, J.; Watkins, J. & Wilkin, R.T. (2002)Formation of ferrihydrite and associated iron corrosionproducts in permeable reactive barriers of zero-valentiron. Journal of Environmental Science and Technol-ogy, v. 36, p. 5469-5475.
Gazzetta Ufficiale della Repubblica Italiana (2006) Normein materia ambientale (Environmental regulations).Gazzetta Ufficiale n. 88 del 14 aprile 2006. Poligraficodello Stato, Roma.
136 Soils and Rocks, São Paulo, 34(2): 129-137, May-August, 2011.
Moraci et al.
Figure 10 - ZVI filled column after the test.

Jeen, S.; Jambor, J.; Blowes, W. D. & Gillham, R. (2007)Precipitates on granular iron in solutions containing cal-cium carbonate with trichloroethene and hexavalentchromium. Journal of Environonmental Science andTechnology, v. 41 p. 1989-1994.
Komnitsas, K.; Bartzas, G.; Fytas, K. & Paspaliaris, I.(2007) Long- term efficiency and kinetic evaluation ofZVI barriers during clean-up of copper containing solu-tions. Minerals Engineering, 20 p. 1200-1209.
Li, L.; Benson, C.H. & Lawson, E.M. (2006) Modeling po-rosity reductions caused by mineral fouling in continu-ous-wall permeable reactive barriers. Journal of Conta-minant Hydrology, v. 83:1-2, p.89-121.
Li, L.; Benson, C.H. & Lawson, E.M. (2005) Impact ofmineral fouling on hydraulic behavior of permeable re-active barriers. Ground Water, v. 43:4, p. 582-596.
Liang, L.; Moline, G.R.; Kamolpornwijit, W. & West, O.R.(2005) Influence of hydrogeochemical processes onzero-valent iron reactive barrier performance: A fieldinvestigation. Journal of Contaminant Hydrology,v. 78:4, p. 291-312.
Mackenzie, P.; Horney, D. & Sivavec, T. (1999) Mineralprecipitation and porosity losses in granular iron col-umns. Journal of Hazardous Materials, v. 68:1-2,p. 1-17.
National Technical University of Athens (2000) LiteratureReview: Reactive Materials and Attenuation Processesfor Permeable Reactive Barriers. Project on Long TermPerformance of Permeable Reactive Barriers used forthe Remediation of Contaminated Groundwater. Pro-ject Contract Number: EVK1-CT-1999-00035. WebSite: www.perebar. bam.de.
Moraci, N.; Calabrò, P.S. & Bilardi, S. (2010) Efficiency ofzero valent iron/pumice granular mixtures in simulta-neous removal of copper and nickel. Proceedings ofHazardous and Industrial Waste Management Confer-ence, Chania.
Morrison, S.J.; Metzler, D.R. & Dwyer, B.P. (2002) Re-moval of As, Mn, Mo, Se, U, V and Zn from groundwa-ter by zero-valent iron in a passive treatment cell: reac-tion progress modelling. Journal of ContaminantHydrology, v. 56:1-2, p. 96-116.
Noubactep, C. (2006) Contaminant reduction at the surfaceof elemental iron: the end of a myth. WissenschaftlicheMitteilungen, v. 31, p. 173-179.
Noubactep, C. (2008) A critical review on the mechanismof contaminant removal in Fe0-H2O systems. Environ-mental Technologies, v. 29:8, p. 909-920.
Noubactep, C.; Schoner, A. & Meinrath, G. (2006) Mecha-nism of uranium removal from the aqueous solution byelemental iron. Journal of Hazardous Materials B,v. 132, p. 202-212.
Pishch, I.V.; Radion, E.V. (1996) A pigment based oncoprecipitated iron(III) and nickel(II) hydroxides. Glassand Ceramics, v. 53:6, p.178-179.
Pumex spa (2008) Lipari Pumice. Website http://www.pumex.it/pumex%20inglese.pdf. Accessed October 1,2008.
Rangsivek, R.& Jekel, M.R. (2005) Removal of dissolvedmetals by zero-valent iron (ZVI): Kinetics, equilibria,processes and implications for stormwater runoff treat-ment. Water Research, v. 39, p. 4153-4163.
Rigano, G. (2007) Studio dell’efficienza di Barriere Per-meabili Reattive per la bonifica di acquiferi contaminatida metalli pesanti. Ph. D. Thesis Università degli StudiMediterranea di Reggio Calabria.
Smith, E.H. (1996) Uptake of heavy metals in batch sys-tems by a recycled iron-bearing material. Water Re-search, v. 30:10, p. 2424-2434.
Thiruvenkatachari, R.; Vigneswaran, S. & Naidu, R.(2008) Permeable reactive barrier for groundwater re-mediation. Journal of Industrial and Engineering Chem-istry, v. 14:2, p. 145-156.
USEPA (1998) Permeable Reactive Barrier Technologiesfor Contaminant Remediation. EPA/600/R-98/125.
USEPA (2004) Evaluation of Permeable Reactive BarrierPerformance. EPA 542-R-04-004.
Vogan, J.L.; Focht, R.M.; Clark, D.K. & Graham, S.L.(1999) Performance evaluation of a permeable reactivebarrier for remediation of dissolved chlorinated sol-vents in groundwater. Journal of Hazardous Materials,v. 68:1-2, p. 97-108.
Wilkin, R.T. and McNeil, M.S. (2003) Laboratory evalua-tion of zero-valent iron to treat water impacted by acidmine drainage. Chemosphere, v. 53:7, p. 715-725.
Soils and Rocks, São Paulo, 34(2): 129-137, May-August, 2011. 137
Long-Term Efficiency of Zero-Valent Iron - Pumice Granular Mixtures for the Removal of Copper or Nickel From Groundwater

Back Analysis of a Landslide in a Residual Soil Slopein Rio de Janeiro, Brazil
Denise Maria Soares Gerscovich, Eurípedes do Amaral Vargas Jr., Tacio Mauro Pereira de Campos
Abstract. After a short period of relatively intense rainfall, a deep-seated landslide occurred in a slope in Rio de Janeiro.On the following day, field inspection revealed full saturation of the failure mass, despite the inexistence of groundwater inthe slope. A comprehensive experimental investigation was undertaken to determine the geotechnical parameters of theresidual soil. A numerical modeling study of the infiltration processes revealed that the rainfall amount was insufficient toreproduce the saturation condition of the failure surface. This paper introduces the slope stability approach aiming to verifyif the factor of safety would reflect a stable condition under the pluviometric records that occurred before the landslide.Therefore, 2D limit equilibrium analyses were accomplished, considering the different hydrological scenarios that wereconceived for the flow simulations. The geotechnical parameters were defined according to laboratory test carried out onsamples extracted from the slide surface and from an undisturbed site. Pore pressure distributions were obtained fromprevious results of flow simulations. Regardless of the geometry of the failed mass, the analyses indicated that the landslidecould not be triggered solely by rain infiltration. Amongst various alternatives, a preferential flow through the bedrockfractured layer revealed to be the only feasible scenario that could reproduce not only the saturated condition, but also a FSvalue close to 1. Despite the usual approach of identifying the landslide as a rainstorm-induced mechanism, it appears to bemore complex and other infiltration sources may play an essential role.Keywords: unsaturated soil, residual soil, transient flow, rainfall, stability analysis, landslide.
1. Introduction
Rio de Janeiro city is located in the southeastern re-gion of Brazil. Its mountainous landscape associated to atropical humid climate results in slopes of unsaturated re-sidual soil with thickness that may vary from a few centi-meters to dozen of meters. Rain-induced soil and/or rockmass movements are quite frequent, during or immediatelyafter periods of intense rainfall.
Despite the considerable progress in the understand-ing of the behavior of unsaturated soils, it is actually verydifficult to predict when or where a landslide may happen.Nevertheless, it is recognized that rainfall-induced land-slides are caused by changes in pore water pressures.
Many authors have attempted to address the probablecauses of landslides (e.g. Kim et al., 2004; Capra et al.,2003; Gasmo et al., 2000; Au, 1998; Costa Nunes et al.,1989; Wolle & Hachich, 1989; Vargas et al., 1986). Shal-low failures may be attributed to the deepening of a wettingfront into the slope, which results in a decrease of matricsuction or to the development of the weathering process ofsteep slopes. Large landslides and debris flows usually re-sult from the development of positive pore pressures thatcomes along with fully saturation of the soil mass. This sce-nario may be achieved when infiltrating water encounters a
low permeability soil layer and a transient perched water ta-ble occurs (Capra et al., 2003) or when water infiltratesthrough fractured layers of the bedrock (Dietrich et al.,1986; Wilson, 1988; Vargas Jr. et al., 1990). Further studieshave also illustrated that positive pore pressure generationalong the failure surface may be produced by the crushingof soil grains resulting in a liquefied soil condition (Wang& Sassa, 2003) or as a consequence of soil contraction thatoriginates at the sliding surface and spreads to the unsatu-rated soil mass (Capra et al., 2003).
In February 1988, a considerable number of soil/rockslides occurred in various slopes in Rio de Janeiro city.Most of them were shallow and quite long in extension(100-150 m) and were classified as being amongst the larg-est that have occurred in the city. The pluviometric datacorresponding to 21 days indicated an accumulated amountof 515.6 mm, with a rain peak of 85.4 mm in a single day.
Nine months later, in November, a deep-seated slideoccurred in a re-vegetated slope (Fig. 1) after a period of amedium intensity rainfall. After 21 days, the accumulatedrainfall amount was 246.3 mm, with a maximum rain peakof 57.5 mm (Fig. 2). The failure caused structural and mate-rial damages to an adjacent building, with the shearing ofone pillar and complete destruction of one apartment. Sev-
Soils and Rocks, São Paulo, 34(2): 139-149, May-August, 2011. 139
Back Analysis of a Landslide in a Residual Soil Slope in Rio de Janeiro, Brazil
Denise Maria Soares Gerscovich, Departamento de Estruturas e Fundações Universidade do Estado do Rio de Janeiro, Rio de Janeiro, RJ, Brazil. e-mail:[email protected]ípedes do Amaral Vargas Jr., Departamento de Engenharia Civil, Pontifícia Pontifícia Universidade Católica do Rio de Janeiro, Rio de Janeiro, RJ, Brazil. e-mail:[email protected] Mauro Pereira de Campos, Departamento de Engenharia Civil, Pontifícia Universidade Católica do Rio de Janeiro, Rio de Janeiro, RJ, Brazil. e-mail:[email protected] on July 15, 2010; Final Acceptance on January 11, 2011; Discussion open until December 30, 2011.

eral cars in external and internal building parking areaswere also damaged. Fortunately, nobody was injured. De-spite no evidence of groundwater within the slope, on thefollowing day and continuously for the following week af-ter the slide, there were clear indications of full saturationof the failure surface, with groundwater springs in its upperregion.
Figure 3 shows a schematic topographic plan of thesite before the landslide. The slope crest has a maximum el-evation of 384 m and surface inclinations ranging from 30°
to 55°. At the toe of the slope there was a gravity wallaligned with an anchored wall, located at the rear of Build-ing A. The superficial drainage system, located in the upperregion of the slope, was presumably malfunctioning, sinceblockage of the channel adjacent to the slide was observedduring field inspections.
Preliminary analyses disregarded the hypothesis offailure of the retaining wall structure as the shape of thefailure surface suggested a major tendency of soil move-ment over the wall crest. There was also no evidence thatthe accumulated rainfall could have raised the water table,which was located at a considerable depth below groundlevel. Using a simple one-dimensional water balance, onecan prove that a large amount of water would be required toachieve soil saturation. Considering, for example, the aver-age depth of the sliding mass to be approximately 5 m, fullydrained condition and typical values of porosity (n = 0.38)and volumetric water content (� = Vw/V = 0.1), then the dif-ference between both parameters gives the available vol-ume of voids to be filled. Therefore, full saturation of theprofile would require at least 1400 mm of infiltrating water.Besides this unrealistic value, the actual volume of waterthat infiltrates, compared to the rainfall rate, depends,among other factors, on the initial soil moisture condition,slope angle, vegetation type, etc. Consequently, the amountof infiltration would be less than the values predicted by thepluviometers data. Nevertheless, the triggering mechanismwas undoubtedly associated to changes in the pore water
140 Soils and Rocks, São Paulo, 34(2): 139-149, May-August, 2011.
Gerscovich et al.
Figure 1 - Slope view on the day after.
Figure 2 - Daily pluviometric data.
Figure 3 - Schematic site plan before landslide.

pressure and it was likely that complex changes of the slopehydrogeology might have occurred.
Numerical 3D-FEM transient flow analyses were car-ried out to identify the infiltration process that could ex-plain field evidence of complete saturation of the failuresurface. Different boundary conditions were conceived andthe results revealed that only major changes of the slopehydrogeology could justify the deep-seated slope failure(Gerscovich et al., 2006).
This paper describes the investigations that were car-ried out after the slope failure in order to define soil stra-tigrafy and the geotechnical parameters of the residualsoils. Slope stability analyses were also performed withpore water meshes previously obtained from transient flowsimulations.
2. Geotechnical Investigation
A comprehensive series of field and laboratory testswas carried out to determine soil profile and geotechnicaland hydrological parameters. Field investigation com-prised seismic refraction surveys, percussion and rotarydrillings. Twenty-one holes were drilled for the installationof fifteen piezometers and six slope indicators, outside theslide area. Maxima piezometers (Brand, 1985) were alsoinstalled at the soil-rock interface to record maximum tran-sient water pressure levels A pluviometric station was in-stalled on the roof of the building, as well. For more detailsregarding field instrumentation refer to Gerscovich et al.(2006).
The soil profile showed depths varying from 0 to15 m and was originated from a gneissic metamorphic rockthat outcropped at the upper and left sides of the landslideboundary. The weathering profile was composed of a su-perficial mature clayey sand residual soil, with an averagethickness of 1 m, underlain by a layer of a sandy matrix
young residual soil (saprolitic soil), with a well definedinherited mineral alignment from the parent rock. The tran-sition between the sound rock and the saprolitic soil is ahighly fractured and weathered rock with a thickness vary-ing within 4 m to 10 m. The mechanical soundings did notindicate the presence of a groundwater level within the soilmass. However, water level was observed in some rotarydrillings within the fractured rock layer. Figure 4 illustratesthe a cross section of the slope behind building B (sectionAA’ - see Fig. 3).
Topographic plans that were generated before and af-ter the slide, aero photos taken between 1966 and 1975, andlogging profiles were used to restore the original geometryof the whole area as well as to define the landslide surface.The failure surface presented an ellipse shape with the rela-tionship width (perpendicular to the movement) and length(along the direction of the movement) of approximately0.6. Figure 5 displays the reconstructed 2D central sectionof the slope and the 3D geometry along with boundaries de-scription.
Block samples were extracted from the slope failuresurface and from a trench located 50 m away from the fail-ure zone. The laboratory investigation comprised geotech-nical characterization, determination of hydraulic parame-ters (hydraulic conductivity and water retention curve) andshear strength tests.
2.1. Soil characterization
Table 1 shows a summary of the characterization testswith the average physical indexes. Two different materialsappeared at the failure surface: an apparently homogeneousand isotropic red-colored mature residual soil, and a greysaprolitic soil, with a well-defined mineral alignment. Atthe trench, only the saprolitic soil was extracted and it wascoarser and denser than the one from the slip surface.
Soils and Rocks, São Paulo, 34(2): 139-149, May-August, 2011. 141
Back Analysis of a Landslide in a Residual Soil Slope in Rio de Janeiro, Brazil
Figure 4 - Cross section behind building B.

The volumetric soil moisture profile of the saproliticsoil extracted from the trench, located behind Building B, isshown in Fig. 6. The results indicated volumetric watercontent around 25% on the surface and a gradual reduction
with depth. Below 2 m deep, this value is approximatelyconstant and equal to 9%.
2.2 Shear strength parameters
Isotropically consolidated drained triaxial tests (CID)were performed on saturated 100 mm-diameter undisturbedsamples of the saprolitic soil extracted from the trench. Thespecimens were molded with the xistosity plane inclinedaround 30° with the horizontal plane. The consolidationstress levels ranged from 25 to 200 kPa and the shearing ve-locity was 0.0122 mm/min. The triaxial chamber allowedfor the use of internal devices for automatic measurementof axial and radial strains and volume changes (water andtotal volume). The variations of air volume were mechani-cally monitored by a bubble trap device (Aguilar, 1990).
Conventional direct shear tests were carried out onsoil samples extracted from the slip surface. The saproliticsoil specimens were molded with the shearing plane paral-lel and perpendicular to the plane of xistosity. In spite of theapparent isotropic condition, the mature soil samples werealso prepared according to perpendicular angles. The sam-ples were initially saturated, prior to the consolidationstage, under normal stresses ranging from 22 to 135 kPa.The shearing velocity was 0.036 mm/min and the shear boxwas assembled with an opening of 0.5 mm between the twohalves.
Figure 7 shows the shear strength test results of thesaprolitic soil and Table 2 summarizes the mean values ofstrength parameters, with no influence of the shear planeangle with respect to the xistosity orientation having beenobserved. The results revealed a reasonable agreement be-tween the direct shear and the triaxial tests of the saproliticsoil, despite the differences on soil characterization.
142 Soils and Rocks, São Paulo, 34(2): 139-149, May-August, 2011.
Gerscovich et al.
Figure 5 - Restored geometry. (a) Central section of the slope. (b)3D geometry and boundaries description.
Figure 6 - Volumetric water content profiles of the saprolitic soilfrom the trench.
Table 1 - Soil characterization.
Location Slip surface Trench
Soil type Saprolitic soil Mature soil Saprolitic soil
Sand (%) 63.0 56.0 82.0
Silt (%) 27.5 34.0 9.8
Clay (%) 9.5 10.0 8.2
�L (%) 38.2 39.5 -
�P (%) NP 24.7 -
� (%) 19.0 21.2 6.4
� (%) 22.4 25.5 10.3
Gs 2.64 2.63 2.66
e 1.19 1.14 0.62
n 0.54 0.53 0.38
�t (kN/m3) 14.0 14.6 17.1
Notes: �L = liquid limit; �L = plasticity limit; � = water content;� = volumetric water content; Gs = specific gravity of grains;e = voids ratio, n = porosity, �t = in situ density.

The Mohr-Coulomb strength envelope of the sapro-litic soil could be fitted by a straight line with effective co-hesion and friction angle equal to 13 kPa and 33°, respec-tively. However, due to the relatively high percentage ofsand, it would be expected a null cohesion within the rangeof low confining stresses. For that reason, the Mohr-Cou-lomb strength envelope would better defined by a bi-linearcurve that is also plotted in Fig. 7. The small thickness ma-ture residual soil provided lower values of strength parame-ters as a result of a more intense weathering process.
The shear strength response of the residual soil underunsaturated condition was determined by direct shear testswith suction control. The tests were carried out on samplesextracted from the slip surface, according to a multi stagetechnique (Ho & Fredlund, 1982), following the wettingpath (Fonseca, 1991; Carrillo et al. 1994). Similarly to thesaturated tests, specimens were molded with shearingplanes parallel and perpendicular to the plane of xistosity.The samples were initially consolidated under a verticalstress of 50 kPa, and then submitted to decreasing suctionsfrom 200 to 15 kPa (de Campos et al., 1994). The shearingvelocity was equal to 0.0366 mm/min.
The shear strength of unsaturated soils is based on theMohr-Coulomb criterion and, according to Fredlund et al.(1978), can be expressed by:
� = c’ + (ua - uw)tg�b + (� - ua) tg�’ (1)
where ua and uw are the pore air and pore water pressures, re-spectively, � is the total normal stress; c’ and �’ are effec-tive strength parameters and �b is the angle indicating therate of increase in shear strength relative to the matric suc-
tion. �b is equal to �’ at low matric suction, and decreases toa lower value at high matric suctions (Tekinsoy et al.,2004).
Figure 8 shows the shear strength results with respectto soil suction. Similar to the saturated soil response, no in-fluence of xistosity plane on the soil strength was observed.The nonlinear relationship between the shear strength andsoil suction was fitted by a bi-linear curve with �b = 33°, forsoil suction up to 115 kPa, and equal to 20°, for higher val-ues. For low soil suctions values, the �b value was equiva-lent to �’.
The similarity between �b and �’, for low values ofmatric suction, was also observed by Rahardjo et al. (1995)in triaxial tests on residual soils of Singapore. Following adrying path, the authors obtained �b equal to 26°, for matricsuctions up to 400 kPa, which was equal to the soil effectivefriction angle �’.
It is worth to note that the relatively high �b values re-vealed the strong influence of the matric suction on theshear strength; thus, any infiltration process promotes asubstantial reduction of the shear strength.
2.3. Hydraulic parameters
The hydraulic conductivities profiles were obtainedby laboratory tests on 100 mm-diameter samples and in thefield by means of Guelph permeameter tests (Reynolds &Elrick, 1987). The results in Fig. 9 reveal a sharp decreaseof the relative hydraulic conductivity (k/ksat) with the in-crease of matric suction, within the first 3 m of the soil pro-file. Below this depth, the hydraulic conductivity parame-ters were considered constant.
Soil-water retention curves (SWCC) were obtainedfrom the saprolitic soil samples from the slip surface, fol-lowing drying and wetting paths. The results, shown inFig. 10, indicated no significant deviation between the wet-ting and drying curves. Characterization of the saproliticsoil of the slip surface (Table 1) indicates that the saturated
Soils and Rocks, São Paulo, 34(2): 139-149, May-August, 2011. 143
Back Analysis of a Landslide in a Residual Soil Slope in Rio de Janeiro, Brazil
Figure 7 - Shear strength of saprolitic soil – saturated condition.
Figure 8 - Unsaturated strength envelope.
Table 2 - Saturated strength parameters.
Test soil Conventional direct shear test Triaxial test
Saprolitic soil Mature soil Saprolitic soil
c’(kPa) 14.6 4.8 9.6
�’(°) 31.8 27.5 34.0
Notes: c’ = effective cohesion; �’ = effective friction angle.

volumetric water content (�s = n x S) is equal to 54%. How-ever, the results suggests a lower value, around 40% that ismainly attributed to entrapped air effects. A more detaileddescription regarding the hydraulic parameters tests anddata interpretation are presented in Gerscovich et al.(2006).
3. Transient Flow Simulations
The general equation that controls steady-unsteadystate flow problems through 3-D saturated-unsaturated po-rous media, usually referred to as Richards’ equation, maybe written as:
��
�
�
� �
xk K
h
xk K C
nS
h
i
ijs
r
p
i
ijs
r s�
�
�
�� � �
� �
��( )
( ) p
t�(2)
where hp is the pressure head, is the matric suction, � isthe volumetric water content (Vw/V), kij
s is the tensor of hy-draulic conductivity at saturation; Kr is the relative hy-
draulic conductivity, which is defined as the relationshipbetween unsaturated and saturated hydraulic conductivi-ties (k/ksat); Kr is a scalar function of the degree of satura-tion (Kr(S)) that varies between 0 and 1; C() is thevolumetric water retention capacity (��/�), given by thetangent to the SWCC, n is the porosity and Ss is the coeffi-cient of specific storage. Ss physically represents the vol-ume of water that a unit volume of porous media releasesfrom storage under a unit decline in hydraulic head (Fre-eze & Cherry, 1979). [Kr kij
s ] represents the effect of the el-evation head, since the equation is written in terms ofpressure head.
A finite element program (FLOW3D) was speciallydeveloped (Gerscovich, 1994) to solve the general flowequation to evaluate flow processes that might have hap-pened within the slope. Its code was derived from FPM500finite element program (Taylor & Brown, 1967), whichperforms flow modeling within saturated soil media. Themajor modifications were based on the paper by Neuman(1973), in order to incorporate the unsaturated and transientconditions.
The mathematical development of the flow equation,built-in in the FLOW3D code, assumes that: i) flow is lami-nar and Darcian; ii) inertial forces, velocity heads, tempera-ture gradients and chemical concentration gradients are allnegligible; iii) soil is linearly elastic and isotropic; iv) hy-draulic properties are not affected by volume changes; v)the air phase is continuous and always in connection withthe constant, external atmospheric pressure; vi) the hys-teretic behaviour of the SWCC is negligible; vii) the effectof soil compressibility on the storage of water under unsat-urated conditions is quite small.
FLOW3D was tested for various steady and unsteadystate flow conditions and geometries. 1D steady-state stateresponse was evaluated by prescribing constant pressureheads at the boundaries of an unsaturated soil profile andcomparing the results with the exact solution. 1D transientflow condition was evaluated by computing the volume ofinfiltrating water and comparing it with Buchanan et al.(1980) results. 2D steady state condition was evaluated bysimulating flow infiltration through a homogeneous earthdam until the development of a phreatic surface that re-mained fixed and similar to Kozeny’s solution. The 3Dtransient flow condition was evaluated by reproducing a 3Dmodel experiment run by Akai et al. (1979). Detailed de-scription of flow tests referrer to Gerscovich et al. (2006).
3.1. Slope geometry and boundary conditions
The 3D mesh comprised 1820 elements and 2436nodes, as shown in Fig. 5b. The small thickness layer, lo-cated at the top of the slope (Fig. 5a), was disregarded in or-der to avoid excessive mesh discretization. It is worthwhileto mention that a 2D analysis of the center cross section ofthe slope revealed that the amount of the rainfall rate was
144 Soils and Rocks, São Paulo, 34(2): 139-149, May-August, 2011.
Gerscovich et al.
Figure 9 - Prescribed relative hydraulic conductivity curves.
Figure 10 - Soil-water retention curve of the saprolitic soil fromthe slip surface.

sufficient to fully saturate the small thickness layer. Conse-quently, its effect was indirectly incorporated by prescrib-ing pressure heads at nodes located at the top boundary.
The lateral boundaries, bottom of the slope, as well asthe slope toe were considered as impervious surfaces. Atthe slope surface, daily rainfall events were simulated byprescribing flow velocities at the surface nodes, accordingto the amounts registered at a pluviometric station, located4 km away from the slope.
The time dependent characteristic of the transientflow through unsaturated soil requires the knowledge of theinitial distribution of matric suction (or soil moisture), pre-vious to the simulation period. Flow modeling assumednull suction at the slope surface and a progressive increaseof matric suction with depth. Below 2 m-depth the soil suc-tion was taken as constant and equal to 200 kPa. These val-ues were assumed by evaluating both the water contentprofile of the saprolitic soil (Fig. 6) and the soil water reten-tion curve (Fig. 10).
3.2. Flow simulation results
Different scenarios of flow infiltration were analyzedin an attempt to reproduce the full saturation of the slopethat was observed the day after the landslide, despite the in-existence of groundwater within the soil mass (Gerscovichet al., 2006).
3.2.1. Case 1: Flow pattern predicted after 21 days ofrainfall recorded in February, 1988
The influence of rainfall intensity was initially evalu-ated by analysing flow patterns considering a more intenserainfall that occurred few months before the landslide. Inthis period, the accumulated rainfall was approximately 2times greater than the registered in November, 1988, priorto the landslide. The results, shown in Fig. 11, indicatedslight changes in pressure head distributions, but no devel-opment of positive pore pressures within the soil slope.This pore-water pressure distribution is in disagreement tofield observation after the landslide, since water wasspringing from the failure surface. This result, therefore,suggests that rain infiltration solely would not be sufficientto produce significant pore-water changes.
3.2.2. Case 2: Flow pattern predicted after 19 days ofrainfall recorded in November, 1988, with an extrapressure head imposed at the top of the slope
The effect of disregarding the small thickness layer,located at the top of the slope, was evaluated by analysingits response to rain infiltration. Thus, a 2D flow analysis ofthis varying thickness layer (Fig. 5a) was carried out and re-vealed that 17 days of rainfall, prior to November 2nd (land-slide day), could easily induce its complete saturation. Inthis study, the initial matric suction was set constant andequal to 10 kPa, the lower and bottom boundaries were im-
pervious and null pressure heads were prescribed at theupper boundary.
The effect of the saturation of the upper layer was in-corporated in the 3D numerical analysis by prescribing hy-drostatic pressure heads at the top boundary nodes. In thisstudy, flow velocities imposed at the nodes of the slope sur-face comprised 19 days of rain events, from October 19th toNovember 7th. Figure 12 presents the pressure head distri-bution predicted at the central section of the slope. Despitethe generation of positive pore pressure at the upper zone,mainly due to the progress of a saturation front, this resultstill did not reproduce the saturation condition of the failuresurface that was verified after the slide.
An additional numerical analysis was carried out inan attempt to evaluate if geometry changes of the slope,produced by the displacement of the soil mass after thelandslide, could accelerate the progression of the saturationfront. This hypothesis was tested by performing a 2D nu-
Soils and Rocks, São Paulo, 34(2): 139-149, May-August, 2011. 145
Back Analysis of a Landslide in a Residual Soil Slope in Rio de Janeiro, Brazil
Figure 11 - Pressure head distribution at the central section of theslope - 3D Analysis (Gerscovich et al., 2006).
Figure 12 - Pressure head distribution in the central section of theslope; prescribed heads at the top of the slope - 3D Analysis(Gerscovich et al., 2006).

merical simulation of the central section of the slope, in-cluding the small thickness layer, located at the top of theslope. In this analysis, a high value of saturated hydraulicconductivity (ksat = 1) was used for the soil above the failuresurface and null pressure heads were prescribed at thenodes at failure surface. The initial moisture conditionswhere equivalent to the ones predicted after 19 days of rainsimulation (Fig. 12) and the remaining boundary conditionswere unchanged. The results confirmed that few hours weresufficient to nearly cause a saturation of the whole soil massand could be a feasible explanation for the saturation condi-tion of the failure surface. However, it could not explain thelandslide, since it was likely that large positive pore-waterpressures would be required to reduce shear strength andcause the soil mass to fail.
3.2.3. Case 3: Flow pattern generated by a rainfall periodof 5 days prior to the landslide and pressure headsprescribed at the top and at the base of the slope
Field investigations indicated the existence of a 4 to10 m thick highly fractured rock layer at the transition ofthe sound rock and saprolitic soil. Maxima piezometersmeasured water levels restricted to this transition layer andconfined to a small area.
The major role of the bedrock in generating highpore-water pressures have already been pointed out byother researchers (Dietrich et al., 1986; Wilson, 1988; Var-gas Jr. et al., 1990). On the other hand, in the current engi-neering practice, it is very difficult not only to identify theexistence of layers with high transmissivities but also toconceive an adequate mathematical model for this condi-tion. Nevertheless, the influence of an eventual preferentialflow through the fracture systems was roughly evaluated byprescribing positive pressure heads at 13 nodes, locatedalong a transversal line of nodes at the base of the 3D mesh,as shown in Fig. 13. At each node, the magnitude of pres-sure head was equivalent to the vertical distance betweenthe node coordinate and the highest point of the slope mesh.This simulation was carried out for a time of approximately6 days, from November 2nd to November 7th. Boundary con-ditions and initial soil suction were similar to the ones usedin the previous analysis. The numerical simulation (Fig. 13)showed that the whole soil mass nearly reached full satura-tion, with high levels of positive pore pressure beenachieved and confirmed the major influence of watersources when they occur at the base of the slope.
4. Slope Stability Analyses
The stability analyses were carried out using the codeSLOPE/W (GEO-SLOPE International Ltd – 2003), whichallows for the computation of safety factors under in 2Dconditions.
The slope profile consisted of a superficial mature re-sidual soil and a variable thickness saprolitic soil layer. Dueto the small thickness of the mature residual soil, this layer
was disregarded and the stability analyses were carried outconsidering a homogeneous material.
The geotechnical parameters were obtained from lab-oratory tests and are listed in Table 3. The non-linearity ofthe effective strength envelope, obtained from Fig. 7, wasadjusted by two straight lines crossing at a confining stressequal to 80 kPa. Due to limitations of the computer pro-gram, the unsaturated strength parameter (�b) was assumedconstant and equal to the average value of the experimentalresults.
It is worthwhile to mention that the strength parame-ters correspond to peak values, as the stress-strain curvesdid not show any loss of strength for high strain levels.
The stability analyses were undertaken for the differ-ent scenarios of flow infiltration previously described. Thepore-water pressure distributions at the central section ofthe slope were incorporated in the SLOPE/W programthrough a mesh of 46 nodes, as the program presents a limi-tation of the maximum number of nodes (50 nodes). The ef-fect of pore air pressure was disregarded.
4.1. Case 1: Flow pattern predicted after 21 days ofrainfall recorded in February, 1988
Figure 14 displays the set of results of Morgenstern &Price method for a slip surface similar to the one observedin situ (FS = 4.1) and for a potential failure surface derived
146 Soils and Rocks, São Paulo, 34(2): 139-149, May-August, 2011.
Gerscovich et al.
Figure 13 - Pressure head distribution – prescribed heads at thetop and at the base of the slope- 3D Analysis (Gerscovich et al.,
Table 3 - Geotechnical parameters.
Soil Parameter Shear stress level (kPa)
� 80.0 > 80.0
�t (kN/m3) 17.5 17.5
c’ (kPa) 0 44.2
�’ (°) 43.7 22
�b (°) 25 25
Notes: �b = rate of increase in shear strength relative to the matricsuction.

from center grid search (FS = 3.5). Both analyses providedhigh factors of safety and the potential failure surfaceshowed an higher initiation point and a larger volume of thedisplaced soil mass.
Shear tests with unsaturated samples indicated a bi-linear relationship between shear strength and matric suc-tion and relatively high �b values. The influence of thematric suction on the safety factor was evaluated by per-forming analyses with �b = 0. The factors of safety obtainedwere relatively high and equal to 1.53 and 1.67, for the cir-cular search and field surfaces, respectively.
Stability analyses were also carried out in order toidentify the likely range of shear strength parameters thatwould result in a FS close to 1. The smallest factors ofsafety (FS = 1.13 and 1.17, for the circular search and fieldsurfaces, respectively) were computed by disregarding theinfluence of the matric suction and using the effectivestrength parameters obtained in the saturated CID tests.
It is worthwhile to emphasize that the analyses werecarried out considering a plane strain condition. The 3Dfeature of the landslide would undoubtedly provide higherfactors of safety.
The computed FS revealed that an ordinary amount ofrain infiltration would not be sufficient to trigger the slopefailure. These results are in accordance to the conclusionsderived from the numerical simulations of rain infiltration,since it did not reproduce the saturated condition of the fail-ure surface.
4.2. Case 2: Flow pattern predicted after 19 days ofrainfall recorded in November, 1988, with an extrapressure head imposed at the top of the slope
The small thickness layer at the top of the slope(Fig. 5a) was disregarded to improve 3D mesh discre-tization. However, full saturation of this region could actu-
ally have happened and imposed an additional boundarycondition. 2D flow simulation of this layer (Fig. 5a) sub-jected to 17 days of rain infiltration, prior to the landslideday, resulted in complete saturation of this soil.
This alternative was taken in account in the 3D flowanalysis by prescribing hydrostatic pressure heads at thenodes located at the upper boundary of the mesh. The 3Dnumerical flow simulation revealed a localized positivepore pressure generation at the upper zone, mainly due tothe progress of a saturation front. At the failure surface thesoil mass remained unsaturated and, therefore, did not re-produce field condition.
Stability analyses, corresponding to the observedfield surface and potential failure surface provided valuesof FS higher than 1.5, as shown in Fig. 15. Thus existenceof a water source at the top of the slope promoted an in-crease of the pore water pressure mesh, which was defi-nitely not sufficient to trigger the landslide.
4.3. Case 3: Flow pattern generated by a rainfall periodof 5 days prior to the landslide and pressure heads pre-scribed at the top and at the base of the slope
The results of the 3D numerical simulations of differ-ent flow scenarios pointed out that, besides rain infiltration,other mechanisms might played a major role on the slopehydrological pattern. Field investigations have indicatedthe existence of a highly fractured rock layer at the transi-tion between the saprolitic soil and the sound rock. Thislayer was, therefore, incorporated in the flow analyses as-suming that preferential flow paths through the fracturescould act as deep water sources at different positions of thebase of the slope. The 3D flow simulation of 6 days of raininfiltration resulted in an almost full saturation condition ofthe whole soil slope (Gerscovich et al., 2006). The loss ofsoil suction followed by generation of positive pore pres-sure appeared as an ideal condition for the landslide. In fact,
Soils and Rocks, São Paulo, 34(2): 139-149, May-August, 2011. 147
Back Analysis of a Landslide in a Residual Soil Slope in Rio de Janeiro, Brazil
Figure 14 - Failure surfaces and Factors of Safety – Case 1. Figure 15 - Failure surfaces and Factors of Safety – Case 2.

the use of a pore water pressure mesh that reproduced thisscenario, resulted in FS values less than 1 (Fig. 16) and,confirmed the assumption that the rainfall amount itselfwould not sufficient to justify the soil failure.
5. ConclusionsIn an attempt to identify the triggering mechanism of
the deep-seated slide of a slope, in Rio de Janeiro, Brazil, acomprehensive experimental investigation, 3D numericalflow analyses and stability analyses were undertaken. Thelandslide occurred after a rainfall period and despite the un-saturated soil condition, on the following day and even oneweek after the slide full saturation of the failure surface,with groundwater sprouting at its upper region, was clearlyobserved.
The slope consisted of a varying thickness layer of aresidual soil overlying a gneissic rock that outcropped atthe upper and left sides of the landslide boundary. The tran-sition between the sound rock and the saprolitic soil wasdensely fractured.
A 3D-FEM transient/unsaturated flow program wasused to simulate various flow scenarios in an attempt to as-sess the suitable condition that could promote the genera-tion of positive pore water pressure within the slope. Theflow analyses not only considered different rainfall rates,but also the influence of the soil saturation at the upper partof the slope, as a result of the malfunction of a surfacedrainage system, and an eventual development of a prefer-ential flow paths through the fractured rock layer. The stud-ies revealed that the existence of a water source at the baseof the slope appeared to be the only feasible scenario thatcould explain the hydrological condition after the landslide.
A series of shear strength laboratory tests, carried outunder saturated and unsaturated soil conditions revealedthat a single strength envelope could be used for the entireslope. These strength parameter were used with the differ-
ent pore water pressure meshes, which were conceivedfrom the results of flow simulations.
The stability analyses of the central section of thelandslide, indicated high values of FS, except for the mostsevere flow condition that assumed water sources at differ-ent positions of the failure surface; i.e., the rainfall amountthat reached slope surface before the landslide was not suf-ficient to trigger slope failure. These slope stability resultsagreed with the 3D flow simulations, since full saturation ofthe failure surface was only predicted if mechanisms otherthan rain infiltration were prescribed.
The authors consider that the main conclusion of thisstudy is that, despite the development of experimental andnumerical techniques to address the behavior of unsatu-rated soils, the understanding of the complex phenomenonof rainstorm-induced landslides is still a challenge amonggeotechnical engineers. Besides, except for extreme andunpredictable rainfall amounts, landslides are probablytriggered by a combination of mechanisms. Therefore, geo-technical engineers must call attention to the complexity oflandslides in unsaturated residual soils, and always try toanswer a simple question that many times arises: why thelandslide did not occur during a more intense event or whyit did not occur few meters away?
AcknowledgmentsThe authors acknowledge the financial support from
the International Development Center (IDRC), Canada, theNational Council for Research (CNPq) and the Rio de Ja-neiro Research Support Agency (FAPERJ), Brazil. The au-thors are also grateful to all graduate students that partici-pated in this research project.
ReferencesAkai, K.; Ohnishi, Y. & Nishigaki, M. (1979) Finite ele-
ment analysis of three-dimensional flow in saturated-unsaturated soils. Proc. 3rd Int. Conf. Numerical Me-thods in Geomechanics, Aachen, pp. 227-239.
Au, S.W.C. (1998) Rain-induced slope instability in HongKong. Engineering Geology, v. 51:1, p. 1-36.
Brand, E.W. (1985) Geotechnical engineering in tropicalresidual soils. Proc. 1st Int. Conf. on Geomechanics inTropical Lateritic and Saprolitic Soils, Brasília, v. 3,pp. 23-100.
Buchanan, P.; Savigny, K.W. & de Vries, J. (1980) Amethod for modeling water tables at debris avalancheheadscarps. Journal of Hydrology, 113, p. 61-68.
Capra, L.; Lugo-Hubp, J. & Borselli, L. (2003) Mass move-ments in tropical volcanic terrains: the case of Teziulán(Mexico). Engineering Geology, 69, p. 359-379.
Carrillo, C.W.; Fonseca, E.C. & de Campos, T.M.P. (1994)Suction controlled direct shear device. Proc. 2nd Symp.on Unsaturated Soils, Recife, pp. 67-78 .
Costa Nunes, A.J.; Couto Fonseca, A.M.M.C.; Couto Fon-seca, de M.; Fernandes, C.E. & Craizer, W. (1989) In-
148 Soils and Rocks, São Paulo, 34(2): 139-149, May-August, 2011.
Gerscovich et al.
Figure 16 - Failure surfaces and Factors of Safety – Case 3.

tense rainstorm and ground slides. Proc. 12th Int. Conf.Soil Mech. and Found. Engn, v. 3, pp. 1627-1630.
de Campos, T.M.; Andrade, M.H.N.; Gerscovich, D.M.S.& Vargas Jr., E.A. (1994) Analysis of the failure of anunsaturated gneissic residual soil slope in Rio de Ja-neiro, Brazil. Proc. 1st. Pan Am. Symp. of Landslides,Guayaquil, v. 1, pp. 201-213.
Dietrich, W.E.; Wilson, C.J. & Reneau, S.L. (1986) Hol-lows, colluvium, and landslides in soil mantled land-scapes. A.D. Abrahams (ed) Hillslope Processes, Allen& Unwin Ltd, pp. 361-368.
Fonseca, E.C. (1991) Ensaio de Cisalhamento Direto comSucção Controlada em Solos Não Saturados. MSc. The-sis. Departamento de Engenharia Civil, UniversidadeCatólica do Rio de Janeiro.
Fredlund, D.G.; Morgenstern, N.R. & Widger, R.A. (1978)The shear strength of unsaturated soils. Canadian Geo-technical Jour., 15, p. 228-232.
Freeze, R.A. & Cherry, J.A. (1979) Groundwater. Pren-tice-Hall, Inc., Englewood Cliffs.
Gasmo, J.M.; Rahardjo, H. & Leong, E.C. (2000) Infiltra-tion effect son stability of a residual soil slope. Com-puters and Geotechnics, 26, p. 145-165.
GEO-SLOPE International Ltd. (2001). SLOPE/W for slo-pe stability analysis, version 5.0.
Gerscovich, D.M.S. (1994) Fluxo em Meios Porosos Satu-rados e Não Saturados Modelagem Numérica comAplicações ao Estudo da Estabilidade de Encostas doRio de Janeiro. DSc. Thesis, Departamento de Enge-nharia Civil, Universidade Católica do Rio de Janeiro.
Gerscovich D.M.S.; de Campos T.P.P. & Vargas Jr., E.A.(2006) On the evaluation of unsaturated flow in a resid-ual soil slope in Rio de Janeiro Brazil. Engineering Ge-ology, 88, p. 23-40.
Ho, D.Y.F & Fredlund, D.G. (1982) The increase in shearstrength due to soil suction for two Hong Kong soils.Proc. ASCE Geotech. Conf. on Engn. Construction inTropical and Residual Soils, Honolulu, pp. 263-295.
Kim, J.; Jeong, S.; Park, S. & Sharma, J. (2004) Influenceof rainfall-induced wetting on the stability off slopes inweathered soils. Engineering Geology, 75, p. 251-262.
Neuman, S.P. (1973) Saturated-unsaturated seepage by fi-nite elements. Journal of Hydraulics Division, 99(HY12), p. 2233-2250.
Rahardjo, H.; Lim, T.T.; Chang, M.F. & Fredlund, D.G.(1995) Shear strength characteristics of a residual soil.Canadian Geotechnical Journal, 32, p. 60-77.
Reynolds, W.D. & Elrick, D.E. (1987) A laboratory and nu-merical assessment of the Guelph permeameter method.Soil Science, v. 144:4, p. 282-292.
Taylor, M.E. & Brown, C.B. (1967) Darcy’s flow solutionwith free surface. Journal of Hydraulics Division, HY2,p. 25-33.
Tekinsoy, M.A.; Kayadelen, C.; Keskin, M.S. & SoylemezM. (2004) An equation for predicting shear strength en-velope with respect to matric suction. Computers andGeotechnics, v. 31, p. 589-593.
Vargas Jr., E.A.; Costa Filho, L.M. & Prado Campos, L.E.(1986) A study of the relationship between stability ofthe slopes in residual soils and rain intensity. Proc. Int.Symp. on Environmental Geotechnology, pp. 491-500.
Vargas Jr., E.A.; Velloso, R.C.; de Campos, T.M.P. &Costa Filho, L.M. (1990) Saturated-unsaturated analy-sis of water flow in slopes of Rio de Janeiro, Brazil.Computers and Geotechnics, v. 10:3, p. 247-261.
Wang, G. & Sassa, K. (2003) Pore-pressure generation andmovement of rainfall-induced landslides: effects ofgrain size and fine-particle content. Engineering Geol-ogy, 69, p. 109-125.
Wilson, C.J. (1988) Runoff and Pore Pressure Develop-ment in Hollows. PhD Thesis, Department of earth andPlanetary Science, California University, Berkeley.
Wolle, C.M. & Hachich, W. (1989) Rain-induced land-slides in south-eastern Brazil. Proc. 12th Int. Conf. SoilMech. and Found. Engn., v. 3, p. 1639-1644.
List of SymbolsGs: specific gravity of grainsS: degree of saturationn: porositye: voids ratio: matric suction�t: in situ density�: volumetric water content�: water content (in weight)Vw: volume of waterV: total volume�LL: liquid limit�LP: plasticity limitc’: effective cohesion�’: effective friction angle�b: rate of increase in shear strength relative to the matricsuctionua: pore air pressureuw: pore water pressure(ua - uw): matric soil suction
Soils and Rocks, São Paulo, 34(2): 139-149, May-August, 2011. 149
Back Analysis of a Landslide in a Residual Soil Slope in Rio de Janeiro, Brazil


Technical Note
Soils and Rocksv. 34, n. 2


Settlement of Floating Bored Piles in Brasilia Porous Clay
W. Patrick Stewart, Renato P. Cunha, Neusa M.B. Mota
Abstract. The geotechnical graduate program of the University of Brasilia maintains a research site on the campus (to bediscontinued for a new place). The site is underlain by the typically partly-saturated and potentially collapsible “porousclay” of the Federal District of Brazil. The soil conditions have been thoroughly evaluated using laboratory and in situgeotechnical tests (DMT, CPT, SPT, and PMT). Five bored piles were installed and tested at the site. Simplified analyseshave been used so that the results of the tests can be easily compared. The various soil tests were used to estimate the pilesettlements which were compared to the measured values and the results are discussed. It has been shown that simpleelastic models can be routinely used in practice for the estimation of the settlement of bored floating piles on tropicalunsaturated soils. Besides, the results tend to indicate that PMT tests provide the best ratios between predicted andmeasured data.Keywords: in situ testing, Brasilia porous clay, pile settlement, elastic theory.
1. Introduction
Brasilia, the capital city of Brazil, was a pre-designedcity, built to accommodate the federal government and thesupporting population of staff and workers. Recently thesize of the city has increased in both population and devel-oped properties. Given the particular conditions of the localtropical subsoil, specific local solutions have been devel-oped for foundation design. Recently more research-basedsolutions and techniques have been developed with the sup-port of the University of Brasília “Foundation Group”(www.geotecnia.unb.br/gpfees), a joint academic-industrygroup. The good academic-industry interaction has notonly allowed a better knowledge of the existing technolo-gies, but also has stimulated a pioneering use of advancedin situ tests (such as the DMT, CPT, the standard penetra-tion test with torque measurement, SPTT, and PMT) in thetropical soil of the city.
Brasília is located in the Central Plateau of Brazil, andis portrayed in Fig. 1 by an “airplane” shape like form. TheUniversity of Brasília (UnB) campus is located within thecity of Brasília. The UnB foundation and in situ testing re-search site is marked on this figure.
Within the Federal District extensive areas are cov-ered by a weathered latosoil of Tertiary-Quaternary age.This latosoil has been extensively subjected to a lateri-zation process and has a variable thickness throughout theDistrict, varying from a few centimetres to around 40 m. Inthis latosoil there is a predominance of the clay mineralkaolinite, and oxides and hydroxides of iron and aluminum(giving it a distinct reddish colour). The variability of theproperties depends on several factors, such as the topogra-phy, the vegetation cover, and the parent rock. In localizedareas of the Federal District the latosoil overlays a sapro-
litic/residual soil with a strong anisotropic mechanicalbehaviour and high (SPT) penetration resistance. The sa-prolite originated from a weathered, folded and foliatedslate, the typical parent rock of the region.
2. Site Characterization
The superficial latosoil is locally known as the Bra-sília “porous clay”, forming a lateritic horizon of low unitweight and high void ratio, and often an extremely high co-efficient of collapse (Cunha et al., 1999). However the soilcan vary from clay to silt and in the upper portion of thissite, silty sand. By breaking down the structure with a
Soils and Rocks, São Paulo, 34(2): 153-159, May-August, 2011. 153
W.P. Stewart, Department of Civil Engineering, British Columbia Institute of Technology, Burnaby, BC, Canada.R.P. Cunha, Department of Civil and Environmental Engineering, University of Brasilia, Brasilia, DF, Brazil. e-mail: [email protected]. Mota, BMS Engenharia Ltda., Brasilia DF, Brazil.Submitted on April 6, 2010; Final Acceptance on February 3, 2011; Discussion open until December 30, 2011.
Figure 1 - Site plan of Brasilia showing the research site of theUnB geotechnical group.

deflocculating agent, the grain size curve of this soil showsa greater concentration of clay-size particles.
Figure 2 contains a simplified profile of the deposit,characterized by a superficial lateritic layer overlying atransition zone and a saprolite formed by the native rock
of the region. The figure also presents the average resultsof SPT blow counts, torque measurements, CPT tip resis-tance and lateral sleeve friction, for each meter depth atthe site. Table 1 presents the geotechnical characterizationof the site, based on soil classification tests, including
154 Soils and Rocks, São Paulo, 34(2): 153-159, May-August, 2011.
Stewart et al.
Figure 2 - Simplified profile of the soil at the UnB research site.
Table 1 - Geotechnical characterization of the soil of the UnB experimental site.
Parameter Depth (m)
1 2 3 4 5 6 7 8 9 10
�s (kN/m3) 26.9 26.8 26.1 25.9 26.9 25.8 26.5 26.2 27.1 27.6
�d (kN/m3) 10.2 10.4 11.5 11.5 12.0 12.0 12.8 13.9 13.8 13.3
� (kN/m3) 13.3 13.7 14.7 14.5 15.0 14.4 15.4 18.0 17.8 17.5
�sat (kN/m3) 16.5 16.5 17.1 17.0 17.5 17.3 17.8 18.6 18.8 18.5
Gs 2.7 2.7 2.7 2.7 2.7 2.6 2.7 2.7 2.8 2.8
e 1.6 1.57 1.27 1.27 1.25 1.15 1.07 0.89 0.96 1.08
n (%) 61.6 61.1 56.0 55.9 55.6 53.5 51.7 47.2 49.0 51.9
Gravel ND1 0.2 0.2 0.7 0.8 1.4 2.1 4.3 3.6 0.6 0.0
Sand ND 56.2 56.2 53.2 53.0 49.2 34.9 30.1 42 10.2 1.4
Silt ND 51.4 35.9 34.2 43.1 48.6 61.4 61.9 51.9 86.8 79.5
Clay ND 2.2 7.7 11.9 3.1 0.8 1.6 3.7 2.5 2.4 19.1
Gravel WD2 0.2 0.2 0.7 0.8 1.4 2.1 4.3 3.6 0.6 0.0
Sand WD 41.5 41.5 41.6 33.7 31.6 25.7 22.7 33.8 10.2 3.4
Silt WD 24.9 29.2 25.7 26.3 26.5 22.9 24.6 27.4 80.4 93.2
Clay WD 33.4 29.1 32.0 39.2 40.5 49.3 48.4 35.2 8.8 3.4
wL (%) 38 36 39 41 45 44 46 43 44 46
wP (%) 28 26 29 29 34 33 35 34 26 30
PI (%) 10 10 10 12 11 11 11 9 18 161Gravel portion with no deflocculating agent. 2Gravel portion with deflocculating agent.

grain size proportions both without and with a deflo-cculating agent.
3. Field and Laboratory TestsIn support of the foundation testing, a series of field
and laboratory tests have been completed at the site (formore details see Mota, 2003). Table 2 summarizes the fieldtests. Figure 3 presents the layout of the field testing andtest piles.
The dilatometer tests (DMT) were carried out with astandard Marchetti apparatus pushed into the soil with a200 kN hydraulic field rig (until the maximum resistance wasmet). The tests were done in accordance with ASTM D-6635-01, using nitrogen gas to expand the membrane. Mea-
surements were done at 20 cm intervals, and the dilatometerwas pushed at 2 cm/s. The measured pressures were correctedusing lab calibrations. Typical examples are shown in Fig. 4.
Soils and Rocks, São Paulo, 34(2): 153-159, May-August, 2011. 155
Settlement of Floating Bored Piles in Brasilia Porous Clay
Figure 3 - Layout of in situ testing and test piles.
Table 2 - Summary of field tests at UnB experimental site.
Test type Total no. ofborings
Depths (m) atend of test
Comments
DMT 12 12.0-18.2 Hydraulic Field Rig
CPT 17 12.1-18.0 Hydraulic Field Rig
SPT-T 5 10.5-12.5 Manual Procedure
PMT 3 7.6-9.6 Done in sequence to-gether with SPT’s
Figure 4 - Typical DMT results.

The cone penetration tests (CPT) were advancedwith the same hydraulic rig. CPTs 1-14 were conductedwith a standard electronic cone - 60° tip with area of10 cm2 - and CPTs 15-17 were conducted with a piezo-cone. The tests were conducted with a penetration rate of2 cm/s (ASTM D-5778). The inclination was measuredand the test was stopped if it became excessive (above15 degrees). The cones were calibrated at the nationalLaboratory of Furnas in Goiânia-GO. Results of 4 CPTtests are given in Fig. 5.
The standard penetration tests (SPT-T) were con-ducted according to NBR-6484, and a manual hammer wasused. The test used a four-legged frame with a winch on oneside. The hammer was a long (H � 2D) pin-guided type thatwas raised by 2 labourers pulling on the cables used to liftthe hammer. After the SPT, the torque was measured with acalibrated torque wrench at a set rate (for both the peak andresidual values) as presented for the typical peak result inFig. 2. Results of the number of blow counts of all SPT testsare presented in Fig. 6.
The Menard pressuremeter tests (PMT) were con-ducted according to ASTM D-4719 to obtain a pressure-deflection curve and gave the strength and deformabilityparameters of the soil, as well as the insitu horizontal stress.The test was usually run in increments of 25 kPa. An exam-ple test is shown in Fig. 7, based on a “curve matching” pro-cedure (see Mota, 2003 and Fontaine et al. 2005).
Two shafts were excavated for geological investiga-tions of the soil profile as depicted in Fig. 3. Triaxial testswere conducted earlier on block samples from depths of3 m, 6 m, and 9 m. At each depth CKoD tests were con-
ducted at cell pressures of 50 kPa, 100 kPa, and 200 kPa andthe values of the initial modulus Ei and the tangent modulusat 50% of the failure stress E50 were found. These valueswere interpolated to the stress conditions at each depth. Forthis paper these three values were averaged, givingEi = 6.6 MPa and E50 = 3.7 MPa.
156 Soils and Rocks, São Paulo, 34(2): 153-159, May-August, 2011.
Stewart et al.
Figure 5 - Results of four CPT profiles.
Figure 6 - Summary of SPT blow count results.

4. Pile Load Tests
An earlier series of test piles had been conducted atthis site, also following the NBR-12131. For this paper a se-ries of five piles were constructed and are noted as E-1 toE-5 on Fig. 3. It was planned to install internal instrumenta-tion (strain gauges in all of the piles and load cells at thebase of E-1, 2 & 4). However the soil squeezed inwards atthe base of piles E-2 & 4, and the instrumentation could notbe installed. The difficulties have been noted for later tests.For piles E-3 & 5, the instrumentation was not installed.The instrumentation in pile E-1 provided reasonable re-sults, proving that this pile, and by analogy the others, be-haved as a floating foundation.
The soil was excavated with mechanical augers to adiameter of 30 cm. The pile lengths were 7.25-7.85 m. Af-ter a re-bar cage was installed, the borings were filled withready-mix concrete. Cylinder samples were obtained forlater testing. After the concrete had hardened, a smooth-faced concrete block was installed at the top of each pile.Pile Echo tests (PET) with a new acquired equipment wererecently conducted on each of the piles to confirm the ab-sence of voids or reductions in cross-section.
Reaction piles with a diameter of 0.5 m and depth of10 m were installed to hold the metal beams that providedthe support for the load tests. For the tests a hydraulic jack,a load cell and extensometers were attached to the head ofthe pile. Six extensometers were used, each with a travel of0.05 m and a sensitivity of 10-5 m. Static load tests were car-ried out in progressive stages. The load-settlement plotswere manually adjusted for any apparent settlement of theloading equipment. A typical example is shown in Fig. 8.
5. Analysis of Pile Settlement
Modulus values were selected for each type of fieldtest. The values of the field measurements varied withdepth, but were averaged (neglecting extreme values).
Most correlations consider sand and clay values separately.Since the soil is partly saturated, undrained (clay) valueswere not used. Many authors consider sand correlations tovary widely depending on stress history and age of the sanddeposit. The soil dates from Tertiary-Quaternary era and isaged soil. The water table is below the pile depth and thesoil is likely somewhat overconsolidated due to variationsin the soil suction. Simple correlations were adopted fromreferences:
• Baldi et al. (1986) indicate that theoretically E25 = (1- �2)ED, but gave an empirical relation of E = 0.88ED, whereED is the dilatometer modulus.
• Robertson and Campanella (1988) suggested E = 6to 10qc and a value of 8qc was used, where qc is the cone tipresistance.
• Poulos (1998) related SPT N-values to the modulusalong and below a pile as 3 N, where N is the SPT blowcounts for 30 cm.
• After standard corrections, the PMT data was plot-ted and curve “matched” via the methodology and cavityexpansion model proposed by Cunha (1996). This originalmodel was later modified for cohesive-frictional materialsby Fontaine et al. (2005), and the model used herein is thismodified version. Hence, a number of soil parameters werefit into their model and were adjusted to match the fieldcurve, giving a modulus value, E, for each test. This modu-lus is derived from the shear modulus G obtained for theelastic zone around the pressurementer. The E values wereaveraged for the pile analysis.
• Values of Ei and E50 from the triaxial tests were useddirectly in the analysis.
As required, the averaged field data were converted toE values, using the correlations and techniques given in Ta-ble 3.
These modulus values for each soil test were thenused in the Poulos & Davies (1990) solution to calculate
Soils and Rocks, São Paulo, 34(2): 153-159, May-August, 2011. 157
Settlement of Floating Bored Piles in Brasilia Porous Clay
Figure 7 - Example PMT test result and analytical fitting analy-sis.
Figure 8 - Example of load-settlement curve of test pile.

settlement. The predicted values were then compared to themeasured values. The ratio of the predicted values to themeasured values are presented in Table 4 (together withworking loads and settlements) and plotted in Fig. 9.
The simple (elastic) model used allowed a straightfor-ward comparison of the settlement predictions. In Table 4,it can be seen that the pressuremeter and SPT modulus val-ues seem to provide the best estimates of the pile settle-ments, followed by the CPT. The DMT and lab valuesover-predict considerably the pile settlements.
6. ConclusionsSimple elastic models can be routinely used in prac-
tice for the estimation of the settlement of bored floatingpiles on tropical unsaturated soils. Although limited interms of data, the results tend to indicate that PMT tests
provide the best ratios between predicted and measureddata. As a general conclusion it can be said that more re-search emphasis must be placed on this matter, so that thisversatile in situ tool becomes more readily used in prac-tice.
Acknowledgments
The authors acknowledge the financial support fromboth CNPq and CAPES organizations on the scholarshipsprovided to the University of Brasília. Grant provided byMCT/CNPq 14/2009 Research fund proposal, to buy thePET equipment, is also acknowledged and valued. Prof.Stewart would like to acknowledge the professional devel-opment grant provided by BCIT. This grant provided thetime for him to visit the University of Brasília, developknowledge of local practices, and prepare this paper.
References
ABNT (2001) NBR 6484. Solo – Sondagens de SimplesReconhecimentos com SPT – Método de Ensaio (Soil –Standard Penetration Test – SPT- Soil Sampling andClassification – Test Method). ABNT Brazilian Associ-ation of Technical Standards, 17 pp.
ABNT (2006) NBR12131. Estacas – Prova de Carga Está-tica – Método de Ensaio (Piles – Piles – Static Load Test– Method of Test). ABNT Brazilian Association ofTechnical Standards, 8 pp.
ASTM (2007) Suggested method for performing the flatdilatometer test: D-6635-01. Geotechnical TestingJournal, v. 9:2, p. 93-101.
ASTM (2007) Standard test method for pressuremeter test-ing in soils: D-4719. American Society for Testing andMaterials, 9 pp.
ASTM (2007) Standard test method for performing elec-tronic friction cone and piezocone penetration tests ofsoil: D-5778. American Society for Testing and Mate-rials, 19 pp.
Baldi, G.; Belloti, R.; Ghionna, V.; Jamiolkowski, M.;Marchetti, S. & PasqualiniI, E. (1986) Flat dilatometertests in calibration chambers. Proceedings of In situ‘86
158 Soils and Rocks, São Paulo, 34(2): 153-159, May-August, 2011.
Stewart et al.
Figure 9 - Plot of settlement ratio for various tests used for modu-lus.
Table 3 - Correlations & techniques used for moduli assessment.
Test Reference Formulation
DMT Baldi et al. (1986) E25 = 0.88ED
CPT Robertson & Campanella (1988) E = 8qc
SPT Poulos (1998) E(MPa) = 3 N
PMT Fontaine et al. (2005) Curve fitting
Laboratory Triaxial CK0D tests Ei and E50
Table 4 - Measured and predicted settlements using Poulos & Davies (1990) solution.
Pile Pload (kN) �measured (mm) Settlement ratio (predicted/measured)
DMT CPT SPT PMT Lab-Ei Lab-E50
E1 135 2.4 1.72 0.98 0.86 1.03 1.82 3.08
E2 180 1.56 3.43 1.73 1.92 1.39 3.73 6.31
E3 135 1.13 3.99 3.00 1.49 - 3.86 6.53
E4 130 2.70 1.47 0.84 0.66 - 1.56 2.63
E5 155 3.14 2.21 1.15 0.75 0.72 1.59 2.70
Average 2.56 1.54 1.14 1.05 2.51 4.25
Note: Pload = working load, �measured = measured settlement at working load.
ASCE Speciality Conference on Use of In situ Tests inGeotechnical Engineering, Virginia Tech, Blacksburg,v. 6, pp. 431-441.
Cunha, R.P.; Jardim, N.A. & Pereira, J.H.F. (1999) In situCharacterization of a Tropical Porous Clay via Dila-tometer Tests. Geo-Congress 99 on Behavorial Charac-teristics of Residual Soils, ASCE Geotechnical SpecialPublication 92, Charlotte, pp. 113-122.
Cunha, RP. (1996) A new cavity expansion model to simu-late selfboring pressuremeter tests in sand. Solos e Ro-chas, v. 19:1, p. 15-27.
Fontaine, E.; Cunha, R.P. & David, C. (2005) A simplifiedanalytical manner to obtain soil parameters from Mé-nard pressuremeter tests on unsaturated soils. 50 Yearsof Pressuremeters International Symposium – ISP5,Paris, v. 1, pp. 289-295.
Mota, N.M.B. (2003) Ensaios Avançados de Campo naArgila Porosa Não Saturada de Brasília: Interpretação eAplicação em Projetos de Fundação (Advanced in situTests in the Brasília Unsaturated Porous Clay: Interpre-tation and Foundation Design Application). Ds.c. The-sis. Departamento de Engenharia Civil, Universidadede Brasília, Brasília, Pub. G.TD-013A/03, 336 pp.
Poulos, H.G. (1998) The pile-enhanced raft – An economi-cal foundation system. Proceedings of XI BrazilianCongress of Soil Mechanics and Geotechnical Engi-neering, Brasilia, v. 5, pp. 27-43.
Poulos, H.G. & Davies, E.H. (1990) Pile Foundation Anal-ysis and Design. R.E. Krieger Publishing Company.
Robertson, P.K. & Campanella, R.G. (1988) Guidelines forusing the CPT, CPTU, and Marchetti DMT for geo-technical design. Federal Highway Administration, Re-port No. FHWA PA-87-023+84+24, v. 2.
Soils and Rocks, São Paulo, 34(2): 153-159, May-August, 2011. 159
Settlement of Floating Bored Piles in Brasilia Porous Clay


Case History
Soils and Rocksv. 34, n. 2


Evaluation of Rockfall Hazard Along Brazil Roads
Guilherme José Cunha Gomes, Frederico Garcia Sobreira, Milene Sabino Lana
Abstract. The Brazilian road network is constructed in a highly heterogeneous geological environment and some stretchescross through discontinuous rock masses that have uncertain or even ignored geotechnical characteristics. Rock slopes arepotentially unstable surfaces and as such are susceptible to rockfalls that affect the highway’s user safety, transportationinfrastructure and surrounding environment. The geomechanical behavior of rock masses and also the geometric andtraffic conditions of highways are fundamental aspects of rockfall evaluation. This research presents a case study ofrockfall evaluation for slopes bordering highway sections, aiming to classify them and determine a hierarchy forintervention, based on defined criteria. The presented method could be used as a first step in the study of stabilizationtechniques for problems caused by rockfalls from highway slopes. In order to use this approach, field investigationsincluding geomechanical classification of rock mass are necessary. In this context, twelve slope sections containing rockslopes in Espirito Santo’s road network were investigated. The slopes were analyzed individually and the influence of eachparameter in the global rating was evaluated. Parameter effectiveness in the proposed method was also evaluated. Theslopes were classified to define priority measures to minimize roadway problems in each place.Keywords: rockfall, slope, highway.
1. Introduction
The Brazilian road network is constructed in a rela-tively heterogeneous geological environment, amidst dif-ferent kinds of discontinuous rock masses with uncertain oreven ignored geotechnical characteristics. The user safetyand environmental preservation require tools to ascertainan acceptable degree of rockfall hazard along highwayslopes, based on rational methodology.
In the highway engineering context, rock slopes arepotentially unstable surfaces and as such are susceptible torockfalls that affect highway user safety, transportation in-frastructure and the surrounding environment.
Due to the seriousness of the problem and the diffi-culties encountered in investigating and analyzing rockfallalong hundreds of kilometers of mountainous highways,several countries have developed classification systems forslopes that could be obtained through field investigationsand simplified calculations. The objective of these classifi-cations is to identify and distinguish particularly dangerousplaces requiring urgent stabilization measures or furtherstudies, and therefore, enabling agencies or highway de-partments to take remedial action.
Rockfall evaluation methods along highways are im-portant tools to monitor potentially unstable slopes. Thesemethods use studies and investigations of directly linkedcharacteristics to the events. Analyses of road sections withgreat geotechnical and geometric problems, allied to anelaborated database obtained in a discerning way, can be
helpful for road managers to choose remedial measures inplaces of potential hazard.
2. Highway Rockfalls
A rockfall corresponds to the detachment of a blockrock mass from a steep or scarp slope (Giani, 1992), withlittle or no shear failure (Hoek & Bray, 1981), withoutstructurally controlled planar and wedge failures. The dis-placements are rapid, and usually involve free fall, rollingor bouncing (Ahrendt, 2005). Individual blocks subjectedto falls have varied geometric dimensions, and can be in theform of cubes, plates, among others (ISRM, 1978; Palms-tröm, 1995).
According to Giani (1992), the beginning of arockfall phenomenon at a slope involves initially unstableconditions, which cause the movement of a mass inducedby slope failure. The main factors in slope instability induc-tion are: joint pore pressure, earthquakes or vibrations dueto blasting, joint pressure due to ice formation and excava-tion.
Ritchie (1963) studied various factors that influenceblock trajectory during a rockfall event. Some of themwere: block size and shape, slope height and angle, hill sur-face characteristics, joint pattern and rock type. He carriedout pioneer research about rockfalls onto roads by studyinghighways in Washington, USA. His work included the ob-servation of hundreds of falls from rock slopes and high-way talus, measuring and recording block paths and thedistances they reached beyond the slope. The study culmi-
Soils and Rocks, São Paulo, 34(2): 163-174, May-August, 2011. 163
Guilherme José Cunha Gomes, M.Sc., Engenheiro Ambiental Rodoviário, Departamento de Estradas de Rodagem do Estado do Espírito Santo, Vila Velha, ES, Brazil. e-mail:[email protected] Garcia Sobreira, D.Sc., Associate Professor, Campus Universitário do Morro do Cruzeiro, Escola de Minas, Universidade Federal de Ouro Preto,Ouro Preto, MG,Brazil. e-mail: [email protected] Sabino Lana, D.Sc., Associate Professor, Departamento de Engenharia de Minas, Universidade Federal de Ouro Preto, Ouro Preto, MG, Brazil.Submitted on March 3, 2010; Final Acceptance on September 21; Discussion open until December 30, 2011.

nated in developing a practical design criterion to estimatethe width of rockfall catchment areas based on rock slopeheight, rock slope angle and depth of the catchment area. Arockfall catchment area is defined as the area between thehighway edge of the pavement and the base of a road slopethat is designed to avoid rockfalls from reaching the road-way (Pierson et al., 2001).
Ritchie’s design criteria has become a practicalmethod for estimating ditches in rock cuts, frequently usedby roadway engineers, mainly in North America, eventhough it was proposed four decades ago (Pierson et al.,2001). Later, this criteria was modified to a chart form(Fig. 1), published by the Federal Highway Administration– FHWA (1989), improving data manipulation by roadwayengineers.
Geomechanical slope behavior is constantly beingevaluated by geotechnical engineers, using data concerningslope stability, orientation and shape of discontinuities and
infilling material. Rock mass geomechanical classifica-tions can be used for this evaluation. Gomes (1991) restatedthe concept that geomechanical classifications are orientedsystems seeking to separate rock masses into classes withsimilar geomechanical characteristics. He did this by allot-ting ratings for them, based on geological, mechanical andgeotechnical parameters, and in doing so, homogenizedsegments with the same behavior.
From among the main geomechanical classifications,the Bieniawski (1973, 1989) and Romana (1985) systemsbecame the base for the development of highway rock slopeclassifications. RMR (Rock Mass Rating), proposed byBieniawski (1973, 1989), includes six parameters that areused to classify a rock mass: strength of intact rock mate-rial; drill core quality or rock quality designation (RQD);spacing of discontinuities; condition of discontinuities;groundwater and discontinuity orientation. SMR (SlopeMass Rating) proposed by Romana (1985) is obtained froman adjustment of Bieniawski’s RMR, to which is added afactorial term dependent on the slope – joint orientationsand the excavation method.
Block size is a very important index for rock massquality evaluation, but its determination is not an easy task.This dimension is calculated through discontinuity spacingand persistence, as well as from the number of joint sets thatdelimit potentially unstable blocks (ISRM, 1978). Palms-tröm (1995) also affirms that there are many ways to calcu-late block volume in a rock mass. Beyond field observa-tions, Palmström (1995) describes some relationships toestimate block volume in rock masses with different jointsets.
Traffic and geometric characteristics of road sectionsalso must be considered in highway rockfall evaluation.Among these characteristics, average traffic per day repre-sents the average number of vehicles traveling on a road-way section per day (DNIT, 2006). The posted speed limit,defined in the road project, is the larger speed allowed inthis segment with appropriate safety conditions, even withwet pavement, without traffic influence. Another roadwaycharacteristic, sight distance, can be understood as a visionpattern given to the driver, in a way that there is always timeto safety decisions.
The first inventory of problematical rockfall areaswas developed by Brawner & Wyllie (1975). Since then,highway rock slope classifications have been developed inorder to assist in the management of critical roadway ar-eas.
In the beginning of the 90’s, a highway rock slopeclassification system was developed by Pierson et al.(1990), based on a previous study, and named RockfallHazard Rating System (RHRS). This method, implantedin the State of Oregon (USA), has proved to be an impor-tant tool for analysis and prevention of rockfall problemsinvolving roads. It has provided significant innovation byimproving the identification, evaluation and mitigation
164 Soils and Rocks, São Paulo, 34(2): 163-174, May-August, 2011.
Gomes et al.
Figure 1 - Modified Ritchie’s design chart to determine requiredwidth (W) and depth (D) of rock catchment areas in relation toheight and slope angle (after FHWA, 1989; Hoek, 1998).

processes of potentially unstable rock masses. The RHRSsystem is a highly-used technique employed for quicklyestablishing which rock slopes offer risks for the users.The nine categories of this system are framed in four dif-ferent ratings. Categories between the established ratingscan be interpolated. The criterion to interpolate ratings in-creases exponentially from 3 to 81, making it possible todistinguish which slopes are more problematic or danger-ous. Slopes with the largest ratings need priority interven-tion.
Budetta (2004) evaluated the rockfall problems ofItalian roads based on the RHRS method (Pierson et al.,1990). The author modified the method, adapting it to thegeological and road context of that country. The main mod-ification proposed by Budetta (2004) was the incorporationof the SMR (Romana, 1985) into the geological evaluationof rock masses.
Several other authors also have studied highwayrockfalls all over the world, for example, Bunce et al.(1997), Hadjin (2002), Hopkins et al. (2003), Rose(2005), Eliassen & Springston (2007), among several oth-ers.
3. Work Development
This research developed and applied a method forrockfall evaluation of slopes bordering highway sections,aiming to classify them and determine a priority interven-tion hierarchy. For this, existent data, as well as collecteddata in the area, was analyzed. This resulted in the defini-tion of a field investigation area involving twelve high-way-bordering rock slopes in the State of Espirito Santo,Brazil (Fig. 2). Due to map scale, two investigated slopesthat are very close do not appear in figure.
The applied rockfall hazard evaluation method thenused the data from the geological and geotechnical slope in-vestigation, as well as traffic and geometrical highway sec-tion assessment. Geomechanical rock mass classificationsystems were applied as a geotechnical tool for evaluatingthe slopes, adjusting rockfall hazard assessment methodsinternationally proposed for Espírito Santo roads. Slopeswith the highest intervention priority were defined.
The application of the methodology, added to profes-sional’s experience in problem diagnosis, represents a con-tribution to highway departments for road safety increment
Soils and Rocks, São Paulo, 34(2): 163-174, May-August, 2011. 165
Evaluation of Rockfall Hazard Along Brazil Roads
Figure 2 - Investigated rock slopes distribution (Espirito Santo State, Brazil).

when adding the acquired results to roadway rehabilitationand improvement projects.
In this method, pavement widths, posted speed limit,decision sight distance, slope height and extension, catch-ment area and the longitudinal ramp of slope extension aredetermined in order to characterize the traffic conditionsalong the road sections and the geometry of each studiedarea.
For the characterization of the basic structural modelfor each slope, an overall rock mass analysis is performedand the surveyed data registered in a standard field sheet.The geological and geotechnical characterization isachieved by surveying the physical and geometric charac-teristics of rock mass discontinuities, as proposed by Bie-niawski (1973, 1989), ISRM (1978), Romana (1985), Pier-son & van Vickle (1993) and Palmström (1995).
For the discontinuity characterization, the followingparameters are used: orientation, spacing, persistence,roughness, opening, infilling, water flow, joint sets andblock size.
The collected information in the field of jointing rockmass was treated to obtain values concerning geomecha-nical quality of the slopes studied. The application of classi-fication Bieniawski (1989) was conducted from field sur-veys and in literature data. Initially, we defined the mostimportant families of discontinuities that control rock massbehavior.
As the characteristics of the rock masses studied werecomposed by crystalline rocks (granites and gneisses), val-ues between 100 and 250 MPa for strength of rock materialwere considered, in accordance with Palmström (1995) andBieniawski (1984) work’s. It may also be added that due tooperational conditions no samples were collected for uni-axial compression test. Therefore, ISRM (1978) proposalwas used and as a result, the rocks were considered as very
resistant, requiring many hammer blows in order to be frac-tured.
For RQD index, as no borehole was available, Priest& Hudson (1976) proposals were used. This method corre-lates RQD with joint spacing by using the following equa-tion:
RQD eS
S� �
��
�
��
��
��
�11001
10 1. / .(1)
being S the average spacing between discontinuities in me-ters.
The joint spacing average of every family was takeninto account in each slope. Joint condition, which involvesopening characteristics, persistence, roughness, alterationin the walls and filling material conditions, it was calcu-lated by averaging the magnitudes analyzed. For the influ-ence of groundwater, a year length visual observationswere made mostly during the rainy season, in order to de-fine the state conditions such as the dry, damp, wet, drip-ping and flowing occurrences.
Bieniawski joint orientation was not considered inSMR classification, as proposed by Romana (1985). In thiscase, the joint and slope dip and dip direction were recordedfor application of the SMR model.
4. Slope Rating Evaluation Methodology
Eight parameters are adopted for the evaluation of theslopes, as shown in Table 1. Each parameter receives a rat-ing ranging from 3 to 81, where the smallest values corre-spond to the best highway safety conditions.
Pierson & van Vickle (1993) have proposed a practi-cal field method for the calculation of average slopeheights. Due to access difficulties to the top of most of theslopes, the cut height is obtained with a measuring tape and
166 Soils and Rocks, São Paulo, 34(2): 163-174, May-August, 2011.
Gomes et al.
Table 1 - Parameters for classification of the evaluated rock slopes.
Parameter Criteria and rating
3 points 9 points 27 points 81 points
Slope height 6.0 m 12.0 m 18.0 m 24.0 m
Ditch effectiveness Good catchment +Ritchie’s chart conformity
+ protection
Moderate catchment +Ritchie’s chart conformity
Limited catchment +Ritchie’s chartdisconformity
No catchment
Average vehicle risk 25% of time 50% of time 75% of time 100% of time
Percent of sightdistance (DV)
100% (Appropriate DV) 75% (Moderate DV) 50% (Limited DV) 25% (Very limited DV)
Roadway width 13.2 m 10.8 m 8.4 m 6.0 m
Block size 0.30 m 0.60 m 0.90 m 1.2 m
Climate condition Low annual rainfall< 1,150 mm
Medium annual rainfall1,150-1,450 mm
Large annual rainfall1,450 - 1,750 mm
High annualrainfall > 1,750 mm
Geologiccharacteristic (SMR)
80 70 60 50

a clinometer, using the relationship between the angleformed by the observation point and the slope surface:
H = X * tan� + AC (2)
where X is the distance, in meters, of the measurement point(pavement edge); � is the angle measured by clinometerand AC is the clinometer height. Slope height is a funda-mental characteristic in stability analyses. This parameterhas shown to be effective in the geometric diagnosis ofslopes, because a high slope will probably have discontinu-ity occurrences that induce rockfalls. The values of 6, 12,18 and 24 meters shown in Table 1 were defined accordingto the variation of slope heights found on the worked area,aiming at establishing an adequate indicator to this cate-gory.
The ditch effectiveness parameter measures the effi-ciency of the catchment area to prevent rockfalls fromreaching the roadway pavement (Ritchie, 1963). This high-way section characteristic have been rated from Budetta(2004), that modified Pierson & van Vickle’s (1993) quali-tative evaluation, improving the pioneering geometric as-pects proposed by Ritchie (1963).
According to Pierson & van Vickle (1993), the aver-age vehicle risk (RV) measures the percentage of time thatvehicles have been exposed to a dangerous rockfall zone.The percentage is obtained from equation below. Averagevehicle risk meaning is similar to that used by the RHRSmethod.
RVADT CE
PSP�
�(3)
where ADT is average daily traffic (cars/h), CE is the cutextension (km) and PSP is the posted speed limit (km/h).Average vehicle risk is determined in percentage terms. Inthis case, the smaller the percentage of vehicles in rockfallhazard areas is, the smaller the index rating of the road sec-tion under consideration will be.
Percentage of sight distance (DV) is used to determinethe highway length available to the driver for taking an in-stantaneous decision. This category is considered criticalwhen roadway obstacles are difficult to notice, or when anunexpected move is requested (Pierson & van Vickle,1993). Percentage of sight distance is an important parame-ter for evaluating rockfall hazard. This is because it is inti-mately related to the probability of the occurrence of auto-mobile collision with any object present on the road. Thecalculation is based on the relationship between actual sightdistance (ASD) and designed sight distance (DSD), mea-sured in meters:
DVASD
DSD� �100% (4)
DSD is designed by engineering project, usually estab-lished by the highway department. ASD is obtained in the
field, changing in each road meter. Due to several opera-tional reasons involving technical and financial resources,some road extensions are built without considering projectsight distance. This fact is perceptible in highways thattranspose mountainous or sinuous extensions.
The parameter roadway width represents the pavedband extension, including the shoulder, and is measuredperpendicularly to the central road line. It represents thespace a driver has to maneuver. Most highway rockfallevaluation methods, based on Pierson et al. (1990) pro-posal, maintain the pavement width as an essential categoryor parameter because this is considered an important geo-metric aspect for safety.
In the investigated sections, frequently less than 3joint sets were identified, so the calculation of the equiva-lent block volume proposed by Palmström (1995) was con-sidered convenient, see Eq. (5). This relationship deter-mines block volume from the volumetric joint count (Jv)and block shape factor (�), which is a function of the largestand the smallest joint spacing (Smáx e Smin) and the number ofjoint set indexes (nj):
Vb JV� � �� 3 (5)
� � �
���
�
����
�
��
�
�
��
20 73S
S n j
max
min
(6)
In which nj = 3,0 to 3 joint sets; nj = 2,5 to 2 joint setsand random sets; nj = 2,0 to 2 joint sets; nj = 1,5 to 1 jointsets and random sets; nj = 1,0 to 1 single joint set.
The Jv index, according to Palmström (1995), is equalto the number of joints in a unitary rock mass volume. Aftercalculation of Vb, Budetta’s proposal (2004) is used to cal-culate block size (Db), measured in meters:
Db Vb� 3 (7)
Several methods of rockfall hazard evaluation inroadway rock slopes, especially those adopted in developedcountries, use combinations between the period when thereis water in the slope and when it snows. But, as the presenceof snow would be a rare event and the slope water conditionhas been already used in SMR classification, this parameteris rated as a function of incident annual rainfall in the stud-ied places. The most important climatic factor in Brazilianslopes is the rainfall, because the water, flowing on discon-tinuities, leads to rock mass shear strength reduction (Bie-niawski, 1984 and Palmström, 1995), among other aspects.As this aspect has already been considered in the RMRclassification, Budetta’s proposal (2004) was adopted,which uses annual rainfall values for the studied areas.Then values of rainfall were obtained from historical seriesof Espirito Santo state. Low annual rainfall (< 1.100 mm)represents points of minor influence of water on the slope.On the other hand, high annual rainfall (> 1.750 mm) repre-sents water’s major contribution to slope instability.
Due to the geotechnical characteristics of the investi-gated slopes, the geological characteristic adopted by Pier-
Soils and Rocks, São Paulo, 34(2): 163-174, May-August, 2011. 167
Evaluation of Rockfall Hazard Along Brazil Roads

son and Van Vickle (1993) was not used. The author’smethod, as quality is concerned, is better suited for regionson wich lithologic structure vary greatly (Gomes & Sobrei-ra, 2008).
The geological characteristic parameter is evaluatedaccording the SMR index (Romana, 1985). Budetta (2004)proposed SMR incorporation, whose value is inversely pro-portional to the Pierson et al. (1990) rating. SMR valueshave been adjusted in this work to provide a better under-standing about the mechanical behavior of the slope.Values of SMR smaller than 50 can be considered critical,hence they have a high value in this parameter.
The parameter ratings are exponential, according tothe Pierson et al. (1990) proposition. Slopes with a largerrating are hazardous and they must be given priority for im-mediate interventions. All parameters, except ditch effec-tiveness, can be put in equation form, according to Ritchie(1963), ISRM (1978), Romana (1985); Bieniawski (1989),Pierson & van Vickle (1993), Palmström (1995), Budetta(2004) and DNIT (2006). The equations to aid the parame-ter calculations and the symbology adopted are presented inthe Table 2.
After the calculation of the parameter values for eachslope, a value that represents the rockfall hazard index (IQB)is determined by de equation:
IQB = IAT + IAC + IRV + IDV + ILP + IDB + ICC + 2ICG (8)
where IAT = slope height parameter; IAC = ditch effectivenessparameter; IRV = average vehicle risk parameter; IDV = sightdistance parameter; ILP = roadway width parameter;IDB = block size parameter; ICC = climate condition parame-ter; ICG = geologic characteristic parameter. The ICG indexwas multiplied by a weight of 2 in order to value the influ-ence of geological-geotechnical characteristic in instabilityrockfall processes.
5. Results and DiscussionsThe slope sections selected for the study are located
in different areas to encompass the aspects desired for theanalysis. Places with differences in the traffic conditions,
ramps, geometry, speed limit, among other intrinsic roadproject aspects were chosen, since the geological character-istics in the studied area didn’t vary significantly. Twelveslopes were selected, two of which are federal highwayssubject to larger loads and greater traffic. The other ten areregional highways.
Basically, the rock masses are highly metamorphiccrystalline rocks (Meneses & Paradella, 1978). There isalso gneiss, essentially composed of quartz, feldspar, bio-tite and garne that is well-oriented by the centimetric alter-nation of the banding. The foliation presents concordancewith the banding.
Each slope was evaluated, increasing the understand-ing of the most problematic places per parameter. The rat-ing of each parameter, following the model developed byPierson et al. (1990), varied exponentially (see Table 1).The graphs in Fig. 3 show the indexes versus parametersrating relation.
Fig. 3 (h) shows the relationship between the ICG indexand the SMR value, as well as the distribution of the valuesobtained for each slope. It can be noticed that the ICG ratingis inversely proportional to the SMR index.
From Fig. 3 (h), it is possible to observe that SMR val-ues above 60 result in low values of ICG. Therefore, a rockslope must have a low value of SMR to present a significantinfluence on the ICG index in the method proposed by Bu-detta (2004). On the other hand, if the ICG value is multipliedby 2, the geological-geotechnical characteristic will have alarger contribution in the determination of IQB.
Table 3 presents the summary of index values and to-tal rating for each slope analyzed. The most problematicslopes in relation to rockfall hazards have larger values ofIQB.
In spite of the high SMR values, it is observed thatfour slopes can be considered less stable: ES-080 (1),ES-146, ES-164 e BR-259. As previously informed, thedistinction between the geological characteristic indexeswas only possible due to SMR use, which is more sensitiveto changes in relation to the initial proposal of RHRS forthat parameter. The RHRS original rating was modified dueto two basic aspects: its evaluation is merely qualitative andit’s difficult to distinguish between the crystalline rockmass being investigated. Gomes and Sobreira (2008) wentinto detail about this discussion.
As it can be seen in Table 3, the slope ES-164 wasconsidered the most critical concerning rockfalls, receivingthe largest IAT. Besides the highway’s geometric factor, dueto the absence of ditch or catchment area in the basis of theslope, geotechnical factors were decisive for its classifica-tion in a critical category. The large slope height, withrockfall hazard, was the first geotechnical aspect consid-ered in the rock mass evaluation.
The slope ES-164 has a jointing pattern that leads toloss of support at its base, favoring instability of the upperblocks. The 30° dip average of the main joint set, formed by
168 Soils and Rocks, São Paulo, 34(2): 163-174, May-August, 2011.
Gomes et al.
Table 2 - Symbols and equations used to each parameter of slopeevaluation.
Parameters Symbol Equation
Slope height (H) IAT IAT = e0.1831.H
Ditch effectiveness IAC -
Average vehicle risk (RV) IRV IRV = e0.0439.RV
Percent of sight distance (DV) IDV IDV = 243e-0.0439.DV
Roadway width (LP) ILP ILP = 1262.7e-0.4578.LP
Block size (Db) IDB IDB = e3.662.Db
Climate condition (P) ICC ICC = 0.0048e0.0054.P
Geologic characteristic (SMR) ICG ICG = 243e-0.055.SMR
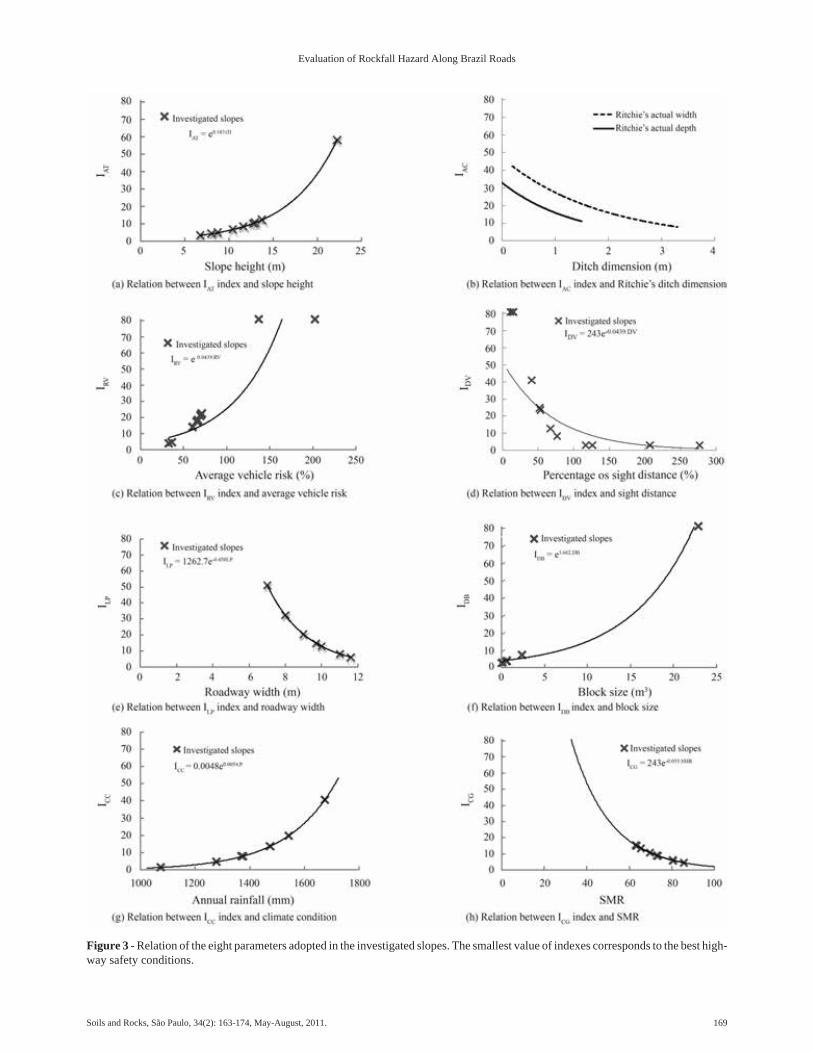
Soils and Rocks, São Paulo, 34(2): 163-174, May-August, 2011. 169
Evaluation of Rockfall Hazard Along Brazil Roads
Figure 3 - Relation of the eight parameters adopted in the investigated slopes. The smallest value of indexes corresponds to the best high-way safety conditions.

gneiss rock banding that dips into the rock mass slope, fre-quently becomes smaller, due to folds or layers of differentstrength in the slope. However, due to different erosionrates of materials in the rock mass, several points belowloosened blocks suffer erosion, creating ideal conditionsfor the beginning of falls. In spite of the fact that the maindiscontinuities, originating from gneiss banding, dip favor-
ably (inside the slope face), there are some jointswith a dip
smaller than the slope face, dipping inside it. This is rele-
vant because this latter discontinuity pattern creates sup-
port loss for some blocks, and due to the lack of a catchment
ditch, any rockfall tends to reach the pavement. Fig. 4(a)
shows detail from the ES-164 slope.
170 Soils and Rocks, São Paulo, 34(2): 163-174, May-August, 2011.
Gomes et al.
Figure 4 - (a) ES-164 slope. Due to the lack of a catchment ditch, any rockfall tends to reach the pavement. (b) BR-259 slope. Ditch de-signed according Ritchie’s chart.
Table 3 - Index values for each investigated slope.
Slope IAT IAC IRV IDV ILP IDB ICC ICG IQB
ES - 080 (1) 3.4 27.0 4.2 12.7 51.2 18.2 8.0 18.5 143.2
ES - 080 (2) 12.3 27.0 4.2 81.0 51.2 20.1 8.0 3.0 206.8
ES - 146 8.4 9.0 18.6 23.6 20.5 81.0 20.0 19.2 200.3
ES - 164 58.3 81.0 22.6 24.8 20.5 3.0 41.0 14.8 266.0
ES - 166 (1) 4.9 27.0 17.6 41.1 8.2 3.0 8.0 3.0 112.8
ES - 166 (2) 5.7 27.0 14.1 8.4 8.2 3.0 8.0 3.8 78.2
ES - 166 (3) 6.5 27.0 21.9 3.0 8.2 10.5 8.0 5.3 90.4
ES - 181 4.3 27.0 4.9 3.0 14.9 81.0 8.0 3.0 146.1
ES - 355 10.2 27.0 21.2 81.0 51.2 3.0 8.0 6.1 207.7
ES - 482 6.7 27.0 14.3 81.0 32.4 3.7 5.0 6.4 176.5
BR - 259 4.9 9.0 81.0 3.0 6.2 3.9 3.0 18.4 129.4
BR - 262 10.6 9.0 81.0 3.0 13.0 81.0 14.0 9.2 220.8

Due to a geotechnical problem, most of the catch-ment areas were not sized according to the Ritchie crite-rion for road safety. In relation to depth, only the twofederal highways match Ritchie’s chart. It can be observein Fig. 4(b).
In slope ES-146, there is an abundant presence of wa-ter, even in dry periods, and its large block volumes cangenerate problems (Fig. 5 (a)). At the base of slope ES-355,several blocks in the ditch indicates regular rockfall prob-lems (Fig. 5 (b)). The beginning of the slope is close to ahorizontal curve and considering the traffic near the rockmass will result in high IDV values.
Table 3 also displays other road segments with a highIQB index. Slope ES-080 (2) has good geotechnical proper-ties, but presents a high value for IQB, related to inadequatedriver-visibility distance and to unfavorable geometriccharacteristics.
The average dimensions of the blocks in each slopewere systematized in the Table 4.
The block size index, IDB, in spite of being an estimate,expressed the rockfall danger of big block failure inBR-262 slope. In this slope the only identified joint set hasa large spacing. In case of another slopes, the less spacedfractures and the largest number of joint sets result in
smaller block volumes, consequently the IDB index de-creased. Fig. 6 shows block format found in ES-166 (2)slope.
Soils and Rocks, São Paulo, 34(2): 163-174, May-August, 2011. 171
Evaluation of Rockfall Hazard Along Brazil Roads
Figure 5 - (a) ES-146 slope. Presence of water is constant even in dry periods. (b) ES-355 slope. Several blocks in the ditch indicatesregular rockfall problems.
Table 4 - Values obtained for dimension of blocks and adoptedterminology.
Slope Block volume(m3)
Description(Palmström, 1995)
ES - 080 (1) 0.496 Very large blocks
ES - 080 (2) 0.550 Very large blocks
ES - 146 2.358 Very large blocks
ES - 164 0.023 Moderate blocks
ES - 166 (1) 0.002 Small blocks
ES - 166 (2) 0.026 Moderate blocks
ES - 166 (3) 0.266 Large blocks
ES - 181 2.358 Large blocks
ES - 355 0.002 Small blocks
ES - 482 0.045 Moderate blocks
BR - 259 0.052 Moderate blocks
BR - 262 22.867 Very large blocks

6. Proposition of Priority Interventions
The results of the classification presented in this pa-per can be used as a tool for road administration. Largervalues of RHRS mean that the slopes must have priority inintervention measures. The proposed classification also al-lows ranking, for practical purposes, of the highway’s char-acteristics that need to be improved or remedied whenseeking user safety. The summary of the most critical as-pects, besides interventions proposed for each rockfall sec-tion, is presented in the Table 5.
The measures to be taken were simply proposed as away of minimizing the main problems observed in the field
and confirmed after determination of the values for eachparameter. The suggested measures include:
• Removal or stabilization of unstable blocks;• Geometric improvements of the road and platform;• Vertical warnings close to unstable slopes;• Elaboration and execution of a rock mass stabiliza-
tion project;• Kinematic analysis for definition of potential fail-
ures.
7. Conclusions
The evaluation method proposed in this work is a pre-liminary tool for identifying hazardous points in highwaysas related to rockfall. It permits specific geotechnical diag-nostics and is the first step towards problem correction inhighway slopes when the problem is related to rockfalls.
Field investigations, including the application of geo-mechanic classification systems to crystalline rock massesthat constitute the rock types studied, were very important.The geomechanical behavior of the slopes was similar, in-dicating that the intact rock had good geotechnical proper-ties, in spite of the fact that most of the discontinuityorientations were unfavorable to slope stability.
The determination of the traffic and geometric char-acteristics of the road sections in this study was fundamen-tal for the evaluation of the rockfall hazards. Highway rockslopes with high traffic or inadequate sight distance due tosinuous geometry should be studied carefully by the gov-ernment, and appropriate interventions should be imple-mented in these places. This is the case of the slopesinvestigated in ES-355 and ES-482 roads that need geomet-
172 Soils and Rocks, São Paulo, 34(2): 163-174, May-August, 2011.
Gomes et al.
Figure 6 - Format of block in ES-166 (2) slope.
Table 5 - Summary of the most critical aspects and priority interventions proposed.
Slope Critical(s) parameter(s) Priorities in interventions
ES - 080 (1) • geological characteristic • removal or stabilization of unstable blocks
ES - 080 (2) • decision distance • geometric improvements of the road and platform
ES - 146 • geological characteristic• average vehicle risk• climatic condition
• removal or stabilization of unstable blocks• vertical warnings close to slopes
ES - 164 • geological characteristic• slope height• ditch effectiveness• climatic condition
• elaboration and execution of a rock mass stabilization project• geometric improvements of the road and platform• vertical warnings close to slopes
ES - 166 (1) • ditch effectiveness • geometric improvements of the road and platform
ES - 166 (2) • ditch effectiveness • geometric improvements of the road and platform
ES - 166 (3) • ditch effectiveness • geometric improvements of the road and platform
ES - 181 • geological characteristic • removal or stabilization of unstable blocks
ES - 355 • sight distance • geometric improvements of the road and platform
ES - 482 • sight distance • geometric improvements of the road and platform
BR - 259 • geological characteristic • removal or stabilization of unstable blocks
BR - 262 • block size • kinematic analysis
ric improvements that would provide a safe sight distancefor users.
A factor of great influence in rockfall mitigation is theexistence of a ditch (catchment area). Even when the struc-ture is not appropriately constructed, as in the verticalslopes studied, there is a great tendency for blocks to becaptured by the structure between the limit of the pavementand the slope base. Road projects should contemplate abudget for the construction of that structure, which also hasthe important function of superficial drainage.
Rock block volume determination of the slopes canbe considered the most arduous task during field surveys. Itis difficult to identify some joint sets because of fracturescaused during rock mass excavation. This influences thedetermination of joint spacing and the block shape. How-ever, empirical relationships were used seeking the calcula-tion of the average block dimensions because this charac-teristic is fundamental for rockfall hazard evaluation.
Another problem faced in this work, that is also an ob-stacle for most geotechnical investigations, was the diffi-culty of expressing a rock mass quality with a single index,due the variability of the structures, materials, etc. Thestudied slopes are heterogeneous, with distinct behavior insome places. Therefore, many times, it was necessary torepresent the overall rock mass quality or, in some cases,the worst observed scenario. Although the index used maytake into account many factors, it is not an easy task to haverepresented all of the rock massif complexity through onesole number, as the environment variability admits, some-times, different values when rating the parameters whichcompose this index.
The method used in this research (rating system) sat-isfactorily represented the slope characteristics related torockfall problems. The intervention hierarchy of the slopesmatched the conditions observed in the field. The alter-ations proposed aimed to adapt internationally used criteriato the geotechnical and road characteristics encountered. Inaddition, the proposed alterations contributed to eliminate acertain subjectivity of some of the parameters.
The investigated slopes are placed in the same geo-logical and climatic environment. This is fundamental forthe viability of the application of the rockfall hazard evalu-ation method proposed in this research. Even though thismethodology is not being used in Brazil, a highway rockfallassessment system could be adapted for the geological-geotechnical and climatic aspects presented in the area. Be-sides, geometric and traffic characteristics of the highwayare essential parameters for these analyses, and should al-ways be considered.
After obtaining the list of problematic roadwayslopes, the government needs to implement this methodol-ogy, so that during the rehabilitation services or road resto-ration, the costs of improvement can be estimated.
Other geotechnical methods of slope classificationcan be used in the evaluation of the rockfall hazard along
highways providing they are in accord with the rock massstructural model and failure conditions. Standard methods inengineering geology, like RMR and SMR, can be adaptedfor peculiar geomechanical conditions.
AcknowledgementsWe are grateful to the Pos-graduate Program in Geo-
technics of Ouro Preto Federal University (NUGEO) and toEspirito Santo Highway State Department (DER-ES) forproviding the development of this study. Likewise, we aredeeply grateful to CNPq for financial our research. Finally,we are grateful to the technical reviewers of this work and,last but not least, to Mr. E. Gomes for his English languagereview.
ReferencesAhrendt, A. (2005) Gravitational Mass Movements – Pro-
posal of a Forecast System: Application in the UrbanArea of Campos do Jordão – SP.DSc Thesis, Universi-dade de São Paulo, São Carlos, 360 pp (in Portuguese).
Bieniawski, Z.T. (1973) Engineering classification ofjointed rock masses. Trans. S. Afr. Inst. Civ. Eng.,v. 15:12, p. 355-3344.
Bieniawski, Z.T. (1989) Engineering Rock Mass Classifi-cations, Wiley, New York, 251 pp.
Brawner, C.O. & Wyllie, D.C. (1975) Rock slope stabilityon railway projects. Proc. Am. Railway Engng Assoc.,Regional Meeting, Vancouver, BC.
Budetta, P. (2004) Assessment of rockfall risk along roads.Natural Hazard and Earth System Sciences, v. 4:1,p. 71-81.
Bunce, C.M.; Cruden, D.M. & Morgenstern, N.R. (1997)Assessment of the hazard from rockfall on a highway,Can. Geotech. J., v. 34:3, p. 344-356.
National Department of Transportation (DNIT) (2006)Traffic Manual Study. IPR. Publ. n. 723, Rio de Janeiro,384 pp. (in Portuguese).
Eliassen, T.D. & Springston, G.E. (2007). Rockfall HazardRating of Rock Cuts on U.S. and State Highways inVermont. Vermont Agency of Transportation, Montpe-lier.
Federal Highway Administration (FHWA) (1989) RockSlopes: Design, Excavation, Stabilization. PublicationNo. FHWA-TS-89-045, Turner-Fairbanks HighwayResearch Center, McLean, VA.
Giani, G.P. (1992) Rock Slope Stability Analysis. A.A.Balkema Publishers, Rotterdam, Netherlands.
Gomes, G.J.C. & Sobreira, F.G. (2008) Geomechanics rockslope characterization of Espirito Santo’s highways,with emphasis in rockfall risk evaluation. 12° Engi-neering geology and environmental national congress,Ipojuca, Pe. São Paulo, v. CD ROM (in Portuguese).
Gomes, R.C. (1991) Classificação Geomecânica de Ma-ciços Rochosos. Material Didático da Escola de Enge-nharia de São Carlos, Universidade de São Paulo, 37 pp.
Soils and Rocks, São Paulo, 34(2): 163-174, May-August, 2011. 173
Evaluation of Rockfall Hazard Along Brazil Roads
Hadjin, D.J. (2002) New York State Department of Trans-portation Rock Slope Rating Procedure and RockfallAssessment, Transportation Research Record 1786, Pa-per number 02-3978.
Hoek, E. (1998) Analysis of rockfall hazards. Rock Engi-neering, Course notes. Available at http://www.rockeng.utoronto.ca/hoekcorner.htm. Acessed January8th, 2009.
Hoek, E. & Bray, J.W. (1981) Rock Slope Engineering. 3rded. IMM, London, 358 pp.
Hopkins, T.C.; Beckham, T.L.; Sun, L. & Butcher, B.(2003) Highway Rock Slope Management Program.Kentucky Transportation Center, University of Ken-tucky.
International Society of Rock Mechanics (ISRM) (1978)Suggested methods for the quantitative description inrock masses. Int. J. Rock Mech. Min. Sci. & Geomech.Abstr., v. 15:6, p. 319-368.
Meneses, P.R. & Paradella, W.R. (1978) Preliminar geo-logical sintesys of Espirito Santo south part. Proc. I Bra-zilian National Congress of Remote Sensing, São Josédos Campos, SP, v. 2 pp. 479-499 (in Portuguese).
Palmström, A. (1995) RMi – A Rock Mass Characteriza-tion System for Rock Engineering Purposes. PhD The-sis, Oslo University, Norway, 400 pp.
Pierson, L.A.; Davis, S.A. & Van Vickle, R. (1990)Rockfall Hazard Rating System – Implementation Ma-nual, Federal Highway Administration (FHWA), Re-port FHWA-OR-EG-90-01, FHWA, U.S. Dep. ofTransp.
Pierson, L.A. & Van Vickle, R. (1993) Rockfall HazardRating System, Transportation Research Record N°1343, National Research Board, Washington, D.C.,pp. 6-19.
Pierson, L.A.; Gullixon, C.F. & Chassie, R.G. (2001)Rockfall Catchment Area Design Guide Final Report.Spr-3 (032). Technical Report Form DOT F 1700.7(8-72). Oregon, U.S.
Priest, S.D. & Hudson, J.A. (1976) Discontinuity spacingin rock. International Journal of Rock Mechanics,Mining Science & Geomechanics, cap. 13, p. 134-153.
Ritchie, A.M. (1963) Evaluation of rockfall and its control,U.S. Department of Commerce, Bureau of Public
Roads, and theWashington State Highway Commis-sion.
Romana, M. (1985) New adjustment ratings for applicationof Bieniawski classification to slopes. InternationalSymposium on the Role of Rock Mechanics, Zacatecas,pp. 49-53.
Rose, B.T. (2005) Tennessee Rockfall Management Sys-tem. PhD Thesis, Faculty of Virginia Polytechnic Insti-tute and State University, Blacksburg, 100 pp.
List of symbolsAC: Clinometer height (L)ADT: Average daily trafficASD: Actual sight distance (L)CE: Cut extension (L)D: Depth of rock catchment areas (L)Db: Block size (L)DSD: Designed sight distance (L)DV: Percent of sight distanceH: Slope height (L)IAC: Ditch effectiveness parameterIAT: Slope height parameterICC: Climate condition parameterICG: Geologic characteristic parameterIDB: Block size parameterIDV: Sight distance parameterILP: Roadway width parameterIQB: Rockfall hazard indexIRV: Average vehicle risk parameterJV: Volumetric joint count (L-1)LP: Roadway width (L)nj: Number of joint set indexesP: Annual rainfall (L)PSP: Posted speed limit (LT-1)RV: Average vehicle riskRMR: Rock mass ratingSMR Slope mass ratingRQD: Rock quality designationS: Average joint spacing (L)Smáx: Largest joint spacing (L)Smin: Smallest joint spacing (L)X: Distance of the measurement point (pavement edge) (L)W: Width of rock catchment areas (L)�: Angle measured by clinometer�: Block shape factor
174 Soils and Rocks, São Paulo, 34(2): 163-174, May-August, 2011.
Gomes et al.


Albuquerque, Paulo José Rocha de 35, 51Almeida, M.C.F. 79Araújo, Adriana de Souza Forster 101Barbosa, Paulo Sérgio de Almeida 91Borges, R.G. 79Brandão, Elisson Hage 91Calabrò, P.S. 129Campos, Tacio Mauro Pereira de 139Carvalho, Carlos Alexandre Braz de 91Carvalho, David de 35, 51Castro, José Adilson de 101Crispim, Flavio A. 91Cunha, Renato P. 153Esteves, Elisabete Costa 35, 51Fonseca, Antonio Viana da 35, 51Gerscovich, Denise Maria Soares 139Gomes, Guilherme José Cunha 163Karimpour-Fard, Mehran 115Lana, Milene Sabino 163Lima, Dario Cardoso de 91
Machado, Sandro Lemos 115Massad, Faiçal 35, 51Moraci, N. 129Mota, Neusa M.B. 153Motta, H.P.G. 79Oliveira, J.R.M.S. 79Palmeira, E.M. 65Poulos, Harry G. 3Ritter, Elizabeth 101Santos, Jaime 35, 51Schaefer, Carlos Ernesto Gonçalves Reynaud 91Silva, Alexandre José da 101Silva, Claudio Henrique de Carvalho 91Sobreira, Frederico Garcia 163Stewart, W. Patrick 153Suraci, P. 129Valadão, Izabella Christynne Ribeiro Pinto 101Vargas Jr., Eurípedes do Amaral 139Viana, H.N.L. 65Viana, P.M.F. 65
SOILS and ROCKSAn International Journal of Geotechnical and Geoenvironmental Engineering
Publication ofABMS - Brazilian Association for Soil Mechanics and Geotechnical Engineering
SPG - Portuguese Geotechnical SocietyVolume 34, N. 2, May-August 2011
Author index

Category of the PapersSoils and Rocks is the scientific journal edited by the
Brazilian Association for Soil Mechanics and Geotech-nical Engineering (ABMS) and the Portuguese Geotech-nical Society (SPG). The journal is intended to the divul-gation of original research works from all geotechnicalbranches.
The accepted papers are classified either as an Articlepaper, a Technical Note, a Case Study, or a Discussionaccording to its content. An article paper is an extensiveand conclusive dissertation about a geotechnical topic. Apaper is considered as a technical note if it gives a shortdescription of ongoing studies, comprising partial resultsand/or particular aspects of the investigation. A casestudy is a report of unusual problems found during the de-sign, construction or the performance of geotechnicalprojects. A case study is also considered as the report ofan unusual solution given to an ordinary problem. Thediscussions about published papers, case studies andtechnical notes are made in the Discussions Section.
When submitting a manuscript for review, the authorsshould indicate the category of the manuscript, and is alsounderstood that they:
a) assume full responsibility for the contents and ac-curacy of the information in the paper;
b) assure that the paper has not been previously pub-lished, and is not being submitted to any other periodicalfor publication.
Manuscript InstructionsManuscripts must be written in English. The text is to
be typed in a word processor (MS Word or equivalent),using ISO A4 page size, left, right, top, and bottom mar-gins of 25 mm, Times New Roman 12 font, and line spac-ing of 1.5. All lines and pages should be numbered. Thetext should be written in the third person.
The fist page of the manuscript is to include the title ofthe paper in English, followed by the names of the au-thors with the abbreviation of the most relevant academictitle. The affiliation, address and e-mail is to be indicatedbelow each author’s name. An abstract of 200 words is tobe written in English after the author’s names. A list withup to six keywords at the end of the abstract is required.
Although alteration of the sequence and the title ofeach section may be required, it is suggested that the textcontains the following sections: Introduction, Materialand Methods, Results, Discussions, Conclusion, Ac-knowledgements, References and List of Symbols. Abrief description of each section is given next.
Introduction: This section should indicate the stateof the art of the problem under evaluation, a descriptionof the problem and the methods undertaken. The objec-tive of the work is to be clearly presented at the end of thesection.
Materials and Methods: This section should includeall information needed to the reproduction of the pre-sented work by other researchers.
Results: In this section the data of the investigationshould be presented in a clear and concise way. Figuresand tables should not repeat the same information.
Discussion: The analyses of the results should be de-scribed in this section. Conclusions: The text of this sec-tion should be based on the presented data and in thediscussions.
Acknowledgenments: If necessary, concise acknowledgementsshould be written in this section.
References: References to other published sources are to be made inthe text by the last name(s) of the author(s), followed by the year of publi-cation, similarly to one of the two possibilities below:
“while Silva & Pereira (1987) observed that resistance depended onsoil density” or “It was observed that resistance depended on soil density(Silva & Pereira, 1987).”
In the case of three or more authors, the reduced format must be used,e.g.: Silva et al. (1982) or (Silva et al., 1982). Two or more citations be-longing to the same author(s) and published in the same year are to be dis-tinguished with small letters, e.g.: (Silva, 1975a, b, c.). Standards must becited in the text by the initials of the entity and the year of publication, e.g.:ABNT (1996), ASTM (2003).
Full references shall be listed alphabetically at the end of the text bythe first author’s last name. Several references belonging to the same au-thor shall be cited chronologically. Some examples are listed next:
Papers: Bishop, A.W. & Blight, G.E. (1963) Some aspects of effectivestress in saturated and unsaturated soils. Géotechnique, v. 13:2, p. 177-197.
Books: Lambe, T.W & Whitman, R.V. (1979) Soil Mechanics, SIVersion, 2nd ed. John Wiley & Sons, New York, p. 553.
Book with editors: Sharma, H.D.; Dukes, M.T. & Olsen, D.M. (1990)Field measurements of dynamic moduli and Poisson’s ratios of refuse andunderlying soils at a landfill site. Landva A. & Knowles, G.D. (eds)Geotechnics of Waste Fills - Theory and Practice, American Society forTesting and Materials - STP 1070, Philadelphia, p. 57-70.
Proceedings (printed matter or CD-ROM): Jamiolkowski, M.; Ladd,C.C.; Germaine, J.T & Lancellotta, R. (1985) New developments in fieldand laboratory testing of soils. Proc. 11th Int. Conf. on Soil Mech. andFound. Engn., ISSMFE, San Francisco, v. 1, pp. 57-153.(specify if CD –ROM)
Thesis and dissertations: Lee, K.L. (1965) Triaxial CompressiveStrength of Saturated Sands Under Seismic Loading Conditions. PhDDissertation, Department of Civil Engineering, University of California,Berkeley, 521 p.
Standards: ASTM (2003) Standard Test Method for Particle SizeAnalysis of Soils - D 422-63. ASTM International, West Conshohocken,Pennsylvania, USA, 8 p.
Internet references: Soils and Rocks available at http://www.abms.com.br.
On line first publications must also bring the digital object identifier(DOI) at the end.
Figures shall be either computer generated or drawn with India ink ontracing paper. Computer generated figures must be accompanied by thecorresponding digital file (.tif, .jpg, .pcx, etc.). All figures (graphs, linedrawings, photographs, etc.) shall be numbered consecutively and have acaption consisting of the figure number and a brief title or description ofthe figure. This number should be used when referring to the figure in text.Photographs should be black and white, sharp, high contrasted andprinted on glossy paper.
Tables shall be numbered consecutively in Arabic and have a captionconsisting of the table number and a brief title. This number should beused when referring to the table in text. Units should be indicated in thefirst line of the table, below the title of each column. Abbreviations shouldbe avoided. Column headings should not be abbreviated. When applica-ble, the units should come right below the corresponding column heading.Any necessary explanation can be placed as footnotes.
Equations shall appear isolated in a single line of the text. Numbersidentifying equations must be flush with the right margin. InternationalSystem (SI) units are to be used. The symbols used in the equations shallbe listed in the List of Symbols. It is recommended that the used symbols
be in accordance with Lexicon in 8 Languages, ISSMFE(1981) and the ISRM List of Symbols.
The text of the submitted manuscript (including fig-ures, tables and references) intended to be published as anarticle paper or a case history should not contain morethan 30 pages formatted according to the instructionsmentioned above. Technical notes and discussionsshould have no more than 15 and 8 pages, respectively.Longer manuscripts may be exceptionally accepted if theauthors provide proper explanation for the need of the re-quired extra space in the cover letter.
DiscussionDiscussions must be written in English. The first page
of a discussion paper should contain:• The title of the paper under discussion in the lan-
guage chosen for publication;• Name of the author(s) of the discussion, followed by
the position, affiliation, address and e-mail. Thediscusser(s) should refer himself (herself, themselves) as“the discusser(s)” and to the author(s) of the paper as “theauthor(s)”.
Figures, tables and equations should be numbered fol-lowing the same sequence of the original paper. All in-structions previously mentioned for the preparation ofarticle papers, case studies and technical notes also applyto the preparation of discussions.
Editorial ReviewEach paper will be evaluated by reviewers selected by
the editors according to the subject of the paper. The au-
thors will be informed about the results of the review process. If the paperis accepted, the authors will be required to submit a version of the revisedmanuscript with the suggested modifications. If the manuscript is refusedfor publication, the authors will be informed about the reasons for rejec-tion. In any situation comprising modification of the original text, classi-fication of the manuscript in a category different from that proposed bythe authors, or refusal for publication, the authors can reply presentingtheir reasons for disagreeing with the reviewers’ comments
SubmissionThe author(s) must submit for review:1. A hard copy of the manuscript to Editors - Soils and Rocks, Av.
Prof. Almeida Prado, 532 – IPT, Prédio 54 – DEC/ABMS, 05508-901 -São Paulo, SP, Brazil. The first page of the manuscript should contain theidentification of the author(s), or
2. The digital file of the manuscript, omitting the authors’ name and anyinformation that eventually could identify them, should be sent [email protected]. The following must be written in the subject of the e-mailmessage: “Paper submitted to Soils and Rocks”. The authors’ names, aca-demic degrees and affiliations should be mentioned in the e-mail message.The e-mail address from which the digital file of the paper was sent will bethe only one used by the editors for communication with the correspondingauthor.
Follow UpAuthors of manuscripts can assess the status of the review process at
the journal website (www.soilsandrocks.com.br) or by contacting theABMS secretariat.
Volume 34, N. 2May-August 2011
Soils and RocksAn International Journal of Geotechnical
and Geoenvironmental Engineering
SOILS and ROCKS An International Journal of Geotechnical and Geoenvironmental Engineering
Volume 34, N. 2, May 2011-August
Table of Contents
Soils and R
ocks Volume 34, N
.2 2011
ISSN 1980-9743
BMS
ARTICLES
TECHNICAL NOTE
Kinetic Mass Transfer Model for Contaminant Migration in Soils
A Study on the Effects of MSW Fiber Content and Solid Particles Compressibilityon its Shear Strength Using a Triaxial Apparatus
Long-Term Efficiency of Zero-Valent Iron - Pumice Granular Mixturesfor the Removal of Copper or Nickel From Groundwater
Settlement of Floating Bored Piles in Brasília Porous Clay
Adriana de Souza Forster Araújo, Izabella Christynne Ribeiro Pinto Valadão,José Adilson de Castro, Alexandre José da Silva, Elizabeth Ritter 101
Sandro Lemos Machado, Mehran Karimpour-Fard 115
N. Moraci, P.S. Calabrò, P. Suraci 129
W. Patrick Stewart, Renato P. Cunha, Neusa M.B. Mota 153
Back Analysis of a Landslide in a Residual Soil Slope in Rio de Janeiro, Brazil
Evaluation of Rockfall Hazard Along Brazil Roads
Denise Maria Soares Gerscovich, Eurípedes do Amaral Vargas Jr., Tacio Mauro Pereira de Campos 139
Guilherme José Cunha Gomes, Frederico Garcia Sobreira, Milene Sabino Lana 163
CASE HISTORY


