SOLAR BALANCE-OF-SYSTEM COSTS BASELINE COST STUDY Final Report Prepared For: New York State Energy Research and Development Authority (NYSERDA) Albany, NY Jenn Phelps, NYSERDA Project Manager Prepared By: Industrial Economics, Incorporated (IEc) Cambridge, Massachusetts Cynthia Manson, Project Manager NYSERDA Contract 32883 May 2017
Transcript
SOLAR BALANCE-OF-SYSTEM COSTS
BASELINE COST STUDY
Final Report
Prepared For:
New York State Energy Research and Development Authority (NYSERDA) Albany, NY
This report was prepared by Industrial Economics, Inc. (IEc) in the course of performing work contracted for and sponsored by the New York State Energy Research and Development Authority (hereinafter the “Sponsor”). The opinions expressed in this report do not necessarily reflect those of the Sponsors or the State of New York, and reference to any specific product, service, process, or method does not constitute an implied or expressed recommendation or endorsement of it. Further, the Sponsors, the State of New York, and the contractor make no warranties or representations, expressed or implied, as to the fitness for particular purpose or merchantability of any product, apparatus, or service, or the usefulness, completeness, or accuracy of any processes, methods, or other information contained, described, disclosed, or referred to in this report. The Sponsor, the State of New York, and the contractor make no representation that the use of any product, apparatus, process, method, or other information will not infringe privately owned rights and will assume no liability for any loss, injury, or damage resulting from, or occurring in connection with, the use of information constrained, described, disclosed, or referred to in this report.
iii
Table of Contents
ContentsNotice ............................................................................................................................................................ ii
Table of Contents ....................................................................................................................................... iii
List of Tables .............................................................................................................................................. iv
List of Figures ............................................................................................................................................. iv
1.1. Program Description ................................................................................................................................................................ 1
1.2. Study Objectives ....................................................................................................................................................................... 1
3.4. Impact of Financing and Overhead Structure on BOS Costs ............................................................................................. 22
3.5. Other Findings ........................................................................................................................................................................ 22
Section 4. Conclusions and Recommendations ...................................................................................... 26
4.1. Potential Priorities for Cost Reduction ................................................................................................................................ 26
4.2. Recommendations for Replication and Future Study ......................................................................................................... 26
Appendix A. Survey Instrument ............................................................................................................ A-1
Appendix B. Detailed Survey Results .................................................................................................... B-1
Appendix C. Detailed Methods and Validation Results ...................................................................... C-1
C.1 Cost Estimation Model ........................................................................................................................................................ C-1
C.2.1 Survey Development and Administration .......................................................................................................................... C-2
C.2.2 Survey Data Validation Methods and Results ................................................................................................................... C-5
C.2.3 Weighting Survey Data ...................................................................................................................................................... C-7
iv
List of Tables
Table ES-1. Residential Costs, by Cost Component ($/Watt) ........................................................... ES-2
This report provides estimates of baseline balance-of-system (BOS) soft costs for solar photovoltaic (PV) systems installed in New York State in 2016. BOS costs are defined as all costs not attributable to the PV panels. The report focuses specifically on soft costs, i.e., non-hardware costs, and therefore does not consider costs for hardware such as inverters, except insofar as they indirectly influence soft costs.
The report resents separate baseline cost estimates for different customer segments (residential and roof-mounted commercial systems) and geographic areas (Con Ed service territory, Long Island, and the rest of the state [ROS]). These estimates will serve as an initial point of comparison for future cost estimates, to facilitate evaluation of NYSERDA programs that aim to reduce the cost of solar PV systems.
BOS costs in this report reflect two key data sources:
1. Extrapolation or adoption of nationwide estimates developed by the National Renewable Energy Laboratory (NREL), for cost elements that were likely to be consistent across states, and
2. A New York State-specific survey of solar installers for cost components that were likely to vary with state context.
For certain cost components estimated based on NREL, such as financing costs and profits, the study team conducted key informant interviews to validate NREL’s benchmark figures. For other cost components (e.g., sales tax), the team used information collected from secondary sources.
The study team estimated the remaining BOS cost components through a web-based survey of solar installers active in New York State in 2016. The survey instrument is reproduced in Appendix A. The team validated results through a multi-step process that included comparing survey results to NREL and GTM Research data sources; identifying cost category definitions or wording that may have affected the accuracy of results; identifying results that were heavily influenced by outliers and other potential anomalies; and conducting follow-up interviews with targeted survey respondents to verify or correct their responses regarding the specific issues identified as warranting validation. The report presents results both including and excluding outliers and other potential data anomalies to allow for greater transparency regarding the impact of these data points on overall cost estimates.
Final BOS baseline cost estimates reflect median weighted results according to respondents’ relative market share (determined by installed capacity) within each regional subgroup for each cost component. Note that these costs are, by their nature, difficult to estimate. The tested questions were used with a representative sample, and the results presented reflect the responses of that sample. However, the results may not be consistent with any given installer’s individual costs or cost accounting processes.
Table ES-1 presents our estimates of the weighted median cost for each cost component for residential systems. For comparison, the report also includes nationwide and New York State-specific benchmark figures for Q1 2016 as reported by NREL.1 These estimates represent costs for a typical residential system. The weighted average system size reported by survey respondents was 7.8 kW for the Con Ed service territory, 7.4 kW for Long Island, and 7.6 kW for ROS.
Our estimates for costs associated with residential systems in the three New York State regions all exceed NREL’s Q1 2016 New York State-specific estimates. The largest differences between NREL estimates and the estimates in this report are in permitting, zoning, inspection, and interconnection activities. Our estimates also include higher per-watt customer acquisition costs. Survey results also show that total BOS costs are highest in the Con Ed service territory.
1 Fu, Ran et al. “U.S. Solar Photovoltaic System Cost Benchmark: Q1 2016.” National Renewable Energy Laboratory (NREL), Technical Report NREL/TP-6A20-66532. September 2016. Available at http://www.nrel.gov/docs/fy16osti/66532.pdf
ES-2
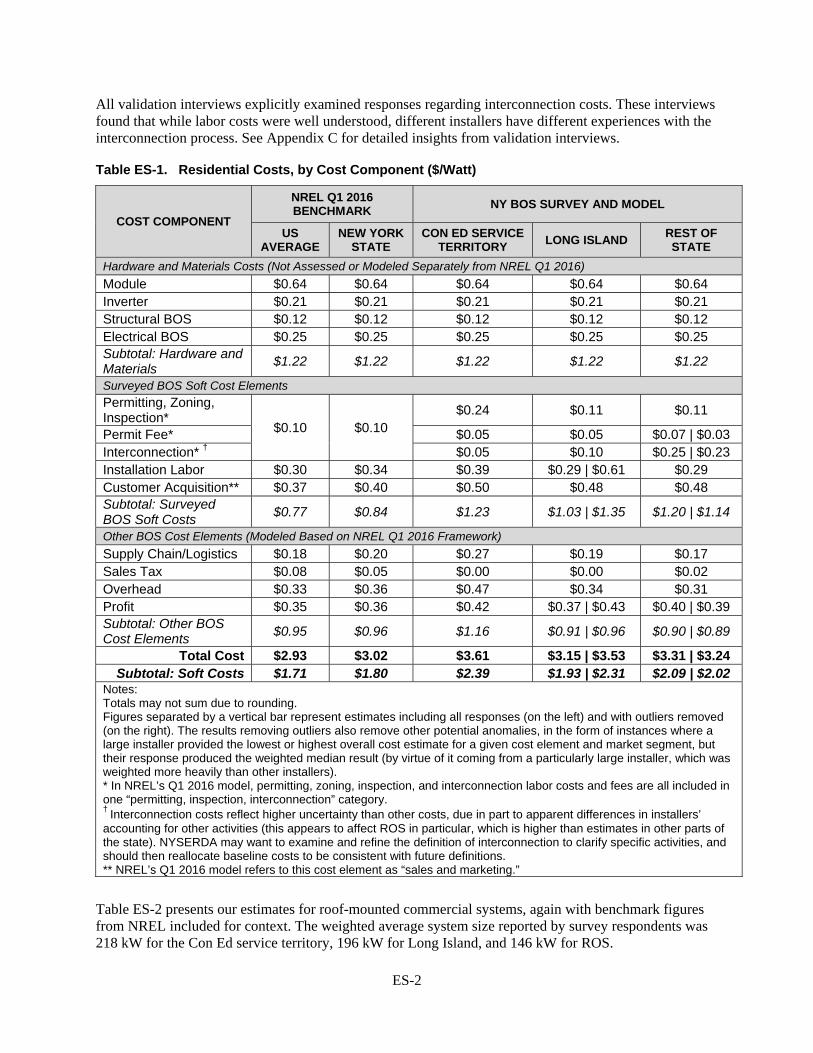
All validation interviews explicitly examined responses regarding interconnection costs. These interviews found that while labor costs were well understood, different installers have different experiences with the interconnection process. See Appendix C for detailed insights from validation interviews.
Table ES-1. Residential Costs, by Cost Component ($/Watt)
COST COMPONENT
NREL Q1 2016 BENCHMARK
NY BOS SURVEY AND MODEL
US AVERAGE
NEW YORK STATE
CON ED SERVICE TERRITORY
LONG ISLAND REST OF STATE
Hardware and Materials Costs (Not Assessed or Modeled Separately from NREL Q1 2016)
Notes: Totals may not sum due to rounding. Figures separated by a vertical bar represent estimates including all responses (on the left) and with outliers removed (on the right). The results removing outliers also remove other potential anomalies, in the form of instances where a large installer provided the lowest or highest overall cost estimate for a given cost element and market segment, but their response produced the weighted median result (by virtue of it coming from a particularly large installer, which was weighted more heavily than other installers). * In NREL’s Q1 2016 model, permitting, zoning, inspection, and interconnection labor costs and fees are all included in one “permitting, inspection, interconnection” category. † Interconnection costs reflect higher uncertainty than other costs, due in part to apparent differences in installers’ accounting for other activities (this appears to affect ROS in particular, which is higher than estimates in other parts of the state). NYSERDA may want to examine and refine the definition of interconnection to clarify specific activities, and should then reallocate baseline costs to be consistent with future definitions. ** NREL’s Q1 2016 model refers to this cost element as “sales and marketing.”
Table ES-2 presents our estimates for roof-mounted commercial systems, again with benchmark figures from NREL included for context. The weighted average system size reported by survey respondents was 218 kW for the Con Ed service territory, 196 kW for Long Island, and 146 kW for ROS.
ES-3
Table ES-2. Commercial Costs, Roof-Mounted Systems, by Cost Component ($/Watt)
COST COMPONENT
NREL Q1 2016 BENCHMARK
NY BOS SURVEY AND MODEL
US AVERAGE
NEW YORK STATE
CON ED SERVICE TERRITORY
LONG ISLAND REST OF STATE
Hardware and Materials Costs (Not Assessed or Modeled Separately from NREL Q1 2016)
Notes: Totals may not sum due to rounding. Figures separated by a vertical bar represent estimates including all responses (on the left) and with outliers removed (on the right). The results removing outliers also remove other potential anomalies, in the form of instances where a large installer provided the lowest or highest overall cost estimate for a given cost element and market segment, but their response produced the weighted median result (by virtue of it coming from a particularly large installer, which was weighted more heavily than other installers). * In NREL’s Q1 2016 model, permitting, zoning, inspection, and interconnection labor costs and fees are encapsulated into one “permitting and interconnection” category. † Interconnection costs reflect higher uncertainty than other costs, due in part to apparent differences in installers’ accounting for other activities (this appears to affect ROS in particular, which is higher than estimates in other parts of the state). NYSERDA may want to examine and refine the definition of interconnection to clarify specific activities, and should then reallocate baseline costs to be consistent with future definitions. ** NREL’s Q1 2016 model does not separately estimate these cost elements, but instead includes an aggregate “developer overhead category.” By our understanding, this category aligns to predevelopment / origination and design and engineering activities, and is therefore analogous to these items within the survey. The $0.41 estimate reflects NREL’s New York State-specific estimate for “developer overhead.” †† ROS predevelopment costs are significantly higher than estimates from other parts of the state, and higher than NYSERDA program staff anticipated based on agency experience. NYSERDA may conduct additional information collection to more closely examine the reasons for this cost difference and determine whether the baseline ROS predevelopment costs require adjustment.
ES-4
Our estimates for commercial roof-mounted systems vary somewhat from NREL’s Q1 2016 New York State-specific estimates. This variation occurs in part because some of the cost category elements defined by NREL may not align perfectly with the categories and definitions used within our estimates. For example, NREL’s commercial model includes a catch-all “developer overhead” category, which likely includes both predevelopment and design and engineering activities.
The variation between region-specific cost estimates and the NREL Q1 2016 New York State-specific models depends on the specific region examined. For the Con Ed service territory, installation labor is higher than NREL’s estimate, but predevelopment costs are lower than NREL’s aggregate estimate for developer overhead. The overall cost estimates for the Con Ed service territory, however, are only slightly lower than NREL’s statewide estimate.
In Long Island, the results including all responses are driven by one particularly large installer with low estimates for several cost categories. However, even when this potential anomaly is removed, estimated dollar-per-watt costs in Long Island are still below the statewide NREL benchmark.
The ROS results differ from the results for the other two regions in that they feature higher costs for interconnection and predevelopment. These predevelopment costs are more in line with the NREL estimates for developer overhead, but interconnection costs are higher than NREL’s aggregate “permitting and interconnection” cost category estimate, resulting in higher ROS results than the statewide NREL benchmark.
As with the residential cost estimates, all validation interviews explicitly examined interconnection costs, and found that while labor costs were well understood, different installers have different experiences with the interconnection process. See Appendix C for detailed insights from validation interviews.
Unlike the results for residential systems in Table ES-1, permitting and interconnection activity costs appear to be more in line with NREL’s benchmark for commercial systems. However, the high estimate for ROS interconnection creates a greater deviation of estimated costs from NREL’s benchmark in this region.
1
Section 1. Introduction
1.1. Program Description
Several NYSERDA programs aim to reduce the costs and increase the market penetration of solar photovoltaic (PV) systems in New York State. In particular, the NY-Sun Initiative includes a variety of initiatives that aim to make solar PV cheaper and easier to acquire, including Solarize (community-based solar campaigns), K-Solar (for schools), Affordable Solar (for low-to-moderate income residents), and Shared Solar (for renters and others that cannot put solar on their roofs). NYSERDA also provides direct incentives for solar installations through the Megawatt Block program, a deployment effort that subsidizes purchases of PV systems.2 Several other NYSERDA initiatives that are not focused directly on solar PV may nonetheless impact the solar PV market in the state.
1.2. Study Objectives
To accurately assess the impact of NYSERDA’s programs on reducing the cost of solar PV, evaluators need a baseline cost estimate against which any future estimates can be measured. The primary objective of this study is to develop a New York State-specific estimate of solar PV balance-of-system soft costs to serve as such a baseline. For PV systems, BOS costs are defined as all costs not attributable to the PV panels; by focusing specifically on soft costs, this study further excludes from consideration non-panel hardware costs, such as the cost of inverters.3 A second main goal is to provide information on how BOS costs vary across different customer segments (residential vs. commercial) and geographic areas, and to provide insights into the relative costs of financing/ownership models.
The research questions for the baseline cost study are:
1. What is the mean and median cost of each major BOS soft cost component for PV systems installed in New York State?
2. What degree of variation exists in costs for each major BOS soft cost component for PV systems installed in New York State by different installers?
3. To what extent do costs for each major BOS soft cost component differ between customer or installation types (i.e., residential vs. commercial)?
4. To what extent do costs for each major BOS soft cost component differ across geographic areas in New York State (i.e., the Con Ed service territory, Long Island, and the rest of the state (ROS)?
5. To what extent do financing costs, and other major BOS soft cost components, differ across PV systems using different financing and ownership structures (i.e., purchase, lease, and PPA)?
6. To what extent do costs for each major BOS soft cost component differ between New York and other U.S. states?
a. Does New York State have unique features that create cost differences relative to other states?
2 See http://ny-sun.ny.gov/About 3 In addition, other data sources that attempt to characterize the per-watt cost of PV solar often include “electrical balance of system costs” and “structural balance of system costs” as additional hardware components. This study also excludes these components from the array of BOS soft costs examined.
2
1.3. Key Limitations
BOS costs are, by their nature, difficult to estimate. The tested questions were used with a representative sample, and the results presented reflect the responses of that sample. However, the results may not be consistent with any given installer’s individual costs.
As with all surveys, the results of this study depend on the accuracy of the information provided by survey responses. The study team worked to minimize inaccuracies in survey responses through a variety of means, including:
Developing the survey instrument in conjunction with NYSERDA program and evaluation staff, and with a solar installer working on the study team;
Using cost categories and definitions that were consistent with industry norms, per the National Renewable Energy Laboratory (NREL);
Conducting outreach during the survey to large installers, to ensure that our overall results reflected a substantial proportion of installed capacity within New York State and individual market segments (when weighting results by respondents’ installed capacity);
Pre-testing the survey before launching the full survey; and
Conducting post-survey follow-up interviews to validate results, focusing on outliers and on cost categories where initial results differed significantly from NREL’s benchmark figures.
To document uncertainty associated with responses, particularly in the context of weighted results, this report presents all results both including and excluding outliers and other potential anomalies.4 In this report, ‘outliers’ are defined as responses falling outside of the 90 percent confidence interval for a given cost element and market segment, using unweighted responses (i.e., prior to weighting individual survey responses according to the respondent’s installed capacity). ‘Other potential anomalies’ are instances where a large installer provided the lowest or highest overall cost estimate for a given cost element and market segment, but their response produced the weighted median result (by virtue of it coming from a particularly large installer, which was weighted more heavily than other installers). Note that some outlier responses and other potential anomalies may in fact reflect accurate information. For instance, large installers may enjoy economies of scale that give them lower costs in certain areas than small installers; in such cases, excluding outliers and other potential anomalies would render the overall cost estimate less accurate, not more.
This survey design differs from the NREL structure in one specific category: interconnection costs. NYSERDA requested that interconnection costs be treated as a standalone category in the survey. The study team defined interconnection as including all labor costs associated with preparing and submitting interconnection applications, but not including expenses associated with fees. A separate question addressed other permitting and inspection costs. Because the practice of separating interconnection into its own cost category is not consistent with industry norms,5 the study team anticipated additional uncertainty around the responses to this question, since it was unfamiliar to respondents.6
4 Because the study team weighted results according to installed capacity, the accuracy of the largest installers’ responses is more important than small installers in determining the accuracy of the overall results. 5 Fu, Ran et al. “U.S. Solar Photovoltaic System Cost Benchmark: Q1 2016,” p. 15. National Renewable Energy Laboratory (NREL), Technical Report NREL/TP-6A20-66532. September 2016. Available at http://www.nrel.gov/docs/fy16osti/66532.pdf 6 To evaluate this possibility, the study team conducted several follow-up interviews with survey respondents focusing on interconnection specifically. The survey instrument defined this category as including only labor costs associated with preparing and submitting interconnection applications, and explicitly indicated that it did not include any expenses associated with fees. One follow-up interviewee indicated that they had misinterpreted the cost category definition and provided revised cost estimates. Overall, validation interviews did not identify a systematic problem with the interconnection cost estimates. However, to minimize misunderstanding in future versions of this survey, NYSERDA may wish to follow industry norms by estimating permitting, inspection, and interconnection costs as a single cost category.
3
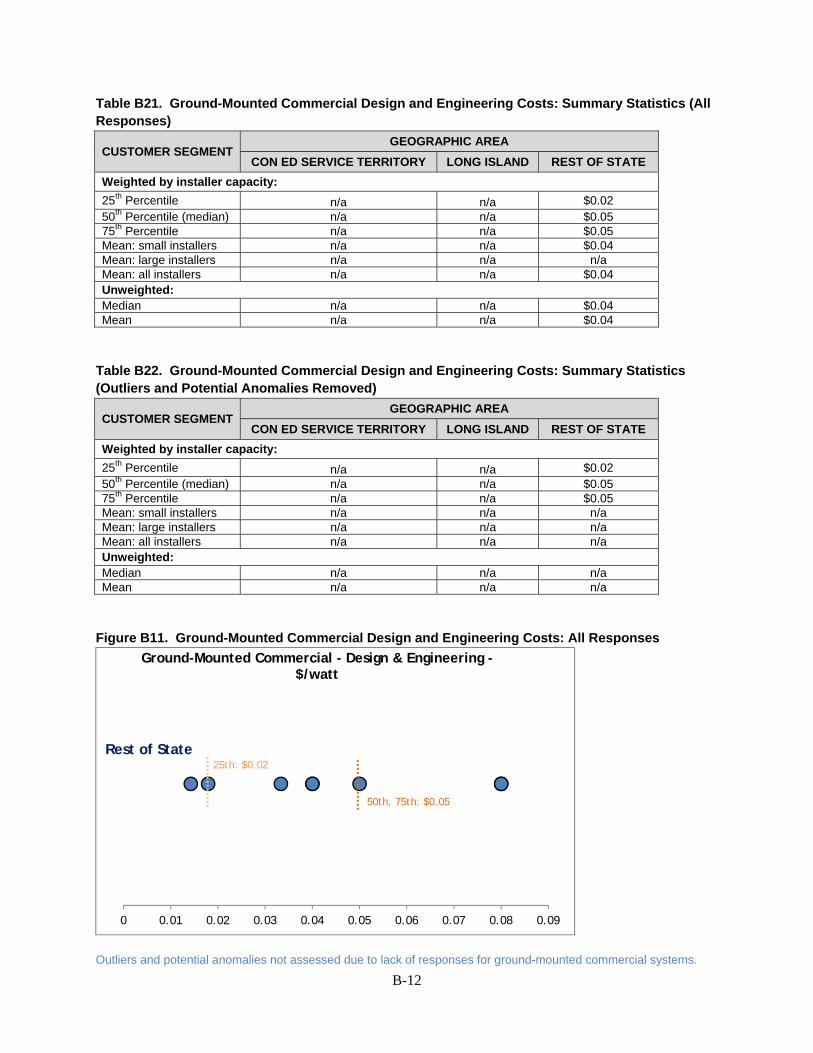
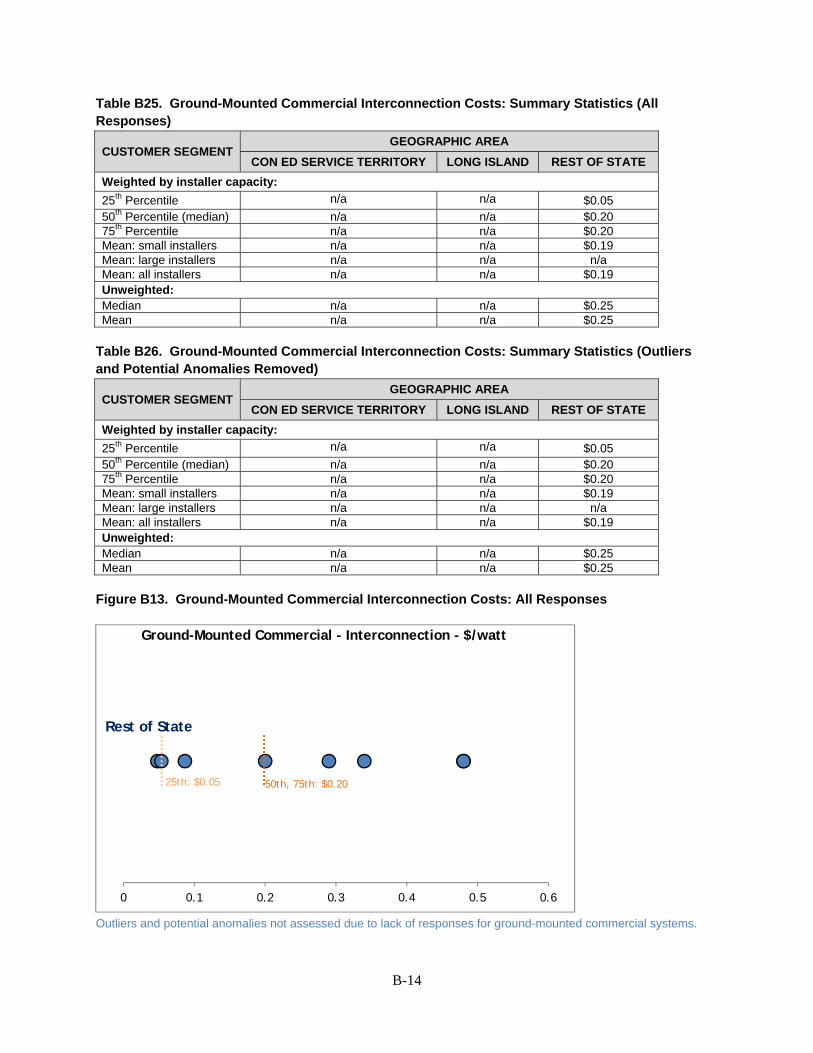
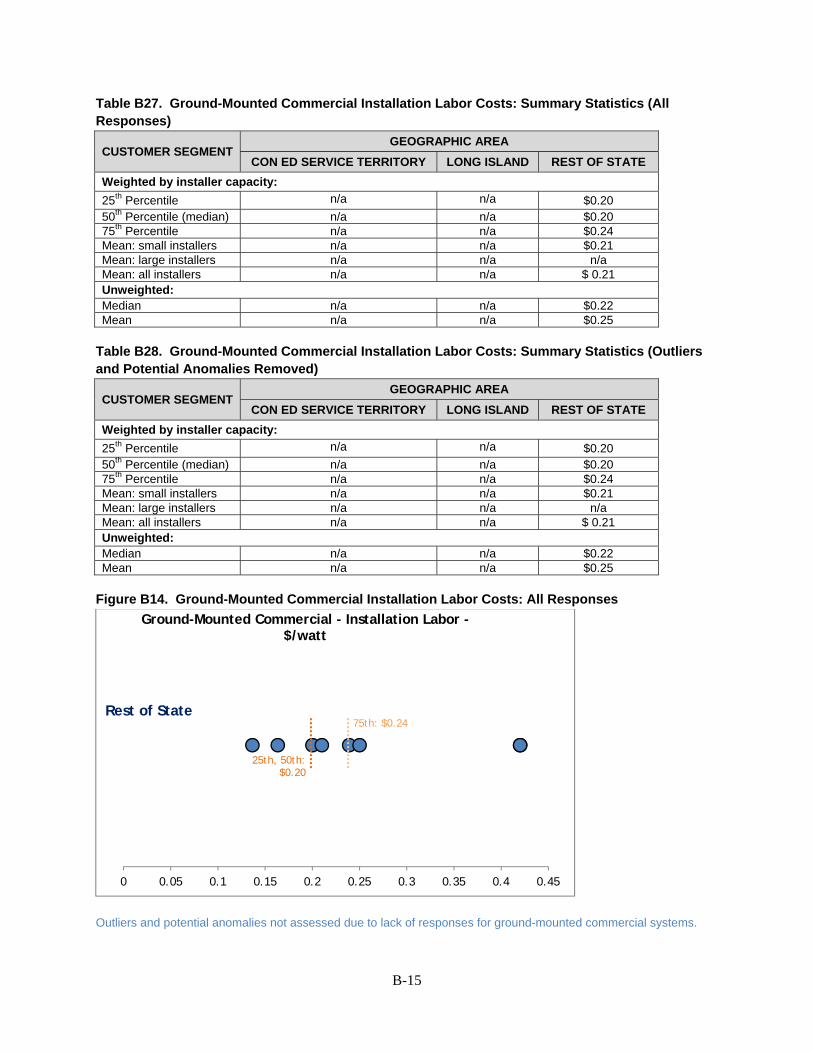
To reduce survey burden, respondents were prompted to provide cost estimates for either roof-mounted or ground-mounted commercial systems, but not both, depending on which accounted for a majority of their installations. Very few commercial respondents provided estimates of ground-mounted system costs; those who did were typically small installers located in the “Rest of State” region (i.e., outside of the Con Ed service territory and Long Island). Estimates for this category therefore feature greater uncertainty than the results for residential or commercial roof-mounted systems, and the low capacity-weighted response rate does not support a statistically-valid estimate. The report therefore includes survey data on ground-mounted systems in Appendix B, but not in the primary results section.
Validation interviews also revealed that installers employ many different definitions of “interconnection” and “fees” that may be associated with interconnection, including application fees, “pay-to-play” fees paid to the utility to conduct interconnection activities, “fees” for required studies that must be conducted before interconnection is performed, wait time-related costs associated with presence at utility-required pre-interconnection inspections, and transmission upgrade costs that might be required before an interconnection can take place. Generally, survey validation respondents indicated that no direct “interconnection fee,” i.e., a surcharge paid to the utility to perform interconnection exists in New York State for the majority of PV solar installations; this is consistent with the NREL benchmark studies, which do not separately estimate or break out interconnection fees for residential or commercial roof-mounted PV solar systems. However, many respondents indicated the presence of other costs associated with interconnection beyond labor costs to prepare and submit interconnection applications, such as the other expense or cost types listed above. Therefore, to the extent that these additional interconnection-related expenses are routine in the United States and/or specifically New York, the estimates presented in this document may systematically underrepresent the BOS and total costs of PV solar installations.
4
Section 2. Methods
The BOS costs developed for this baseline are designed to be comparable to NREL’s “U.S. Solar Photovoltaic System Cost Benchmark: Q1 2016.”7 To ensure that the approach and, where appropriate, data used were consistent with NREL’s methods, the study team developed cost estimates using an Excel model based on the national model developed by NREL. For cost elements that are likely to be consistent across states, and/or where the study team anticipated that survey data may not provide accurate information, the study extrapolated from generalized estimates developed by NREL through its nationwide BOS cost estimation efforts as part of its series of benchmark studies. For these cost components, which included financing and other overhead costs and profits, the study team conducted key informant interviews to validate NREL’s benchmark figures and methodologies.
For costs that are more likely to be state-specific, the study team collected New-York State-specific data using a web-based survey of solar installers active in the state in 2016. The survey instrument is reproduced in Appendix A. The survey was distributed to the full list of NY-Sun program partners, which included 360 solar installers.8 229 of these companies installed PV systems in New York State in 2016.9 The study obtained 110 unique survey responses, for a response rate of approximately 48 percent among companies performing solar system installations in New York in 2016.
Table 1 identifies the methods used to estimate each cost component.
Table 1. Methods Used by Cost Component
COST COMPONENT CUSTOMER SEGMENT METHOD OF ESTIMATION
Customer acquisition Residential Survey Predevelopment/origination Commercial Survey Design and engineering Commercial Survey Permitting, inspection, and zoning labor
All Survey
Interconnection labor All Survey Installation labor All Survey
Permitting fees All
Collected during survey follow-up / validation interviews (Con Ed service territory and Long Island)
Survey (rest of state)
Sales tax All
PV systems are exempt from state sales tax in NY.
Applied average local sales tax rates (weighted by PV capacity installed in different jurisdictions) for jurisdictions that do not exempt PV systems from local sales taxes.
7 Fu, Ran et al. “U.S. Solar Photovoltaic System Cost Benchmark: Q1 2016,” p. 15. National Renewable Energy Laboratory (NREL), Technical Report NREL/TP-6A20-66532. September 2016. Available at http://www.nrel.gov/docs/fy16osti/66532.pdf 8 NY-Sun program partners can be either commercial or residential partners. To qualify for commercial partnership, an installer must demonstrate that they have completed three commercial-scale projects totaling 500 kW in the past three years, or have completed a PV project under a previous NYSERDA PV PON that has been reporting data to the NYSERDA DG Integrated Data System website for at least three months. To qualify for residential partnership, installers must fulfill one of three credentialing paths: NABCEP certification; IBEW-NECA electrical journeyman and apprentice training; or UL PV system installation certification. Residential applicants are also evaluated on prior experience with installation, employment history, and customer references. Note that to receive financial incentives from the NY-Sun program, solar PV systems must be installed by a NY-Sun program partner. As we understand, the vast majority of residential and commercial PV systems installed in New York State receive these incentives. Thus, the list of NY-Sun program partners constitutes all, or nearly all, solar installers active in New York State. Some program partners did not install PV systems in 2016; they were screened out of the survey. 9 OpenNY data identified an overall total of 244 unique companies installing a PV solar system in New York State in 2016. Thus, it would appear that 15 companies included in OpenNY were not on the list of NY-Sun program partners.
5
COST COMPONENT CUSTOMER SEGMENT METHOD OF ESTIMATION
Supply chain / logistics cost (markup)
All Modeled based on NREL cost model.
Contingency costs Commercial Modeled based on NREL cost model.
Overhead and Margin (including financing costs)
All
Modeled based on NREL cost model. Validated NREL assumptions through interviews to confirm appropriateness for New York.
Profit All
Modeled based on NREL cost model. Validated NREL assumptions through interviews to confirm appropriateness for New York.
The cost model estimates certain PV cost components based in part on hardware costs, including supply chain and contingency markups, sales taxes, overhead costs (which include financing costs) and margins (profits). Higher hardware costs produce higher BOS costs for these items. However, the study team did not have a New York State-specific data source available for 2016 hardware costs. As a result, the cost model uses NREL’s nationwide estimates for Q1 2016. Consultation with two New York equipment distributors provides anecdotal support for this approach; both confirmed that the NREL estimates were generally reasonable for the time period, and that hardware costs do not vary significantly by region.
Using NYSERDA data on the number and capacity of solar installations performed by each installer in 2016, the study team developed a weighting protocol to determine the proportion of total installed capacity in a given market segment attributable to each survey respondent. Table 2 summarizes these data for the 110 survey respondents, while Figure 1 shows the three geographic areas in the study (Con Ed service territory, Long Island, and “Rest of State”). Because large installers have a bigger impact on weighted costs in a given market segment, survey implementation included outreach to ensure participation by installers with a high proportion of capacity installed in 2016. By design, the response rate in terms of total installed capacity is therefore higher than the unweighted response rate in many market segments.10
Table 2. Survey Respondent Characteristics
CUSTOMER SEGMENT CON ED SERVICE
TERRITORY LONG ISLAND REST OF STATE Residential:
Number of Respondents 34 25 68 Response Rate (% of Sample) 48% 42% 47% Response Rate (Weighted by Installed Capacity )
72% 69% 65%
Commercial (Non-Residential): Number of Respondents 16 11 44 Response Rate (% of Sample) 47% 46% 51% Response Rate (Weighted by Installed Capacity )
37% 48% 37%
10 The weighted response rate more accurately reflects the overall population of PV systems installed in New York State, and thus, the average costs for all such PV systems; as a result, the weighted response rate rather than the unweighted response rate should be used to evaluate the statistical significance of the survey results. Note that the weighted response rate is not higher than the unweighted response rate in two segments: commercial (non-residential) in the Con Ed service territory, and commercial (non-residential) in the “Rest of State” area (i.e., everything outside of the Con Ed service territory and Long Island). In both instances, some installers with substantial installed capacity in this segment did not respond to the survey; further, the commercial installation market in the “Rest of State” area is highly fragmented, without a wide array of large installers for outreach prioritization.
6
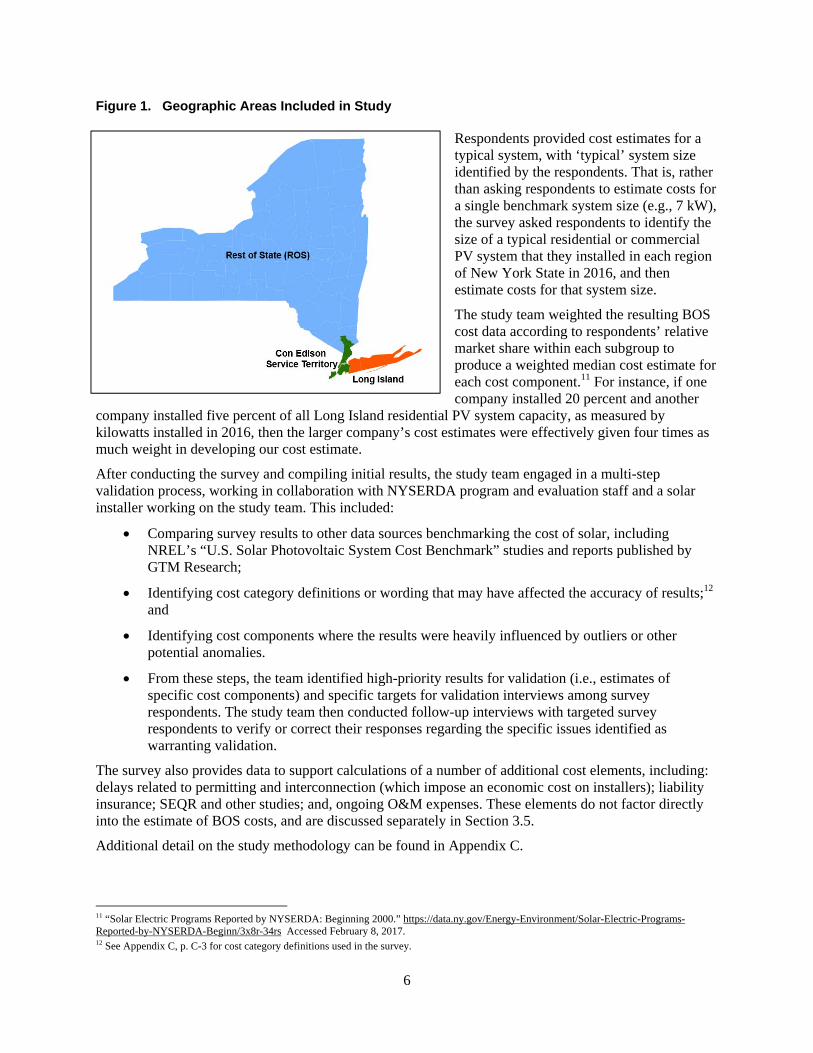
Figure 1. Geographic Areas Included in Study
Respondents provided cost estimates for a typical system, with ‘typical’ system size identified by the respondents. That is, rather than asking respondents to estimate costs for a single benchmark system size (e.g., 7 kW), the survey asked respondents to identify the size of a typical residential or commercial PV system that they installed in each region of New York State in 2016, and then estimate costs for that system size.
The study team weighted the resulting BOS cost data according to respondents’ relative market share within each subgroup to produce a weighted median cost estimate for each cost component.11 For instance, if one company installed 20 percent and another
company installed five percent of all Long Island residential PV system capacity, as measured by kilowatts installed in 2016, then the larger company’s cost estimates were effectively given four times as much weight in developing our cost estimate.
After conducting the survey and compiling initial results, the study team engaged in a multi-step validation process, working in collaboration with NYSERDA program and evaluation staff and a solar installer working on the study team. This included:
Comparing survey results to other data sources benchmarking the cost of solar, including NREL’s “U.S. Solar Photovoltaic System Cost Benchmark” studies and reports published by GTM Research;
Identifying cost category definitions or wording that may have affected the accuracy of results;12 and
Identifying cost components where the results were heavily influenced by outliers or other potential anomalies.
From these steps, the team identified high-priority results for validation (i.e., estimates of specific cost components) and specific targets for validation interviews among survey respondents. The study team then conducted follow-up interviews with targeted survey respondents to verify or correct their responses regarding the specific issues identified as warranting validation.
The survey also provides data to support calculations of a number of additional cost elements, including: delays related to permitting and interconnection (which impose an economic cost on installers); liability insurance; SEQR and other studies; and, ongoing O&M expenses. These elements do not factor directly into the estimate of BOS costs, and are discussed separately in Section 3.5.
Additional detail on the study methodology can be found in Appendix C.
11 “Solar Electric Programs Reported by NYSERDA: Beginning 2000.” https://data.ny.gov/Energy-Environment/Solar-Electric-Programs-Reported-by-NYSERDA-Beginn/3x8r-34rs Accessed February 8, 2017. 12 See Appendix C, p. C-3 for cost category definitions used in the survey.
7
Section 3. Results This section presents estimates of BOS costs for solar PV systems installed in New York in 2016. Sections 3.1 and 3.2 summarize estimates for the elements in our estimates of total residential and roof-mounted commercial system costs respectively. Later sections of the chapter discuss findings related to ground-mounted commercial systems; financing and ownership structures; and other issues.
3.1. Residential Costs Figures 2 and 3 present estimates of the weighted median cost for each cost component for residential systems. Results are also summarized in Table 3. Figure 2 includes all responses, while Figure 3 removes outlier data points (defined as survey responses that fall outside of the 90 percent confidence interval for a given cost element and market segment (for unweighted responses), and other potentially anomalous responses (where the weighted median for a given cost element and market segment reflects the lowest or highest overall response received for that cost element and market segment, by virtue of this response coming from a large installer).13 For comparison, the figures include nationwide benchmark figures for Q1 2016 as reported by NREL, and Q2 2016 figures as reported by GTM Research.14
Survey respondents reported a weighted average system size of 7.8 kW for the Con Ed service territory, 7.4 kW for Long Island, and 7.6 kW for ROS. NREL’s estimates reflect a 5.6 kW system.15
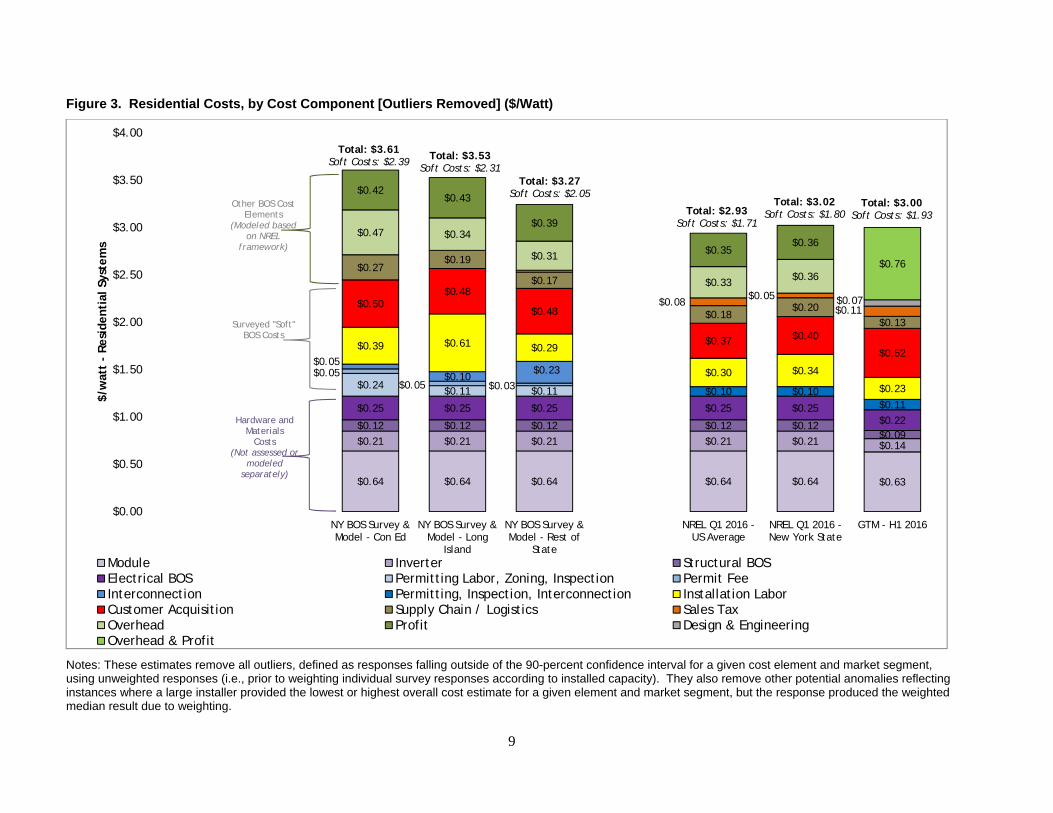
NREL’s New York State-specific benchmark estimates total dollar-per-watt costs for a typical residential system of $3.02, of which $1.80 is soft costs (i.e., all costs excluding hardware costs). In comparison, as shown in Figure 2, the survey data show the following total dollar-per-watt costs:
Con Ed service territory: $3.61, of which $2.39 is soft costs; Long Island: $3.15, of which $1.93 is soft costs; and ROS: $3.31, of which $2.09 is soft costs.
The largest variation is in permitting, zoning, inspection, and interconnection activities; NREL estimates approximately $0.10/watt for these activities, compared to $0.26/watt to $0.43/watt in the survey data. Per-watt customer acquisition costs of $0.48/watt to $0.50/watt are also high compared to NREL’s estimates of $0.40/watt in New York State.
Removing outliers and potential anomalies has limited effects on these estimates. As shown in Figure 3, the largest change occurs in installation labor in Long Island, which leads to an overall dollar-per-watt estimate of $3.63 (compared to $3.15 with all responses included, as shown in Figure 2). Figure 3 also reflects a modest overall decrease in overall dollar-per-watt costs in ROS of approximately $0.07/watt.
13 The methods used to define outliers and other potential anomalies can be found in Appendix C. 14 This study uses NREL’s classification scheme for BOS costs, with the exception of interconnection costs (which NREL includes with permitting and interconnection). As shown in Figures 2 and 3, GTM Research classifies BOS costs using somewhat different categories. Further, GTM Research’s cost estimation methods are proprietary, and thus not directly comparable to NREL’s benchmark or to the results from the current study, but they represent another general option for comparison. See https://www.greentechmedia.com/research/report/us-solar-pv-price-brief-h1-2016 15 NREL Q1 2016 Benchmark Report, p. 5.
8
Figure 2. Residential Costs, by Cost Component [All Responses] ($/Watt)
Figure 3. Residential Costs, by Cost Component [Outliers Removed] ($/Watt)
Notes: These estimates remove all outliers, defined as responses falling outside of the 90-percent confidence interval for a given cost element and market segment, using unweighted responses (i.e., prior to weighting individual survey responses according to installed capacity). They also remove other potential anomalies reflecting instances where a large installer provided the lowest or highest overall cost estimate for a given element and market segment, but the response produced the weighted median result due to weighting.
Notes: Totals may not sum due to rounding. Figures separated by a vertical bar represent estimates including all responses (on the left) and with outliers removed (on the right). The results removing outliers also remove other potential anomalies, in the form of instances where a large installer provided the lowest or highest overall cost estimate for a given cost element and market segment, but their response produced the weighted median result (by virtue of it coming from a particularly large installer, which was weighted more heavily than other installers). * In NREL’s Q1 2016 model, permitting, zoning, inspection, and interconnection labor costs and fees are all included in one “permitting, inspection, interconnection” category. † Interconnection costs reflect higher uncertainty than other costs, due in part to apparent differences in installers’ accounting for other activities (this appears to affect ROS in particular, which is higher than estimates in other parts of the state). NYSERDA may want to examine and refine the definition of interconnection to clarify specific activities, and should then reallocate baseline costs to be consistent with future definitions. ** NREL’s Q1 2016 model refers to this cost element as “sales and marketing.”
3.1.1 Modeled cost elements
The study team estimated costs for certain components using a cost model developed based on NREL’s model. Specifically:
Supply chain and logistics costs. These are calculated using mark-up parameters equivalent to those used by NREL in its Q1 2016 benchmark, but adjusted according to the NREL geography-specific methodology of applying a Cost of Doing Business Index for each specific geographic
11
region, i.e., New York City, Long Island, and ROS. The mark-up is calculated as a percentage of the value of total system hardware.
Sales tax. Sales tax is not assessed on PV systems installed in the Con Ed service territory or Long Island. For ROS, the study team calculated the average tax rate for the region, weighted by the proportion of systems installed in each county.16 Sales taxes are assumed to apply to hardware only; the surveyed cost elements do not influence this cost component.
Overhead. Similar to supply chain and logistics costs, the study team calculated overhead using average per-watt amounts estimated by NREL in its Q1 2016 benchmark, adjusted using the Cost of Doing Business Index for each specific geographic region. The study team conducted interviews with nine market actors in New York State’s solar financing and installation markets to validate this approach; those interviews confirmed that this approach, and the specific numbers used, were reasonable for New York State. Consistent with NREL’s approach, our modelled overhead costs as applied to this model are based on an installer’s presumed portfolio of installations and the indirect expenditures needed to facilitate that portfolio; they are not calculated based on surveyed cost elements.
Profit. This analysis used the 17 percent profit mark-up used by NREL in its Q1 2016 benchmark, and applies this to all cost elements.17 Because the surveyed cost elements and local cost adjustments differ from NREL’s benchmark, the specific value of the New York State-specific calculation differs from NREL’s estimate, but the methods are identical.
Figures 2 and 3 reflect all of these estimates.
3.1.2 Surveyed cost elements
The subsections below briefly discuss each of the five surveyed BOS cost elements for residential systems, including geographic variation, comparison with NREL estimates, the overall distribution of survey responses received for each element, and impacts of excluding outliers and other potential anomalies. Appendix B presents additional summary statistics for each cost element in the survey, including the 25th and 75th percentile cost, and the weighted mean across all respondents and for small and large installers separately.
Customer Acquisition
Survey responses produced a weighted median customer acquisition cost of approximately $0.50/watt in the Con Ed service territory, and a similar figure of $0.48/watt in Long Island and ROS. These estimates are 20 to 25 percent higher than NREL’s Q1 2016 benchmark estimate of $0.40/watt.18
Generally, larger installers tended to report higher customer acquisition costs. The overall spread of reported costs for this element varied substantially, from $0.01/watt to $0.60/watt, potentially reflecting different business models among respondents. Most small installers reported costs between $0.25/watt and $0.40/watt, while most large installers reported costs of $0.48/watt to $0.56/watt.19
16 Per the New York State Department of Taxation and Finance, Publication 718-S, effective December 1, 2015. Specifically, there are no applicable sales taxes on residential PV solar system equipment in the Con Ed service territory or Long Island, while the weighted-average sales tax rate for ROS is approximately 1.69 percent. Note that the NREL Q1 2016 benchmark model for New York appears to apply the four percent New York statewide sales tax rate, which, by our understanding, would not be applicable to the residential solar PV system equipment considered in this report. 17 Note that for customer acquisition and overhead, again consistent with NREL, only approximately 27 percent of the total cost estimate for those components is considered as a basis for the application of a profit mark-up. 18 Three installers provided customer acquisition cost estimates outside of the specified confidence intervals for their geographic segments. However, each of these was a small installer whose installed capacity was insufficient to influence the weighted median reported in Figure 1. As a result, there is no difference in the results including and excluding outliers. 19 Throughout our discussion of results by cost element, we define “small installers” as those with less than one percent of the total installed capacity for a given market segment in 2016, while “large installers” are those who account for one percent or more of total installed capacity.
12
Permitting, Zoning, Inspection
Survey responses indicated a weighted median permitting, zoning, and inspection labor cost of $0.24/watt for the Con Ed service territory, and $0.11/watt for Long Island and ROS. These estimates are higher than NREL’s Q1 2016 benchmark of $0.10/watt, which also includes permit fees and interconnection costs (the survey analysis estimates those elements separately). Excluding permit fees, the remaining PII (permitting, inspection, and interconnection) components in the NREL benchmark are approximately $0.03/watt.20 Therefore, according to survey respondents, costs associated with permitting, zoning, and inspection activities for residential systems in New York State appear higher than the national average for these activities, particularly in the Con Ed service territory.
In the Con Ed service territory, permitting, zoning, and inspection costs not only reflect the highest–cost responses of any region, but also exhibited the highest degree of variation. Among smaller installers, costs varied from $0.06/watt to $1.20/watt; costs also varied among larger installers, though to a lesser extent, from $0.10/watt to $0.65/watt. There was less variation among the responses for Long Island and ROS, where the maximum value reported was $0.24/watt.21
Interconnection
Survey responses indicate a weighted median interconnection cost of $0.05/watt in the Con Ed service territory, $0.10/watt in Long Island, and $0.25/watt in ROS. While NREL’s model does not isolate interconnection costs, the Long Island and ROS weighted survey responses for interconnection alone are higher than NREL’s Q1 2016 benchmark of $0.10/watt for total costs for interconnection, permitting, zoning, and inspection activities and permit fees.
Responses to this survey question reveal greater variation than responses for other residential system cost elements. While some responses tended to cluster between $0.01/watt to $0.13/watt, a substantial number of small installers, and some large installers, reported higher costs, between approximately $0.20/watt and $0.66/watt. This spread was particularly prominent in ROS, where separate clusters of small installers provided responses between $0.20/watt and $0.25/watt and between $0.48/watt and $0.53/watt. In addition, while most large installers in the Con Ed service territory and Long Island reported interconnection costs of $0.10/watt or lower, two larger installers in ROS reported interconnection costs of $0.50/watt, influencing upward the weighted median for this geographic segment.22
Because identifying interconnection as a separate cost category was not consistent with NREL’s approach, and because the resulting cost estimates were significantly higher than might be expected based on NREL’s benchmark for the permitting, inspection and interconnection cost category, the study team explored interconnection in follow-up validation interviews with survey respondents, to explore the possibility that some respondents may have misunderstood the survey question and included additional costs outside of the category as defined.23 The interviews indicated that respondents had in fact understood the category correctly and provided cost estimates consistent with the definition provided.
20 The $0.03/watt parameter was calculated by using NREL’s $0.10/watt value, which NREL indicates is based on a permit fee of $400 and “six office staff hours for building permit preparation and submission, and interconnection application preparation and submission.” Since $400 divided by 5.6 kW (NREL’s benchmark system size) equals approximately $0.07/watt, the remainder, or the six office staff hours noted, must equal $0.03/watt. Compared to NREL’s estimates, the survey data received suggest that “permitting, inspection, and interconnection” costs, inclusive of permit fees, are approximately $0.34/watt in the Con Ed service territory, $0.26/watt in Long Island, and $0.43/watt in ROS. 21 We identified eight outliers impacting overall results for this cost element: two in the Con Ed service territory, one in Long Island, and five in ROS. The installed capacity of the installers providing these outlier responses was insufficient to influence the weighted median reported in Figure 1. As a result, there is no difference in the results including and excluding outliers. 22 There were four outliers for this cost element, but each of these data points was from a small installer whose installed capacity was insufficient to influence the weighted median reported in Figure 1. The exception is the combination of two such outliers in ROS, which, when both removed, slightly lower the weighted median from $0.25/watt to $0.23/watt. Note that the wide spread of reported interconnection costs through the survey created a wide confidence interval; therefore, despite certain clusters of responses, responses of approximately $0.50/watt and above were not considered outliers based on the methodology applied. 23 The definition used in the survey was as follows: “Includes all labor costs associated with preparing and submitting interconnection applications. Do not include expenses associated with fees.”
13
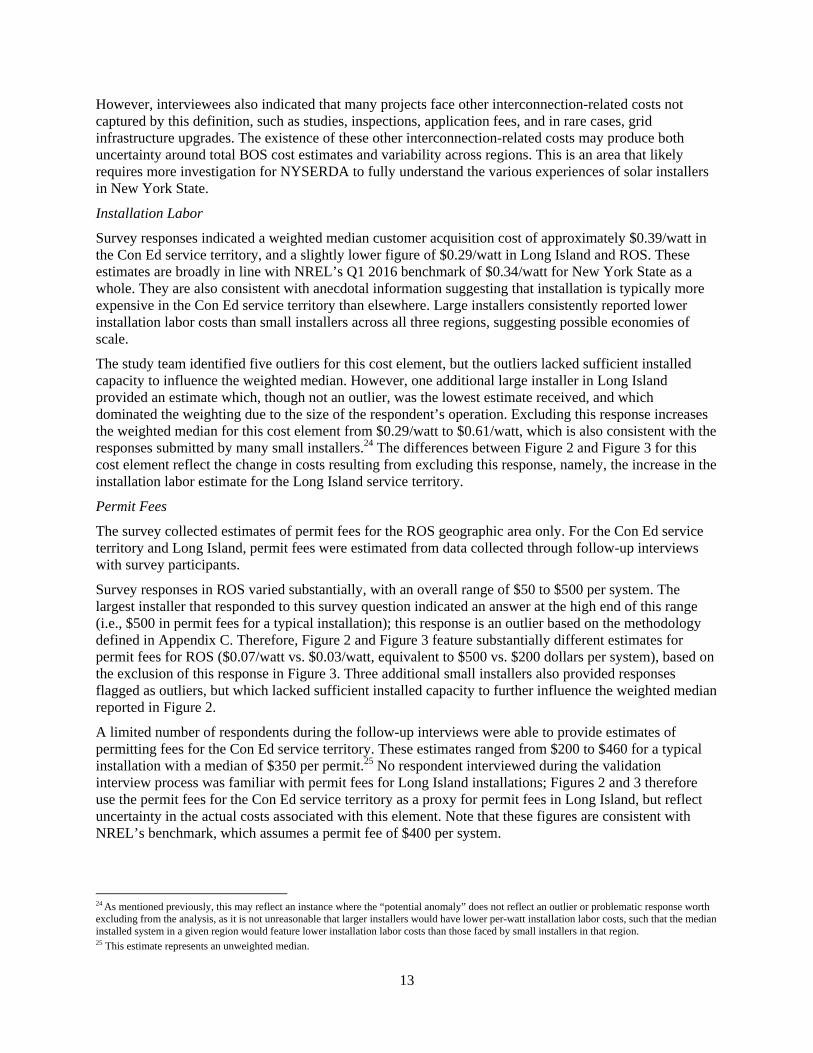
However, interviewees also indicated that many projects face other interconnection-related costs not captured by this definition, such as studies, inspections, application fees, and in rare cases, grid infrastructure upgrades. The existence of these other interconnection-related costs may produce both uncertainty around total BOS cost estimates and variability across regions. This is an area that likely requires more investigation for NYSERDA to fully understand the various experiences of solar installers in New York State.
Installation Labor
Survey responses indicated a weighted median customer acquisition cost of approximately $0.39/watt in the Con Ed service territory, and a slightly lower figure of $0.29/watt in Long Island and ROS. These estimates are broadly in line with NREL’s Q1 2016 benchmark of $0.34/watt for New York State as a whole. They are also consistent with anecdotal information suggesting that installation is typically more expensive in the Con Ed service territory than elsewhere. Large installers consistently reported lower installation labor costs than small installers across all three regions, suggesting possible economies of scale.
The study team identified five outliers for this cost element, but the outliers lacked sufficient installed capacity to influence the weighted median. However, one additional large installer in Long Island provided an estimate which, though not an outlier, was the lowest estimate received, and which dominated the weighting due to the size of the respondent’s operation. Excluding this response increases the weighted median for this cost element from $0.29/watt to $0.61/watt, which is also consistent with the responses submitted by many small installers.24 The differences between Figure 2 and Figure 3 for this cost element reflect the change in costs resulting from excluding this response, namely, the increase in the installation labor estimate for the Long Island service territory.
Permit Fees
The survey collected estimates of permit fees for the ROS geographic area only. For the Con Ed service territory and Long Island, permit fees were estimated from data collected through follow-up interviews with survey participants.
Survey responses in ROS varied substantially, with an overall range of $50 to $500 per system. The largest installer that responded to this survey question indicated an answer at the high end of this range (i.e., $500 in permit fees for a typical installation); this response is an outlier based on the methodology defined in Appendix C. Therefore, Figure 2 and Figure 3 feature substantially different estimates for permit fees for ROS ($0.07/watt vs. $0.03/watt, equivalent to $500 vs. $200 dollars per system), based on the exclusion of this response in Figure 3. Three additional small installers also provided responses flagged as outliers, but which lacked sufficient installed capacity to further influence the weighted median reported in Figure 2.
A limited number of respondents during the follow-up interviews were able to provide estimates of permitting fees for the Con Ed service territory. These estimates ranged from $200 to $460 for a typical installation with a median of $350 per permit.25 No respondent interviewed during the validation interview process was familiar with permit fees for Long Island installations; Figures 2 and 3 therefore use the permit fees for the Con Ed service territory as a proxy for permit fees in Long Island, but reflect uncertainty in the actual costs associated with this element. Note that these figures are consistent with NREL’s benchmark, which assumes a permit fee of $400 per system.
24 As mentioned previously, this may reflect an instance where the “potential anomaly” does not reflect an outlier or problematic response worth excluding from the analysis, as it is not unreasonable that larger installers would have lower per-watt installation labor costs, such that the median installed system in a given region would feature lower installation labor costs than those faced by small installers in that region. 25 This estimate represents an unweighted median.
14
3.2. Roof-mounted Commercial Costs
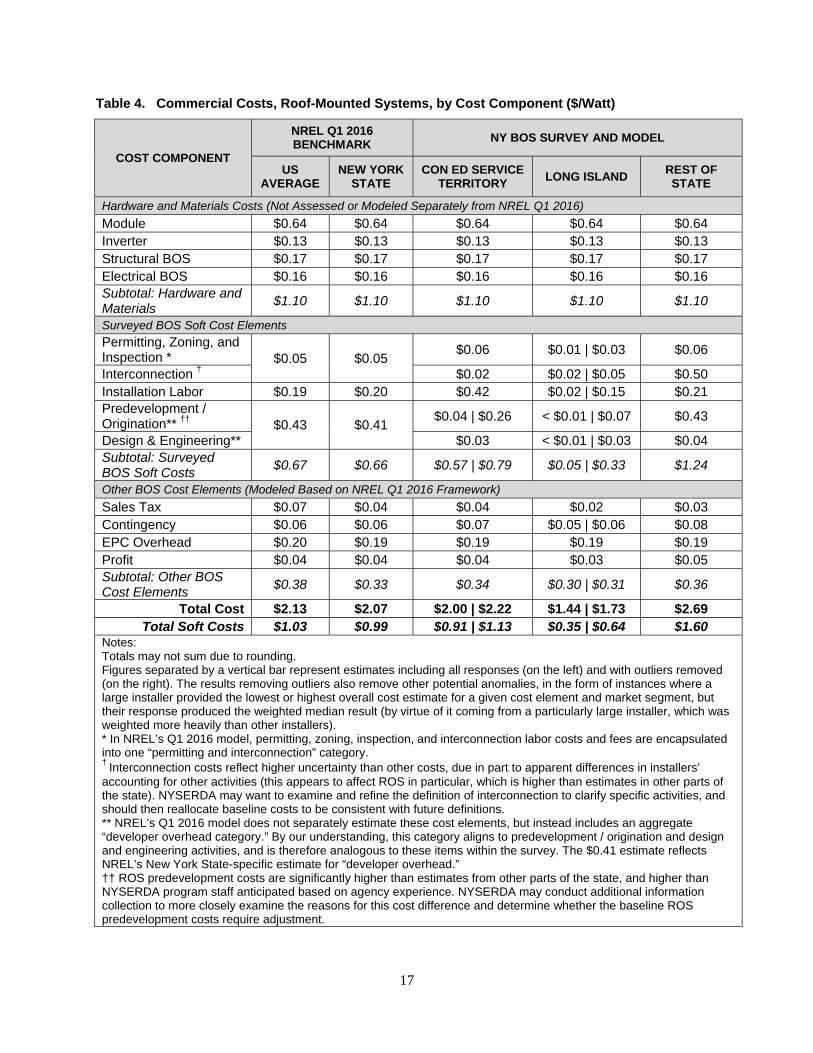
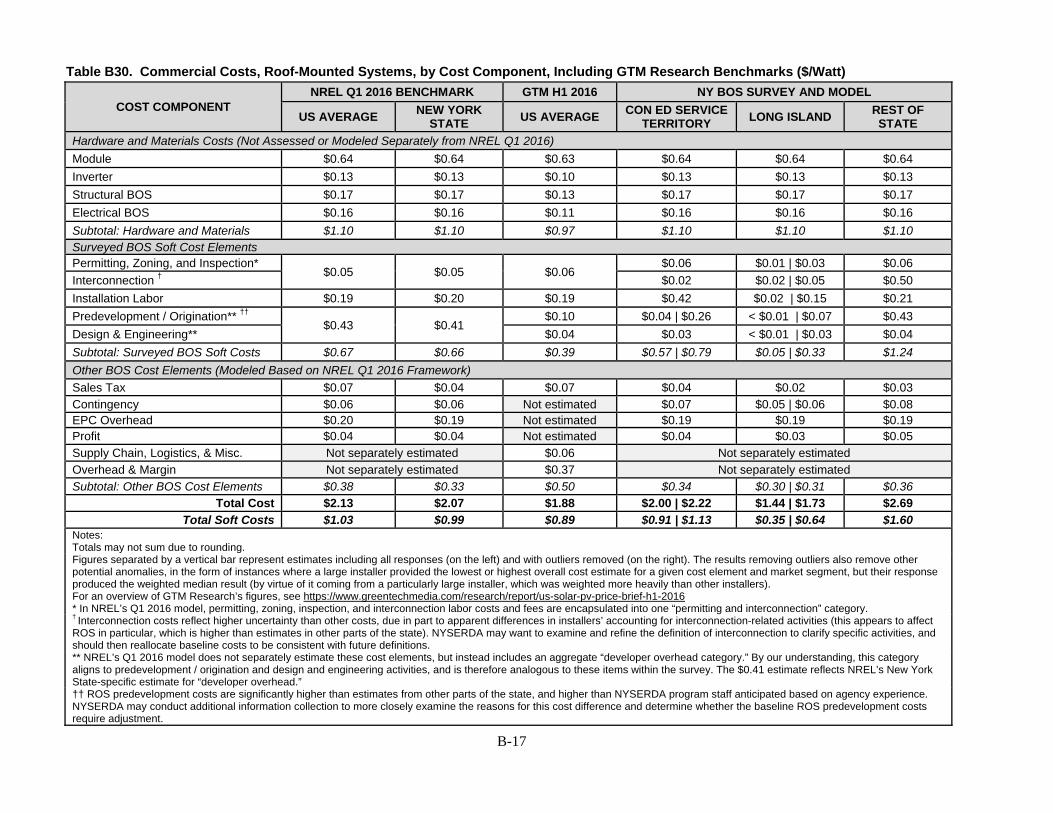
Figures 4 and 5 present estimates for roof-mounted commercial systems, again with benchmark figures from NREL and GTM Research included for context.26 Results are also summarized in Table 4. These estimates represent costs for a typical commercial system. The weighted average system size reported by survey respondents was 218 kW for the Con Ed service territory, 196 kW for Long Island, and 146 kW for the rest of the state (ROS). NREL’s estimates reflect a 200 kW system.27
NREL’s New York State-specific benchmark estimates total dollar-per-watt costs for a typical commercial-scale system of $2.07, of which $0.99 is soft costs. By comparison, the survey data show the following total dollar-per-watt costs:
Con Ed service territory: $2.00, of which $0.91 is soft costs; Long Island: $1.44, of which $0.35 is soft costs; and ROS: $2.69, of which $1.60 is soft costs.
26 This study uses NREL’s model structure and classifications, with the exception of interconnection costs (which NREL includes with permitting and interconnection). As shown in Figures 2 and 3, GTM Research classifies BOS costs differently for some categories, and cost estimation methods are proprietary, so it is not possible to adjust GTM results for full comparison with other estimates. See https://www.greentechmedia.com/research/report/us-solar-pv-price-brief-h1-2016 27 NREL Q1 2016 Benchmark Report, p. 5.
Notes: These estimates remove all outliers, defined as responses falling outside of the 90-percent confidence interval for a given cost element and market segment, using unweighted responses (i.e., prior to weighting individual survey responses according to installed capacity). They also remove other potential anomalies reflecting instances where a large installer provided the lowest or highest overall cost estimate for a given element and market segment, but the response produced the weighted median result due to weighting.
Notes: Totals may not sum due to rounding. Figures separated by a vertical bar represent estimates including all responses (on the left) and with outliers removed (on the right). The results removing outliers also remove other potential anomalies, in the form of instances where a large installer provided the lowest or highest overall cost estimate for a given cost element and market segment, but their response produced the weighted median result (by virtue of it coming from a particularly large installer, which was weighted more heavily than other installers). * In NREL’s Q1 2016 model, permitting, zoning, inspection, and interconnection labor costs and fees are encapsulated into one “permitting and interconnection” category. † Interconnection costs reflect higher uncertainty than other costs, due in part to apparent differences in installers’ accounting for other activities (this appears to affect ROS in particular, which is higher than estimates in other parts of the state). NYSERDA may want to examine and refine the definition of interconnection to clarify specific activities, and should then reallocate baseline costs to be consistent with future definitions. ** NREL’s Q1 2016 model does not separately estimate these cost elements, but instead includes an aggregate “developer overhead category.” By our understanding, this category aligns to predevelopment / origination and design and engineering activities, and is therefore analogous to these items within the survey. The $0.41 estimate reflects NREL’s New York State-specific estimate for “developer overhead.” †† ROS predevelopment costs are significantly higher than estimates from other parts of the state, and higher than NYSERDA program staff anticipated based on agency experience. NYSERDA may conduct additional information collection to more closely examine the reasons for this cost difference and determine whether the baseline ROS predevelopment costs require adjustment.
18
Estimates for commercial roof-mounted systems vary somewhat from NREL’s Q1 2016 New York State-specific estimates, in part because some of the cost category elements defined by NREL may not align perfectly with the categories and definitions used within our estimates. For example, NREL’s commercial model includes a catch-all “developer overhead” category, which likely includes both predevelopment and design and engineering activities.
The difference between region-specific cost estimates and the NREL Q1 2016 New York State-specific models varies by region. For the Con Ed service territory, installation labor is higher than NREL’s estimate ($0.42/watt vs. $0.20/watt), but predevelopment costs are only $0.04/watt, compared with an aggregate NREL New York State-specific estimate of $0.41/watt for developer overhead. Overall cost estimates for the Con Ed service territory, however, are only slightly lower than NREL’s statewide estimate.
In Long Island, results in Figure 4 are driven by one particularly large installer with low estimates for several cost categories. However, even if this response is not considered in the results (Figure 5), dollar-per-watt costs in Long Island remain lower than the statewide NREL benchmark. This is once again driven largely by predevelopment costs under $0.10/watt, compared to an aggregate NREL estimate of $0.41/watt for developer overhead.
ROS results feature higher costs for interconnection ($0.50/watt, compared to $0.02/watt in the Con Ed service territory and Long Island) and predevelopment ($0.43/watt, compared to $0.04/watt or lower in the Con Ed service territory and Long Island) than the other two regions. These predevelopment costs are roughly consistent with NREL estimates for developer overhead, but interconnection costs are higher than NREL’s aggregate “permitting and interconnection” cost category estimate of approximately $0.05/watt. Therefore, ROS results are higher than those estimated by NREL in its statewide benchmark.
Unlike results for residential systems in Figures 2 and 3, permitting and interconnection activity costs appear to be more in line with NREL’s benchmark for commercial systems. NREL estimates approximately $0.05/watt for these costs in New York State; the study model estimates aggregate costs of $0.08/watt for these activities in the Con Ed service territory and $0.03/watt in Long Island (or $0.08/watt in both of these regions if outliers and potential anomalies are removed, as in Figure 5). However, as noted previously, the high estimate of $0.50/watt for ROS interconnection creates a greater deviation of estimated costs from NREL’s benchmark in this region.
Appendix B provides additional detail on each of the surveyed cost elements.
3.2.1 Modeled cost elements
As noted above, the study estimated costs for certain components using a cost model which we developed based on NREL’s model. Specifically:
EPC (engineering, procurement, and construction) overhead. The study calculates EPC overhead using the ratio of EPC overhead to hardware costs used in NREL’s Q1 2016 benchmark model for commercial systems. The mark-up is calculated as a percentage of the value of total system hardware.
Sales tax. The study team calculated the average tax rate for each region, weighted by the proportion of systems installed in each county.28 This mark-up applies to hardware costs only; the surveyed cost elements do not influence this cost component.
Contingency. The study team calculated contingency using a flat four percent mark-up, consistent with NREL’s Q1 2016 benchmark model for commercial systems. The mark-up
28 Per the New York State Department of Taxation and Finance, Publication 718-CS, effective December 1, 2015. The weighted-average sales tax rates for the Con Ed service territory, Long Island, and ROS are 3.44 percent, 2.13 percent, and 3.02 percent, respectively. Note that the NREL Q1 2016 benchmark model for New York appears to apply the four percent New York statewide sales tax rate, which, by our understanding, would not be applicable to the commercial solar PV system equipment considered in this report.
19
applies to both hardware costs and surveyed cost elements, and thus deviates from NREL’s estimated value due to differences between surveyed cost elements across the NREL Q1 2016 benchmark model and the present analysis.
Profit. The study team used the methodology applied by NREL in its Q1 2016 benchmark, inclusive of a two percent profit mark-up applied to all cost elements. Because the surveyed cost elements and local cost adjustments differ from NREL’s benchmark, the specific value of the New York State-specific calculation differs from NREL’s estimate, but the methods are identical.
3.2.2 Surveyed cost elements
The subsections below briefly discuss each of the five surveyed BOS cost elements for roof-mounted commercial systems, including how they vary geographically and/or with NREL estimates, the overall distribution of survey responses received for each element, and the impact of including or excluding outliers from the dataset.
Predevelopment
Survey responses indicated a weighted median predevelopment cost of approximately $0.04/watt in the Con Ed service territory, $0.002/watt in Long Island, and $0.43/watt in ROS (including outliers). Respondents provided a wide range of estimates for this cost element, across regions and for both large and small installers.29 As a result, the weighted median results shown in Figure 4 for this cost element depend heavily on the responses of the largest installer in each geographic area.
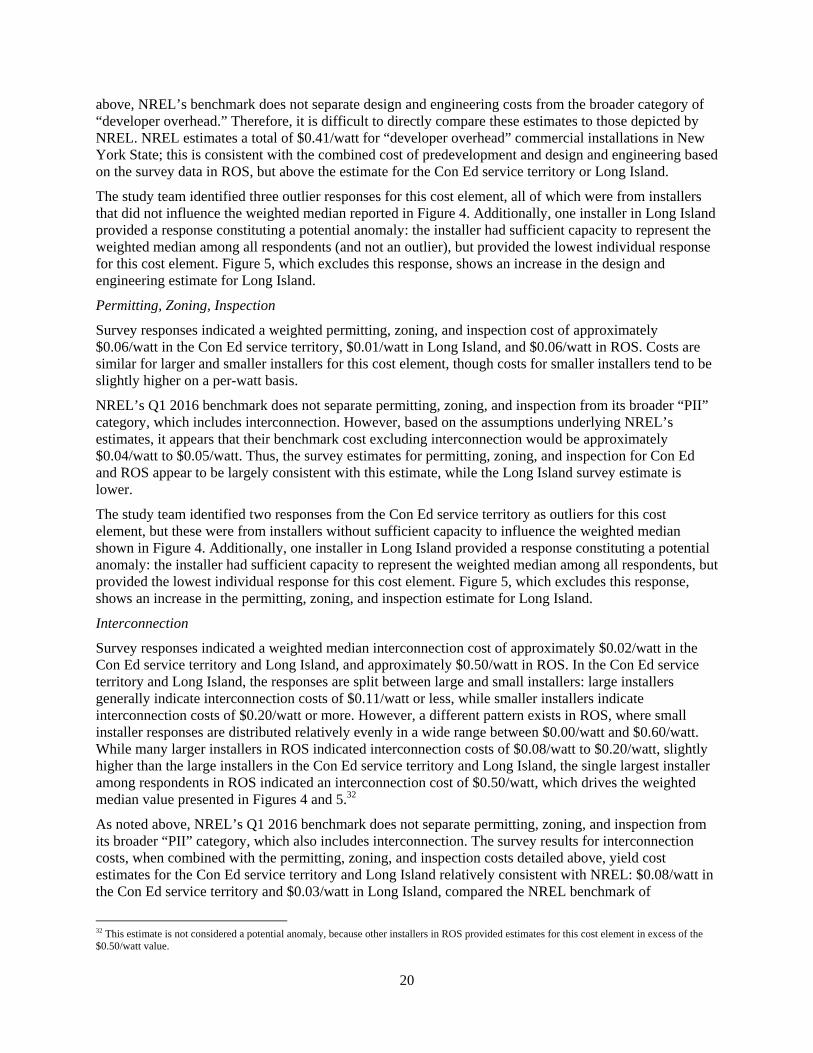
Unlike its benchmark for residential systems, NREL’s Q1 2016 commercial system benchmark does not separate predevelopment costs from the broader category of “developer overhead.” It is therefore difficult to directly compare survey estimates to NREL. However, the study team considers NREL’s developer overhead cost category to be comparable to combined predevelopment and design and engineering costs in our survey. NREL estimates this cost component at $0.41/watt for commercial installations in New York State. Survey estimates are roughly consistent with this figure in the ROS region, but below NREL’s estimates in the Con Ed service territory and Long Island.30
Based on the outlier methodology developed for this analysis (see Appendix C), the study team identified one outlier in the Con Ed service territory for this cost element, but the installer providing the response lacked sufficient capacity to alter the weighted median. One other installer in the Con Ed service territory, and one in Long Island, provided responses constituting potential anomalies, as the installers had sufficient capacity to represent the weighted median among all respondents, but provided the lowest individual responses for this cost element in their respective regions.31 The differences between Figure 4 and Figure 5 for this cost element reflect a change in costs resulting from excluding these potential anomalies, namely, an increase in the predevelopment estimates for both the Con Ed service territory and Long Island. In both of these cases, the predevelopment estimate rises closer to, but is still substantially lower than, the NREL estimate for developer overhead costs.
Design and Engineering
Survey responses produced a weighted median design and engineering cost of approximately $0.03/watt in the Con Ed service territory, $0.001/watt in Long Island, and $0.04/watt in ROS. Most responses were less than $0.08/watt, though a handful of respondents indicated costs of $0.13/watt or higher. As noted
29 In the Con Ed service territory, large installer responses ranged from $0.04/watt to $0.26/watt, while small installer responses ranged from $0.05/watt to $1.90/watt. In Long Island, large installer responses ranged from less than $0.01/watt to $0.48/watt, while small installer responses ranged from $0.39/watt to $0.50/watt. In ROS, large installer responses ranged from $0.10/watt to $0.43/watt, while small installer responses ranged from $0.02/watt to $0.53/watt. 30 The weighed median survey cost estimate for these combined cost categories is $0.07/watt for the Con Ed service territory, $0.003/watt for Long Island, and $0.47/watt for ROS. 31 Notably, two large installers in the Con Ed service territory provided an $0.04/watt estimate for predevelopment cost for roof-mounted commercial systems. Responses from other large installers in this region were $0.19/watt and above.
20
above, NREL’s benchmark does not separate design and engineering costs from the broader category of “developer overhead.” Therefore, it is difficult to directly compare these estimates to those depicted by NREL. NREL estimates a total of $0.41/watt for “developer overhead” commercial installations in New York State; this is consistent with the combined cost of predevelopment and design and engineering based on the survey data in ROS, but above the estimate for the Con Ed service territory or Long Island.
The study team identified three outlier responses for this cost element, all of which were from installers that did not influence the weighted median reported in Figure 4. Additionally, one installer in Long Island provided a response constituting a potential anomaly: the installer had sufficient capacity to represent the weighted median among all respondents (and not an outlier), but provided the lowest individual response for this cost element. Figure 5, which excludes this response, shows an increase in the design and engineering estimate for Long Island.
Permitting, Zoning, Inspection
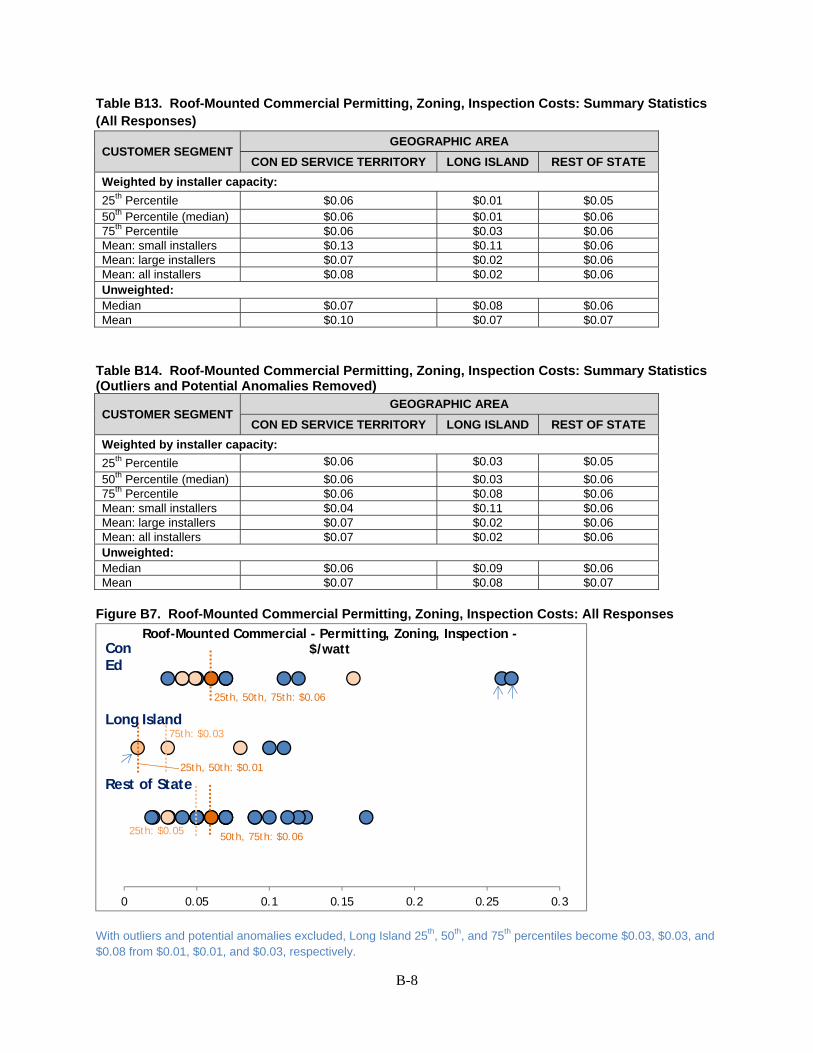
Survey responses indicated a weighted permitting, zoning, and inspection cost of approximately $0.06/watt in the Con Ed service territory, $0.01/watt in Long Island, and $0.06/watt in ROS. Costs are similar for larger and smaller installers for this cost element, though costs for smaller installers tend to be slightly higher on a per-watt basis.
NREL’s Q1 2016 benchmark does not separate permitting, zoning, and inspection from its broader “PII” category, which includes interconnection. However, based on the assumptions underlying NREL’s estimates, it appears that their benchmark cost excluding interconnection would be approximately $0.04/watt to $0.05/watt. Thus, the survey estimates for permitting, zoning, and inspection for Con Ed and ROS appear to be largely consistent with this estimate, while the Long Island survey estimate is lower.
The study team identified two responses from the Con Ed service territory as outliers for this cost element, but these were from installers without sufficient capacity to influence the weighted median shown in Figure 4. Additionally, one installer in Long Island provided a response constituting a potential anomaly: the installer had sufficient capacity to represent the weighted median among all respondents, but provided the lowest individual response for this cost element. Figure 5, which excludes this response, shows an increase in the permitting, zoning, and inspection estimate for Long Island.
Interconnection
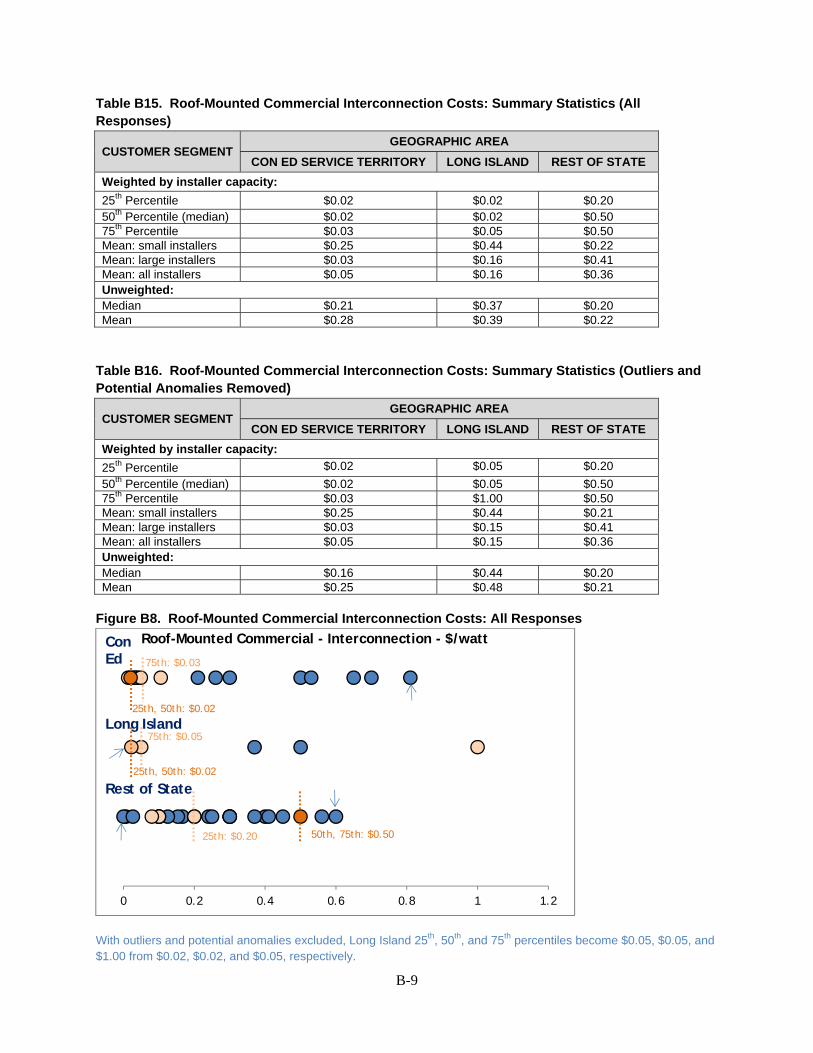
Survey responses indicated a weighted median interconnection cost of approximately $0.02/watt in the Con Ed service territory and Long Island, and approximately $0.50/watt in ROS. In the Con Ed service territory and Long Island, the responses are split between large and small installers: large installers generally indicate interconnection costs of $0.11/watt or less, while smaller installers indicate interconnection costs of $0.20/watt or more. However, a different pattern exists in ROS, where small installer responses are distributed relatively evenly in a wide range between $0.00/watt and $0.60/watt. While many larger installers in ROS indicated interconnection costs of $0.08/watt to $0.20/watt, slightly higher than the large installers in the Con Ed service territory and Long Island, the single largest installer among respondents in ROS indicated an interconnection cost of $0.50/watt, which drives the weighted median value presented in Figures 4 and 5.32
As noted above, NREL’s Q1 2016 benchmark does not separate permitting, zoning, and inspection from its broader “PII” category, which also includes interconnection. The survey results for interconnection costs, when combined with the permitting, zoning, and inspection costs detailed above, yield cost estimates for the Con Ed service territory and Long Island relatively consistent with NREL: $0.08/watt in the Con Ed service territory and $0.03/watt in Long Island, compared the NREL benchmark of
32 This estimate is not considered a potential anomaly, because other installers in ROS provided estimates for this cost element in excess of the $0.50/watt value.
21
approximately $0.05/watt for New York. However, the $0.50/watt weighted median interconnection cost for ROS is markedly higher than the NREL benchmark in that region.
Three survey responses for this cost element constituted outliers for ROS, but these responses did not affect the weighted median reported in Figure 4 for the interconnection cost element. Additionally, one installer in Long Island provided a response constituting a potential anomaly: the installer had sufficient capacity to represent the weighted median among all respondents, but provided the lowest individual response for this cost element. Figure 5, which excludes this response, shows an increase in the interconnection estimate for Long Island.33
As noted above, the study team explored interconnection in follow-up validation interviews with survey respondents, to explore the possibility that some respondents may have misunderstood the survey question and included additional costs outside of the category as defined.34 Interviews revealed that respondents had understood the category correctly and provided cost estimates consistent with the definition provided. However, many solar PV projects face other interconnection-related costs not captured by this definition, such as studies, inspections, application fees, and in rare cases, grid infrastructure upgrades. The existence of these other interconnection-related costs may produce both uncertainty around total BOS cost estimates and variability across regions. Again, NYSERDA should consider further analysis on this issue.
Installation Labor
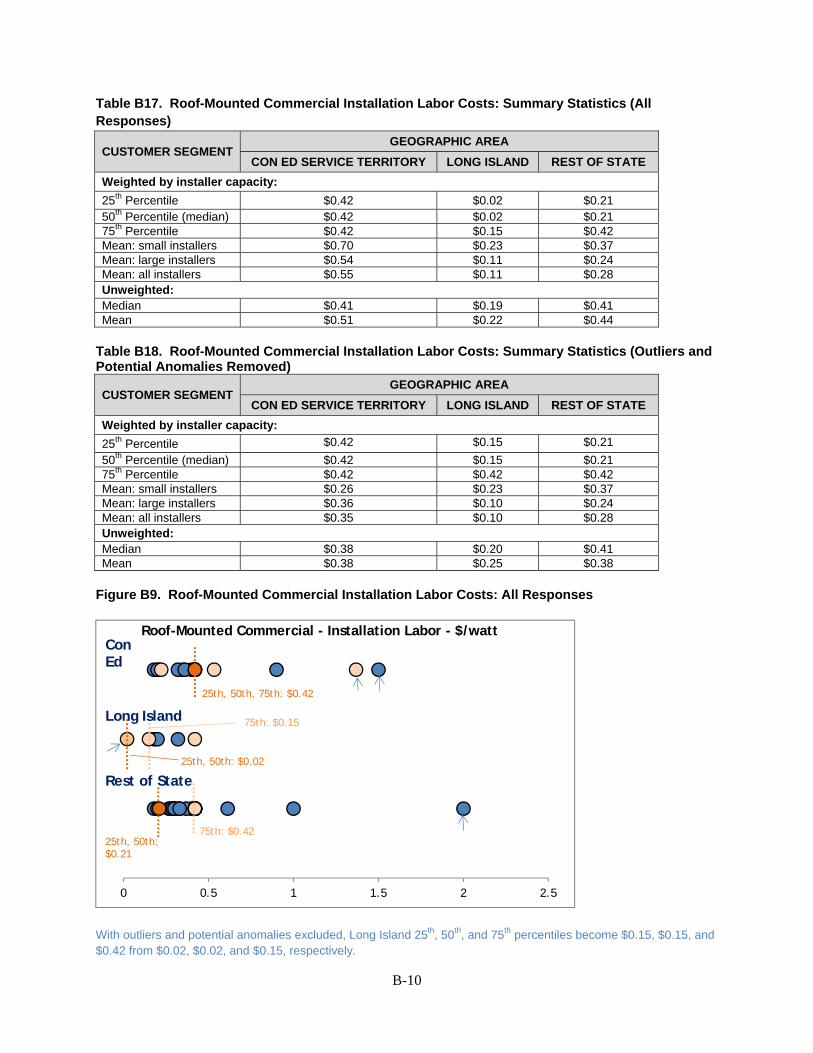
Survey responses indicate a weighted median installation labor cost of approximately $0.42/watt in the Con Ed service territory, $0.02/watt in Long Island, and approximately $0.21/watt in ROS. By comparison, NREL’s Q1 2016 benchmark for “installation labor and equipment” totals $0.20/watt for New York State. This is roughly equivalent to the $0.21/watt weighted median for ROS, but lower than the estimate for the Con Ed service territory and higher than the estimate for Long Island. Similar to the results for residential systems, many small installers reported consistently higher estimates than larger installers, especially in Long Island and ROS.
In the Con Ed service territory, many respondents reported installation labor costs of between $0.32/watt and $0.42/watt, though a number of other respondents also provided responses outside of this range. In Long Island, responses were spread out between the $0.02/watt and $0.42/watt range, with larger installers tending to be on the lower end of the spectrum. In ROS, responses clustered heavily in the $0.18/watt to $0.42/watt range.
The study team identified two outliers in the Con Ed service territory and one in ROS, but these installers had insufficient capacity to influence the weighted medians in Figure 4. Additionally, one installer in Long Island provided a response constituting a potential anomaly: the installer had sufficient capacity to represent the weighted median among all respondents, but provided the lowest individual response for this cost element. Figure 5, which excludes this response, shows a substantial increase in the installation labor estimate for Long Island, from $0.02/watt to $0.15/watt (which is much closer to the NREL benchmark figure).
3.3. Ground-mounted Commercial Costs
The survey questions also targeted cost information on ground-mounted commercial systems in circumstances where respondents indicated that these systems accounted for more than half of their
33 Within ROS, if the response of $0.50/watt for interconnection costs attributed to the largest installer providing a response for this cost element is removed, the weighted median shifts to $0.10/watt. This is closer to NREL’s benchmark for the “PII” cost category ($0.06 for ROS permitting, zoning, and inspection costs plus $0.10 for ROS interconnection costs equals $0.16, compared to NREL’s New York State-specific benchmark of $0.05/watt for commercial systems) than the estimates in Figures 3 and 4, but still substantially higher than this benchmark and the estimates for interconnection provided by respondents in the Con Ed service territory and Long Island. 34 As with residential systems, the definition used in the survey was as follows: “Includes all labor costs associated with preparing and submitting interconnection applications. Do not include expenses associated with fees.”
22
capacity installed in 2016. However, few respondents provided estimates ground-mounted commercial systems, preventing any reliable statistical analysis of this market segment. Instead of including ground mount commercial systems in the total estimates, therefore, this report summarizes the responses in Appendix B.
3.4. Impact of Financing and Overhead Structure on BOS Costs
The study team’s validation of NREL’s cost model included interviews with several financiers and solar installers participating in the New York State PV solar market. The majority of these interviewees were most familiar with their own financing structures and business protocols, and were unable to provide generalizable information across all financing, overhead, and profit structures currently in use. Detailed validation questions during these interviews discussed the structure underpinning the NREL cost model. Interviewees generally agreed with the broad tenets of this model as they pertain to overhead and financing costs. Further, interviewees provided information about differences between New York State and other states with regard to overhead, profit, or financing structures that could have material impacts on the use of a generalized, national model (i.e., the NREL model). Interviewees generally indicated that New York State does not differ along these lines from other states in which they do business, and therefore no modeling adjustments would be warranted or justified on these grounds.
A number of solar installers interviewed did suggest that overhead costs and profit margins for residential systems may be higher than modeled by NREL, and therefore, higher than shown in the present analysis. However, these installers also indicated that overhead costs vary substantially by installer type. For example, some smaller installers may have lower overhead costs than larger installers who pre-purchase and warehouse modules and other equipment due to the demands of a higher-volume business. They further indicated that profit benchmarks and targets can vary substantially by project, and that many installers target overall profit margins rather than project-specific outcomes. Therefore, the study team expects that uncertainty associated with the overhead and profit components of BOS costs as shown in Figures 2 through 5 may be skewed such that these costs are more likely to be underestimated than overestimated, but the study team does not have a reliable basis for adjusting these numbers.
3.5. Other Findings
The survey questions targeted data on a number of other issues that could directly or indirectly affect project cost and viabilities. These include permit wait times, O&M costs, liability insurance costs, costs of conducting SEQR studies and other studies required for solar installations, shared solar installation costs, and opportunities for cost reduction. The report discusses each of these below.
3.5.1 Permit Wait Times
Table 5 presents survey respondents’ average number of “lost” days spent waiting for permits to be approved (i.e., delays that prevented them from performing work at the site). For residential systems, wait times were longest in Long Island (weighted median of 30 days) and shorter in the Con Ed service territory and ROS (weighted medians of 10 and 14 days, respectively). Most respondents indicated that New York State wait times are long than wait times in other states. For roof-mounted commercial, the weighted median wait time was 90 days for the Con Ed service territory and Long Island, and 60 days for ROS, compared to an (unweighted) median of 15 days outside of New York State. All respondents with commercial system installations in the Con Ed service territory reported that those wait times were longer than wait times outside of New York State.
23
Table 5. Permit Wait Times
CUSTOMER SEGMENT
GEOGRAPHIC AREA
CON ED LONG
ISLAND REST OF STATE
OUTSIDE NEW YORK
STATE Residential:
Average wait time 10 days 30 days 14 days 12 days % saying permit approval is slower than outside of New York State
78% 60% 64% N/A
Roof-mounted Commercial: Average wait time 90 days 90 days 60 days 15 days % saying permit approval is slower than outside of New York State
100% No data 40% N/A
Notes: New York State results for average wait time are medians, weighted by installed capacity. Because the survey did not gather information on respondents’ installed capacity outside of New York, we were unable to weight responses for outside New York State; as a result, those results are unweighted medians.
3.5.2 Operations and Maintenance
On projects where installers continue to own the PV system after installation, installers incur operations and maintenance (O&M) costs for the life of the system. Table 6 summarizes survey responses regarding these costs. Few respondents provided information on O&M.35 However, the information provided is broadly in line with NREL’s nationwide benchmark figures, which range from less than $0.01 to $0.04 per watt-year.36 Note that because these costs are incurred over time and not at the beginning of the project, they are not included in the system cost estimates shown in Figures 2 through 5 above.
The survey collected qualitative information regarding the cost of liability insurance in New York State compared to insurance in other states. Seventy-eight percent of respondents providing answers indicated that liability costs are higher in New York State, and 22 percent said that costs were about the same. No one reported having lower liability insurance costs in New York State than in other states. Only three respondents provided a quantitative estimate of the cost difference; the average was that New York State liability insurance costs are 18.33 percent higher than other states, but this result is only illustrative, given the small number of responses. Anecdotally, some follow-up interviews conducted with solar installers also noted that insurance requirements in New York State, including liability insurance requirements, posed a particular challenge to PV solar installers and developers by driving up system costs.
35 Survey respondent data suggest that approximately half of installed residential systems use lease or PPA financing structures, while half use installer-provided or third-party financing that may reflect a homeowner/customer-owned structure. However, interviews conducted with multiple solar installers active in the New York residential market indicated that these installers believe that due to the structure of New York’s solar incentives, homeowner/customer-owned solar systems are a more valuable long-term proposition and are therefore growing in popularity with consumers at the expense of PPA and lease structures. For commercial systems, survey respondent data suggest that over 57 percent of commercial systems use installer-provided or third-party financing, while 43 percent use leases or PPAs. 36 National Renewable Energy Laboratory (NREL). “Distributed Generation Renewable Energy Estimate of Costs.” Updated February 16, 2016. http://www.nrel.gov/analysis/tech_lcoe_re_cost_est.html.
24
3.5.4 State Environmental Quality Review and Other Studies
For some commercial projects, installers must complete State Environmental Quality Review (SEQR) studies and/or other studies before receiving project approval. Table 7 reports the frequency with which installers indicated that such studies were required, and their cost estimates for completing such studies. Few respondents provided cost estimates, but among those that did, the cost of SEQR appears to be modest compared to overall project costs. Note that because these costs were not incurred for all projects, the cost estimates shown cannot be considered an average cost imposed on all PV systems installed.
Table 7. SEQR and Other Studies
STUDY TYPE
INSTALLED SYSTEMS FOR WHICH STUDIES WERE REQUIRED? COST ESTIMATES
Notes: Respondents that had installed systems requiring other studies also estimated the proportion of systems for which these studies were required. Responses were 1%; 5%; 5%; 10%; 15%; and 100%, for an average of 22.7%.
3.5.5 Shared Solar Projects
Shared solar systems are those where the energy and/or financial benefits from a solar electric system are shared across multiple community members. According to NYSERDA, no shared solar projects were completed in New York State during 2016. As a result, the 2016 baseline does not include costs for these projects. However, the survey asked respondents about their qualitative expectations of the costs of shared solar projects. Fifty-five percent of survey respondents stated that they had considered installing shared solar systems in New York State; these respondents differed on whether they estimated that costs for shared solar projects would be higher or lower than costs for non-shared installations. Table 8 reports those respondents’ expectations regarding shared solar costs.
Table 8. Shared Solar Anticipated Cost Characteristics
COST COMPONENT
% OF RESPONDENTS ANTICIPATING: SUBSTANTIALLY HIGHER COST OR OTHER BARRIERS VS. NON-SHARED
SYSTEMS
SUBSTANTIALLY LOWER COST VS.
NON-SHARED SYSTEMS
Customer acquisition
49.2% 18.0%
Design and engineering
29.5% 27.9%
Permitting, zoning, and inspection
45.9% 24.8%
Interconnection 49.2% 9.8% Installation labor 9.8% 32.8% Development time 78.7% N/A Other barriers 55.7% N/A Notes: 1. These survey questions were asked of respondents who indicated that they had considered installing shared solar PV systems in New York State. 2. Other barriers that respondents anticipated shared solar projects would face included challenges with remote net metering, uncertainty on the billing process, non-standardized approval process, regulatory uncertainty, and aggregation of interested customers.
25
3.5.6 Cost Reduction Opportunities
The survey solicited open-ended feedback from solar installers on where they saw the greatest opportunity to reduce BOS costs. Among the responses provided, perhaps the strongest theme that emerged in an area that NYSERDA is positioned to address was the need to streamline, expedite, and simplify permitting across the state. Several respondents also identified insurance and worker’s compensation costs in New York City, as well as taxes, as cost reduction opportunities. Finally, many respondents indicated that hardware and materials costs were the greatest opportunity for cost reduction, even though the question had specified BOS costs.
26
Section 4. Conclusions and Recommendations
This report presents a set of baseline estimates for BOS soft costs for solar PV systems installed in New York State in 2016. Our primary results, showing modeled estimates and, for cost estimates derived from survey responses, weighted median costs for each cost component, are shown in Figures 2, 3, 4, and 5 and Tables 3 and 4 above. These figures represent a baseline against which future estimates can be measured, in order to assess the degree to which NY-Sun and other NYSERDA programs are successful in reducing costs over time (to the extent that any future cost reductions can be attributed to NYSERDA programs).
4.1. Potential Priorities for Cost Reduction
Based on the research conducted for this report, the following BOS cost categories may represent potential priorities for NYSERDA in focusing cost-reduction efforts:
1. Permitting costs, especially in the Con Ed service territory for residential systems. Costs associated with permitting, zoning, and inspection for residential systems in the Con Ed service territory appear to be higher than similar costs in Long Island or ROS; Con Ed service territory costs for this element also exceeded NREL’s national average. Further, permitting costs represent a common theme in open-ended survey responses regarding avenues for reducing BOS costs in the future, and surfaced extemporaneously during interviews with solar installers. More than 20 respondents and interviewees mentioned standardized permitting and inspection protocols across the state as a possible strategy for reducing costs.
2. Installation labor costs in the Con Ed service territory. Installation labor costs appear to be systematically higher in the Con Ed service territory compared to costs in Long Island and ROS. While baseline costs do not provide a further breakout of what is included in this cost category, responses to qualitative survey questions suggest that insurance, worker’s compensation, and scaffolding law requirements unique to the New York City area may be contributing factors.
3. Customer acquisition and predevelopment costs, especially in ROS. Residential customer acquisition appears to be more costly in New York State than the nationwide average. This trend appears to be driven by large installers. A similar pattern is notable in for commercial systems in ROS specifically, where many large and small installers indicated relatively high predevelopment costs, especially relative to installers in the Con Ed service territory or on Long Island.
4.2. Recommendations for Replication and Future Study
The methodology used in this study has been designed to be replicated easily as part of a longitudinal effort. Validation steps included questions about both the content and structure of the survey. Further, the results suggest that NYSERDA can use the same methodology in future iterations, with a limited number of changes to improve survey implementation:
1. Replace pop-up definitions with permanent on-page definitions. While the web interface for the survey included definitions for each cost component in pop-up boxes, information collected during follow-up interviews suggests that cost category definitions should be more prominent. At least one respondent was not aware of the pop-up definitions, though they did correctly interpret the questions.
2. Combine interconnection costs with permitting and inspection. Follow-up interviews indicated that some respondents may have had difficulty separately estimating interconnection costs. While this issue does not appear to be widespread, separating interconnection costs from permitting and inspection costs is not consistent with industry norms, and may increase uncertainty. However, NYSERDA should also consider more in-depth analysis on
27
interconnection costs that may not be included in the cost category as defined (by the current survey or by NREL). In particular, certain costs may be incurred occasionally, but not for a ‘typical’ PV project; characterizing these cost elements would provide a more thorough understanding of overall solar BOS costs.
3. Collect permitting fee survey data for all regions. The survey gathered information on permitting fees in ROS, but not in the Con Ed service territory or Long Island. In the future, the study team recommends including survey questions on permitting fees for all regions of the state.
4. Consider expanded collection of survey cost data on ground-mounted systems. To reduce survey length, skip logic allowed respondents to provide information on either roof-mounted or ground-mounted systems, but not both. This resulted in a small number of responses for ground-mounted systems. If NYSERDA is interested in developing a more robust estimate of ground-mounted BOS costs, it should revisit the survey design or conduct additional, separate data collection. However, if estimating the costs of ground-mounted systems continues to be a relatively lower priority, no change is needed.
The study team has presented results including all responses, and (separately) removing outliers and other potential anomalies. The validation process did not reveal any broad pattern in outlier responses that would lead to a recommendation to uniformly include or exclude outliers and anomalies; both sets of responses are therefore included for NYSERDA’s use in developing a baseline. Absent any new information, it is recommended that both numbers be used as potential baseline estimates in developing longitudinal analysis and repeating implementation of the survey. As program implementation continues, NYSERDA may identify additional information about costs and reporting that may strengthen the confidence in a specific result where two are reported. In this case, NYSERDA should carefully document this information as it becomes available, and revise both baseline estimates and replication approaches as appropriate to incorporate the new information.
Finally, the study team also recommends that when comparing future BOS cost estimates to the values shown here, researchers look not only at how the overall totals compare, but also how values change over time for specific solar installers; this approach will allow for a more nuanced understanding of any changes seen.37
37 Note that his approach would require future researchers to have access to non-anonymized survey data from the current dataset, as well as from any future surveys. To preserve confidentiality, however, the study team did not provide non-anonymized survey data to NYSERDA.
A-1
Appendix A. Survey Instrument
Welcome to the NYSERDA Solar Balance-of-System Cost Survey!
You have been selected to participate in this important research effort designed to collect information about solar balance-of-system (BOS) soft costs in New York State. This survey will help NYSERDA to understand the solar PV market in New York State and the different costs associated with solar PV installations.
This survey takes approximately 15 minutes to complete. The survey will ask about your average costs for solar installation projects. If you are not familiar with this information, please provide the survey e-mail and link to the appropriate person in your organization who can provide information about your average project costs. The information you provide will be kept confidential to the extent permitted by law. All responses will be reported in aggregate and will not be attributed to you as an individual.
Please click “Start” to begin the survey.
Screening Questions [ASK ALL]
1. Has your company installed PV systems in New York State in 2016?
1. Yes 2. No 97. Don’t know
[If no: “Based on your response, you are not eligible for this survey. Thank you for your time and willingness to participate!” then Terminate.]
[If don’t know: “This survey is focused on your organization's solar installation system costs in New York State in 2016. If you are not familiar with this and know someone else in your organization who is knowledgeable about your recent work in New York State, please forward your survey invitation e-mail to that individual and click the “next” button to return to the beginning of the survey.” then Terminate.]
2. Are you familiar with your company’s work to install PV systems in New York State during the past year?
1. Yes 2. No
[If no: “This survey is focused on your organization's solar installation system costs in New York State in 2016. If you are not familiar with this and know someone else in your organization who is knowledgeable about your recent work in New York State, please forward your survey invitation e-mail to that individual and click the “next” button to return to the beginning of the survey.” then Terminate.]
A-2
2b. Are you able to provide approximate estimates of your company’s average costs for typical PV system installation projects in New York State?
1. Yes 2. No
[If no: “This survey is focused on your organization's solar installation system costs in New York State in 2016. If you are not familiar with this and know someone else in your organization who is knowledgeable about your recent work in New York State, please forward your survey invitation e-mail to that individual and click the “next” button to return to the beginning of the survey.” then Terminate.]
Introductory Material [ASK ALL]
3. What is your company’s name?
4. For validation purposes only, please provide the following information. This information is voluntary and will not be shared with NYSERDA staff.
a. Your name b. Your job title or position c. Your email address d. The city where your office or primary work is located
5. Approximately how many total employees does your company have?
6. Approximately how many employees does your company have in New York State? [PROGRAMMER: set range from 0 to 10,000]
7. Which of the following types of PV systems did your company install in New York State in 2016? Check all that apply.
a. Residential b. Commercial – roof-mounted c. Commercial – ground-mounted
[PROGRAMMER: ASSIGN ROOF=1 IF Q7B SELECTED; ASSIGN GROUND=1 if Q7C SELECTED]
8. [ASK IF ROOF=1 & GROUND=1] Did your company install more roof-mounted or ground-mounted commercial PV systems in New York State in 2016?
1. Roof-mounted 2. Ground-mounted
9. Which metric do you prefer to use for costs such as design and installation labor? Please
choose one.
1. Dollars per Watt ($/Watt)
A-3
2. Total dollar cost 3. Total labor hours
Residential: Overview [ASK SECTION IF Q7=A]
[TRANSITION TEXT: “For the next several questions, please think about your company’s work on residential PV systems only.”]
10. Please indicate the number of residential PV systems installed by your company in New York from January to June 2016 that fall into each of the following categories. Your best estimate is fine.
How many installations were…
a. Leased b. Power Purchase Agreement (PPA) arrangements c. Purchased, with financing arranged by your company d. Purchased, with third-party financing e. Purchased, with other or unknown financing structure
[PROGRAMMER: include a button for “Don’t know” for each option; set range from 0 to 50,000)]
11. In which regions did your company install residential PV systems in 2016? Check all that apply.
a. The Con Ed service territory (New York City and Westchester County) b. Long Island (Nassau and Suffolk Counties) c. The rest of New York State (excluding Long Island, New York City, and
Westchester County) d. Areas outside of New York State
[IF ONLY Q11D SELECTED, SKIP TO COMMERCIAL OVERVIEW SECTION (TEXT BEFORE Q20]
12. [ASK IF Q11A, B, OR C SELECTED] What was the typical kW size of a residential PV system installed by your company in 2016? Your best estimate for the average system you installed is fine.
[PROGRAMMER: Include boxes for separate responses for each NY region selected in question 11 (A, B, C only). For each region, include a button for “Don’t know.”]
[PROGRAMMER: Include error message if answer is < 1 kW or > 25 kW].
Residential: Upfront Costs [ASK SECTION IF Q7=A]
13. NYSERDA is interested in learning about your typical costs for different project activities. Thinking about the residential solar PV systems your company installed in 2016, please estimate your company’s costs for a typical project for each of the
A-4
categories shown below. For each category, click the triangle to move and select the appropriate point on each bar. [IF MORE THAN ONE REGION PICKED IN Q11: “Please provide your best estimate for each region in New York State you indicated working in.”]
[PROGRAMMER: Include separate slider bar sets for each region in New York State selected in Question 11: The Con Ed Service Territory (Q11 = A), Long Island (Q11 = B) and the Rest of New York State (Q11 = C). DO NOT include slider bar sets for Areas outside of New York State (Q11 = D).]
If you need more information on each category, click on the name of each category for more information. National average values are shown for some of these categories to assist you.
[For dollars per Watt ($/Watt), values are:
Component
Benchmark Cost ($/W)
[Start]
Min Cost
[Left]
Max Cost
[Right] Customer acquisition $0.38 $0.00 $0.76 Permitting, zoning, and inspection:
LI, ROS $0.12 $0.00 $0.24 Con Ed $0.00 $0.00 $1.20
14. Overall, how confident are you of the estimates you provided for your company’s typical residential PV costs?
1. Very confident 2. Somewhat confident 3. Not at all confident
15. For residential installation labor, including all contract labor, what was your company’s
percentage split between electrician labor hours vs. non-electrician labor hours for a typical residential system installed in New York in 2016?
[PROGRAMMER: Insert a sliding bar for each NY region selected in question 11a-c. Also insert a button for “I can’t answer this question” for each region.]
Residential: Other Costs [ASK SECTION IF Q7=A]
16. [ASK IF Q10A > 0 OR 10B > 0 & Q11=C] What percentage of your residential PV projects in the last 12 months have been in jurisdictions that have “opted out” of the Solar Real Property Tax Exemption? [PROGRAMMER: set range from 0% to 100%]
1. Provide Answer 96. Do Not Wish to Provide 97. Don’t Know
17. [ASK ONLY IF Q11=C] Excluding the Con Ed service territory (New York City and
Westchester County) and Long Island (Nassau and Suffolk Counties), what was the average permitting fee for a typical residential PV system in the rest of New York State in 2016? Your best approximation is fine. Include the cost for all permits. Include the fee only; do not include any labor costs associated with completing the permit application or any other permit-related activities. [PROGRAMMER: Indicate metric as dollars.]
Component
Benchmark Cost ($) [Start]
Min Cost
[Left]
Max Cost
[Right] Permitting Fees $250 $0 $500
18. [ASK IF Q10=B] Nationwide average operating and maintenance (O&M) costs for a typical residential system are $0.02 - $0.04 per Watt per year. What was your company’s average annual O&M cost for a typical residential system in 2016? Your best estimate is fine. If you do not have information available for 2016, an estimate based on 2015 is fine. [PROGRAMMER: Indicate metric as dollars per watt per year)
Component
Benchmark Cost ($/Watt-
year) [Start]
Min Cost
[Left]
Max Cost
[Right] Residential O&M Costs $0.03 $0 $0.06
A-6
19. For a typical residential PV system installed in 2016, how many business days on average did you spend waiting for permit applications to be approved that prevented you from undertaking additional work at the site? Please include all of the different permits that are typically required for a project.
[PROGRAMMER: include separate answer boxes for each region in which they installed systems, both inside and outside of NY (Q11a-Q11d); set maximum at 1,000; Include “Don’t Know”]
Commercial: Overview [ASK SECTION IF Q7=B OR C]
[TRANSITION TEXT: “For the next several questions, please think about your company’s work on commercial PV systems only.”]
20. Please indicate the number of commercial PV systems installed by your company in New York from January to June 2016 that fall into each of the following categories. Your best estimate is fine. [PROGRAMMER: set range from 0 to 50,000)] How many installations were…
a. Leased b. Power Purchase Agreement (PPA) arrangements c. Purchased, with financing arranged by your company d. Purchased, with third-party financing e. Purchased, with other or unknown financing structure
[PROGRAMMER: include a button for “Don’t know” for each option]
21. In which regions did your company install commercial PV systems in 2016? Check all that apply.
a. The Con Ed service territory (New York City and Westchester County) b. Long Island (Nassau and Suffolk Counties) c. The rest of New York State (excluding Long Island, New York City, and
Westchester County) d. Areas outside of New York State
[IF ONLY Q21D SELECTED, SKIP TO COMMERCIAL OVERVIEW SECTION (TEXT BEFORE Q50]
22. [ASK IF Q7=B] What was the typical kW size of a roof-mounted commercial PV system installed by your company in 2016? Your best estimate for the average system you installed is fine.
[PROGRAMMER: Include boxes for separate responses for each NY region selected in question 11 (A, B, C only). For each region, include a button for “Don’t know.”]
A-7
[PROGRAMMER: Include error message if answer is < 1 kW or > 300 kW. Include a button for “Don’t know.”]
23. [ASK IF Q7=C] What was the typical kW size of a ground-mounted commercial PV system installed by your company in 2016? Your best estimate for the average system you installed is fine.
[PROGRAMMER: Include boxes for separate responses for each NY region selected in question 11 (A, B, C only). For each region, include a button for “Don’t know.”]
[PROGRAMMER: Include error message if answer is < 1 kW or > 300 kW. Include a button for “Don’t know.”]
24. How many commercial PV systems installed by your company in 2016 were…[PROGRAMMER: set range from 0 to 50,000)]
a. Roof mounted systems b. Ground mounted systems
Roof-Mounted Commercial: Upfront Costs [ASK SECTION IF Q8=1 OR ROOF=1 & GROUND=0]
25. NYSERDA is interested in learning about your typical costs for different project activities. Thinking about the roof-mounted commercial solar PV systems your company installed in 2016, please estimate your company’s costs for a typical project for each of the categories shown below. For each category, click the triangle to move and select the appropriate point on each bar. [IF MORE THAN ONE REGION PICKED IN Q21: “Please provide your best estimate for each region in New York State you indicated working in.”]
[PROGRAMMER: Include separate slider bar sets for each region in New York State selected in Question 20: The Con Ed Service Territory (Q21 = A), Long Island (Q21 = B) and the Rest of New York State (Q21 = C). DO NOT include slider bar sets for Areas outside of New York State (Q21 = D).]
If you need more information on each category, click on the name of each category for more information. National average values are shown for some of these categories to assist you.
[For dollars per Watt ($/Watt), values are:
Component
Benchmark Cost ($/W)
[Start] Min
[Left] Max
[Right] Pre-Development $0.43 $0.00 $0.86 Design and Engineering $0.04 $0.00 $0.08 Permitting, zoning, and inspection $0.06 $0.00 $0.12
26. Overall, how confident are you of the estimates you provided for your company’s typical roof-mounted commercial PV costs?
1. Very confident 2. Somewhat confident 3. Not at all confident
27. For roof-mounted commercial installation labor, including all contract labor, what was
your company’s percentage split between electrician labor hours vs. non-electrician labor hours for a typical commercial system installed in New York in 2016?
[PROGRAMMER: Insert a sliding bar for each NY region selected in question 21a-c. Also insert a button for “I can’t answer this question” for each region.]
Roof-Mounted Commercial: Other Costs [ASK SECTION IF Q8=1 OR ROOF=1 & GROUND=0]
28. [ASK IF Q20=A OR B & Q21=C] What percentage of your roof-mounted commercial PV projects in the last 12 months have been in jurisdictions that have “opted out” of the Solar Real Property Tax Exemption? [PROGRAMMER: set range from 0% to 100%]
1. Provide Answer 96. Do Not Wish to Provide 97. Don’t Know
A-9
29. [ASK IF Q20=B] Nationwide average operating and maintenance (O&M) costs for a
typical commercial system are <$0.01 - $0.04 per Watt per year. What was your company’s average annual O&M cost for a typical roof-mounted commercial system installed in 2016? Your best estimate is fine. If you do not have information available for 2016, an estimate based on 2015 is fine. [PROGRAMMER: Indicate metric as dollars per watt per year)
Component
Benchmark Cost ($/Watt-
year) [Start]
Min Cost
[Left]
Max Cost
[Right] Commercial O&M Costs $0.025 $0 $0.05
30. For a typical roof-mounted commercial PV system installed in 2016, how many days on average did you spend waiting for permit applications (including variances) to be approved that prevented you from undertaking additional work at the site? Please include all of the different permits that are typically required for a project.
[PROGRAMMER: include separate answer boxes for each region in which they installed systems, both inside and outside of NY (Q21a-Q21d); set maximum at 1,000; Include “Don’t Know”]
31. Did your company install any roof-mounted commercial PV systems in 2016 for which a
State Environmental Quality Review (SEQR) study was required? (In New York, SEQR studies are required for any system larger than 4,000 sq. ft., or approximately 50 kW).
1. Yes 2. No 97. Don’t Know
32. [ASK IF Q31=1] What was the approximate average cost for SEQR studies for roof-
mounted commercial PV systems installed by your company in 2016? [PROGRAMMER: set range from 0 to 100,000]
1. Provide Answer 96. Do Not Wish to Provide 97. Don’t Know
33. Did your company install any roof-mounted commercial PV systems in 2016 for which
other studies were required, beyond the SEQR study?
1. Yes 2. No 97. Don’t Know
A-10
34. [ASK IF Q33=1] Approximately what percentage of the roof-mounted commercial PV systems installed by your company in 2016 required other studies, beyond the SEQR study? [Set range from 1 to 100%].
35. [ASK IF Q33=1] For roof-mounted commercial PV systems installed in 2016, what was the average total cost per system for all of these studies combined (excluding the SEQR study)? Your best estimate is fine. [PROGRAMMER: set range from 0 to 500,000]
1. Provide Answer 96. Do Not Wish to Provide 97. Don’t Know
Ground-Mounted Commercial: Upfront Costs [ASK SECTION IF Q8=2 OR ROOF=0 & GROUND=1]
36. NYSERDA is interested in learning about your typical costs for different project activities. Thinking about the ground-mounted commercial solar PV systems your company installed in 2016, please estimate your company’s costs for a typical project for each of the categories shown below. For each category, click the triangle to move and select the appropriate point on each bar. [IF MORE THAN ONE REGION PICKED IN Q21: “Please provide your best estimate for each region in New York State you indicated working in.”]
[PROGRAMMER: Include separate slider bar sets for each region in New York State selected in Question 21: The Con Ed Service Territory (Q21 = A), Long Island (Q21 = B) and the Rest of New York State (Q21 = C). DO NOT include slider bar sets for Areas outside of New York State (Q21 = D).]
If you need more information on each category, click on the name of each category for more information. National average values are shown for some of these categories to assist you.
[For dollars per Watt ($/Watt), values are:
Component
Benchmark Cost [$/W]
[Start] Min
[Left] Max
[Right] Pre-Development $0.43 $0.00 $0.86 Design and Engineering $0.04 $0.00 $0.08 Permitting, zoning, and inspection $0.06 $0.00 $0.12
37. Overall, how confident are you of the estimates you provided for your company’s typical ground-mounted commercial PV costs?
1. Very confident 2. Somewhat confident 3. Not at all confident
38. For ground-mounted commercial installation labor, including all contract labor, what was
your company’s percentage split between electrician labor hours vs. non-electrician labor hours for a typical commercial system installed in New York in 2016?
[PROGRAMMER: Insert a sliding bar for each NY region selected in question 21a-c. Also insert a button for “I can’t answer this question” for each region.]
Ground-Mounted Commercial: Other Costs [ASK SECTION IF Q8=2 OR ROOF=0 & GROUND=1]
39. [ASK IF Q20A > 0 OR 20B > 0 & Q21=C] What percentage of your ground-mounted commercial PV projects in the last 12 months have been in jurisdictions that have “opted out” of the Solar Real Property Tax Exemption? [PROGRAMMER: set range from 0% to 100%]
1. Provide Answer 96. Do Not Wish to Provide
A-12
97. Don’t Know
40. [ASK IF Q20=B] Nationwide average operating and maintenance (O&M) costs for a typical commercial system are <$0.01 - $0.04 per Watt per year. What was your company’s average annual O&M cost for a typical ground-mounted commercial system installed in 2016? Your best estimate is fine. If you do not have information available for 2016, an estimate based on 2015 is fine. [PROGRAMMER: Indicate metric as dollars per watt per year.]
Component
Benchmark Cost ($/Watt-
year) [Start]
Min Cost
[Left]
Max Cost
[Right] Commercial O&M Costs $0.025 $0 $0.05
41. For a typical ground-mounted commercial PV system installed in 2016, how many days on average did you spend waiting for permit applications (including variances) to be approved that prevented you from undertaking additional work at the site? Please include all of the different permits that are typically required for a project.
[PROGRAMMER: include separate answer boxes for each region in which they installed systems, both inside and outside of NY (Q21a-Q21d); set maximum at 1,000; Include “Don’t Know”]
42. Did your company install any ground-mounted commercial PV systems in 2016 for which a State Environmental Quality Review (SEQR) study was required? (In New York, SEQR studies are required for any system larger than 4,000 sq. ft., or approximately 50 kW).
1. Yes 2. No 97. Don’t Know
43. [ASK IF Q42=1] What was the approximate average cost for SEQR studies for ground-
mounted commercial PV systems installed by your company in 2016? [PROGRAMMER: set range from 0 to 100,000]
1. Provide Answer 96. Do Not Wish to Provide 97. Don’t Know
44. Did your company install any ground-mounted commercial PV systems in 2016 for
which other studies were required, beyond the SEQR study?
1. Yes 2. No 97. Don’t Know
A-13
45. [ASK IF Q44=1] Approximately what percentage of the ground-mounted commercial PV systems installed by your company in 2016 required other studies, beyond the SEQR study? [Set range from 1 to 100%].
46. [ASK IF Q45=1] For ground-mounted commercial PV systems installed in 2016, what was the average total cost per system for all of these studies combined (excluding the SEQR study)? Your best estimate is fine. [PROGRAMMER: set range from 0 to 500,000]
1. Provide Answer 96. Do Not Wish to Provide 97. Don’t Know
Roof and Ground-Mounted Solar: Additional Questions [ASK IF ROOF=1 & GROUND=1]
47. Comparing a typical roof-mounted commercial system to a typical ground-mounted commercial system, how do the following types of costs compare (on a per-kW basis)?
a. Development b. Design and Engineering c. Permitting, zoning, and inspection d. Interconnection labor e. Other up-front costs
1. Costs are about the same 2. Costs are significantly higher for roof-mounted systems 3. Costs are significantly higher for ground-mounted systems 97. Don’t know
48. Are there any other major differences in costs between your typical roof-mounted and
ground-mounted systems?
1. Yes 2. No
49. [ASK IF Q48=1] Please describe these differences in costs between your typical roof-mounted and ground-mounted systems.
Shared Solar [ASKED ALL]
50. Has your company considered installing shared solar PV systems in New York? In a shared solar installation, multiple participants benefit directly from the energy produced by a single solar array, which could either be on-site, such as in a large apartment building, or off-site. Shared solar participants typically own or lease a portion of a system, or purchase kilowatt-hour blocks of renewable energy generation.
1. Yes 2. No
A-14
[PROGRAMMER: If no: skip remainder of shared solar questions. If yes, ask remaining questions in shared solar section.]
51. [ASK IF Q50=1] Are there any additional costs specific to shared solar installations that you would not incur in other, non-shared residential or commercial systems?
1. Yes 2. No
52. [ASK IF Q51=1] Please list these additional costs specific to shared solar installations.
53. [ASK IF Q50=1] Do you anticipate that any of the following costs would be substantially higher (on a per-Watt basis) for shared solar PV systems in New York than for other, non-shared residential or commercial systems?
a. Customer acquisition b. Design and Engineering c. Permitting, zoning, and inspection d. Interconnection e. Installation labor
1. Yes 2. No 97. Don’t Know
[PROGRAMMER: Include an optional comment box for further comment/explanation]
54. [ASK IF Q50=1] Do you anticipate that any of the following costs would be substantially lower (on a per-Watt basis) for shared solar PV systems in New York than for other, non-shared residential or commercial systems?
a. Customer acquisition b. Design and Engineering c. Permitting, zoning, and inspection d. Interconnection e. Installation labor
1. Yes 2. No 97. Don’t Know
[PROGRAMMER: Include an optional comment box for further comment/explanation]
A-15
55. [ASK IF Q50=1] Do you expect that shared solar installations will require more time than other, non-shared residential or commercial systems, on average, to proceed from the initial development stages to full operation?
1. Yes 2. No
56. [ASK IF Q55=1] Please explain why you expect shared solar installations will require
more time.
57. [ASK IF Q50=1] Are there any policy or regulatory barriers unique to shared solar installations that do not apply to other, non-shared residential or commercial systems?
1. Yes 2. No
58. [ASK IF Q57=1] Please explain these barriers.
Other [ASK ALL]
[TRANSITION TEXT: “You are almost finished! These final questions ask about your overall work and experience in New York State.”]
59. [ASK IF (Q11=A OR B OR C) AND IF Q11=D; OR ASK IF (Q21=A OR B OR C) AND IF Q21=D] Thinking about your costs for liability insurance, how would you say costs in New York State compare to costs for liability insurance outside of New York State?
1. Costs in New York State are higher than outside of New York State 2. Costs in New York State are lower than outside of New York State 3. Costs in New York State are about the same as costs outside of New York State
60. [ASK IF Q59=1 OR 2] About how much [INSERT “HIGHER” if Q58=1 OR “LOWER”
if Q58=2] is the cost of liability insurance in New York State in 2016 compared to the cost outside of New York State? Please answer in the form of a percentage. [PROGRAMMER: set range from 0 to 1,000%] 1. Provide Answer 96. Do Not Wish to Provide 97. Don’t Know
61. In your experience, where is there the greatest opportunity for solar developers to reduce
balance-of-system costs?
62. Do you have any other information or feedback you wish to share with NYSERDA regarding solar balance-of-system costs in New York?
A-16
Contact information (for validation purposes) [ASK ALL]
63. As part of its efforts to bring down balance of system costs, NYSERDA would appreciate the opportunity to ask follow-up questions. Are you willing to be contacted if we have follow-up questions?
1. Yes 2. No
64. [ASK IF Q64=1] Please provide a phone number where we can reach you.
[CLOSING: “You have completed the survey. Thank you for your time and participation!”]
B-1
Appendix B. Detailed Survey Results
This appendix contains a series of dot plots, one for each surveyed cost element. The dot plots represent all survey responses received for each cost element; each dot represents an individual survey response. Responses from the same geographic region (Con Ed service territory, Long Island, and Rest of State) are grouped together vertically; the horizontal location of a dot represents the cost estimate provided, with higher dollar-per-watt responses appearing further towards the right.
The dot plots use shading to indicate the magnitude of individual respondents’ installed capacities, and therefore, the relative weight installers receive when calculating weighted median and weighted mean values for each cost element. The shading convention used in the dot plots is as follows:
The dot plots use vertical dotted lines to denote the weighted 25th, 50th (weighted median), and 75th percentiles for each cost element in each geographic region. Note that in many cases, a given response comes from an installer with sufficient installed capacity to represent the weighted 25th and 50th percentiles together, or the weighted 50th and 75th percentile together.
Outliers, as identified through the methodology in Appendix C, are identified with blue arrows:
These arrows also appear in cases where responses may represent potential anomalies: these are evident in cases where the blue arrow points to a dot that also represents the weighted median for a cost category, where that dot is also at the extreme low end or extreme high end of the range of dots for a given cost element and region.
In cases where the scenario that excludes outliers and potential anomalies results in differential 25th, 50th, or 75th percentile estimates, these are noted below the dot plot in blue font.
Following the dot plots, this appendix presents the same summary cost tables as in the Executive Summary and Results chapters of this report, but with corresponding benchmark figures from GTM Research included for additional comparison. Because GTM Research’s cost categories don’t align with the NREL cost categories, it is not possible to perform a detailed comparison using these data.
Small installers Large installers Darker shading indicates relatively more installed capacity,
CON ED SERVICE TERRITORY LONG ISLAND REST OF STATE
Weighted by installer capacity:
25th Percentile $0.04 $0.10 $0.08
50th Percentile (median) $0.05 $0.10 $0.23 75th Percentile $0.32 $0.10 $0.50 Mean: small installers $0.26 $0.26 $0.16 Mean: large installers $0.13 $0.06 $0.35 Mean: all installers $0.19 $0.08 $0.29 Unweighted: Median $0.23 $0.21 $0.12 Mean $0.24 $0.25 $0.19
Figure B3. Residential Interconnection Costs: All Responses
With outliers and potential anomalies excluded, Long Island 25th percentile becomes $0.10 (from $0.04), and ROS 50th percentile becomes $0.23 (from $0.25).
CON ED SERVICE TERRITORY LONG ISLAND REST OF STATE
Weighted by installer capacity:
25th Percentile $0.39 $0.33 $0.29
50th Percentile (median) $0.39 $0.61 $0.29 75th Percentile $0.41 $0.61 $0.36 Mean: small installers $ 0.51 $0.50 $0.53 Mean: large installers $ 0.44 $0.19 $0.32 Mean: all installers $ 0.45 $0.21 $0.34 Unweighted: Median $0.66 $0.63 $0.45 Mean $0.61 $0.59 $0.50
Figure B4. Residential Installation Labor Costs: All Responses
With outliers and potential anomalies excluded, Long Island 25th, 50th, and 75th percentiles shift from $0.29, $0.29, $0.60 to $0.33, $0.61, and $0.61, respectively.
CON ED SERVICE TERRITORY LONG ISLAND REST OF STATE
Weighted by installer capacity:
25th Percentile $0.19 $0.07 $0.35
50th Percentile (median) $0.26 $0.07 $0.43 75th Percentile $0.26 $0.48 $0.43 Mean: small installers $ 0.20 $0.45 $0.30 Mean: large installers $ 0.05 $0.09 $0.38 Mean: all installers $ 0.06 $0.09 $0.36 Unweighted: Median $0.30 $0.45 $0.32 Mean $0.29 $0.38 $0.30
Figure B5. Roof-Mounted Commercial Predevelopment Costs: All Responses
With outliers and potential anomalies excluded, Con Ed 25th, 50th, and 75th percentiles becomes $0.19, $0.26, and $0.26 from $0.04, $0.04, and $0.10, respectively; Long Island 25th, 50th, and 75th percentiles become $0.07, $0.07, and $0.48 from $0.002, $0.002, and $0.07, respectively.
CON ED SERVICE TERRITORY LONG ISLAND REST OF STATE
Weighted by installer capacity:
25th Percentile $0.03 $0.001 $0.04 50th Percentile (median) $0.03 $0.001 $0.04 75th Percentile $0.03 $0.03 $0.04 Mean: small installers $0.11 $0.06 $0.05 Mean: large installers $0.11 $0.02 $0.04 Mean: all installers $0.11 $0.02 $0.04 Unweighted: Median $0.07 $0.04 $0.05 Mean $0.11 $0.04 $0.06
Table B12. Roof-Mounted Commercial Design and Engineering Costs: Summary Statistics (Outliers and Potential Anomalies Removed)
CUSTOMER SEGMENT GEOGRAPHIC AREA
CON ED SERVICE TERRITORY LONG ISLAND REST OF STATE
Weighted by installer capacity:
25th Percentile $0.03 $0.03 $0.04
50th Percentile (median) $0.03 $0.03 $0.04 75th Percentile $0.03 $0.08 $0.04 Mean: small installers $0.11 $0.06 $0.05 Mean: large installers $0.02 $0.02 $0.04 Mean: all installers $0.03 $0.02 $0.04 Unweighted: Median $0.07 $0.06 $0.05 Mean $0.08 $0.06 $0.05
Figure B6. Roof-Mounted Commercial Design and Engineering Costs: All Responses
With outliers and potential anomalies excluded, Long Island 25th, 50th, and 75th percentiles become $0.03, $0.03, and $0.08 from $0.001, $0.001, and $0.03, respectively.
CON ED SERVICE TERRITORY LONG ISLAND REST OF STATE
Weighted by installer capacity:
25th Percentile $0.06 $0.03 $0.05
50th Percentile (median) $0.06 $0.03 $0.06 75th Percentile $0.06 $0.08 $0.06 Mean: small installers $0.04 $0.11 $0.06 Mean: large installers $0.07 $0.02 $0.06 Mean: all installers $0.07 $0.02 $0.06 Unweighted: Median $0.06 $0.09 $0.06 Mean $0.07 $0.08 $0.07
Figure B7. Roof-Mounted Commercial Permitting, Zoning, Inspection Costs: All Responses
With outliers and potential anomalies excluded, Long Island 25th, 50th, and 75th percentiles become $0.03, $0.03, and $0.08 from $0.01, $0.01, and $0.03, respectively.
CON ED SERVICE TERRITORY LONG ISLAND REST OF STATE
Weighted by installer capacity:
25th Percentile $0.02 $0.05 $0.20
50th Percentile (median) $0.02 $0.05 $0.50 75th Percentile $0.03 $1.00 $0.50 Mean: small installers $0.25 $0.44 $0.21 Mean: large installers $0.03 $0.15 $0.41 Mean: all installers $0.05 $0.15 $0.36 Unweighted: Median $0.16 $0.44 $0.20 Mean $0.25 $0.48 $0.21
Figure B8. Roof-Mounted Commercial Interconnection Costs: All Responses
With outliers and potential anomalies excluded, Long Island 25th, 50th, and 75th percentiles become $0.05, $0.05, and $1.00 from $0.02, $0.02, and $0.05, respectively.
CON ED SERVICE TERRITORY LONG ISLAND REST OF STATE
Weighted by installer capacity:
25th Percentile $0.42 $0.15 $0.21
50th Percentile (median) $0.42 $0.15 $0.21 75th Percentile $0.42 $0.42 $0.42 Mean: small installers $0.26 $0.23 $0.37 Mean: large installers $0.36 $0.10 $0.24 Mean: all installers $0.35 $0.10 $0.28 Unweighted: Median $0.38 $0.20 $0.41 Mean $0.38 $0.25 $0.38
Figure B9. Roof-Mounted Commercial Installation Labor Costs: All Responses
With outliers and potential anomalies excluded, Long Island 25th, 50th, and 75th percentiles become $0.15, $0.15, and $0.42 from $0.02, $0.02, and $0.15, respectively.
Figures separated by a vertical bar represent estimates including all responses (on the left) and with outliers removed (on the right). The results removing outliers also remove other potential anomalies, in the form of instances where a large installer provided the lowest or highest overall cost estimate for a given cost element and market segment, but their response produced the weighted median result (by virtue of it coming from a particularly large installer, which was weighted more heavily than other installers). For an overview of GTM Research’s figures, see https://www.greentechmedia.com/research/report/us-solar-pv-price-brief-h1-2016 * In NREL’s Q1 2016 model, permitting, zoning, inspection, and interconnection labor costs and fees are all included in one “permitting, inspection, interconnection” category. † Interconnection costs reflect higher uncertainty than other costs, due in part to apparent differences in installers’ accounting for interconnection-related activities (this appears to affect ROS in particular, which is higher than estimates in other parts of the state). NYSERDA may want to examine and refine the definition of interconnection to clarify specific activities, and should then reallocate baseline costs to be consistent with future definitions.
** NREL’s Q1 2016 model refers to this cost element as “sales and marketing.”
B-17
Table B30. Commercial Costs, Roof-Mounted Systems, by Cost Component, Including GTM Research Benchmarks ($/Watt)
COST COMPONENT NREL Q1 2016 BENCHMARK GTM H1 2016 NY BOS SURVEY AND MODEL
US AVERAGE NEW YORK
STATE US AVERAGE
CON ED SERVICE TERRITORY
LONG ISLAND REST OF STATE
Hardware and Materials Costs (Not Assessed or Modeled Separately from NREL Q1 2016)
Other BOS Cost Elements (Modeled Based on NREL Q1 2016 Framework)
Sales Tax $0.07 $0.04 $0.07 $0.04 $0.02 $0.03
Contingency $0.06 $0.06 Not estimated $0.07 $0.05 | $0.06 $0.08 EPC Overhead $0.20 $0.19 Not estimated $0.19 $0.19 $0.19 Profit $0.04 $0.04 Not estimated $0.04 $0.03 $0.05
Supply Chain, Logistics, & Misc. Not separately estimated $0.06 Not separately estimated
Overhead & Margin Not separately estimated $0.37 Not separately estimated
Subtotal: Other BOS Cost Elements $0.38 $0.33 $0.50 $0.34 $0.30 | $0.31 $0.36 Total Cost $2.13 $2.07 $1.88 $2.00 | $2.22 $1.44 | $1.73 $2.69
Total Soft Costs $1.03 $0.99 $0.89 $0.91 | $1.13 $0.35 | $0.64 $1.60 Notes: Totals may not sum due to rounding. Figures separated by a vertical bar represent estimates including all responses (on the left) and with outliers removed (on the right). The results removing outliers also remove other potential anomalies, in the form of instances where a large installer provided the lowest or highest overall cost estimate for a given cost element and market segment, but their response produced the weighted median result (by virtue of it coming from a particularly large installer, which was weighted more heavily than other installers). For an overview of GTM Research’s figures, see https://www.greentechmedia.com/research/report/us-solar-pv-price-brief-h1-2016 * In NREL’s Q1 2016 model, permitting, zoning, inspection, and interconnection labor costs and fees are encapsulated into one “permitting and interconnection” category. † Interconnection costs reflect higher uncertainty than other costs, due in part to apparent differences in installers’ accounting for interconnection-related activities (this appears to affect ROS in particular, which is higher than estimates in other parts of the state). NYSERDA may want to examine and refine the definition of interconnection to clarify specific activities, and should then reallocate baseline costs to be consistent with future definitions. ** NREL’s Q1 2016 model does not separately estimate these cost elements, but instead includes an aggregate “developer overhead category.” By our understanding, this category aligns to predevelopment / origination and design and engineering activities, and is therefore analogous to these items within the survey. The $0.41 estimate reflects NREL’s New York State-specific estimate for “developer overhead.”
†† ROS predevelopment costs are significantly higher than estimates from other parts of the state, and higher than NYSERDA program staff anticipated based on agency experience. NYSERDA may conduct additional information collection to more closely examine the reasons for this cost difference and determine whether the baseline ROS predevelopment costs require adjustment.
C-1
Appendix C. Detailed Methods and Validation Results
This appendix discusses the methods used for this study. Primary methods included developing a cost estimation model, based in part on an existing model developed by NREL; a web-based survey of solar installers; survey data validation, including follow-up interviews with selected survey respondents; and weighting survey results.
C.1 Cost Estimation Model
The cost estimation model used in the present analysis uses a similar framework to the NREL Q1 2016 benchmark model for residential and commercial PV solar systems to combine hardware costs, surveyed BOS cost elements, and other BOS cost elements such as sales taxes, overhead, and profit into an overall per-watt cost for PV solar systems.
The model is based mainly on the NREL Q1 2016 benchmark model, and varies across residential and commercial systems. It uses NREL Q1 2016 hardware costs for these systems, inserts the weighted median estimate for each surveyed cost element in each geographic segment, and then adds on additional BOS cost elements in accordance with the NREL Q1 2016 benchmark model, with New York state- or region-appropriate adjustments as necessary.
The study team conducted multiple rounds of model and data validation to calibrate the model. One round of calibration involved detailed follow-up and discussion with NREL staff regarding the assumptions and parameters used in their model, such as financing calculations developed in 2013 that underpin the current model framework, and assumptions about parameters used to fully load labor rates. The team next conducted an array of interviews with financiers and installers involved in New York State’s PV solar market to determine the extent to which NREL’s model, which generally reflects nationwide solar costs and cost elements with a limited degree of tailoring for New York State, is appropriate to estimating the per-watt costs of PV solar systems in New York State. These interviews focused mainly on financing costs (included in overhead in the NREL Q1 2016 benchmark model), other overhead costs, and profit margins.
Interviewees generally indicated that New York State does not differ substantially along these lines from other states in which they do business, and therefore no modeling adjustments would be warranted or justified for these cost elements. As a result, the study team retained NREL’s assumptions regarding these cost elements for use in our model.
Some solar installers interviewed suggested that overhead costs and profit margins for residential systems may be higher than modeled by NREL, and therefore, higher than shown in the present analysis. However, these installers also indicated that overhead costs vary substantially by installer type, i.e., some smaller installers may have substantially lower overhead costs than larger installers who pre-purchase and warehouse modules and other equipment due to the demands of a higher-volume business. They further indicated that profit benchmarks and targets can vary substantially by project, and that many installers target portfolio-level profit margins rather than project-specific outcomes. Therefore, the study team expects that the uncertainty associated with the overhead and profit components of BOS costs shown in Figures 2 through 5 may be skewed such that these costs are more likely to be underestimated than overestimated.
C-2
Descriptions of the non-hardware, non-surveyed cost elements for residential and commercial systems included in the cost model are available in sections 3.1 and 3.2 of this report, respectively.38
C.2 Survey
C.2.1 Survey Development and Administration
The second primary method effort for this baseline cost estimate consisted of a web-based survey of solar installers active in New York State in 2016. The survey was distributed to the list of NY-Sun program partners, which included 360 solar installers.39 Businesses that did not actually install solar PV systems in the state in 2016 were removed from the survey. 229 of these companies installed PV systems in New York State in 2016; OpenNY data identified an overall total of 244 unique companies as installing a PV solar system in New York State in 2016. Thus, it would appear that 15 companies included in OpenNY were not on the list of NY-Sun program partners.
Using NYSERDA data on the number of capacity of solar installations performed by each installer in 2016, the study team developed a weighting protocol to examine the proportion of total installed capacity in a given market segment attributable to survey respondents. Because the largest installers have the greatest influence in driving average costs in a given market segment, survey implementation included outreach to ensure participation by installers with a high proportion of capacity installed in 2016. By design, the response rate in terms of total installed capacity is therefore higher than the unweighted response rate in many market segments.40
APPRISE administered the survey between December 20, 2016 and February 2, 2017. Table C1 summarizes the final survey disposition.
38 The survey did not collect data on permit fees for commercial systems, including roof-mounted commercial systems. Review of NREL models and datasets underlying recent NREL modeling efforts suggests that on a per-watt basis, permitting fees for commercial-scale systems may be negligible, especially to the extent that permit fees do not differ substantially between residential and commercial systems, as indicated by some installers during validation and solar installer interviews conducted in the course of this analysis. To the extent that permitting fees for commercial systems are non-negligible on a dollar-per-watt basis, the estimates presented in this document for commercial, roof-mounted systems may slightly understate total system per-watt costs as well as total soft costs. 39 NY-Sun program partners can be either commercial or residential partners. To qualify for commercial partnership, an installer must demonstrate that they have completed three commercial-scale projects totaling 500 kW in the past three years, or have completed a PV project under a previous NYSERDA PV PON that has been reporting data to the NYSERDA DG Integrated Data System website for at least three months. To qualify for residential partnership, installers must fulfill one of three credentialing paths: NABCEP certification; IBEW-NECA electrical journeyman and apprentice training; or UL PV system installation certification. Residential applicants are also evaluated on prior experience with installation, employment history, and customer references. Note that to receive financial incentives from the NY-Sun program, solar PV systems must be installed by a NY-Sun program partner. As we understand, the vast majority of residential and commercial PV systems installed in New York State receive these incentives. Thus, the list of NY-Sun program partners constitutes all, or nearly all, solar installers active in New York State. Some program partners did not install PV systems in 2016; they were screened out of the survey. 40 The weighted response rate more accurately reflects the overall population of PV systems installed in New York State, and thus, the average costs for all such PV systems; as a result, the weighted response rate rather than the unweighted response rate should be used to evaluate the statistical significance of the survey results. Note that the weighted response rate is not higher than the unweighted response rate in two segments: commercial (non-residential) in the Con Ed service territory, and commercial (non-residential) in the “Rest of State” area (i.e., everything outside of the Con Ed service territory and Long Island). In both instances, some installers with substantial installed capacity in this segment did not respond to the survey; further, the commercial installation market in the “Rest of State” area is highly fragmented, without a wide array of large installers for outreach prioritization.
C-3
Table C1. Survey Respondent Characteristics
CUSTOMER SEGMENT CON ED SERVICE
TERRITORY LONG ISLAND REST OF STATE Residential:
Number of Respondents 34 25 68 Response Rate (% of Sample) 48% 42% 47% Response Rate (Weighted by Installed Capacity )
72% 69% 65%
Commercial (Non-Residential): Number of Respondents 16 11 44 Response Rate (% of Sample) 47% 46% 51% Response Rate (Weighted by Installed Capacity )
37% 48% 37%
Respondents provided cost estimates for a typical-size system, with that ‘typical’ size identified by the respondents. That is, rather than defining a particular system size (e.g., 7 kW) and asking respondents to estimate their costs for that benchmark system, the study team asked respondents to identify the typical size of a residential or commercial PV system installed in each region of New York State in 2016, and then estimate costs for that system size.
Table C2 reproduces the definitions for the cost categories used in the survey.
Table C2. Survey Cost Category Definitions
COST CATEGORY CUSTOMER SEGMENT DEFINITION
Customer acquisition Residential
Includes the following pre-sale activities: marketing and advertising; sales calls; system design; site visits; travel time to and from the site; contract negotiation with the system host/owner; and bid preparation. You should include costs incurred for potential customers that did not end up completing a PV system purchase.
Pre-development Commercial
Includes the following pre-sale activities: marketing and advertising; sales calls; site visits; travel time to and from the site; contract negotiation with the system host/owner; and bid preparation. You should include costs incurred for potential customers that did not end up completing a PV system purchase.
Design and engineering Commercial Includes all labor costs associated with designing the PV system.
Permitting, zoning, and inspection
Residential and Commercial
Includes all labor costs associated with preparing and submitting building and zoning permits, and with building inspection. Do not include expenses associated with fees.
Interconnection Residential and Commercial
Includes all labor costs associated with preparing and submitting interconnection applications. Do not include expenses associated with fees.
Installation labor Residential and Commercial
Includes all direct labor costs for system installation.
Respondents were also given the option of providing cost estimates in terms of $/watt, total dollars, or labor hours. Total dollar responses were converted to $/watt by simply dividing the amount given by the capacity (in watts) of a typical system, as reported by each survey respondent individually.41 Labor hour
41 In rare instances, a respondent provided total dollar responses to estimate the surveyed cost elements, but did not provide a typical system size. In these cases, we researched the types of installations performed by installers and noticed that they varied substantially, to the extent that a typical system size for the installer did not exist, based on their array of 2016 solar PV installations in a given market segment. Therefore, where a respondent provided a total dollar (or total labor hour) response and did not provide a corresponding typical residential and/or commercial
C-4
responses were converted to total dollars using New York State-specific wage data from the Bureau of Labor Statistics. Specifically, survey respondents providing labor hour-based estimates of cost elements were also asked to specify the distribution of those labor hours between electrician and non-electrician labor hours. Electrician labor hours were priced using Occupation Code 47-2111 (“Electricians”) for May 2016 in New York State, with a median wage rate of $32.53 per hour. Non-electrician labor hours were priced using Occupation Code 47-2061 (“Construction Laborers”) for May 2016 in New York State with a median wage rate of $18.68 per hour.42 These median wage rates were transformed into fully-loaded rates using Bureau of Labor Statistics data on employer costs for employee compensation, namely the proportion of total compensation consisting of wages and salaries versus benefits for the construction industry as of December 2016, or 69.5 percent.43 This yielded fully-loaded median wage rates of $46.79 per hour for electrician labor and $26.88 for non-electrician laborers. These rates were converted to total dollar estimates based on the total number of labor hours estimated by the respondent and their percentage breakdown of these hours across electrician and non-electrician labor for each cost element. The resulting total dollar estimates were then converted to $/watt by dividing the result by the capacity of a typical system.
Where respondents provided non-$/watt estimates, the study team conducted statistical tests to determine whether the processes used to convert total dollar or total labor hour estimates resulted in a distribution of calculated per-watt costs similar to the distribution of non-calculated per-watt estimates provided by other survey respondents. This analysis indicated that for most cost elements, distributions were generally similar. Further, only a minority of respondents chose to respond in terms of total dollars or total labor hours. The study team therefore does not believe that the choice of metric or the conversion methodology resulted in any systematic distortion of the results.
During data analysis, one set of responses was removed from the survey data because it belonged to a solar installer that had already answered the survey during the pre-testing phase. The two sets of responses were generally similar, but not identical; the analysis used the first set of responses provided.
The web interface for the survey used a series of “slider bars.” Respondents estimated their costs for each cost component by moving the cursor to a spot somewhere on the horizontal bar, where the left edge represented the minimum value ($0.00 per watt) and the right edge represented the maximum allowed value (which varied by cost category). In a few instances, respondents chose the maximum value, which suggests that their actual estimates may have been higher; note, however, that this only affected our overall results in one instance, which was already flagged as an outlier value.44 In future versions of this study, if benchmark costs fall and the allowed range of cost estimates from survey respondents shrinks accordingly,45 this could become a more significant issue. If this occurs, future evaluators may need to conduct additional validation on this issue.
system size, we did not include that respondent’s responses within the data analysis. Meta-analysis of these instances indicates that doing so using an average or other reasonable system size for these installers would not fundamentally change the results of the analysis. 42 See U.S. Department of Labor, Bureau of Labor Statistics, May 2016 State Occupational Employment and Wage Estimates, New York, https://www.bls.gov/oes/current/oes_ny.htm. 43 See U.S. Department of Labor, Bureau of Labor Statistics, Table 6. Private Industry, by Major Industry Group: Employer costs per hour worked for employee compensation and costs as a percent of total compensation: private industry workers, by major industry group, December 2016, https://www.bls.gov/news.release/ecec.t06.htm. Note that after the analysis was performed, the Bureau of Labor Statistics appeared to retroactively revise the 69.5 percent figure representing the proportion of total compensation for workers in the construction industry to 69.8 percent. This does not have a material effect on the present analysis. Fully-loaded median wage rates are calculated by diving the base wage rates by this proportion, i.e., $32.53 divided by 69.5 percent yields $46.79. 44 Specifically, for residential permit fees for ROS, a large installer chose the maximum value of $500. This installer’s capacity was sufficiently large that their response constituted the median estimate, notwithstanding the fact that it was an outlier (on an unweighted basis). The results including and excluding the outlier responses are shown in Figures 2 and 3, respectively. 45 As we understand, with the “slider bar” approach, the bar can only be placed at the midpoint of the bar or at one edge. Thus, if a benchmark cost estimate is to be used as the starting point, it will by definition be at the midpoint of the range, meaning the maximum allowable value will be two times the benchmark value.
C-5
C.2.2 Survey Data Validation Methods and Results
Survey Validation Methods
After administering the survey and compiling initial results, the study team engaged in a multi-step validation process, working in collaboration with NYSERDA program and evaluation staff and a solar installer.
The study team first compared initial survey results to BOS cost estimates developed by NREL and GTM Research. Most cost elements appeared reasonably consistent across these data sources, with the survey figures generally slightly higher than estimates from other sources. This is consistent with state-specific estimates from NREL and anecdotal information that costs in New York State are typically somewhat higher than the nationwide average.46 Key exceptions were:
All cost components of Long Island roof-mounted commercial systems, which were substantially lower in the survey data (i.e., approximately 80 percent lower than NREL); and
Interconnection and predevelopment/origination costs in Rest of State for roof-mounted commercial systems, where the survey cost estimates were substantially higher (i.e., more than four times as large as GTM Research; NREL does not include this as a separate cost category).
While the study team expected to see differences in some results between data sources, these discrepancies were sufficiently large, and inconsistent with the study team’s and NYSERDA’s understanding of the New York State solar market, to warrant further investigation.
The study team also reviewed initial results with a solar installer to determine whether any of the definitions used for the various cost categories could have led to confusion among survey respondents and negatively impacted the accuracy of the overall results. Based on that review, the team determined that some respondents may have provided results for interconnection costs that were inconsistent with the category as defined in the survey. The study team therefore flagged interconnection as an area of particular focus for validation interviews.
Another key criterion for determining where further validation was needed was whether the overall cost estimates (25th percentile, median, and 75th percentile, weighted by respondents’ installed capacity)47 were being driven by responses from one or more large installers whose responses are at one end (i.e., the very highest or very lowest cost out of all responses) of the distribution. The study team identified two instances of this issue upon review of the survey responses:
Roof-mount commercial systems in Long Island (all cost elements); and
Residential systems in Long Island (installation labor costs).
In addition to these overall areas, the study team defined objective criteria for characterizing individual responses as outliers that warrant further validation. These criteria were as follows:
1a) A survey response that falls outside of the 90 percent confidence interval (in either direction) for a given cost element and market segment (for unweighted responses), where
1b) The survey response is sufficiently different from the remaining responses and/or the installer has sufficient installed capacity such that the weighted mean changes at all if the outlier is removed
or
46 In addition, the NREL and GTM estimates do not adequately account for certain high-level factors driving overall costs, such as a higher sales tax in New York State (where applicable) than the parameter used in these models. 47 To estimate median costs, we are weighting survey responses based on each respondent’s capacity of installed PV within each subgroup in 2016. Thus, if one respondent accounted for ten percent of all Long Island residential PV capacity installed in 2016 and another respondent accounted for one percent, the first respondents’ answers are given ten times as much weight in determining the overall median cost for each cost category.
C-6
2) The weighted median for a given cost element and market segment reflects the lowest or highest overall response received for that cost element and market segment (by virtue of this response coming from a large installer).
The study team also reviewed initial results with the solar installer to identify any other data points or overall cost estimates that warrant further validation, based on the installer’s familiarity with costs typically seen in the market. Based on this review, the study team determined there were no other cost estimates requiring validation beyond those listed above.
Based on this methodology, the study team identified an array of 12 survey respondents as validation interview targets that had identified they were willing to be contacted as a follow-up to their survey participation.48 These respondents included a mix of large and small installers who provided outlier responses as defined above (n = 7), as well as a handful of large installers that could be used to validate and confirm costs associated with interconnection costs, due to the additional uncertainty surrounding this cost element (n = 5).
Survey Validation Results
In total, of these 12 respondents identified for follow-up validation, five agreed to conduct follow-up interviews and provide additional clarification regarding their understanding of the survey questions and their responses. These validation interviews were used to clarify respondents’ understanding of the survey questions, offer respondents a chance to revise survey data if discussions indicated that they misunderstood the question, offer general feedback for future iterations of the survey, and also to collect data on permitting and interconnection fees, which were not collected in the original survey instrument (with the exception of ROS residential systems). The study team received the following general responses:
Most validation interviewees, including those submitting outlier responses, confirmed an appropriate understanding of the survey questions and cost elements, including those for which they submitted outlier data points.
Two interviewees revised their survey responses for selected cost categories. In one instance, this resulted from additional clarification of the cost element in question. In the other instance, the interviewee indicated that the definition of the cost category was appropriate, but that the survey response submitted was a user error wherein the respondent entered incorrect data, despite understanding the question correctly. In both instances, the study team included these updated estimates in our analysis.
Most validation interviewees indicated that there was no “pay-to-play” interconnection fee in New York State, though they indicated that there are a variety of other components of the interconnection process that could be considered “fees,” such as paying the utility to conduct required studies, submitting application fees for interconnection, or expending labor hours to be present at interconnection-related inspections.
All validation interviewees indicated that costs associated with transmission upgrades necessary to initiate some interconnection projects were highly unusual and should not be considered as a standard interconnection cost when estimating the price of a typical residential or commercial solar PV system.
No validation interviewee expressed any general problems or difficulties with completing the survey. Some interviewees stated that solar installers use a variety of definitions and internal cost tracking systems to categorize and report their costs, and that requests that they dissociate them
48 Other respondents who provided outlier responses, or whose responses were flagged for follow-up for another reason, indicated in their survey responses that they did not wish to be contacted again.
C-7
into specific categories can lead to difficulties and challenges. However, validation interviewees indicated that they took care to prevent double-counting among survey answers submitted.
Interconnection
Regional Variation in Interconnection
Unlike many of the other cost elements surveyed, interconnection costs vary dramatically among regions. Because interconnection costs are not separately addressed by NREL, it is not clear whether specific estimates are lower or higher than “average,” but within New York, interconnection costs tend to be substantially higher in ROS:
For residential systems, interconnection costs are estimated as $0.05/watt in the Con Ed service territory, $0.10/watt in Long Island, and $0.25/watt in ROS. (The scenario that removes outliers drops the ROS figure from $0.25/watt to $0.23/watt.)
For commercial, roof-mounted systems, interconnection costs are estimated as $0.02/watt in the Con Ed service territory, $0.02/watt in Long Island (or up to $0.05/watt in Long Island in the scenario that removes outliers), and $0.50/watt in ROS.
An examination of the regional patterns of respondent’s answers for this cost element, as shown in Appendix B, Figures B3 and B8, shows that the results are not driven by one large respondent, or a handful of large respondents, that skew the results upwards. Rather, as shown in Figure B3, for residential interconnection costs, the following are important to note:
In the Con Ed service territory, there was a cluster of interconnection cost responses between $0.01/watt and $0.13/watt, including many large respondents. Other clusters included $0.25/watt to $0.35/watt, and one large respondent provided an estimate of $0.50/watt.
In Long Island, there was a cluster of interconnection cost responses between approximately $0.04/watt and $0.14/watt, and another cluster between $0.20/watt and $0.24/watt. Disparate responses from small installers went as high as $0.61/watt in this region.
In ROS, many responses clustered tightly between $0.01/watt and $0.12/watt, similar to the other two regions. However, other clusters emerged between $0.15/watt and $0.25/watt, between $0.30/watt and $0.34/watt, and between $0.48/watt and $0.53/watt, including a large installer in this latter cluster.
Thus, a greater proportion of respondents estimated residential interconnection costs upwards of $0.30/watt in ROS than in the other regions.
For commercial roof-mounted systems, as shown in Figure B8:
In the Con Ed service territory, large installers estimated interconnection costs between $0.02/watt and $0.11/watt. Small installers provided disparate responses ranging from $0.21/watt to $0.81/watt.
In Long Island, large installers provided estimates of $0.02/watt, $0.05/watt, and $1.00/watt. The small installers provided disparate responses of $0.30/watt and $0.50/watt.
In ROS, responses were spread fairly evenly throughout the entire range of estimates between $0.01/watt and $0.60/watt. Most larger installers provided estimates between $0.08/watt and $0.20/watt, though one large installer indicated costs of $0.50/watt.
In general, in ROS, many responses exceed $0.08/watt, and a number of responses from both large and small installers exceeded $0.20/watt. This was not the case in the other geographic regions. Therefore, installers in ROS consistently reported higher interconnection costs than those reported by installers in the
C-8
Con Ed service territory and Long Island; that is, the high average cost reported is not the result of a small number of anomalous responses.
Ambiguity in Types of Interconnection Costs Considered
The survey defined interconnection costs as “labor costs associated with preparing and submitting interconnection applications,” and explicitly instructed respondents to exclude any fees associated with interconnection. Follow-up validation interviews assessed the extent to which respondents understood and consistently followed this definition. Respondents did not indicate that this definition was problematic or inappropriate. Only one interviewee revised their interconnection cost estimate as a result of targeted discussion regarding this definition.
However, the validation interviewees all remarked about potential ambiguities regarding the existence of “interconnection fees” in solar projects. It is possible that this ambiguity may be driving the high degree of variation in interconnection costs shown in Figures B3 and B8 of Appendix B, as well as the variation within and across the groups of large and small installers. Specifically, validation interviewees noted the following as potential “interconnection fees” or additional interconnection costs that could be plausibly included or omitted in any individual respondents’ definition of “interconnection costs:”
As defined in the survey, labor costs associated with preparing and submitting interconnection applications, i.e., paperwork costs. Some validation interviewees indicated that the applications were standard, and that the cost associated with this activity was minimal. However, others suggested a need for standardized interconnection applications, suggesting the existence of substantial variation across utilities that could contribute substantially to soft costs.
Interconnection application fees. Research suggests that utilities in New York State charge a standardized $750 interconnection application fee. However, validation interviewees noted that this fee is typically waived and that they rarely, if ever, encounter this fee. Note that a flat $750 fee would result in additional interconnection costs of approximately $0.11/watt for a 7 kW residential system, but a cost of less than $0.01/watt for a 200 kW commercial system. Even if these fees are waived for smaller, residential systems but not for larger commercial systems, they would be unlikely to significantly alter the estimates presented in this report.
Some validation interviewees indicated that utilities charged general “pay to play” interconnection charges for them to conduct interconnection after an application was approved, and that these charges constituted the bulk of interconnection costs for solar PV systems. However, other interviewees indicated that no such charges exist. This diversity in installers’ experience may also explain the substantial variation in interconnection costs across installers and/or across regions. For example, if such charges are routinely incurred in some ROS jurisdictions but not by Con Ed or utilities in Long Island, this may help explain the variation in interconnection cost estimates between these regions.
Costs for grid assessments/studies, and fees for transmission upgrades where required. The validation interviews explicitly inquired regarding interconnection costs associated with transmission upgrades, based on feedback received from the solar installer working with the study team. The interviewees indicated that utilities rarely required transmission upgrades for planned PV solar projects, and that therefore it was not typical for transmission upgrade costs to factor into the cost of a given system. However, some interviewees did note a cost associated with the utility conducting a study to determine the need for transmission upgrades. Because this cost may not apply to all systems, this may also be driving the differential between interconnection costs reported by respondents.
Wait times associated with utility-required interconnection-specific inspections. One validation interviewee noted that utilities may require additional, interconnection-specific inspections beyond the standard site/system inspection process, and that from the installer’s
C-9
perspective, these inspections represented potentially large labor costs associated with wait time for the utility inspector to arrive and complete the inspection.
All of the above may lead to substantial variation in interconnection costs. To the extent that these costs may be more prevalent across the utilities in ROS, as compared to Con Ed and Long Island, this may partially or fully explain the difference between interconnection costs in ROS and the other two regions.
C.2.3 Weighting Survey Data
Data for survey weighting was obtained from the OpenNY database.49 The study team derived survey weights from this dataset as follows:
1. All non-2016 installations were removed from the dataset, using the “Date Completed” field.
2. Installations were sorted into the three geographic segments analyzed (Con Ed service territory, Long Island, and ROS), and then into residential or non-residential sectors. Geographic sorting used the “County” field, while the residential/non-residential sorting used the “Sector” field.
3. Within each of the six sub-segments created through the previous steps, the “Contractor” field was analyzed to combine contractor names related to the same entity. Contractor names were correspondingly standardized to reflect a single, unique name per contractor.
4. Within each of the six sub-segments, the total nameplate capacity across all 2016 installations was calculated using the “Total Nameplate kW DC” field. Then, for each contractor participating in the segment, that contractor’s share of overall capacity installed in that sub-segment was derived using the sum of that contractor’s installed 2016 capacity, and the total 2016 capacity in that sub-segment. This figure reflects the weight used for that contractor in the segment.
When calculating “weighted percentiles” for survey responses, the analysis leveraged STATA’s ability to compute weighted percentiles for any array of data. Weighted percentiles are calculated similarly to unweighted percentiles, with the difference that each data point in the array is “repeated” commensurate with its weight. This methodology can be applied to other percentiles in addition to the median, which is the 50th percentile.50
In many instances, survey respondents did not respond to all questions posed to them in the survey. In these cases, the relative weights for each survey respondent in each sub-segment are automatically adjusted to reflect the proportion of installed capacity each respondent providing a response for each cost element represents, relative to the total installed capacity among all respondents providing a response for that cost element in that sub-segment.
The study team also analyzed weighting results based on the number of installations by contractor, rather than the total installed capacity (i.e., kilowatts installed) by contractor. This alternative weighting scheme did not result in markedly different results. The most significant changes occurred in ROS, especially in the commercial sub-segment. Most residential systems and many commercial systems in the Con Ed service territory and Long Island showed relatively little change, rendering the results from these two weighting approaches very similar in these segments.
49 “Solar Electric Programs Reported by NYSERDA: Beginning 2000.” https://data.ny.gov/Energy-Environment/Solar-Electric-Programs-Reported-by-NYSERDA-Beginn/3x8r-34rs Accessed February 8, 2017. 50 The weighted percentile approach is preferable to the weighted average approach for the same reason that medians may generally be preferable to averages (means): they diminish the influence of large outliers, which often occur in survey data. Further, the interpretation of a weighted median is intuitive in the context of the present analysis: the weighted median of a given cost element indicates that across all installed nameplate capacity for which survey respondents provided cost element data, 50 percent feature a higher cost than the weighted median, and 50 percent features a lower cost than the weighted median. The interpretation of the weighted median can be thought to be: “the midpoint of the distribution of costs for all installed kW of nameplate capacity in a given sub-segment is the weighted median,” when the weight is the proportion of installed capacity held by a contractor respondent, as described above.