Demand Savings Analysis Solar + Battery Projects what we have learned from our operating portfolio and how to stress test financial models using performance data Ali Chehrehsaz Dan Rosenberg
Transcript
Demand Savings AnalysisSolar + Battery Projects
what we have learned from our operating portfolioand
how to stress test financial models using performance data
Ali ChehrehsazDan Rosenberg
there is a lot of excitement in the battery storage market!
behind the meter battery installations are expected to
provide electricity bill savings by reducing electricity demand
charges
additionally, solar plus battery storage installations are expected
to provide more savings by reducing both usage and demand
charges
as battery storage is a new market, there are varying
methods in projecting combined solar plus battery storage
installations
this presentation describes how TerraVerde projects demand
savings from battery installations when paired with a solar installation by relying on
performance data from our operating portfolio
we will first start with background information and work our way
through a case study
to assess the savings projection, we first need to understand how
an electricity bill is calculated
electricity costs are calculated based on the rate schedule
applied to each utility electricity meter
the rate schedule is primarily determined by the usage profile
the usage profile is the measure of how fast, how much, and time
of use of electricity
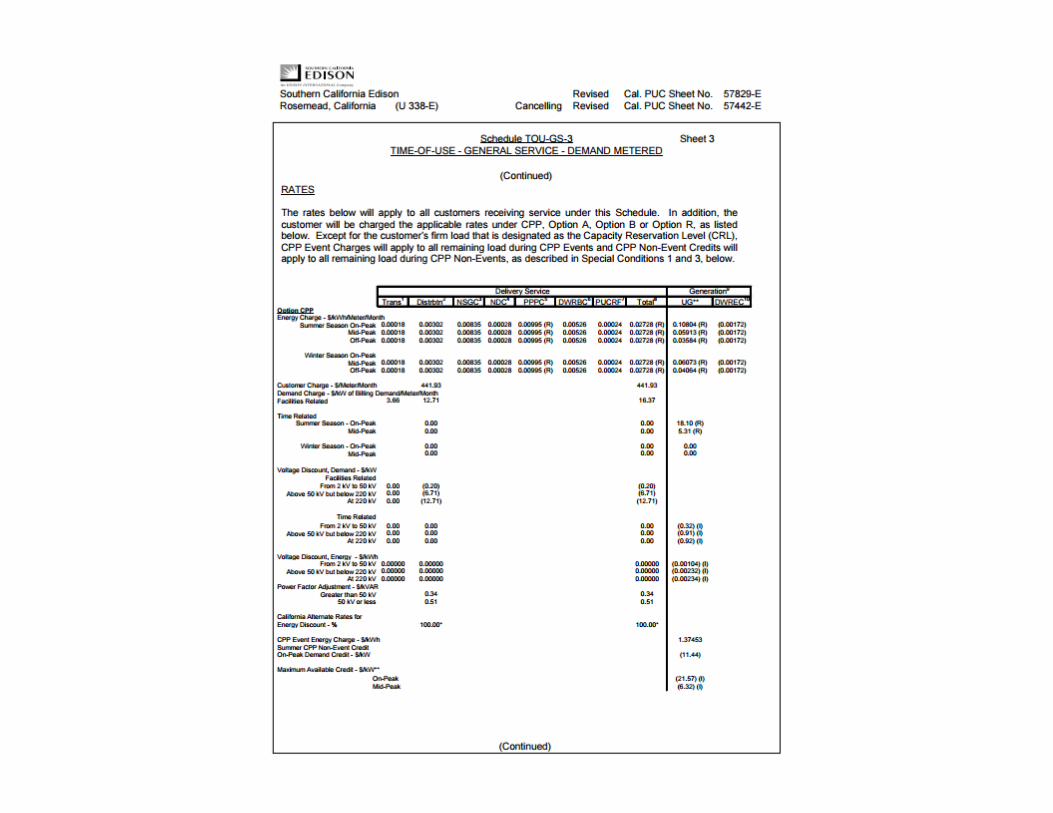
to better understand all the details involved in a rate schedule you will need to thoroughly read the documentation provided by
the electric utility
the next slide shows the Southern California Edison TOU-
GS3 rate schedule and all the components that need to be factored into calculating the
electricity bill
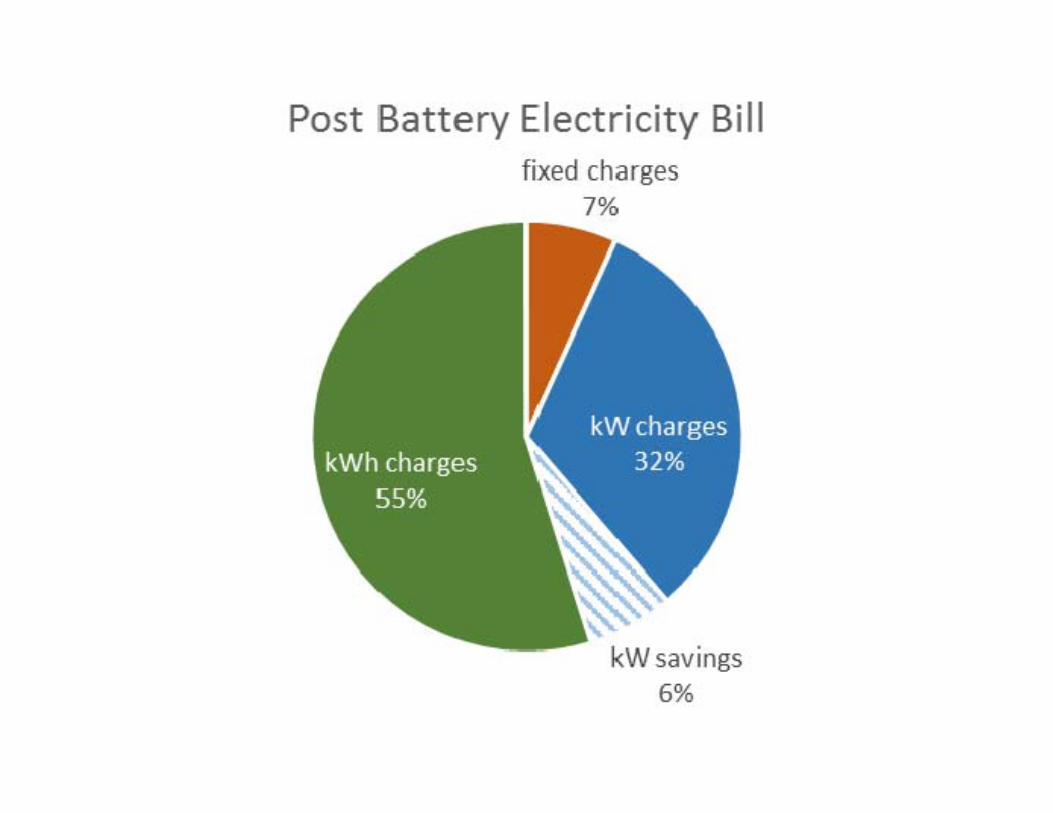
the rate schedule components can be summarized into three
categories: • Usage or kWh charges• Demand or kW charges• Fixed charges
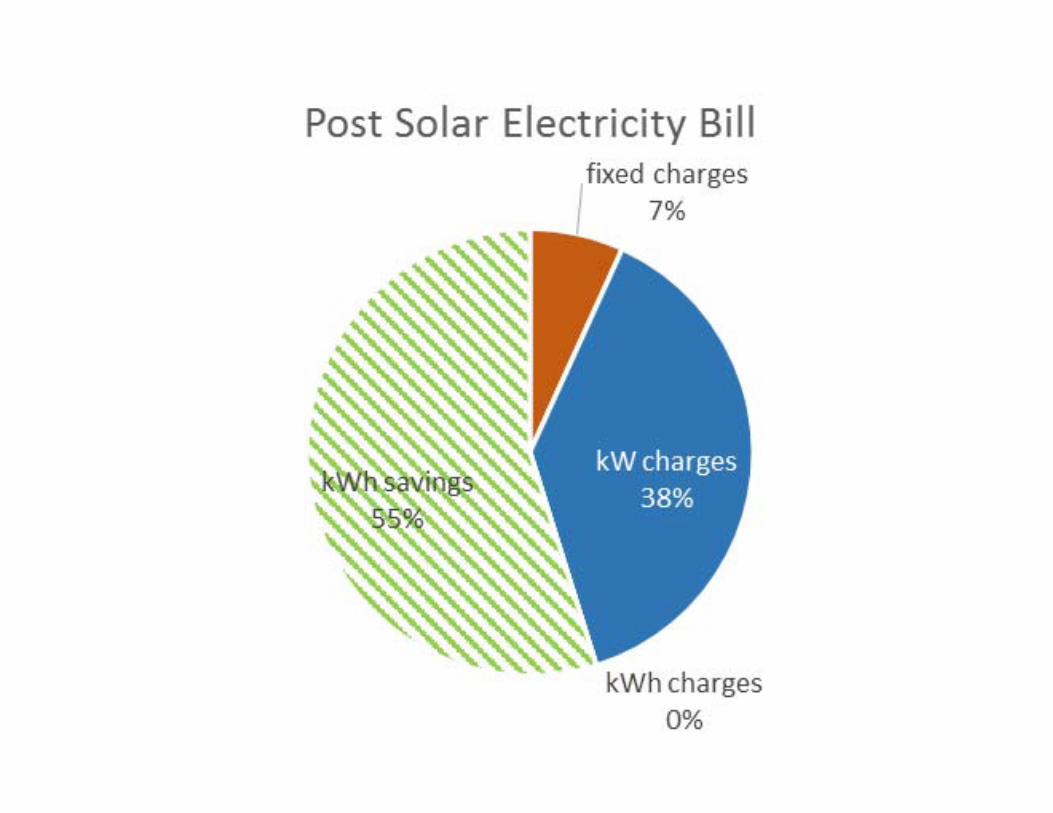
the ratio of three categories for the building in our case study are shown in the following pie chart
usage charges are the sum of total electricity drawn from the
grid and measured in kWh
demand charges are calculated based on the maximum demand for each month measured in kW
during any 15-minute interval
fixed charges are the sum of non variable costs including meter
costs
now that the basics of an electricity bill are covered, let’s
jump into the analysis
this presentation will walk through the following three
savings analysis for:• solar only savings• battery only savings• solar + battery savings
let’s start by showing a block diagram of typical behind-the-
meter solar installation
PV modules inverter
switchgear
utility meter
electric grid
school
the graph on the next slide shows the solar production and
building load profiles for a typical school day
solar production
building load without solar
building load with solar
electricity delivered to grid
the building load reduction plus the excess solar production
delivered to the grid results in electricity bill savings which are
shown on the next slide
as shown on the last slide the solar installation is capable of
reducing the entire usage (kWh) charges of the electricity bill
solar installations are also able to reduce the instantaneous building demands, however demand (kW)
savings are not accounted in savings projections due to intermittent nature of solar
production
why does the solar production intermittency risk prevent
accounting for demand savings?
remember, demand charges are calculated based on the
maximum demand (kW) for each month as measured during any
15-minute interval
therefore, temporary cloud coverage during a typical
operational day that reduces solar production would result in a
demand spike measurement on the utility meter
since the utility bills for demand charges for the one time highest 15-minute interval per month, the load spike during the could event would set the maximum demand
for the month
back to the bill, the next slide shows the electricity bill pre and
post solar
if all assumptions hold, the electricity bill would be reduced to $35,295 (sum of kW charges and Fixed charges) per year for the
life of the solar installation
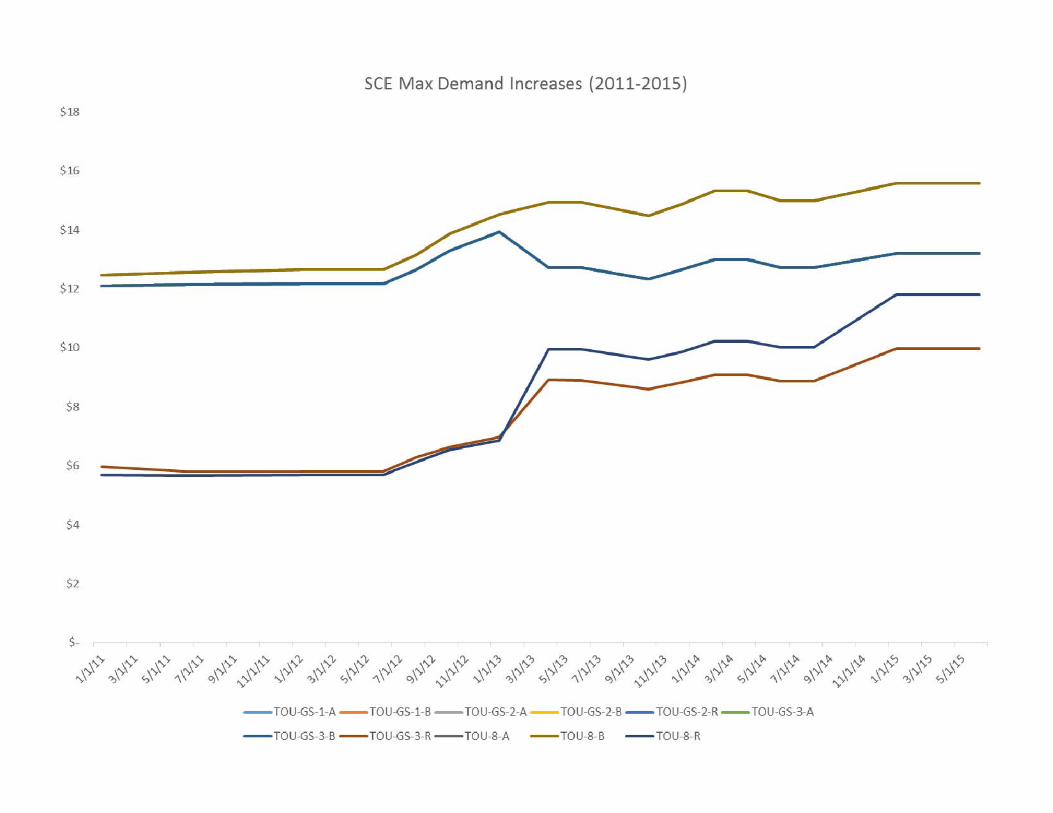
unfortunately, the kW charges are expected to increase and as a result the post solar electricity bill
will continue to increase
the next slide shows the growth of the kW charges in SCE territory for a sample of the rate schedules
to reduce the impact of kW charge increases and provide
additional savings on the electricity bill we will look to
battery storage systems
before we see how a battery system complements a solar
system, let’s first look at a stand alone battery system
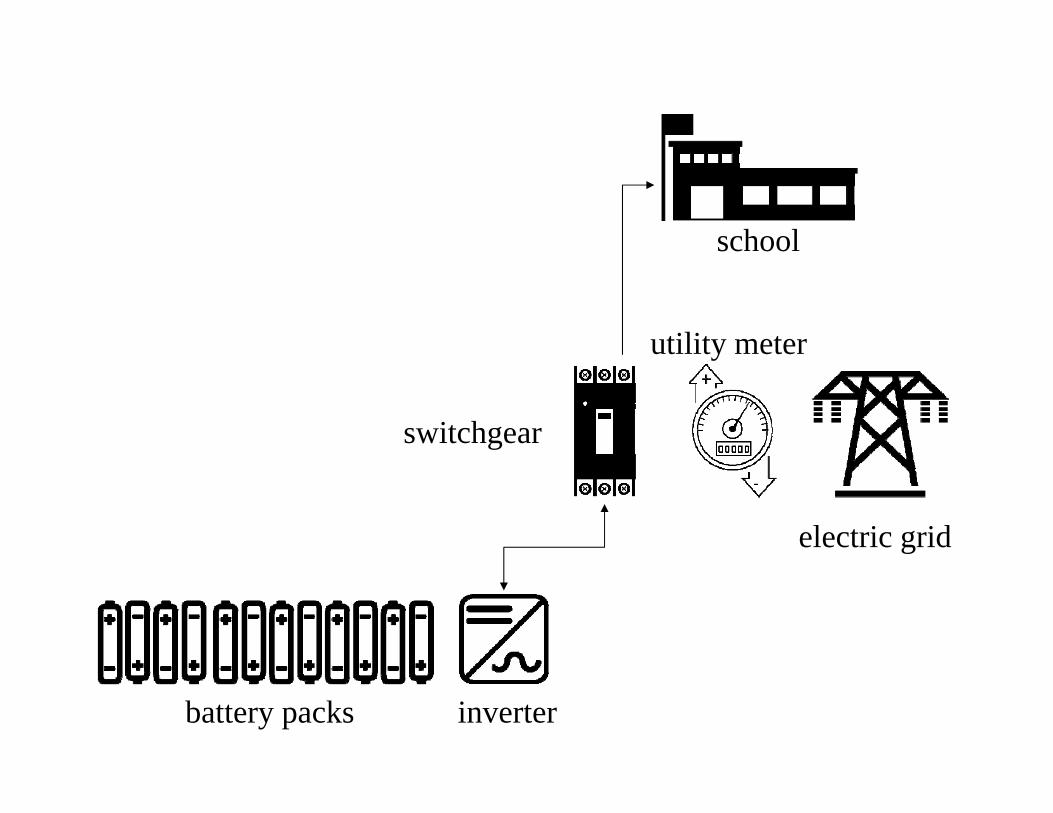
the next slide shows a block diagram of a behind-the-meter
battery installation
inverterbattery packs
switchgear
utility meter
electric grid
school
the graph on the next slide shows the charge/discharge and building load profiles for a battery
installation
battery discharging
battery charging
max demand pre battery
max demand post battery
the building max demand reduction per month results in kW charge reductions as shown on
the next slide
the electricity bill savings as a result of demand reduction is
shown next
as shown on the last slide, the kW charges are reduced by $5,031 on an annual basis
you may have noted a small increase in kWh charges; the increase is due to round-trip
efficiency losses of the battery
we have now covered the basics of stand alone behind-the-meter
solar and battery installations
let’s get into the exciting portion of the presentation and show what happens when solar and battery installations are paired!
again, we will start with a block diagram
inverterbattery packs
switchgear
utility meter
electric grid
school
PV modules inverter
and next is the demand and usage profiles of the same
building for the same day; scroll back up to compare the profile
differences
solar production
max demand before solar + battery
max demand after solar + battery
the next slide shows the reductions in kWh and kW
charges as a result of solar and battery installations
you may have also noticed in reduction in Fixed charges which is due to rate schedule change
in this scenario, the combination of solar and battery installations
result in sufficient demand reduction to allow the building to switch from a GS3 to a GS2 rate schedule which has lower Fixed,
kW, and kWh charges
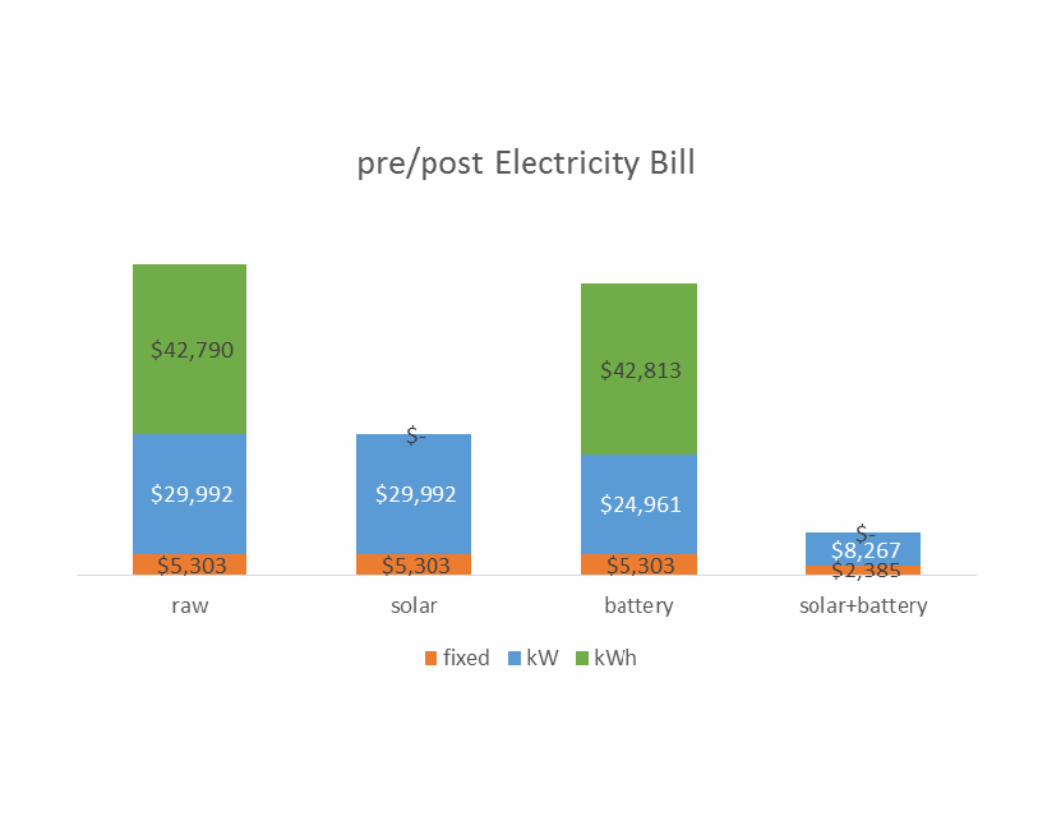
the next slide shows the electricity bill savings from solar
and battery combination in comparison to previous scenarios
the savings exhibit a compelling argument for pairing solar with
battery installations
the remaining electricity bill is a fraction of the original bill
while the opportunity and cost savings look attractive, it is critical
to explore the assumptions behind the savings projections
a key assumption explored in this presentation is the intermittent
performance of solar installations and the impact on battery
demand reduction
when projecting demand reductions in solar plus battery
installations, the model assumes typical year solar production
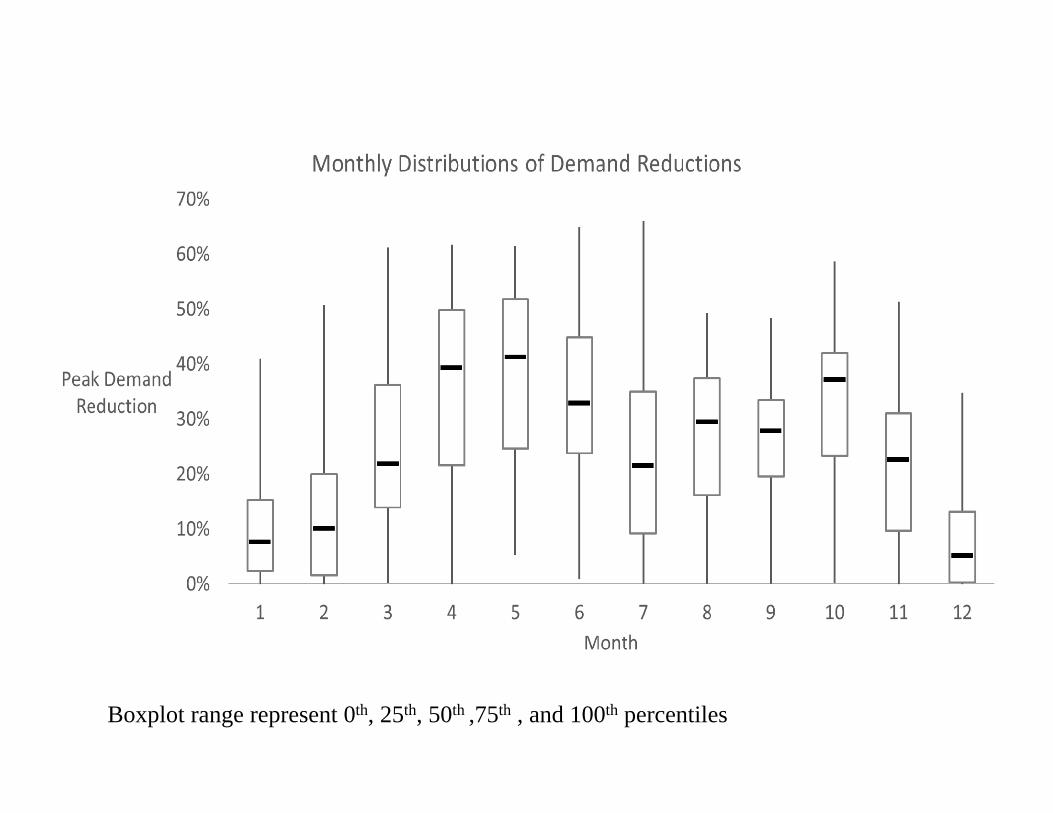
the typical year solar model for this scenario would result in monthly demand reductions
ranging from min 5% in December to max 66% in April
that means solar production without the help of a battery is capable of creating demand reduction and therefore kW charge savings, if typical
performance is realized per models
this is a highly optimistic assumption which we are able to modify based on the performance
data from our portfolio of operating solar installations
the data presented is collected from the operating solar installations managed by
TerraVerde
the boxplot on the next slide shows the percentiles of max
demand reduction, by month, for all of our portfolio sites
Boxplot range represent 0th, 25th, 50th ,75th , and 100th percentiles
the following slide shows the same data but the sites are
grouped by portfolio of financed projects
Boxplot range represent 0th, 25th, 50th ,75th , and 100th percentiles
as shown from the last slide, the range of the average demand reduction gets much smaller
when a portfolio of installations are evaluated
the upcoming slide shows how much maximum demand
decreases, depending on the hour when it occurs
Boxplot range represent 0th, 25th, 50th ,75th , and 100th percentiles
the following slide shows what time of day maximum demand occurs with and without solar
as seen on the previous slides, a solar installation is capable of
reducing and shifting peak demand
the following slide is a heat map showing the expected reduction in demand based on the month and
hour it occurs
Month1 2 3 4 5 6 7 8 9 10 11 12
6
7
8
9
10
11
Hour 12
13
14
15
16
17
18
19
20
Spring Afternoon
Average Demand Reduction Percentage
0% 47%
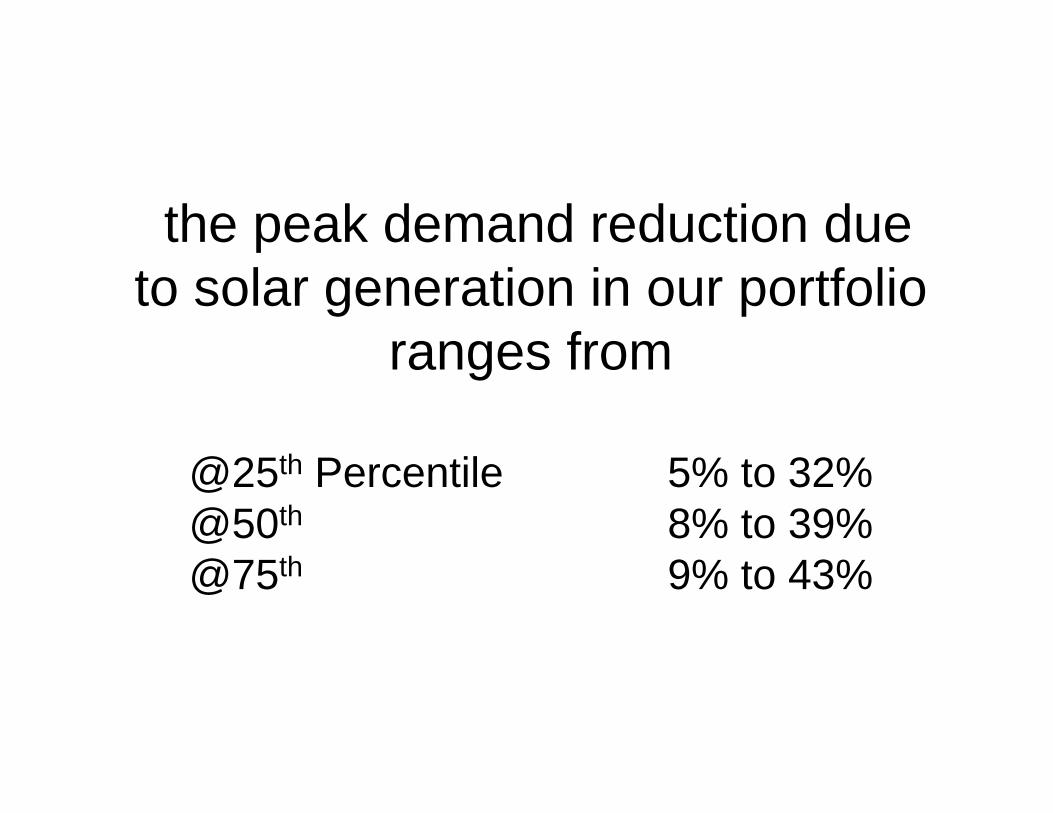
the peak demand reduction due to solar generation in our portfolio
ranges from
@25th Percentile 5% to 32%@50th 8% to 39%@75th 9% to 43%
as shown in the last slide, the peak demand reduction observed from operating solar installations is lower in most months than the modeled values based on TMY
data
therefore, to avoid over-estimating savings, we apply the 25th and 50th percentile limits to the post solar demand profile
prior to testing the peak demand reduction using a battery
installation
the next slide shows the reduction in savings from the theoretical scenario assuming perfect solar performance per
TMY data
as seen above, the residual electricity bill for the 25th
percentile scenario is increased by $4,532 per year (43%) as compared to the TMY model
savings
the reduced projected savings from the combined solar and battery reduces the return on
investment for the project
while the reduced ROI is less attractive, it should be treated as
a sound stress test of the financial models and part of the due
diligence process
in closing, we would like to remind you that the data
presented here are from our operating solar portfolio with a
system uptime of >99%
additionally, the portfolio presented is specific to California public school districts in various
climate zones
to perform a stress test on the financial return of solar and
battery installations the analysis must be based on dataset collected from applicable
buildings in similar climate zones
finally, we need to emphasis for simplicity of presentation, we
omitted to highlight other benefits of combined solar and battery
installations including charge/discharge arbitrage and
Demand Response opportunities
About TerraVerde Renewable Partners
Since 2009, TerraVerde has been California’s leading independent solar energy advisor
Recognized leader in project development consulting services in Energy Efficiency, Solar, and Energy StorageUnique engagement model mitigates project risks during developmentIn house engineering, structured finance, financial modeling, Design-Build & PPA contracts, owner’s representative project management, and Asset ManagementCompleted the first solar plus battery storage school project in California for Burton City Schools in Porterville and several more under installation and development
99
Contact Information
Ali Chehrehsaz, EVP Operations
TerraVerde Renewable Partners, LLC1100 Larkspur Landing, Suite 155