1 Solar Energetic Particles: Science and Applications Olga E. Malandraki Leader of ISEST Working Group 6 on ‘Solar Energetic Particles (SEPs)’ National Observatory of Athens, IAASARS, Greece National Observatory of Athens (NOA) VarSITI Completion General Symposium June 10-14, 2019, Sofia, Bulgaria
Transcript
1
Solar Energetic Particles:
Science and Applications
Olga E. Malandraki
Leader of ISEST
Working Group 6 on
‘Solar Energetic Particles
(SEPs)’
National Observatory of Athens,
IAASARS, Greece
National Observatory of Athens (NOA)
VarSITI Completion General Symposium
June 10-14, 2019, Sofia, Bulgaria
ISEST/MINIMAX24
WORKING GROUP 6, WG6:
‘SOLAR ENERGETIC PARTICLES (SEPS)’
Scientific Objectives
The main objective of this Working Group, directly aligned
with the ISEST science objectives, is the improvement of
our understanding of the origin, acceleration and
transport of energetic particles in the heliosphere, in
association with Coronal Mass Ejections (CMEs) and
Corotating Interaction Regions (CIRs) propagation and
evolution.
2
SCIENTIFIC ISSUES ADDRESSED WITHIN ISEST/WG6 - RESULTS
SEP release time and Radio bursts (Kouloumvakos et al., 2015)
Potential SEP acceleration by shock compression (Kozarev et al. 2015; Schwadron et al. 2015)
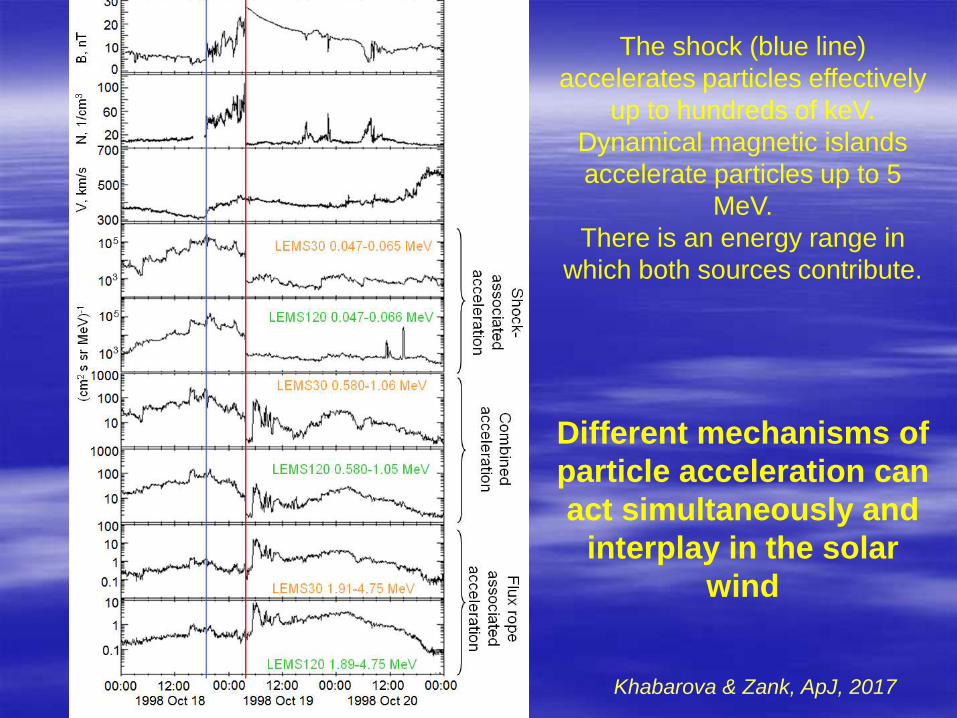
Magnetic cavities, current sheets and magnetic islands as local sources of energetic particles in the solar wind (Khabarova et al. 2015, 2016, 2017, 2018; Malandraki et al. 2019)
Gamma-ray flare events and SEPs: FERMI era (Share et al. 2019)
Triangulation of shocks in 3-D (Plotnikov et al. 2017)
Joint Ne/O and Fe/O analysis to diagnose large SEP events (Tan et al. 2017)
What governs the longitudinal spread of SEPs? (Cohen et al. 2017)
3-D Modeling of SEP propagation within the heliosphere (Dalla et al. 2017)
ENLIL and 3-D test particle model (Thomas et al. 2018)
Are abundance enhancements power-law in A/Q?
Compare FIP plots of SEPs and slow solar wind (Reames et al. 2017)
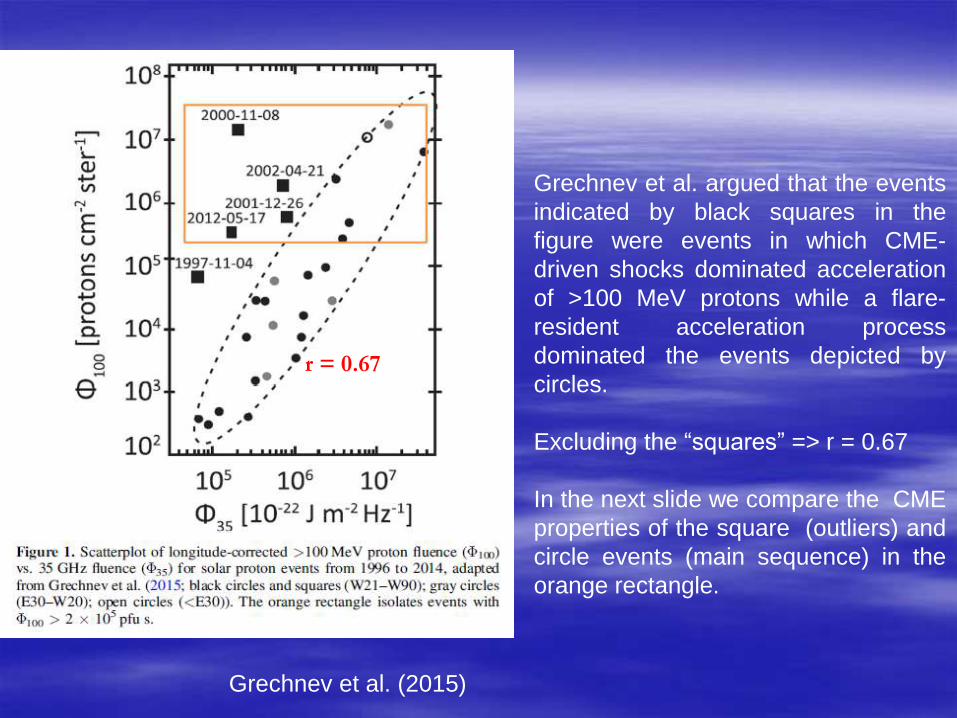
Flare vs Shock Acceleration of high-energy protons in SEP events (Cliver et al. 2016)
Extreme CME kinematics and SEP spectra: 2012 July 23, 2017 Sept 10 events (Gopalswamy et al. 2016, 2018)
Extreme solar eruptions and their space weather consequences (Gopalswamy 2017)
The long-lasting injection during the widespread 2013 Dec 26 SEP event (Dresing et al. 2018)
SEP event forecasting: With Flare X-ray peak ratios (Kahler & Ling, 2018) ESPERTA-based forecast (Laurenza et al. 2018) HESPERIA-based forecast (Malandraki et al. 2018; Nunez et al. 2017, 2018,
BBC SWS Regional Network) HESPERIA REleASE forecast, 2017 Sept 10 SEP event Key Open Questions and Future Missions
3
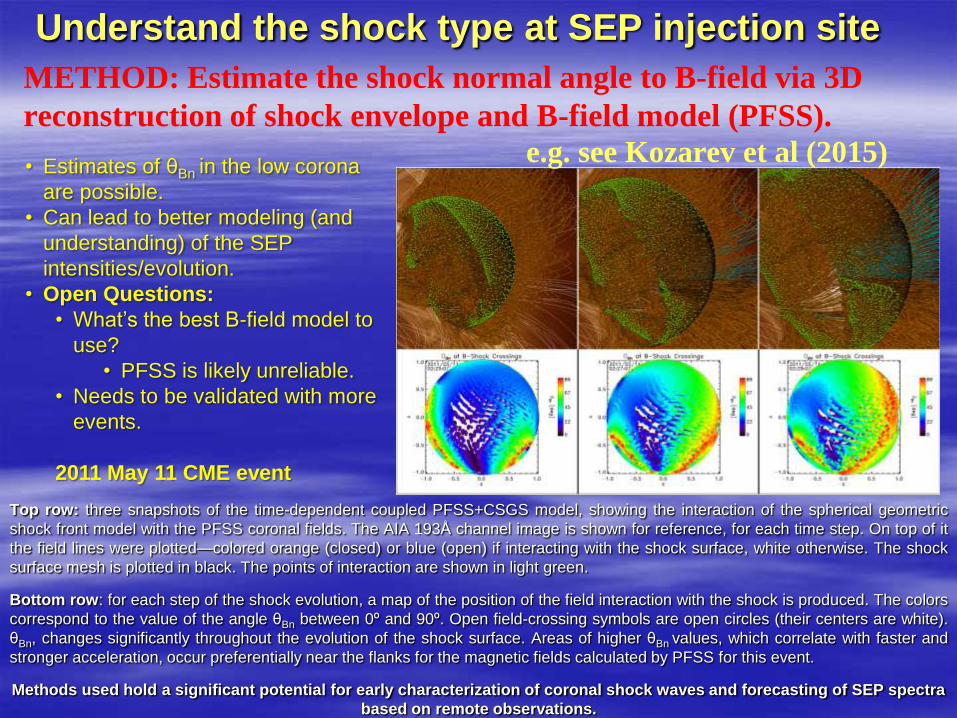
Understand the shock type at SEP injection site
Top row: three snapshots of the time-dependent coupled PFSS+CSGS model, showing the interaction of the spherical geometric
shock front model with the PFSS coronal fields. The AIA 193Å channel image is shown for reference, for each time step. On top of it
the field lines were plotted—colored orange (closed) or blue (open) if interacting with the shock surface, white otherwise. The shock
surface mesh is plotted in black. The points of interaction are shown in light green.
Bottom row: for each step of the shock evolution, a map of the position of the field interaction with the shock is produced. The colors
correspond to the value of the angle θBn between 0º and 90º. Open field-crossing symbols are open circles (their centers are white).
θBn, changes significantly throughout the evolution of the shock surface. Areas of higher θBn values, which correlate with faster and
stronger acceleration, occur preferentially near the flanks for the magnetic fields calculated by PFSS for this event.
Methods used hold a significant potential for early characterization of coronal shock waves and forecasting of SEP spectra
based on remote observations.
• Estimates of θBn in the low corona
are possible. • Can lead to better modeling (and
understanding) of the SEP
intensities/evolution.
• Open Questions:
• What’s the best B-field model to
use?
• PFSS is likely unreliable.
• Needs to be validated with more
events.
2011 May 11 CME event
METHOD: Estimate the shock normal angle to B-field via 3D
reconstruction of shock envelope and B-field model (PFSS).
e.g. see Kozarev et al (2015)
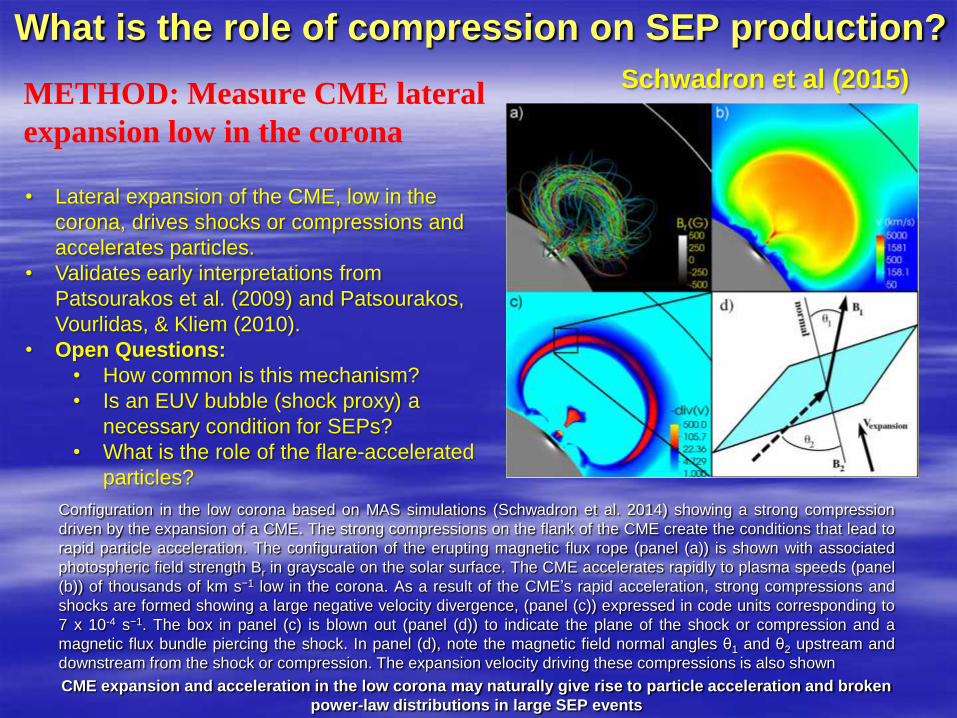
What is the role of compression on SEP production?
Configuration in the low corona based on MAS simulations (Schwadron et al. 2014) showing a strong compression
driven by the expansion of a CME. The strong compressions on the flank of the CME create the conditions that lead to
rapid particle acceleration. The configuration of the erupting magnetic flux rope (panel (a)) is shown with associated
photospheric field strength Br in grayscale on the solar surface. The CME accelerates rapidly to plasma speeds (panel
(b)) of thousands of km s−1 low in the corona. As a result of the CME’s rapid acceleration, strong compressions and
shocks are formed showing a large negative velocity divergence, (panel (c)) expressed in code units corresponding to
7 x 10⁻⁴ s−1. The box in panel (c) is blown out (panel (d)) to indicate the plane of the shock or compression and a
magnetic flux bundle piercing the shock. In panel (d), note the magnetic field normal angles θ1 and θ2 upstream and
downstream from the shock or compression. The expansion velocity driving these compressions is also shown
CME expansion and acceleration in the low corona may naturally give rise to particle acceleration and broken
power-law distributions in large SEP events
Schwadron et al (2015)
• Lateral expansion of the CME, low in the
corona, drives shocks or compressions and
accelerates particles.
• Validates early interpretations from
Patsourakos et al. (2009) and Patsourakos,
Vourlidas, & Kliem (2010).
• Open Questions:
• How common is this mechanism?
• Is an EUV bubble (shock proxy) a
necessary condition for SEPs?
• What is the role of the flare-accelerated
particles?
METHOD: Measure CME lateral
expansion low in the corona
Zank et al., ApJ, 2014, 2015; le Roux et al., ApJ, 2015, 2016;