235
Solar Energy Seminar Summit County Builders Association

Solar Energy Seminar
Summit County Builders
Association

2
AgendaContext: fossil fuels cost, availability, and environmental issuesSolar Resource: geometry of the sun's path, Breckenridge/Frisco weather data.Passive Solar Heating and Cooling Load AvoidanceDaylightingNatural VentilationSolar Water Heating and Solar Space HeatingSolar Ventilation Air HeatingPhotovoltaicsFinancial Incentives: Federal and Utility rebates and tax credits

3
Colorado Energy Use
1,351,463 billion BtuTotal Colorado
4.8 millionPopulation
297 million BtuPer Capita
http://tonto.eia.doe.gov/state/state_energy_profiles.cfm?sid=CO

4
Colorado Energy Use (billion btu)
317,421
289,677
368,433
375,929
ResidentialCommercialIndustrialTransportation

5

6
Fossil Fuel Resources and Reserves
Total Resource Base
Undiscovered Resources
Uneconomical Resources
Not ProvedReserves
Discovered Resources
Economical Resources .
ProvedReserves
NP
P -
CPNot Producing, Producing, Cumulative Production to date
Proved Undeveloped, Proved Developed

7
Fossil Fuels Exhaustion Time
te = ln{Eres ln(1+I)/E1 + 1}/ln(1+I)Eres= amount of resourceE1= first year extraction rateI= rate of increase in consumption
Natural Gas, E1= 440 million cubic feet/year, I=2%
Colorado Proved Reserves 16596 million cubic feet, te = 28.2 years
Coal, E1 = 1.67 million tons/year, I = 2%Colorado Proved Reserves 382 million tons, te = 86.3 years
http://tonto.eia.doe.gov/state/state_energy_profiles.cfm?sid=CO

8
Abundance of cheap fossil fuels is not a blessing, it is a problem.

9
0
2
4
6
8
10
12
Residential Gas Commercial Gas
Residential Gas 6.14 8.37 5.62 6.61 8.47 10.29
Commercial Gas 5.37 7.71 4.82 5.93 7.48 9.39
2000 2001 2002 2003 2004 2005
Colorado Natural Gas Prices
$/ t
hous
and
cubi
c fe
et
http://tonto.eia.doe.gov/state/state_energy_profiles.cfm?sid=CO

10
Colorado Electric Rates
0
2
4
6
8
10
12
2005 2006
Residential Electricity Commercial Electric
Residential Electricity 8.64 9.76
Commercial Electric 6.99 8.57
Nov-05 Nov-06
c/kW
h
http://tonto.eia.doe.gov/state/state_energy_profiles.cfm?sid=CO

11
The Future of Energy
18801860
500
0
1000
1500
1900 1920 1940 1960 1980 2000 2020 2040 2060
Surprise
Geothermal
Solar
Biomass
Wind
NuclearHydroGas
Oil &NGL
CoalTrad. Bio.
Exaj
oule
s
Source: Shell, The Evolution of the World’s Energy Systems, 1995

12
Renewable Energy Pathways
Wind Energy
Solar Photovoltaics
Solar Thermal Electric
Solar Buildings
Biomass Electric
Biomass Transportation Fuels
Geothermal Energy
Hydropower
Source: Technology Opportunities to Reduce U.S. Greenhouse Gas Emissions, Oct 1997

13
Renewable Energy Cost Trends
100
80
60
40
20
Cos
t of e
lect
ricity
(¢/k
Wh)
0
1980 1985 1990 1995
Photovoltaics4
3
2
1
0Cos
t of e
than
ol ($
/gal
)1980 1985 1990 1995
Bioethanol40
30
20
10
0Cos
t of e
lect
ricity
(¢/k
Wh)
1980 1985 1990 1995
Wind
Cos
t of e
lect
ricity
(¢/k
Wh) 10
8
6
4
2
0
1980 1985 1990 1995
Geothermal
10
30
40
20
Cos
t of e
lect
ricity
(¢/k
Wh)
01980 1985 1990 1995
Solar Thermal
0
5
10
15
20
Biomass Power
Cos
t of e
lect
ricity
(¢/k
Wh)
1980 1985 1990 1995
Source: Billman, Advances in Solar Energy submission, 1/8/99

14
25.7
16.8
3 2.1 1.6 1.4 1.2 0.60
5
10
15
20
25
30
Source: REPP,Worldwatch 1998/99
Nuclear
WindSolar PV
GeothermalNat. GasHydroOilCoal
Global Growth by Energy Source, Annual Average, 1990-98
Fastest Growing Energy Source in the World

15
World PV Cell/Module Production
050
100150200250300350400
Rest of World 3 4 4.7 5 4.6 4.4 5.6 6.35 9.75 9.4 18.7 20.5 23.42 32.6
Europe 6.7 7.9 10.2 13.4 16.4 16.55 21.7 20.1 18.8 30.4 33.5 40 60.66 86.38
Japan 12.8 14.2 16.8 19.9 18.8 16.7 16.5 16.4 21.2 35 49 80 128.6 171.22
United States 11.1 14.1 14.8 17.1 18.1 22.44 25.64 34.75 38.85 51 53.7 60.8 74.97 100.3
Total 33.6 40.2 46.5 55.4 57.9 60.09 69.44 77.6 88.6 125.8 154.9 201.3 287.65 390.5
1988 1989 1990 1991 1992 1993 1994 1995 1996 1997 1998 1999 2000 2001
MegaWattts

16

17
Advantages of Renewable Energy
Cost-effective: least cost alternative in many casesZero emissions on siteEmploys local trades rather than exporting jobs to import energyAvoids fuel delivery and handling risksNo fuel cost fluctuationsEnergy Security: no fuel supply interruptionsReliability: redundant power supplies

18
Renewables go hand-in-hand with Energy Efficiency
Conventional Efficient Integrated efficiency &renewable
Conventional energy use
Renewable energy useQuanity
ofEnergy

19
Building Energy Use
SchoolGrocery Store
OfficeHealth Care
LodgingMercantile
Restaurant
Heating Cooling Ventilation Hot Water Lights Equipment

Building Design

DaylightingLight Shelves

Soluminaire
Durant Middle SchoolNorth Carolina
DaylightingSkylights

• Produces the cost savings
• Provides user more control
• Continuous Dimming– Low voltage control– IC control ballasts ($$)
• Multi-level switching• Produces the cost
savings• Provides user more
control
DaylightingControls

Overhangs
Silver Hill Office Building, Golden COOverhangs on south, none on north.

Building Orientation
• Sun is maximum on the south side in winter, maximum on the roof, east and west in summer.

7
Suntempered Direct Gain
Sunspace Thermal Storage Wall
Principles of Passive Solar HeatingPrinciples of Passive Solar Heating

Direct Gain
NREL Thermal Test Facility

Sunspace

Trombe Wall
NREL Solar Energy Research Facility

Cooling Load Avoidance

Selective Glass

Passive Solar Design Tools
Computer Simulations:
DOE2, EnergyPlus, E-Quest
Energy10
Great Sand Dunes National Monument, CO

1
Solar Ventilation Air Preheating
Transpired Solar Collector

2
Sun warms the surface
4 - 6 in.
Heat conducts from surface to thermal “boundary layer” of air 1 mm thick
Boundary layer is drawn into hole by fan before heat can escape by convectionSouth wallSolar wall
Boundary layer - 1 mm
Transpired Collector Principle

3
Panel Properties
Panels may be aluminum or steelOver 2,600 perforations per m2
Corrugated to increase structural rigidity

4
Typical Installation
Supports create plenumFlashing around edgesInstalled over or around
existing wall openingsInstalled over any non-
combustible wall material
Easy installation – no special skills or tools needed

Solar Ventilation Air Preheating System

6
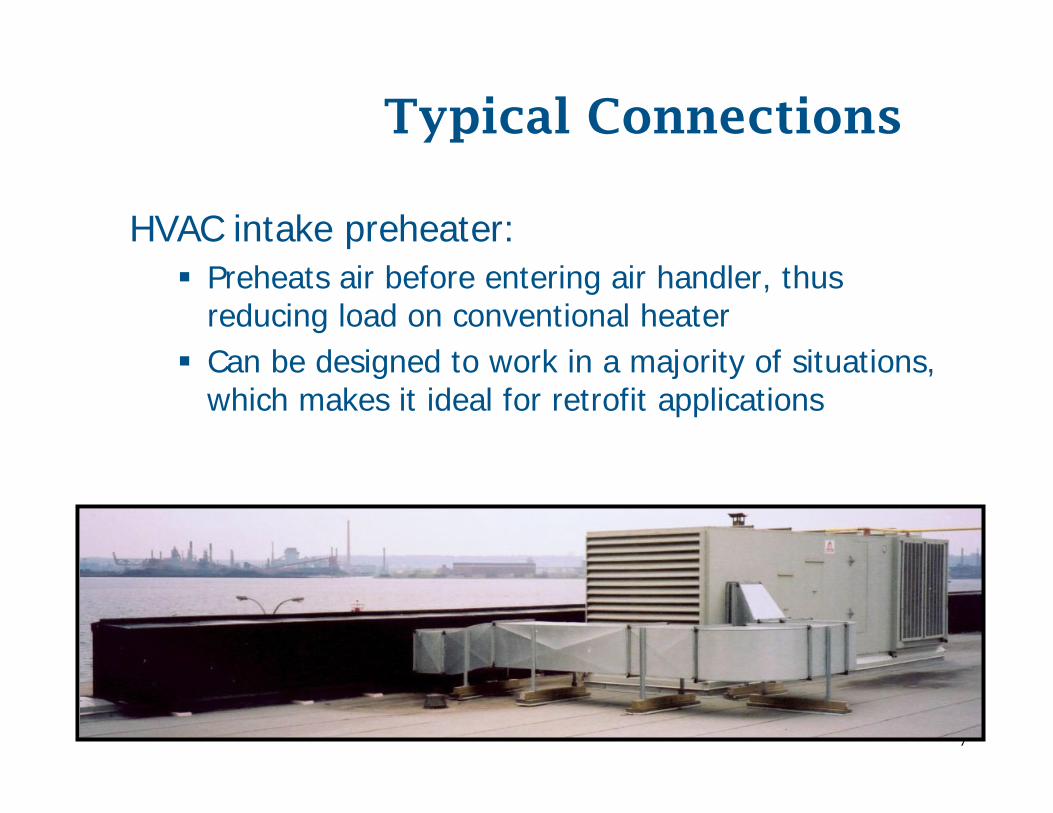
Typical Connections
Heated air supplied directly into building:Solar-heated air is supplied directly to the building via a perforated flexible ductDucting destratifiesceiling heat reducing heating load Suitable for both new and retrofit applications
7
Typical Connections
HVAC intake preheater:Preheats air before entering air handler, thus reducing load on conventional heaterCan be designed to work in a majority of situations, which makes it ideal for retrofit applications

8
Bypass Damper

9
Winter Operation

10
Summer Operation
Bypass damper brings outside air directly in, bypassing solar wall.
Unheated Air

11
Air Temperature Rise

12
Typical Applications
Preheating ventilation air for:Industrial and maintenance buildings.School and institutional buildings.Apartment buildings.Commercial and penthouse fans.Aircraft hangers.
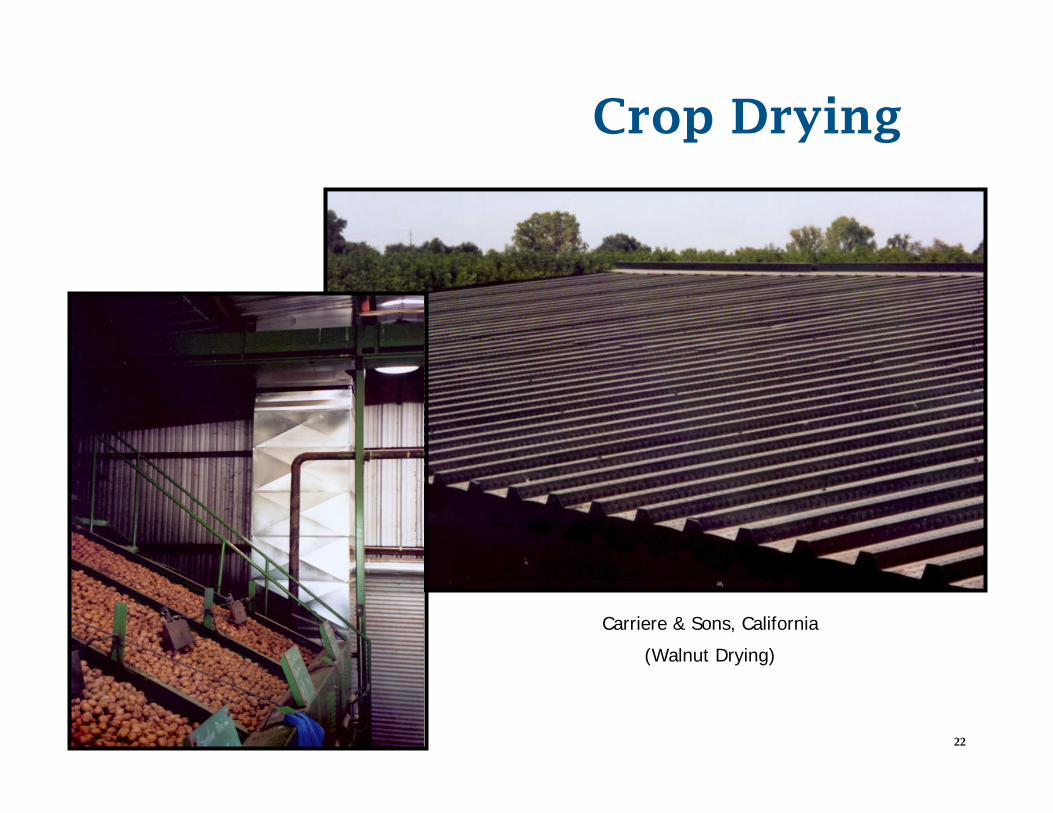
Crop dryingProcess air heatingCombustion Air pre-heating

13
Industrial
Bombardier’s Canadair Assembly Plant – Ville St-Laurent, QC

14
Commercial
Wasag Building - Switzerland

15
Farming
Piggeries – Eastern Townships, QC

16
Schools
Alaittuq High School – Rankin Inlet, Nunavut

17
Retails
BigHorn Home Improvement Center – Silverthorne, CO
Winner of the 2001 AIA Top 10 Green Projects
Award

18
Military
Fort Carson – Colorado Springs, CO

19
Community Centers
Rapid City Community Center – Rapid City, SD

20
Apartment Buildings
Windsor Housing Authority – Windsor,
ON

21
Residential
Ski Chalet – Ellicottville, NY
22
Crop Drying
Carriere & Sons, California
(Walnut Drying)

23
Collector Sizing
Ac = Vbldg / v wall
Ac = solar collector area (ft 2), might be limited by available wall area.
V bldg = building outside air flow rate (CFM)v wall = per-unit-area airflow through wall
(typically 4 to 8 CFM/ft2. If wall area is sufficient, use the lower value of 4 CFM/ft2).

24
kWh/m2/year

25
Thermal Energy Delivery
Qsolar = A c q useful (#days per week)/7Q saved = Qsolar /η heating
Qsolar = annual heat delivery of solar system (kWh/yr)
η heating = heating system efficiency (typically 70%)

26
Parasitic Fan Power
Q fan = A c q fan (# of hours/year)
q fan = fan energy required to pull air through collector (typically 1 W/ft2)

27
Advantages of Transpired Collectors
Very low cost.Extremely reliable (no moving parts but fan).No maintenance.High Efficiency (up to 80%). Operates near ambient temperature.No problems with freezing or fluid leaks.No storage required.

28
…other benefits
Recovers heat lost through south wall
Ventilation air introduced high in high-bay space• destratifies air
• lower ceiling and exhaust air heat loss.
Positive pressure on building• reduces incoming drafts
• Increases comfort.
Looks better than an old, dilapidated facade

29
Solar Ventilation Preheat System Costs
Installation Costs in Retrofit ApplicationsAbsorber $9.50/ft2
Supports, Flashing, Etc. $2.50/ft2
Installation $4.00/ft2
Other Costs $4.00/ft2
Total $20.00/ft2

30
Natural Gas @ $7.50/Mbtu & 70% eff = $0.032/kWhEnergy
Energy Cost $/kWh

31

32
Case Study: NREL Chemical Storage
300 ft2
3,000 CFM $6000 cost63% measured efficiencySaves 14,310 kWh/yearSaves $726/year of electric heat (no flames allowed in building)Payback = 8.3 years

33
Case Study: Ford Engine Assembly
20,000 ft2
Savings of 5,811 Mbtu/year Saves $30,000/year
– 17% of plant’s air heating costs
5 year payback period

34
Case Study: GM Battery Plant
4,520 ft2
40,000 CFM Saves 940 Mbtu/year
– Qsolar = 678 Mbtu/yr– Q htrec = 262 Mbtu/yr
Saves $10,200/yearCost $66,530
($14.72/ft2), including duct modifications
Payback period = 6 years

35
Case Study: US Bureau of Reclamation
• Water treatment facility in Leadville, Colorado.
• Estimated savings are more than $4,000 per year
• 7 year simple payback.

36
Case Study: Federal Express Denver, CO
5,000 ft2 (465 m2) system
45,000 cfmsaves 2,300 million
Btu/yearSaves $12,000 per
year lease payments
$4,800/ yearFEDEX saves
$7,200 /year for the 10 year term of the lease.

37
Design Considerations
South-facing is best, but not necessary
+/- 20° of south gives 96-100% of south+/- 45° of south gives 80-100% of south
Black is best, but a wide choice of dark to medium colors may be used with efficiency loss of less than 10%
Windsor Housing Authority, Canada

38
Design Considerations
Black
Classic Bronze
Chocolate Brown
Hartford Green
Medium Bronze
Boysenberry
Rocky Grey
Regal Blue
Forest Green
Hemlock Green
Slate Blue
Redwood
Teal
Slate Grey
Patina Green
Standard Colors
* Actual colors may differ from displayed colors
39
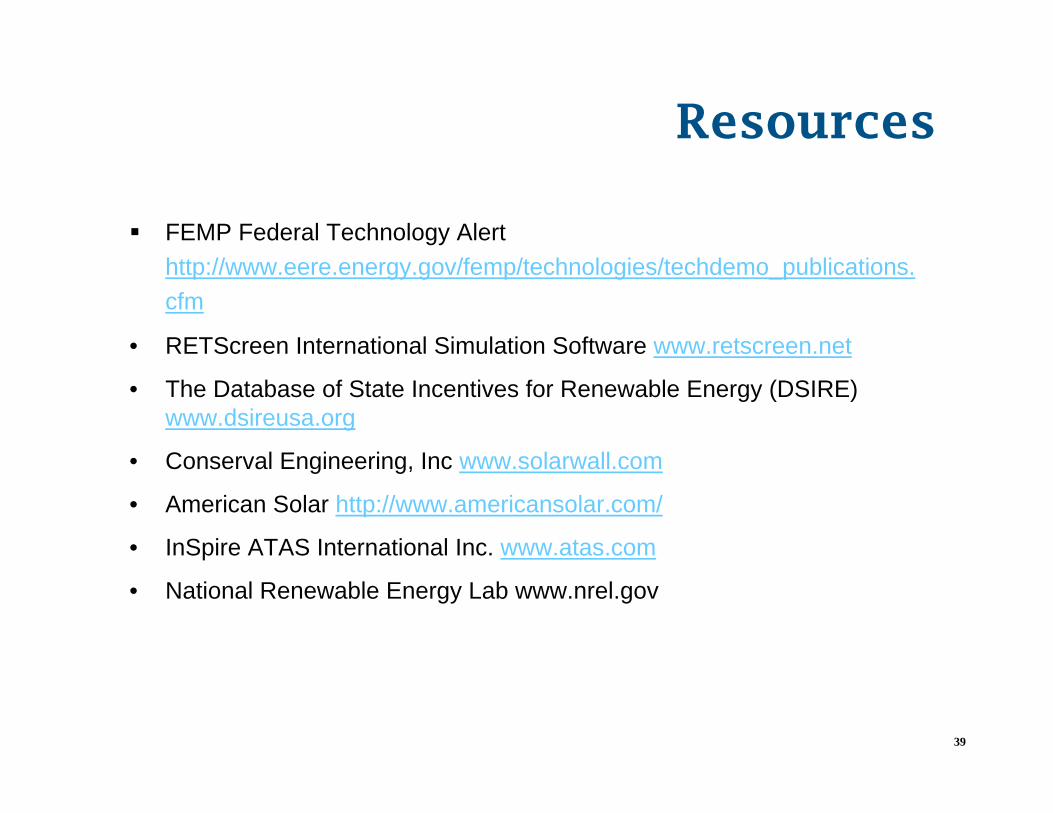
Resources
FEMP Federal Technology Alert http://www.eere.energy.gov/femp/technologies/techdemo_publications.cfm
• RETScreen International Simulation Software www.retscreen.net
• The Database of State Incentives for Renewable Energy (DSIRE) www.dsireusa.org
• Conserval Engineering, Inc www.solarwall.com
• American Solar http://www.americansolar.com/
• InSpire ATAS International Inc. www.atas.com
• National Renewable Energy Lab www.nrel.gov

Photovoltaics

P
Si
B
The Photovoltaic Effect
No material is consumed and the process could continue indefinitely
Phosphorous: 5 valence electrons
Silicon: 4 valence electrons
Boron: 3 valence electrons
P-N
Junction

PV ManufacturingSingle Crystal Multi-Crystal Amorphous Thin
Film
EIA Data, 2004
•13 to 17 % efficiency
•341 MW in 2004
•10 to 15 % efficiency
•669 MW in 2004
•5 to 11 % efficiency
•47 MW in 2004

050
100150200250300350
Ann
ual
Man
ufa
ctur
(MW
)
BP Sola
r
Kyoce
ra
Shar
pSh
ell
Sany
o
Scho
tt
Mitsub
ishi
Qcells
Source: 2004 World PV Cell/Module Production from Paul Maycock, PV News, March and April issues, 2005.
Largest PV Manufacturers

PV Cell –Cross-sectional View
Antireflection coating
Transparent adhesiveCover glass
p-Type semiconductorn-Type semiconductor Back contact
Hole
Front contact
Current
Electron
Sunlight

PV Cells are wired in series to increase voltage...
and in parallel to increase current
PV Cells

PV is Modular
Cells are assembled into Modules... and modules into arrays.

PV Cells “I-V Curve”
Current (Amps)
Voltage (Volts)
Open Circuit Voltage
Short Circuit Current
Maximum Power Point
Optimal voltage changes with sunlight and temperature

I-V Curve: Sunlight and Current
•Current (Amps) of each cell depends on
•surface area
•intensity of incident sunlight (kW/m2)

IV Curve: Voltage and Temperature
•Voltage (Volts) of each cell depends on
•the material’s band gap (eV),
•goes down slightly with increasing temperature

PV Module Nameplate Rating
• “Rated Power” is the output of a PV module under standard reference conditions – 1 kW/m2 sunlight, – 25 C ambient temperature– 1 m/s wind speed.
ASTM E1036-96, Standard Test Method for Electrical Performance of Nonconcentrator Terrestrial Photovoltaic Modules and Arrays Using Reference Cells

Module Nameplate

Best Research Solar Cell Efficiencies
026587136
Effic
iency
(%)
Universityof Maine
Boeing
Boeing
Boeing
BoeingARCO
NREL
Boeing
Euro-CIS
200019951990198519801975
NREL/Spectrolab
NRELNREL
JapanEnergy
Spire
No. CarolinaState University
Multijunction ConcentratorsThree-junction (2-terminal, monolithic)Two-junction (2-terminal, monolithic)
Crystalline Si CellsSingle crystalMulticrystallineThin Si
Thin Film TechnologiesCu(In,Ga)Se2CdTeAmorphous Si:H (stabilized)
Emerging PVDye cells Organic cells(various technologies)
Varian
RCA
Solarex
UNSW
UNSW
ARCO
UNSWUNSW
UNSWSpire Stanford
Westing-house
UNSWGeorgia TechGeorgia Tech Sharp
AstroPower
NREL
AstroPower
Spectrolab
NREL
Masushita
Monosolar Kodak
Kodak
AMETEK
Photon Energy
UniversitySo. Florida
NREL
NREL
NRELCu(In,Ga)Se2
14x concentration
NREL
United Solar
United Solar
RCA
RCARCA
RCA RCARCA
Spectrolab
Solarex12
8
4
0
16
20
24
28
32
36
University ofLausanne
University ofLausanne
2005
Kodak UCSBCambridge
NREL
UniversityLinz
Siemens
ECN,The Netherlands
Princeton
UC Berkeley

Efficiency versus Size• Efficiency= power out/power in• Power in = Area (m2) * 1 kW/m2• For Example:
– 1 kW of 15% efficient crystalline71ft2
– 1 kW of 9.5 % efficient amorphous 99ft2

Price of PV Modules
0
5
10
15
20
25
30
35
1975
1980
1986
1990
1992
1994
1996
1998
2000
2002
Year
PV M
odul
e Pr
ice
($/
$3.09
Source: EIA 2005 data

Cost of Photovoltaic Systems
• Small (10kW) Grid Connected: $8,800/kw
• Small Off Grid with Batteries, etc$17, 000/kW
Source: RS Means “Green Building Project Planning and Cost Estimating”
Material Cost ($/kW)
Labor Cost ($/kW)
Equipment Rental Costs ($/kW) Total ($)
PV Modules $5,730 $248 $107 $6,085Roof Preparation $100 $100 0 $200Rack Structure $150 $150 0 $300Array Electrical $300 $248 0 $548Utility Connection $10 $20 0 $30Inverter $590 $80 0 $670Other Elect $500 $200 0 $700AC Disconnect $33 $12 0 $44DC Disconnect $43 $12 0 $55Isolation Transformer $110 $55 0 $165Total $7,566 $1,124 $107 $8,796

Diffusion Model:As the cost of PV comes down, and the cost of alternatives go up, PV applications grow from high-value niche applications to widespread use.
Small, Remote Loads
Hybrid and Village Power Peaking and high value utility connects
Bulk Power
You Are Here
Cost Effective PV Applications

PV Markets
Industrial
Residential
Commercial
Transportation
Utility
Government
Other
• Most Cost Effective:– Small Loads
• Emergency Call Boxes• Irrigation Controls• Sign lighting
– Avoided Line Extensions ($20k to $100k/mile)
• Water Pumping• Residential
– Remote Diesel Generators ($0.19 to $1.68/kWh)
2005 EIA data
Grid Interactive
Remote
Communication
ConsumerGoods
Transportation

World PV Production
0200400600800
10001200140016001800
Rest of World 3 4 4.7 5 4.6 4.4 5.6 6.35 9.75 9.4 18.7 20.5 23.42 32.6 55 83.8 140 290
Europe 6.7 7.9 10.2 13.4 16.4 16.55 21.7 20.1 18.8 30.4 33.5 40 60.66 86.38 135 193.3 314.4 450
Japan 12.8 14.2 16.8 19.9 18.8 16.7 16.5 16.4 21.2 35 49 80 128.6 171.2 251 363.9 602 810
United States 11.1 14.1 14.8 17.1 18.1 22.44 25.64 34.75 38.85 51 53.7 60.8 74.97 100.3 120.6 103 139 180
Total 33.6 40.2 46.5 55.4 57.9 60.09 69.44 77.6 88.6 125.8 154.9 201.3 287.7 390.5 561.8 744.1 1195 1727
1988 1989 1990 1991 1992 1993 1994 1995 1996 1997 1998 1999 2000 2001 2002 2003 2004 2005
MW
of P
V
prod
uced
per
yea
r
Sources: 2004 World PV Cell/Module Production from Paul Maycock, PV News, March and April issues, 2005; Energy Information Administration; NREL National Center for Photovoltaics

PV System Components(depending on type of system)
• PV Array to convert sunlight to electricity• Array Support Structure and Enclosure to protect other
equipment• Maximum Power Point Tracker to match load to optimal array
voltage• Batteries to store charge for when it is needed• Charge Controller to protect battery from over-charging• Low Voltage Disconnect to protect battery from over-
discharging• Inverter to convert direct current (DC) to alternating current
(AC)• Wiring, combiner boxes, fuses and disconnects• Automatic generator starter/stopper to start a generator when
battery is too low

Simple Direct Drive PV System

Simple DC PV System with Battery Storage

DC PV System Example:PJKK Federal Building, HI
• 2 solar panels per lamp with peak output of 96 watts
• 39 Watt fluorescent lamps, 2500 lumens
• 90 amp-hour battery powers 12 hours per night
• ~$2500 per light

AC PV System with Inverter

Inverter
Converts Direct Current (DC) to Alternating Current (AC)

Inverter Technology• Various DC and AC voltages, number of phases• MODIFIED SINE WAVE (Trace UX, Trace DR, Powerstar,
Portawattz– low cost, slightly more efficient– Bad for some computers, photocopy machines, laser printers, and
cordless tool rechargers. • TRUE SINE WAVE(Trace SW, Prosine, Exeltech, SMA)
– power of better quality than utility• SIZE from under 100 watts to 10 kW, larger are custom• EFFICIENCY 85 to 95%. • FEATURES: meters, alarms, battery charger, grid interaction,
automatic shut down, start/stop other devices.• UL Standard 1741, Standard for Static Inverters and Charge
Controllers for Use in Photovoltaic Power Systems – incorporates the testing required by IEEE 929 – includes design (type) testing and production testing.

Utility-Connected (Line-Tie) PV System

Utility-Connected PV Example: Presidio Thoreau Center
• Building-Integrated Photovoltaics
• 1.25 kW PV Array• Spacing between cells
admits daylight into entryatrium below

Grid-Connected System
Source: Powerlight

Hybrid PV/Generator System

PV/Propane Hybrid Example: Joshua Tree National Park
• 20.5 kW PV Array
•613 kWh battery bank
•35 kW propane generator
•$273,000 cost financed by Southern California Edison under 15 year tariff

Building-Integrated PV (BIPV)

Roof-integrated photovoltaics

Example: Coronado Island CA 924 kW, cost $7.7 million

Coronado Island CA PV System Performance
0
20,000
40,000
60,000
80,000
100,000
120,000
140,000
160,000
180,000
Jan-04
Feb-04
Mar-04
Apr-03 May-03
Jun-03 Jul-03 Aug-03
Sep-03
Oct-03 Nov-03
Dec-03
Month
Pow
er P
rodu
ctio
n, k
Wh/
mon
th
0
100
200
300
400
500
600
700
800
900
Peak
Pow
er, k
W
829 kW AC maximum delivery
1,228,658 kWh/year delivery

Energy Delivery versus OrientationData for New York City
Annual Energy Production from 1 kW of PV (84 Ft2) on each side
• North 554 kWh/yr• East 871 kWh/yr• South 1097 kWh/yr• West 833 kWh/yr• Horizontal 1393 kWh/yrBy comparison…• Tilt=41 deg 1530 kWh/yr• 2-axis track 1929 kWh/yr

System Efficiency
Array 10% Efficiency
Battery 80% Round-trip Efficiency
Inverter 90% Efficiency
100 Watts from sun > 10 Watts >8 Watts > 7.2 AC Watts to load
Overall system efficiency is product of component efficiencies. Example 0.10*0.80*0.90=0.072...exacerbated by mismatch losses, typical system efficiency = 0.06
Efficiency = power out / power in

PV System Sizing ExerciseStand-Alone Applications
PV System SizePrated = L
Imin
Prated = rated PV power (kW) L = Daily Load on PV = electricity
required/inverter efficiency/battery efficiency (kWh/day)
I min = minimum daily solar radiation (sun hours/day)
if you want to know how big in m2, divide Prated by 100 W/m2
Annual Energy DeliveryEs = L * 365 (days/year)Wasted solar = (Prated Iave - L) * 365 (d/y) I ave = average solar radiation (sun hours/day)
January June December
Month
ener
gy Solar
Load
Wasted Solar

PV System Sizing: Grid/Generator-Connected
Solar System SizePrated = L
ImaxI max = maximum daily solar radiation (sun hours/day)
Annual Electricity GenerationEgen = Prated Iave 365
Annual Fuel SavingsEs = Prated Iave 365
ηgenerator
ηgenerator = auxiliary generator efficiency(typically 9 kWh/gallon for diesel, 6 kWh/gallon for propane)
January June December
Month
ener
gy Load
Solar
Generator


Sizing Example: Small Load in San Francisco• Daily Electric Load
Lights 120 Watts * 4 hours/day = 480 Wh/dayFan 250 Watts * 2 hours/day = 500 Wh/dayClock 20 Watts * 24 hours/day = 480 Wh/dayPeak Load 390 W Total Daily Load = 1.460 kWh/day
• Inverter sizing: at least 390 W, say 500W.
• Battery Sizing: 3 days storage * 1.46 kWh/day = 4.38 kWh4.38 kWh/0.5 max depth of discharge= 8.76 kWh

• Array Sizing• Add system inefficiency to Load
1.46 kWh/day/0.80 battery efficiency/0.90 inverter efficiency = 2.027 kWh/day
• For San Francisco, tilt equal to 37 degrees (local latitude)Imax = 6.8, I ave = 5.4, and I min = 3.4 (kWh/m2/day = sunhours/day)
• If PV stands alone to meet the load, size for minimum sunPrated = L / Imin = 2.027 kWh/day / 3.4 sunhours/day)
= 0.596 kWcould be eight modules seventy-five watts each.
PV Energy Delivery= 2.027 kWh/day * 365 days/year = 740 kWh/year
PV Sizing Example: Small Load in San Francisco
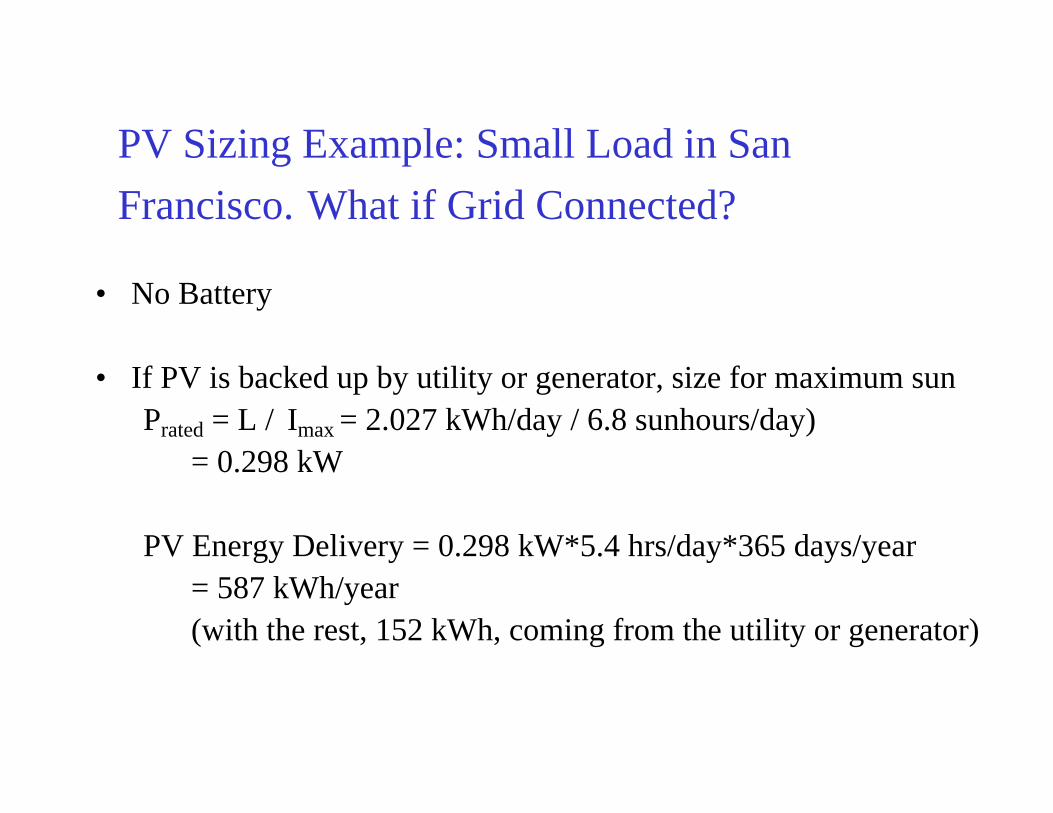
PV Sizing Example: Small Load in San Francisco. What if Grid Connected?
• No Battery
• If PV is backed up by utility or generator, size for maximum sunPrated = L / Imax = 2.027 kWh/day / 6.8 sunhours/day)
= 0.298 kW
PV Energy Delivery = 0.298 kW*5.4 hrs/day*365 days/year = 587 kWh/year(with the rest, 152 kWh, coming from the utility or generator)

Wire Selection
• T Thermoplastic insulation• H 75°C (Note: lack of "H" indicates 60°C)• HH 90°C• N Nylon jacket• W Moisture resistant• R Rubber insulation• U Underground use• USE Underground Service Entrance *• UF Underground Feeder *• SE Service Entrance *• -2 90°C and wet
Type Temp. °C/°F
Moist Condui Req.
Sunlight Res.
THHN 90/194 Damp Yes No THWN 75/167 Wet Yes No THWN 90/194 Dry Yes No THWN-2 90/194 Wet Yes No THW 75/16 Wet Yes No THW-2 90/194 Wet Yes No RHW 75/167 Wet Yes No RHW-2 90/194 Wet Yes No RHH 90/194 Damp Yes No USE 75/167 Wet No Yes USE-2 90/194 Wet No Yes UF 60/140 Wet No Marked SE 75/167 Wet No Yes
Use only 90C (not 60 or 75C) temperature rating
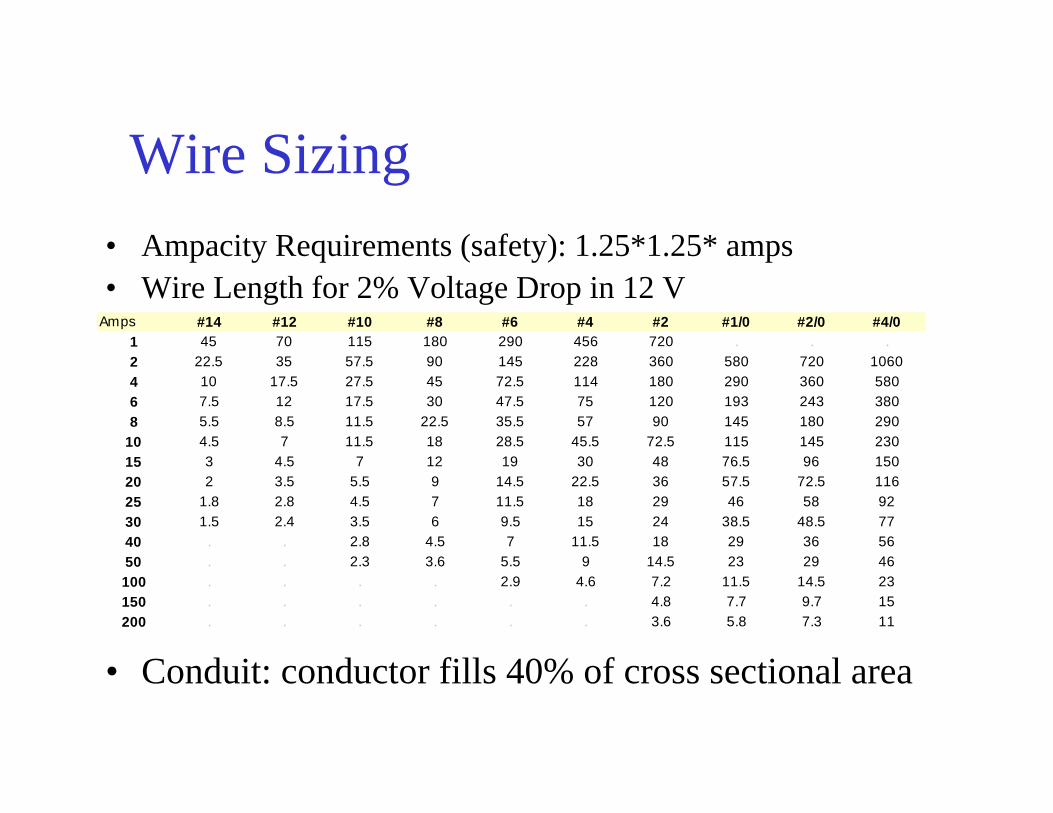
Wire Sizing• Ampacity Requirements (safety): 1.25*1.25* amps• Wire Length for 2% Voltage Drop in 12 V
• Conduit: conductor fills 40% of cross sectional area
Amps #14 #12 #10 #8 #6 #4 #2 #1/0 #2/0 #4/01 45 70 115 180 290 456 720 . . .2 22.5 35 57.5 90 145 228 360 580 720 10604 10 17.5 27.5 45 72.5 114 180 290 360 5806 7.5 12 17.5 30 47.5 75 120 193 243 3808 5.5 8.5 11.5 22.5 35.5 57 90 145 180 290
10 4.5 7 11.5 18 28.5 45.5 72.5 115 145 23015 3 4.5 7 12 19 30 48 76.5 96 15020 2 3.5 5.5 9 14.5 22.5 36 57.5 72.5 11625 1.8 2.8 4.5 7 11.5 18 29 46 58 9230 1.5 2.4 3.5 6 9.5 15 24 38.5 48.5 7740 . . 2.8 4.5 7 11.5 18 29 36 5650 . . 2.3 3.6 5.5 9 14.5 23 29 46100 . . . . 2.9 4.6 7.2 11.5 14.5 23150 . . . . . . 4.8 7.7 9.7 15200 . . . . . . 3.6 5.8 7.3 11

American Society for Testing and Materials (ASTM)
• nearly 100 standards regarding solar energy systems• American Society for Testing and Materials (ASTM)
100 Barr Harbor DriveWest Conshohocken, PA 19428Phone: (610) 832-9585; Fax: (610) 832-9555Email: [email protected] Wide Web: http://www.astm.org/
• Annual Book of ASTM Standards, Volume 12:02: Nuclear, Solar and Geothermal Energy

ASTM E44.09 Standards
• E 927-91 Specification for Solar Simulation for Terrestrial PV Testing • E 948-95 Test Method for Electrical Performance of PV Cells using Reference Cells under Simulated Sunlight • E 973-91 Test Method for Determination of the Spectral Mismatch Parameter Between a PV Device and a PV Reference Cell • E 1021-95 Test Methods for Measuring Spectral Response of PV Cells • E 1036-96 Test Methods Electrical Performance of Nonconcentrator Terrestrial PV Modules and Arrays using Reference Cells • E 1038-93 Test Method for Determining Resistance of PV Modules to Hail by Impact with Propelled Ice Balls • E 1039-94 Test Method for Calibration of Silicon Non-Concentrator PV Primary Reference Cells Under Global Irradiation• E 1040-93 Specification for Physical Characteristics of Non-Concentrator Terrestrial PV Reference Cells • E 1125-94 Test Method for Calibration of Primary Non-Concentrator Terrestrial PV Reference Cells using a Tabular Spectrum • E 1143-94 Test Method for Determining the Linearity of a PV Device Parameter with Respect to a Test Parameter • E 1171-93 Test Method for PV Modules in Cyclic Temperature and Humidity Environments • E 1328-94 Terminology Relating to PV Solar Energy Conversion • E 1362-95 Test Method for the Calibration of Non-Concentrator Terrestrial PV Secondary Reference Cells • E 1462-95 Test Methods for Insulation Integrity and Ground Path Continuity of PV Modules • E 1524-93 Test Methods for Saltwater Immersion and Corrosion Testing of PV Modules for Marine Environments • E 1596-94 Test Methods for Solar Radiation Weathering of PV Modules • E 1597-94 Test Method for Saltwater Pressure Immersion and Temperature Testing of PV Modules for Marine Environments • E 1799-96 Practice for Visual Inspection of PV Modules • E 1802-96 Test Methods for Wet Insulation Integrity Testing of PV Modules

Institute of Electrical and Electronic Engineers (IEEE)
• Standards for electrical and electronic equipment• relates to industry experts.• Institute of Electrical and Electronic Engineers, Inc
345 East 47th Street New York, NY 10017, USA
• P929 Recommended Practice for Utility Interface of Photovoltaic (PV) Systems– display “Utility-Interactive” on the listing label– frequency and voltage limits, power quality, non-
islanding inverter testing

IEEE PV Standards
• 928 IEEE Recommended Criteria for Terrestrial PV Power Systems • 929 IEEE Recommended Practice for Utility Interface of Residential and Intermediate
PV Systems • 937 IEEE Recommended Practice for Installation and Maintenance of Lead-Acid
Batteries for PV Systems • 1013 IEEE Recommended Practice for Sizing Lead-Acid Batteries for PV Systems • 1144 Sizing of Industrial Nickel-Cadmium Batteries for PV Systems • 1145 IEEE Recommended Practice for Installation and Maintenance of Nickel-
Cadmium Batteries for PV Systems • P1262 Recommended Practice for Qualification of PV Modules • P1361 Recommended Practice for Determining Performance Characteristics and
Suitability of Batteries in PV Systems • P1373 Recommended Practice for Field Test Methods and Procedures for Grid-
Connected PV Systems • P1374 Guide for Terrestrial PV Power System Safety

Underwriters Laboratory (UL)
• Standards for Electrical Equipment Safety• relates mainly to manufacturers.• 333 Pfingsten Road Northbrook, IL 60062• UL Standard 1703, Flat-plate Photovoltaic Modules
and Panels• UL Standard 1741, Standard for Static Inverters and
Charge Controllers for Use in Photovoltaic Power Systems – incorporates the testing required by IEEE 929 – includes design (type) testing and production testing.

National Fire Protection Association (NFPA)
• National Electrical Code (NEC)• Electrical Power System Installation• relates to electrical trade and industry experts.• Article 690: Solar Photovoltaic Systems
– requires listing for utility interface inverters• Underwriters Laboratory (UL)• Edison Testing Laboratories (ETL)• Factory Mutual Research (FM)
• Article 230: Disconnect Means• Article 240: Overcurrent Protection• Article 250: Grounding• Article 300 to 384: Wiring Methods• Check out http://www.nmsu.edu/~tdi/codes&.htm

IEC PV Standards
• IEC-891 Procedures for Temperature and Irradiance Corrections to Measured I-V Characteristics of Crystalline Silicon PV Devices
• IEC-904-1 Measurement of PV I-V Characteristics • IEC-904-2 Requirements for Reference Solar Cells • IEC-904-3 Measurement Principles for Terrestrial PV Solar Devices with Reference Spectral Irradiance Data • IEC-904-4 On-Site Measurements of Crystalline Silicon PV Array I-V Characteristics • IEC-904-5 Determination of the Equivalent Cell Temperature (ECT) of PV Devices by the Open-Circuit Voltage Method • IEC-904-6 Requirements for Reference Solar Modules • IEC-904-7 Computation of Spectral Measurement of a PV Device • IEC-904-8 Guidance for Spectral Measurement of a PV Device • IEC-904-9 Solar Simulator Performance Requirements • IEC-1173 Overvoltage Protection for PV Power Generating Systems • IEC-1194 Characteristic Parameters of Stand-Alone PV Systems • IEC-1215 Design and Type Approval of Crystalline Silicon Terrestrial PV Modules • IEC-1277 Guide-General Description of PV Power Generating System • IEC-1701 Salt Mist Corrosion Testing of PV Modules • IEC-1702 Rating of Direct-Coupled PV Pumping Systems • IEC-1721 Susceptibility of a Module to Accidental Impact Damage (Resistance to Impact Test) • IEC-1727 PV-Characteristics of the Utility Interface • IEC-1829 Crystalline Silicon PV Array - On-Site Measurement of I-V Characteristics

Environmental Testing
• ASTM E 1171-93 Test Method for PV Modules in Cyclic Temperature and Humidity Environments
• Temperature -40 to +85 C • Damp heat 85 C, 85%RH• Humidity freeze 85%RH, -40
C • Thermal Shock -40 to
110 C in 20 min

Hail Impact Testing
• ASTM E 1038-93 Test Method for Determining Resistance of PV Modules to Hail by Impact with Propelled Ice Balls
• 1” simulated hailstones• 55 mph• Corner, edge and middle of
module

Cyclic Load Testing
• ASTM E 1830M-96, Standard Test Method for Determining the Mechanical Integrity of Photovoltaic Modules. (30 lb/ft2 cyclic load)

Other Requirements
• Building codes - UBC, SBC, BOCA, local codes• ASTM
– Standard Glass specifications– structural
• Consumer Product Safety Council– Structural Requirements , section 16– tempered, laminated
• Local covenants regarding appearance• National Historic Preservation Act, SHPO

Capabilities:Sunpath GeometrySystem Sizing System ConfigurationOn grid vs. Off grid Est. Power OutputBuilding SimulationsShading Temperature & Thermal Performance Economic AnalysisAvoided EmissionsBuilding Energy Load AnalysisMeteorological Data
Available Software:– PVSYST– MAUI SOLAR
• PV DESIGN PRO– WATSUN PV– PV CAD – PV FORM– BLCC– HOMER– ENERGY-10 – AWNSHADE
PV Design Toolshttp:// www.eren.doe.gov/buildings/tools_directory
58

Requirements for Success• Conservation First • Verify Load Estimates• Appropriate Application• Proven Design• Operational Indicators or Monitoring• Operations and Maintenance Training and Manual• Properly Sized • Require No Manual Intervention• Performance Guarantee

The Solar Resource

Solar Spectrum
• 6% ultraviolet, 48% visible, and 46% infrared light• annual average radiation 1,366 W/m2 in space, • typically less than 1000 W/m2 on Earth.

Declination, d
Winter Solstice,
South
d= -23.45 degSpring Equinox,
d= 0
Fall Equinox,
d=0
Summer Solstice,
d=23.45 degrees North
Sun
Varies like a sine wave throughout the year d=23.45*(SIN(360/365*(284+day of year)))
•Depends on the season

Hour angle, h
-90 deg0 deg+90 degHour angle, h6 pm12 noon 6 amSolar Time
•Depends on time of day
•Earth rotates 360 deg in 24 hours, or 15 degrees per hour
•Hour angle, h=(15 degrees/hour)*(hours from noon)

Position of the Sun
• Altitude angle, a, angle fom the horizon up to the sunsin a=cos l cos d cos h + sin l sin d
• Azimuth angle, z, horizontal from due south to the sun,sin z = sin h cos d/ cos a
• l=latitude (deg), h=hour angle (deg), d=declination (deg)

Sun Position Example
• 10:00 am June 9 in Denver CO• Solar Time 9:00 am
– Daylight Savings Time (one hour earlier)– Distance from Standard Meridian (105-105 deg west, neglect)– Equation of Time (0.02 hours, neglect)
• Declination, d = 23 deg• Hour Angle, h = 45 deg• Latitude, L = 40 deg• Altitude, a = 49 degrees• Azimuth, z = 79 degrees

N. Cheyenne Capitol

Shading
Winter sun
Altitude, a, at h=30, d=-23.45Window Shading: Good
Solar Collector Shading: Bad

Exercise: Design overhang for 1 m high row of windows. noontime shade from 5/11 to 8/12
noontime sun from 11/17 to 1/25

Exercise: Sun Position C
• Solar time 12:00 pm November 17 in Denver CO– Declination, d = -19 deg– Hour Angle, h = 0 deg– Latitude, L = 40 deg– Altitude, a = 31 degrees
• Solar time 12:00 pm May 12– Declination, d = +18 deg– Hour Angle, h = 0 deg– Latitude, L = 40 deg– Altitude, a = 68 degrees

Exercise: Design overhang for 1 m high row of windows. noontime shade from 5/11 to 8/12
noontime sun from 11/17 to 1/25
31 degrees
68 degrees1 m
0.321 m
0.534 m

Shading: horizon profileAltitude angle of horizon at each azimuth angle
Solar Pathfinder

“Sun Hours”• “Rated Power” is the output of a PV module under
standard reference conditions (1 kW/m2 light, 25 C, 1 m/s wind speed).
Example: June in Boulder 6.1 kWh/m2/day = 5.1 “sun hours”/day.
A module “rated” at 1 kW would produce 5.1 kWh in that day.
Time of Day
Sunlight (kW/m2)
Time of Day
Sunlight (kW/m2)
Sun Hours
1 kW/m2
=0
1
12 12
1
0

Daily Average (kWh/m2/day)
kWh/m2/day = sun hours/day

Fixed Tilt/TrackingFixed Tilt Facing Equator
tilt=latitudetilt<latitude for summer gaintilt>latitude for winter gain
One Axis Tracking around axis tilted or flat
Two Axis Tracking both azimuth and altitude of sun around two axes

Effect of Orientation• Average daily solar radiation (kWh/m2/day)
0123456789
10
Jan
Feb Mar Apr
May
Ju
n Jul
AugSep Oct Nov Dec
Horizontal 4.6Tilt=Latitude 5.5Vertical 3.81-axis tracking 7.22-axis tracking 7.4
Data for Boulder CO


Breckenridge Weather Data
Month
Average Dry Bulb
Temperature, °F
Average Daily Maximum Dry
Bulb Temperature,
°F
Average Daily
Minimum Dry Bulb
Temperature, °F
Maximum Dry Bulb
Temperature, °F
Minimum Dry Bulb
Temperature, °F
Average Wet Bulb
Temperature, °F
Relative Humidity, %
Average Wind
Speed, MPH
Average Daily
Horizontal Solar
Radiation, Btu/ft²
Heating Degree Days, Base
65.0 °F
Cooling Degree Days, Base
65.0 °F January 14 29.1 -1 42 -35 11.9 78.9 7.7 772 1581 0 February 16 31.8 1.3 50 -21 14.1 81.7 6.2 1022 1358 0 March 22.1 36 9 51 -5 19.7 80.8 5.9 1367 1318 0 April 31.4 44.4 18.3 57 6 27.3 71 8.5 1814 1010 0 May 41.4 55.5 26.5 70 14 36.3 71.9 7.2 2090 746 0 June 50.3 66.5 33.2 75 25 42.6 63.2 6.1 2331 456 0 July 55.8 73.1 38.6 84 33 48.6 68.8 5.3 2174 283 0 August 53.4 70.5 37.4 79 29 46.8 70 6.5 1984 343 0 September 45.9 62.6 30.2 72 22 39.3 66.6 6 1640 558 0 October 36.1 53.1 21.7 67 11 30.9 67.3 4.9 1252 856 0 November 23.8 38.6 10.9 51 -3 21.3 77 4.9 828 1207 0 December 15.8 30.3 2.6 54 -13 13.8 75.3 4.9 663 1505 0 Year 33.8 49.3 19 84 -35 29.4 72.7 6.2 1495 11219 0

-40
-30
-20
-10
0
10
20
30
40
50
60
70
80
Jan Feb Mar Apr May Jun Jul Aug Sep Oct Nov Dec
Tem
pera
ture
, °F
Average Hourly by Month
0
100
200
300
400
500
600
Btu/
ft²
Temperatures & Solar Radiation Dillon 1 E, Colorado (adj)
Dry BulbWet BulbGlobalBeamDiffuse

0.001
0.002
0.003
0.004
0.005
0.006
0.007
0.008
0.009
0.010
0 10 20 30 40 50 60 70 80
Hum
idity
Rat
io
Temperature, °F
Typical Day Psychrometric Chart Dillon 1 E, Colorado (adj)
JanuaryFebruaryMarchAprilMayJuneJulyAugustSeptemberOctoberNovemberDecemberApprox. Comfort Zone
100%
50%

NREL Solar Radiation Data Manualhttp://rredc.nrel.gov/solar/old_data/nsrdb/redbo
ok/atlas/

Solar Water Heating

2
Technology Overview
Low-temperature collectors:– Unglazed mats for water heating.
Mid-temperature collectors:– Glazed and insulated collectors.
High-temperature collectors:– Evacuated tubes.– Focusing collectors.
Solar Water Heaters intercept solar radiation and use it to heat water. Solar thermal collectors can be categorized by the temperature at which they efficiently deliver heat.

Solar Water Heating
• Water heating accounts for 4.5 Quads/year of 37.6 Quads/year total US building energy use.
• Of this, about 1% (0.05 Quads/year) is currently supplied by solar.– 3% of buildings have solar– One third of each building load by
solar
Solar1%
Oil5%
Propane2%
Electric (Primary)
46%
Natural Gas46%

Collector Types
Technology Overview
4

Energy Collected = optical gains -thermal losses
Q useful = τ α I Ac - Uc Ac(Ts-Tamb)
Efficiency = Energy Collected / Incident Solar ηsolar = Quseful / I Ac
= τ α - Uc (Ts-Tamb)/I, (a line of slope Uc and intercept τ α )
I= incident solar radiation (W/m2)τ = transmissivity of cover glassα = absorptivity of absorber plateAc= collector area (m2)Quseful = useful heat from collector (W)Uc= thermal loss coefficient of collector
(W/C)Ts= storage water temperature (C)Tamb= outdoor ambient temperature (C)
I τ αAc
UUccAAcc(T(Tss--TTambamb))
Q usefulI Ac
Collector Efficiency (Rating)

Which collector is best depends on the temperature...
Efficiency = % of solar captured by collector

Solar Rating and Certification Corp.
•an independent nonprofit organization that tests performance and certifies almost every solar heater on the market today.
•Reports efficiency line and annual performance for different climates and temperature uses.
Contact information
Solar Rating and Certification Corporationc/o FSEC, 1679 Clearlake RoadCocoa, FL 32922-5703Voice (321)638-1537Fax (321)638-1010E-mail: [email protected]

US Solar Thermal Shipments
Source: EIA 2003 Data
0
5,000
10,000
15,000
20,000
25,000
1974
1977
1980
1983
1986
1989
1992
1995
1998
2001
Year
US S
olar
The
rmal
Shi
pmen
ts (k
sf)
High TempMid TempLow Temp

9
Passive Systems
Integral Collector StorageThermosyphon
System Types
Active SystemsOpen Loop:– Direct– Drain Down
Closed Loop:– Drain Back– Antifreeze

Passive, Integral Collector Storage (ICS) Direct System
Moderate freeze protection (pipes at risk)Minimal hard water tolerance Very low maintenance requirements

Passive, Thermosyphon, Direct System
Auxiliary element can also be in tank above collector, eliminating the auxiliary tank altogether.No freeze protectionMinimal hard water tolerance Low maintenance requirements

Active, Open-loop, Pumped Direct System
No freeze protection Minimal hard water tolerance High maintenance requirements

Active, Closed-loop (antifreeze), Indirect System
Excellent freeze protection Good hard water tolerance High maintenance requirements

Active, Closed-loop, Drainback, Indirect System
Good freeze protection Good hard water tolerance High maintenance requirements

Recirculation Loop
Requires well insulated collector (evacuated tube) Active protection for freezing and overheating
Recirculation loop
to and from boiler

Tempering Valve to Prevent Scalding:Extremely Important for Safety!
17
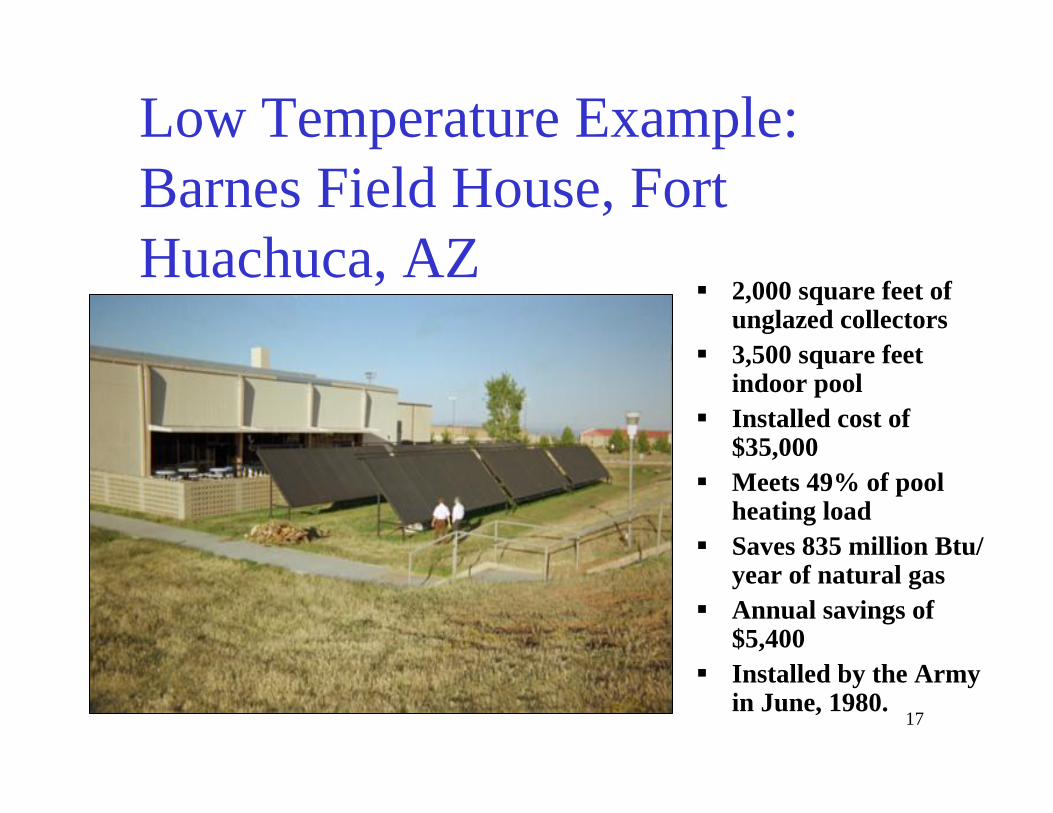
Low Temperature Example: Barnes Field House, Fort Huachuca, AZ
2,000 square feet of unglazed collectors3,500 square feet indoor poolInstalled cost of $35,000Meets 49% of pool heating loadSaves 835 million Btu/ year of natural gasAnnual savings of $5,400Installed by the Army in June, 1980.

18
Mid Temperature Example: Chickasaw National Recreation Area, OK
Small Comfort Stations– 195 square feet of flat plate
collectors– 500 gallon storage volume– Cost $7,804– Delivers 9,394 kWh/year– Saves $867 / year
Large Comfort Stations– 484 square feet of flat plate
collectors– 1000 gallon storage volume– Cost $16,100– Delivers 18,194 kWh/year– Saves $1,789 / year

62 units installed 1998Active (pumped), Direct systemsAverage cost $4,000 per system80 sf per system$800 per system HECO rebateSavings of 9,700 kWh/year and $822/year per systemSimple Payback 4 years (with rebate)
Mid Temperature Example: USCG Housing, Honolulu HI

USCG Housing, Honolulu HI

Three closed loop systems with evacuated tube collectors, heat exchanger in the preheat tank. Food-grade Propylene Glycol solution for freeze protection.– Bay F 80 gallon preheat tank and 20 ft2 of
collector area. – Bay B 80 gallon preheat and 40 ft2 of
collector area – Bay D 120 gallon preheat tank and 90 ft2
of collector area , measured output averaged 50,000 Btu/day in December, 98.
Total Cost = $26,000, 15 yr payback
High Temperature Example: Building 209, EPA Lab, Edison NJ

High Temperature Example:Social Security Admin. Philadelphia.
• Reheats Recirculation Loop• 360 Evacuated Heat-Pipe
Collector tubes, 54 m2 gross area, 36 m2 net absorber area
• Cost $58,000• Delivery of 143 million
Btu/year estimated• Installed 2004.

23
High Temperature Example: Phoenix Federal Correctional Institution 17,040 square feet of parabolic trough
collectors23,000 gallon storage tankInstalled cost of $650,000Delivered 1,161,803 kWh in 1999 (87.1% of the water heating load).Saved $77,805 in 1999 Utility Costs.Financed, Installed and Operated under Energy Savings Performance Contract with Industrial Solar Technology, Inc.The prison pays IST for energy delivered at a rate equal to 90% of the utility rate (10% guaranteed savings), over 20 years.

Month Energy and Cost Savings
0
100
200
300
400
500
Jan Feb Mar Apr May Jun Jul Aug Sep Oct Nov Dec
Month
Tota
l Del
iver
ed H
eat (
mill
ion
Btu
)
19992000200120022003
High Temperature Example: Phoenix Federal Correctional Institution

Simple Evaluation Procedure
Estimate Daily Water Heating LoadDetermine Solar ResourceCalculate Solar System Size– meet load on sunniest day– undersize rather than oversize
Calculate Annual Energy SavingsCalculate Annual Cost SavingsEstimate System CostCalculate Savings-to-Investment Ratio and Simple Payback Period

Solar Water Heating Costs
– Single, small system $155/ft2
– Large central system $40/ft2
– Swimming Pool system $18/ft2
Source: RS Means “Green Building Project Planning and Cost Estimating, FCI Phoenix project

Daily Water Heating Energy LoadL = MC (Thot - T cold)
L = Daily Hot Water Energy Load (kWh/day)
M= mass of water per day (kg/day), 3.785 kg/gallon
C = specific heat of water= 0.001167 kWh/kg°C
Thot= hot water delivery temperature (°C), often 50 ° C = 120 ° F
Tcold = cold water temperature (°C), often 13 ° C = 55 ° F
Typical Hot Water Usage:
Dormitory 13 gal/day/personMotel 15 gal/day/unitHospital 18 gal/day/bedOffice 1 gal/day/personFood Service 2.4 gal/mealResidence 40 gal/day/personSchool 1.8 gal/day/student

28
Solar Energy ResourceCollectors should face south (in northern hemisphere)Tilt Angle=latitude maximizes annual gain (lat+15°for winter, lat-15° for summer)Location I Max I Ave (kWh/m2/day)Anchorage, AK 4.6 3.0Austin, TX 6.3 5.3Boston, MA 5.6 4.6Chicago, IL 5.7 4.4Denver, CO 6.1 5.5Fargo, ND 6.5 4.6Honolulu, HI 6.5 5.5Jacksonville, FL 6.1 4.9Sacramento, CA 7.2 5.5San Diego, CA 6.5 5.7Seattle, WA 5.7 3.7
For COMPLETE data on hundreds of sites, check out www.nrel.gov

Solar Water Heating System Size and DeliverySolar Water System Size
Ac = L . (ηsolar Imax)
Ac = collector area (m2) L = Daily Load (kWh/day)ηsolar= efficiency of solar system
(typically 0.40)I max = maximum daily solar
radiation (kWh/m2/day)
Annual Energy SavingsEs = Ac Iaveηsolar365
ηboiler
I ave = average solar radiation (kWh/m2/day)
ηboiler = auxiliary heater efficiencygas 0.43 to 0.86, assume 0.57electric 0.77 to 0.97, assume 0.88
heat pump assume 2.0propane 0.42 to 0.86, assume 0.57oil 0.51 to 0.66, assume 0.52
Source: GAMA

Solar Water Heating System Cost and SavingsSolar System CostC = csolar Ac
C = Installed Cost of Solar System ($)
csolar = per-unit-area cost of installed solar system ($/m2), typically $400/ m2 for large system $1000/m2 for small systems$750/ m2 might be average
Annual Cost SavingsS = Es Ce
S = annual cost savings ($/year)
Ce = cost of auxiliary energytypically:Electricity $0.084/kWhNatural Gas $0.040/kWhPropane $0.040/kWhOil $0.025/kWh
Source: FTC

Solar Water Heating System Cost EffectivenessSavings-to-Investment RatioSIR = S*pwf / Cproject is cost effective if SIR>1.
pwf = present worth factor for future savings stream, = 17.4 years for 25 year lifetime and 3% real discount rate (specified by NIST).
Simple Payback PeriodSPB = C / S

Example: 4 person residencein Boulder against electricity
M=4person*40gal/person/day*3.785 kg/gal=606 kg/dayL=MC(Thot-Tcold) =606 kg/day*0.001167kWh/kgC*(50C-18C) =22.6 kWh/dayFor Boulder, CO, Imax = 6.1 and I ave = 5.5 kWh/m2/dayAc = L / (ηsolar Imax) = 22.6 kWh/day / (0.4 * 6.1 kWh/m2/day) =9.2 m2Es = Ac Iave ηsolar 365/ ηboiler = 9.2 m2 * 5.5 kWh/m2.day * 0.4 * 365days/year / 0.88 = 8,452 kWh/yearC = csolar Ac = $1000/m2 * 9.2 m2 = $9,200S = Es Ce = 8,452 kWh/year * $0.084/kWh = $710/yearSIR = S*pwf / C = $710/year * 17.4 years / $9,200 = 1.3SO IT IS COST EFFECTIVE!


2001 Top Five Destinations of Thermal Solar Collector Shipments
State Percent of U.S. ShipmentsFlorida 44%California 29%Arizona 4%Nevada 2%Connecticut 1%

36
Cost-Effective Solar Thermal Applications
Low temperature:• Swimming Pools
Mid temperature:• Residential Hot Water• Cafeterias• Laundries• Air Conditioning Reheat
High temperature:• Industrial Processes• Electrical Generation
Water heating loads constant throughout week and year (or more in the summer).High cost of backup energy (electricity, propane, etc.).Sufficient area to site collectors (1 ft2/gal/d).Sunny climate helps, but is not a requirement- solar works in cold climates too.Need on-site “champion”

37
Requirements for SuccessAppropriate Application (Provide a Reasonable Payback)Proven DesignRedundant Freeze ProtectionProperly Sized (undersized, not oversized)Require No Manual InterventionOperational Indicators or Monitoring
Conservation FirstVerify LoadPerformance GuaranteeRequire Operations and Maintenance Manual and TrainingAcceptance Test

38
Solar System Maintenance Options
Energy Savings Performance Contract:– You pay for delivered energy.
Guaranteed Energy Savings Contract:– You don't pay if energy is not delivered.
Service Contract and Warranty:– You pay fixed service costs, whether needed or not.
Facility does maintenance --– Or, historically, facility doesn't do maintenance:
Low priority (always have hot water at the tap).No inventory of parts and little expertise.Utility bill is always paid while efforts to reduce maintenance budgets are ongoing.

,Temp. Sensor Mount
Expansion Tank
Pump Winding
Pump Capacitor
Leaks
Valves
Collector
PC Board
Relay
DC power supply
Temp. Sensor Open
Working Fine
Problems
O&M Survey of 185 Solar Water Heating Systems

40
Solar Water Heating Resources and References
American Society of Heating, Air Conditioning and Refrigeration Engineers, Inc.– ASHRAE 90003 -- Active Solar Heating Design Manual– ASHRAE 90336 -- Guidance for Preparing Active Solar
Heating Systems Operation and Maintenance Manuals– ASHRAE 90346 -- Active Solar Heating Systems Installation
Manual
Solar Rating and Certification Corporation– SRCC-OG-300-91 -- Operating Guidelines and Minimum
Standards for Certifying Solar Water Heating Systems
FEMP Federal Technology Alert “Solar Water Heating” call 1-800-DOE-EREC or www.eree.energy.gov/femp.

Financing
Project Financing Options• Appropriations• Debt (Commercial Bank Loan)• Mortgage, Home Equity Loan• Limited Partnership• Vendor Financing• General Obligation Bond• Lease• Energy Savings Performance Contracts• Utility Programs• Chauffage (end-use purchase)• Grants• Tax Credits

Home Mortgage or Home Equity Loan• Low Interest Rates, Tax Deductible, Long Terms!• May add to appraised value, mil levy and taxes.• Federal National Mortgage Association (Fannie Mae).
– up to $240,000, market interest rates, allow 2% increase in debt-to-income ratio for energy efficient home, secured, 30 year term.
– Residential Energy Efficiency Improvement Loans up to $15,000 (or up to 10% of base loan), below-market interest rates, unsecured, 10 year term.
• Federal Home Mortgage Loan Corp (Freddie Mac).– up to $240,000, market interest rates or variable prime plus 2%, up
to 10% above base loan amount with Energy Efficient Mortgage.• US Dept of Housing and Urban Development (HUD).
– Up to 10% above base loan amount with Energy Efficient Mortgage.• US Dept of Veterans Affairs (VA).
– for veterans. Up to $230,000, Up to 10% above base loan amount with Energy Efficient Mortgage.

Tips to Reduce Interest Rate:
• Consult with Financier regarding early development of DER contract
• Include fixed termination schedule.• Fix Settlement and Acceptance Dates• Fixed Payments Made On Time• Bundle projects• Be ready to act when negotiating• Escrow or hedge? Project in stages. • Protection of leinholder interest: right to cure or take
performance risk (non-recourse financing).• Make your deal more like standard, commercial
securities.

Financing Example: Energy Efficient Mortgage
Dorothy and Jerry Wheeler Home Mortgage
• 960 Watt PV on new home in Tucson
• PV was $12,000 of $280,000 loan
• 30 year term 7.8% interest• Payments $87/month fixed• Utility savings*, Tax
benefits, reliable, silent, no pollution.
• Included in appraisal (resale).
•$16.5/ month with 6.5 kWh/m2/day solar and $0.0868/kWh powerSource: interview Dorothy Wheeler

Limited Partnership• General Partnership.• Limited Partnership.• No guaranteed rate-of-return (depends on project
performance).• Strategic alliances (eg. Gas LDC partners with DG
supplier).

• 7,200 ft2 solar trough system• $160,000 installed cost
financed by limited partners• 15 years of O&M
($1,800/year) included in price• Heat sold to prison at 90% of
cost of natural gas• Investors paid back from
revenue, but $8000 per year minimum
Financing Example: Limited Partnership
Solar Water Heating Jefferson County Jail
Source: Ken May, IST Corp.

Energy Savings Performance Contracts (ESPC)
• Energy Service Company (ESCo) finances measure in exchange for a share of the energy cost savings.
• Risk of project performance often on the ESCo.• Interest rates prime plus 1.25 to 1.5 % depending on
recourse or non-recourse and perceived risk.• For Federal projects, payments cannot exceed savings and
term cannot exceed 25 years. In practice, term is often less than 15 years.
• Examples include several hundred million dollars worth of projects.

Reallocating the Utility Budget
$
• Pay a lower utility bill• Pay the contractor• Achieve cost savings
Utility Utility BillBill
Utility Utility BillBill
Utility Utility BillBill
ContractorContractorPaymentPayment
Govt.Govt.ShareShare
Govt. Govt. ShareShare Energy
Cost Savings
Before ESPCContract
During ESPCContract
After ESPC Contract

Financing Example: Energy Savings Performance Contract
Phoenix Federal Correctional InstitutionSolar Water Heating ESPC
Installed cost of $650,000 for 17,040 ft2 solar fieldDelivered 1,161,803 kWh in 1999 Saved $77,805 in 1999 at $0.067/kWh.Prison paid Industrial Solar Tech. $70,025 (10% savings)Term 20 years.

Financing Example: Super ESPCNaval Base Coronado
750kW Parking Lot Photovoltaic SystemShaded parking for 444 vehiclesProvides 3% of peak summer demand
$7.7M installed cost, $3.6M CA. incentives$228k annual savings, 9.9 yr SPB w/incentivesM&V: Option A using PVWatts analysis for savings; electric meter installed to monitor performanceEmissions reduction benefits:
NOx: 11,660 lbs, SOx: 10,480 lbs, CO2: 7430 tons

DER Financing Example: Super ESPCNaval Base Coronado

Utility Financing
• substitute for wire-based revenue– Utility DER services by unregulated energy services
business– Utility arranges third-party, non-recourse financing– "If they don't and rates go up sharply, people are
going to buy their own solar panels and pull the plug on the utilities." ... " David Freeman, SMUD.
• to cut cost and enhance wire-based revenue

Utility Programs• Projects financed through contracts and ordering
agreements.• Utility Incentives.
– Demand Side Management (DSM) Bidding Programs,– DSM Rebates.
• Example: Hawaiian utilities offer $800 rebate for residential solar water heaters.
– See www.dsireusa.org for state incentives• Projects provided through tariffs.
– approved by State Public Utility Commissions.• Projects to supply Green Power Purchases.
– electric power generated from renewable energy resources.– certified by third party.– often sold at premium price.

www.dsireusa.org

Financing Example: Utility Tariff
Joshua Tree National Park PV System
• 20.5 kW PV Array
•$273,000 cost financed by Southern California Edison
•Monthly payments $4,368: 9.94% interest plus O&M
•15 year term
EPAct-05?
• The Energy Policy Act of 2005 (EPAct-05) is an update to the Energy Policy Act of 1992, an energy policy for the United States. Among many other things, the 1724 page law provides new tax incentives for a number of solar and energy efficiency measures. Among them are---

Credits & Deductions
• Tax credits for– Improvements to existing and new homes– Residential and commercial solar photovoltaic and solar hot
water heating systems– Residential fuel cells– Commercial fuel cells and microturbines– Hybrid or lean burn vehicle
• Tax deductions for – Highly efficient commercial buildings– EPAct tax credits and deductions (except vehicles) only good
in 2006 and 2007!

But First…Some Definitions
• A tax deduction is subtracted from income before total tax liability is computed.
• A tax credit is subtracted directly from the total tax liability.
Example:• A credit is 3 or more times more advantageous to the
taxpayer than a deduction. • A tax credit of $1,000 for someone in the 28% tax bracket
is equivalent to a tax deduction of $3,570 .

Existing Homes
• One time maximum tax credit limit of $500• Primary residence• For improvements and equipment placed in
service during 2006-2007• Product to meet 2000 International Energy
Conservation Code criteria

Qualified Energy Efficiency Improvements
• Tax credits of 10% of the cost• Insulation material or system that reduces
heat loss or gain • Windows including skylights ($200 tax
credit limit)• Exterior doors• Metal roofs that meet Energy Star program
requirements

Qualified Energy Property Tax Credit Limits
• $50 for any advanced main air circulating fan– Used in furnace that uses no more than 2% of
the total annual energy use of the furnace• $150 for any qualified natural gas, propane,
or oil furnace or hot water boiler – Water heater with EF or 0.80 or greater – Furnace or hot water boiler with AFUE of 95%
or greater

Qualified Energy Property Tax Credit Limits
• $300 for any item of qualified energy property– Electric heat pump water heater with EF of 2.0
or greater – Electric air source heat pumps with HSPF of
9.0 / SEER 13 or greater– Geothermal heat pumps:
• Closed loop products with EER of 16.2 and COP of 3.3 or greater
• Open loop products with EER of 14.1 and COP of 3.3 or greater

Qualified Energy Property Tax Credit Limits
– Direct expansion (DX) products with EER of 15 and COP of 3.5 or greater
– Central air conditioner that receives the highest efficiency tier established by the Consortium of Energy Efficiency as of January 1, 2006
• Split systems – 14 SEER/11.4 EER/9.2 HSPF• Single packaged – 14 SEER/11 EER/8 HSPF

New Homes (Site Built)• $2000 tax credit to eligible contractors for
homes that are Certified to:– Use 50% less for annual heating and cooling
energy than IECC 2003 plus supplements– 20% of savings from building envelope
improvements and equipment must meet NAECA minimum efficiency standards
– Home acquired (purchased) in 2006 - 2007

New Manufactured Homes
• $1000 tax credit per home to builder for homes Certified to:– Use 30% less for annual heating and cooling
energy than IECC 2003 plus supplement– 33% of savings from building envelope
improvements or meet EPA Energy Star Labeled homes program
– Conform to Federal Manufactured Home Construction and Safety Standards

Renewable Energy Credits & Rebates
• Solar hot water (no pools) and Photovoltaics– Commercial
• 30% credit of the cost of a system
– Residential • 30% credit of the cost with a
maximum of $2000 per system

Renewable Energy Credits & Rebates
Photovoltaics (Amendment 37)
– Xcel • PV systems up to 10 kW
– $2.00 per DC watt (nameplate) +– Plus ~$2.50 per DC watt for the Renewable Energy Credits (PVWatts
calculated value based on size, azimuth, tilt, type, inverter)– Monthly $0.115/kWh
• PV systems 10 kW to 100 kW– $2.00 per DC watt (nameplate) +– Monthly $0.115/kWh REC payment
– Colorado Springs Utilities • PV systems up to 10 kW for residential and 25 kW for business applications • ~$4 per AC watt (AC watt calculated based on rating, orientation, tilt,
inverter efficiency)• Expected to decrease $0.25 to $0.50 per year

Renewable Energy Example• Commercial PV -- 10 kW system
– Installed cost $100,000– Utility incentive $45,000 max – Federal tax credit $16,500– Net cost $38,500 – 62% savings through rebates
and tax credits!– Plus generate electricity at retail rate due to net
metering

Commercial Energy Efficiency• EPAct 2005 tax deduction: • Up to $1.80 per square foot• 50% less utility costs than ASHRAE 90.1-2001
compliant model • Energy efficient subsystems ($0.60/sf/subsystem)
– Interior lighting– Heating, cooling, and ventilating and hot water– Envelope
• New construction or existing buildings• Building owner or “designer” for public buildings• Equipment placed in service during 2006-2007
(may be extended)• Requires energy modeling to justify the deduction

Utility Programs Commercial Building by Xcel Energy
• Peak demand rebate (new and existing construction)– Cooling
• Cooling towers - $3/ton• Cooling systems- $10 to $50 per ton
» + $3 to $4 per ton greater efficiency
– Premium Efficiency Motors• $10 to $600 per motor
– Variable Frequency Drives on motors • 1 to 200 hp at $30/hp

Utility Programs Commercial BuildingXcel Energy
• Peak demand rebate continued– New construction:
• Lighting - $1.75 to $18 per fixture, depends on type
– Existing building:• Lighting - $5 to $75 per fixture, depends on
type• VAV boxes - $200 per box to convert from
constant volume

Utility Programs Commercial BuildingXcel Energy• Custom Efficiency program
– Any energy efficiency measures not identified in the prior list may be considered for a Custom Efficiency Rebate
– Xcel determines energy savings internally and provides rebate
– Xcel calculations are not based on an hourly simulation, must work with Xcel before purchasing equipment
– Up to $200 per kW of demand saved

Utility Programs Commercial Building Fort Collins Utility
• Peak demand rebate– Greater of $500 per kW or $0.10 per kWh saved – Applicable systems:
• Lighting; Air conditioning; Motors; • Mechanical systems
• Cooling systems– $50 to $90 per ton for central AC and heat pumps
meeting certain efficiency requirements (includes residential)

Utility Programs Commercial Building Colorado Springs UtilitiesLighting retrofit rebate for existing buildings
– T12 to T8s – $9 to $15 per fixture• Peak demand rebate
– $400 per kW with a minimum 10 kW demand reduction– Applicable systems:
• Lighting replacement: T-8 (all sizes), T-5, and HID • Chiller replacement • Motor replacement • HVAC replacement • Thermal storage devices
– Existing buildings or new construction

Commercial Energy Efficiency Example
• 50,000 sf commercial building • T8 lighting of 0.91 watt/sf
– 1.3 watt/sf per ASHRAE 90.1-2001– EPAct tax deduction
• $0.30/sf = $15,000– Xcel incentive
• $5/fixture + $4/reflector = $7,000

Commercial Energy Efficiency Example• 50,000 sf commercial building • 0.55 kW/ton 170 ton scroll chiller
– 0.72 kW/ton per ASHRAE 90.1-2001– EPAct tax deduction
• $0.60/sf = $30,000– Xcel incentive = $6,290
• $10/ton for minimum efficiency = $1,700• $3/ton for higher efficiency than required (0.64 vs. 0.55
kW/ton) = $4,590

Commercial Energy Efficiency Example
• 50,000 sf commercial building • Solar hot water system
– EPAct tax credit of• $30,000 x 30% = $9,000

Commercial Energy Efficiency Example
• 50,000 sf commercial building • $142,500 investment
– $62,500 Lighting; $50,000 Chiller; $30,000 Solar Hot Water
• $67,290 total incentives– $13,290 XCEL Incentives; $9,000 Federal Tax
Credit; $45,000 Federal Tax Deduction– Plus energy savings over time for the life of
the systems

Commercial Energy Case Study• Summit Middle School, Frisco• Pursuing in design:
– High performance windows with light shelves– Displacement ventilation in classrooms– Daylighting with skylights and light tubes in Learning
Communities and new Gymnasium– Electric control of lighting and daylight levels with photocells
and dimming ballasts – High efficiency lighting design – Efficient boilers – High levels of wall and roof insulation – Demand controlled ventilation
• Will save 42% on energy usage and 32% on energy cost with the current design.

Commercial Case Study
• Summit Middle School, Frisco• Pursuing the following EEMs:
– Additional daylighting controls; Heat pipe heat recovery; Indirect evaporative cooling; High efficiency condensing boiler on an outside air reset schedule; Solar ventilation preheat for gymnasium; Re-Install the 2.4 kW photovoltaic system
• Will save 60% on energy usage and 45% on energy cost if all of these EEMs are in the final design.
• First cost: $216,800• Tax deduction: $315,000• Annual energy savings: $137,600• You do the math!

Thank You!


