23
Solar in State RPS Policies: Recent Developments in New Jersey Kevin Cooney Summit Blue Consulting National Conference of State Legislatures Washington, DC October 19, 2007
Solar in State RPS Policies: Recent Developments in New Jersey
Kevin CooneySummit Blue Consulting
National Conference of State Legislatures
Washington, DCOctober 19, 2007
Overview of Presentation
• State RPS requirements, solar set-asides and targets
• Increasing role of REC Markets
• California Solar Initiative - one approach
• New Jersey approach to date
• New Jersey stakeholder-proposed models for market-based solar development
• Estimated ratepayer impacts of proposed models
• New Jersey’s transition to an SREC-driven solar market
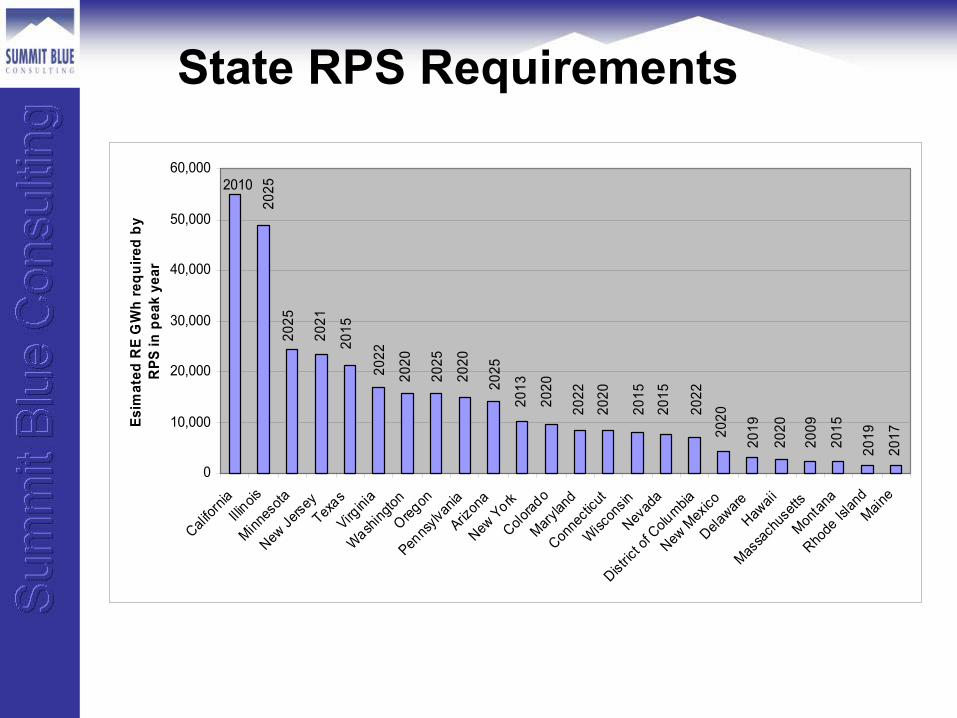
State RPS Requirements
0
10,000
20,000
30,000
40,000
50,000
60,000
Califor
niaIllin
oisMinn
esota
New Je
rsey
Texas
Virgini
aWash
ington
Oregon
Penns
ylvan
iaAriz
ona
New York
Colorad
oMary
land
Conne
cticu
tWisc
onsin
Nevad
a
Distric
t of C
olumbia
New M
exico
DelawareHaw
aii
Massa
chus
etts
Montan
aRho
de Is
land
Maine
Esim
ated
RE
GW
h re
quire
d by
R
PS in
pea
k ye
ar
2010
2025
2021
2015
201320
20
202520
20
2025
2025
2022
2020
2022
202020
15
2015
2022
201720
19
2019
2020
2020
2009
2015
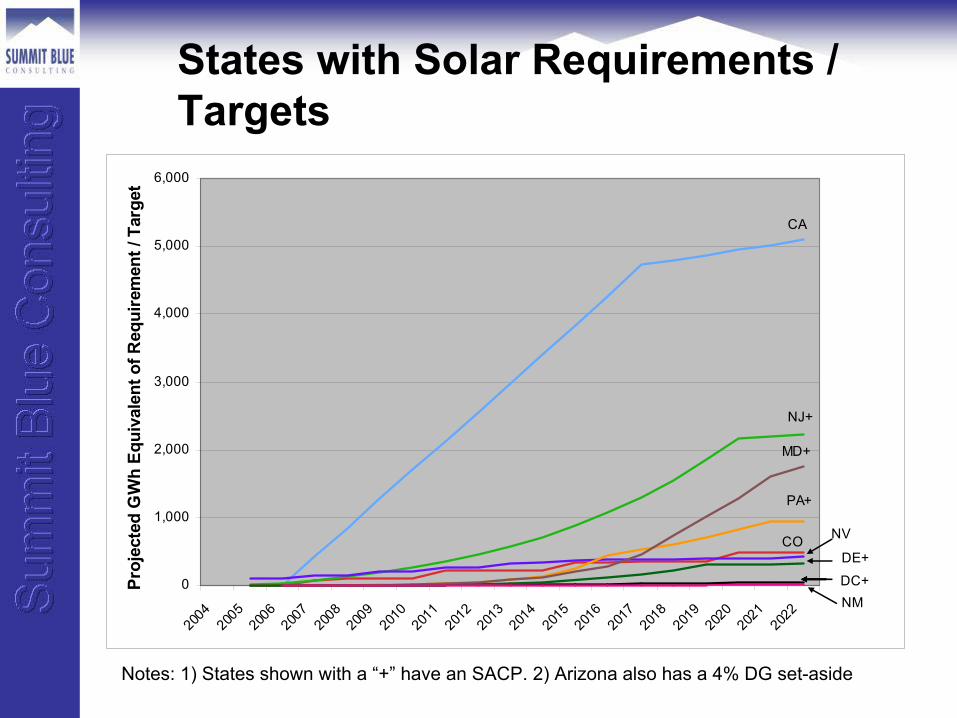
States with Solar Requirements / Targets
Notes: 1) States shown with a “+” have an SACP. 2) Arizona also has a 4% DG set-aside
0
1,000
2,000
3,000
4,000
5,000
6,000
2004
2005
2006
2007
2008
2009
2010
2011
2012
2013
2014
2015
2016
2017
2018
2019
2020
2021
2022
Proj
ecte
d G
Wh
Equi
vale
nt o
f Req
uire
men
t / T
arge
t
CA
NJ+
MD+
PA+
CO NV
DE+
DC+NM
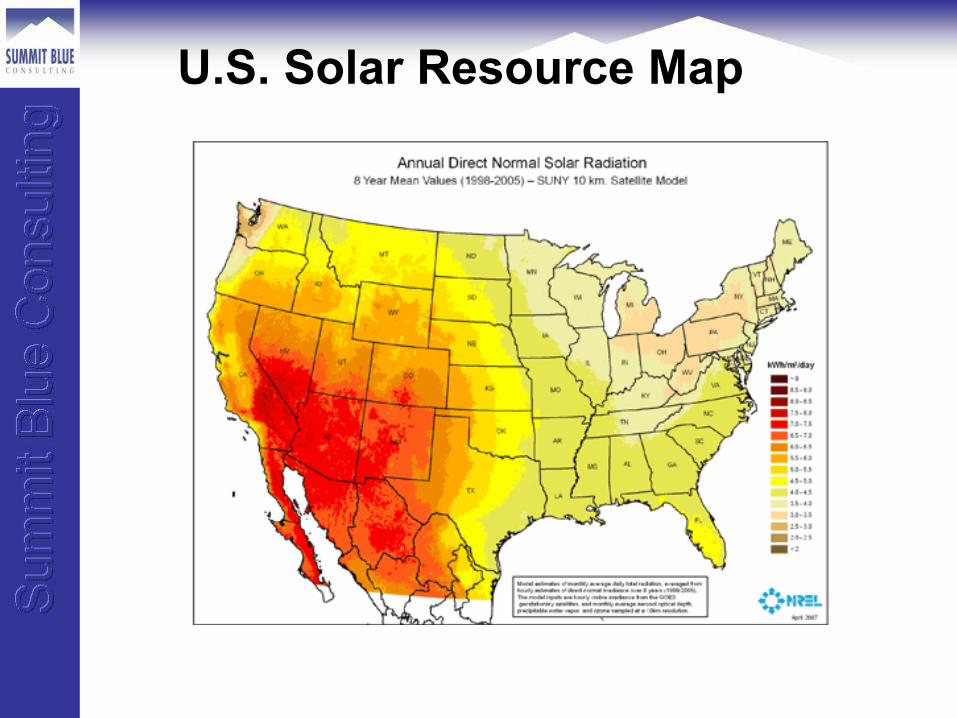
U.S. Solar Resource Map
Rationale for Solar Set-Asides
• Solar and other DG relieve congestion on distribution system and can help defer investments in grid upgrades
• Solar closely matches peak demand for electricity (can help shave peak prices)
• Downstream solar market creates more jobs than other renewables: more accessible to population centers than wind and biomass
• Solar is politically popular with the public
• Note: California’s has the largest solar target in the nation, but it’s not part of the RPS
Reaching Solar Targets• Key Objectives:
– Decrease upfront / levelized cost of solar project
– Provide revenue certainty (minimize risk premiums)
– Increase solar REC (“SREC”) value
• Approaches– Solar Alternative Compliance Payments (SACP) and penalty fees (DC,
DE, MD, NJ, PA)♦ MD: $450/MWh in 2008, declining♦ NJ & DC: currently $300/MWh (NJ increasing dramatically in ’09)♦ PA: 200% of year’s average SREC trading value
– Financial incentives (rebates, $/kWh performance-based incentives, tax credits)
– Solar multipliers for RPS compliance
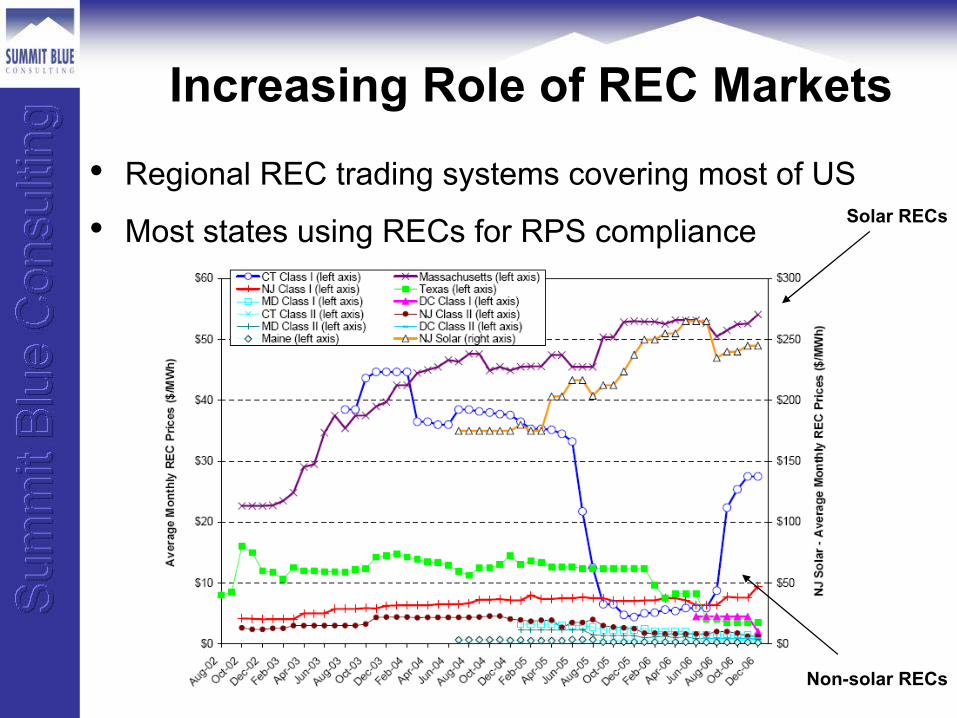
Increasing Role of REC Markets
• Regional REC trading systems covering most of US
• Most states using RECs for RPS compliance Solar RECs
Non-solar RECs
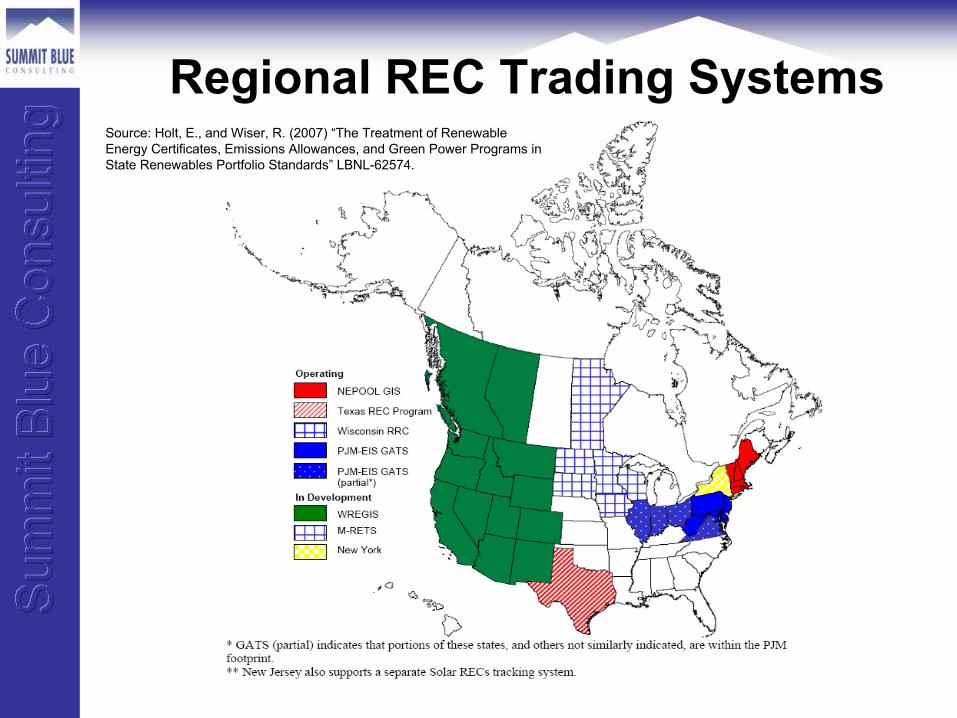
Regional REC Trading SystemsSource: Holt, E., and Wiser, R. (2007) “The Treatment of Renewable Energy Certificates, Emissions Allowances, and Green Power Programs in State Renewables Portfolio Standards” LBNL-62574.
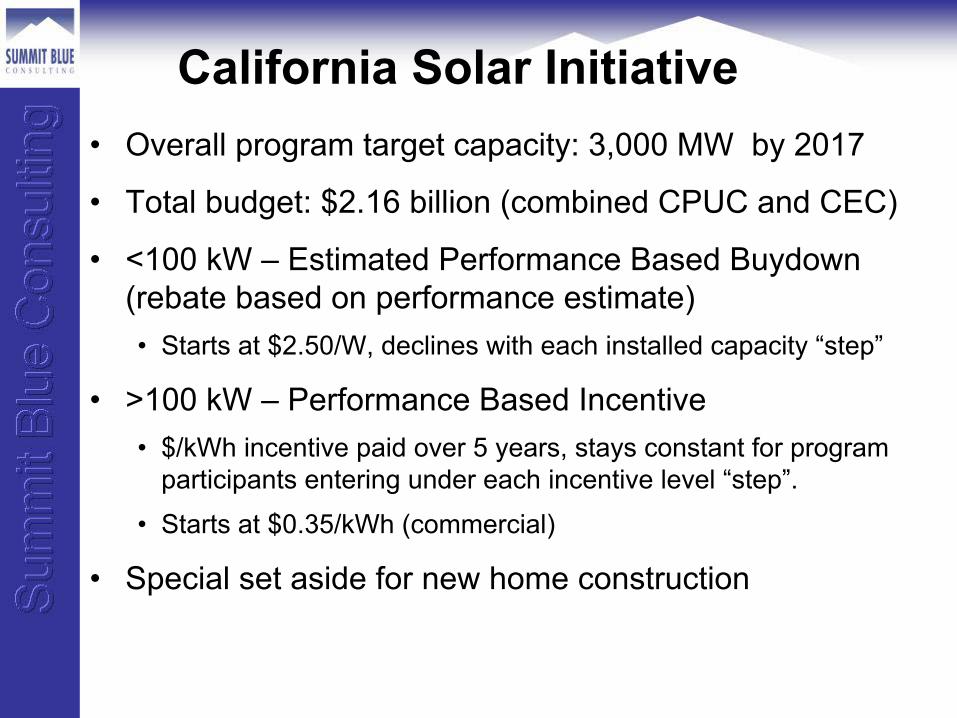
California Solar Initiative• Overall program target capacity: 3,000 MW by 2017
• Total budget: $2.16 billion (combined CPUC and CEC)
• <100 kW – Estimated Performance Based Buydown(rebate based on performance estimate) • Starts at $2.50/W, declines with each installed capacity “step”
• >100 kW – Performance Based Incentive • $/kWh incentive paid over 5 years, stays constant for program
participants entering under each incentive level “step”.
• Starts at $0.35/kWh (commercial)
• Special set aside for new home construction
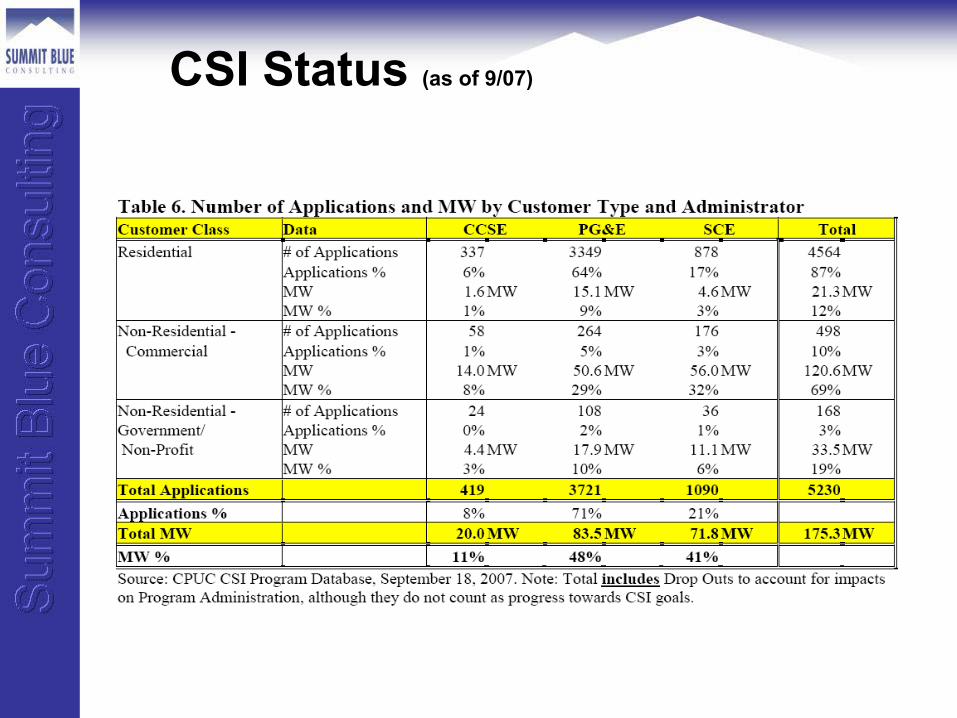
CSI Status (as of 9/07)
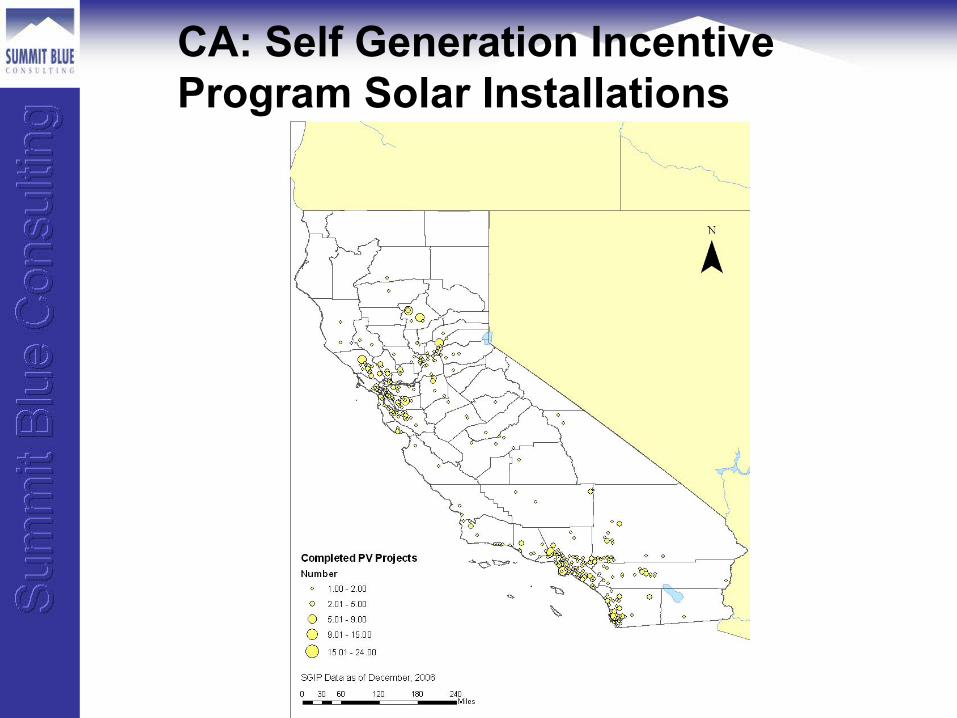
CA: Self Generation Incentive Program Solar Installations
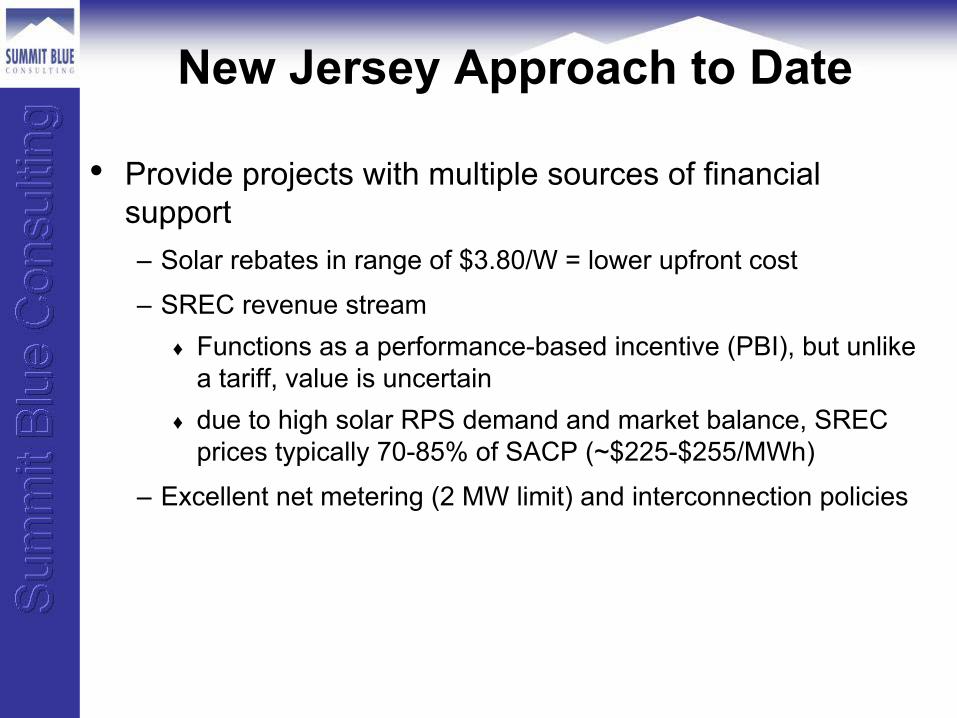
New Jersey Approach to Date
• Provide projects with multiple sources of financial support– Solar rebates in range of $3.80/W = lower upfront cost
– SREC revenue stream ♦ Functions as a performance-based incentive (PBI), but unlike
a tariff, value is uncertain♦ due to high solar RPS demand and market balance, SREC
prices typically 70-85% of SACP (~$225-$255/MWh)
– Excellent net metering (2 MW limit) and interconnection policies
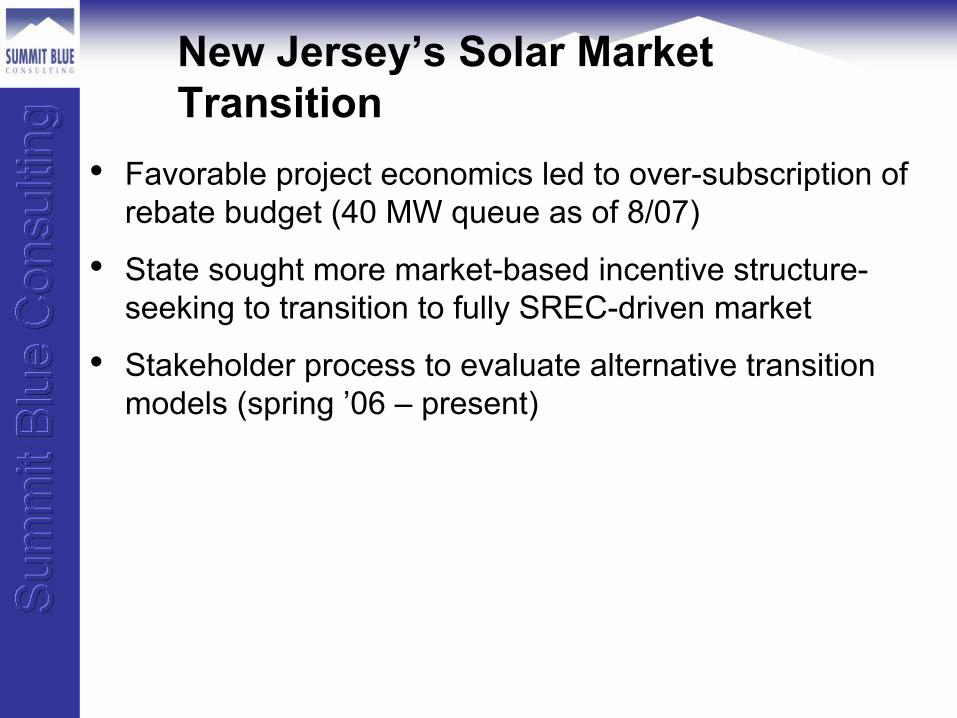
New Jersey’s Solar Market Transition
• Favorable project economics led to over-subscription of rebate budget (40 MW queue as of 8/07)
• State sought more market-based incentive structure-seeking to transition to fully SREC-driven market
• Stakeholder process to evaluate alternative transition models (spring ’06 – present)
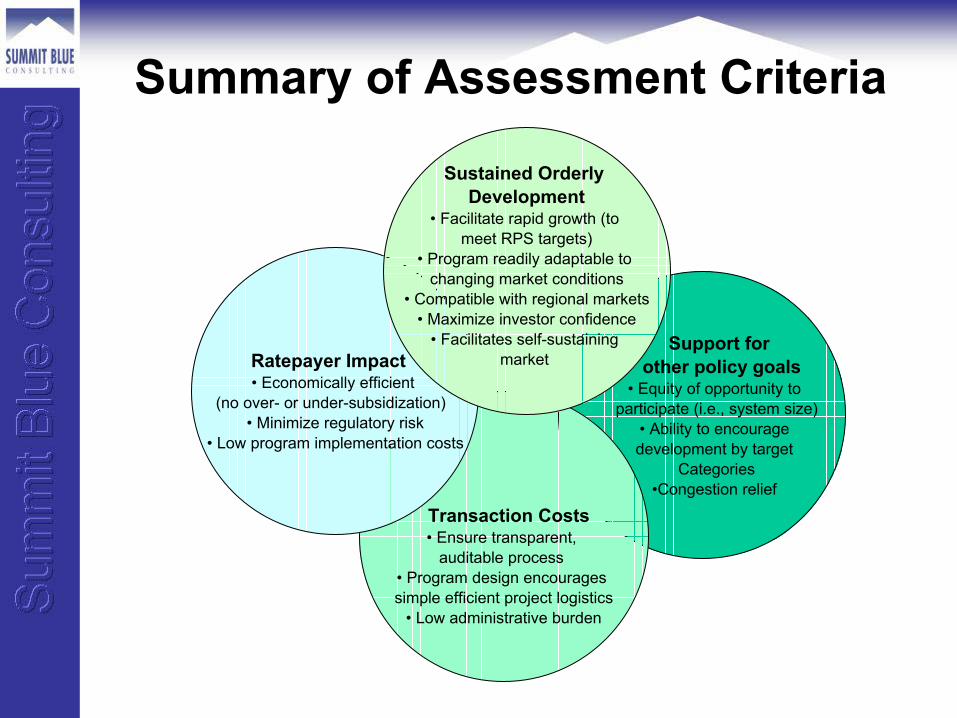
Support for other policy goals
• Equity of opportunity to participate (i.e., system size)
• Ability to encourage development by target
Categories•Congestion relief
Transaction Costs• Ensure transparent,
auditable process • Program design encourages simple efficient project logistics
• Low administrative burden
Ratepayer Impact• Economically efficient
(no over- or under-subsidization) • Minimize regulatory risk
• Low program implementation costs
Summary of Assessment Criteria
Sustained Orderly Development
• Facilitate rapid growth (to meet RPS targets)
• Program readily adaptable to changing market conditions
• Compatible with regional markets• Maximize investor confidence
• Facilitates self-sustaining market
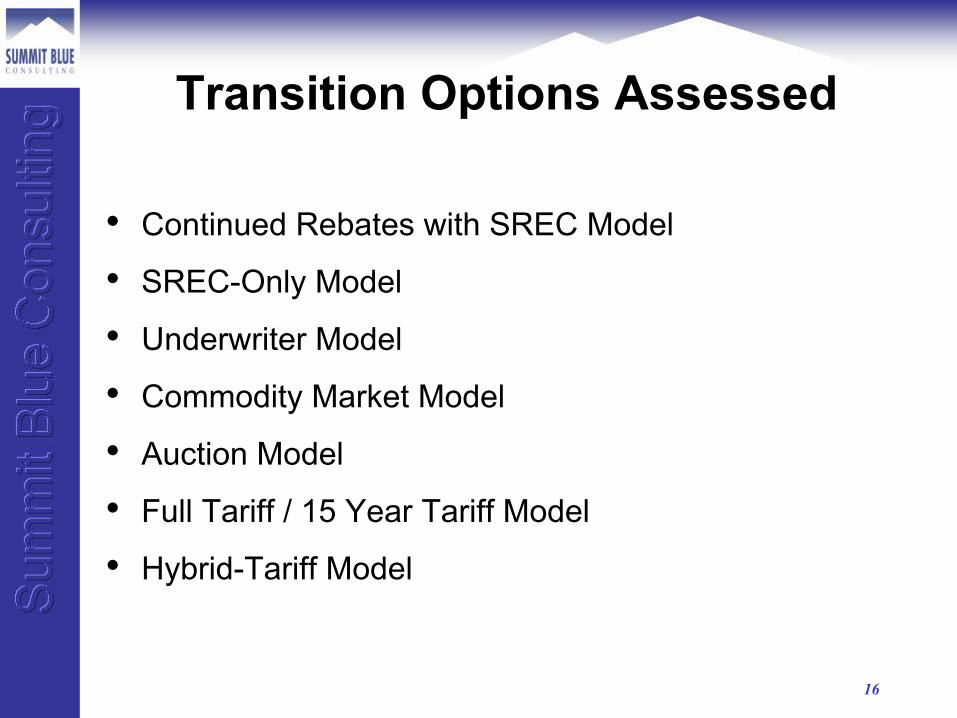
Transition Options Assessed
• Continued Rebates with SREC Model
• SREC-Only Model
• Underwriter Model
• Commodity Market Model
• Auction Model
• Full Tariff / 15 Year Tariff Model
• Hybrid-Tariff Model
16
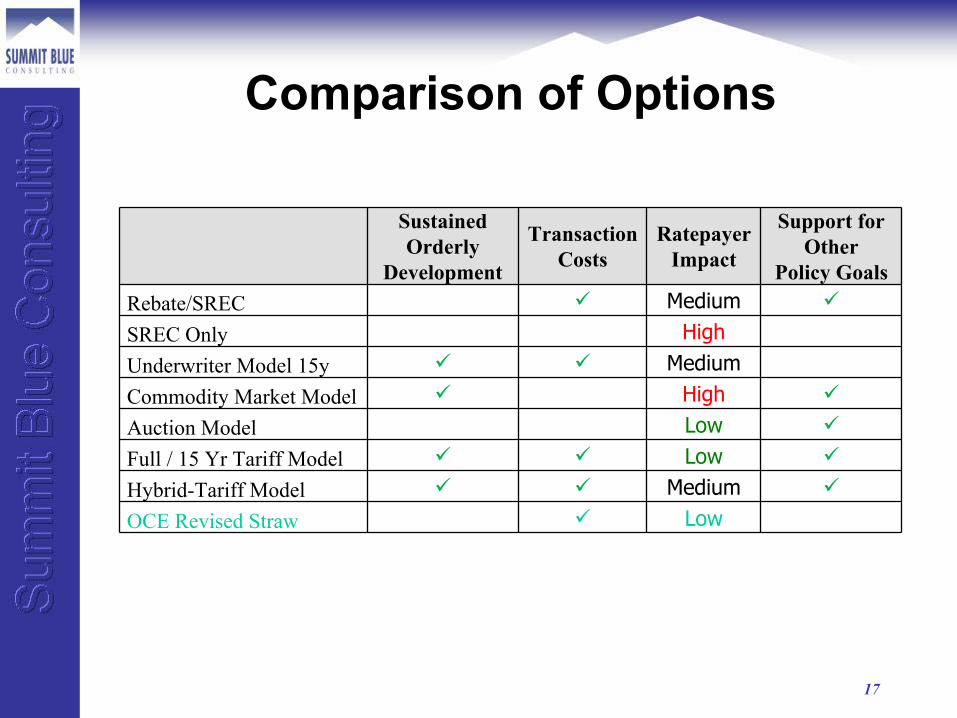
Comparison of Options
17
MediumHybrid-Tariff ModelLowOCE Revised Straw
SustainedOrderly
Development
TransactionCosts
RatepayerImpact
Support forOther
Policy GoalsRebate/SREC Medium
SREC Only High
Underwriter Model 15y Medium
Commodity Market Model High
Auction Model Low
Full / 15 Yr Tariff Model Low
18
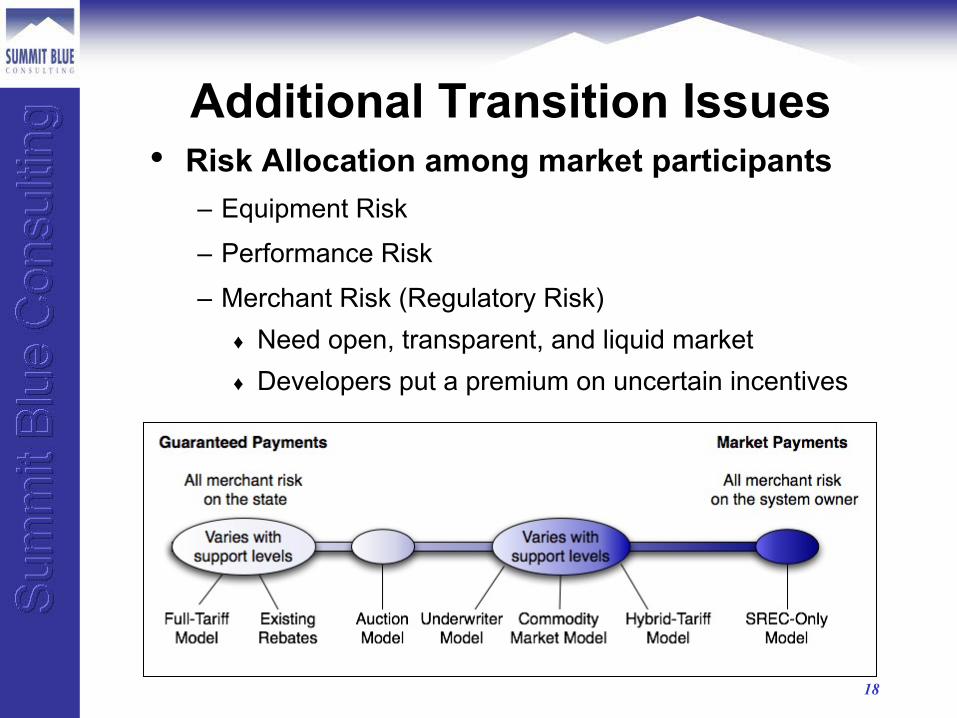
Additional Transition Issues• Risk Allocation among market participants
– Equipment Risk
– Performance Risk
– Merchant Risk (Regulatory Risk)♦ Need open, transparent, and liquid market♦ Developers put a premium on uncertain incentives
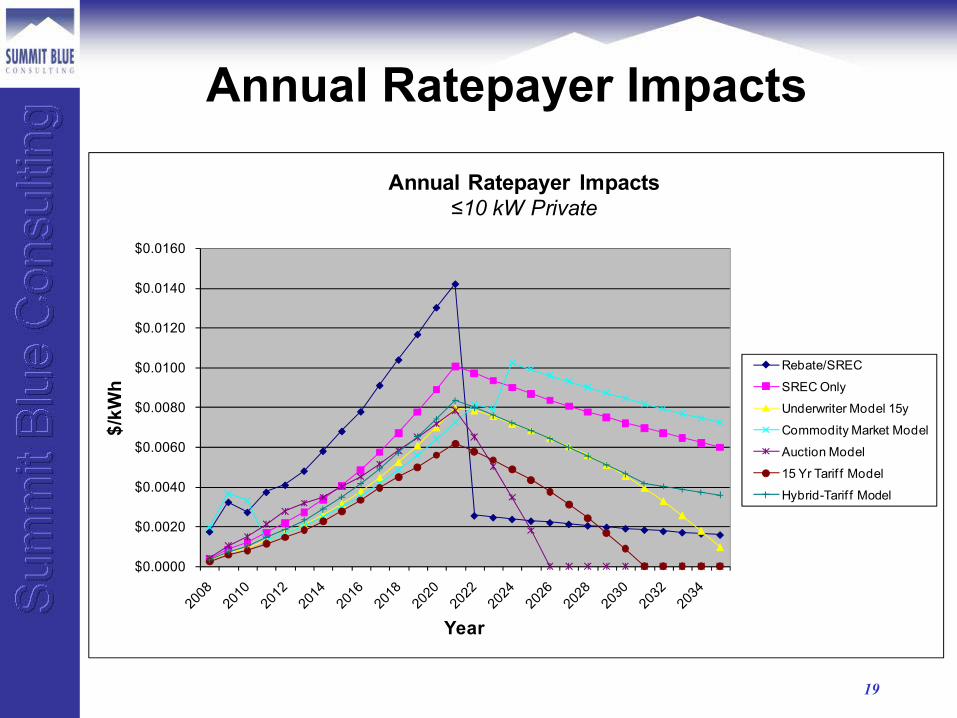
Annual Ratepayer Impacts
19
$0.0000
$0.0020
$0.0040
$0.0060
$0.0080
$0.0100
$0.0120
$0.0140
$0.0160
$/kW
h
Year
Annual Ratepayer Impacts≤10 kW Private
Rebate/SREC
SREC Only
Underwriter Model 15y
Commodity Market Model
Auction Model
15 Yr Tarif f Model
Hybrid-Tarif f Model
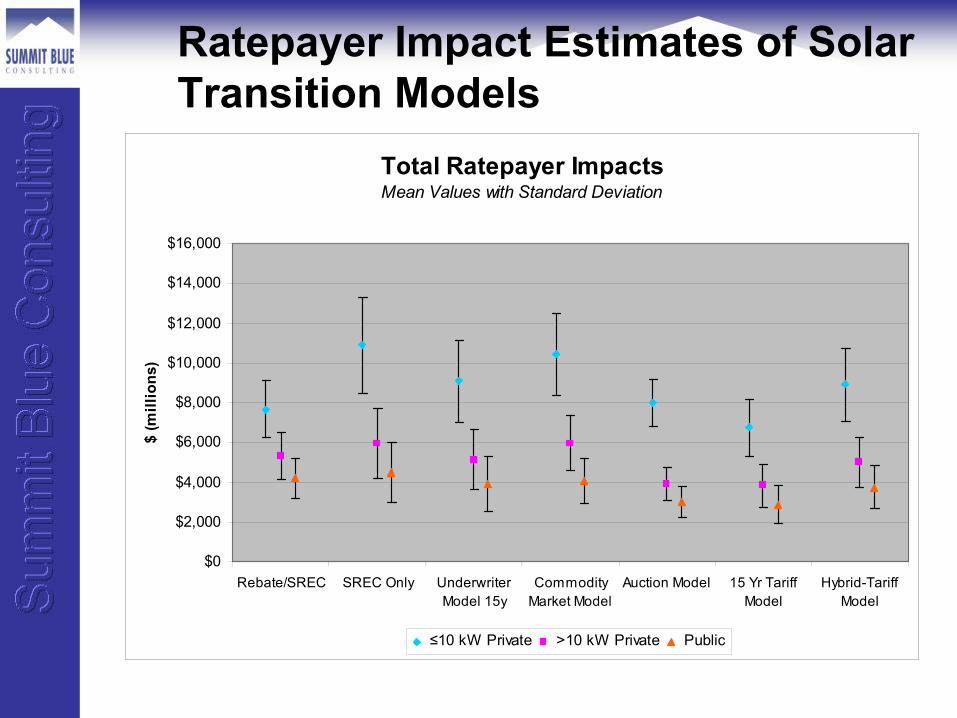
Ratepayer Impact Estimates of Solar Transition Models
Total Ratepayer ImpactsMean Values with Standard Deviation
$0
$2,000
$4,000
$6,000
$8,000
$10,000
$12,000
$14,000
$16,000
Rebate/SREC SREC Only UnderwriterModel 15y
CommodityMarket Model
Auction Model 15 Yr TariffModel
Hybrid-TariffModel
$ (m
illio
ns)
≤10 kW Private >10 kW Private Public
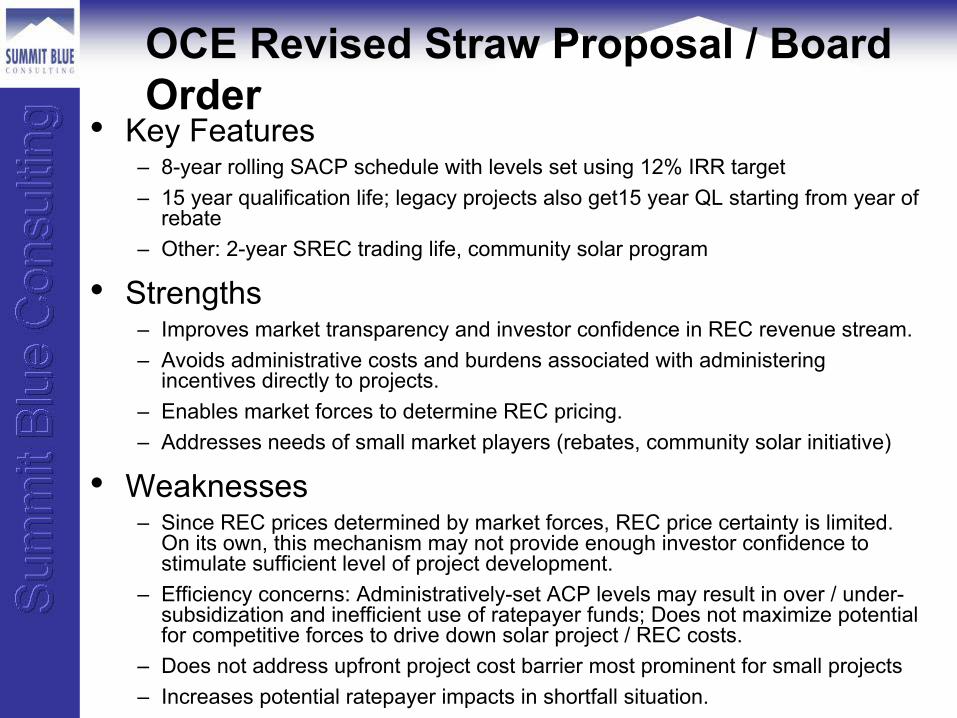
OCE Revised Straw Proposal / Board Order
• Key Features– 8-year rolling SACP schedule with levels set using 12% IRR target – 15 year qualification life; legacy projects also get15 year QL starting from year of
rebate– Other: 2-year SREC trading life, community solar program
• Strengths– Improves market transparency and investor confidence in REC revenue stream.– Avoids administrative costs and burdens associated with administering
incentives directly to projects. – Enables market forces to determine REC pricing. – Addresses needs of small market players (rebates, community solar initiative)
• Weaknesses– Since REC prices determined by market forces, REC price certainty is limited.
On its own, this mechanism may not provide enough investor confidence to stimulate sufficient level of project development.
– Efficiency concerns: Administratively-set ACP levels may result in over / under-subsidization and inefficient use of ratepayer funds; Does not maximize potential for competitive forces to drive down solar project / REC costs.
– Does not address upfront project cost barrier most prominent for small projects– Increases potential ratepayer impacts in shortfall situation.
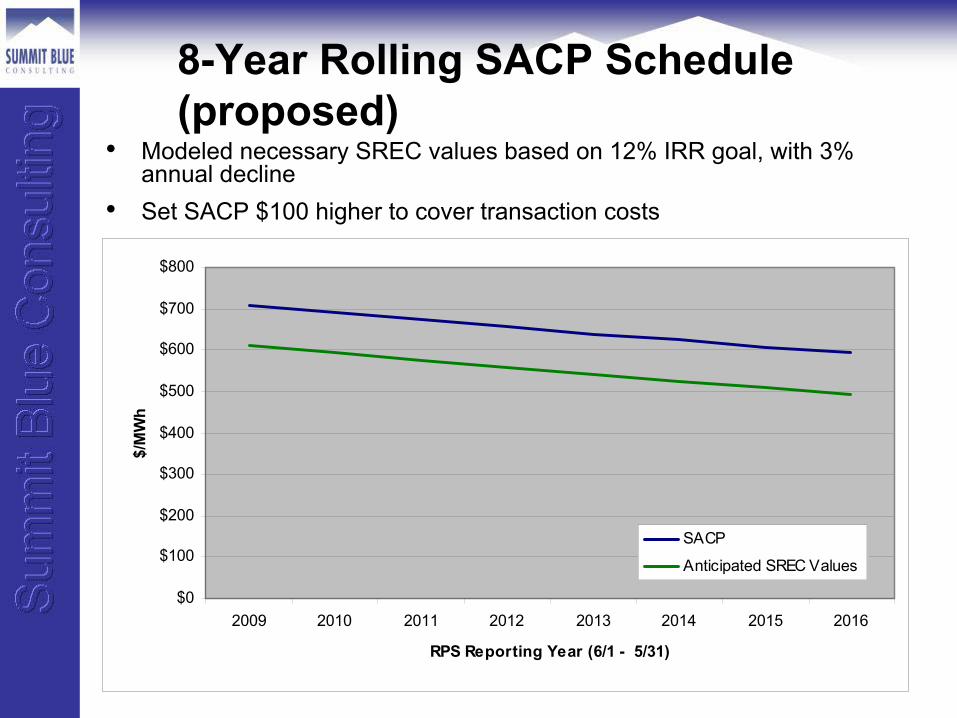
8-Year Rolling SACP Schedule (proposed)
• Modeled necessary SREC values based on 12% IRR goal, with 3% annual decline
• Set SACP $100 higher to cover transaction costs
$0
$100
$200
$300
$400
$500
$600
$700
$800
2009 2010 2011 2012 2013 2014 2015 2016
RPS Reporting Year (6/1 - 5/31)
$/M
Wh
SACP
Anticipated SREC Values