To be submitted to PNAS 1 Draft: 9/21/2005 PHYSICAL SCIENCES: Environmental Sciences Solar influence on climate during the past millennium: results from transient simulations with the NCAR Climate System Model Caspar M. Ammann 1 , Fortunat Joos 1,2 , David S. Schimel 1 , Bette L. Otto-Bliesner 1 , Robert A. Tomas 1 1 Climate and Global Dynamics Division, National Center for Atmospheric Research, 1850 Table Mesa Drive, Boulder, CO 80307-3000, USA 2 Climate and Environmental Physics, Physics Institute, University of Bern, Sidlerstr. 5, CH-3012 Bern, Switzerland. Corresponding Author: Fortunat Joos, Climate and Environmental Physics, Physics Institute, University of Bern, Sidlerstr. 5, CH-3012 Bern,Switzerland; [email protected]; ph: ++41-31-631 44 61, fx: ++41- 31-631 87 42 Until 11-23-2005 : Climate and Global Dynamics Division, National Center for Atmospheric Research, 1850 Table Mesa Drive, Boulder, CO, 80305, ph: ++1-303 497 13 44; fx: 1-303 497 16 95 Number of text pages (incl. Fig): 28 (text 22 + 6 pages for figures Number of figures: 4 plus two supplementary figures Number of tables: 0 Number of words in abstract: 245 (limit: 250) Total Number of characters (incl. figures and tables): 46’848
Transcript
To be submitted to PNAS 1 Draft: 9/21/2005
PHYSICAL SCIENCES: Environmental Sciences
Solar influence on climate during the past millennium: results from transient
simulations with the NCAR Climate System Model
Caspar M. Ammann1, Fortunat Joos1,2, David S. Schimel1,
Bette L. Otto-Bliesner1, Robert A. Tomas1
1Climate and Global Dynamics Division, National Center for Atmospheric Research,
1850 Table Mesa Drive, Boulder, CO 80307-3000, USA
2Climate and Environmental Physics, Physics Institute, University of Bern, Sidlerstr. 5,
CH-3012 Bern, Switzerland.
Corresponding Author:
Fortunat Joos,
Climate and Environmental Physics, Physics Institute, University of Bern, Sidlerstr. 5,
Abstract Changes in solar activity likely explain a considerable part of global climatic variation over the past millennium. Because solar variability prior to the satellite period must be scaled from proxy data, large uncertainty exists over the low-frequency magnitude of the forcing. We forced a coupled climate system model over the published range of solar irradiance estimates to determine if part of the previously estimated large range of past solar irradiance changes could be excluded. Transient simulations integrated from AD 850 through the ’Medieval Warm Period’ and the ‘Little Ice Age’ to the present show a clearly detectable signal from the sun as well as from volcanic aerosols. The temperature response is larger over land and in high latitudes resulting in a larger temperature response in the Northern than in the Southern hemisphere. Solar forcing produced low-frequency climate evolution generally consistent with the data-based temperature reconstructions. The largest peak-to-peak temperature differences are found with largest solar forcing. Smaller rather than larger long-term trends in solar irradiance appear more likely and produced modeled climates in better agreement with the range of Northern Hemisphere temperature proxy records both in phase and magnitude. Despite the significant sensitivity of the model to solar forcing, even large solar combined with realistic volcanic forcing could not explain the 20th Century warming without greenhouse gas effects. Although solar and volcanic effects appear to dominate most of the slow climate variations within the past thousand years, greenhouse gas effects have dominated the last century.
To be submitted to PNAS 3 Draft: 9/21/2005
1. Introduction Understanding and quantifying natural climate variability on decadal to centennial
time scales is a prerequisite to projecting future climate changes. It is important to
evaluate comprehensive models in the pre-industrial period when natural variations were
(relatively) pronounced and anthropogenic influences were comparatively small. The
recently improved records of the variations in climate of the past 1000 years (1) together
with solar and volcanic forcing histories (2, 3) provide a key opportunity for (a)
evaluating long transient simulations with Atmosphere-Ocean General Circulation
Models (AOGCMs) over the preindustrial era, (b) for exploring the proposed magnitudes
of past solar irradiance changes and (c) to estimate natural contributions to century scale
climate variability.
A range of Northern Hemisphere (NH) and one global surface temperature
reconstructions for the past millennium have become available in the past few years.
These studies infer the magnitude of past temperature variations from proxy data such as
tree ring width and density, coral growth, ice core, speleothem and documentary data or
from borehole temperature profiles. The reconstructions have a variety of uncertainties
and, especially at longer time scales, individual temperature series deviate notably from
each other. This is particularly the case for the magnitude of the cooling during the period
generally referred to as the Little Ice Age (~1300-1850). However, most maintain a
similar temporal structure, and taken together they suggest that natural century scale NH-
temperature variations over the past millennium remained within 0.3ºC (low estimate: (4,
5) to about 0.9ºC (high estimate, e.g., (6-8)).
To be submitted to PNAS 4 Draft: 9/21/2005
The dominating natural forcings on sub-millennium time scales result from
explosive volcanism and from changes in solar energy output. Great uncertainty remains
about their magnitude. Explosive volcanic eruptions generate large aerosol clouds in the
stratosphere where they perturb both incoming and outgoing radiation (9, 10). Generally,
the former is the dominating effect and surface cooling occurs (11, 12). The bulk of the
direct forcing for individual events is limited to a few years by the relatively short
residence time of the injected particles in the lower stratosphere (13). Prolonged effects
have been documented for temporally relatively closely spaced eruptions (14, 15), but
could also result from extremely large eruptions with injection of material at very high
altitudes.
There is an ongoing debate on the role of the sun in recent observed warming.
Century-scale solar irradiance variations have been proposed as cause for past climatic
changes (e.g. (16, 17)). The latest summaries of the various uncertainties can be found in
two recent reviews (18, 19). Satellite data since 1979 quantify the irradiance variations
associated with the 11-year Schwabe sunspot cycle to roughly 0.08-0.1% of the ~1367
Wm-2 solar radiation reaching the top of our atmosphere (19). This variation translates
into a radiative forcing of about 0.2-0.3 W m-2, roughly a factor of 10 smaller than the
radiative forcing by well-mixed Greenhouse Gases of 2.4 W m-2 in 2000 AD (relative to
1750 AD). Although direct measurements of solar irradiance are limited to the satellite
period (19), tentative correlations with records of sunspots (20, 21), aurora histories,
geomagnetic indices, or the production rates of cosmogenic nuclei such as 10-Beryllium
(10Be) and radiocarbon (14C) (2, 22) in conjunction with magnetic behavior of solar-like
stars (23, 24) have been used to estimate solar irradiance in the past. The temporal
To be submitted to PNAS 5 Draft: 9/21/2005
evolution of the different proxy series, particular in certain well-defined frequencies
(~11-year Schwabe Cycle, ~80-85-year Gleissberg Cycle, and ~207-year deVries Cycle),
is in reasonable agreement across most solar proxies (18). However, the scaling required
to translate a proxy record of sunspot number or production rate of 10Be into actual solar
irradiance anomalies is highly uncertain and published estimates of multi-decadal solar
irradiance changes vary by a factor of more than five ((2, 14).
Possible transient effects of solar irradiance changes on climate have been
investigated with computationally efficient models, such as Energy Balance Models (14,
25) and Models of Intermediate Complexity (26, 27) as well as with Atmosphere-Ocean-
General Circulation Models for the 20th century (28) and the past (29).
Here, we employ a coupled AOGCM in experiments covering the period of the
last 1150 years. The low-frequency solar forcing was taken from the 10Be record and
scaled to solar irradience over much of the published range. We identify links between
the solar forcing and modeled temperature as well as proxy-based temperature
reconstructions.
2. Model and Forcings
Simulations for this study are conducted with the NCAR Climate System Model
(CSM), Version 1.4, a global coupled atmosphere-ocean-sea ice-land surface model
without flux adjustments (30, 31). The atmospheric model is CCM3, a spectral model
with 18 levels in the vertical. For these experiments, it is run at T31 resolution (an
equivalent grid spacing of roughly 3.75 by 3.75 degrees). The land surface model has
specified vegetation types and a comprehensive treatment of surface processes. The land
To be submitted to PNAS 6 Draft: 9/21/2005
model uses the same grid spacing as the atmosphere model. Freshwater balance is
maintained with the precipitation scaling scheme described in (32). The ocean model is
the NCAR CSM Ocean Model (NCOM) with 25 levels, 3.6° longitudinal grid spacing,
and latitudinal spacing of 1.8° poleward of 30° smoothly decreasing to 0.9° within 10° of
the equator. The sea ice model includes ice thermodynamics based on the three-layer
model and ice dynamics based on the cavitating fluid rheology. The grid spacing is the
same as that of the ocean model.
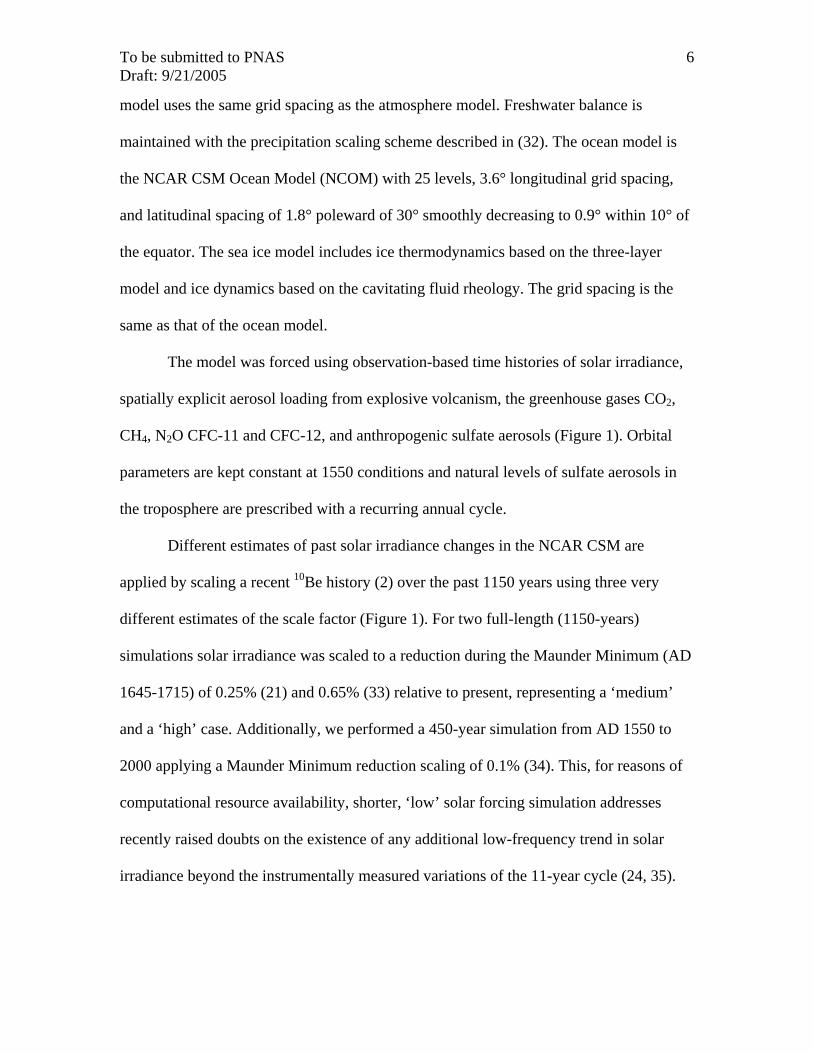
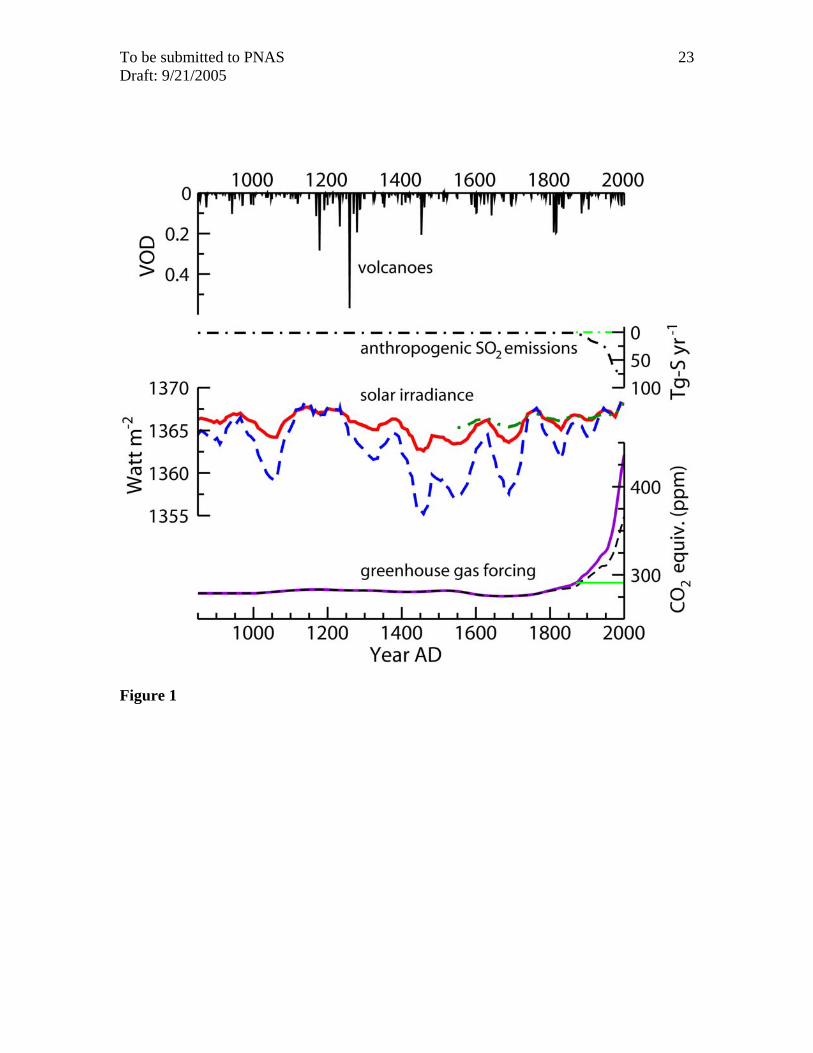
The model was forced using observation-based time histories of solar irradiance,
spatially explicit aerosol loading from explosive volcanism, the greenhouse gases CO2,
CH4, N2O CFC-11 and CFC-12, and anthropogenic sulfate aerosols (Figure 1). Orbital
parameters are kept constant at 1550 conditions and natural levels of sulfate aerosols in
the troposphere are prescribed with a recurring annual cycle.
Different estimates of past solar irradiance changes in the NCAR CSM are
applied by scaling a recent 10Be history (2) over the past 1150 years using three very
different estimates of the scale factor (Figure 1). For two full-length (1150-years)
simulations solar irradiance was scaled to a reduction during the Maunder Minimum (AD
1645-1715) of 0.25% (21) and 0.65% (33) relative to present, representing a ‘medium’
and a ‘high’ case. Additionally, we performed a 450-year simulation from AD 1550 to
2000 applying a Maunder Minimum reduction scaling of 0.1% (34). This, for reasons of
computational resource availability, shorter, ‘low’ solar forcing simulation addresses
recently raised doubts on the existence of any additional low-frequency trend in solar
irradiance beyond the instrumentally measured variations of the 11-year cycle (24, 35).
To be submitted to PNAS 7 Draft: 9/21/2005
The volcanic forcing was established following earlier work (15) by converting
ice core aerosol proxies to latitudinal and temporally varying atmospheric aerosol fields.
Volcanic aerosol was specified as a single aerosol size distribution and optical depth is
scaled linearly with the aerosol loading. Atmospheric CO2, CH4 and N2O concentrations
were individually prescribed following ice core measurements and direct atmospheric
observations. The CFC-11, scaled to take into account the radiative forcing by other
halogenated species and SF6 (36), and CFC-12 concentration histories are based on
historic emission data and recent measurements. The volcanic and anthropogenic forcing
histories were the same in all three simulations. A parallel control experiment without
any forcing changes was run over 1150 years. This control exhibits a drift in global-
average surface temperature of 0.07ºC per century over the first 600 years; after 1500 AD
global average surface temperature remains approximately constant. All results shown
here are detrended; shown are the residuals after subtracting a spline fit for individual
months of the annual cycle at each model grid point obtained from the control
integration.
The main experiments include the anthropogenic change in radiative forcing over
the industrial period. In order to evaluate the contribution of natural forcing (solar and
volcanic) to the 20th century climate change additional simulations were performed over
the period 1870 to 1999 with all anthropogenically influenced forcings fixed at the 1870
AD values. These simulations are branches of the three main experiments to take into
account the inertia of the climate system and the influence of preindustrial forcing
changes on 20th century climate.
To be submitted to PNAS 8 Draft: 9/21/2005
3. Results
Both simulations covering the full 1150-years (Figure 2) show a clear two-stage
initial warming interrupted by a temperature drop in the 11th century. Relative maxima in
global temperatures occur during the 10th century and between the late 11th and the 12th
century. Subsequently, modeled temperatures decrease. Globally, the coldest episodes are
in the 15th (high solar forcing), 15th and 17th century (medium solar forcing) and the
19th century (low solar forcing, but based on a shorter run). Over the instrumental record
after 1850, all three runs are essentially indistinguishable and they closely match the
observed global warming both in magnitude and in temporal evolution. In all three
simulations, decadal-mean global average surface temperature was higher during the
most recent three to four decades than during the previous 1100 years. During the
preindustrial period, the three experiments are generally separated by several tenths of a
degree Celsius (Figure 2). The difference is due to the solar forcing since that was the
only difference between the experiments. This difference is greater than one standard
deviation of the low-frequency variability of the control run of 0.107ºC). Decadal-scale
Northern Hemisphere surface temperature is generally synchronous with the global-
mean, but NH-perturbation amplitudes are larger by about 20%.
Several sharp cooling episodes mark the response to very large volcanic forcing
(e.g., AD 1258, 1453, 1815). The largest volcanic forcing was estimated for AD 1258
(Figure 1) following the probably largest explosive eruption of the past few thousand
years. The source volcano of this event is still unknown, although from deposition
starting ~1258 at both polar ice caps it is clear that it is a tropical event. This particularly
large event is followed by a remarkable sequence of large eruptions causing a clear
To be submitted to PNAS 9 Draft: 9/21/2005
temperature decrease of several tenths of a degree Celsius over the late 13th century
(Figure 2). Similar cumulative volcanic cooling is also simulated in the mid 15th, the
17th, the early 19th as well as (to a lesser degree) late 19th - early 20th century.
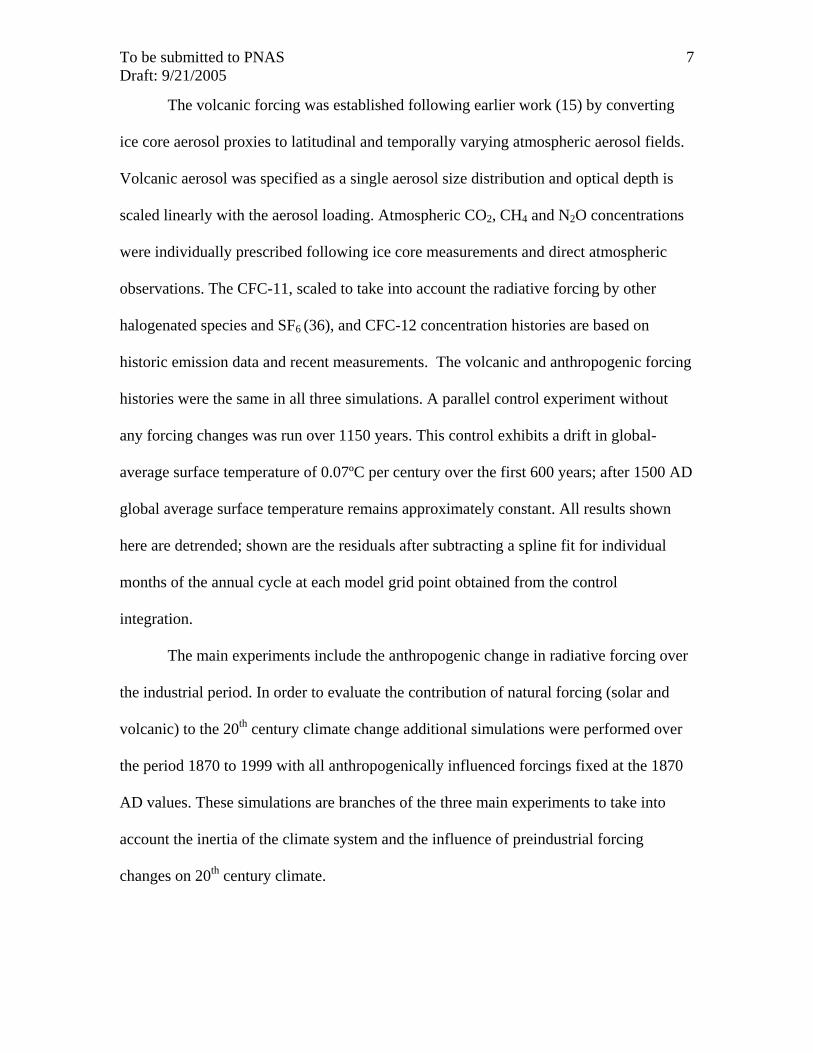
The pre-industrial range in multi-decadal global surface temperature is reduced by
more than a factor of two in the low and medium experiments compared to the high solar
forcing case (Figure 2). The amplitude difference between the warmest and coldest
periods at the decadal time scale is ~0.4ºC (pre-1850) for the low and medium
simulations as compared to ~1ºC for the high scaling. The largest scaling of the solar
forcing yields both the coldest and warmest decades in all simulations prior to the late
20th century.
There is a link between simulated low-frequency climate variability and the
natural climate forcings during the preindustrial period. The correlation between solar
forcing and modeled global surface temperature series decreases with diminishing solar
forcing magnitude. Fifty-year long, Gaussian-weighted global surface temperature
variations in the large-forcing experiment is almost entirely determined by the solar
forcing (decadal data : r2=0.88). This cause-effect link is reflected in a tight phase
relationship in the dominant century-scale frequency band of solar variability (~1/200 yr,
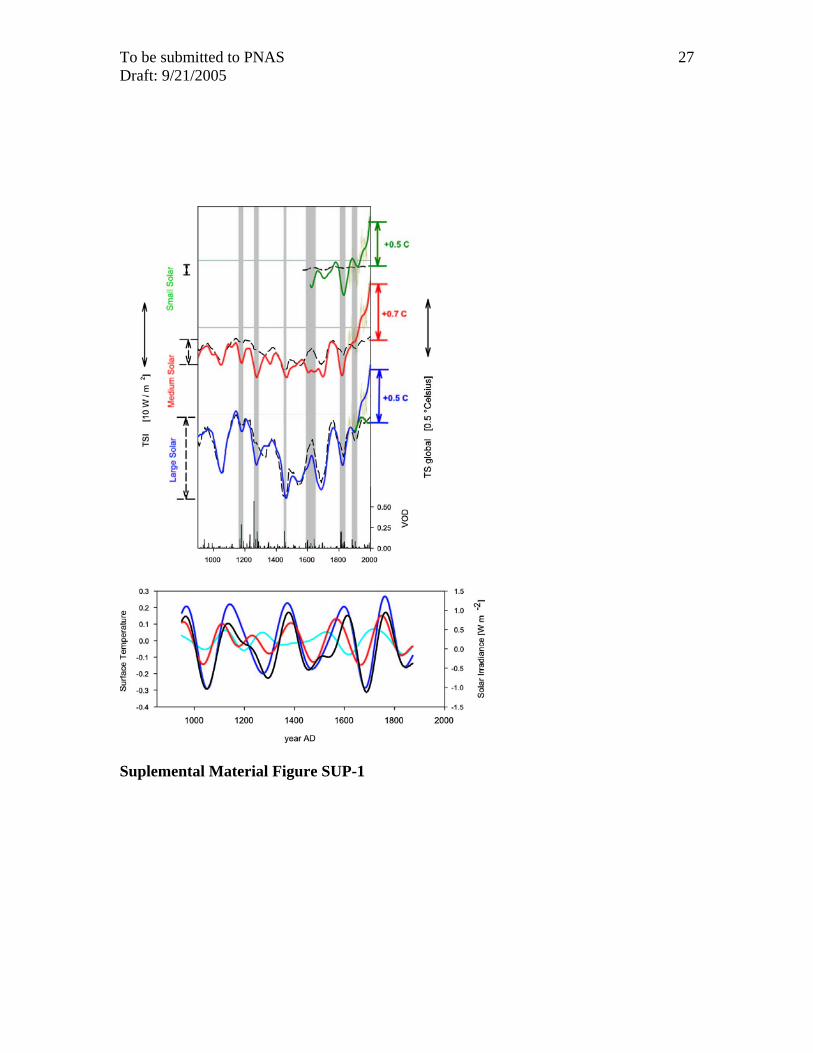
Supplemental Material, Figure SUP-1). The strength of the relationship between solar
forcing and global surface temperature (r2=0.47) as well as the magnitude of the response
are reduced in the medium-forcing run. The solar forcing response becomes smaller
relative to the model’s internal variability and the ratio of solar signal to volcanic
influence and/or model noise decreases. Deviations of simulated temperature evolution
To be submitted to PNAS 10 Draft: 9/21/2005
from the evolution of irradiance do occur repeatedly and are almost exclusively negative
due to explosive volcanism. (Supplemental Material, Figure SUP-1).
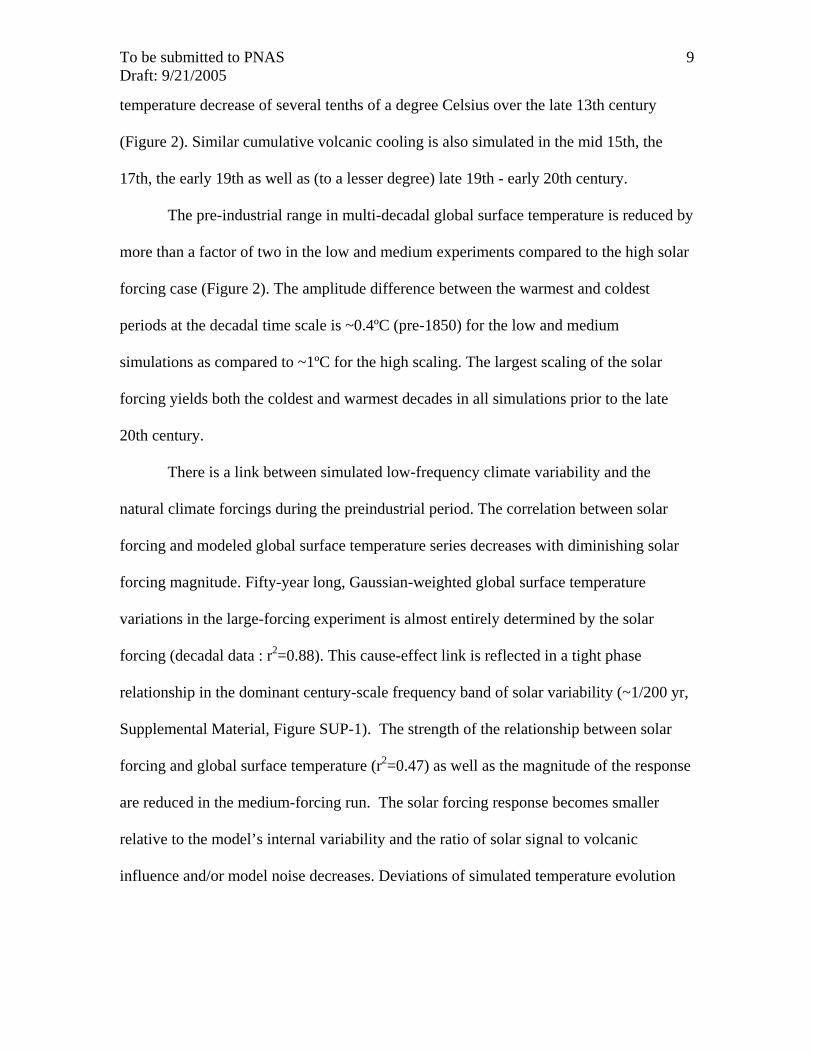
The simulated decadal-scale NH temperature variations of the medium-scaled run
fall mostly within the uncertainty band from the proxy-based reconstructions (Figure 3b).
Only during the cool interval within the ‘Medieval Warm Period’ (~1050 AD) are the
temperatures falling below this range. Generally, the reconstructed high temperatures in
the 11th and 12th centuries and the cold conditions between 1450 and 1800 AD are
reflected in the model results. Relative minima and maxima found in the proxy
reconstructions such as those in the late 18th century and the beginning of the 19th century
or around 1570 and 1450 are also found in the medium-scaled simulation. For a
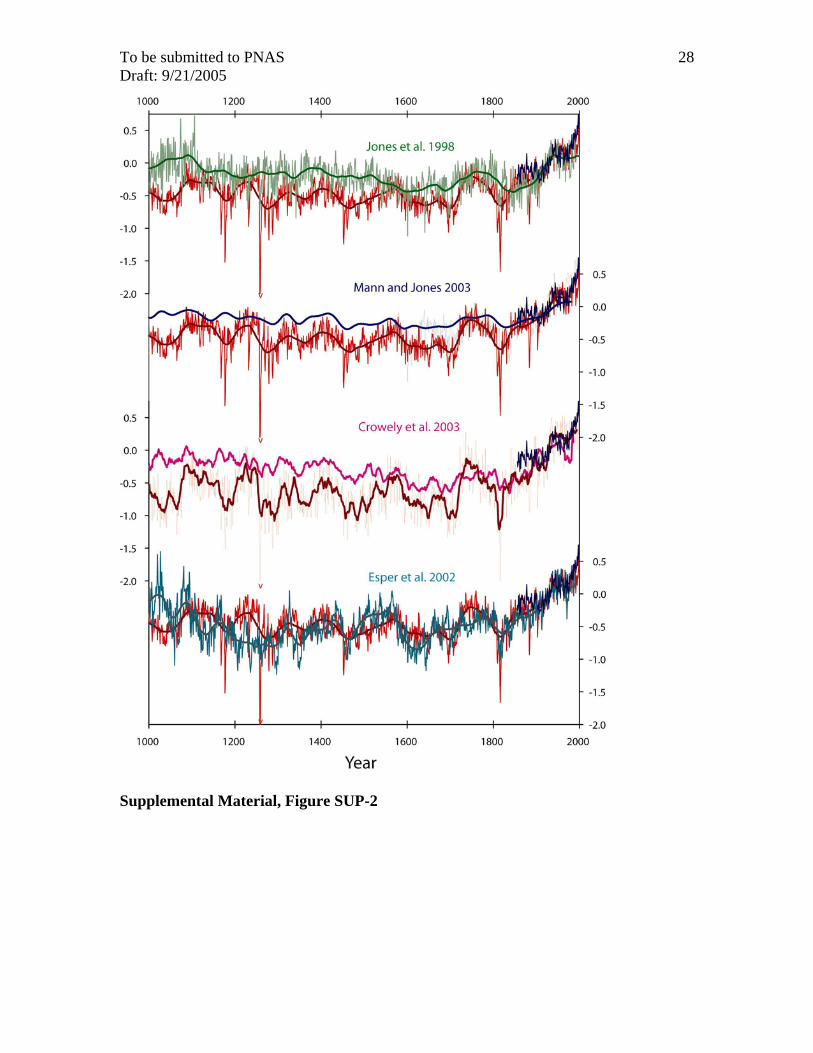
comparison between modeled NH temperatures with various proxy reconstructions see
supplemental material, Figure SUP-2.
The results of the low and high solar forcing experiments encompass the (pre-
1850) amplitude range in multi-decadal-averaged NH temperatures of the available proxy
reconstructions. The preindustrial amplitude of up to 1.2ºC for NH-temperature found in
the high solar forcing simulation is larger than in all reconstructions. However, the
variations of the order of 0.9ºC proposed by (7, 8) are similar. The pre-1850 NH-
temperature range of 0.3ºC found in the low case is essentially the same as proposed by
(5).
Solar forcing and low-frequency volcanic forcing are anticorrelated around 1600
(Figure 1). The 10Be and radiocarbon records (2, 18) suggest that solar forcing increases
in the late 16th century to peak early in the 17th century, whereas volcanic eruptions tend
to cool the Earth surface at the same time. It is a robust features of all temporally-
To be submitted to PNAS 11 Draft: 9/21/2005
resolved reconstructions that the NH cools after ~1570 AD (Figure 1a). This is also the
case in the medium-scaled run (Figures 2 and 3). In contrast, simulated NH temperature
in the large-scaled run continues to increase after 1570 until the peak in the 10Be solar
forcing around 1620 AD. This suggests that the ratio between prescribed solar forcing
and volcanic forcing is too big in the large-scaled run. This effect of a very strong solar
influence on the phase of the low-frequency variation is also illustrated in the
supplemental material (Figure SUP-1b).
Turning to the instrumental record, all three simulations with anthropogenic
forcing yield a twenty-century warming of about 0.5ºC (small and high solar) to 0.7ºC
(medium solar) (Figure 3c). This is fully consistent with the data-based estimate of 0.6+-
0.2ºC and the evolution of global-mean surface temperature very closely matches the
instrumental record. The natural-only extensions for all three simulations after 1870
(holding greenhouse gases and tropospheric aerosol constant at 1870 conditions) yield a
20th century peak warming (decadally smoothed data) of about 0.2ºC which is reduced to
0.1ºC by the end of the century through increased volcanism. The separation of a human-
induced warming from the natural background temperature evolution occurs early in the
20th century in the model.
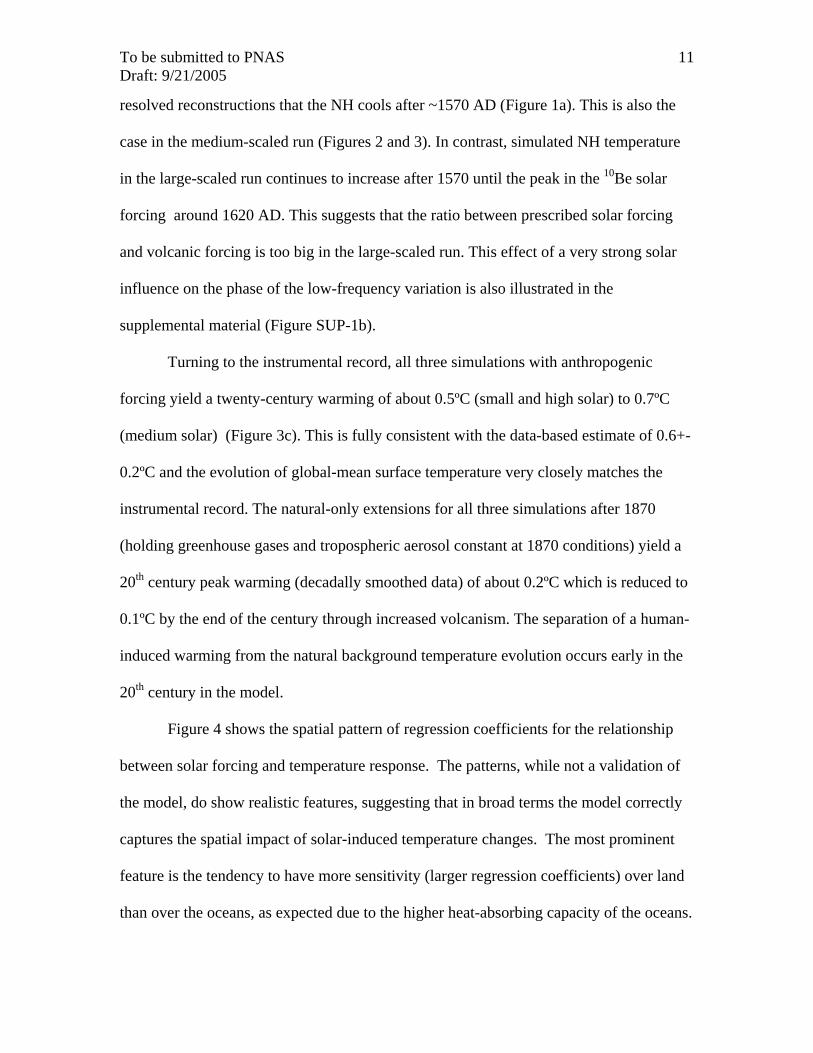
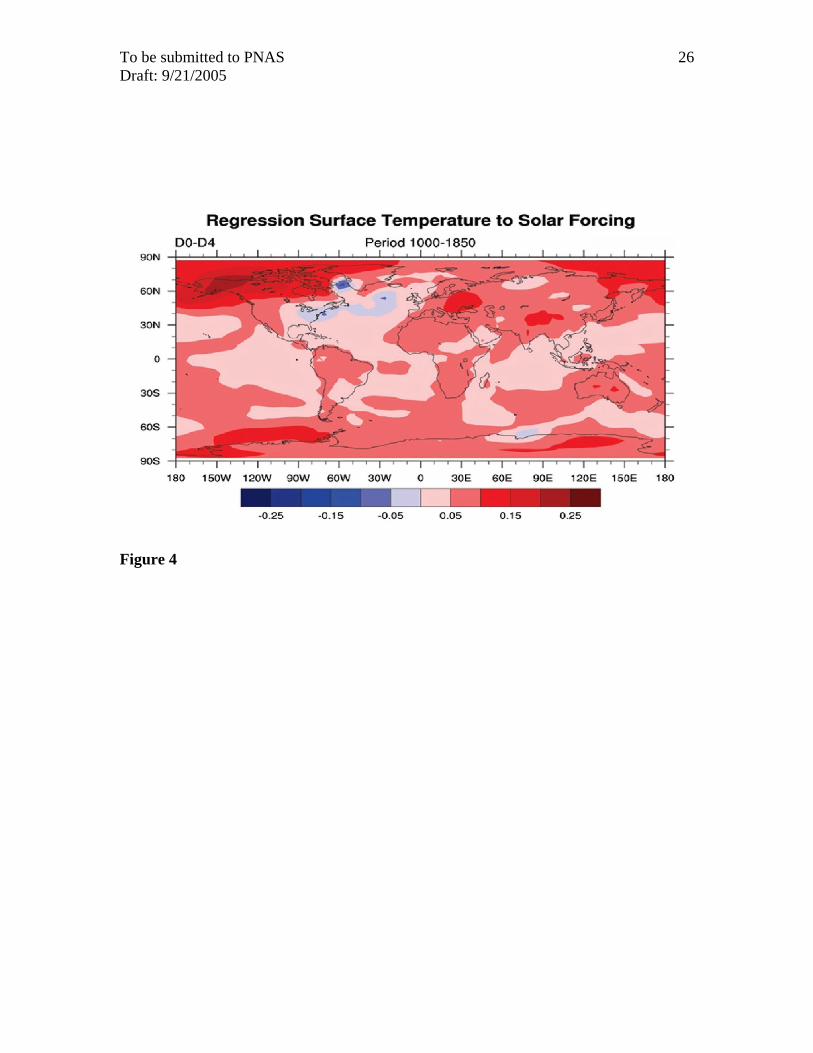
Figure 4 shows the spatial pattern of regression coefficients for the relationship
between solar forcing and temperature response. The patterns, while not a validation of
the model, do show realistic features, suggesting that in broad terms the model correctly
captures the spatial impact of solar-induced temperature changes. The most prominent
feature is the tendency to have more sensitivity (larger regression coefficients) over land
than over the oceans, as expected due to the higher heat-absorbing capacity of the oceans.
To be submitted to PNAS 12 Draft: 9/21/2005
The model result also exhibits polar amplification, or higher sensitivity at high latitudes,
with a greater effect in the NH because of the interaction of this effect with the land-
ocean contrast. The southern Hemisphere with its sparser land masses shows less
amplification. There is some variability in sensitivity within the NH high latitude
regions, likely because of persistent climate patterns associated with planetary wave
structure. Finally, there are some regions with negative relationships to solar forcing,
mainly in the NH high latitude oceans. These may represent regions of complex
interactions between climate, ocean currents and ocean heat uptake, possibly associated
with a known internal model oscillation, but they also occur in areas with significant sea
ice. The model is known to have systematic biases in its simulated sea ice , so the
regressions in these regions could be exaggerated or in error.
4. Discussion and Conclusions
A set of transient millennium-long simulations with the NCAR CSM1.4 coupled
atmosphere-ocean-land-sea ice general circulation model has been performed to address
the links between solar forcing and surface temperature change. The NCAR CSM1.4 has
a low climate sensitivity (~2ºC for a doubling of atmospheric CO2) and correspondingly
simulated responses to solar and other forcings are near the lower end of the range
spanned by the current suite of AOGCMs. The model has been forced by solar irradiance
changes and stratospheric sulfate aerosol concentrations from explosive volcanic
eruptions as well as with the known atmospheric history of the anthropogenically
influenced greenhouse gases and anthropogenic sulfur dioxide emissions into the
troposphere. The solar irradiance evolution has been prescribed following the South Pole
To be submitted to PNAS 13 Draft: 9/21/2005 10Be record of (2). The 10Be record has been linearly scaled to a Maunder Minimum solar
irradiance reduction of 0.65% (high case), 0.25% (medium case) and 0.1% (low case)
relative to today (2). In this way, the uncertainty range associated with a possible long-
term trend in solar irradiance is covered by the simulations. Uncertainties arising from a
potentially non-linear relationship between 10Be concentration in ice, its production rate,
and solar irradiance (18) are not addressed here. These are thought to be of less
importance compared to the scaling uncertainty. Spatially explicit forcing from explosive
volcanism has been constructed from ice core proxies and assuming a single sulfate
particle size distribution independent of the magnitude of the events (15). Reconstructed
forcing appears too high for the largest eruptions (e.g. 1258 AD or 1815AD), with
simulated temperature depressions larger than reconstructed, possibly because the real
particle distribution might have been shifted to larger particles (with less effective
backscattering properties) for those large events. Other damping mechanisms might
exist(37). The modeled (decadal-scale) NH surface temperature for the medium-scaled
experiment falls within the uncertainty range of the available temperature proxy
reconstructions and the main features of the proxy records are reproduced. A clear link
between the 10Be solar proxy and simulated NH temperatures has been identified. Local
minima and maxima found in the proxy NH temperature reconstructions are also evident
in the simulations. A planetary wave response to solar forcing has been identified similar
as in earlier AOGCM studies (11, 38).
The temperature proxy records suggests that the ensemble obtained by combining
the NCAR CSM with its low climate sensitivity and three different natural forcing
histories, very likely encompass the realistic range of naturally-forced low frequency NH-
To be submitted to PNAS 14 Draft: 9/21/2005
temperature variations during the past 1150 years. This conclusion holds irrespective
whether in reality the temperature variations were caused by irradiance changes and
volcanic eruptions alone or in combination with indirect solar mechanisms, such as solar-
induced changes in stratospheric ozone and wave dynamics or cloud properties. The high
solar forcing appears incompatible with the phase relationships and magnitude between
reconstructed and simulated temperatures in the dominant solar frequency band of around
1/200 years and the reconstructed cooling around 1570 appears too late in the large-
scaled simulations in response to strong solar forcing. Thus, given the low (~2oC) climate
sensitivity of the CSM a large (0.65%) solar irradiance change appears unlikely, though
not impossible. However, smaller, and possibly much smaller irradiance changes are
more consistent with most of the available temperature reconstructions both in magnitude
and phase.
The 20th century warming found in the instrumental record is clearly reproduced
and very similar between the three experiments with anthropogenic greenhouse gas
forcing and sulfate emissions included. On the other hand, the simulations with only
natural forcings included yield a 20th century peak warming of about 0.2 ºC which is
reduced to 0.1ºC by the end of the century through increased volcanism. This suggests
that a rebound from cooler preindustrial conditions plays a minor role for the 20th
century warming. In conclusion, the range of NH-temperature reconstructions and the
cosmogenic isotope record as a proxy for solar forcing together with volcanic forcing
constrain the natural contribution to the 20th century warming to be less than 0.2ºC.
Anthropogenic forcing must account for the difference between a small natural
temperature signal and the observed warming in the late 20th century.
To be submitted to PNAS 15 Draft: 9/21/2005
Acknowledgments: The National Center for Atmospheric Research is sponsored by the
National Science Foundation. FJ acknowledges support by the University of Bern, the
Swiss National Science Foundation, and the UCAR/NCAR visitor program. We thank E.
Dlugokencky, J. Flückiger and A. Dällenbach for providing greenhouse gas data from the
NOAA/CMDL air sampling network and from ice cores.
To be submitted to PNAS 16 Draft: 9/21/2005
References
1. Jones, P. D. & Mann, M. E. (2004) Reviews of Geophysics 42, art. no.-RG2002. 2. Bard, E., Raisbeck, G., Yiou, F. & Jouzel, J. (2000) Tellus 52B, 985-992. 3. Robock, A. & Free, M. P. (1995) Journal of Geophysical Research-Atmospheres
100, 11549-11567. 4. Mann, M. E., Bradley, R. S. & Hughes, M. K. (1998) Nature 392, 779-787. 5. Mann, M. E. & Jones, P. D. (2003) Geophysical Research Letters 30, art. no.-
1820. 6. Huang, S. P., Pollack, H. N. & Shen, P. Y. (2000) Nature 403, 756-758. 7. Esper, J., Cook, E. R. & Schweingruber, F. H. (2002) Science 295, 2250-2253. 8. Moberg, A., Sonechkin, D. M., Holmgren, K., Datsenko, N. M. & Karlen, W.
(2005) Nature 433, 613-617. 9. Stenchikov, G. L., Kirchner, I., Robock, A., Graf, H. F., Antuna, J. C., Grainger,
R. G., Lambert, A. & Thomason, L. (1998) Journal of Geophysical Research-Atmospheres 103, 13837-13857.
10. Lacis, A. E., Hansen, J. E. & Sato, M. (1992) Geophysical Research Letters 19, 1607-1610.
11. Robock, A. (2000) Review of Geophysics 38, 191-219. 12. Briffa, K. R., Jones, P. D., Schweingruber, F. H. & Osborn, T. J. (1998) Nature
393, 450-455. 13. Robock, A. & Mao, J. (1993) Journal of Climate 8, 1086-1103. 14. Crowley, T. J. (2000) Science 289, 270-277. 15. Ammann, C. M., Meehl, G. A., Washington, W. M. & Zender, C. S. (2003)
Geophysical Research Letters 30, art. no.-1657. 16. Eddy, J. A. (1976) Science 192, 1189-1202. 17. Fleitmann, D., Burns, S. J. & Mudelsee, M. (2003) Science 300, 1737-1739. 18. Muscheler, R., Joos, F., Beer, J., Müller, S. A., Vonmoos, M. & Snowball, I.
(2005) Earth Science Reviews submitted. 19. Fröhlich, C. & Lean, J. (2004) Astronomy and Astrophysics Review 12, 273-320. 20. Hoyt, D. V., Schatten, K. H., & 1993: A discussion of plausible solar irradiance
variations. J. Geophys. Res., 98 (1993) Journal of Geophysical Research 98, 18895-18906.
21. Lean, J., Beer, J. & Bradley, R. (1995) Geophysical Research Letters 22, 3195-3198.
22. Stuiver, M. & Braziunas, T. F. (1989) Nature 338, 405-408. 23. Baliunas, S. & Jastrow, R. (1990) Nature 348, 520-522,. 24. Hall, J. C. & Lockwood, G. M. (2004) Astrophysical Journal 614, 942-946. 25. Gerber, S., Joos, F., Brugger, P., Stocker, T. F., Mann, M. E., Sitch, S. & Scholze,
M. (2003) Climate Dynamics 20, 281-299. 26. Bertrand, C., Loutre, M. F., Crucifix, M. & Berger, A. (2002) Tellus Series A-
Dynamic Meteorology and Oceanography 54, 221-244. 27. Bauer, E., Claussen, M., Brovkin, V. & Huenerbein, A. (2003) Geophysical
Research Letters 30, art. no.-1276. 28. Meehl, G. A., Washington, W. M., Wigley, T. M. L., Arblaster, J. M. & Dai, A.
(2003) Journal of Climate 16, 426-444.
To be submitted to PNAS 17 Draft: 9/21/2005
29. Gonzalez-Rouco, F., von Storch, H. & Zorita, E. (2003) Geophysical Research Letters 30, art. no.-2116.
30. Otto-Bliesner, B. L. & Brady, E. C. (2001) Journal of Climate 14, 3587-3607. 31. Boville, B. A., Kiehl, J. T., Rasch, P. J. & Bryan, F. O. (2001) Journal of Climate
14, 164-179. 32. Boville, B. A. & Gent, P. R. (1998) Journal of Climate 11, 1115-1130. 33. Reid, G. C. (1997) Climatic Change 37, 391-405. 34. Lean, J. L., Wang, Y. M. & Sheeley, N. R. (2002) Geophysical Research Letters
29, art. no.-2224. 35. Foukal, P., North, G. & Wigley, T. (2004) Science 306, 68-69. 36. Joos, F., Prentice, I. C., Sitch, S., Meyer, R., Hooss, G., Plattner, G.-K., Gerber, S.
& Hasselmann, K. (2001) Global Biogeochem. Cycles 15, 891-907. 37. Pinto, J. P., Turco, R. P. & Toon, O. B. (1998) J. Geophys. Res. 94, 11,165-
11,174. 38. Shindell, D. T., Schmidt, G. A., Mann, M. E., Rind, D. & Waple, A. (2001)
Science 294, 2149-2152. 39. Jones, P. D., Briffa, K. R., Barnett, T. P. & Tett, S. F. B. (1998) Holocene 8, 455-
471. 40. Huang, S. P. & Pollack, H. N. (1998) in Contrib. Ser. 1998-044, IGBP
Pages/World Data Cent. A for Paleoclimatol. Data (NOAA/NGDC Paleoclimatol. Program, Boulder, Colo).
41. Crowley, T. J. & Lowery, T. S. (2000) Ambio 29, 51-54. 42. Briffa, K. R., Osborn, T. J., Schweingruber, F. H., Harris, I. C., Jones, P. D.,
Shiyatov, S. G. & Vaganov, E. A. (2001) Journal of Geophysical Research-Atmospheres 106, 2929-2941.
43. Oh, H. S., Ammann, C. M., Naveau, P., Nychka, D. & Otto-Bliesner, B. L. (2003) Journal of Atmospheric and Solar-Terrestrial Physics 65, 191-201.
44. Crowley, T. J., Baum, S. K., Kim, K. Y., Hegerl, G. C. & Hyde, W. T. (2003) Geophysical Research Letters 30, art. no.-1932.
To be submitted to PNAS 18 Draft: 9/21/2005
Figure Captions
Figure 1
Prescribed forcings. Volcanic forcing (15) is indicated as visible optical depth (top). Solar
forcing is obtained by scaling 10Be data of (2) to a Maunder Minimum reduction in solar
irradiance relative to today of 0.1% (green dash-dot, low solar simulation from 1550 to
2000 AD), 0.25% (red, solid, medium solar simulation from 850 to 2000 AD) and 0.65%
(blue, dash, high solar simulation from 850 to 2000 AD). The 11-year solar cycle is not
included in the forcing. Anthropogenic SO2 emissions (dash-dot) and forcing by
greenhouse gases (bottom, solid), expressed as CO2 equivalent are from (36). The
atmospheric CO2 concentration is shown by the black, dashed line. In addition to three
long simulations with prescribed solar and identical volcanic and greenhouse gas forcings
and SO2 emissions, three ‘natural-only’ simulations were branched-off from the high,
medium, and low solar simulations at year 1870 with greenhouse gas concentrations and
SO2 emissions kept at year 1870 level (green lines).
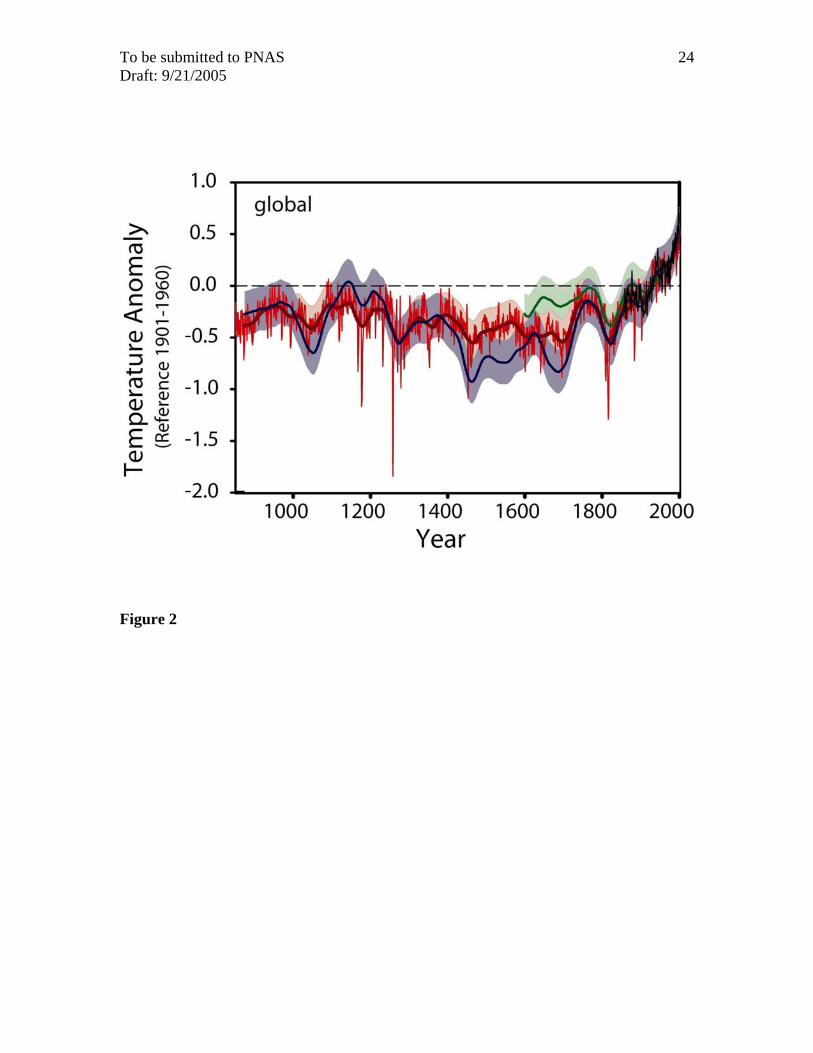
Figure 2
a) Global average surface temperature (50-year Gaussian weighted average) simulated
with the Paleo-NCAR CSM 1.4 with prescribed high (blue), medium (red) and low
(green) solar forcing. Annual data are shown for the medium solar forcing run (red, thin
line) and for the instrumental record of global average surface temperature (black)
Volcanic and greenhouse gas forcing and SO2 emissions are the same in all three
simulations. Ranges depict two positive and negative standard deviations (sdv) around
To be submitted to PNAS 19 Draft: 9/21/2005
the 50-year averages computed from 1000 years of an unforced control simulation (sdv =
0.107ºC).
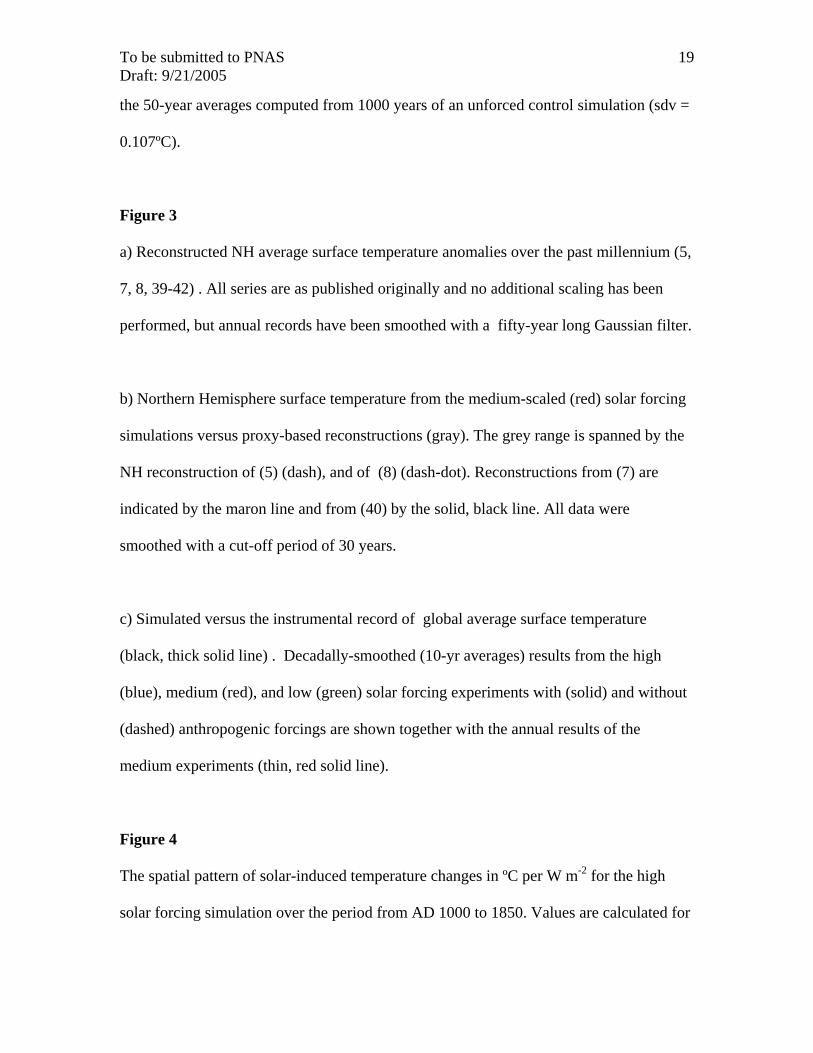
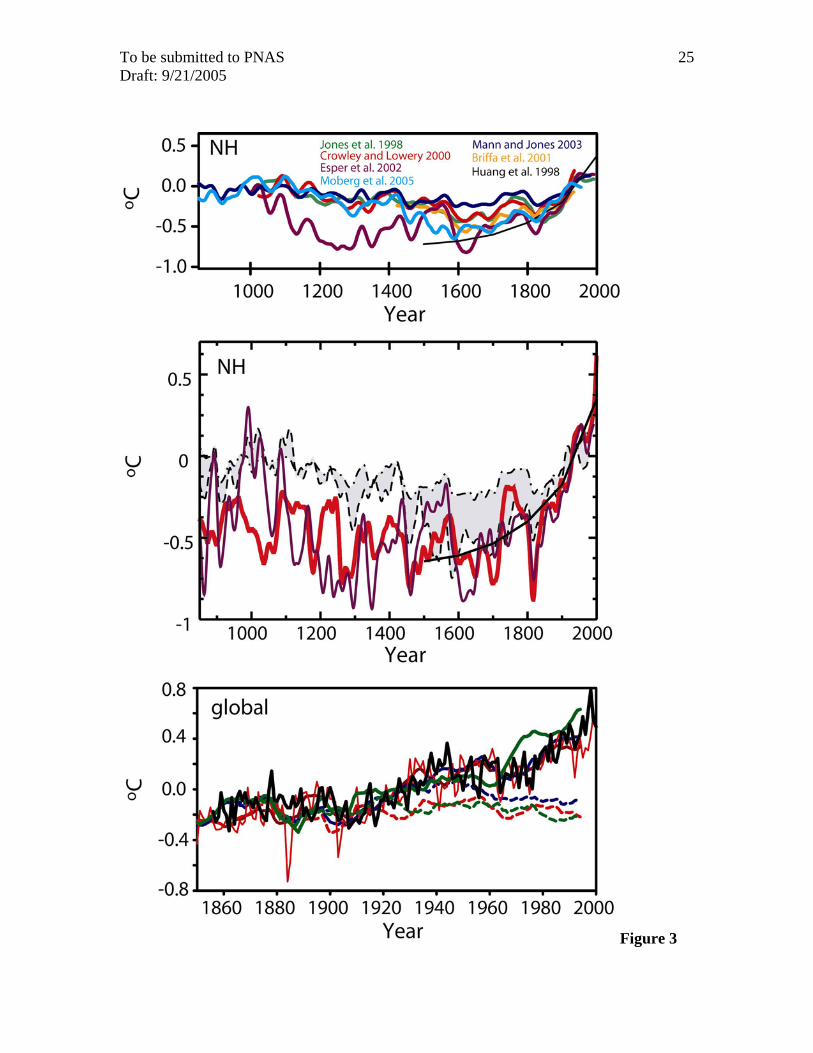
Figure 3
a) Reconstructed NH average surface temperature anomalies over the past millennium (5,
7, 8, 39-42) . All series are as published originally and no additional scaling has been
performed, but annual records have been smoothed with a fifty-year long Gaussian filter.
b) Northern Hemisphere surface temperature from the medium-scaled (red) solar forcing
simulations versus proxy-based reconstructions (gray). The grey range is spanned by the
NH reconstruction of (5) (dash), and of (8) (dash-dot). Reconstructions from (7) are
indicated by the maron line and from (40) by the solid, black line. All data were
smoothed with a cut-off period of 30 years.
c) Simulated versus the instrumental record of global average surface temperature
(black, thick solid line) . Decadally-smoothed (10-yr averages) results from the high
(blue), medium (red), and low (green) solar forcing experiments with (solid) and without
(dashed) anthropogenic forcings are shown together with the annual results of the
medium experiments (thin, red solid line).
Figure 4
The spatial pattern of solar-induced temperature changes in ºC per W m-2 for the high
solar forcing simulation over the period from AD 1000 to 1850. Values are calculated for
To be submitted to PNAS 20 Draft: 9/21/2005
each grid-point as the slope of the linear correlation between solar irradiance anomalies
and local temperature, both filtered with a 200-year frequency window using wavelet
analysis. Global mean response is equivalent to 0.05 ºC for each W m-2 irradiance change
at the top of the atmosphere.
To be submitted to PNAS 21 Draft: 9/21/2005
Figure SUP-1
a) Comparison of 50-year Gaussian-weighted global temperature anomalies (solid) and
prescribed solar irradiance changes (black, dash) for the high (blue), medium (red), and
low (green) solar forcing simulations. Volcanic forcing is expressed as change in visible
optical depth (VOD) (bottom) and gray bars indicate periods of particular strong volcanic
forcing. Temperature scale of 0.5ºC is shown on the right, solar irradiance scale of 10 W
m-2 on the left. The ranges of prescribed solar irradiance anomalies are indicated by
dashed arrows on the left. The differences in simulated global mean temperature for year
2000 AD between the high, medium and low solar forcing simulations and the
corresponding natural forcing only simulations is indicated by the arrows on the right.
The transient results of the natural forcing only simulations are shown for the high solar
case (green). The instrumental record of global average surface temperature is given by
thin, green lines.
b) ~200-year band from a discrete wavelet decomposition (43) for the solar irradiance
record (black, based on the medium-scaled record, but the temporal structure is the same
for the others) and simulated global average surface temperature from the three long
simulations (control: cyan; medium solar: red; and high solar: blue). The magnitudes are
directly comparable between the model runs indicating increased amplitude of climate
response with increased forcing.
Figure SUP-2
a) Reconstructed NH surface temperature anomalies as published by Jones et al. (39)
(annual mean; green), Mann and Jones (5) (30-yr Gaussian filter; blue), Crowley
To be submitted to PNAS 22 Draft: 9/21/2005
and Lowery (14) updated by Crowley et al. (44) (11-yr running averages, 30oN to
90oN, magenta) and Esper and co-workers (7) (annual mean, dark green). The
reconstructions are compared with the medium solar forcing simulation (red, NH-
average or NH extratropics); smooth trends were obtained by applying a 50-year
Gaussian filter or 11-yr running averages. The small solar experiment (1550-
2000, green) is also shown in comparison with (5). The instrumental record is