Solar influences on cosmic rays and cloud formation: A reassessment Bomin Sun 1 and Raymond S. Bradley Climate System Research Center, Department of Geosciences, University of Massachusetts, Amherst, Massachusettts, USA Received 27 February 2001; revised 30 July 2001; accepted 1 August 2001; published 27 July 2002. [1] Svensmark and Friis-Christensen [1997] proposed a ‘‘cosmic ray-cloud cover’’ hypothesis that cosmic ray flux, modulated by solar activity, may modify global cloud cover and thus global surface temperature by increasing the number of ions in the atmosphere, leading to enhanced condensation of water vapor and cloud droplet formation. We evaluate this idea by extending their period of study and examining long- term surface-based cloud data (from national weather services and the Global Telecommunication System) as well as newer satellite data (International Satellite Cloud Climatology Project (ISCCP) D2, 1983–1993). No meaningful relationship is found between cosmic ray intensity and cloud cover over tropical and extratropical land areas back to the 1950s. The high cosmic ray-cloud cover correlation in the period 1983–1991 over the Atlantic Ocean, the only large ocean area over which the correlation is statistically significant, is greatly weakened when the extended satellite data set (1983– 1993) is used. Cloud cover data from ship observations over the North Atlantic, where measurements are denser, did not show any relationship with solar activity over the period 1953 – 1995, though a large discrepancy exists between ISCCP D2 data and surface marine observations. Our analysis also suggests that there is not a solid relationship between cosmic ray flux and low cloudiness as proposed by Marsh and Svensmark [2000]. INDEX TERMS: 2104 Interplanetary Physics: Cosmic rays; 1650 Global Change: Solar variability; 1610 Global Change: Atmosphere (0315, 0325); 1704 History of Geophysics: Atmospheric sciences; KEYWORDS: global climate, greenhouse gas, anthropogenic, solar irradiance, cloud 1. Introduction [2] The pronounced increase in global temperatures over the last century has given rise to concerns over the relative importance of ‘‘natural’’ forcing factors as compared to anthropogenic influences resulting from the buildup of greenhouse gases in the atmosphere. Although there is evidence that anthropogenic effects now have a discernible effect on global climate [Santer et al., 1996], some are concerned that there has been a ‘‘rush to judgment’’ on this issue and that other potentially important factors have been overlooked or ignored [e.g., Calder, 1997]. A recurrent theme in such criticisms is that the effects of solar activity have been underestimated. In particular, it has been pro- posed that solar irradiance variations affect changes in global cloudiness and that these changes play a major role in modulating global temperature [Svensmark and Friis- Christensen, 1997]. [3] Svensmark and Friis-Christensen [1997] argued that changes in solar irradiance modulate the cosmic ray flux to the atmosphere (periods of high irradiance corresponding to low cosmic ray flux and vice versa). Although the mecha- nism is not entirely clear, they suggested that cosmic rays increase the number of ions in the atmosphere and thus lead to enhanced condensation of water vapor and cloud droplet formation. Figure 1 shows the relationship between large- scale cloud cover (from International Satellite Cloud Cli- matology Project (ISCCP) C2 monthly data) and cosmic ray intensity (as recorded at Climax, Colorado) during the late 1980s as reported by Svensmark and Friis-Christensen [1997]. Figure 2 shows a composite of various cloud data sets and cosmic ray data over a slightly longer period. Figures 1 and 2 show a statistically significant positive relationship (<0.01 level) that warrants further examination. [4] Svensmark and Friis-Christensen [1997] used C2 ocean cloud data (60°N–60°S) for the period 1983–1991 from the ISCCP. They did not use C2 land data because they claimed that [Svensmark and Friis-Christensen, 1997, p. 1225] ‘‘cloud cover over sea behaves markedly differently from the cloud cover over land,’’ perhaps an artifact of the satellite-derived data. Thus their cosmic ray flux-cloud cover hypothesis is based only on cloud cover data over ocean areas. Their hypothesis has been questioned by several people. Kuang et al. [1998] checked the variations of cloud optical thickness and their relationship with cosmic ray flux intensity and El Nin ˜o–Southern Oscillation (ENSO) activity over the period 1983–1991. Given the short duration of the cloud data set, they concluded that it is JOURNAL OF GEOPHYSICAL RESEARCH, VOL. 107, NO. D14, 10.1029/2001JD000560, 2002 1 Now at NOAA’s National Climatic Data Center, Asheville, North Carolina, USA. Copyright 2002 by the American Geophysical Union. 0148-0227/02/2001JD000560$09.00 AAC 5 - 1
Transcript
Solar influences on cosmic rays and cloud formation:
A reassessment
Bomin Sun1 and Raymond S. BradleyClimate System Research Center, Department of Geosciences, University of Massachusetts, Amherst, Massachusettts, USA
Received 27 February 2001; revised 30 July 2001; accepted 1 August 2001; published 27 July 2002.
[1] Svensmark and Friis-Christensen [1997] proposed a ‘‘cosmic ray-cloud cover’’hypothesis that cosmic ray flux, modulated by solar activity, may modify global cloudcover and thus global surface temperature by increasing the number of ions in theatmosphere, leading to enhanced condensation of water vapor and cloud dropletformation. We evaluate this idea by extending their period of study and examining long-term surface-based cloud data (from national weather services and the GlobalTelecommunication System) as well as newer satellite data (International Satellite CloudClimatology Project (ISCCP) D2, 1983–1993). No meaningful relationship is foundbetween cosmic ray intensity and cloud cover over tropical and extratropical land areasback to the 1950s. The high cosmic ray-cloud cover correlation in the period 1983–1991over the Atlantic Ocean, the only large ocean area over which the correlation isstatistically significant, is greatly weakened when the extended satellite data set (1983–1993) is used. Cloud cover data from ship observations over the North Atlantic, wheremeasurements are denser, did not show any relationship with solar activity over the period1953–1995, though a large discrepancy exists between ISCCP D2 data and surface marineobservations. Our analysis also suggests that there is not a solid relationship betweencosmic ray flux and low cloudiness as proposed by Marsh and Svensmark[2000]. INDEX TERMS: 2104 Interplanetary Physics: Cosmic rays; 1650 Global Change: Solar
variability; 1610 Global Change: Atmosphere (0315, 0325); 1704 History of Geophysics: Atmospheric
sciences; KEYWORDS: global climate, greenhouse gas, anthropogenic, solar irradiance, cloud
1. Introduction
[2] The pronounced increase in global temperatures overthe last century has given rise to concerns over the relativeimportance of ‘‘natural’’ forcing factors as compared toanthropogenic influences resulting from the buildup ofgreenhouse gases in the atmosphere. Although there isevidence that anthropogenic effects now have a discernibleeffect on global climate [Santer et al., 1996], some areconcerned that there has been a ‘‘rush to judgment’’ on thisissue and that other potentially important factors have beenoverlooked or ignored [e.g., Calder, 1997]. A recurrenttheme in such criticisms is that the effects of solar activityhave been underestimated. In particular, it has been pro-posed that solar irradiance variations affect changes inglobal cloudiness and that these changes play a major rolein modulating global temperature [Svensmark and Friis-Christensen, 1997].[3] Svensmark and Friis-Christensen [1997] argued that
changes in solar irradiance modulate the cosmic ray flux tothe atmosphere (periods of high irradiance corresponding to
low cosmic ray flux and vice versa). Although the mecha-nism is not entirely clear, they suggested that cosmic raysincrease the number of ions in the atmosphere and thus leadto enhanced condensation of water vapor and cloud dropletformation. Figure 1 shows the relationship between large-scale cloud cover (from International Satellite Cloud Cli-matology Project (ISCCP) C2 monthly data) and cosmic rayintensity (as recorded at Climax, Colorado) during the late1980s as reported by Svensmark and Friis-Christensen[1997]. Figure 2 shows a composite of various cloud datasets and cosmic ray data over a slightly longer period.Figures 1 and 2 show a statistically significant positiverelationship (<0.01 level) that warrants further examination.[4] Svensmark and Friis-Christensen [1997] used C2
ocean cloud data (60�N–60�S) for the period 1983–1991from the ISCCP. They did not use C2 land data because theyclaimed that [Svensmark and Friis-Christensen, 1997, p.1225] ‘‘cloud cover over sea behaves markedly differentlyfrom the cloud cover over land,’’ perhaps an artifact of thesatellite-derived data. Thus their cosmic ray flux-cloudcover hypothesis is based only on cloud cover data overocean areas. Their hypothesis has been questioned byseveral people. Kuang et al. [1998] checked the variationsof cloud optical thickness and their relationship with cosmicray flux intensity and El Nino–Southern Oscillation(ENSO) activity over the period 1983–1991. Given theshort duration of the cloud data set, they concluded that it is
JOURNAL OF GEOPHYSICAL RESEARCH, VOL. 107, NO. D14, 10.1029/2001JD000560, 2002
1Now at NOAA’s National Climatic Data Center, Asheville, NorthCarolina, USA.
Copyright 2002 by the American Geophysical Union.0148-0227/02/2001JD000560$09.00
AAC 5 - 1
not clear if cloud variations are caused by the solar cycle orby the ENSO cycle. Farrar [2000], on the other hand,tended to believe that oceanic total cloud coverage varia-tions are related to the ENSO cycle and do not require orsupport a cosmic ray flux influence. It has also been arguedthat no statistical relationships exist between cosmic rayflux and individual cloud types [Kernthaler et al., 1999] orcloud radiative forcing at the top of the atmosphere [Krist-jansson and Kristiansen, 2000]. Kristjansson and Kristian-sen [2000] also showed that there is a large discrepancybetween Defense Meteorological Satellite Program (DMSP)and ISCCP cloud cover data and therefore it is not appro-priate to use DMSP data as an extension of ISCCP. We notethat ISCCP observations, which cover less than one solarcycle, are the major data set used in previous cosmic ray-cloud-climate studies, including all the studies mentionedabove.[5] In view of the controversial nature of the cosmic
ray-cloud cover hypothesis and of the uncertainty andshort time duration of satellite data [Klein and Hartmann,1993; Rossow et al., 1993], in this article, long-termsurface-based cloud data are (1) checked and comparedwith improved ISCCP cloud data, the D2 version [Dou-triaux-Boucher and Seze, 1998; Rossow and Schiffer,1999], to establish the correspondence between the two(and any limitations in these two data sets) and (2)compared with long-term (1953–1995) cosmic ray datato determine if the relationship observed by Svensmarkand Friis-Christensen [1997] is sustained over a longerperiod over both land and ocean. Section 2 is a descriptionof various cloud data sets used in this investigation andincludes a comparison of ISCCP C2 and D2. Section 3shows our results on the cosmic ray flux and thetotal cloudcover relationship for the land and the ocean, respectively.Section 4 discusses whether there is solid evidence tosupport the recent conclusions of Marsh and Svensmark
[2000], who argued that the influence of galactic cosmicrays on clouds is limited to low-level cloudiness.
2. Data
[6] In this study, two sets of surface-based cloud data areused: (1) observations made by national weather services[Groisman et al., 2000] and (2) observations made bynational weather services (over land) and volunteer observ-ing ships (over ocean) but transmitted by the Global Tele-communication System (GTS) [Hahn and Warren, 1999].These surface-based cloud observations are available formany decades. Cloud characteristics in these two data setsare visual observations, including total and low-cloudamounts, and low, middle, and high cloud types. Clouddata of Groisman et al. [2000] were collected from �1500meteorological weather stations over northern land areas,
Figure 1. Twelve-month running averages of total cloudcover given as changes in percent (International SatelliteCloud Climatology Project (ISCCP) C2 data) (thick line).Data are from the area over the oceans covered bygeostationary satellites. End points of the ISCCP C2 curve(first and last six points) have been discarded. The thin lineis the normalized monthly mean counting rate of cosmic rayintensity from Climax, Colorado, drawn to the same scale.Normalized Climax data are representative of globalvariations in cosmic ray flux (reproduced from Svensmarkand Friis-Christensen [1997]).
Figure 2. Normalized cosmic ray fluxes from Climax,Colorado (thick line), and four satellite cloud data sets:Nimbus 7 (triangles), ISCCP C2 (squares), DMSP (dia-monds), and ISCCP D2 (crosses). (top) Monthly valuesillustrating the variability of the monthly cloud data sets.(bottom) Data smoothed by a 12-month running mean.Nimbus 7 and DMSP data are total cloud cover for theSouthern Hemisphere oceans, and the ISCCP data havebeen derived from the geostationary satellites over oceans,with the tropics excluded (reproduced from Svensmark andFriis-Christensen [1997]).
AAC 5 - 2 SUN AND BRADLEY: SOLAR INFLUENCE ON COSMIC RAYS AND CLOUD FORMATION
with the main distribution of stations in middle latitudes.Groisman et al. [2000] data have hourly/3-hourly/6-hourlytime resolution, and the data sets from major countriesincluding the United States, the former USSR, and Chinaare 40–50 years in length. Hahn and Warren [1999] clouddata over land span 26 years (1971–1996) with 3-hourlytime resolution. In this data set, there are �3615 stationsover global land areas with at least 20-year records over theperiod 1971–1996. The practices used in processing Hahnand Warren [1999] land data (i.e., the GTS data) differ inseveral ways from those for Groisman et al. [2000] data(i.e., the national archive data). For example, cloud amountin the Groisman et al. [2000] data was measured in tenths,while it was recorded in octas in Hahn and Warren [1999]data (in this work, cloud amount in the Hahn and Warren[1999] data over both the land and the ocean was convertedto tenths by multiplying by 1.25); cloud type in the Grois-man et al. [2000] data over each country was reportedfollowing the particular reporting policy of that country,while cloud type in the Hahn and Warren [1999] data fromalmost all over the world was recorded using the WorldMeteorological Organization [1975] synoptic code. Adetailed comparison between these two surface-based clouddata sets was made by Sun et al. [2001]. These two sets ofsurface-based cloud data passed necessary quality controlsand have been widely used in climate studies [i.e., Warrenet al., 1986; Henderson-Sellers, 1992; Kaiser, 1998; Daiet al., 1999; Sun and Groisman, 2000]. The Hahn andWarren [1999] ocean cloud data are available from 1952 to1995. The ocean data used by Hahn and Warren [1999] are3-hourly surface ship observations obtained from the Com-prehensive Ocean-Atmosphere Data Set (COADS) [Wood-ruff et al., 1987]. Cloud parameters in the Hahn and Warren[1999] ocean data were recorded using rules similar to thoseused with the Hahn and Warren [1999] land data. The oceandata used by Hahn and Warren [1999] are sparse over the
Southern Hemisphere and over central areas of northernoceans but are relatively dense over coastal areas of thenorthern continents and middle latitudes of the NorthAtlantic. More information regarding the Hahn and Warren[1999] ocean data is also given by Bajuk and Leovy [1998]and Norris [1999].[7] Two versions of the ISCCP cloud data, C2 and D2,
are monthly averaged data based on measurements every 3hours. Cloud cover was measured as the percentage ofcloudy pixels (4–7-km horizontal resolution per pixel) ona 280-km grid. In order to be comparable with surface-observed land cloud cover, the satellite cloud cover per-centage was divided by 10, thus making it equivalent tosurface-measured cloud cover in tenths. The C2 data set,which Svensmark and Friis-Christensen [1997] used, hasrecently been replaced by the improved D2 data set [Rossowand Schiffer, 1999]. A major improvement in the D2 dataset is the more accurate detection of cirrus clouds over landareas and of low clouds over snow-and ice-covered areas.The D2 data set was extended from June 1991 in theoriginal C2 data set to December 1993 and thus includesone solar cycle. In this work, D2 instead of C2 data aretherefore used to compare the surface-based cloud data.[8] Because of the difference of the algorithm in retrieving
C2 and D2 data sets, it is necessary to check whether the twodata sets are comparable and whether the cosmic ray-cloudcover relationship which Svensmark and Friis-Christensen[1997] found from C2 data still exists in D2 data. Figure 3shows the comparison of total cloud cover between the C2and D2 data sets over the land and the ocean. It is seen fromFigure 3 that total cloud cover over the global ocean in D2(the left y axis) is slightly larger than that in C2 (the right yaxis) (by 4% for the annual mean in the period July 1983 toJune 1991) but total cloud cover in D2 over the land is higherthan that in C2 by 22% for the annual mean (total cloud coverin D2 is 5.81 and in C2 is 4.49) and by 26% for the winter
Figure 3. Monthly total cloud cover comparison between ISCCP C2 and D2 data sets over (a) land and(b) ocean. The correlation coefficient R between the two data sets is calculated, after the removal of theseasonal cycle, over the period July 1983 to June 1991.
SUN AND BRADLEY: SOLAR INFLUENCE ON COSMIC RAYS AND CLOUD FORMATION AAC 5 - 3
season (total cloud cover in D2 is 5.85 and in C2 is 4.34). Thesmaller seasonal variability in D2 land data may be primarilydue to larger low and high cloud cover amounts at highlatitudes in cold seasons as compared to those in C2 land data[Doutriaux-Boucher and Seze, 1998]. In spite of the differ-ences in total cloud cover and seasonal amplitude, Figure 3indicates that the two data sets match well with each other onseasonal cycles. The correlation coefficient between them is0.61 for the land and 0.94 for the ocean, and it is 0.88 for theland and 0.95 for the ocean after the removal of the seasonalcycle, suggesting that they are quite consistent with eachother, particularly over the ocean.
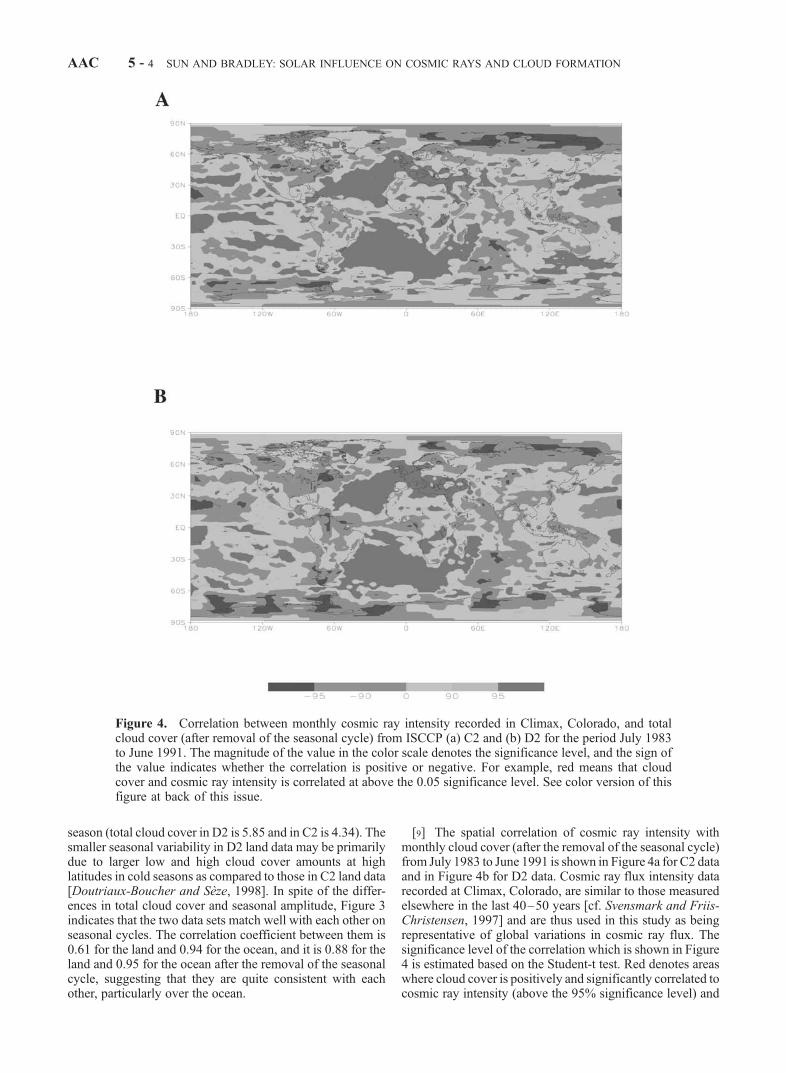
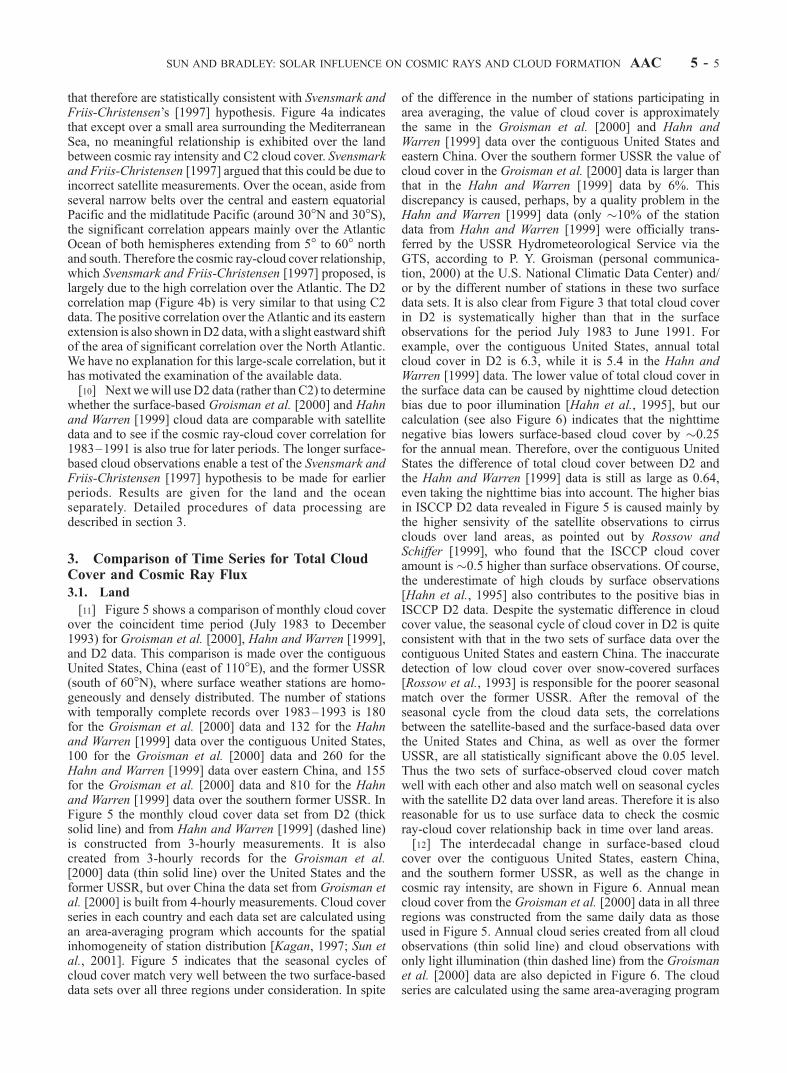
[9] The spatial correlation of cosmic ray intensity withmonthly cloud cover (after the removal of the seasonal cycle)from July 1983 to June 1991 is shown in Figure 4a for C2 dataand in Figure 4b for D2 data. Cosmic ray flux intensity datarecorded at Climax, Colorado, are similar to those measuredelsewhere in the last 40–50 years [cf. Svensmark and Friis-Christensen, 1997] and are thus used in this study as beingrepresentative of global variations in cosmic ray flux. Thesignificance level of the correlation which is shown in Figure4 is estimated based on the Student-t test. Red denotes areaswhere cloud cover is positively and significantly correlated tocosmic ray intensity (above the 95% significance level) and
Figure 4. Correlation between monthly cosmic ray intensity recorded in Climax, Colorado, and totalcloud cover (after removal of the seasonal cycle) from ISCCP (a) C2 and (b) D2 for the period July 1983to June 1991. The magnitude of the value in the color scale denotes the significance level, and the sign ofthe value indicates whether the correlation is positive or negative. For example, red means that cloudcover and cosmic ray intensity is correlated at above the 0.05 significance level. See color version of thisfigure at back of this issue.
AAC 5 - 4 SUN AND BRADLEY: SOLAR INFLUENCE ON COSMIC RAYS AND CLOUD FORMATION
that therefore are statistically consistent with Svensmark andFriis-Christensen’s [1997] hypothesis. Figure 4a indicatesthat except over a small area surrounding the MediterraneanSea, no meaningful relationship is exhibited over the landbetween cosmic ray intensity and C2 cloud cover. Svensmarkand Friis-Christensen [1997] argued that this could be due toincorrect satellite measurements. Over the ocean, aside fromseveral narrow belts over the central and eastern equatorialPacific and the midlatitude Pacific (around 30�N and 30�S),the significant correlation appears mainly over the AtlanticOcean of both hemispheres extending from 5� to 60� northand south. Therefore the cosmic ray-cloud cover relationship,which Svensmark and Friis-Christensen [1997] proposed, islargely due to the high correlation over the Atlantic. The D2correlation map (Figure 4b) is very similar to that using C2data. The positive correlation over the Atlantic and its easternextension is also shown inD2 data,with a slight eastward shiftof the area of significant correlation over the North Atlantic.We have no explanation for this large-scale correlation, but ithas motivated the examination of the available data.[10] Next wewill use D2 data (rather than C2) to determine
whether the surface-based Groisman et al. [2000] and Hahnand Warren [1999] cloud data are comparable with satellitedata and to see if the cosmic ray-cloud cover correlation for1983–1991 is also true for later periods. The longer surface-based cloud observations enable a test of the Svensmark andFriis-Christensen [1997] hypothesis to be made for earlierperiods. Results are given for the land and the oceanseparately. Detailed procedures of data processing aredescribed in section 3.
3. Comparison of Time Series for Total CloudCover and Cosmic Ray Flux
3.1. Land
[11] Figure 5 shows a comparison of monthly cloud coverover the coincident time period (July 1983 to December1993) for Groisman et al. [2000], Hahn and Warren [1999],and D2 data. This comparison is made over the contiguousUnited States, China (east of 110�E), and the former USSR(south of 60�N), where surface weather stations are homo-geneously and densely distributed. The number of stationswith temporally complete records over 1983–1993 is 180for the Groisman et al. [2000] data and 132 for the Hahnand Warren [1999] data over the contiguous United States,100 for the Groisman et al. [2000] data and 260 for theHahn and Warren [1999] data over eastern China, and 155for the Groisman et al. [2000] data and 810 for the Hahnand Warren [1999] data over the southern former USSR. InFigure 5 the monthly cloud cover data set from D2 (thicksolid line) and from Hahn and Warren [1999] (dashed line)is constructed from 3-hourly measurements. It is alsocreated from 3-hourly records for the Groisman et al.[2000] data (thin solid line) over the United States and theformer USSR, but over China the data set from Groisman etal. [2000] is built from 4-hourly measurements. Cloud coverseries in each country and each data set are calculated usingan area-averaging program which accounts for the spatialinhomogeneity of station distribution [Kagan, 1997; Sun etal., 2001]. Figure 5 indicates that the seasonal cycles ofcloud cover match very well between the two surface-baseddata sets over all three regions under consideration. In spite
of the difference in the number of stations participating inarea averaging, the value of cloud cover is approximatelythe same in the Groisman et al. [2000] and Hahn andWarren [1999] data over the contiguous United States andeastern China. Over the southern former USSR the value ofcloud cover in the Groisman et al. [2000] data is larger thanthat in the Hahn and Warren [1999] data by 6%. Thisdiscrepancy is caused, perhaps, by a quality problem in theHahn and Warren [1999] data (only �10% of the stationdata from Hahn and Warren [1999] were officially trans-ferred by the USSR Hydrometeorological Service via theGTS, according to P. Y. Groisman (personal communica-tion, 2000) at the U.S. National Climatic Data Center) and/or by the different number of stations in these two surfacedata sets. It is also clear from Figure 3 that total cloud coverin D2 is systematically higher than that in the surfaceobservations for the period July 1983 to June 1991. Forexample, over the contiguous United States, annual totalcloud cover in D2 is 6.3, while it is 5.4 in the Hahn andWarren [1999] data. The lower value of total cloud cover inthe surface data can be caused by nighttime cloud detectionbias due to poor illumination [Hahn et al., 1995], but ourcalculation (see also Figure 6) indicates that the nighttimenegative bias lowers surface-based cloud cover by �0.25for the annual mean. Therefore, over the contiguous UnitedStates the difference of total cloud cover between D2 andthe Hahn and Warren [1999] data is still as large as 0.64,even taking the nighttime bias into account. The higher biasin ISCCP D2 data revealed in Figure 5 is caused mainly bythe higher sensivity of the satellite observations to cirrusclouds over land areas, as pointed out by Rossow andSchiffer [1999], who found that the ISCCP cloud coveramount is �0.5 higher than surface observations. Of course,the underestimate of high clouds by surface observations[Hahn et al., 1995] also contributes to the positive bias inISCCP D2 data. Despite the systematic difference in cloudcover value, the seasonal cycle of cloud cover in D2 is quiteconsistent with that in the two sets of surface data over thecontiguous United States and eastern China. The inaccuratedetection of low cloud cover over snow-covered surfaces[Rossow et al., 1993] is responsible for the poorer seasonalmatch over the former USSR. After the removal of theseasonal cycle from the cloud data sets, the correlationsbetween the satellite-based and the surface-based data overthe United States and China, as well as over the formerUSSR, are all statistically significant above the 0.05 level.Thus the two sets of surface-observed cloud cover matchwell with each other and also match well on seasonal cycleswith the satellite D2 data over land areas. Therefore it is alsoreasonable for us to use surface data to check the cosmicray-cloud cover relationship back in time over land areas.[12] The interdecadal change in surface-based cloud
cover over the contiguous United States, eastern China,and the southern former USSR, as well as the change incosmic ray intensity, are shown in Figure 6. Annual meancloud cover from the Groisman et al. [2000] data in all threeregions was constructed from the same daily data as thoseused in Figure 5. Annual cloud series created from all cloudobservations (thin solid line) and cloud observations withonly light illumination (thin dashed line) from the Groismanet al. [2000] data are also depicted in Figure 6. The cloudseries are calculated using the same area-averaging program
SUN AND BRADLEY: SOLAR INFLUENCE ON COSMIC RAYS AND CLOUD FORMATION AAC 5 - 5
as for Figure 3. However, �10–15% of total stations fromGroisman et al. [2000] have shorter records. In order toavoid or reduce the bias in the area-averaged time serieswhich could be caused by the temporal instability of theGroisman et al. [2000] station network (the station networkused by Groisman et al. [2000] is very stable during 1971–1995 over the three regions aforementioned), the followingdata preprocessing was performed before the area-averagingprogram was applied. We first calculated the mean annualvalue of 1961–1990 data at each station; stations that didnot have at least a 25-year record during 1961–1990 wereexcluded from any further consideration. Then, we calcu-lated the annual anomaly by subtracting the mean value of1961–1990 data at each station. Finally, the anomalies andmeans at all stations of a region were area averaged. The
annual mean time series of cloud cover shown in Figure 6was thus created by adding the area-averaged anomalies andmeans for each region.[13] Despite the different practices used in recording
cloud cover between Groisman et al. [2000] and Hahnand Warren [1999], the consistency of variation betweenGroisman et al. [2000] and Hahn and Warren [1999] onboth annual and decadal scales shown in Figure 6 againindicates that surface-based cloud data are likely to bereliable. It is also realized from Figure 6 that nighttimecloud detection bias indeed lowers annual cloud cover by�0.2–0.3 but does not affect the decadal variation of cloudcover. In contrast to the dominant 11-year cycle in cosmicray flux intensity recorded, our spectrum analysis (notshown) indicates that cloud variations over these three
Figure 5. Monthly total cloud cover intercomparison of three data sets: Groisman et al. [2000](GBS00), Hahn and Warren [1999] (HW99), and D2 (ISCCP D2) over the contiguous United States,China (east of 110�E), and the former USSR (south of 60�N). R13 and R23 are the correlation coefficientsbetween D2 and Groisman et al. [2000] data and between D2 and Hahn and Warren [1999] data,respectively, calculated after the removal of the seasonal cycle.
AAC 5 - 6 SUN AND BRADLEY: SOLAR INFLUENCE ON COSMIC RAYS AND CLOUD FORMATION
regions demonstrate mainly a significant 2- to 3-yearvariability, in addition to an increase over the contiguousUnited States, a decrease over China, and no significantlong-term change over the former USSR, which also havebeen documented by Kaiser [1998], Dai et al. [1999], andSun and Groisman [2000]. The correlation coefficients(shown in Figure 6) also confirm that no meaningfulrelationship between cosmic ray intensity and cloud coveris found for unaltered, detrended, or 3-year running aver-aged Groisman et al. [2000] cloud data sets. Therefore thesignificant cosmic ray-cloud cover relationship proposed bySvensmark and Friis-Christensen [1997] from satelliteocean data does not exist over the three major countriesof the Northern Hemisphere over the period since the 1950s.[14] Hahn and Warren [1999] data over the period 1982–
1995 exhibit a temporally complete and spatially densedistribution over northern extratropical land areas as wellas over tropical land areas of both hemispheres. Cloud datafrom Hahn and Warren [1999], instead of those from
Groisman et al. [2000], were therefore used to check thecosmic ray-cloud cover relationship over latitudinal landbelts. In order to eliminate the seasonal fluctuations in clouddata and make different data sets comparable, we smoothedthe monthly anomaly time series (after subtracting the meanvalues for 1982–1995) by applying 12-month runningmeans, and the monthly anomaly data sets were then furthernormalized by dividing the root of mean squares of theanomaly series. The time series of cloud cover and cosmicray intensity over tropical (20�S–20�N) (thin dashed line)and extratropical (20�N–60�N) (thin solid line) land areasshown in Figure 7 are thus normalized anomalies. Cloudcover variations over both the tropical and the extratropicalland did not vary in phase with cosmic ray intensity. Forexample, during the solar maximum in early 1991, cloudcover over land areas had high values. It is also notable thatthe high correlation over the land area northwest of theMediterranean Sea (one portion of high-correlation areassurrounding the Mediterranean Sea shown in Figure 4) also
1950 1960 1970 1980 1990
tota
l clo
ud
co
ver
(te
nth
s)
4
5
6
1950 1960 1970 1980 1990
tota
l clo
ud
co
ver
(te
nth
s)
5
6
7
1950 1960 1970 1980 1990
tota
l clo
ud
co
ver
(te
nth
s)
5
6
7GBS00 (all obs.)HW99 (all obs.)HW99 (light obs.)
1950 1960 1970 1980 1990
cosm
ic r
ay
flux
3400
3600
3800
4000
4200
4400
Contiguous U.S.
China (east of 110E)
Former USSR (south of 60N)
Colorado
R1=-0.44 R2=-0.43 R3=-0.51
R1=-0.05 R2=-0.04 R3=0.12
R1=-0.32 R2=-0.29 R3=-0.37
Figure 6. Cosmic ray intensity recorded at Climax, Colorado and comparisons between annual meancosmic ray intensity and surface-based total cloud cover over the contiguous United States, China (east of110�E), and the former USSR (south of 60�N). R1, R2, and R3 are the correlation coefficients betweencosmic ray intensity and unaltered, detrended, and 3-year running averaged annual cloud cover,respectively.
SUN AND BRADLEY: SOLAR INFLUENCE ON COSMIC RAYS AND CLOUD FORMATION AAC 5 - 7
appears in the 1983–1991 Hahn and Warren [1999] landdata, but turns out to be insignificant in the 1982–1995Hahn and Warren [1999] land data (not shown).[15] In summary, over land areas, surface-based cloud
cover data made by national weather services [Groisman etal., 2000] and by data from the Global TelecommunicationSystem [Hahn and Warren, 1999] match well with eachother, and they are also consistent on seasonal cycles withISCCP D2 data. However, no meaningful relationshipbetween cosmic ray intensity variations and cloud cover isfound for major land areas, even back to the 1950s.
3.2. Ocean
[16] Figure 4 reveals that the significant correlationbetween satellite cloud cover and cosmic ray intensity for
July 1983 to June 1991 appears mainly over the AtlanticOcean. Next we will check if the relationship over theAtlantic continues to December 1993 in the D2 data and ifthe long-term ship-based marine observations given byHahn and Warren [1999] support the satellite result.[17] Figure 8 describes the relationship between cosmic
ray intensity and D2 cloud cover from July 1983 toDecember 1993 over the North Atlantic (0�–60�N) (thinsolid line) and South Atlantic (0�–60 �S) (dashed line).The time series of cloud cover and cosmic ray intensity inFigure 8 are monthly normalized anomalies calculatedusing the same method as for Figure 7. The period tothe left of the vertical line (prior to 1991) is that used bySvensmark and Friis-Christensen [1997] (using C2 data),and the relationship they noted is confirmed by the D2 data
1982 1984 1986 1988 1990 1992 1994 1996-3
-2
-1
0
1
2
3 HW99 cloud (20S-20N) HW99 cloud (20N-60N) cosmic ray intensity
clo
ud
co
ver
(co
smic
ra
y in
ten
sity
) a
no
ma
ly
Figure 7. Comparison between normalized monthly anomalies of cosmic ray intensity and Hahn andWarren [1999] land total cloud cover over tropical (20�S–20�N) and extratropical (20�N–60�N) landareas. Data sets are first smoothed by a 12-month running average after subtracting the means for theperiod 1982–1994 and then normalized by dividing the root of mean squares of the anomaly series.
1984 1986 1988 1990 1992 1994mon
thly
clo
ud c
over
(co
smic
ray
inte
nsity
) an
omal
y
-3
-2
-1
0
1
2
3
D2 cloud cover (North Atlantic)D2 cloud cover (South Atlantic)cosmic ray intensity
Figure 8. Same as Figure 6 except for D2 total cloud cover over the South Atlantic (0�–60�S) and theNorth Atlantic (0�–60�N). Cosmic intensity is also shown.
AAC 5 - 8 SUN AND BRADLEY: SOLAR INFLUENCE ON COSMIC RAYS AND CLOUD FORMATION
analyzed here. Cloud cover variation over both the Northand South Atlantic generally followed the variation of solaractivity before 1991: from 1984 to the end of 1986, cloudcover increased with the increase of cosmic ray intensity;cloud cover decreased from 1987 to late 1990 followingthe decline of cosmic ray intensity. However, we see fromFigure 8 that the maximum cosmic ray intensity in late1986 lagged the maximum cloud cover by �2–3 monthsand the minimum cosmic ray intensity in early 1991 laggedthe minimum cloud cover by �10 months over the NorthAtlantic and by �3 months over the South Atlantic.Furthermore, this correlation breaks down after 1991, ascloud cover over the Atlantic decreased in spite of the riseof cosmic ray intensity. The cosmic ray-total cloud coverrelationship found by Svensmark and Friis-Christensen[1997] is thus largely weakened when the extended ISCCPcloud cover data set is investigated.[18] Given the short time period of satellite data, it is
difficult to give a definite conclusion on the oceanic cosmicray-cloud cover relationship, and observations with long-term records are therefore needed. The ocean cloud data setgiven by Hahn and Warren [1999] is the longest onecurrently available. However, Hahn and Warren [1999]ocean data are spatially inhomogeneous. In order to avoidsample bias, we selected an area with a better data density tocreate a longer-term cloud time series: the North Atlantic(0�–50�N with the exclusion of the southeastern area),where at least 10 observations at a given hour during amonth within a 2.5� � 2.5� grid box are available. Clouddata were first averaged into monthly means on these 2.5� �2.5� grids over the North Atlantic. Monthly anomaly timeseries were created by subtracting the mean values for theperiod 1952–1995. These monthly anomalies were thenaveraged into annual anomalies and area averaged, weight-ed by latitude, to establish the annual anomaly series (solidline) shown in Figure 9. The cloud cover series from D2(dashed line) over the same area is also shown in Figure 9. Itis clear that there is a large discrepancy in cloud coverbetween ship and satellite observations from 1984 to 1992:Hahn and Warren [1999] cloud cover data increased while
D2 data cloud cover decreased. We also found that exceptfor several very small areas located between 20�N and50�N, no large-scale high-correlation (between cosmic rayflux and cloud cover) pattern over the Atlantic is found inthe Hahn and Warren [1999] cloud data over the period July1983 to December 1993. Calculations of the correlationbetween cosmic ray intensity and 3-year running averaged(after the removal of linear trend) total cloud cover show nomeaningful relationship over the period 1953–1995. Thestrong upward trend of Hahn and Warren [1999] cloudcover data revealed in the North Atlantic (Figure 9) alsoexists over other ocean areas [Norris, 1999]. Presently, nofactors or reasons have been identified or documented toexplain the differences between these two ocean data sets.Our knowledge of physical mechanisms for cloud variationsis still limited, though some studies [Croke et al., 1999;Tselioudis et al., 2000] suggest that cloud cover variabilityis closely related to the variation of surface pressuresystems. Nevertheless, neither the long-term synoptic shipobservations nor the �10 years of ISCCP D2 data stronglysupport the cosmic ray-total cloud cover relationship pro-posed by Svensmark and Friis-Christensen [1997].[19] The significant correlation between cosmic ray inten-
sity and total cloud cover seen in the period 1983–1991 overthe Atlantic, which largely contributes to the establishment ofSvensmark and Friis-Christensen’s [1997] hypothesis, isweakened when the extended satellite data (1983–1993)are examined. No solar activity related signal is found inthe ship-observed total cloud cover over the period 1952–1995 in relation to cosmic ray intensity variation, though adiscrepancy exists between Hahn and Warren [1999] oceandata and ISCCP data.
4. Discussion
[20] Section 3 indicated that no significant correlationexists even back to the 1950s between galactic cosmic rayflux and total cloud cover. Total cloud cover is composed ofcloud covers with different heights, usually denoted as low,middle, and high clouds. The microphysical conditions and
1950 1955 1960 1965 1970 1975 1980 1985 1990 1995
annu
al a
nom
aly
of c
loud
cov
er (
tent
hs)
-0.3
-0.2
-0.1
0.0
0.1
0.2
0.3HW99 cloud coverD2 cloud cover
North Atlantic area
Figure 9. Annual mean total cloud cover comparison between Hahn and Warren [1999] and D2 overthe North Atlantic (0�–50�N) with the exclusion of the southeast area. Cloud cover series are annualanomalies from the means of the period 1952–1995 [Hahn and Warren, 1999] and 1984–1993 (D2).
SUN AND BRADLEY: SOLAR INFLUENCE ON COSMIC RAYS AND CLOUD FORMATION AAC 5 - 9
processes for cloud formation differ at different levels. Is itpossible that the impact of cosmic rays on cloud formationis limited to only one of these height levels? Figure 10shows the relationship between cosmic ray intensity andcloud cover at low (thin solid line), middle (dashed line),and high (dotted line) levels over the North Atlantic. Thecorrelation coefficients for the period July 1987 to Decem-ber 1993 between cosmic ray flux and nonsmoothedmonthly low, middle, and high cloud covers is 0.19, 0.07,and 0.00, respectively. The poor relationship between cos-mic ray flux and high clouds suggests that the relativelystrong galactic cosmic ray ionization at higher altitudes doesnot have an effect on higher-level cloud cover. The highcorrelation between cosmic ray flux and low cloud covercomes mainly from the period before 1990 (low cloud covervariation is opposite to cosmic ray variation after 1990).Similar results were also found over the South Atlantic (notshown). Kristjansson and Kristiansen [2000] reported sim-ilar relationships between cosmic ray flux and low (middleand high) clouds but over global midlatitude oceans. Marshand Svensmark [2000] thus postulated that the influence ofgalactic cosmic ray flux on cloudiness may be restricted tolower altitude cloud properties. They speculated that atmos-pheric ionization produced by galactic cosmic rays, byaffecting ultrafine aerosol formation [Yu and Turco, 2000],could affect cloud condensation nuclei and thus cloudinessat lower levels in the atmosphere, where concentrations oftrace gases are high. The area of high correlation betweencosmic ray flux and low-cloud properties, including cloudamount and particularly cloud top temperature as revealedby Marsh and Svensmark [2000], is concentrated over thetropics.[21] However, questions remain regarding the Marsh and
Svensmark [2000] cosmic ray-low cloud hypothesis. First,as stated by Marsh and Svensmark [2000], Yu and Turco[2000] did indicate that the aerosols needed for cloudcondensation nuclei can be influenced by ions, based onstudies at a field site (Idaho Hill, Colorado). However,Marsh and Svensmark’s [2000] global correlation map
[see Marsh and Svensmark, 2000, Figure 2] did not showany significant relationship between galactic cosmic rayflux and low-cloud properties over the continental UnitedStates and most of the other middle-to high-latitude landareas. Furthermore, Turco et al. [1998], Yu and Turco[2000], and other related studies indicate that the fractionof ion-related nucleation events strongly depend upon theabundance of precursor atmospheric sulfuric acid vapor.However, as shown in Marsh and Svensmark’s [2000]Figure 2, the regions with very little background sulfateand other trace concentration, including the oceans of theSouthern Hemisphere, exhibit a significant cosmic ray-cloud correlationship similar to the regions with a highlevel of atmospheric sulfur compounds, including East Asiaand the Indian subcontinent. Actually, the ion-mediatednucleation process involving complicated chemical/physicalinteractions is not yet well defined, and its contribution tothe formation of cloud condensation nuclei and cloudinessis also not clear. There is a lack of evidence to claim thatthe high cosmic ray flux-low cloudiness correlationshipshown by Marsh and Svensmark [2000] is physicallybased. Second, if the cosmic ray-low cloud hypothesisproposed by Marsh and Svensmark [2000] were correct,we would expect a worldwide decrease in low cloudinessin at least the last few decades (Marsh and Svensmark[2000] stated that the strength of the solar magnetic fluxhas increased and the cosmic ray flux has decreased by3.7% since 1964). However, ship observations [Norris,1999] revealed that there is a steady upward trend (anincrease of 3.6% between 1952 and 1995) in low cloudi-ness over the global ocean, including the tropics. Overmost of the land areas, precipitating clouds have shown anincrease in the past 40–50 years [Dai et al., 1997]. Anincrease of 2.3% per decade in surface-based cloud occur-rence frequency (extracted from Marsh and Svensmark’s[2000] data set) over the contiguous United States for1952–1992 is also reported by Sun et al. [2001]. Third,low-cloud detection from satellites could be biased if lowcloud is overlapped by higher-level clouds. Figure 10
1982 1984 1986 1988 1990 1992 1994
mon
thly
clo
ud c
over
(co
smic
ray
inte
nsity
) an
omal
y
-4
-3
-2
-1
0
1
2
3
D2 low cloudD2 middle cloudD2 high cloudcosmic ray intensity
North Atlantic
Figure 10. Same as Figure 6 except for D2 cloud cover at low, middle, and high level over the NorthAtlantic (0�–60�N).
AAC 5 - 10 SUN AND BRADLEY: SOLAR INFLUENCE ON COSMIC RAYS AND CLOUD FORMATION
shows that cloud covers at middle and high levels basicallymatch before late 1991, but variations in low-cloud coverdiffer. At several time points, including mid-1987 and mid-1990, the extreme cloud cover amount values at high ormiddle levels are opposite to those at low levels. Thereason for this cloud cover amount compensation at differ-ent levels can be that satellites generally underestimate lowclouds if high clouds are present. Therefore the highcorrelation of cosmic ray flux with low-cloud propertiesderived from satellite measurements revealed by Marshand Svensmark [2000] can be due to an artifact in low-cloudiness data.[22] From the above discussions, we tend to think that
there is no solid physical evidence for the galactic cosmicray-low cloudiness relationship shown byMarsh and Svens-mark [2000]. Because of the direct close functional relation-ship between cloud condensation nuclei concentration andcloud optical depth [Slingo, 1989], if cosmic ray flux reallyhad a detectable effect on cloud condensation nuclei con-centration by affecting ultrafine aerosol formation, thencloud optical depth or reflectivity should be largelychanged. Our judgment would be more robust if we couldfind that there is no correlation between cosmic ray flux andlow-cloud optical depth or reflectivity. Unfortunately, we donot have low-cloud radiative characteristic data to check thisidea.
5. Conclusion
[23] Using ISCCP C2 ocean total cloud cover data for1983–1991, Svensmark and Friis-Christensen [1997]argued that cosmic ray flux intensity, modulated by solaractivity variations, may modify global cloud cover and thusglobal surface temperature by altering cloud condensationnuclei. In this study, long-term surface-based cloud datamade by national weather services [Groisman et al., 2000]and by the Global Telecommunication System [Hahn andWarren, 1999], as well as ISCCP D2 (1983–1993) clouddata, were used to reexamine the Hahn and Warren [1999]hypothesis for land and ocean separately. The ISCCP D2cloud data set, retrieved from an improved algorithm, is anew version of the C2 product, but it has been extendedfrom June 1991 to December 1993. The high correlationbetween cosmic ray intensity and C2 cloud cover over theAtlantic Ocean in both hemispheres, which is the only largearea on the globe with correlations at or above the 0.05significance level and which largely contributed to Svens-mark and Friis-Christensen’s [1997] hypothesis, exists alsoin D2 data over the period 1983–1991.[24] Over land, the two sets of surface-based total cloud
cover match well with each other on seasonal, annual, anddecadal timescales. Surface-based total cloud cover in bothGroisman et al. [2000] and Hahn and Warren [1999] data,though lower than the satellite-based cloud cover value, isquite consistent with the latter in terms of seasonal cycle.No meaningful relationship was found between cosmic rayintensity and total cloud cover over tropical and extratrop-ical land areas when the period back to the 1950s wasconsidered. Over the Atlantic Ocean the high cosmic ray-cloud cover correlation is greatly weakened when theextended satellite data set is used. Cloud cover from shipobservations [Hahn and Warren, 1999] over the North
Atlantic, where ship measurements are denser, did not showany relationship with solar activity over the period 1952–1995, but a large discrepancy exists between ISCCP D2data and surface marine total cloud observations. Finally,we find that there is no solid evidence for the existence ofthe galactic cosmic ray flux-low cloud relationship assuggested by Marsh and Svensmark [2000].
[25] Acknowledgments. This work was supported by grants fromNSFATM-9905399 (Climate Dynamics) and the Department of Energy. Wethank P. Y. Groisman and Frank Keimig for assistance with data retrievaland analysis.
ReferencesBajuk, L. J., and C. B. Leovy, Are there real interdecadal variations inmarine low clouds?, J. Clim., 11, 2910–2921, 1998.
Calder, N., The Manic Sun, 211 pp., Pilkington, London, 1997.Croke, M. S., R. D. Cess, and S. Hameed, Regional cloud cover changeassociated with global climate change: Case studies for three regions ofthe United States, J. Clim., 12, 2128–2134, 1999.
Dai, A., A. D. Del Genio, and I. Y. Fung, Clouds, precipitation and tem-perature range, Nature, 386, 665–666, 1997.
Dai, A., K. E. Trenberth, and T. R. Karl, Effects of clouds, soil moisture,precipitation and water vapor on diurnal temperature range, J. Clim., 12,2451–2473, 1999.
Doutriaux-Boucher, M., and G. Seze, Significant changes between theISCCP C and D cloud climatologies, Geophys. Res. Lett., 25, 4193–4196, 1998.
Farrar, P. D., Are cosmic rays influencing oceanic cloud coverage or is itonly El Nino?, Clim. Change, 47, 7–15, 2000.
Groisman, P. Y., R. S. Bradley, and B. Sun, The relationship of cloud coverto near-surface temperature and humidity: Comparison of GCM simula-tions with empirical data, J. Clim., 13, 1858–1878, 2000.
Hahn, C. J., and S. G. Warren, Extended edited synoptic reports from shipsand land stations over the globe, 1952–1996, Rep. ORNL/CDIAC-123,71 pp., Oak Ridge Natl. Lab., Oak Ridge, Tenn., 1999.
Hahn, C. J., S. G. Warren, and J. London, The effect of moonlight onobservation of cloud cover at night, and application to cloud climatology,J. Clim., 8, 1429–1446, 1995.
Henderson-Sellers, A., Continental cloudiness changes this century, Geo-Journal, 27.3, 255–262, 1992.
Kagan, R. L., Averaging of Meteorological Fields, Atmos. Oceanogr. Sci.Lib., vol. 19, edited by L. S. Gandin and T. M. Smith, 279 pp., KluwerAcad., Norwell, Mass., 1997.
Kaiser, D. P., Analysis of total cloud amount over China: 1951–1994,Geophys. Res. Lett., 25, 3599–3602, 1998.
Kernthaler, S. C., R. Toumi, and J. D. Haigh, Some doubts concerning alink between cosmic ray fluxes and global cloudiness, Geophys. Res.Lett., 26, 863–865, 1999.
Klein, S. A., and D. L. Hartmann, Spurious changes in the ISCCP data set,Geophys. Res. Lett., 20, 455–458, 1993.
Kristjansson, J. E., and J. Kristiansen, Is there a cosmic ray signal in recentvariations in global cloudiness radiative forcing?, J. Geophys. Res., 105,11,851–11,863, 2000.
Kuang, Z., Y. Jiang, and Y. L. Yung, Cloud optical thickness variationsduring 1983–1991, Geophys. Res. Lett., 25, 1415–1417, 1998.
Marsh, N. D., and H. Svensmark, Low cloud properties influenced bycosmic rays, Phys. Rev. Lett., 85, 5004–5007, 2000.
Norris, J. R., On trends and possible artifacts in global ocean cloud coverbetween 1952 and 1995, J. Clim., 12, 1864–1870, 1999.
Rossow, W. B., and R. A. Schiffer, ISCCP cloud data products, Bull. Am.Meteorol. Soc., 80, 2261–2288, 1999.
Rossow, W. B., A. W. Walker, and L. C. Garder, Comparison of ISCCP andother cloud amounts, J. Clim., 6, 2394–2418, 1993.
Santer, B., T. M. L. Wigley, T. P. Barnett, and E. Anyamba, Detection ofclimate change and attribution of causes, in Climate Change 1995: TheScience of Climate Change, edited by J. T. Houghton et al., pp. 407–443,Cambridge Univ. Press, New York, 1996.
Slingo, A., A GCM parameterization for the shortwave radiative propertiesof water clouds, J. Atmos. Sci., 46, 1419–1427, 1989.
Sun, B., and P. Y. Groisman, Cloudiness variations over the former SovietUnion, Int. J. Climatol., 20, 1097–1111, 2000.
Sun, B., P. Y. Groisman, and I. I. Mokhov, Recent changes in cloud typefrequency and inferred increases in convection over the United States andthe former USSR, J. Clim., 14, 1864–1879, 2001.
Svensmark, H., and E. Friis-Christensen, Variations of cosmic ray flux and
SUN AND BRADLEY: SOLAR INFLUENCE ON COSMIC RAYS AND CLOUD FORMATION AAC 5 - 11
global cloud coverage—A missing link in solar-climate relationships, J.Atmos. Sol. Terr. Phys., 59, 1225–1232, 1997.
Tselioudis, G., Y. Zhang, and W. B. Rossow, Cloud and radiation variationsassociated with northern midlatitude low and high sea level pressureregimes, J. Clim., 13, 312–327, 2000.
Turco, R. P., J.-X. Zhao, and F. Yu, A new source of tropospheric aerosols:Ion-ion recombination, Geophys. Res. Lett., 25, 635–638, 1998.
Warren, S. G., C. J. Hahn, J. London, R. M. Chervin, and R. L. Jenne,Global distribution of total cloud cover and cloud type amounts overland, NCAR Tech. Note NCAR/TN-273+STR, 29 pp., 200 maps, Natl.Cent. for Atmos. Res., Boulder, Colo., 1986.
Woodruff, S. D., R. J. Slutz, R. L. Jenne, and P. M. Steurer, A comprehen-sive ocean-atmosphere data set, Bull. Am. Meteorol. Soc., 68, 1239–1250, 1987.
World Meteorological Organization, Manual on the Observation of Cloudsand Other Meteors, vol. 407, 155 pp., Geneva, 1975.
Yu, F., and R. P. Turco, Ultrafine aerosol formation via ion-mediated nu-cleation, Geophys. Res. Lett., 27, 883–887, 2000.
�����������R. S. Bradley, Climate System Research Center, Department of Geo-
sciences, University of Massachusetts, Amherst, MA 01003 USA.([email protected])B. Sun, NOAA’s National Climatic Data Center, 151 Patton Avenue,
AAC 5 - 12 SUN AND BRADLEY: SOLAR INFLUENCE ON COSMIC RAYS AND CLOUD FORMATION
SUN AND BRADLEY: SOLAR INFLUENCE ON COSMIC RAYS AND CLOUD FORMATION
Figure 4. Correlation between monthly cosmic ray intensity recorded in Climax, Colorado, and totalcloud cover (after removal of the seasonal cycle) from ISCCP (a) C2 and (b) D2 for the period July 1983to June 1991. The magnitude of the value in the color scale denotes the significance level, and the sign ofthe value indicates whether the correlation is positive or negative. For example, red means that cloudcover and cosmic ray intensity is correlated at above the 0.05 significance level.