NAVAL POSTGRADUATE SCHOOL MONTEREY, CALIFORNIA MBA PROFESSIONAL REPORT SOLAR PHOTOVOLTAIC AND LIQUID NATURAL GAS OPPORTUNITIES FOR COMMAND NAVAL REGION HAWAII December 2014 By: Austin L. Henne Advisors: Nick Dew Dan Nussbaum Approved for public release; distribution is unlimited
Transcript
NAVAL POSTGRADUATE
SCHOOL
MONTEREY, CALIFORNIA
MBA PROFESSIONAL REPORT
SOLAR PHOTOVOLTAIC AND
LIQUID NATURAL GAS OPPORTUNITIES FOR COMMAND
NAVAL REGION HAWAII
December 2014
By: Austin L. Henne Advisors: Nick Dew
Dan Nussbaum
Approved for public release; distribution is unlimited
THIS PAGE INTENTIONALLY LEFT BLANK
REPORT DOCUMENTATION PAGE Fonn Approved OMB No. 0704-0188 Public reporting burden for this collection of information is estimated to average 1 hour per response, including the time for reviewing instruction, searching existing data sources, gathering and maintaining the data needed, and completing and reviewing the collection of information. Send comments regarding this burden estimate or any other aspect of this collection of information, including suggestions for reducing this burden, to Washington headquarters Services, Directorate for Information Operations and Reports, 1215 Jefferson Davis Highway, Suite 1204, Arlington, VA 22202-4302, and to the Office of Management and Budget, Paperwork Reduction Proiect (0704-0188) Washington, DC 20503.
1. AGENCY USE ONLY (Leave blank) I 2. REPORT DATE I 3. REPORT TYPE AND DATES COVERED December 20 14 MBA Professional Rep01t
4. TITLE AND SUBTITLE 5. FUNDING NUMBERS SOLAR PHOTOVOLTAIC AND LIQUID NATURAL GAS OPPORTUNITIES FOR COMMAND NAVAL REGION HAW All
6. AUTHOR(S) Austin L. Henne
7. PERFORMING ORGANIZATION NA:i\IIE(S) AND ADDRESS(ES) 8. PERFORiVIING ORGANIZATION Naval Postgraduate School REPORT NUMBER Monterey, CA 93943-5000
9. SPONSORING /MONITORING AGENCY NAME(S) AND ADDRESS(ES) 10. SPONSORING/MONITORING Command Navy Region Hawaii AGENCY REPORT NUMBER
11. SUPPLEMENTARY NOTES TI1e views expressed in this thesis are those of the author and do not reflect the official policy or position of the Deprutment of Defense or the U.S. Govemment. IRB Protocol number __ N/A __ .
12a. DISTRIBUTION I AVAILABILITY STATEMENT 12b. DISTRIBUTION CODE Approved for public release; distribution is unlimited A
13. ABSTRACT (maximum 200 words)
This thesis examines the costs and benefits of tv.ro onsite energy opportunities for Conunand Naval Region Hawaii (CNRH) and the sm1·ounding region. The proj ect analyzes a proposed 50-MW solar photovoltaic (PV) system on West Loch Peninsula in Pearl Harbor, Hawaii, and the economic impacts of a proposed liquid natw-al gas (LNG)-imp01t tenninal on Waipu Peninsula in Pearl Harbor, using net present value (NPV) and cost benefit analysis. CNRH is considering collaboration with Hawaiian Electric Companies to pw-sue the proposed PV plant and the LNG tenninal in order to meet Hawaiian C lean Energy Initiative requirements for producing 40% renewable energy by 2030. The goal of this project is to calculate the economic impacts an LNG -imp01t tenninalrnight have on solar PV and potential indirect impacts of pursuing both proj ects.
14. SUBJECT TERMS 15. NUMBER OF solar photovoltaic, renewable energy, Conuuand Naval Region Hawaii, West Loch, Waipu, liquid PAGES natural gas, Hawaii Electric Company
17. SECURITY 18. SECURITY CLASSIFICATION OF CLASSIFICATION OF TffiS REPORT PAGE
Unclassified Unclassified NSN 754Q-Ol-280-5500
105
16. PRICE CODE
19. SECURITY 20. LIMITATION OF CLASSIFICATION OF ABSTRACT ABSTRACT
Unclassified uu Standard Form 298 (Rev. 2- 89) Prescribed by ANSI Std. 239-18
THIS PAGE INTENTIONALLY LEFT BLANK
ii
Approved for public release; distribution is unlimited
SOLAR PHOTOVOLTAIC AND LIQUID NATURAL GAS OPPORTUNITIES FOR COMMAND NAVAL REGION HAWAII
Austin L. Henne, Lieutenant, United States Navy
Submitted in partial fulfillment of the requirements for the degree of
MASTER OF BUSINESS ADMINISTRATION
from the
NAVAL POSTGRADUATE SCHOOL December 2014
Author: Austin L. Henne Approved by: Nick Dew Dan Nussbaum William R. Gates, Dean
Graduate School of Business and Public Policy
iii
THIS PAGE INTENTIONALLY LEFT BLANK
iv
SOLAR PHOTOVOLTAIC AND LIQUID NATURAL GAS OPPORTUNITIES FOR COMMAND NAVAL REGION HAWAII
ABSTRACT
This thesis examines the costs and benefits of two onsite energy opportunities for
Command Naval Region Hawaii (CNRH) and the surrounding region. The project
analyzes a proposed 50-MW solar photovoltaic (PV) system on West Loch Peninsula in
Pearl Harbor, Hawaii, and the economic impacts of a proposed liquid natural gas (LNG)-
import terminal on Waipu Peninsula in Pearl Harbor, using net present value (NPV) and
cost benefit analysis. CNRH is considering collaboration with Hawaiian Electric
Companies to pursue the proposed PV plant and the LNG terminal in order to meet
Hawaiian Clean Energy Initiative requirements for producing 40% renewable energy by
2030. The goal of this project is to calculate the economic impacts an LNG-import
terminal might have on solar PV and potential indirect impacts of pursuing both projects.
v
THIS PAGE INTENTIONALLY LEFT BLANK
vi
TABLE OF CONTENTS
I. INTRODUCTION........................................................................................................1 A. BACKGROUND ..............................................................................................1
1. Costs ......................................................................................................1 2. Public Policy .........................................................................................3 3. Solar PV ................................................................................................6 4. Liquid Natural Gas ..............................................................................9 5. Energy Storage ...................................................................................11 6. Renewable Energy Reimbursement .................................................11 7. Legislation ...........................................................................................13
B. OBJECTIVE OF THIS STUDY ...................................................................13 C. RESEARCH QUESTIONS ...........................................................................13 D. SCOPE OF STUDY .......................................................................................14 E. ORGANIZATION OF THIS STUDY ..........................................................14
II. LITERATURE REVIEW .........................................................................................15 A. “TRACKING THE SUN VII” ......................................................................15 B. HAWAII SOLAR INTEGRATION STUDY ..............................................16 C. THE GALWAY REPORT ............................................................................17 D. FACTS OF GLOBAL ENERGY ..................................................................22
III. METHODOLOGY AND RESEARCH APPROACH ............................................25 A. INTRODUCTION..........................................................................................25 B. PEARL HARBOR SOLAR-PV ANALYSIS ...............................................25
1. 50-MW Solar-NPV Assumptions at West Loch ..............................26 2. Solar Methodology .............................................................................28
a. NPV of Solar PV over Different Investment Costs ................28 b. Break-Even Analysis ...............................................................28
3. Solar PV Sensitivity Analysis ............................................................28 C. A POTENTIAL LNG TERMINAL .............................................................29
1. Zone of Possible Agreement ..............................................................29 2. Galway Report LNG NPV.................................................................30 3. Economics of Pearl Harbor LNG Terminal Alternatives ..............34 4. Comparable LNG-Terminal Land Leases .......................................36 5. LNG Expected Electricity Savings ...................................................36
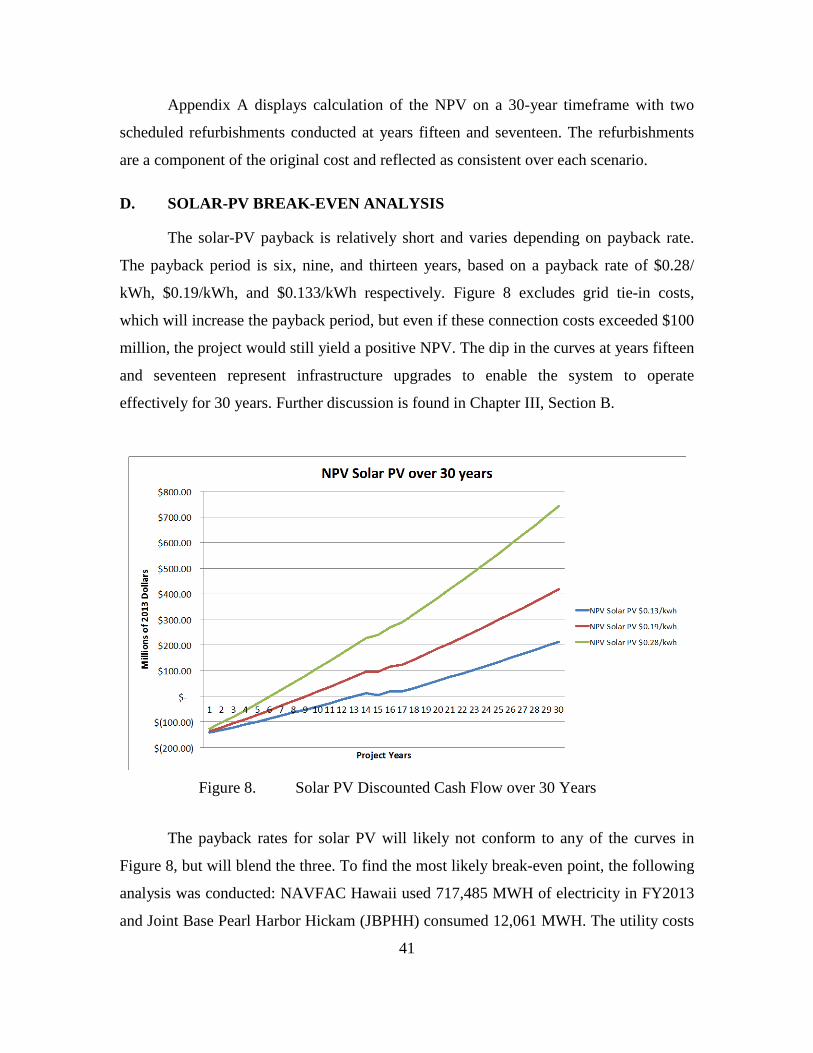
IV. DATA ANALYSIS OF SOLAR PV .........................................................................39 A. INTRODUCTION..........................................................................................39 B. BASE-CASE ASSUMPTIONS AND DATA ANALYSIS ..........................39 C. NPV OF SOLAR PV OVER DIFFERENT INVESTMENT COSTS .......39 D. SOLAR-PV BREAK-EVEN ANALYSIS ....................................................41
V. DATA ANALYSIS OF LNG .....................................................................................45 A. MEETING THE HAWAII CLEAN ENERGY INITIATIVE BY 2030 ...45
vii
B. FGE REPORT NET PRESENT VALUE ....................................................46 C. GALWAY REPORT NET PRESENT VALUES .......................................48 D. LNG FAIR MARKET PORT COMPARABLE .........................................51 E. PROJECTED SAVINGS IN ENERGY COSTS FROM ANNUAL
FINANCIAL STATEMENTS.......................................................................52 F. IMPACT OF AN LNG TERMINAL ON THE RENEWABLE
ENERGY MARKET .....................................................................................54 G. VALUE OF CARGO PORT TERMINAL ..................................................54 H. COST OF REMOVAL OF HOUSES FROM THE BLAST ZONE .........55 I. HECO’S BEST LNG IMPORT TERMINAL ALTERNATIVE ..............55 J. ZONE OF POSSIBLE AGREEMENT FOR AN LNG-IMPORT
VI. CONCLUSIONS AND RECOMMENDATIONS ...................................................59 A. CONCLUSIONS ............................................................................................59 B. RECOMMENDATIONS ...............................................................................61
APPENDIX A. 50-MW SOLAR-PV NPV ..................................................................63
APPENDIX B. LNG CALCULATIONS ....................................................................67
LIST OF REFERENCES ......................................................................................................77
INITIAL DISTRIBUTION LIST .........................................................................................83
viii
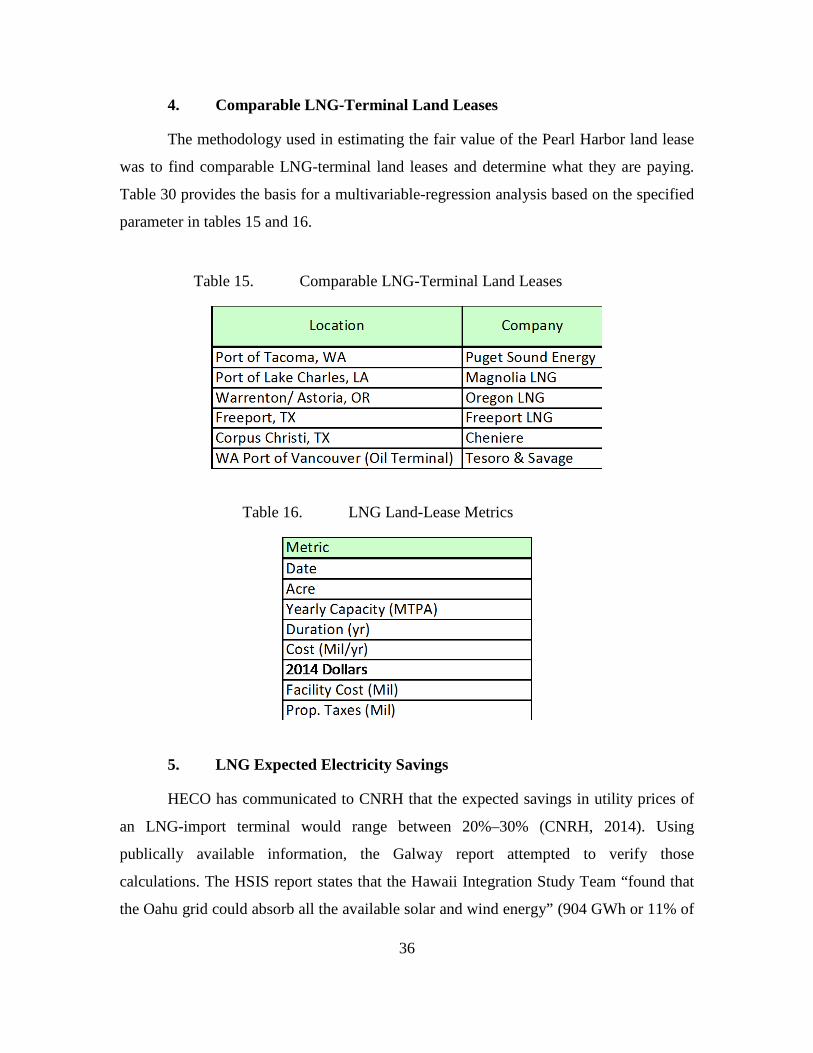
LIST OF TABLES
Table 1. Savings in Delivered Energy Cost, LNG vs Low-Sulfur Diesel, 2012 U.S.$/mmBtu (from FGE, 2012) .......................................................................9
Table 2. By Products of Fuel Combustion (from EPA, 2000) .......................................10 Table 3. Regasification and Shipping Economics (from Galway, 2013) .......................17 Table 4. On Shore vs. Off Shore Regasification Facility (after Galway, 2013) ............19 Table 5. Summary of Options for Regasification Infrastructure (after Galway,
2010) ................................................................................................................27 Table 9. Galway LNG NPV Assumptions .....................................................................31 Table 10. Cost of Delivered LNG in $/mmBTU (after FGE,2012) .................................32 Table 11. Comparison in Delivered Cost of LNG to LSFO and LS Diesel (after
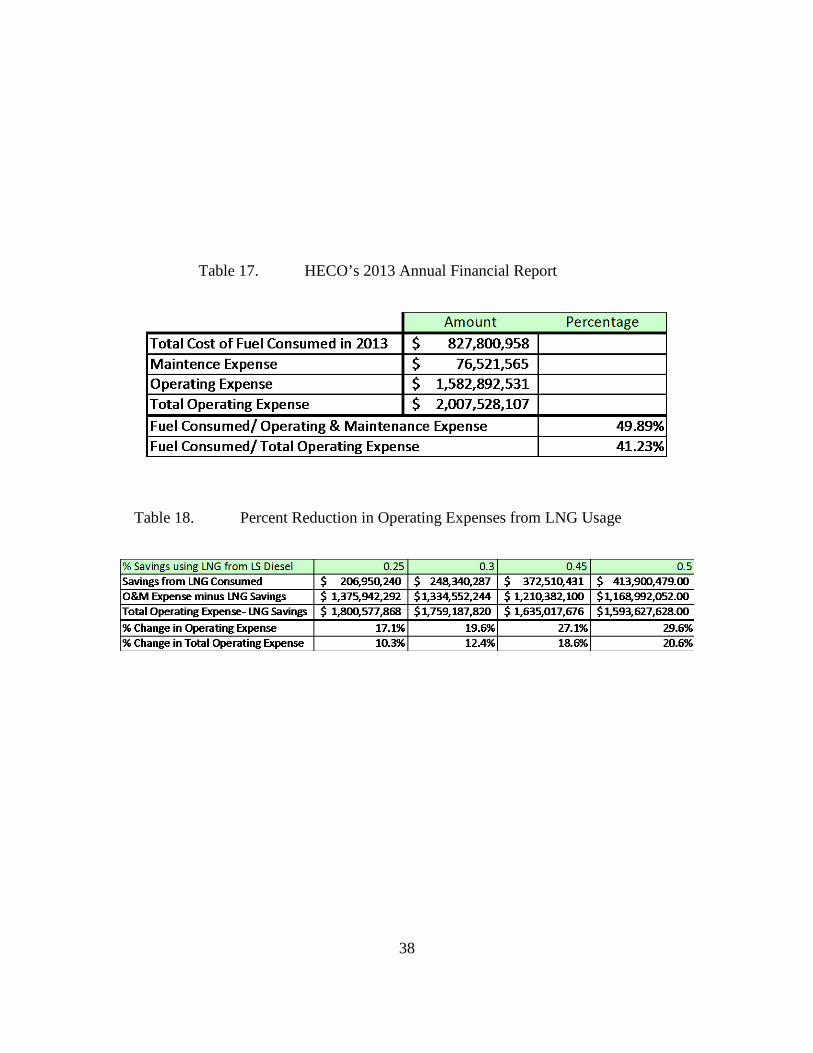
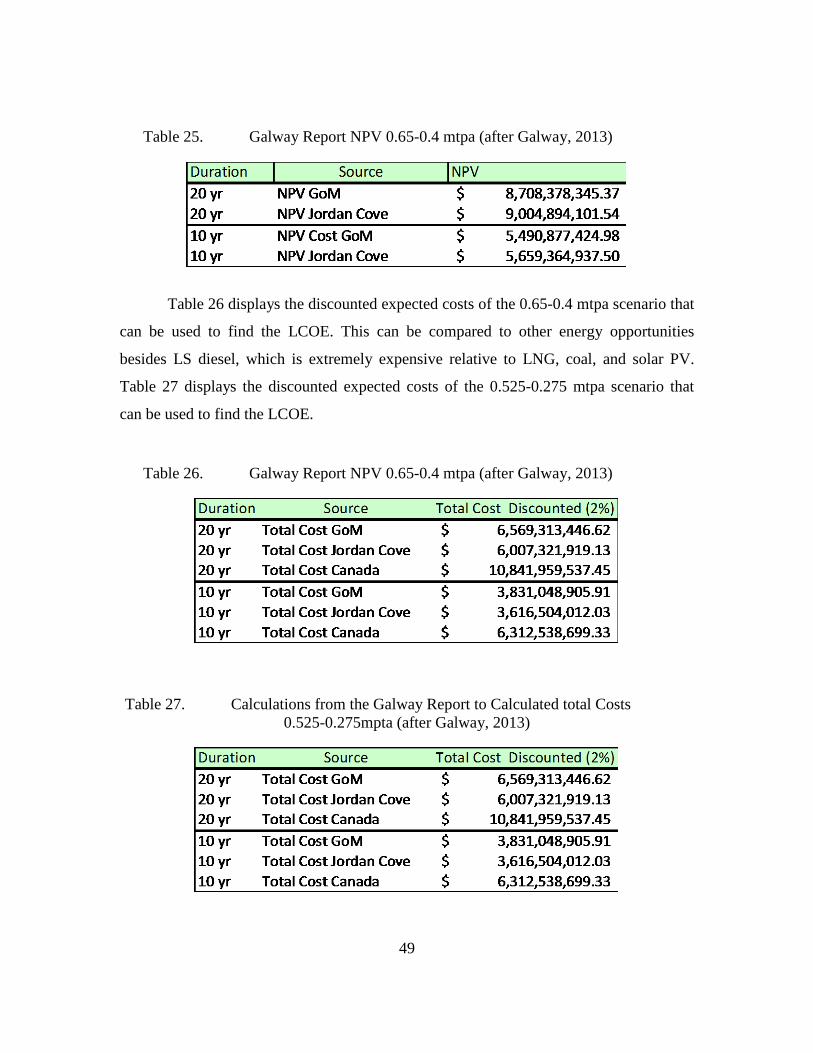
FGE, 2012) .......................................................................................................32 Table 12. Moored LNG FSRU Costs ...............................................................................33 Table 13. Re-gas and Shipping Economics (after Galway, 2013) ...................................35 Table 14. LNG Commodity Prices Generated after Galway Report ...............................35 Table 15. Comparable LNG-Terminal Land Leases ........................................................36 Table 16. LNG Land-Lease Metrics ................................................................................36 Table 17. HECO’s 2013 Annual Financial Report ..........................................................38 Table 18. Percent Reduction in Operating Expenses from LNG Usage ..........................38 Table 19. NPV of 50 MW Solar PV at $3.10 W(dc) .......................................................40 Table 20. Projected Savings from Supply Power to JBPHH with Solar PV ...................43 Table 21. HCEI Specifics (after HECO, 2014b) (after DBEDT, 2014) ..........................46 Table 22. FGE LNG NPV (after FGE, 2012) ..................................................................47 Table 23. FGE NPV (in dollars) (after FGE, 2012) .........................................................47 Table 24. Galway Report NPV 0.525-0.275 mtpa (after Galway, 2013) ........................48 Table 25. Galway Report NPV 0.65-0.4 mtpa (after Galway, 2013) ..............................49 Table 26. Galway Report NPV 0.65-0.4 mtpa (after Galway, 2013) ..............................49 Table 27. Calculations from the Galway Report to Calculated total Costs 0.525-
0.275mpta (after Galway, 2013) ......................................................................49 Table 28. 0.65-0.40 MPTA Levelized Cost of Energy Calculated from Galway
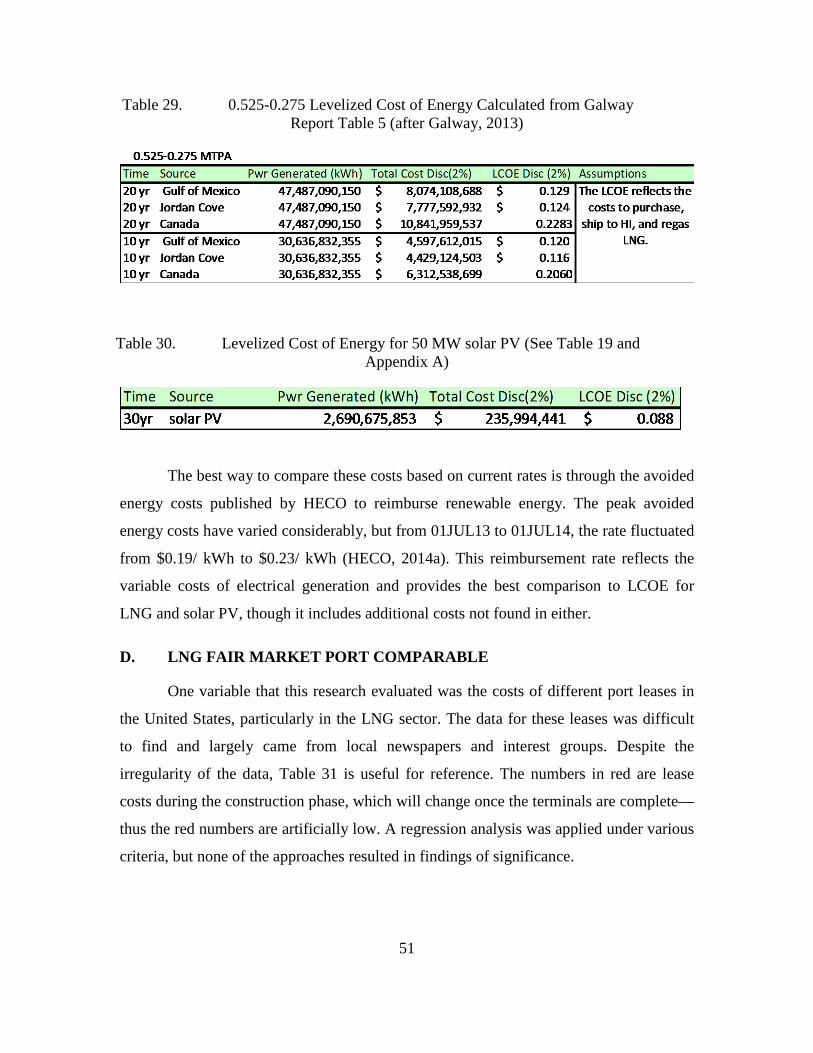
Report Table 4 (N-129) (after Galway, 2013) .................................................50 Table 29. 0.525-0.275 Levelized Cost of Energy Calculated from Galway Report
Table 5 (after Galway, 2013) ...........................................................................51 Table 30. Levelized Cost of Energy for 50 MW solar PV (See Table 19 and
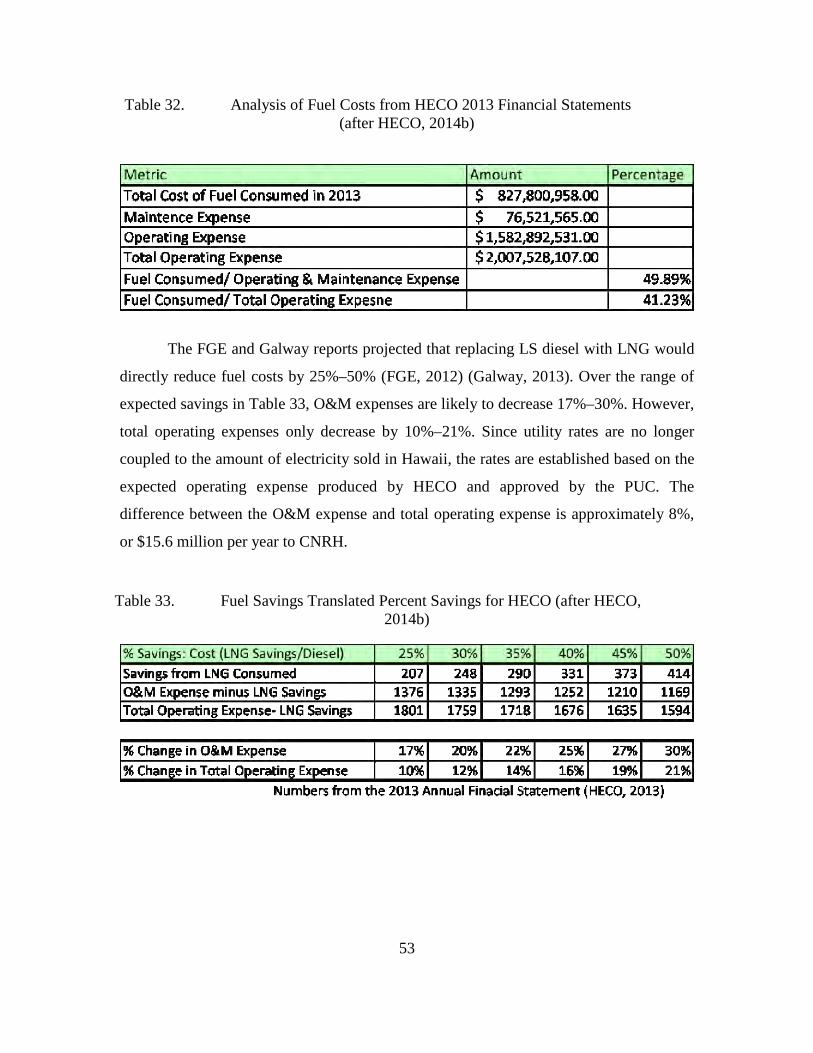
Appendix A).....................................................................................................51 Table 31. Comparative Analysis of Port Leases ..............................................................52 Table 32. Analysis of Fuel Costs from HECO 2013 Financial Statements (after
While the PUC and HECO have expressed a desire to work together to improve
customer service and reduce electricity rates for “customers” (HECO) and “ratepayers”
(PUC), the PUC has essentially taken a hardline stance toward HECO. This dynamic is
extremely important to understand in evaluating the PUC’s willingness to approve an
LNG-import terminal.
HECO is characterized as a monopoly and is therefore tightly regulated by the
PUC. Credit-rating agencies, such as Standard and Poors (S&P), view the relationship
between the utility and the PUC as a significant factor in the utility’s credit rating (NPR,
2012). S&P gave Hawaiian Electric Industries Inc. a BBB- rating in February 2014,
which is the lowest investment-grade credit rating (Hawaiian Electric Industries Inc,
2014), citing “strong” business risk and a “significant” financial-risk profile (Hawaiian
Electric Industries Inc., 2014). The implication is that HECO has to pay high interest
rates for money, a problem when contemplating a large investment such as an LNG-
import terminal; thus HECO will likely rely on a third party consortium to obtain
financing for the proposed project (CNRH, 2014).
There is a significant ideological divergence between HECO’s pursuit of LNG
and the PUC’s preference for renewable energy. The PUC wrote in its guidance to
HECO,
The costs of fuel and purchased power constitute the largest components in today’s high bills for electricity customers and represent major strategic opportunity for lowering electric rates…. Therefore, to further stabilize and lower the costs of generation, the HECO Companies should expeditiously:
• Seek high penetration of lower-cost, new utility-scale renewable resources
• Modernize the generation system to achieve a future with high penetrations of renewable resources
• Exhaust all opportunities to achieve operational efficiencies in existing power plants
• Pursue opportunities to lower fuel costs in existing power plants In carrying out these goals, the Commission puts forward the following guidelines for the review of future generation-related project in each of these areas. Aggressively Seek Lower-Cost, New Utility-Scale Renewable Resources… New generation resources should lower system costs and maximize use of cost-effective renewable resources” (PUC, 2013).
4
These guidelines emphasize that the PUC wants HECO to invest in renewable
resources (PUC, 2014) (or as HECO puts it, variable generation [HELCO, 2014]). The
PUC also wants HECO to modernize current plants and find new ways to lower fuel
costs. While the latter could involve the use of LNG, the PUC’s failure to mention the
proposed $100+ million import terminal among its priorities is significant.
Increasing the use of LNG is not entirely dependent upon the construction of an
import terminal. Hawaii Gas is already shipping containerized vessels to Oahu (EIA,
2014), and HECO is pursuing containerized LNG vessels, pending approval from the
PUC (Shimogawa, 2014b). An article in Pacific-Based News states that
Hawaii Electric Co. has selected a finalist for a project to supply and deliver to the state’s largest electric utility hundreds of tons of liquefied natural gas to be used as a replacement fuel for power generation across Hawaii, the incoming head of the Honolulu-based company told PBN Tuesday (Shimogawa, 2014b).
The PUC report cited docket No. 2013–0381 as stating that
…the average levelized price of the utility-scale solar PV projects included in the Application is 15.576 cents per kWh (calculated without state tax credits), which is significantly lower than HECO’s avoided energy cost of electrical generation 22.697 cents per kWh in November 2013 (PUC, 2013).
The PUC cites HECO’s records in finding that it is 30% cheaper to produce power via
solar PV than the “avoided energy costs,” which is HECO’s cost to produce energy.
However, the PUC did not consider additional costs. Hawaii Administrative Rule 6–74
defines “avoided energy costs” as including the cost of fuel, electrical generation and
operation, and maintenance (Department of Budget and Finance, 1998). Additionally,
avoided energy costs can include fuel inventory costs, working-cash costs, and line-loss
costs, which are considered when presented in a specific proposal from a qualifying
facility (Department of Budget and Finance, 1998). What is not considered in avoided
energy costs is the cost of adding infrastructure upgrades such as smart-grid technology
or utility-scale electrical storage to the grid to accommodate renewable energy (e.g.,
solar, wind), which will be required when renewable penetration exceeds 20% (HSIS,
2012). Therefore, the PUC reference to 15.576 cents per kWh is technically correct in 5
terms of the definition of avoided energy costs, but it is improperly used because higher
penetrations of renewable energy are accompanied by expensive infrastructure upgrades
(PUC, 2014). This problem will continue as renewable-energy distribution grows from
18% in 2013 to exceed 20%. (PUC, 2014) (DBET, 2014) (HSIS, 2012).
A study conducted by FACTS Global Energy, funded by the Hawaii Natural
Energy Institute, an affiliate of the University of Hawaii, finds that,
Some people worry that LNG will be so cheap that it will challenge renewables. This is a strange kind of logic, since it in effect is an argument that the best thing for Hawaii renewables would be if the customers all paid the highest energy prices possible. If that is to be State policy, then LNG is a bad idea. Our analysis here assumes that State policy is to lower prices within the HCEI framework, not keep them high. (FGE, 2012)
Before an LNG-import terminal is further explored, understanding PUC priorities
is essential. These include aggressive pursuit of lower costs, new utility-scale renewable
resources, and reduced fuel costs in existing power plants (PUC, 2014). It remains
unclear whether lowering these fuel costs by means of an LNG-import terminal is
consistent with the PUC’s intended framework.
3. Solar PV
The high cost of electricity presents many opportunities for solar PV in Hawaii, as
well as challenges. Installation of solar PV has rapidly grown, due to a significant cost
reduction in panels, increased federal and state tax incentives, more stringent emissions
targets, and a rise in available financing for renewable energy projects (Rocky Mountain
Institute, 2014) (Medelsohn and Harper, 2012) (Medelsohn and Kreycik, 2012) (Strand
and Seligman, 2013). The Rocky Mountain Institute (RMI) found in 2013 that solar PV
in Hawaii was more cost effective than local utility rates (RMI, 2014). In 2013,
renewable energy constituted approximately 18% of total energy production in Hawaii
(DBET, 2014). Solar PV contributed 4.3% of the renewable total, but it is the fastest-
growing sector in the Hawaiian renewable-energy market (DBET, 2014). Figure 2 shows
solar as a percentage of total renewable-energy generation in Hawaii. Figure 3 shows the
number of PV systems installed in Hawaii as of 2013. Figure 4 shows cumulative solar-
6
PV generation in MW per year. Figure 5 lists completed utility-scale solar projects in the
State of Hawaii.
Figure 2. Solar Energy as a Percentage of Total Renewable Generation in Hawaii (DBET, 2014)
Figure 3. Quantity and Capacity of PV Systems (DBET, 2014)
7
Figure 4. Total Photovoltaic (PV) Generation by Year (GWh) (DBET,
2014)
Figure 5. Existing Utility Scale Solar Projects (DBET, 2014)
According to HECO, the cumulative PV power generation capability in 2013 was
221 MW, generated from 29,558 different systems (DBEDT, 2014). HECO believes that
the growing employment of solar PV, with its variable-generating nature, “present[s] a
severe risk to the security of the system” (HELCO, 2014). Fluctuations in demand for
electricity were met with fast-start diesels and simple-cycle combustion turbine
generators in 2012 (HELCO, 2014), which, being able to operate quickly, were used to
mitigate fluctuations in wind and PV generation (HELCO, 2014). As the supply of
renewable energies increases, the grid will become more vulnerable if corrective actions
are not taken.
8
The Rocky Mountain Institute wrote in 2014 that solar-PV-plus-battery and diesel
generators in commercial systems were either as cost effective or below parity with the
Hawaiian grid (RMI, 2014). In the same report, RMI projected that by the end of 2014,
solar-plus-battery will be on par with the grid for commercial applications, which could
lead to mass defection from dependence on the utility (RMI, 2014). The study noted that
as more people defect from the grid, the utility’s fixed costs will be distributed among
fewer ratepayers, thus hastening the “death spiral” coined by Liam Denning in a
December 2013 Wall Street Journal article (RMI, 2014) (McMahon, 2014).
4. Liquid Natural Gas
HECO seeks to curb the high costs of energy production by using liquid natural
gas (LNG) instead of costly low-sulfur (LS) fuel oil or LS diesel. A 2012 study by FGE
states that “LNG could provide fuel savings in the Oahu power sector of 30–50% or more
compared to oil” (FGE, 2012). The study calculated that savings in 2020 would range
from 31–47% contingent on fuel costs delivered to Oahu, if LNG demand is greater than
0.5 mtpa, and if U.S.-built Jones Act-compliant carriers from the U.S. West Coast could
deliver the LNG to an onshore facility (FGE, 2012). Table 1 shows the projected
percentage decrease in costs from delivering LNG to Oahu as compared to LS diesel.
Table 1. Savings in Delivered Energy Cost, LNG vs Low-Sulfur Diesel, 2012 U.S.$/mmBtu (from FGE, 2012)
9
It should be noted that these projected savings are contingent upon LNG’s being
sourced from the continental United States, with Jones-Act compliant or -exempt ships
available to transport the fuel (FGE, 2012). Savings are less than half if the LNG is
sourced from Canada.
LNG is less expensive than LS diesel and more environmentally friendly than oil
or coal (EPA, 2014). Table 2 illustrates that LNG combustion produces less carbon
dioxide, sulfur dioxide, and nitrogen oxide than either oil or coal.
Table 2. By Products of Fuel Combustion (from EPA, 2000)
Experts disagree as to whether the findings in Table 2 translate directly to a
potential national reduction in carbon emissions. Research conducted by the University of
California, Irvine; Stanford University; and the nonprofit organization Near Zero have
released findings indicating that increased LNG use would have an insignificant benefit
on the environment, as compared to coal (Nunez, 2014). The report found “between 2013
and 2055 the use of natural gas could reduce cumulative emissions from the electricity
sector by no more than 9 percent” (Nunez, 2014). Their research concluded that LNG is
not a suitable bridge fuel from coal to renewable energy from an environmental
perspective.
HECO commissioned the firm of Galway Energy Advisors LLC to study the
commercial viability of importing LNG to Oahu. Completed in October 2012 (Galway,
2013), the Galway report stated that importing LNG would be economically beneficial,
that Pearl Harbor would be the most economically viable location for an LNG terminal
10
(Galway, 2013), and that HECO could use the same diesel power-generation
infrastructure, with minor upgrades (Galway, 2013).
5. Energy Storage
HECO announced in a May 2014 press release that it is pursuing investments in a
storage technology that will accommodate 60–200 MW of energy for up to thirty minutes
(Wall Street Journal, 2014). HECO’s request for proposal (RFP No. 072114-01) observes
that
rapid growth in variable renewable energy penetration to the electrical grid has become a challenge to manage. The intermittent nature of wind and solar generation require that the existing thermal generation fleet since it needs to manage the volatility of the variable generation. Voltage and frequency regulation on the grid are expected to become increasingly challenging with progressively higher levels of variable renewable generation. (Wall Street Journal, 2014)
In September 2014, Pacific Business News reported that HECO was negotiating
with three energy-storage developers after receiving 60 proposals (Shimogawa, 2014).
“Colton Ching, vice president for energy delivery for HECO... [stated that] all three are
proposing battery storage. We hope to sign contracts with all three that offer the best
value for Oahu electric customers” (Shimogawa, 2014).
Energy storage could be extremely useful in protecting the grid from power
fluctuations. Utility-scale energy storage could also be designed to back up critical
infrastructure in the event of complete power loss.
6. Renewable Energy Reimbursement
The State of Hawaii has a net-metering initiative that allows customers to pay
solely for electricity utilized minus the amount of energy the customer produced via
renewable energy (Energy.gov, 2014). However, net metering is restricted to a less-than
100-kW capacity for individual systems in Oahu. Several pilot programs have been
instituted by the HECO utilities, as mandated by the PUC, to allow larger systems to
qualify for net metering that is “technically and economically reasonable and practicable”
(Energy.gov, 2014). However, the pilot program’s maximum capacity falls far short of
11
the 50-MW solar PV capacity that is proposed for Pearl Harbor Naval Base (Energy.gov,
2014) (CNRH, 2014).
Whether solar PV infrastructure is purchased by the Navy or an independent
entity with whom the Navy negotiates a power-purchase agreement (PPA), the 50-MW
system would be reimbursed by HECO at a rate of no less than the avoided energy costs.
These costs range from 19 cents/kWh on peak demand to 15 cents/kWh in the off-peak,
providing that the system is tied into the local utility grid (HECO, 2014a). An
independent power producer (IPP) or the Navy could negotiate a rate exceeding the
avoided energy costs if the agreement is signed no later than one year after the plant is
brought online. The excerpts below outline the legal precedent for avoided energy costs,
found in Docket No. 7310, Decision Order No. 24086, filed March 11, 2008.
Our reading of [HAR chapter 6–74], the applicable state statute, and federal rules and regulations is that a utility and an independent power producer are not precluded from negotiating a contract that contains a front-end loaded energy rate and an environmental and security premium pricing structure. Both [Hawaii Revised Statutes (“HRS”)] 269–27.2 and HAR 6–74-22 (a) (3) require only that rates from power purchases be not less than 100 per cent of the utility’s avoided energy cost and not less than the minimum purchase rate. Moreover, HAR 6–74-15 (b) (1) provides that nothing in subchapter 3 of [HAR Chapter 6–74] “prohibit [s] an electric utility or any qualifying facility to agree to a rate for any purchase, or terms or conditions relation to any purchase, which differ from the rate or terms or conditions which would otherwise be required by this subchapter.
Although a qualifying facility and a utility may negotiate a contract containing [a] front-end loaded energy rate and avoided external cost pricing structure, any such contract must receive the commission’s approval if the utility is to recover any payments it makes under the contract from its ratepayers. In its review of such a contract, the commission must determine, among other things, whether the rate and pricing structure are just and reasonable and in the overall best interest of the general public. In making that determination, the appropriateness of a front-end loaded energy rate and pricing structure in the particular contract is a relevant consideration. (PUC, 2008)
HAR 6–74-1 defines “minimum purchase rate” in terms of utility’s avoided energy cost. In the case of a legally enforceable contract between a qualifying facility and the utility, the minimum purchase rate is the utility’s avoided energy cost in effect on the date the contract becomes
12
effective. Where there is no contract in excess of one year, the minimum purchase rate is the utility’s avoided energy cost in effect on the date the qualifying facility delivers energy to the utility.” (PUC, Footnote Nine, 2008)
The avoided energy costs (> 100kW). Schedule “Q” rates (< or = 100 kW) Q-rate
(cents/kWh) on July 1, 2014 in Oahu. On-peak avoided energy cost was 19.701 (HECO,
2014a). The off-peak avoided energy cost was 15.143, and the Schedule Q for systems
less than 100 kW was 17.33 (HECO, 2014a).
7. Legislation
The Hawaii Clean-Energy Initiative was passed in January 2008 to create a
roadmap from oil to renewable-energy power generation (Braccio, Finch, and Frazier,
2012). “Hawaii Clean Energy Initiative set a goal of generating 70% of electricity from
renewable sources by 2030; 40% from local generation and 30% from energy efficiency
and conservation measures” (Megan Strand and Jake Seligaman, 2013). Residential,
commercial, and utility-scale solar PV all play a part in reaching this goal.
The DOD has strict guidelines regulating the transition to renewable energy. The
“National Defense Authorization Act of 2010: Section 2842 requires the DOD to produce
or procure 25 percent of its total facility energy use from renewable sources, beginning in
2025” (Environmental and Energy Study Institute, 2011). Naval Base Pearl Harbor needs
to procure 179,371 MWh per year by 2025 if energy consumption remains at FY 2013
levels (B. Law, email to author, October 24, 2014).
B. OBJECTIVE OF THIS STUDY
This study analyzes the best information available and presents decision makers
with recommendations as to which proposed energy projects offer the greatest benefit to
the DOD and United States taxpayer.
C. RESEARCH QUESTIONS
• For CNRH, what is the NPV of a 50-MW solar PV installation?
13
• What is the leased value of the land for an LNG-import terminal
(~.55mmpta)?
• What is the difference in cost between using Pearl Harbor land and a
floating LNG terminal?
• If an LNG-import terminal were built, what percentage could the CNRH
expect to save on its utility bill?
• What impact would an LNG-import terminal have on independent
renewable-energy power producers due to PUC-mandated avoided energy
costs?
D. SCOPE OF STUDY
This study is limited to economic analysis of a 50-MW solar-PV project on the
West Loch Peninsula and an LNG-import terminal, both on Pearl Harbor Naval Base,
from the perspective of CNRH.
E. ORGANIZATION OF THIS STUDY
This thesis contains six chapters. Chapter I includes the background, objective,
research questions, and scope of investigation. Chapter II presents a review of relevant
documents. Chapter III describes the methodological approach, NPV, and years to break
even for solar PV. Chapter IV analyzes findings, beginning with an introduction, basic
assumptions, and data and sensitivity analyses and concluding with a note on the study’s
limitations. Chapter V provides an economic analysis of the LNG-import terminal.
Chapter VI summarizes findings and gives recommendations.
14
II. LITERATURE REVIEW
A. “TRACKING THE SUN VII”
“Tracking the Sun” is a report funded by the Lawrence Berkeley National
Laboratory and the U.S. Department of Energy to examine data on installed solar PV in
the United States (Barbose, Weaver, and Darghouth, 2014). The study synthesizes data
from approximately 300,000 individual residential solar, commercial, and utility-scale
PV systems, which represents 80% of the installed solar capacity in the United States
(Barbose et al., 2014). The intent of the study was to track the installed costs of solar PV
before tax incentives. The report separates the costs among residential, commercial, and
utility systems. This thesis concerns trends in utility-scale PVs only.
The report found that “capacity-weighted average installed prices fell by 40%,
from $5.0/W for the 5 systems [utility-scale solar-PV projects] installed during the 2007–
2009 period to $3.0/W for the 25 systems completed in 2013” (Barbose et al., 2014).
However, there was negligible price reduction in the 25 utility-scale projects completed
in 2013 when compared with utility projects completed in 2012 (Barbose et al., 2014).
Possible explanations for this cost flattening include the use of increased premium
efficiency modules and solar-PV unit-tracking capabilities (Barbose et al., 2014).
The report documented a significant decrease in the cost of crystalline silicon (c-
Si) modules as compared to thin-film modules (Barbose et al., 2014). “Average installed
prices [of crystalline silicon] fell by $3.4/W (52%) between the 2007–2009 period and
2013;” however, thin-film prices remained virtually the same during that period (Barbose
et al., 2014).
Prices of the 25 utility-scale solar projects completed in America in 2013 varied
considerably, ranging from $1.9/W to $4.9W, with most of the projects ranging from
$2.6/W to $3.5/W (Barbose et al., 2014). The capacity-weighted average-installed-price
for c-Si modules and tracking was $3.1/W and $3.0/W for fixed- tilt (Barbose et al.,
2014). Thin-film systems cost less, at $2.7/W for fixed-tilt (Barbose et al., 2014).
15
The study found that larger systems did not reflect cost savings due to economies
of scale (Barbose et al., 2014). Additionally, the costs for systems completed in 2012 and
2013 that were greater than 50 MW had a cost per Watt between a narrow range of $2.6/
W to $3.2/W (Barbose et al., 2014).
B. HAWAII SOLAR INTEGRATION STUDY
The Hawaii Solar Integration Study was commissioned by HECO in response to
the Hawaii Clean-Energy Initiative (HSIS, 2012). A research team analyzed numerous
scenarios with various amounts of solar and wind generation (HSIS, 2012).
The study found that the Oahu grid could accommodate up to 20% renewable
energy before point grid security began to be compromised (HSIS, 2012). The study
stated that integrating renewable energy into the grid would reduce variable costs by 19%
each year, relative to the baseline system (HSIS, 2012). However, the estimated reduction
in costs did not account for the capital required to integrate wind and solar energy into the
grid (HSIS, 2012) and also failed to include the cost of the PPA and mitigation measures
(HSIS, 2012).
The study analyzed technologies that would mitigate large fluctuations in current,
including the battery energy-storage system (BESS) (HSIS, 2012). The study determined
that a “BESS of approximately 24–30 MW was needed at each of the [central PV plants
greater than] 100 MW” to “provide a 5% pu/min ramp rate functionality” (HSIS, 2012).
The energy rating for the BESS would need to be between 16–18 min (HSIS, 2012). If
the ramp rate could be reduced, the operating reserves on the system could also be
reduced (HSIS, 2012). If the rate were reduced from 5% pu/min to an aggressive .8% pu/
min, the spinning reserves would be reduced by approximately 40 MW, a reduction of
17% (HSIS, 2012). These calculations were made with the assumption that the annual
energy demand for the Oahu system is 8,084 GWhr, with a system peak of 1,263MW
(HSIS, 2012).
16
C. THE GALWAY REPORT
The Galway report was commissioned by HECO to investigate feasible options
for establishing an LNG-import terminal in Hawaii. The report found that LNG suppliers
factored in the risk of physical damage to a ship when quoting LNG delivery costs
(Galaway, 2013). The premium charged for this risk was approximately $1 per MMtu, or
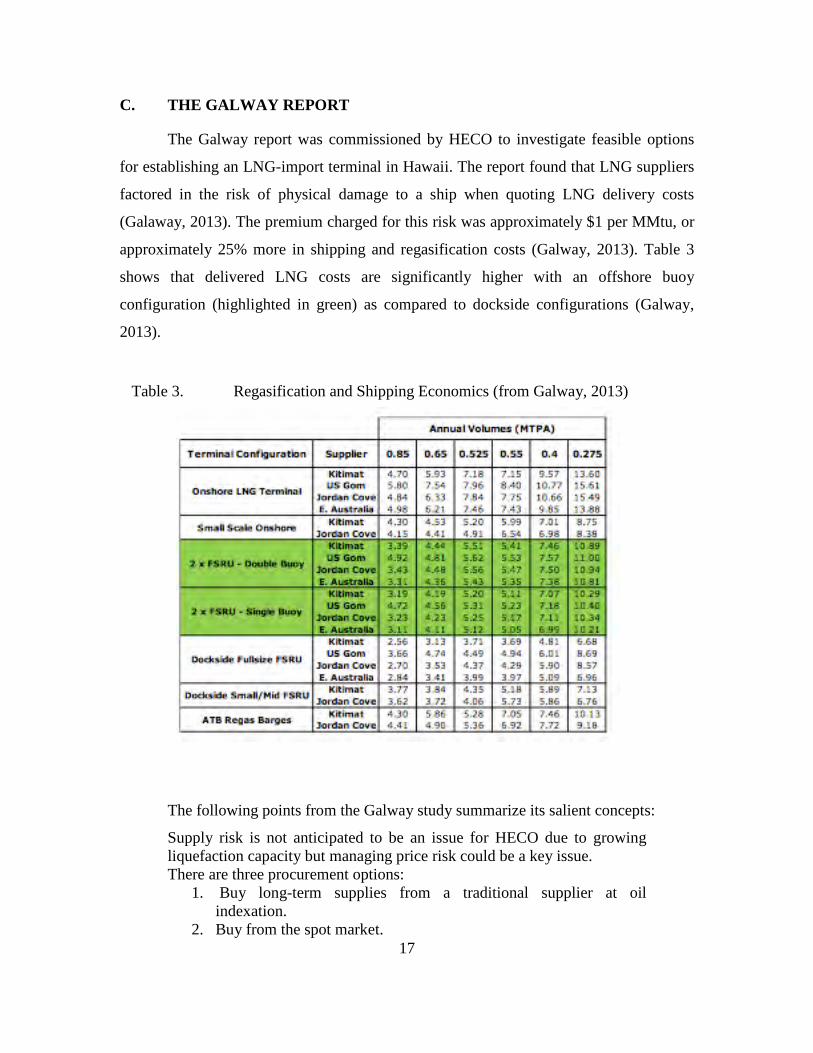
approximately 25% more in shipping and regasification costs (Galway, 2013). Table 3
shows that delivered LNG costs are significantly higher with an offshore buoy
configuration (highlighted in green) as compared to dockside configurations (Galway,
2013).
Table 3. Regasification and Shipping Economics (from Galway, 2013)
The following points from the Galway study summarize its salient concepts:
Supply risk is not anticipated to be an issue for HECO due to growing liquefaction capacity but managing price risk could be a key issue. There are three procurement options:
1. Buy long-term supplies from a traditional supplier at oil indexation.
2. Buy from the spot market. 17
3. Contract for U.S. liquefaction tolling capacity (and buy gas from U.S. grid)
HECO’s demand for LNG is small, which may limit its negotiation leverage as well as procurement options Near shore floating LNG terminal options are viable but may face significant permitting challenges. Although offshore floating options could be viable, additional study is required to confirm this. Shipping strategy is driven by supply strategy and regasification configuration. U.S. Sourced supplies are likely to necessitate HECO’s entry into the shipping business due to the Jones Act compliance requirements. There appears to be a significant positive burner tip price spread between HECO’s [Low Sulfur Fuel Oil] LSFO/ [Low Sulfur Diesel] LSD and U.S. LNG costs. There may be a positive price spread against global oil indexed LNG prices as well. Galway believe there to be sufficient viability to further investigate LNG as an alternative fuel Galway recommends that the next step should be to further define project scope and confirm technical and regulatory viability. This can be accomplished by undertaking the following tasks: Commission detailed siting studies to assess the viability of offshore buoy based options. This could take 3 to 6 months with costs ranging from $0.5 to $1 million. HECO should initiate discussions with the U.S. Navy to assess the viability of locating a FSRU based terminal in Pearl Harbor. Develop regulatory and permitting strategy through informal consultations with federal and state regulatory authorities. Develop detailed commercial and business structure for LNG importation. Hold informal consultations with vendors and suppliers. (Galway, 2013)
Another major consideration in establishing an LNG-import terminal is the
longevity of the terminal. The Galway study estimates import scenarios of .85, .65, and
.525 millions of tons per annum (mmtpa) for the first ten years and .55, .4, and .275 18
mmtpa for the following ten (Galway, 2013). In essence, the Galway study forecasts a
reduction in LNG volumes of 35%, 38%, and 47%, respectively in the first ten years of
production (Galway, 2013). Therefore, the Navy must carefully examine long-term plans
for the import terminal and commission a disposal-cost study before committing to a
contract.
An additional factor that must be considered is whether to build the LNG-import
terminal onshore or afloat. (Either approach must accommodate regasification, or re-gas,
the process of converting liquefied natural gas to natural gas at atmospheric temperature.)
The Galway report summarizes the two options as shown in Table 4 (Galway, 2013).
Table 4. On Shore vs. Off Shore Regasification Facility (after Galway, 2013)
Capital costs may vary from $0.5–$1.5 billion based on the size and configuration
of structures used in high-volume situations (Galway, 2013). Economies of scale are
essential in onshore regasification terminals for companies to recoup the costs of service,
debt servicing, and taxes (Galway, 2013). HECO is not likely to benefit unless significant
economies of scale from an onshore gas facility can be achieved (Galway, 2013).
19
Floating storage and regasification units (FSRUs) may result in significantly less
expensive upfront costs and may prove more cost effective in situations with low
economies of scale (Galway, 2013). Additionally, floating solutions are easier to
implement, both in construction costs and permitting (Galway, 2013). Onshore
regasification permits issued by the Federal Energy Regulatory Commission can take
three to four years (Galway, 2013). The U.S. Coast Guard is responsible for permitting
offshore terminals and has streamlined the process to less than a year (Galway, 2013).
For berth-based floating terminal solutions, “Kalaeloa Harbor and Pearl Harbor
may be the only viable sites” (Galway, 2013). Kalaeloa Harbor is well protected, with
relatively deep water (38 feet), and is close to HECO’s plants and the hub of the fuel-
pipeline distribution infrastructure (Galway, 2013), though the distribution infrastructure
may need to be expanded to accommodate more gas (Galway, 2013). “Met-ocean
conditions are a key determinant of the feasibility of floating LNG solutions” (Galway,
2013). Further study is needed to determine whether Kalaeloa Harbor conditions are
sufficiently mild (Galway, 2013). “From a functional perspective, [Pearl Harbor] is likely
to be the best site as it is protected, in calm waters and closer to major power and gas load
customer” (Galway, 2013).
Floating options using ship-to-ship (STS) transfers may not be feasible in Hawaii
because of the turgid sea state. Unlike U.S. Navy ships, LNG ships conducting STS
transfers do not typically transfer gas while underway (moving through the water). STS
occur mainly between two ships physically fastened via mooring lines. In 2013, FSRU
STS transfers were conducted while docked 95% of the time (Galway, 2013).
Offshore Hawaii has unfavorable sea conditions for STS transfers (Galway,
2013). The report states that a historical analysis of the sea state off the coast of Hawaii in
the vicinity of Barber’s Point showed sea conditions as satisfactory only 14% of the year,
due primarily to the periodicity of the sea state’s exceeding 8 seconds (Galway, 2013).
Galway determined that STS “seems unlikely to be feasible” (Galway, 2013).
20
Kalaeloa Harbor and offshore Barbers Point are two locations under consideration
for an LNG-import facility (Galway, 2013). Table 5 shows both feasible and unfeasible
options.
Table 5. Summary of Options for Regasification Infrastructure (after Galway, 2013)
While several of the options in Table 5 are feasible pending further siting
considerations, Pearl Harbor is presently considered the best option (Galway, 2013). The
Galway report wrote states,
Pearl Harbor seems to be the best site for a Hawaii LNG terminal. The site is protected is in calm water and would likely require little dredging. Further, it is close to major load centers for power HECO and local gas companies. Presumably, it could also provide ancillary benefits to the U.S. Navy Base (Galway, 2013).
The Galway report notes that “Kalaeloa Harbor is seen as a viable fallback siting
option, but obtaining the required permits and approval will require stakeholder consent
and input” (Galway, 2013). The major problems with Kalaeloa Harbor are:
21
• Berth availability “Kalaeloa Harbor is a busy commercial port with
limited berth availability.” The Hawaii Department of Transportation,
Harbor Division, must be consulted with regard to terminal expansions
(Galway, 2013).
• Harbor dredging “Dredging would be required to accommodate standard
LNG ships and berthed FSRUs” (Galway, 2013). The estimated dredging
cost would range from $5 million to $10 million. Additionally, land-based
excavation would also be required, with an estimated cost between $6
million to $20 million at one potential location in Kalaeloa Harbor
(Galway, 2013). Removal of dirt also requires an environmental impact
study under the NEPA process administered by the FERC permitting
process, which increases time and expense (Galway, 2013). However,
dredging would be minimized or eliminated with a small or midscale LNG
solution either onshore or floating (Galway, 2013).
• Security zones The Coast Guard mandates the placement of security
zones on a site-by-site basis for LNG vessels both underway and moored
(Galway, 2013). Merchant traffic and pleasure boaters may have
substantial opposition to LNG permitting in Kalaeloa Harbor (Galway,
2013). Additionally, residential homes would likely fall within an
exclusion zone, which are “determined through modeling and are
dependent on site specific characteristics such as prevailing temperatures,
humidity, wind speed and direction, topography” (Galway, 2013).
D. FACTS OF GLOBAL ENERGY
FGE was contracted in 2012 to conduct an analysis of the LNG market for
Hawaii. The study primarily focused on market conditions for LNG and sourcing
possibilities and financial benefits of building an LNG-import terminal (FGE, 2012).
Obtaining LNG from the right supplier is a primary driver behind the economics of an
LNG-import terminal on Hawaii. One advantage Hawaii has in sourcing fuel from one of
22
the new American LNG-export terminals is that the import terminal would be exempted
from DOE approval because the shipment would be considered interstate trade rather
than legal exporting (FGE, 2012). However, since the trade would be interstate, the Jones
Act would apply (FGE, 2012), requiring “trade between two U.S. ports to be carried on
U.S.-built, U.S.-flagged ships, and the crew must be three-quarters comprised of U.S.
merchant seaman” (FGE, 2012). Currently, all LNG ships built in the United States are
flagged abroad (FGE, 2013). Therefore, American ships would have to be purchased new
or reflagged (FGE, 2012).
An additional problem stems from the fact that all LNG ships, even the smallest,
are rated at a capacity of 57,000 tonnes of LNG at 90% of their deadweight tonnage
(DWT, the total weight of cargo that a ship can transport) (FGE, 2012) (FGE, 2012). For
security of supply, at least two of these ships would have to be engaged (FGE, 2012). The
pair of hypothetical ships would supply 2.2 million tons of LNG per year, or a million
tons if traversing from Australia to the Gulf Coast (FGE, 2012). The Galway study
expects .85 million tons per annum on the high side and, on the low end, .525 tons per
year (Galway, 2013). Additionally, the demand is expected to decrease 35%–47% by the
eleventh year (Galway, 2013).
American LNG ships were all built prior to 1980, making replacement a
consideration (FGE, 2012). However, it is widely held that the industrial infrastructure
for building an LNG cargo ship to replace aging ships no longer exists in the United
States (FGE, 2012). One possible substitute is LNG barges that have been built outside
the U.S. (FGE, 2012). The Coast Guard has deemed foreign LNG barges Jones-Act
exempt, providing that “the LNG containment vessels are not an integral part of the hull”
(FGE, 2012). Further investigation is required to determine whether an FSRU could
receive a Jones-Act waiver (FGE, 2012).
Table 6 shows shipping costs from several LNG-import terminals and highlights
how these costs can vary by large percentages, depending on where the LNG is sourced.
The importance of shipping strategy in the overall economic analysis of the LNG-import
Offshore storage and gasification along the model of the single tending line (STL) buoy system may in fact be a poor idea for Hawaii, irrespective of delivery economics. Once the LNG gas reassumes a gaseous form, many options become impractical. Yes, gas onshore on Oahu can feed power plants and existing Hawaii Gas SNG customers, but it eliminates many of the other possible usages of LNG such as road transport and marine bunkering. LNG may also be the best way to deliver gas for CNG filling stations (FGE, 2013).
The cost of converting diesel plants to LNG must be carefully considered (FGE,
2013). Plants in Puerto Rico have been retrofitted as dual-firing plants that burn either
LNG or diesel at any given time (FGE, 2012). Technology vendors consulted in the FGE
study indicate that the cost of fitting a new power plant for dual firing would cost
$500,000 per unit, and the cost of retrofitting an existing plant would be nearly $1 million
(FGE, 2012). The main consideration is the cost per kWh. For a plant like Kahe, which
has six units, the retrofit would cost approximately $6 million (FGE, 2012). If the plan
maintains a 60% utilization rate, the cost per kWh for retrofitting to dual firing is less
than 0.02 cents (FGE, 2012). The FGE study further concluded that the retrofitting cost
per kWh could be higher in lower-capacity, less-utilized plants, but was not likely to
exceed 0.1 cents/kWh. Therefore, the cost of retrofitting a plant is negligible compared to
fuel, shipping, and capital-investment costs.
24
III. METHODOLOGY AND RESEARCH APPROACH
A. INTRODUCTION
Many variables and models must be considered when analyzing multi-million-
dollar energy projects. Assumptions for developing the NPV and CBA are clarified in
this chapter, followed by explanations of calculations and formulas for each model.
B. PEARL HARBOR SOLAR-PV ANALYSIS
The NPV for Solar PV has been calculated over a 30-year timeframe with a
scheduled system upgrade of $20 million ($400/installed kW) at year fifteen and an
additional upgrade of $12.5 million ($250/ installed kW) at year seventeen to address any
degradation in panels, wiring, or invertor performance. These assumptions are best
estimates; however, a higher fidelity model can be employed based on inputs from the
actual performance and miscellaneous costs of the solar-PV system at Waipu, once
installed (CNRH, 2014). The net-present-value method compares the benefits of owning
a solar-PV system and the option of a PPA, while considering the time value of money.
Table 7. Solar PV NPV Assumptions
25
1. 50-MW Solar-NPV Assumptions at West Loch
The assumptions in Table 8 have been used to develop the 50-MW solar-PV NPV
(see Appendix A) and evaluate the best course of action for CNRH. The assumptions
were generated from the information provided by CNRH and the most relevant published
data. The system capacity was selected by CNRH (CNRH, 2014b). While 50 MW was
used for the base-case assumption, system capacity may change before contract
finalization.
An efficiency and usage percentage of 22% was obtained from a local report
commissioned by HECO for various amounts of solar efficiency per location on Oahu
(HSIS, 2012). The stated 22% for efficiency (usage) is specific to the Pearl Harbor area
and is considered a high-fidelity estimate (HSIS, 2012).
The $0.28/kWh was obtained directly from CNRH (CNRH, 2013). CNRH paid
HECO/KIUC $0.272/kWh on average in FY2013 for all electricity used within the
NAFAC regional fence line (B. Law, email to author, October 24, 2014). Therefore, $.28/
kWh reflects a conservative estimate for the CNRH utility rate, which has shown a strong
historical trend of increasing.
A 2% annual electricity price increase was used as an estimate that roughly
mirrors expected inflation and the average annual PPA rate increase for Hawaii
(Solsystems, 2014).
The 50MW system cost was determined by multiplying the capacity of the system
(50,000 kW =50MW) by the expected $3.10W(dc) for an upper estimate of the utility-
scale projects in Hawaii (Solsystems, 2014). This amount is corroborated by a recent Sun
Shot report observing that U.S. solar prices for a utility-scale c-Si fixed-tilt in 2013–2014
averaged $3.0 W (dc) (Barbose, Galen, Weaver, and Darghouth, 2014). Therefore, $3100
kW (dc) or $3.10 W (dc) was used for the base-case assumption.
Systems maintenance costs were assessed at $40/kW-year with an increase in
costs of 2% per year, totaling $2 million for the first year. $40/kW-year was generated
from an EPRI report that asserted total O&M costs as $47 /kW-yr (EPRI, 2010). Table 8
26
shows the costs of ground-mounted, fixed-tilt solar panels made of monocrystalline (c-Si)
panels (EPRI, 2010). The price breakdown is as follows:
Table 8. Utility-Scale Solar PV Power Plant O&M Costs Estimates (after EPRI, 2010)
The O&M cost estimates seem extremely conservative. Costs such as scheduled
maintenance/cleaning, unscheduled maintenance, and inverter-replacement reserve
certainly apply to the West Loch solar PV project; however, costs such as insurance and
property taxes do not, if the Navy chooses to purchase the system and not pursue a PPA.
Accordingly, only $8 ($/kWh) of the insurance, property taxes, and owners’s costs were
allocated to the total O&M costs. Therefore, the working number for analysis is 40 rather
than 47 ($/kWh-yr).
Degradation of system capability was also considered. According to a report
entitled “Outdoor PV Degradation Comparison” by Jordan, Smith, Gelak, Kurtz, and
Osterwald, the median degradation of solar PV panels over time was 0.5% per year after
comparing 40 different modules from ten different manufactures with a minimum
degradation assessment time of two years (2010). All the panels assessed were installed
before 2008, and several before 2000 (Jordan, Smith, Gelak, Kurtz, and Oserwarld,
2010). In their findings, the authors report that panels produced after 2000 show
considerably less degradation than panels produced before (Jordan, Smith, Gelak, Kurtz,
and Oserwarld, 2010). Since older panels were included in the population sample that
resulted in a 0.5% median degradation, 0.5% appeared to be a fairly conservative
estimate, taking into consideration the age of the solar-PV technology, recent
27
advancements in PV technology, and the ability to choose panels that demonstrate lower
degradation.
2. Solar Methodology
Solar PV was evaluated in two ways. The first way was to determine the NPV
over 30 years. The second way was to determine the number of years for the investment
to break even.
a. NPV of Solar PV over Different Investment Costs
The cost of solar PV is not a fixed price. While indications are that utility-scale
solar prices bottomed out in 2012 and 2013, each individual project is different (Barbose,
Galen, Weaver, and Darghouth, 2014). Therefore, a particular emphasis was made to
evaluate the NPV over a range of installed costs in 2013 dollars, from $2.70 to $3.70 per
Watt (dc) (Barbose, Galen, Weaver, and Darghouth, 2014). Analysis over a broad range
of installed costs allows more relevant estimation of pricing predictions.
b. Break-Even Analysis
A break-even analysis was conducted to estimate the first year solar PV would
have a positive NPV. The values were discounted at the OMB real discount rate of 1.9%
for projects with a life cycle of 30 years.
3. Solar PV Sensitivity Analysis
Solar-PV sensitivity analysis was conducted for both changes in cost savings and
efficiency or performance over time. The cost savings were evaluated at three values:
$0.28/ kWh, $0.19/ kWh, and $13.3/ kWh. $0.28/kWh was used under the assumption
that either a net-metering situation would exist or a micro-grid could be installed to
completely avoid the utility-rate costs. This situation is unlikely to occur, since the PUC
allows for net metering on less than 100-kW systems only (HECO, 2014a). Therefore,
utility-scale systems such as the proposed project at West Loch would not qualify for net
metering. Additionally, CNRH contributes 6.5% of gross revenue for Hawaii Electric
Industries (HEI) and all of HEI’s subsidiaries, according to the 2013 consolidated 10-K
28
(B. Law, email to author, October 24, 2014) (HECO, 2014b). It is highly unlikely that
HECO could sustain such large losses in revenue, considering the relatively small
margins authorized by the PUC.
Utility-scale projects must be repaid at a rate of no less than 100% of the utility
avoided energy cost, which was $0.19/kWh for 7/1/2014 (HAR 6–74-22) (HECO,
2014a). Therefore, the second rate analyzed was $0.19/kWh to capture minimum avoided
energy costs that would be paid by HECO to a utility-scale IPP.
The final rate analyzed was $0.133/kWh, because it captured the savings that
HECO predicted might be expected if an LNG-import terminal were installed. HECO
reported to CNRH that an LNG-import terminal would result in a 20%–30% reduction in
utility rates (CNRH, 2014b), as in the equation below.
$0.19𝑘𝑘𝑘𝑘ℎ
∗ (1 − 30%) =$0.133𝑘𝑘𝑘𝑘ℎ
Three different efficiencies were chosen for sensitivity analysis. The base case
chosen was 22% in accordance with the HECO-commissioned HSIS report. Additionally,
efficiencies of 18% and 28% were analyzed, based on the approximated minus- and plus-
two cents in the levelized cost of energy (LCOE), respectively.
C. A POTENTIAL LNG TERMINAL
An LNG-import terminal could be a significant benefit to CNRH and all utility
ratepayers. While many locations might work for an LNG terminal, the Pearl Harbor
terminal was cited as the best location by the FGE and Galway reports (FGE, 2012)
(Galway, 2013). Both reports cited the offshore terminals as likely unfeasible or requiring
further investigation, due to technical difficulties involving sea state (FGE, 2012)
(Galway, 2013). Besides Pearl Harbor, the only other onshore LNG terminal possible is
Kalaeloa Harbor, the main commercial port for Oahu.
1. Zone of Possible Agreement
A zone of possible agreement (ZOPA) is the bargaining range in which two
parties are willing to conduct business (Spangler, 2013), based on the concept that both
29
parties have already established their best alternative to a negotiated agreement
(BATNA), or best alternative option (Rogers and Ury, 2011). Figure 6 depicts how a
ZOPA can be used.
Figure 6. ZOPA (from Spangler, 2013)
This figure may also describe real negotiations with fictitious numbers. Assume
CNRH is the seller and HECO the buyer, though HECO is currently pursuing CNRH to
reach an agreement. According to Figure 6, the seller (CNRH) is not willing to lease the
land for less than a fictitious $4,500, because the land could be leased to an outside entity
for no less than $4,500. Therefore, CNRH’s BATNA is $4,500. The buyer (HECO) is not
willing to lease the land for greater than $5,000 because that is the cost of a lease at
Kalaeloa Harbor, which would have equal operating costs. Thus, HECO’s BATNA is no
greater than $5,000.
2. Galway Report LNG NPV
The LNG NPV is conducted from the prospective of HECO. While it is
impossible to account for all of the factors that would contribute to the costs of an LNG-
import terminal, the LNG NPV is extremely useful in understanding HECO’s willingness
to pay for the LNG land lease at Pearl Harbor. The FGE report cites the expected cost to
retrofit a diesel generator so that it can also be used with LNG (FGE, 2012). The FGE
30
report also provides estimates for the cost of the piping infrastructure required to
transport LNG from an import terminal to the HECO power facilities (FGE, 2012).
The Galway report gives estimates for the commodity and transportation costs to
Oahu of several of the most viable options and provides a range of costs for a floating
storage re-gas unit (FSRU)—plus the infrastructure required to safely moor the unit in the
harbor.
Based on the numbers generated from the FGE and Galway reports, an NPV
could be conducted with the assumptions listed in Table 9.
Table 9. Galway LNG NPV Assumptions
The consumption of LNG was derived from the Galway report, in which 0.65
mpta was the midpoint value of three estimates in the “HECO Re-gas Economic
Analysis” (Galway, 2013). Additionally, the model is centered at 0.55 mpta, which is the
figure HECO communicated to CNRH as the approximate capacity of the LNG terminal
(CNRH, 2014b). The Galway model demonstrated a decreasing consumption of LNG
from 0.65 mpta a year in 2020 to 0.40 mpta a year in 2030 (Galway, 2013).
The reduction in LNG consumption would be consistent with HECO’s
commitment to achieving the Hawaii Clean Energy Initiative mandate of 40% renewable
energy by 2030. Therefore, this report modeled a linear reduction in LNG consumption in
Year 1 (2021) 0.65 mpta to Year 10 (2030) 0.40 mpta.
The base-case acquisition and transportation costs of LNG were obtained from the
m,s• 2,12s Si3,892~0<l 524,248,508 s~slO,l17 S2<~JS.S09 m , l'9,ass s2;,n~m s:!&,l!O,os; m ,m ,m 526,893,973 >I2,000,483I s ~,856,492} s l2,913,m } s )2,971,895} s [3,03~3331 s ~,091,989) s )3,153,799} s 1~216,874] s ~,181,1121 s )3,346,835}
10421 2043 l.\144
181 291 30
8!,162,760 83,741,9~ 83,323,237 UJ2038431 0.33079!599 0337d10Gl 527)94,693 527,701,3~ s "28,114,134 s ~.·13,773) s {3,482,0<18} s )3;551,689]
Discounte d Cash Flow (OCF} OCF f o r 1 2 y ear s only OCF fo r 1.0 year s only Tota l Cost aver 30 y ear s kwh produce d ove r 30 y e a r s l COE(S/kWh)
s 56,625,766 s 1 8,780,783 $(23 5,994,441) 2 ,690,675,85 3
0 .088
Table 40. 50 MW Solar PV NPV with $0.133 payback
66
APPENDIX B. LNG CALCULATIONS
Appendix B shows the calculations used for calculating the NPV from the FGE
report as well as the NPV from two different Galway report scenarios. This appendix
concludes with the numbers used to determine that the Pearl Harbor LNG terminal was
$50 million less expensive than alternative options.
67
Table 41. FGE LNG NPV (after FGE 2012)
68
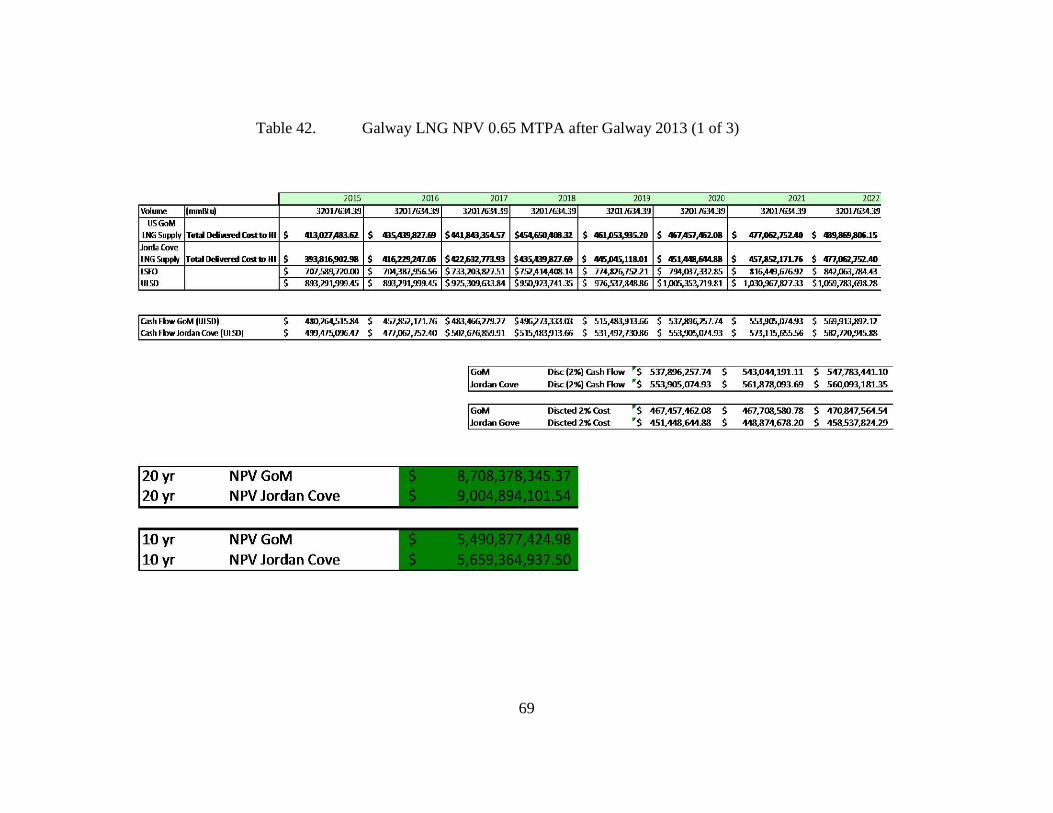
Table 42. Galway LNG NPV 0.65 MTPA after Galway 2013 (1 of 3)
69
2015
Volume (mmBlu) 3201763-139
USGoM IJIG Supply Tobl Delilll!n!d t:ostto HI $ 4B,OZ7 ,483..62
Jorda Cove
LNG Supply Tolill ~m Cosl to HI $ :193,816,!102.!111
Jordan Co~~e $ 135,237,561.89 $154,645,174.13 $122,179,292.85 $170,407,701.83 $117,430,831.38 $ 142,611,469.38 E. Australia $ 130,213,256.19 $150,803,058.00 $ 118, 785,42H.O $167,156,680.49 $115,066,452.23 $140,818,481.86
$ 100 Kit imat S107,185,188.37 s 118,145,070.92 s 81,713,928.77 S130,311,771.99 s 73,098,722.22 s 92,131,974.42
Dockside Full size FSRU USGom S 153,241,324.00 s 169,693,462 .29 s 102,077,144.24 s 164,176,577.60 s 96,742,513.77 s 119,854,320.01 Jordan Cove s 113,046,878.36 s 130,952,124.67 s 98,944,341.86 s 146,566,878.68 s 94,575, 166.21 s 76,822,619.39
E. Austra lia s 118,908,568.35 s 127,110,008.55 s 89,023,800.99 s 137,897,488.44 s 78,615,606.91 s 95,993,793.71
$ 129 Dockside Small/ Mid FSRU Kit imat s 157,846,937.57 s 136,074,946.18 s 103,904,612.30 s 160,112,800.92 s 120,583,336.92 s 98,338,469.70
Jordan Cove S 151,566,555.44 s 132,232,830.05 s 96,333,673.21 s 175,013,315.39 s 119,992,242 .13 s 93,235,351.36 $ 165 Kitimat $180,037,621.10 $ 202,351,449.38 $ 125,573,162.10 $215,651,082.12 $129,252,727.16 $139,715,104.92
I Rule of thumb I s 44.23 1 s 59 .60 $ 27.58 $ 41.87 $ 54.18 $ 60.00 $ 22.17 1 plug
THIS PAGE INTENTIONALLY LEFT BLANK
76
LIST OF REFERENCES
A Barrel Full. (2014). Corpus Christi LNG export terminal. Retrieved from Wikidot http://abarrelfull.wikidot.com/corpus-christi-lng-export-terminal-project.
Barbose, Galen L., Samantha Weaver, and Naïm Darghouth. (2014). Tracking the sun VII: An historical summary of the installed price of photovoltaics in the United States from 1998–2013. Retrieved from University of California, Environmental Energy Technologies Division, Lawrence Berkeley National Laboratory website: http://escholarship.org/uc/item/2j2888zv#page-2
Bashour, N. M. (2014, July 17). Are LNG exports good for America? Retrieved from http://www.atlantic-community.org/-/are-lng-exports-good-for-america-
Braccio, R., Finch, P., & Frazier, R. (2012). Hawaii clean energy initiative scenario analysis: quantitative estimates used to facilitate working group discussions (2008–2010). Retrieved from National Renewable Energy Laboratory http://www.hawaiicleanenergyinitiative.org/storage/pdfs/Hawaii Clean Energy Initiative Scenario Analysis_March 2012.pdf
Cheniere. (2013, September). Annual Report of Cheniere Energy’s Community Investment and Outreach Efforts. Retrieved from http://www.cheniere.com/community/Community%20Brochure%20web.pdf
Command Naval Region Hawaii. (2014a). Naval Region Hawaii energy strategy Retrieved from Command Naval Region Hawaii.
Command Naval Region Hawaii. (2014b). Potential feasibility of liquefied natural gas (LNG) terminal in Pearl Harbor. Retrieved from Command Naval Region Hawaii
Corvin, Aaron. (2014, March 4). Port of Vancouver asked to cancel Tesoro-Savage lease: Opponents of an oil terminal speak at commission hearing. The Columbian. Retrieved from http://www.columbian.com/news/2014/mar/04/port-vancouver-asked-cancel-tesoro-savage-lease/
Daughtry, Shannon. (2012, June 3). Freeport LNG, port ink 30-year lease deal. The Facts: Coastal Communities. Retrieved from http://www.eda-bc.com/documents/FreeportLNGPortInk30-YearLeaseDeal-TheFacts6-3-2012.pdf.
Department of Budget and Finance. (1998). Amendment and compilation of chapter 6–74 Hawaii administrative rules. Retrieved from http://budget.hawaii.gov/wp-content/uploads/2012/11/Chapter-74.pdf
77
Department Bureau Economic Transportation. (2014). Monthly energy trend highlights. Hawii.gov, Research Economic Analysis Division. Retrieved from http://www.google.com/url?sa=t&rct=j&q=&esrc=s&source=web&cd=3&ved=0CCsQFjAC&url=http%3A%2F%2Ffiles.hawaii.gov%2Fdbedt%2Feconomic%2Fdata_reports%2Fenergy-trends%2FMonthly_Energy_Data.xlsx&ei= pW5iVN7IAtSzoQTjv4KQCw&usg=AFQjCNEhpFUwhl_xgoDuSYB2Gc07V2ow0g&sig2=L6QLV-YfUkiHOKipRzVBdA&bvm=bv.79400599,d.cGU
Energy Facility Site Evaluation Council. (2014). Tesro Savage petroleum terminal LLC application. Retrieved from http://www.efsec.wa.gov/Tesoro-Savage.shtml.
Energy Information Agency. (2000). Retrieved from http://www.epa.gov/cleanenergy/energy-resources/egrid/
Energy Information Agency. (2014). Table 8.1. average operating heat rate for selected energy sources. U.S. Energy Information Administration in Form EIA-920, “Combined Heat and Power Plant Report. Retrieved from http://www.eia.gov/electricity/annual/html/epa_08_01.html
Electric Power Research Institute. (July, 2010). Addressing solar photovoltaic operations and maintenance challenges: A survey of current knowledge and practices. Retrieved from http://www.smartgridnews.com/artman/uploads/1/1021496AddressingPVOaMChallenges7-2010_1_.pdf
Environmental and Energy Study Institute. (2011). Fact sheet: DOD’s energy efficiency and renewable energy initiatives. Retrieved from http://www.eesi.org/files/dod_eere_factsheet_072711.pdf
Energy.gov. (2014) Net metering. Retrieved from http://energy.gov/savings/net-metering-9
FACTS Global Energy. (2012). Liquefied natural gas for Hawaii: policy, economic, and technical questions. Retrieved from http://www.hnei.hawaii.edu/sites/web41.its.hawaii.edu.www.hnei.hawaii.edu/files/story/2013/01/Liquefied%20Natural%20Gas%20for%20Hawaii%20Policy%20Economic%20and%20Technical%20Questions-FINAL.pdf
Fisher, Roger and William Ury. (2011). Getting to Yes: Negotiating Agreement Without Giving In, 3rd ed. New York: Penguin Books.
Florip, Eric. Stephanie Rice. (2014, June 2). Council approves resolutions opposing Tesoro-Savage project: Majority of speakers testified against the project before city councilors. The Columbian. Retrieved from http://www.columbian.com/news/2014/jun/02/hundreds-speak-up-on-vancouver-oil-terminal/.
78
Galway Energy Advisors LLC. (2012). LNG imports to Hawaii: Commercial & economic viability study. Retrieved from https://www.hawaiianelectric.com/vcmcontent/IntegratedResource/IRP/PDF/IRP-2013-App-N-LNG-Imports-Study-062813-Filed.pdf
Gilie, John. (2014, August 20). Puget Sound energy to build Washington’s first LNG fueling station at Port of Tacoma. The News Tribune. Retrieved from http://www.thenewstribune.com/2014/08/20/3339543/puget-sound-energy-to-build-washingtons.html
Hawaii Electric Company. (2013). Application for approval of additional waiver from the frame work of competitive bidding (Docket No. 2013–0381).
Hawaii Electric Company. (2014a). Avoided energy costs: Hawaiian Electric Company Hawaii Electric Light Company Maui Electric Company. Retrieved from http://www.heco.com/vcmcontent/StaticFiles/FileScan/PDF/EnergyServices/Tarrifs/HECO/AvoidCost.pdf
Hawaii Electric Company. (2014b). Annual Report of Hawaiian Electric, Inc. to the Public Utilities Commission of the State of Hawaii for the year ending in December 31, 2013.
Hawaiian Electric Industries, Inc. (2014, February, 21). Hawaiian Electric Industries Inc.- 10-K- Management’s discussion and analysis of financial condition and results of operation. Retrieved from http://www.4-traders.com/HAWAIIAN-ELECTRIC-INDUSTR-12896/news/Hawaiian-Electric-Industries-Inc--HAWAIIAN-ELECTRIC-INDUSTRIES-INC-10-K-MANAGEMENTS-DISCUSSI-17985588/
Hawaii Electric Light Company. (2014). Power Supply Plan Docket No. 2012–0212. Retrieved from http://dms.puc.hawaii.gov/dms/OpenDocServlet?RT=&document_id=91+3+ICM4+LSDB15+PC_DocketReport59+26+A1001001A12H31B31149G3426418+A12H31B31149G342641+14+1960
Jang, Brent. (2014, July 8). Aboriginal group on Vancouver Island signs deal for LNG project. The Globe and Mail. Retrieved from http://www.theglobeandmail.com/report-on-business/industry-news/energy-and-resources/aboriginal-group-on-vancouver-island-signs-deal-for-lng-project/article19507257/.
Jordan, D.C. R.M. Smith, C.R. Osterwal, E. Gelak, and S.R. Kurtz. (June 25, 2010). Outdoor PV Degradation Comparison. National Renewable Energy Laboratory. Retrieved from http://www.nrel.gov/docs/fy11osti/47704.pdf
McMahon, J. (2014, February 4). Utilities want regulatory rescue from ‘death spiral.” Forbes. Retrieved from http://www.forbes.com/sites/jeffmcmahon/2014/02/04/utilities-want-regulatory-rescue-from-death-spiral/
79
Magnolia LNG. (2013, October 11). Application of Magnolia LNG, LLC for long-term authorization to export LNG to free trade agreement countries. Retrieved from http://www.fossil.energy.gov/programs/gasregulation/authorizations/2013_applications/13_131_lng_fta.pdf
Magnolia LNG (2013) Show page. Retrieved from http://www.magnolialng.com/IRM/Company/ShowPage.aspx?CategoryId=190&CPID=1980&EID=50440019
Medelsohn, M., & Kreycik, C. (2012). Federal and state structures to support financing utility-scale solar projects and the business models designed to utilize them. Retrieved from National Renewable Energy Laboratory website: http://www.nrel.gov/docs/fy12osti/48685.pdf
Mendelsohn, M., & Harper, J. (2012). Treasury grant expiration: Industry insight on financing and market implications (1603). National Renewable Energy Laboratory. Retrieved from http://www.nrel.gov/docs/fy12osti/53720.pdf
National Public Radio. (2012): Hawaiian Electric Company. Retrieved from http://www.hawaiipublicradio.org/sites/default/files/news_mp3/HECO_17.mp3
Naval Station Pearl Harbor (2014, November, 14). 2014 BAH Rates. Retrieved from www.pearlharborhousing.com/bah.php.
Nunez, Christina. (2014, September 24). Switch to natural gas won’t reduce carbon emissions much, study finds. National Geographic [online]. Retrieved from http://news.nationalgeographic.com/news/energy/2014/09/140924-natural-gas-impact-on-emissions/
Office of Management and Budget (2013). OMB Circular No. A-94. Retrieved from http://www.whitehouse.gov/omb/circulars_a094/a94_appx-c
Oregon LNG. (2014). Home Page. Retrieved from http://www.oregonlng.com
Port Authority of New York and New Jersey (2011, June 14) Amended and restated agreement of lease between Port Authority of New York and New Jersey and Port Newark Container Terminal LLC. Lease No. L-PN-265. Retrieved from http://www.panynj.gov/corporate-information/pdf/port-lease-amended-PNCT-6-2011.pdf.
Port Authority of New York and New Jersey (2000, October 1) Agreement of Lease EP-249 between the Port Authority of New York and New Jersey and Maher Terminals, Inc. Retrieved from http://www.panynj.gov/corporate-information/pdf/port-lease-maher-terminals.pdf
Persily, L. (2012, August 1). LNG could ease Hawaii’s high energy costs. Retrieved October 3, 2014, from http://www.arcticgas.gov/lng-could-ease-hawaii-high-energy-costs
80
Public Utilities Commission of the State of Hawaii. (2008, March 11). Docket no. 7310: Decision and order no. 24086. Retrieved from http://files.hawaii.gov/dcca/dca/dno/dno2008/24086.pdf
Rocky Mountain Institute, Homer Energy, & Cohnreznick Think Energy. (2014). The economics of grid defection: When and where distributed solar generation plus storage competes with traditional utility service. Retrieved from http://homerenergy.com/pdf/RMI_Grid_Defection_Report.pdf
Sickinger, Ted. (2010, March, 11). Judge orders Port of Astoria to renew Oregon LNG lease. The Oregonian. Retrieved from http://www.oregonlive.com/business/index.ssf/2010/03/judge_orders_port_of_astoria_t.html
Sickinger, Ted. (2014, July 25). Legal marathon continues over Oregon LNG project in Warrenton. The Oregonian. Retrieved from http://www.oregonlive.com/business/index.ssf/2014/07/oregon_lng_project_in_warrento.html
Spangler, Brian. (June, 2013). Zone of possible agreement (ZOPA). Beyond intractability. Retrieved from http://www.beyondintractability.org/essay/zopa
State of Hawaii Public Utilities Commission. (2013). Public utilities commission issues major energy orders. Retrieved from http://puc.hawaii.gov/wp-content/uploads/2013/06/PUC-Press-Release.2013-06-03.pdf
State of Hawaii Department of Business, Economic Development and Tourism. (2014). Hawaii Energy Facts & Figures May 2014. Retrieved from State of Hawaii Department of Business, Economic Development and Tourism website: http://energy.hawaii.gov/wp-content/uploads/2011/08/HI-Energy-FactsFigures_May2014_2r.pdf
State of Hawaii Public Utilities Commission. (2014). Exhibit a: Commission’s inclination of the future of Hawaii’s electric utilities: Aligning the utility business model with customer interests and public policy goals. Retrieved from http://puc.hawaii.gov/wp-content/uploads/2014/04/Commissions-Inclinations.pdf
Shimogawa, D. (2014a). HECO negotiating with three battery energy storage developers. Pacific Business News. Retrieved October 3, 2014, from http://www.bizjournals.com/pacific/news/2014/09/29/heco-negotiating-with-three-battery-energy-storage.html?page=all
Shimogawa, D. (2014b). HECO down to finalists in LNG developer selection process. Pacific Business News. Retrieved from http://www.bizjournals.com/pacific/news/2014/09/16/heco-down-to-finalists-in-lng-developer-selection.html
Sol Systems. (August, 2014). Project Finance Journal. Retrieved from www.solsystemscompany.com
81
Stock Researching. (2014, January, 18). Royal Dutch Shell: Fundamental Analysis WACC, Cost of Debt and Cost of Equity $RDS.A. Retrieved October 31, 2014, from http://www.stockresearching.com/2014/01/18/royal-dutch-shell-fundamental-analysis-wacc-cost-of-debt-and-cost-of-equity-rds-a/
Strand, M., & Seligman, J. (2013). Renewable energy installations acceleration in Hawaii. Retrieved from Chadbourne & Parke LLP website: http://www.chadbourne.com/files/Publication/98a55a15-4c0c-468c-a0df-859432bbbda6/Presentation/PublicationAttachment/f0243bec-8417-4fbf-9ae9-8fac2acdab4f/RenewableEnergyInstallationsInHawaii_Seligman_Aug13.pdf
Thaler, Richard H. Sendhil Mullainathan. “Behavioral Economics.” The Concise Encyclopedia of Economics. 2008. Library of Economics and Liberty. Retrieved November 22, 2014 from the World Wide Web: http://www.econlib.org/library/Enc/BehavioralEconomics.html
Union of the Electricity Industry. (2012). EU islands: Towards a sustainable energy future. Retrieved from http://www.eurelectric.org/media/38999/eu_islands_-_towards_a_sustainable_energy_future_-_eurelectric_report_final-2012-190-0001-01-e.pdf
United States Environmental Protection Agency. (n.d.). Natural Gas. Retrieved October 3, 2014, from http://www.epa.gov/cleanenergy/energy-and-you/affect/natural-gas.html
82
INITIAL DISTRIBUTION LIST
1. Defense Technical Information Center Ft. Belvoir, Virginia 2. Dudley Knox Library Naval Postgraduate School