Solar-Powered, Liquid-Desiccant Air Conditioner for Low-Electricity Humidity Control – Summary Report Energy and Water Projects Demonstration Plan SI-0822 TP-7A40-56437-2 November 2012 Jesse Dean, Eric Kozubal, Lesley Herrmann (NREL) Jeff Miller and Andy Lowenstein (AIL Research) Greg Barker (Mountain Energy Partnership) Steve Slayzak (Coolerado) Link to Full Report
Transcript
Solar-Powered, Liquid-Desiccant Air Conditioner for Low-Electricity
Humidity Control – Summary Report
Energy and Water Projects Demonstration Plan SI-0822
TP-7A40-56437-2
November 2012
Jesse Dean, Eric Kozubal, Lesley Herrmann (NREL) Jeff Miller and Andy Lowenstein (AIL Research)
Greg Barker (Mountain Energy Partnership) Steve Slayzak (Coolerado)
This manuscript has been authored by employees of the Alliance for Sustainable Energy, LLC (“Alliance”) under Contract No. DE-AC36-08GO28308 with the U.S. Department of Energy (“DOE”). The work described in this report (NREL/TP-7A40-56437) was funded under task number WFG7.1000. This report was prepared as an account of work sponsored by an agency of the United States government. Neither the United States government nor any agency thereof, nor any of their employees, makes any warranty, express or implied, or assumes any legal liability or responsibility for the accuracy, completeness, or usefulness of any information, apparatus, product, or process disclosed, or represents that its use would not infringe privately owned rights. Reference herein to any specific commercial product, process, or service by trade name, trademark, manufacturer, or otherwise does not necessarily constitute or imply its endorsement, recommendation, or favoring by the United States government or any agency thereof. The views and opinions of authors expressed herein do not necessarily state or reflect those of the United States government or any agency thereof.
Available electronically at http://www.osti.gov/bridge
Available for a processing fee to U.S. Department of Energy and its contractors, in paper, from:
U.S. Department of Energy Office of Scientific and Technical Information P.O. Box 62 Oak Ridge, TN 37831-0062 phone: 865.576.8401 fax: 865.576.5728 email: mailto:[email protected]
Available for sale to the public, in paper, from: U.S. Department of Commerce National Technical Information Service 5285 Port Royal Road Springfield, VA 22161 phone: 800.553.6847 fax: 703.605.6900 email: [email protected] online ordering: http://www.ntis.gov/help/ordermethods.aspx
Printed on paper containing at least 50% wastepaper, including 10% post-consumer waste.
iii
Table of Contents Table of Contents ......................................................................................................................... iii List of Figures ............................................................................................................................... iv
List of Tables ................................................................................................................................. v
Acronyms and Abbreviations ..................................................................................................... vi ACKNOWLEDGEMENTS ......................................................................................................... 1
APPENDIX –POINTS OF CONTACT .................................................................................... 35
iv
List of Figures Figure 1. Psychrometric chart showing the dehumidification process using desiccants .............. 11 Figure 2. Desiccant reactivation using single-effect scavenging air regenerator ......................... 12 Figure 3. Major components and packaging of the AILR LDAC. ............................................... 13 Figure 4. The first implementation of a low-flow conditioner. .................................................... 14 Figure 5. The upper end of a manufacturable low-flow conditioner. ........................................... 15 Figure 6. A PPSU regenerator (similar to the one installed in the Tyndall LDAC). .................... 16 Figure 7. The second prototype of a low-flow LDAC processing ventilation air for a machine
shop in Wrightsville, Pennsylvania. ........................................................................................ 16 Figure 8. Commercial LDAC using low-flow technology installed on a Los Angeles
supermarket. ............................................................................................................................ 17 Figure 9. Psychometric plot Tyndall AFB .................................................................................... 21 Figure 10. AFRL site. ................................................................................................................... 22 Figure 11. Tyndall AFB building layout....................................................................................... 23 Figure 12. LDAC system and supply air layout. .......................................................................... 26
v
List of Tables Table 1. Performance Objectives .................................................................................................... 3 Table 2. Summer 2010 (3 Weeks) Performance Summary ............................................................ 4 Table 3. Monthly (Averaged) Performance for Summer 2011 ....................................................... 4 Table 4. Energy and Cost Savings from the LDAC in 2011 .......................................................... 4 Table 5. Performance Objectives .................................................................................................. 20 Table 6. Air-Cooled Chiller Schedule .......................................................................................... 24 Table 7. AHU #3 schedule ............................................................................................................ 24 Table 8. Sensor Accuracy Summary ............................................................................................. 27 Table 9. Performance Objectives .................................................................................................. 28 Table 10. Energy and Cost Savings from the LDAC in 2011 ...................................................... 30
vi
Acronyms and Abbreviations AAHX air-to-air heat exchanger AC air conditioning AFB air force base AFRL Air Force Research Laboratory AHU air-handling unit AILR AIL Research ASHRAE American Society of Heating,
Refrigerating, and Air-Conditioning Engineers
Btu British thermal units CaCl2 calcium chloride cfm cubic feet per minute CHP combined heat and power CPVC chlorinated polyvinyl chloride CoC cycles of concentration COP coefficient of performance DAS data acquisition system DOAS dedicated outdoor air system DoD Department of Defense DOE Department of Energy DX direct expansion EER energy efficiency ratio EISA Energy Independence and
Security Act E.O. executive order EPAct Energy Policy Act ESTCP Environmental Security
Technology Certification Program
ft foot ft2 square foot FY fiscal year gal gallon GHI global horizontal irradiance gpm gallons per minute hr hour EUI energy use intensity HMX heat and mass exchanger hp horsepower HVAC heating, ventilating, and air
conditioning LDAC liquid-desiccant air conditioner kW kilowatt kWh kilowatt-hour lb pound LiCl lithium chloride MBtu million British thermal units MEP Mountain Energy Partnership NREL National Renewable Energy
Laboratory PLC programmable logic controller PPSU polyphenylsulfone PVC polyvinyl chloride RH relative humidity VFD variable-frequency drive W watt yr year
1
ACKNOWLEDGEMENTS The authors would like to thank all of the Environmental Security Technology Certification Program (ESTCP) project team members for their creativity, persistence, and willingness to support this project. Bruce Nielsen at Tyndall Air Force Base was instrumental in setting up the demonstration and has provided countless hours assisting with the installation of the data acquisition system (DAS) and multiyear performance testing. Mountain Energy Partnership provided invaluable assistance with the design and installation of the DAS, as well as data analysis support. Jeff Miller and Andy Lowenstein provided countless hours designing, testing, and commissioning the liquid-desiccant system at Tyndall Air Force Base. Various members of the National Renewable Energy Laboratory’s Commercial Buildings Research team—including James Page, Andrew Parker, and Michael Deru—provided laboratory testing assistance, field testing assistance, and modeling support. Finally, the project would not have been possible without financial support from the ESTCP, which not only provided funding but also provided valuable insights into the types of data analysis procedures and results that would be most beneficial to Department of Defense facilities and engineers.
2
EXECUTIVE SUMMARY Today’s air-conditioning (AC) technology is primarily based on direct expansion (DX) or the refrigeration process. It is now so prevalent that it is considered a necessity for the majority of residential and commercial buildings throughout the United States. During the 100-plus years of development, DX AC has been optimized for cost and thermodynamic efficiency, both of which are nearing their practical limits. Nevertheless, AC accounts for approximately 15% of all source energy used for electricity production in the United States alone [nearly 4 quadrillion British thermal units (Btu)], which results in the release of about 343 million tons of carbon dioxide into the atmosphere every year. (DOE 2011) The Department of Defense (DoD) occupies over 316,000 buildings and 182,000 structures on 536 military installations worldwide, and accounts for about 64% of the energy consumed by federal facilities. This makes the DoD the largest energy consumer in the United States. In Fiscal Year (FY) 2007, the DoD consumed 218 trillion Btu in site-delivered energy, 26.2 trillion Btu for AC alone. This cooling cost equates to an estimated $413 million per year. (Pacific Northwest National Lab, undated) In hot, humid climates, conventional AC units expend excess energy to sensibly overcool the air for dehumidification. As a result, excess energy must be used to reheat the air to a more comfortable supply temperature (overcool/reheat cycle). The use of desiccant-based AC systems decouples the latent and sensible loads of an airstream, enabling higher efficiency cooling and improved thermal comfort conditions. The following is a list of criteria that can be used to identify feasible sites for liquid-desiccant air conditioner (LDAC) applications:
• Hot and humid climate – latent cooling required most of the year • One hundred percent outdoor air ventilation requirements • Significant reheat loads on current heating, ventilation, and AC (HVAC) system • Heat source available or suitable installation identified for desiccant regeneration • Current issues with humidity control – comfort, sick building syndrome, mold, etc.
The primary objective of this project was to demonstrate the capabilities of a new high-performance, liquid-desiccant dedicated outdoor air system (DOAS) to enhance cooling efficiency and comfort in humid climates while substantially reducing electric peak demand at Tyndall Air Force Base (AFB), which is 12 miles east of Panama City, Florida. The new type of LDAC invented by AIL Research (AILR) has higher thermal efficiency than any other LDAC on the market today. The technology was recently invented, and only six active units were operating at the time of this report, four of which are demonstration projects funded by the Department of Energy (DOE) with the purpose of demonstrating different applications and resolving new-product technical issues. Broader application is expected soon after technical reliability and manufacturing costs become acceptable. Seeing the technology’s potential, Munters Corporation recently purchased AILR’s LDAC technology and will commercialize it in areas with low thermal energy costs compared to electricity (e.g., low natural gas cost or waste-heat applications). This was the first solar-powered demonstration of the technology. The goal of the project was to quantify energy and water consumption, solar energy utilization, and cost savings relative to DX air conditioners. The LDAC system that was installed at Tyndall AFB was a pre-commercial
3
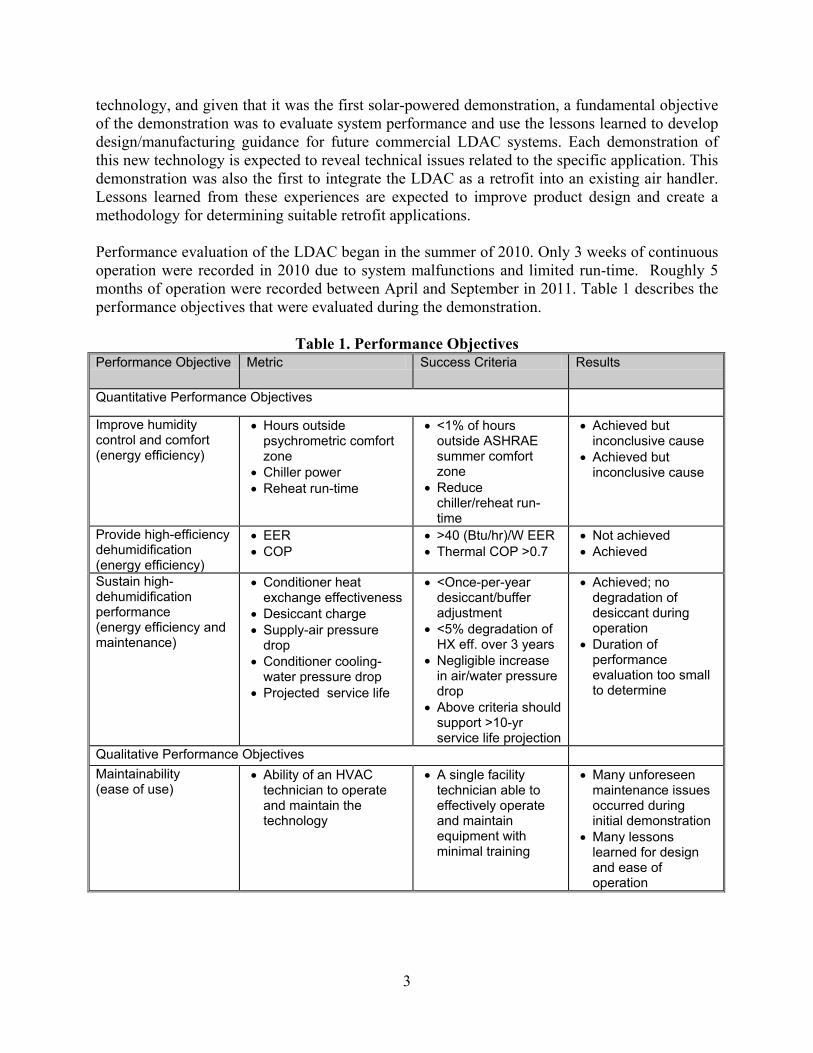
technology, and given that it was the first solar-powered demonstration, a fundamental objective of the demonstration was to evaluate system performance and use the lessons learned to develop design/manufacturing guidance for future commercial LDAC systems. Each demonstration of this new technology is expected to reveal technical issues related to the specific application. This demonstration was also the first to integrate the LDAC as a retrofit into an existing air handler. Lessons learned from these experiences are expected to improve product design and create a methodology for determining suitable retrofit applications. Performance evaluation of the LDAC began in the summer of 2010. Only 3 weeks of continuous operation were recorded in 2010 due to system malfunctions and limited run-time. Roughly 5 months of operation were recorded between April and September in 2011. Table 1 describes the performance objectives that were evaluated during the demonstration.
Improve humidity control and comfort (energy efficiency)
• Hours outside psychrometric comfort zone
• Chiller power • Reheat run-time
• <1% of hours outside ASHRAE summer comfort zone
• Reduce chiller/reheat run-time
• Achieved but inconclusive cause
• Achieved but inconclusive cause
Provide high-efficiency dehumidification (energy efficiency)
• EER • COP
• >40 (Btu/hr)/W EER • Thermal COP >0.7
• Not achieved • Achieved
Sustain high-dehumidification performance (energy efficiency and maintenance)
• Conditioner heat exchange effectiveness
• Desiccant charge • Supply-air pressure
drop • Conditioner cooling-
water pressure drop • Projected service life
• <Once-per-year desiccant/buffer adjustment
• <5% degradation of HX eff. over 3 years
• Negligible increase in air/water pressure drop
• Above criteria should support >10-yr service life projection
• Achieved; no degradation of desiccant during operation
• Duration of performance evaluation too small to determine
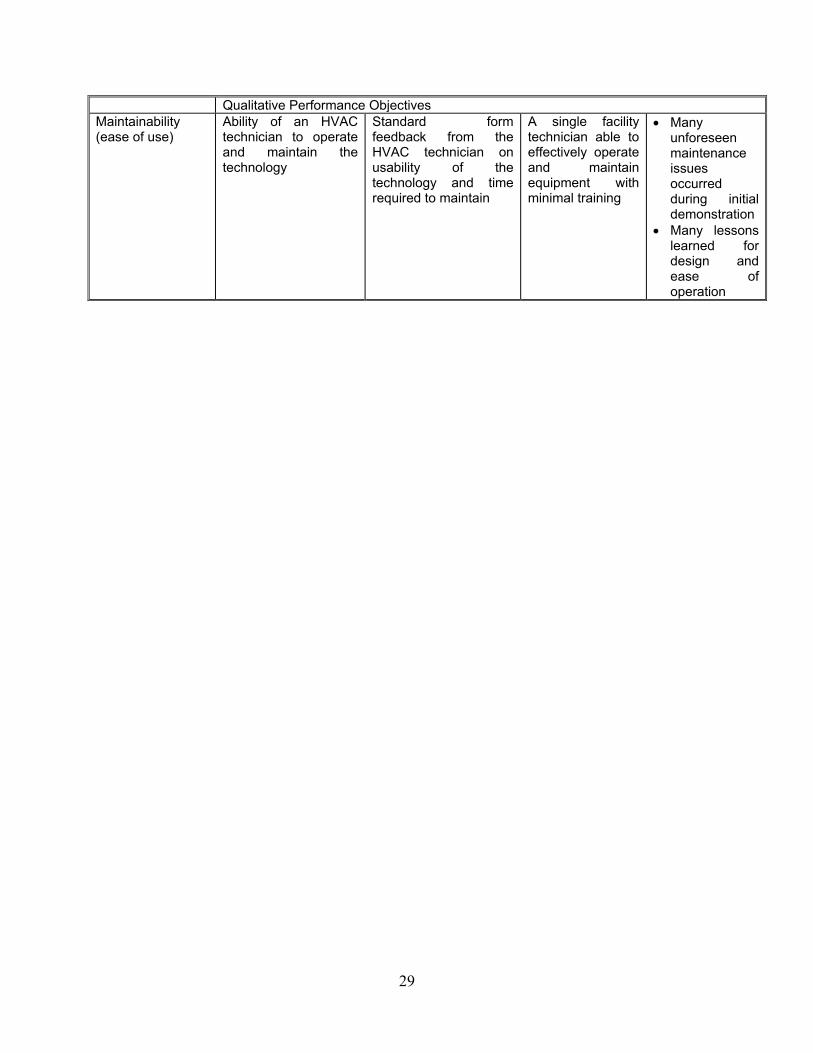
Qualitative Performance Objectives Maintainability (ease of use)
• Ability of an HVAC technician to operate and maintain the technology
• A single facility technician able to effectively operate and maintain equipment with minimal training
• Many unforeseen maintenance issues occurred during initial demonstration
• Many lessons learned for design and ease of operation
4
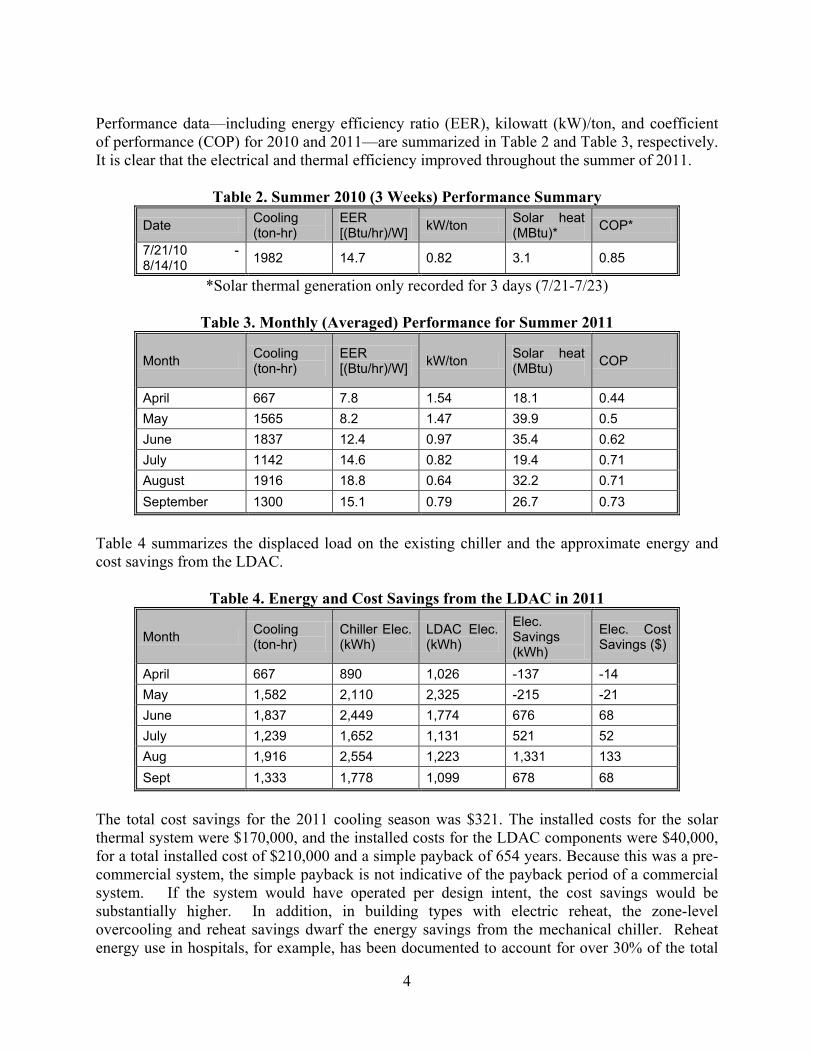
Performance data—including energy efficiency ratio (EER), kilowatt (kW)/ton, and coefficient of performance (COP) for 2010 and 2011—are summarized in Table 2 and Table 3, respectively. It is clear that the electrical and thermal efficiency improved throughout the summer of 2011.
*Solar thermal generation only recorded for 3 days (7/21-7/23)
Table 3. Monthly (Averaged) Performance for Summer 2011
Month Cooling (ton-hr)
EER [(Btu/hr)/W] kW/ton Solar heat
(MBtu) COP
April 667 7.8 1.54 18.1 0.44 May 1565 8.2 1.47 39.9 0.5 June 1837 12.4 0.97 35.4 0.62 July 1142 14.6 0.82 19.4 0.71 August 1916 18.8 0.64 32.2 0.71 September 1300 15.1 0.79 26.7 0.73
Table 4 summarizes the displaced load on the existing chiller and the approximate energy and cost savings from the LDAC.
Table 4. Energy and Cost Savings from the LDAC in 2011
Month Cooling (ton-hr)
Chiller Elec. (kWh)
LDAC Elec. (kWh)
Elec. Savings (kWh)
Elec. Cost Savings ($)
April 667 890 1,026 -137 -14 May 1,582 2,110 2,325 -215 -21 June 1,837 2,449 1,774 676 68 July 1,239 1,652 1,131 521 52 Aug 1,916 2,554 1,223 1,331 133 Sept 1,333 1,778 1,099 678 68
The total cost savings for the 2011 cooling season was $321. The installed costs for the solar thermal system were $170,000, and the installed costs for the LDAC components were $40,000, for a total installed cost of $210,000 and a simple payback of 654 years. Because this was a pre-commercial system, the simple payback is not indicative of the payback period of a commercial system. If the system would have operated per design intent, the cost savings would be substantially higher. In addition, in building types with electric reheat, the zone-level overcooling and reheat savings dwarf the energy savings from the mechanical chiller. Reheat energy use in hospitals, for example, has been documented to account for over 30% of the total
5
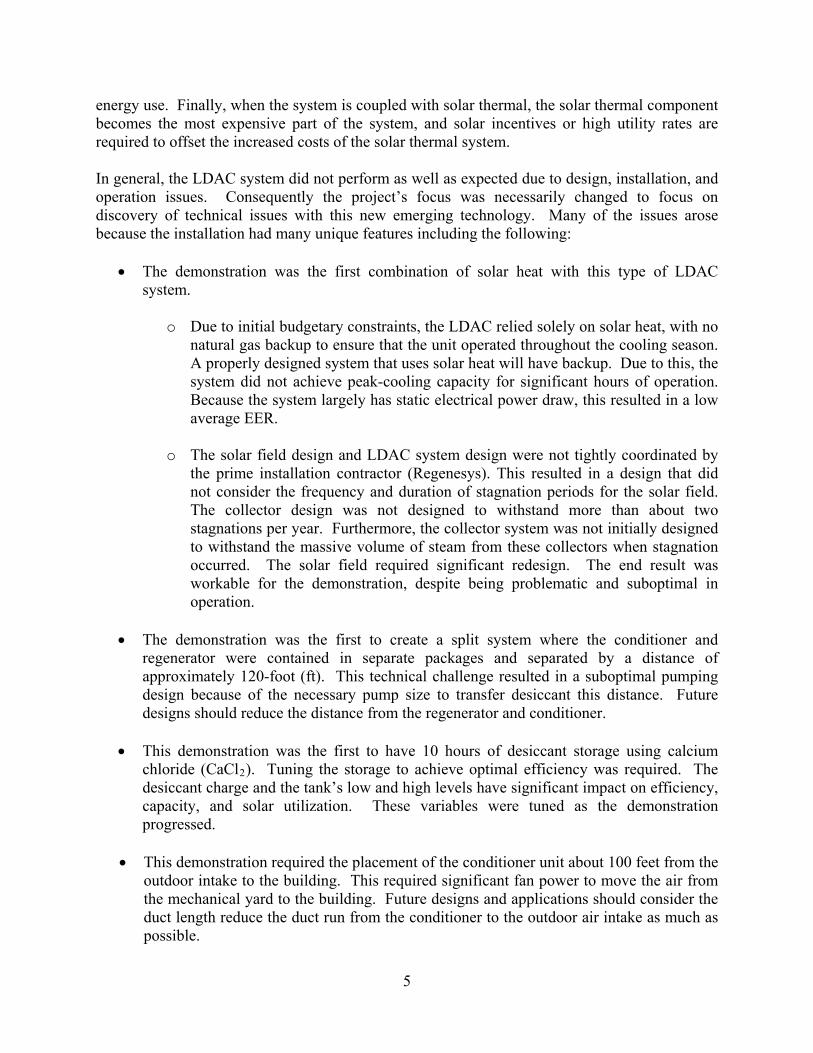
energy use. Finally, when the system is coupled with solar thermal, the solar thermal component becomes the most expensive part of the system, and solar incentives or high utility rates are required to offset the increased costs of the solar thermal system. In general, the LDAC system did not perform as well as expected due to design, installation, and operation issues. Consequently the project’s focus was necessarily changed to focus on discovery of technical issues with this new emerging technology. Many of the issues arose because the installation had many unique features including the following:
• The demonstration was the first combination of solar heat with this type of LDAC system.
o Due to initial budgetary constraints, the LDAC relied solely on solar heat, with no natural gas backup to ensure that the unit operated throughout the cooling season. A properly designed system that uses solar heat will have backup. Due to this, the system did not achieve peak-cooling capacity for significant hours of operation. Because the system largely has static electrical power draw, this resulted in a low average EER.
o The solar field design and LDAC system design were not tightly coordinated by
the prime installation contractor (Regenesys). This resulted in a design that did not consider the frequency and duration of stagnation periods for the solar field. The collector design was not designed to withstand more than about two stagnations per year. Furthermore, the collector system was not initially designed to withstand the massive volume of steam from these collectors when stagnation occurred. The solar field required significant redesign. The end result was workable for the demonstration, despite being problematic and suboptimal in operation.
• The demonstration was the first to create a split system where the conditioner and
regenerator were contained in separate packages and separated by a distance of approximately 120-foot (ft). This technical challenge resulted in a suboptimal pumping design because of the necessary pump size to transfer desiccant this distance. Future designs should reduce the distance from the regenerator and conditioner.
• This demonstration was the first to have 10 hours of desiccant storage using calcium chloride (CaCl2). Tuning the storage to achieve optimal efficiency was required. The desiccant charge and the tank’s low and high levels have significant impact on efficiency, capacity, and solar utilization. These variables were tuned as the demonstration progressed.
• This demonstration required the placement of the conditioner unit about 100 feet from the
outdoor intake to the building. This required significant fan power to move the air from the mechanical yard to the building. Future designs and applications should consider the duct length reduce the duct run from the conditioner to the outdoor air intake as much as possible.
6
• The demonstration did not treat 100% of the outdoor air, thus limiting the benefit to
energy savings from offset cooling. In order to offset the reheat for such an installation, a system should be designed to ensure that the LDAC meets a significant portion of the latent load. Typically, the LDAC can meet 100% of a building’s latent load if designed to treat 100% of the outdoor air.
This report outlines lessons learned that should be applied to future projects in order to ensure successful design, installation, and operation of a solar-powered LDAC system. At the end of 2011, the LDAC technology was sold to Munters Corporation, one of the largest HVAC manufacturers in the United States. The first demonstration of a commercial LDAC system is being evaluated at the Coral Reef Fitness and Sports Center on Andersen AFB in Guam. A 6,000 cubic-feet-per-minute (cfm) conditioner was designed for this system. The power requirements per ton of cooling for the existing building level chiller and LADC are 1.05 kW/ton and 0.3 kW/ton, respectively. Note that the power requirement of the chiller does not account for the chiller water pumps, so the power requirement may be slightly greater in reality. The system is designed with an evacuated-tube solar thermal field supplying 80% of the thermal power and a backup diesel-powered boiler providing 20% of the thermal power. The system is expected to reduce HVAC energy use by 34% and save $145,395 per year with an estimated simple payback of 11.6 years.
7
1.0 INTRODUCTION
1.1 BACKGROUND
Today’s AC is primarily based on the DX or refrigeration process, which was invented by Willis Carrier more than 100 years ago. It is now so prevalent and entrenched in many societies that it is considered a necessity for maintaining efficient working and living environments. DX AC has also had 100-plus years to be optimized for cost and thermodynamic efficiency, both of which are nearing their practical limits. However, the positive impact of improved comfort and productivity does not come without consequences. Each year, AC accounts for approximately 15% of all source energy used for electricity production in the United States alone (nearly 4 quadrillion Btu), which results in the release of about 343-million tons of carbon dioxide into the atmosphere every year. (DOE 2011) R-22 (Freon) as a refrigerant for AC is quickly being phased out because of its deleterious effects on the ozone layer. The most common remaining refrigerants used today (R-410A and R- 134A) are strong contributors to global warming; their global warming potentials are 2,000 and 1,300, respectively. (Owen 2010) Finding data on refrigerant release rates for air conditioners is challenging as they are generally serviced only when broken, and refrigerant recharge is not accurately accounted for. The limited data that does exist indicates that typical refrigerant release rates for supermarket refrigeration equipment are 10% to 15% per year. (Baxter et al. 1998) A typical residential-size AC unit may contain as much as 13 pounds of R-410A, and a 10-ton commercial AC will contain as much as 22 pounds. Water is not commonly considered to be a refrigerant, but the American Society of Heating, Refrigerating and Air-Conditioning Engineers (ASHRAE) recognizes it as the refrigerant R-718. Evaporative cooling uses the refrigerant properties of water to remove heat the same way DX systems use the refrigeration cycle. Water evaporates and drives heat from a first heat reservoir; water vapor is then condensed into a second reservoir. The water used in this process is delivered to the building as a liquid via the domestic water supply. Evaporative cooling is so efficient because the Earth’s atmosphere and nature cycles, rather than a compressor and condenser heat exchanger, perform the energy-intensive process of recondensing the refrigerant. The National Renewable Energy Laboratory’s (NREL’s) thermally activated technology program has been working closely with AILR as an industry partner for more than 15 years to develop an LDAC. The technology uses liquid desiccants to enable water as the refrigerant in lieu of chlorofluorocarbon-based refrigerants to drive the cooling process. The desiccants are strong saltwater solutions. In high concentrations, desiccants can absorb water from air and drive dehumidification processes; thus, evaporative cooling devices can be used in novel ways in all climates. Thermal energy dries the desiccant solutions once the water is absorbed. LDACs substitute most electricity use with thermal energy, which can be powered by many types of energy sources, including natural gas, solar thermal, biofuels, and waste heat. The benefits include generally lower source energy use, much lower peak-electricity demand, and lower carbon emissions, especially when a renewable fuel is used. The LDAC technology deployed in this demonstration was invented by AILR, and was the result of collaborative effort with NREL, and was funded by DOE. The LDAC technology developed
8
by AILR is the result of a 10-year, $5 million DOE R&D effort to increase the efficiency of the LDAC technology on the market and decrease maintenance concerns related to legacy problems with desiccant carryover into the product airstream. The technology is emerging and at the writing of this report, six active demonstrations had been deployed. Munters Corporation has seen the promise of the technology and has purchased the rights from AIL Research. The six active demonstrations are focused on providing cooling to grocery stores where the benefits from drying the space to sufficient levels reduce refrigeration evaporator-coil frosting due to water condensation and freezing. Energy is reduced by less defrosting and a lower load on the refrigeration system. Munters Corporation has taken on the task to manufacture the LDAC technology. The demonstration to date, including the Tyndall demonstration, has shown a critical level of reliability of the LDAC system and identified points of improvement. The sale of the technology shows that Munters Corporation is satisfied with the current state of reliability and willing to commercialize it. AC is also the single largest contributor to peak demand on electric grids and is a primary cause of grid failure resulting in blackouts. Power generators and electric air conditioners are least efficient at high ambient temperatures, when cooling demand is highest, leading to increased pollution, excessive investment in standby generation capacity, and poor utilization of peaking assets. This LDAC approach—the result of a 10-year, $5 million DOE R&D effort—increases the efficiency of LDAC technology on the market and decreases maintenance concerns related to legacy problems with desiccant carryover into the product airstream.
1.2 OBJECTIVE OF THE DEMONSTRATION
The primary objective of this project was to demonstrate the capabilities of a new high-performance, liquid-desiccant DOAS to enhance cooling efficiency and comfort in humid climates while substantially reducing electric peak-demand. This was the first solar-powered demonstration of the technology. The goal of the project was to quantify energy and water consumption, solar energy utilization, and cost savings relative to DX air conditioners. The LDAC system installed at Tyndall was a pre-commercial technology and given that it was the first solar-powered demonstration, a fundamental objective of the demonstration was to evaluate the performance of the system and use the lessons learned to develop design/manufacturing guidance for future commercial LDAC systems. At the end of 2011, the LDAC technology was licensed to Munters, one of the largest HVAC manufacturers in the United States, and the first demonstration of a commercial LDAC system is being evaluated on the Coral Reef Fitness and Sports Center on Andersen AFB in Guam.
1.3 REGULATORY DRIVERS
The DoD Environmental Security Technology Certification Program awarded this new technology demonstration project as a means to identify programmatic changes that could be applied to the design and construction of energy-efficient, DOAS AC systems for humid environments. A new low-energy use LDAC unit could be implemented throughout ASHRAE climate zones 1, 2, and 3 to help the agency meet or exceed the various requirements set forth in Executive Order (E.O.) 13423, the Energy Policy Act (EPAct) of 2005, and the Energy Independence and Security Act (EISA) of 2007.
9
EPAct 2005 requires the U.S. secretary of energy to ensure that not less than 7.5% of total electricity consumed by the federal government comes from renewable sources in FY 2013; and thereafter, to the extent economically feasible and technically practicable in FY 2013, and thereafter, of the total electricity consumed by the federal government comes from renewable energy. If the thermal portion of the LDAC unit is driven by a solar thermal source, this technology would help DoD meet its renewable energy goals. The key features of EISA 2007 that pertain to this technology are outlined in section 431 and requires a reduction in energy use intensity (EUI) [1,000 (k)Btu/square foot (ft2)/year (yr)] of federal buildings by 3% per year, from a 2003 baseline, resulting in a 30% reduction in EUI by 2015. The EISA 2007 legislation has superseded all previous EUI reduction mandates. E.O. 13423 provides requirements for water conservation at federal facilities, mandating federal agencies reduce potable water consumption intensity 2% annually through FY 2020. This would result in a 26% reduction by the end of FY 2020, relative to a FY 2007 baseline. E.O. 13514 also mandates a reduction in industrial, landscaping, and agricultural water consumption by 2% annually, or 20% by the end of FY 2020, relative to a FY 2010 baseline. The LDAC unit can substantially reduce energy use and peak demand, which will help meet EISA 2007 requirements, but it also has the potential to increase potable water consumption, which will be detrimental to the E.O. 13514 requirements. Each DoD base is encouraged to try to identify alternative sources of cooled water for the conditioner, such as geothermal-based cooling.
10
2.0 TECHNOLOGY DESCRIPTION
2.1 TECHNOLOGY OVERVIEW
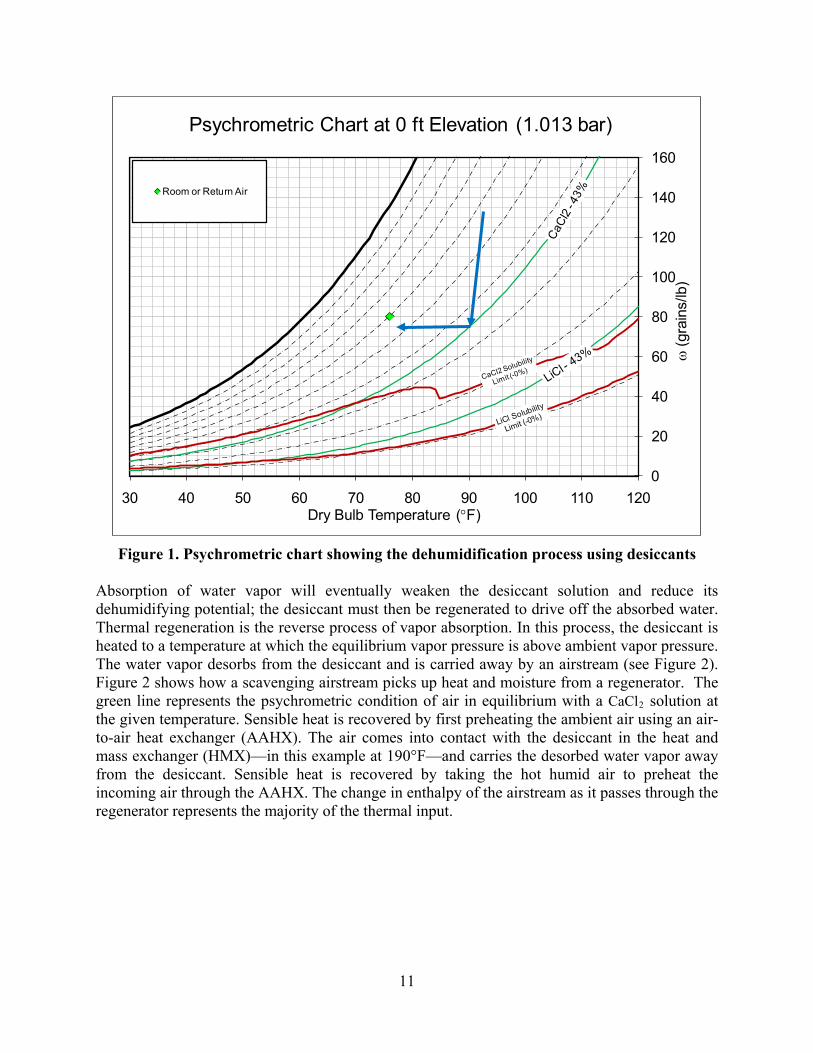
Desiccants reverse the paradigm of standard DX AC by first dehumidifying and then sensibly cooling the outside airstream to meet a given cooling load. Desiccant at any given temperature has a water-vapor pressure equilibrium that is roughly in line with constant relative humidity (RH) lines on a psychrometric chart, as shown in Figure 1. The green lines show the dehumidification potential for two common types of liquid desiccants: lithium chloride (LiCl) and CaCl2. If the free surface of the desiccant is kept at a constant temperature, the ambient air will be driven to the dehumidification potential line. If used with an evaporative heat sink at temperatures between 55°F and 85°F, the air can be significantly dehumidified, and dew points less than 32°F are easily achieved. The blue arrow in Figure 1 shows the path of ambient air driven to equilibrium with CaCl2 with the use of an evaporative heat sink. At this point, the air can be sensibly cooled to the proper supply temperature. This type of desiccant AC system decouples sensible and latent cooling by controlling each independently. During the dehumidification process, the liquid desiccant (about 43% salt concentration by weight in a water solution) absorbs water vapor in an exothermic reaction. The heat released by the desiccant is carried away by a heat sink, usually cooled water from a cooling tower. As water vapor is absorbed from the ambient air, it dilutes the liquid desiccant, and decreases its vapor pressure and its ability to absorb additional water vapor. Lower concentrations of desiccant come into equilibrium at higher ambient air RH levels. Dehumidification can be controlled by the desiccant concentration supplied to the device. The outlet humidity level of the processed ambient air can be controlled by the desiccant concentration and/or the flow of highly concentrated desiccant. The latter allows the highly concentrated desiccant to quickly be diluted and thus “act” as a weaker desiccant solution in the device.
11
Figure 1. Psychrometric chart showing the dehumidification process using desiccants
Absorption of water vapor will eventually weaken the desiccant solution and reduce its dehumidifying potential; the desiccant must then be regenerated to drive off the absorbed water. Thermal regeneration is the reverse process of vapor absorption. In this process, the desiccant is heated to a temperature at which the equilibrium vapor pressure is above ambient vapor pressure. The water vapor desorbs from the desiccant and is carried away by an airstream (see Figure 2). Figure 2 shows how a scavenging airstream picks up heat and moisture from a regenerator. The green line represents the psychrometric condition of air in equilibrium with a CaCl2 solution at the given temperature. Sensible heat is recovered by first preheating the ambient air using an air-to-air heat exchanger (AAHX). The air comes into contact with the desiccant in the heat and mass exchanger (HMX)—in this example at 190°F—and carries the desorbed water vapor away from the desiccant. Sensible heat is recovered by taking the hot humid air to preheat the incoming air through the AAHX. The change in enthalpy of the airstream as it passes through the regenerator represents the majority of the thermal input.
0
20
40
60
80
100
120
140
160
30 40 50 60 70 80 90 100 110 120
ω(g
rain
s/lb
)
Dry Bulb Temperature (°F)
Psychrometric Chart at 0 ft Elevation (1.013 bar)
Room or Return Air
12
Figure 2. Desiccant reactivation using single-effect scavenging air regenerator
The process uses hot water or steam to achieve a latent COP between 0.8 and 0.94, depending on desiccant concentration. Latent COP is defined as:
COP is maximized by maximizing the regeneration temperature and change in concentration while minimizing the desiccant concentration. Including the COP of the water heater (about 0.82), a typical combined latent COP for the LDAC systems is 0.82 × 0.85 = 0.7. If the heating source is derived from solar thermal technologies, the COP of the water heater would be the efficiency of the solar collectors (the benefit here being that there is no fuel cost penalty for the heat conversion efficiency). The AILR technology innovations result in higher thermal efficiency when compared to other technologies on the market. NREL tests have shown that the Kathabar and other high-flow systems achieve a latent COP of about 0.4 to 0.55. The LDAC technology developed by AILR uses novel HMXs to perform these two processes as shown in Figure 3, which illustrates the desiccant conditioner and scavenging air regenerator. The liquid desiccant is dispensed over the plates in the conditioner (absorber) where the inlet ambient air is dehumidified. This technology is called low-flow, liquid-desiccant AC because the desiccant flow is minimized in the HMXs of the conditioner and regenerator to the flow rate needed to absorb the necessary moisture from the airstream, which eliminates liquid desiccant
Enthalpy = 43.6 BTU/lbmEnthalpy = 60.7 BTU/lbmEnthalpy = 194 BTU/lbmAmbient AirAir after AAHXRegeneration Outlet Air
Regenrations Hot Water Tem
perature
13
carryover into the supply airstream. The HMXs must therefore have integral heating and cooling sources; 55°F – 85°F cooling tower water is supplied to the conditioner, and the regenerator uses hot water or hot steam at 160°F – 200°F. The cooling or heating water flows internal to the heat exchange plates while the desiccant flows on the external side of the HMX plates. The plates are flocked, which effectively spreads the desiccant and creates direct-contact surfaces between the air and desiccant as the air passes between the plates.
Figure 3. Major components and packaging of the AILR LDAC.
(Illustration by NREL)
2.2 TECHNOLOGY DEVELOPMENT
Since its founding in 1988, the primary mission of AILR has been to develop and commercialize high-efficiency, end-use products for heating and cooling applications. For the past 14 years, AILR has focused on the parallel activities of developing plastic heat exchangers and applying these heat exchangers in HVAC products that use advanced liquid-desiccant technology. From October 1990 to October 1991, AILR conducted research for the Gas Research Institute on a project entitled, “The Effect of Material Properties on the Performance of Liquid Desiccant Air Conditioners and Dehumidifiers.” (AILR, undated) In addition to investigating alternative desiccants to LiCi, AILR studied novel configurations of the regenerator and the conditioner of an LDAC. An important conclusion from this work, which was reported in ASHRAE Paper No. AN-92-3-3, was that the desiccant flow rate in a packed-bed conditioner (which was the dominant technology at the time) is set by the requirement to limit the desiccant’s temperature rise. (Lowenstein and Gabruk 1992) By embedding cooling within the conditioner heat and
Conditioner
Regenerator
Economizer
hot & humid
air
humid exhaust
cool, dry ventilation delivered to
building heating water
cooling water
14
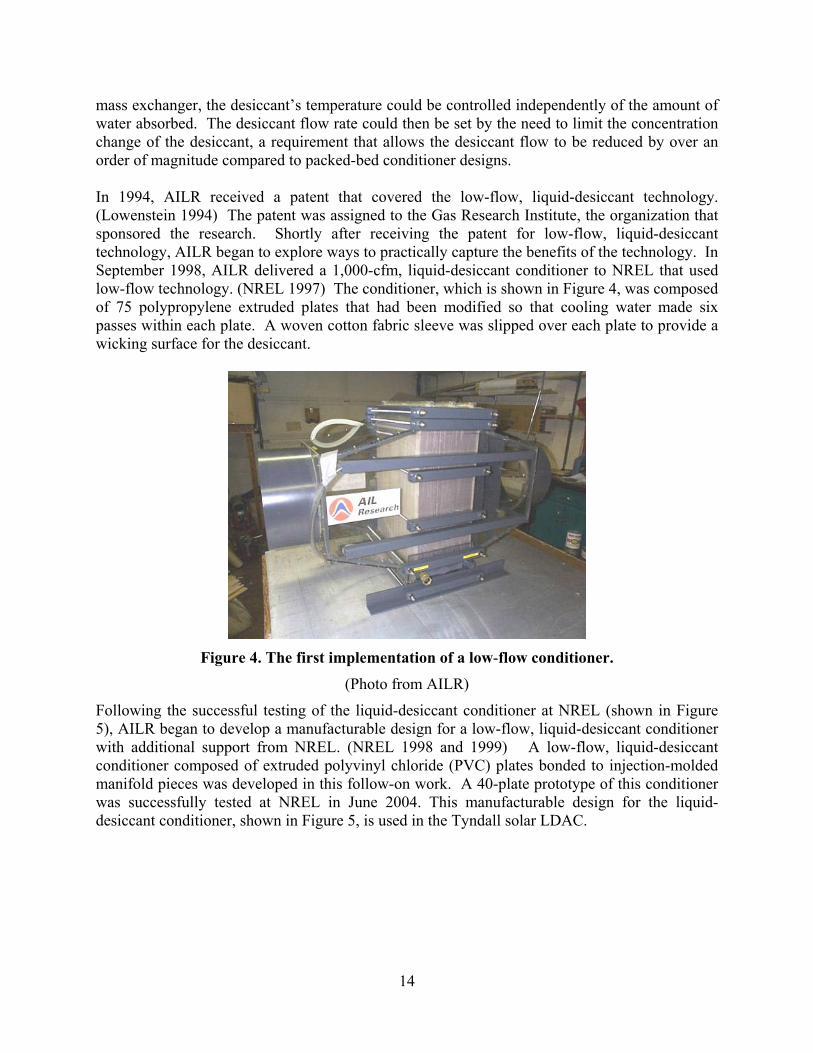
mass exchanger, the desiccant’s temperature could be controlled independently of the amount of water absorbed. The desiccant flow rate could then be set by the need to limit the concentration change of the desiccant, a requirement that allows the desiccant flow to be reduced by over an order of magnitude compared to packed-bed conditioner designs. In 1994, AILR received a patent that covered the low-flow, liquid-desiccant technology. (Lowenstein 1994) The patent was assigned to the Gas Research Institute, the organization that sponsored the research. Shortly after receiving the patent for low-flow, liquid-desiccant technology, AILR began to explore ways to practically capture the benefits of the technology. In September 1998, AILR delivered a 1,000-cfm, liquid-desiccant conditioner to NREL that used low-flow technology. (NREL 1997) The conditioner, which is shown in Figure 4, was composed of 75 polypropylene extruded plates that had been modified so that cooling water made six passes within each plate. A woven cotton fabric sleeve was slipped over each plate to provide a wicking surface for the desiccant.
Figure 4. The first implementation of a low-flow conditioner.
(Photo from AILR)
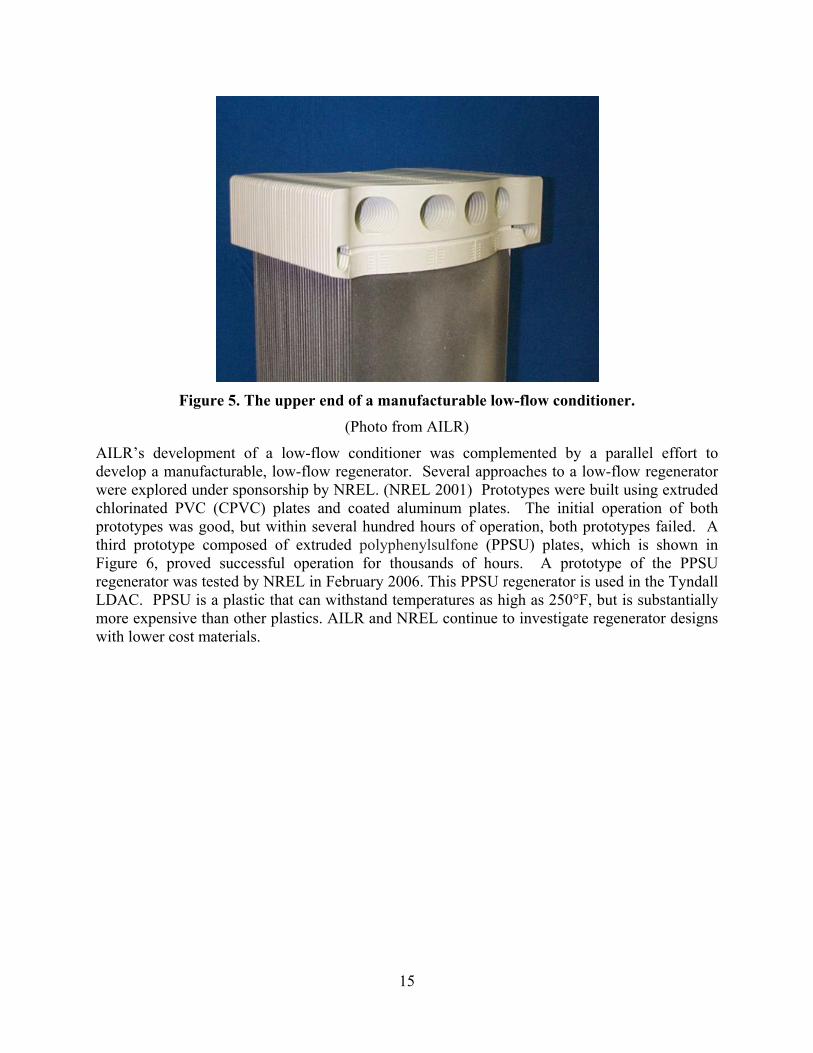
Following the successful testing of the liquid-desiccant conditioner at NREL (shown in Figure 5), AILR began to develop a manufacturable design for a low-flow, liquid-desiccant conditioner with additional support from NREL. (NREL 1998 and 1999) A low-flow, liquid-desiccant conditioner composed of extruded polyvinyl chloride (PVC) plates bonded to injection-molded manifold pieces was developed in this follow-on work. A 40-plate prototype of this conditioner was successfully tested at NREL in June 2004. This manufacturable design for the liquid-desiccant conditioner, shown in Figure 5, is used in the Tyndall solar LDAC.
15
Figure 5. The upper end of a manufacturable low-flow conditioner.
(Photo from AILR)
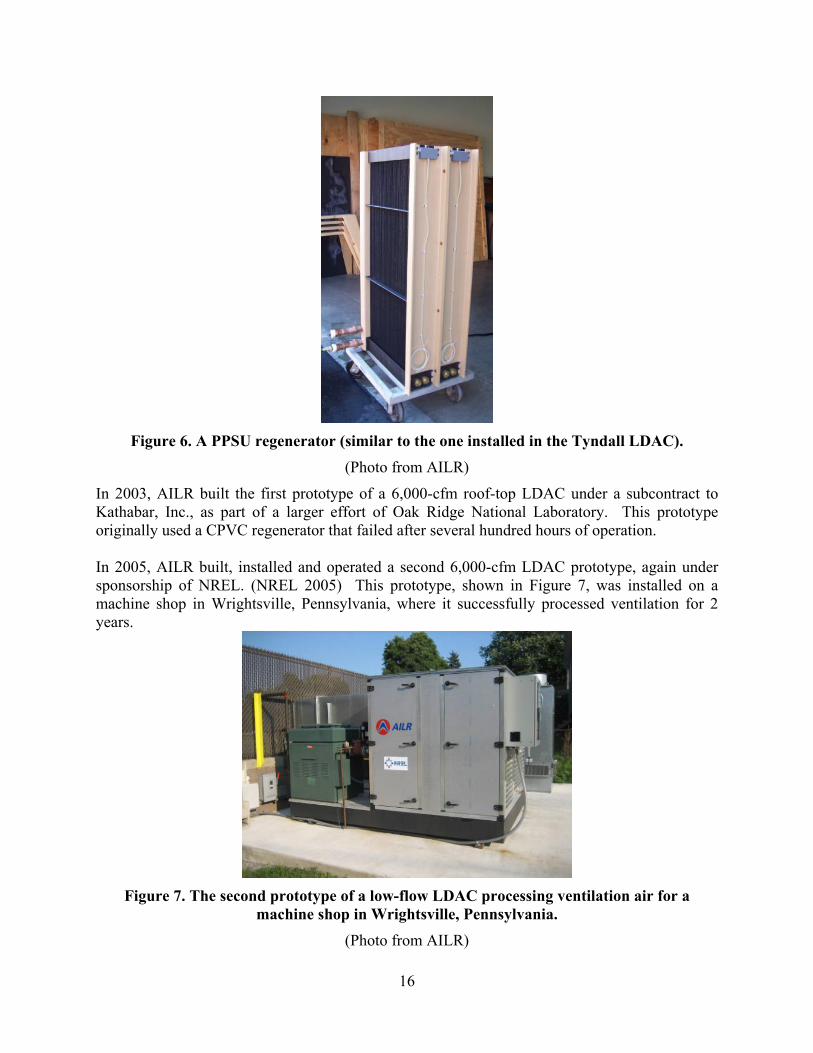
AILR’s development of a low-flow conditioner was complemented by a parallel effort to develop a manufacturable, low-flow regenerator. Several approaches to a low-flow regenerator were explored under sponsorship by NREL. (NREL 2001) Prototypes were built using extruded chlorinated PVC (CPVC) plates and coated aluminum plates. The initial operation of both prototypes was good, but within several hundred hours of operation, both prototypes failed. A third prototype composed of extruded polyphenylsulfone (PPSU) plates, which is shown in Figure 6, proved successful operation for thousands of hours. A prototype of the PPSU regenerator was tested by NREL in February 2006. This PPSU regenerator is used in the Tyndall LDAC. PPSU is a plastic that can withstand temperatures as high as 250°F, but is substantially more expensive than other plastics. AILR and NREL continue to investigate regenerator designs with lower cost materials.
16
Figure 6. A PPSU regenerator (similar to the one installed in the Tyndall LDAC).
(Photo from AILR)
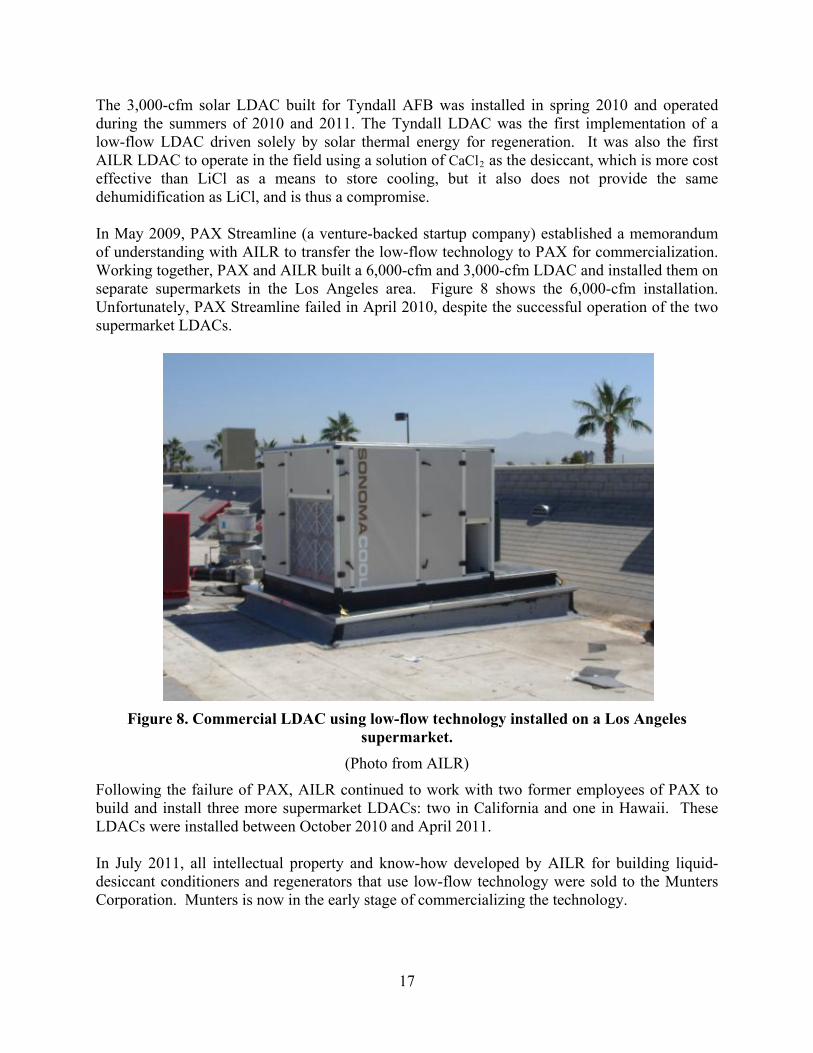
In 2003, AILR built the first prototype of a 6,000-cfm roof-top LDAC under a subcontract to Kathabar, Inc., as part of a larger effort of Oak Ridge National Laboratory. This prototype originally used a CPVC regenerator that failed after several hundred hours of operation. In 2005, AILR built, installed and operated a second 6,000-cfm LDAC prototype, again under sponsorship of NREL. (NREL 2005) This prototype, shown in Figure 7, was installed on a machine shop in Wrightsville, Pennsylvania, where it successfully processed ventilation for 2 years.
Figure 7. The second prototype of a low-flow LDAC processing ventilation air for a
machine shop in Wrightsville, Pennsylvania. (Photo from AILR)
17
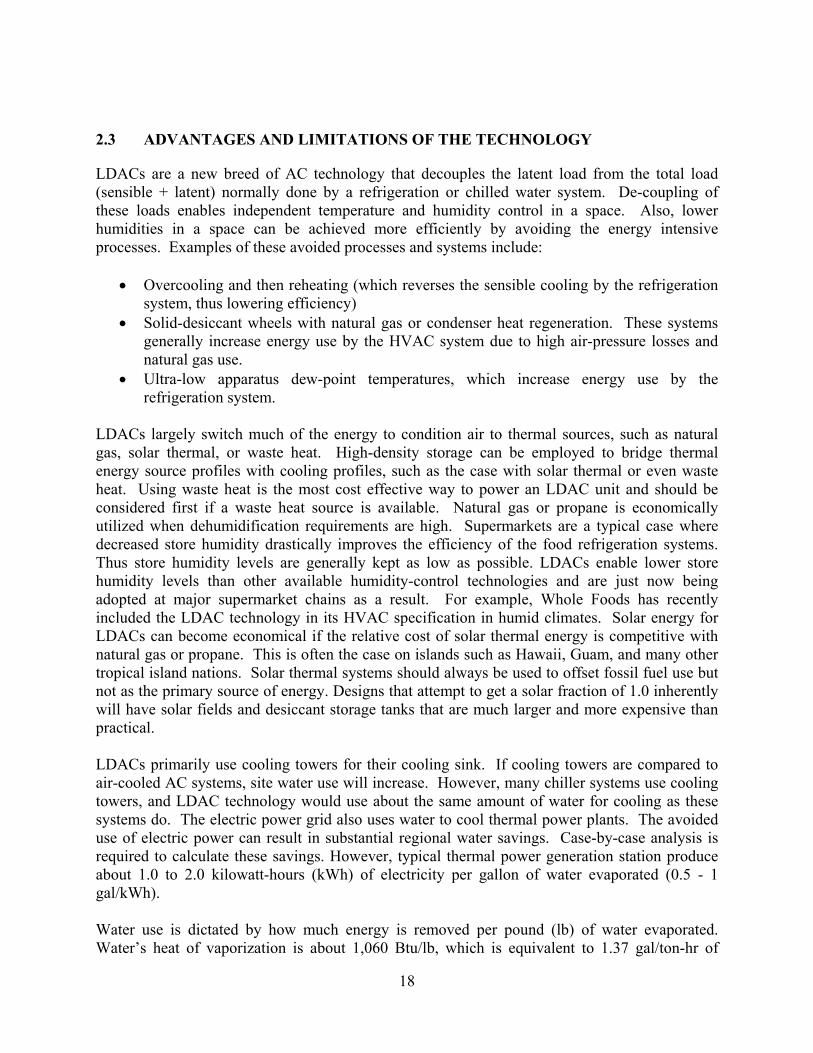
The 3,000-cfm solar LDAC built for Tyndall AFB was installed in spring 2010 and operated during the summers of 2010 and 2011. The Tyndall LDAC was the first implementation of a low-flow LDAC driven solely by solar thermal energy for regeneration. It was also the first AILR LDAC to operate in the field using a solution of CaCl2 as the desiccant, which is more cost effective than LiCl as a means to store cooling, but it also does not provide the same dehumidification as LiCl, and is thus a compromise. In May 2009, PAX Streamline (a venture-backed startup company) established a memorandum of understanding with AILR to transfer the low-flow technology to PAX for commercialization. Working together, PAX and AILR built a 6,000-cfm and 3,000-cfm LDAC and installed them on separate supermarkets in the Los Angeles area. Figure 8 shows the 6,000-cfm installation. Unfortunately, PAX Streamline failed in April 2010, despite the successful operation of the two supermarket LDACs.
Figure 8. Commercial LDAC using low-flow technology installed on a Los Angeles
supermarket. (Photo from AILR)
Following the failure of PAX, AILR continued to work with two former employees of PAX to build and install three more supermarket LDACs: two in California and one in Hawaii. These LDACs were installed between October 2010 and April 2011. In July 2011, all intellectual property and know-how developed by AILR for building liquid-desiccant conditioners and regenerators that use low-flow technology were sold to the Munters Corporation. Munters is now in the early stage of commercializing the technology.
18
2.3 ADVANTAGES AND LIMITATIONS OF THE TECHNOLOGY
LDACs are a new breed of AC technology that decouples the latent load from the total load (sensible + latent) normally done by a refrigeration or chilled water system. De-coupling of these loads enables independent temperature and humidity control in a space. Also, lower humidities in a space can be achieved more efficiently by avoiding the energy intensive processes. Examples of these avoided processes and systems include:
• Overcooling and then reheating (which reverses the sensible cooling by the refrigeration system, thus lowering efficiency)
• Solid-desiccant wheels with natural gas or condenser heat regeneration. These systems generally increase energy use by the HVAC system due to high air-pressure losses and natural gas use.
• Ultra-low apparatus dew-point temperatures, which increase energy use by the refrigeration system.
LDACs largely switch much of the energy to condition air to thermal sources, such as natural gas, solar thermal, or waste heat. High-density storage can be employed to bridge thermal energy source profiles with cooling profiles, such as the case with solar thermal or even waste heat. Using waste heat is the most cost effective way to power an LDAC unit and should be considered first if a waste heat source is available. Natural gas or propane is economically utilized when dehumidification requirements are high. Supermarkets are a typical case where decreased store humidity drastically improves the efficiency of the food refrigeration systems. Thus store humidity levels are generally kept as low as possible. LDACs enable lower store humidity levels than other available humidity-control technologies and are just now being adopted at major supermarket chains as a result. For example, Whole Foods has recently included the LDAC technology in its HVAC specification in humid climates. Solar energy for LDACs can become economical if the relative cost of solar thermal energy is competitive with natural gas or propane. This is often the case on islands such as Hawaii, Guam, and many other tropical island nations. Solar thermal systems should always be used to offset fossil fuel use but not as the primary source of energy. Designs that attempt to get a solar fraction of 1.0 inherently will have solar fields and desiccant storage tanks that are much larger and more expensive than practical. LDACs primarily use cooling towers for their cooling sink. If cooling towers are compared to air-cooled AC systems, site water use will increase. However, many chiller systems use cooling towers, and LDAC technology would use about the same amount of water for cooling as these systems do. The electric power grid also uses water to cool thermal power plants. The avoided use of electric power can result in substantial regional water savings. Case-by-case analysis is required to calculate these savings. However, typical thermal power generation station produce about 1.0 to 2.0 kilowatt-hours (kWh) of electricity per gallon of water evaporated (0.5 - 1 gal/kWh). Water use is dictated by how much energy is removed per pound (lb) of water evaporated. Water’s heat of vaporization is about 1,060 Btu/lb, which is equivalent to 1.37 gal/ton-hr of
19
cooling load. However, because evaporative cooling is an open-cycle process where mineral content of domestic water must be removed, the water use will be higher by the cycles of concentration (CoC) required to prevent mineral buildup in an evaporative system. CoC is defined as the ratio of mineral concentration in the blow-down water divided by the initial concentration. CoC is dependent on water quality, but typically range from 2-7 where a CoC of 2 is typically associated with facilities that have extreme water hardness. A typical water-draw rate for a typical cooling tower will be 1.57 to 2.74 gal/ton-hr. In the case of the LDAC technology, a cooling tower must only remove the cooling load. In the case of a water-cooled DX system, the cooling tower must remove the cooling load plus the compressor load. For a DX cycle with a COP of 4, a cooling tower would thus draw 25% more water or typically 1.96 to 3.42 gal/ton-hr. The preceding analysis does not include the complicated weather effects on a cooling tower, but is approximate for most conditions where the cooling tower’s airstream becomes fully saturated and leaves at the same temperature as the inlet air. However, the comparison with DX cooling remains accurate in relative amounts. LDAC technology will, in general, use about 25% less water than a water-cooled DX system. The net regional water impact by using an LDAC system will typically be small or even positive in some cases. LDACs are now being employed to treat dedicated outdoor airstreams to control humidity in a space. The highest benefit thus will be for humid climates with large yearly humidity loads and applications where reheat energy is high. High-value applications include buildings with large outdoor air loads that have the highest levels of reheat or benefit from decreased humidity in the space such as the following:
• Hospitals (avoiding massive amounts of reheat) • Supermarket humidity control • School buildings in humid regions • Buildings with waste heat available • Indoor pools.
LDACs are an emerging technology and have not seen the level of refinement that economy of scale has bestowed upon vapor-compression technology. The technology is still in a pre-commercial state; the systems are more complex than traditional vapor-compression systems and require custom engineering in most new applications. This is a major hurdle that now faces this technology as research funding will inherently drop and market pull must pick up. Thus LDACs will be first introduced in the highest-value applications, where market pull for the benefits is large enough. In its current state the LDAC technology cannot compete in facilities that do not over-cool/re-heat supply air and are also in locations with lower electricity rates.
20
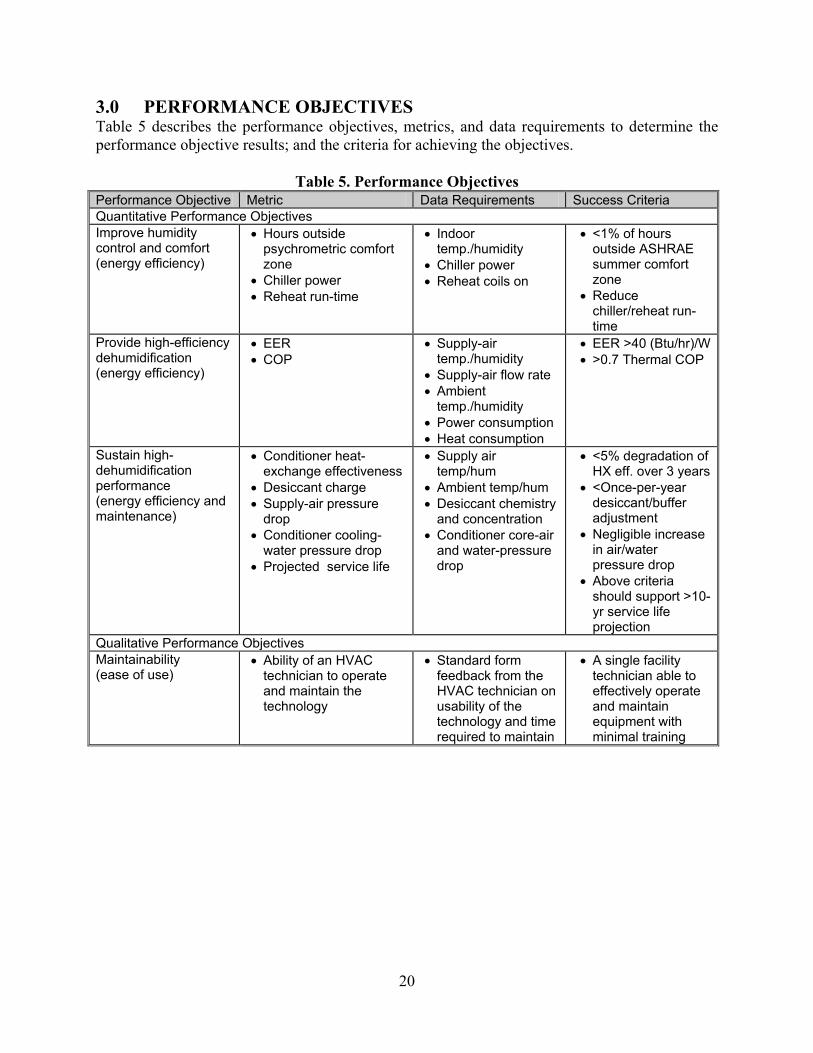
3.0 PERFORMANCE OBJECTIVES Table 5 describes the performance objectives, metrics, and data requirements to determine the performance objective results; and the criteria for achieving the objectives.
Table 5. Performance Objectives Performance Objective Metric Data Requirements Success Criteria Quantitative Performance Objectives Improve humidity control and comfort (energy efficiency)
• Hours outside psychrometric comfort zone
• Chiller power • Reheat run-time
• Indoor temp./humidity
• Chiller power • Reheat coils on
• <1% of hours outside ASHRAE summer comfort zone
• Reduce chiller/reheat run-time
Provide high-efficiency dehumidification (energy efficiency)
• EER • COP
• Supply-air temp./humidity
• Supply-air flow rate • Ambient
temp./humidity • Power consumption • Heat consumption
• EER >40 (Btu/hr)/W • >0.7 Thermal COP
Sustain high-dehumidification performance (energy efficiency and maintenance)
• Conditioner heat-exchange effectiveness
• Desiccant charge • Supply-air pressure
drop • Conditioner cooling-
water pressure drop • Projected service life
• Supply air temp/hum
• Ambient temp/hum • Desiccant chemistry
and concentration • Conditioner core-air
and water-pressure drop
• <5% degradation of HX eff. over 3 years
• <Once-per-year desiccant/buffer adjustment
• Negligible increase in air/water pressure drop
• Above criteria should support >10-yr service life projection
Qualitative Performance Objectives Maintainability (ease of use)
• Ability of an HVAC technician to operate and maintain the technology
• Standard form feedback from the HVAC technician on usability of the technology and time required to maintain
• A single facility technician able to effectively operate and maintain equipment with minimal training
21
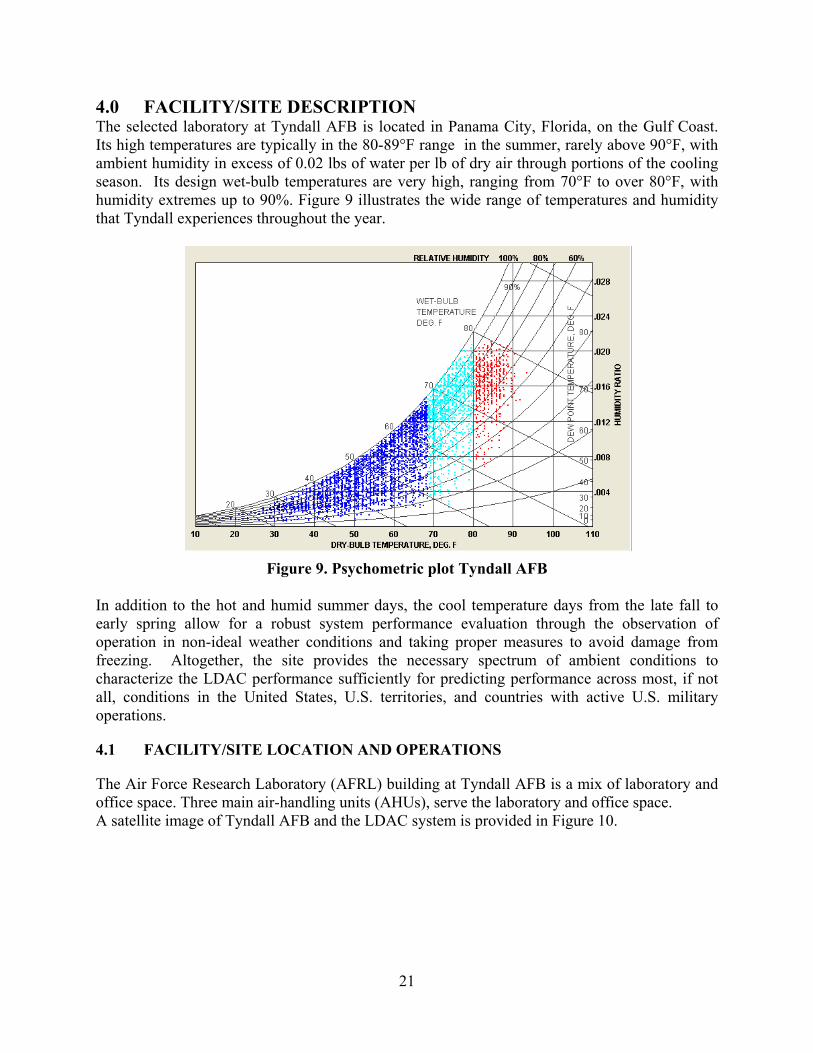
4.0 FACILITY/SITE DESCRIPTION The selected laboratory at Tyndall AFB is located in Panama City, Florida, on the Gulf Coast. Its high temperatures are typically in the 80-89°F range in the summer, rarely above 90°F, with ambient humidity in excess of 0.02 lbs of water per lb of dry air through portions of the cooling season. Its design wet-bulb temperatures are very high, ranging from 70°F to over 80°F, with humidity extremes up to 90%. Figure 9 illustrates the wide range of temperatures and humidity that Tyndall experiences throughout the year.
Figure 9. Psychometric plot Tyndall AFB
In addition to the hot and humid summer days, the cool temperature days from the late fall to early spring allow for a robust system performance evaluation through the observation of operation in non-ideal weather conditions and taking proper measures to avoid damage from freezing. Altogether, the site provides the necessary spectrum of ambient conditions to characterize the LDAC performance sufficiently for predicting performance across most, if not all, conditions in the United States, U.S. territories, and countries with active U.S. military operations.
4.1 FACILITY/SITE LOCATION AND OPERATIONS
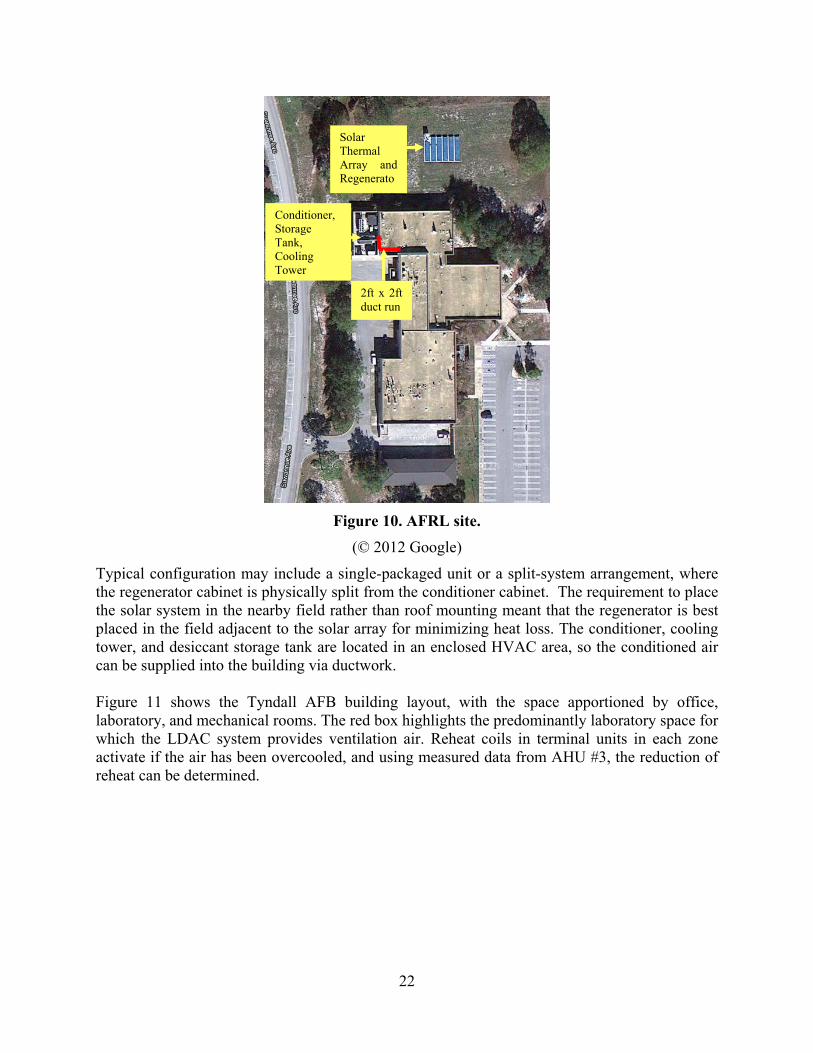
The Air Force Research Laboratory (AFRL) building at Tyndall AFB is a mix of laboratory and office space. Three main air-handling units (AHUs), serve the laboratory and office space. A satellite image of Tyndall AFB and the LDAC system is provided in Figure 10.
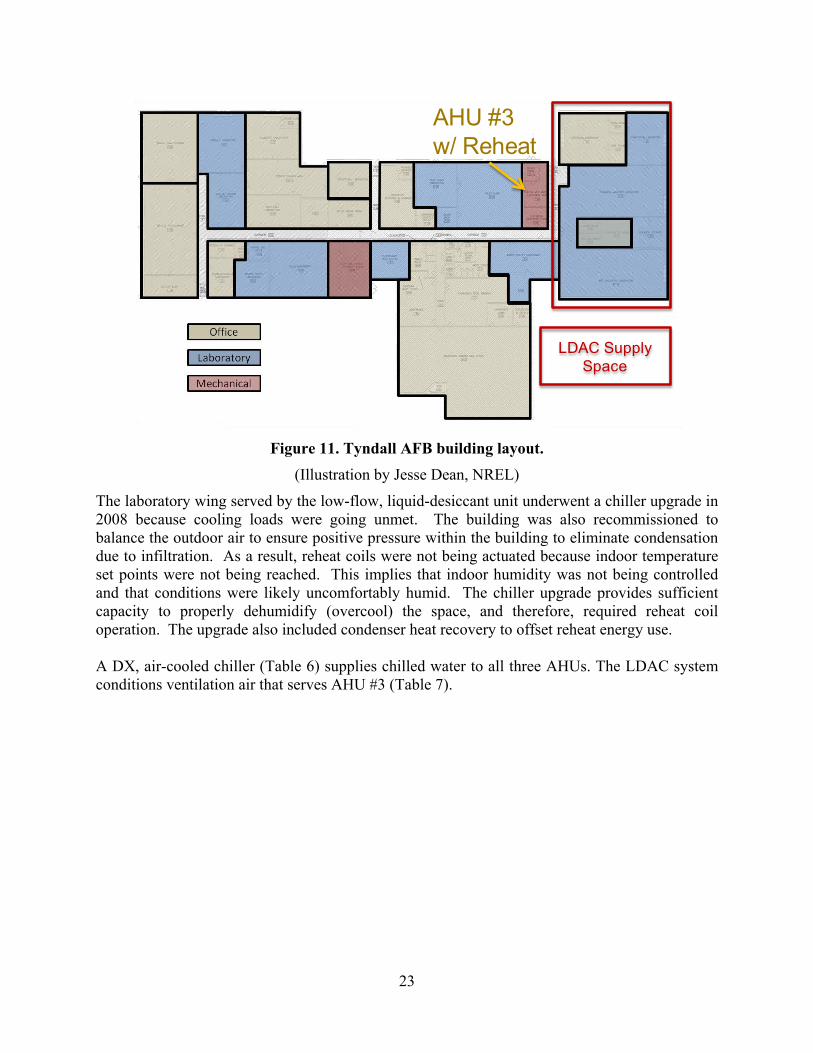
Typical configuration may include a single-packaged unit or a split-system arrangement, where the regenerator cabinet is physically split from the conditioner cabinet. The requirement to place the solar system in the nearby field rather than roof mounting meant that the regenerator is best placed in the field adjacent to the solar array for minimizing heat loss. The conditioner, cooling tower, and desiccant storage tank are located in an enclosed HVAC area, so the conditioned air can be supplied into the building via ductwork. Figure 11 shows the Tyndall AFB building layout, with the space apportioned by office, laboratory, and mechanical rooms. The red box highlights the predominantly laboratory space for which the LDAC system provides ventilation air. Reheat coils in terminal units in each zone activate if the air has been overcooled, and using measured data from AHU #3, the reduction of reheat can be determined.
Solar Thermal Array and Regenerato
Conditioner, Storage Tank, Cooling Tower
2ft x 2ft duct run
23
Figure 11. Tyndall AFB building layout.
(Illustration by Jesse Dean, NREL)
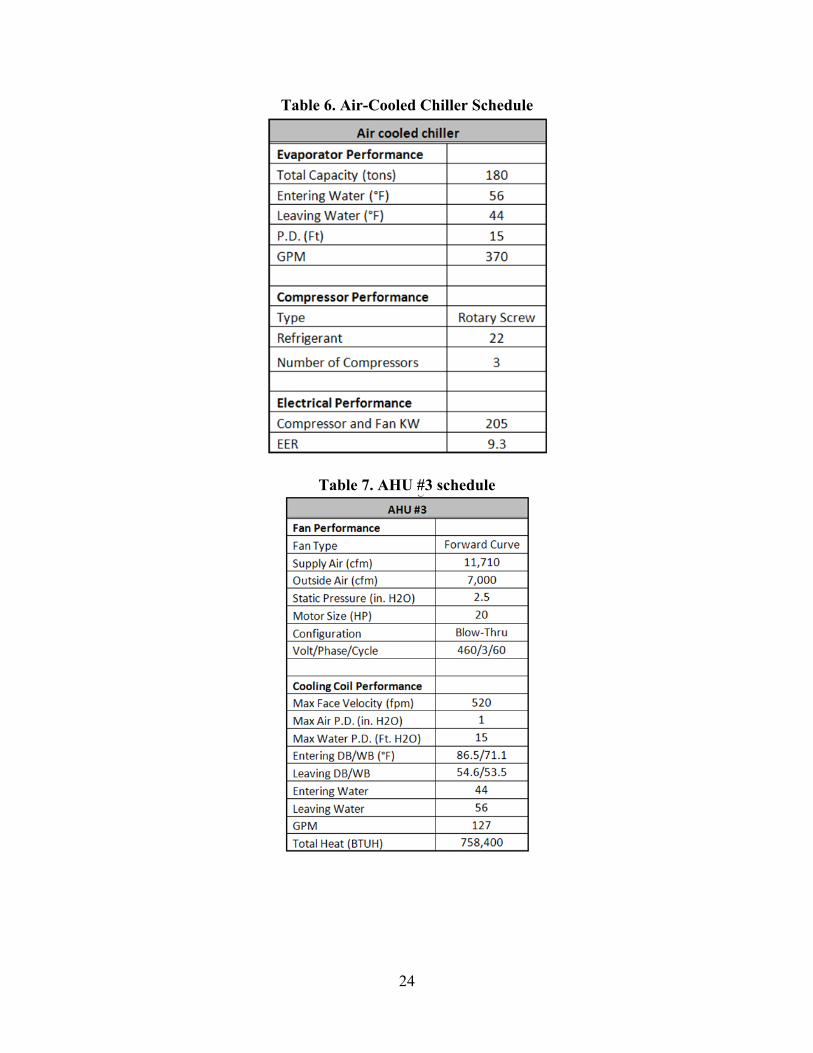
The laboratory wing served by the low-flow, liquid-desiccant unit underwent a chiller upgrade in 2008 because cooling loads were going unmet. The building was also recommissioned to balance the outdoor air to ensure positive pressure within the building to eliminate condensation due to infiltration. As a result, reheat coils were not being actuated because indoor temperature set points were not being reached. This implies that indoor humidity was not being controlled and that conditions were likely uncomfortably humid. The chiller upgrade provides sufficient capacity to properly dehumidify (overcool) the space, and therefore, required reheat coil operation. The upgrade also included condenser heat recovery to offset reheat energy use. A DX, air-cooled chiller (Table 6) supplies chilled water to all three AHUs. The LDAC system conditions ventilation air that serves AHU #3 (Table 7).
AHU #3 w/ Reheat
LDAC Supply Space
24
Table 6. Air-Cooled Chiller Schedule
Table 7. AHU #3 schedule
25
5.0 TEST DESIGN
5.1 CONCEPTUAL TEST DESIGN
NREL installed instrumentation and a data acquisition system for one SOA3000 dehumidifier, powered by a 1,300-ft2, evacuated-tube solar thermal array. The solar array and regenerator components are oversized relative to the conditioner’s average dehumidification output in order to generate and store excess desiccant during the day. An 800-gal uninsulated storage tank fully utilizes the solar arrays excess heat output and allows for a few hours of average cooling operation without solar input. The unit is designed to operate continuously at maximum airflow in order to serve fume-hood makeup air needs. The LDAC technology was characterized in NREL’s Advanced HVAC Systems Laboratory in 2004 and 2006. The laboratory test results are invaluable in interpreting the field results, particularly with regard to critical airflow rates, which are notoriously difficult measurements to make in the field. The unit was monitored for two cooling seasons, and its annual and peak energy use was compared to conventional AC.
5.2 BASELINE CHARACTERIZATION
The installation had the potential to generate compelling side-by-side test results in that the recent chiller upgrade should allow operation with or without desiccant unit operation. Circumstances that complicate comparison include the facts that: 1) the chiller serves the entire building; and 2) the disparity in capacities between the chiller and the desiccant system is approximately 10:1. Chiller power and calls for reheat were measured in one wing of the facility. Because mechanical AC is a well-understood technology, baselines for individual sites were not critical to project energy savings relative to conventional equipment at various efficiency levels. Once the efficiency of the desiccant system was established, comparisons of energy use relative to mechanical AC were straightforward over the full range of building applications and climates.
5.3 DESIGN AND LAYOUT OF TECHNOLOGY COMPONENTS
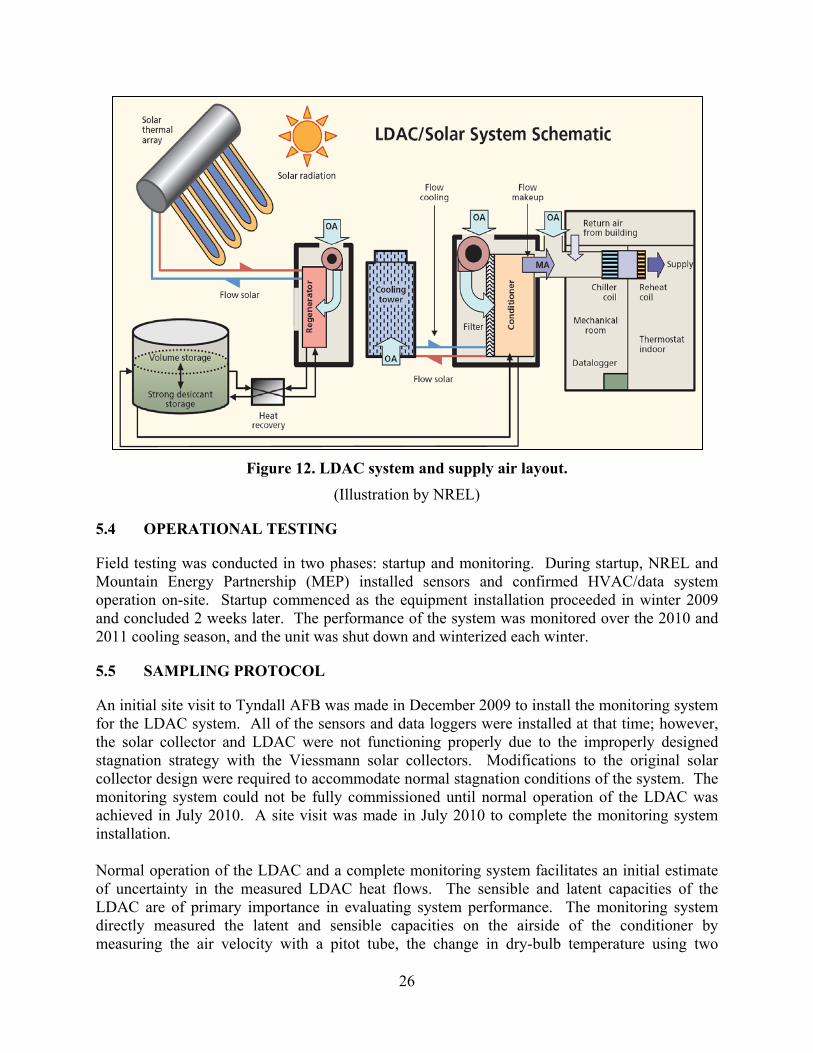
Figure 12 illustrates the design and layout of the LDAC system. Demonstration equipment was placed in two locations at the test site. The solar array and regenerator components were collocated in the open field to the north of the building. The desiccant storage, conditioner component, and cooling tower were placed within the walled HVAC equipment area on the west end of the subject wing with the chiller. Piping connecting the storage tank and conditioner supply strong desiccant for the dehumidification process, and a 100-ft-long duct run was installed across the roof to connect the conditioner to the fresh air intake of the building.
26
Figure 12. LDAC system and supply air layout.
(Illustration by NREL)
5.4 OPERATIONAL TESTING
Field testing was conducted in two phases: startup and monitoring. During startup, NREL and Mountain Energy Partnership (MEP) installed sensors and confirmed HVAC/data system operation on-site. Startup commenced as the equipment installation proceeded in winter 2009 and concluded 2 weeks later. The performance of the system was monitored over the 2010 and 2011 cooling season, and the unit was shut down and winterized each winter.
5.5 SAMPLING PROTOCOL
An initial site visit to Tyndall AFB was made in December 2009 to install the monitoring system for the LDAC system. All of the sensors and data loggers were installed at that time; however, the solar collector and LDAC were not functioning properly due to the improperly designed stagnation strategy with the Viessmann solar collectors. Modifications to the original solar collector design were required to accommodate normal stagnation conditions of the system. The monitoring system could not be fully commissioned until normal operation of the LDAC was achieved in July 2010. A site visit was made in July 2010 to complete the monitoring system installation. Normal operation of the LDAC and a complete monitoring system facilitates an initial estimate of uncertainty in the measured LDAC heat flows. The sensible and latent capacities of the LDAC are of primary importance in evaluating system performance. The monitoring system directly measured the latent and sensible capacities on the airside of the conditioner by measuring the air velocity with a pitot tube, the change in dry-bulb temperature using two
27
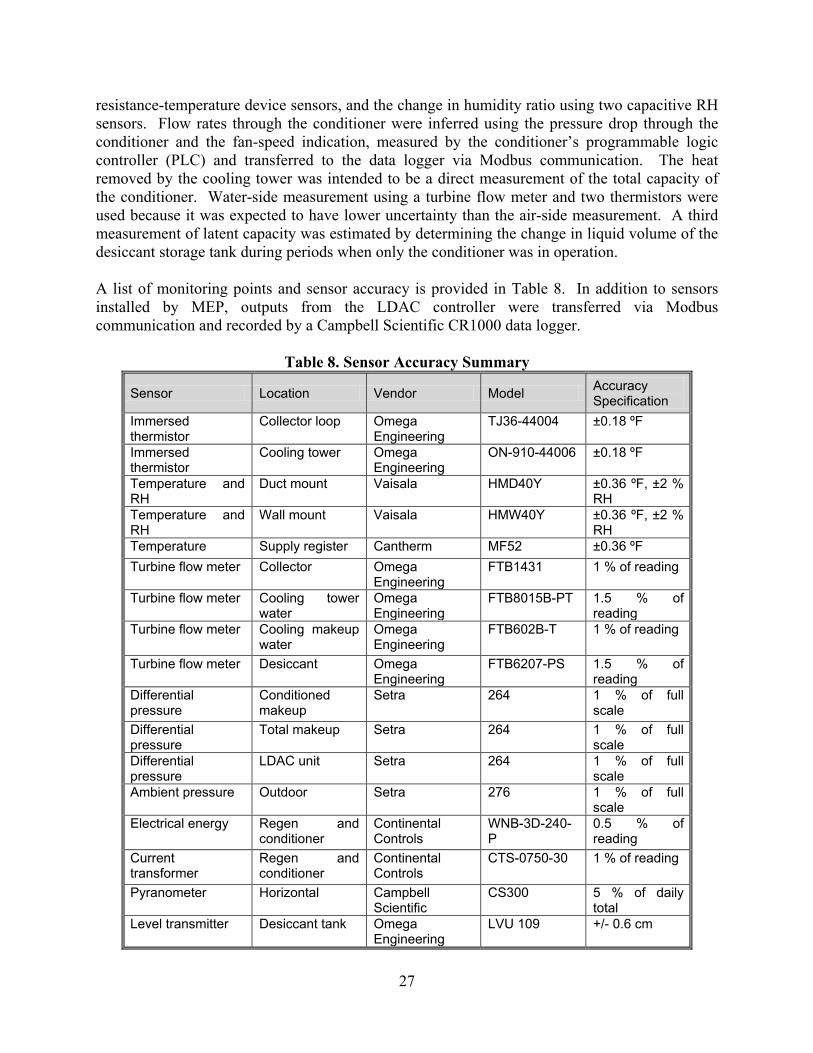
resistance-temperature device sensors, and the change in humidity ratio using two capacitive RH sensors. Flow rates through the conditioner were inferred using the pressure drop through the conditioner and the fan-speed indication, measured by the conditioner’s programmable logic controller (PLC) and transferred to the data logger via Modbus communication. The heat removed by the cooling tower was intended to be a direct measurement of the total capacity of the conditioner. Water-side measurement using a turbine flow meter and two thermistors were used because it was expected to have lower uncertainty than the air-side measurement. A third measurement of latent capacity was estimated by determining the change in liquid volume of the desiccant storage tank during periods when only the conditioner was in operation. A list of monitoring points and sensor accuracy is provided in Table 8. In addition to sensors installed by MEP, outputs from the LDAC controller were transferred via Modbus communication and recorded by a Campbell Scientific CR1000 data logger.
Table 8. Sensor Accuracy Summary
Sensor Location Vendor Model Accuracy Specification
Immersed thermistor
Collector loop Omega Engineering
TJ36-44004 ±0.18 ºF
Immersed thermistor
Cooling tower Omega Engineering
ON-910-44006 ±0.18 ºF
Temperature and RH
Duct mount Vaisala HMD40Y ±0.36 ºF, ±2 % RH
Temperature and RH
Wall mount Vaisala HMW40Y ±0.36 ºF, ±2 % RH
Temperature Supply register Cantherm MF52 ±0.36 ºF Turbine flow meter Collector Omega
Engineering FTB1431 1 % of reading
Turbine flow meter Cooling tower water
Omega Engineering
FTB8015B-PT 1.5 % of reading
Turbine flow meter Cooling makeup water
Omega Engineering
FTB602B-T 1 % of reading
Turbine flow meter Desiccant Omega Engineering
FTB6207-PS 1.5 % of reading
Differential pressure
Conditioned makeup
Setra 264 1 % of full scale
Differential pressure
Total makeup Setra 264 1 % of full scale
Differential pressure
LDAC unit Setra 264 1 % of full scale
Ambient pressure Outdoor Setra 276 1 % of full scale
Electrical energy Regen and conditioner
Continental Controls
WNB-3D-240-P
0.5 % of reading
Current transformer
Regen and conditioner
Continental Controls
CTS-0750-30 1 % of reading
Pyranometer Horizontal Campbell Scientific
CS300 5 % of daily total
Level transmitter Desiccant tank Omega Engineering
LVU 109 +/- 0.6 cm
28
6.0 PERFORMANCE ASSESSMENT Performance evaluation of the LDAC began in the summer of 2010. Three weeks of continuous operation was recorded during the 2010 cooling season, and around 5 months of operation were recorded for 2011. Because the majority of the LDAC system operation occurred during the summer months of 2011, the performance assessment is based on summer 2011 data. The 2010 performance data are presented to illustrate performance variability. Representative performance assessment metrics for each objective are summarized in Table 9. Table 9 describes the performance objectives, metrics, and data requirements to determine the performance objective results, and the criteria for achieving the objectives.
Improve humidity control and comfort (energy efficiency)
• Hours outside psychrometric comfort zone
• Chiller power • Reheat run-
time
• Indoor
temp./humidity • Chiller power • Reheat coils on
• <1% of hours outside ASHRAE summer comfort zone
• Reduce chiller/reheat runtime
• Achieved but inconclusive cause
• Achieved but inconclusive cause
Provide high-efficiency dehumidification (energy efficiency)
• EER • COP
• Supply-air temp./humidity
• Supply-air flow rate • Ambient
temp./humidity • Power consumption • Heat consumption
• EER >40
(Btu/hr)/W • >0.7 Thermal
COP
• Not achieved • Achieved
Sustain high-dehumidification performance (energy efficiency and maintenance)
• Conditioner
heat exchange effectiveness
• Desiccant charge
• Supply air pressure drop
• Conditioner cooling water pressure drop
• Projected service life
• Supply-air
temp./humidity • Ambient
temp./humidity • Desiccant
chemistry and concentration
• Conditioner core-air and water-pressure drop
• <5% degradation of HX eff. over 3 years
• <Once-per-year desiccant/buffer adjustment
• Negligible increase in air/water pressure drop
• Above criteria should support >10yr service life projection
• Achieved; no degradation of desiccant during operation
• Duration of performance evaluation too small to determine
29
Qualitative Performance Objectives Maintainability (ease of use)
Ability of an HVAC technician to operate and maintain the technology
Standard form feedback from the HVAC technician on usability of the technology and time required to maintain
A single facility technician able to effectively operate and maintain equipment with minimal training
• Many unforeseen maintenance issues occurred during initial demonstration
• Many lessons learned for design and ease of operation
30
7.0 MARKET ANALYSIS
7.1 COST MODEL
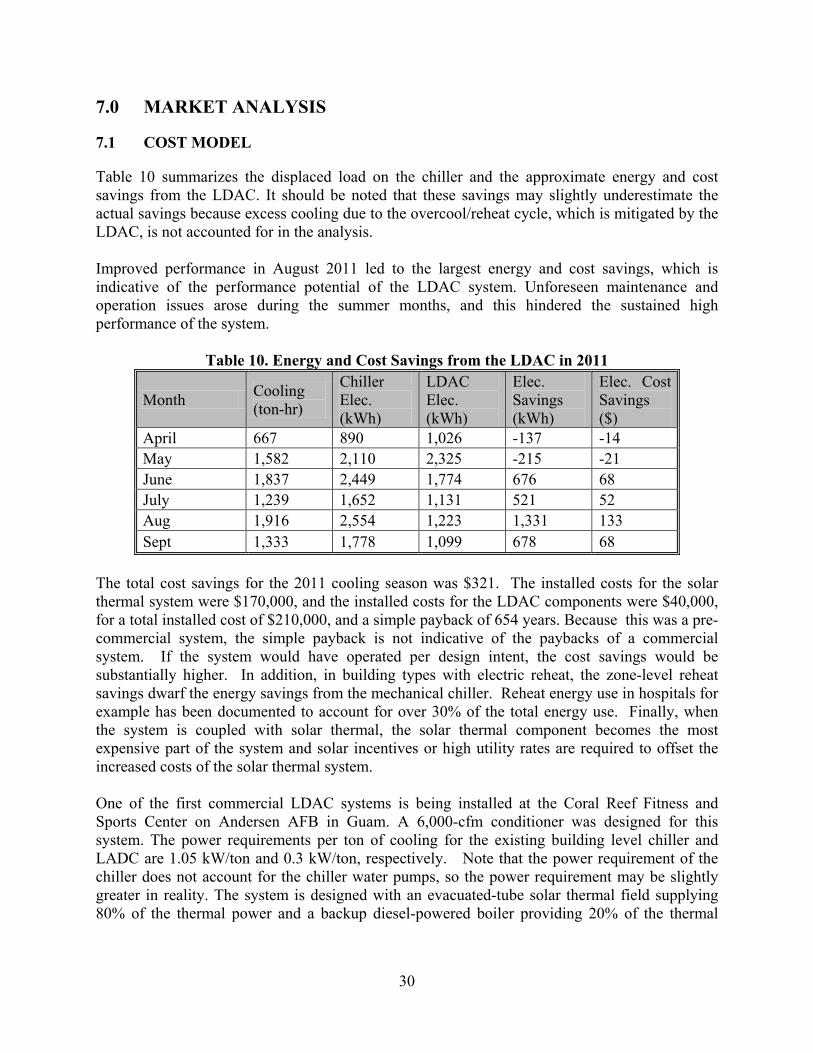
Table 10 summarizes the displaced load on the chiller and the approximate energy and cost savings from the LDAC. It should be noted that these savings may slightly underestimate the actual savings because excess cooling due to the overcool/reheat cycle, which is mitigated by the LDAC, is not accounted for in the analysis. Improved performance in August 2011 led to the largest energy and cost savings, which is indicative of the performance potential of the LDAC system. Unforeseen maintenance and operation issues arose during the summer months, and this hindered the sustained high performance of the system.
Table 10. Energy and Cost Savings from the LDAC in 2011
Month Cooling (ton-hr)
Chiller Elec. (kWh)
LDAC Elec. (kWh)
Elec. Savings (kWh)
Elec. Cost Savings ($)
April 667 890 1,026 -137 -14 May 1,582 2,110 2,325 -215 -21 June 1,837 2,449 1,774 676 68 July 1,239 1,652 1,131 521 52 Aug 1,916 2,554 1,223 1,331 133 Sept 1,333 1,778 1,099 678 68
The total cost savings for the 2011 cooling season was $321. The installed costs for the solar thermal system were $170,000, and the installed costs for the LDAC components were $40,000, for a total installed cost of $210,000, and a simple payback of 654 years. Because this was a pre-commercial system, the simple payback is not indicative of the paybacks of a commercial system. If the system would have operated per design intent, the cost savings would be substantially higher. In addition, in building types with electric reheat, the zone-level reheat savings dwarf the energy savings from the mechanical chiller. Reheat energy use in hospitals for example has been documented to account for over 30% of the total energy use. Finally, when the system is coupled with solar thermal, the solar thermal component becomes the most expensive part of the system and solar incentives or high utility rates are required to offset the increased costs of the solar thermal system. One of the first commercial LDAC systems is being installed at the Coral Reef Fitness and Sports Center on Andersen AFB in Guam. A 6,000-cfm conditioner was designed for this system. The power requirements per ton of cooling for the existing building level chiller and LADC are 1.05 kW/ton and 0.3 kW/ton, respectively. Note that the power requirement of the chiller does not account for the chiller water pumps, so the power requirement may be slightly greater in reality. The system is designed with an evacuated-tube solar thermal field supplying 80% of the thermal power and a backup diesel-powered boiler providing 20% of the thermal
31
power. The system is expected to reduce HVAC energy use by 34% and save $145,395 per year with an estimated simple payback of 11.6 years.
7.2 RELEVANT MARKETS
The LDAC system typically used for outdoor air dehumidification, and an electric chiller is typically required to sensibly cool the air to the desired temperature. The energy consumption from the LDAC includes heat for regeneration and electricity for the pumps and fans in the system. The LDAC is most suitable where:
• The existing HVAC system is not able to meet latent loads on a facility • Humidity control is required • Overcool/ reheat strategies are used in traditional HVAC systems • Large quantities of ventilation air are needed
The LDAC should be applied to hot/humid climates that require year-round cooling and de-humidification. Future installations should focus on facilities in ASHRAE climate zones 1A and 2A.
32
8.0 IMPLEMENTATION ISSUES The project’s focus was necessarily changed to focus on discovery of technical issues with this new emerging technology. Many of the issues arose because the installation had many unique features including the following:
• The demonstration was the first combination of solar heat with this type of LDAC system.
o Due to initial budgetary constraints, the LDAC relied solely on solar heat with no natural gas backup to ensure that the unit operated throughout the cooling season. A properly designed system that uses solar heat will have backup. Due to this, the system did not achieve peak-cooling capacity for significant hours of operation. Because the system largely has static power draw, this resulted in a low average EER.
o The solar field designer and LDAC system design were not tightly coordinated by
the prime installation contractor (Regenesys). This resulted in a design that did not consider the frequency and duration of stagnation periods for the solar field. The collector design was not designed to withstand more than about two stagnations per year. Furthermore, the collector system was not initially designed to withstand the massive volume of steam from these collectors when stagnation occurred. The solar field required significant redesign. The end result was workable for the demonstration despite being problematic and suboptimal in operation.
• The demonstration was the first to create a split system where the conditioner and
regenerator were contained in separate packages and separated by around a 100-ft distance. This technical challenge resulted in a suboptimal pumping design configuration because of the necessary pump size to transfer desiccant this distance. Future designs should reduce the distance from the regenerator and conditioner.
• This demonstration was the first to have 10 hours of desiccant storage using CaCl2. Tuning the storage to achieve optimal efficiency was required. The desiccant charge and the tank’s low and high levels have significant impact on efficiency, capacity, and solar utilization. These variables were tuned as the demonstration progressed.
• This demonstration required the placement of the conditioner unit about 100 feet from the outdoor intake to the building. This required significant fan power to move the air from the mechanical yard to the building. Future designs and applications should consider the duct length reduce the duct run from the conditioner to the outdoor air intake as much as possible.
• The demonstration did not treat 100% of the outdoor air, thus limiting the benefit to energy savings from offset cooling. In order to offset the reheat for such an installation, a system should be designed to ensure that the LDAC meets a significant portion of the latent load. Typically, the LDAC can meet 100% of a building’s latent load if designed to treat 100% of the outdoor air.
33
9.0 REFERENCES AILR. (undated). “The Effect of Material Properties on the Performance of Liquid Desiccant Air Conditioners and Dehumidifiers.” Gas Research Institute Contract No. 5090-243-2030. AILR. (October 2008). “Liquid Desiccants for Solar Cooling.” SOA3000 Product Brochure. Princeton, NJ: AILR. Balaras, C.A., et al. (June 2006). “Solar Cooling: An Overview of European Applications & Design Guidelines.” ASHRAE Journal; pp. 14-21. Baxter, V.; Fischer, S.; Sand, J. R. (1998). Global Warming Implications of Replacing Ozone-Depleting Refrigerants. Atlanta, GA: ASHRAE. Daou, K.; Wang, R.Z.; Xia, Z.Z. (2006) “Desiccant Cooling Air Conditioning: A Review.” Renewable and Sustainable Energy Reviews (10); pp. 55-77. DOE. (2011). Buildings Energy Data Book. Accessed Oct. 1, 2012: http://buildingsdatabook.eren.doe.gov/. Chen, X.Y.; Jiang, Y.; Li, Z.; Qu, K.Y. (2005) “Field Study on Independent Dehumidification Air-Conditioning System – II: Performance of the Whole System.” ASHRAE Annual Meeting Proceedings. Conde-Petit, M. (2007). “Liquid Desiccant-Based Air-Conditioning Systems – LDACS.” 1st European Conference on Polygeneration, October 16-17, 2007, Tarragona, Spain. Ice Energy. (2012). “Ice Bear Energy Storage: Product Specification Sheet.” Accessed Oct. 3, 2012: http://www.ice-energy.com/stuff/contentmgr/files/1/b5fef8f4e945bef09e48aca6714b5c51/download/ice_bear_product_sheet.pdf. IEA-SHC-Task 25. (July 2012). “Solar Assisted Air Conditioning of Buildings.” International Energy Agency. Accessed Oct. 1, 2012: http://iea-shc-task25.org/?p=8. Lowenstein, A. (November 2008). “Review of Liquid Desiccant Technology for HVAC Applications.” ASHRAE HVAC&R Research (14:6). Lowenstein, A., U.S. Patent No. 5,351,496 (October 1994). Lowenstein, A.; Gabruk, R. (1992). "The Effect of Absorber Design on the Performance of a Liquid-Desiccant Air Conditioner." ASHRAE Trans. AN-92-3-3. pt.1.
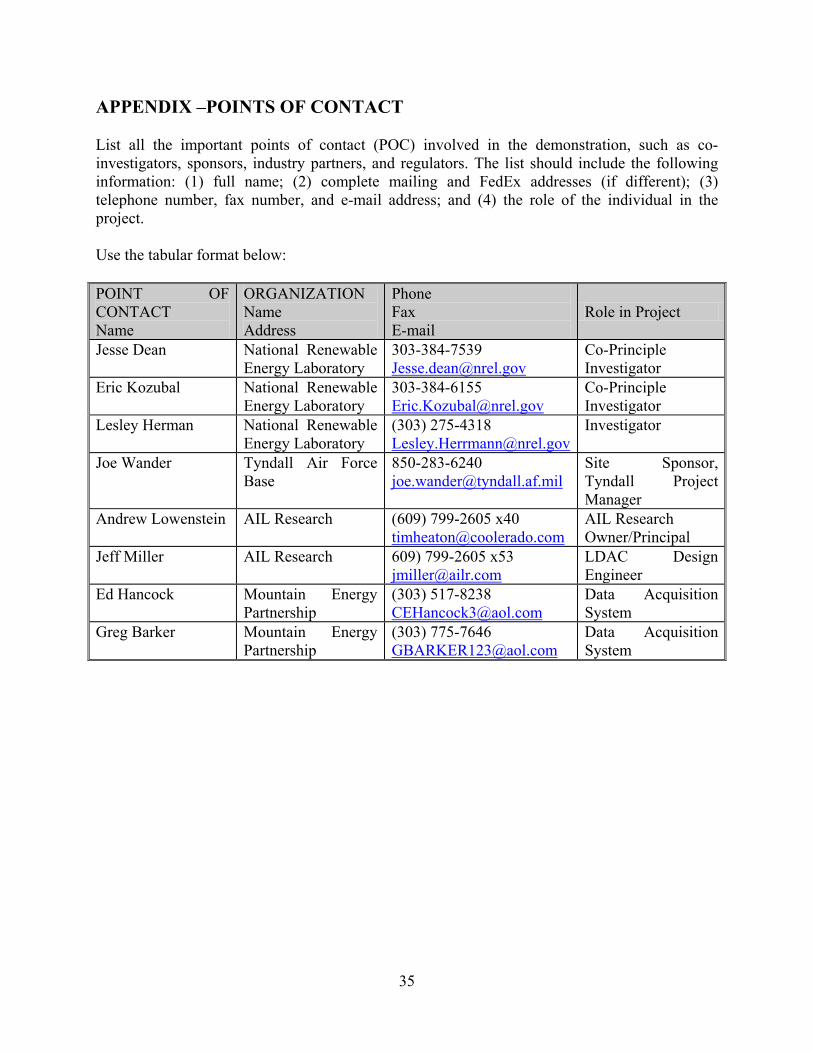
APPENDIX –POINTS OF CONTACT List all the important points of contact (POC) involved in the demonstration, such as co-investigators, sponsors, industry partners, and regulators. The list should include the following information: (1) full name; (2) complete mailing and FedEx addresses (if different); (3) telephone number, fax number, and e-mail address; and (4) the role of the individual in the project. Use the tabular format below: POINT OF CONTACT Name