15
© OECD/IEA 2013 Solar PV Vision by 2050 Uwe Remme Energy Technology Policy Division, IEA
© OECD/IEA 2013
Solar PV Vision by 2050
Uwe Remme
Energy Technology Policy Division, IEA

© OECD/IEA 2013
Various IEA scenarios for PV
Time GW TWh Scenario Source
2018 308 (370-390)
368
Medium Term RE Market Report 2013
2020 210 298 IEA Technology Roadmap (2010)
2035 690 951 NPS
World Energy Outlook 2013
990 1 389 450
2050
3 155 4 572 IEA Technology Roadmap (2010)
2 017 2 655 2DS
Energy Technology Perspectives 2012
3 289 4 822 hiRen
>2060 12 000 18 000 « Testing limits » Solar Energy Perspectives (2011)
© OECD/IEA 2013
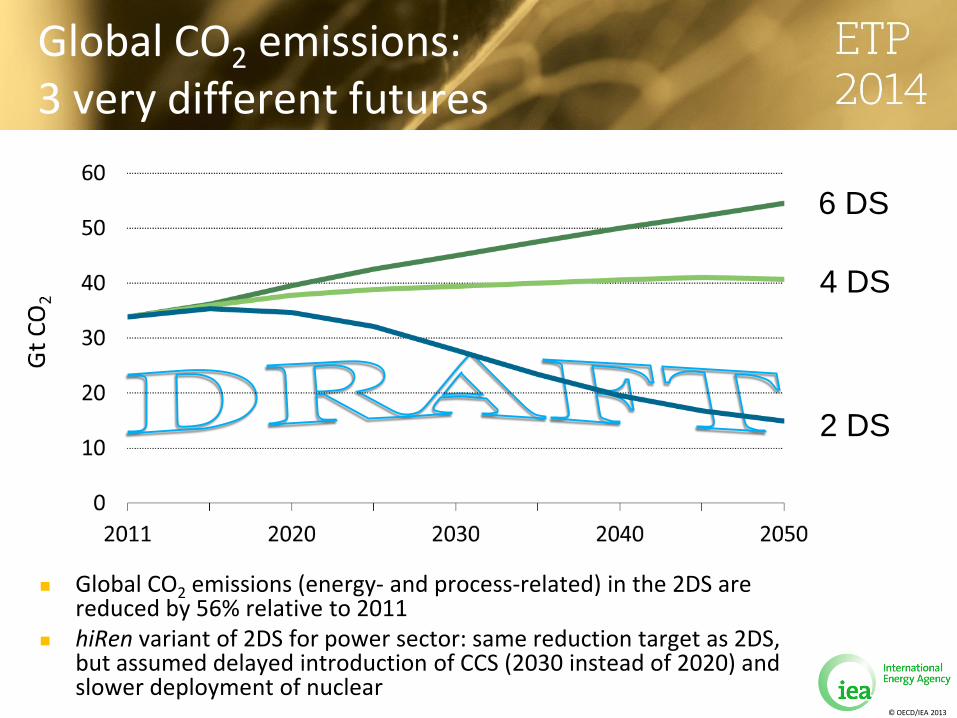
Global CO2 emissions: 3 very different futures
Global CO2 emissions (energy- and process-related) in the 2DS are reduced by 56% relative to 2011
hiRen variant of 2DS for power sector: same reduction target as 2DS, but assumed delayed introduction of CCS (2030 instead of 2020) and slower deployment of nuclear
6 DS
4 DS
2 DS
© OECD/IEA 2013
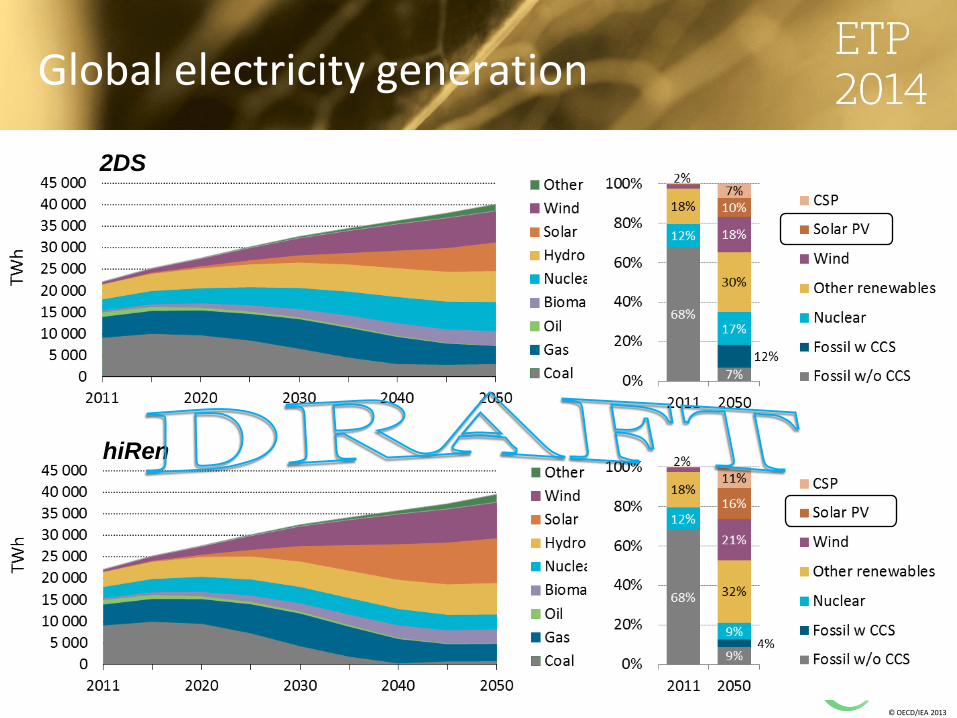
Global electricity generation
2DS
hiRen
© OECD/IEA 2013
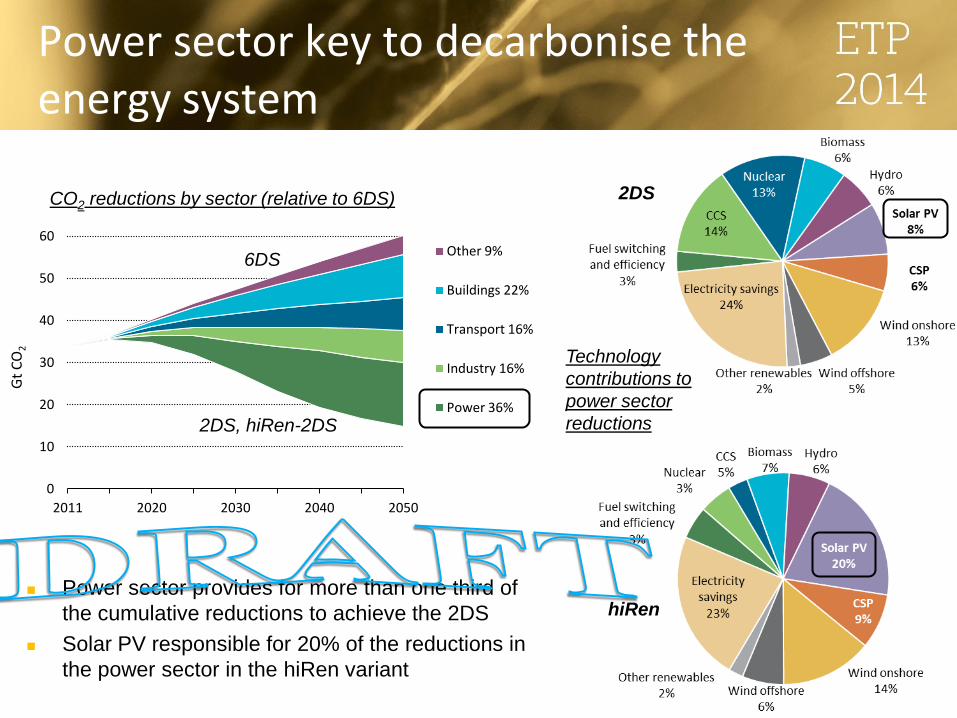
Power sector key to decarbonise the energy system
2DS
hiRen
Technology
contributions to
power sector
reductions
0
10
20
30
40
50
60
2011 2020 2030 2040 2050
Gt
CO
2
Other 9%
Buildings 22%
Transport 16%
Industry 16%
Power 36%
2DS, hiRen-2DS
6DS
CO2 reductions by sector (relative to 6DS)
Power sector provides for more than one third of
the cumulative reductions to achieve the 2DS
Solar PV responsible for 20% of the reductions in
the power sector in the hiRen variant
© OECD/IEA 2013
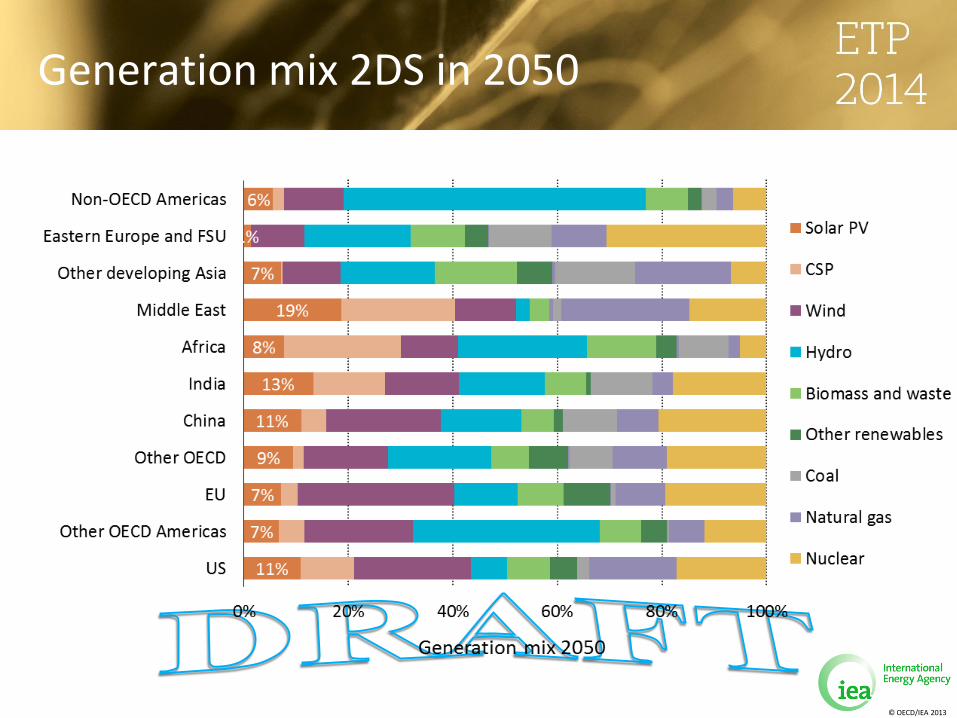
Generation mix 2DS in 2050
© OECD/IEA 2013
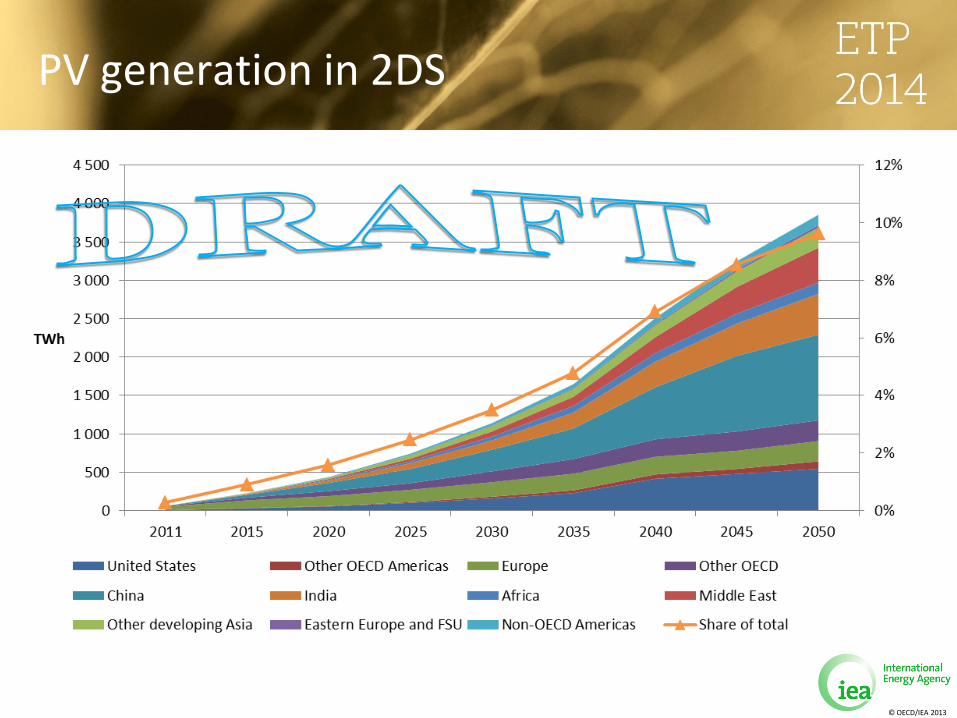
PV generation in 2DS
© OECD/IEA 2013
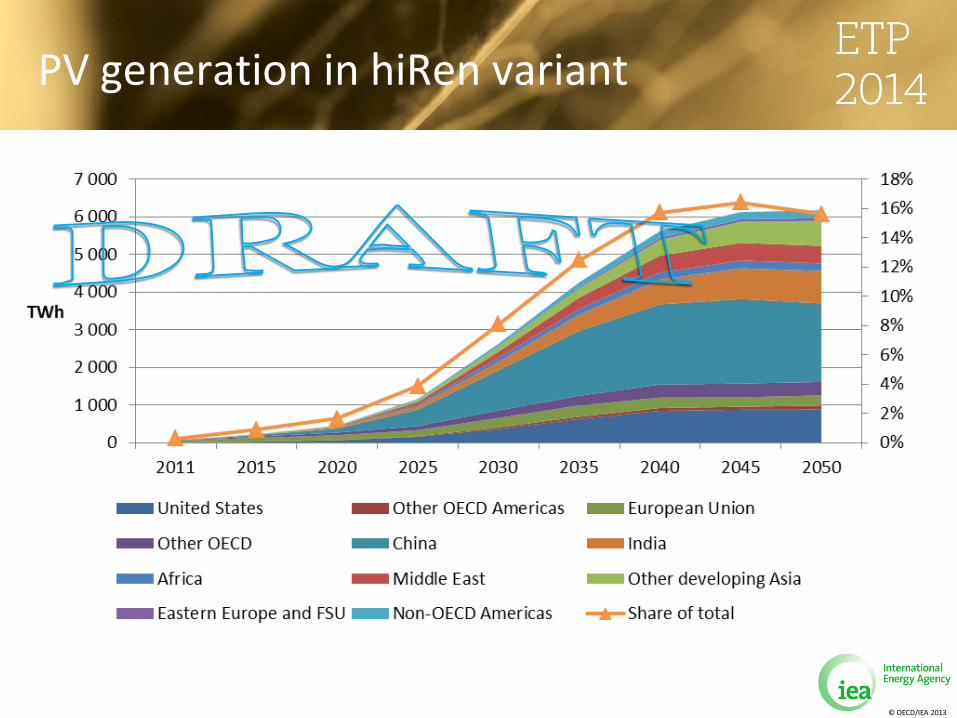
PV generation in hiRen variant
© OECD/IEA 2013
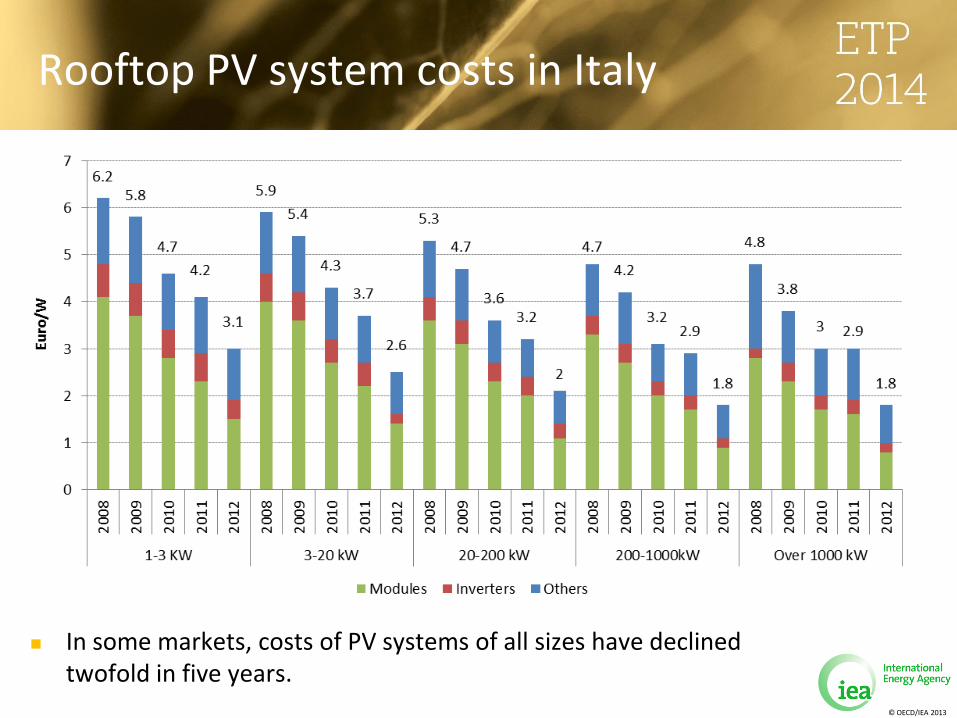
Rooftop PV system costs in Italy
In some markets, costs of PV systems of all sizes have declined twofold in five years.
© OECD/IEA 2013
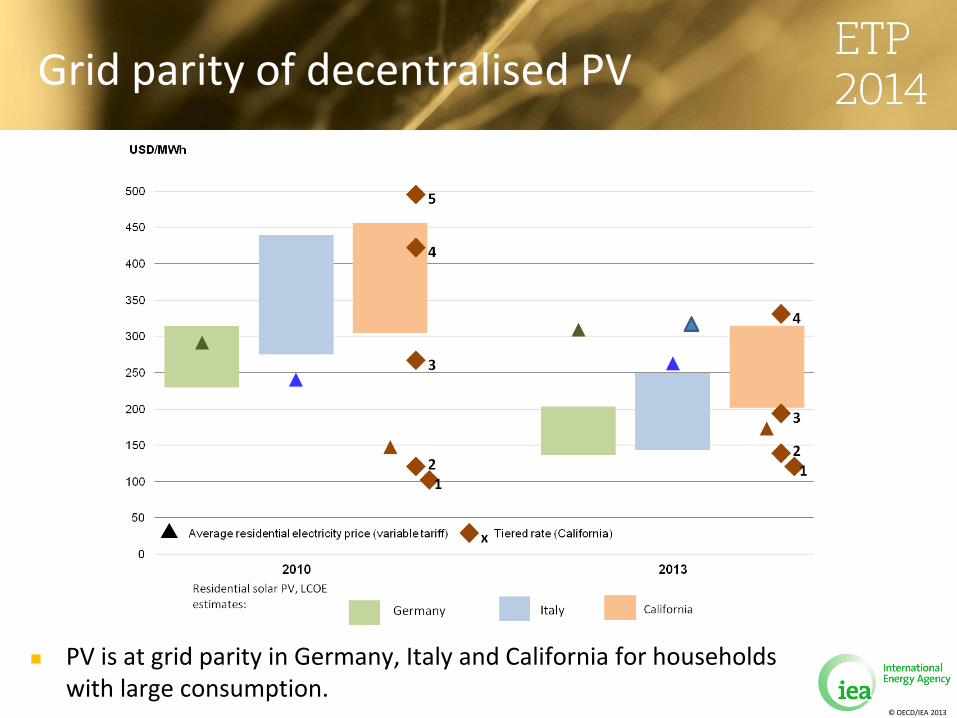
Grid parity of decentralised PV
PV is at grid parity in Germany, Italy and California for households with large consumption.
© OECD/IEA 2013
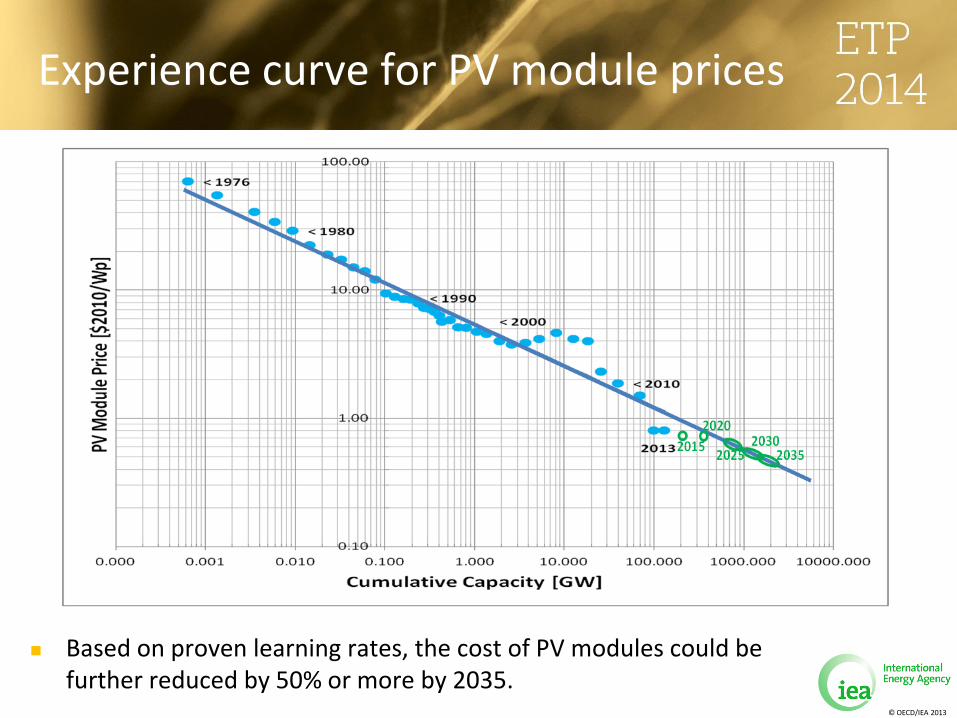
Experience curve for PV module prices
Based on proven learning rates, the cost of PV modules could be further reduced by 50% or more by 2035.
© OECD/IEA 2013
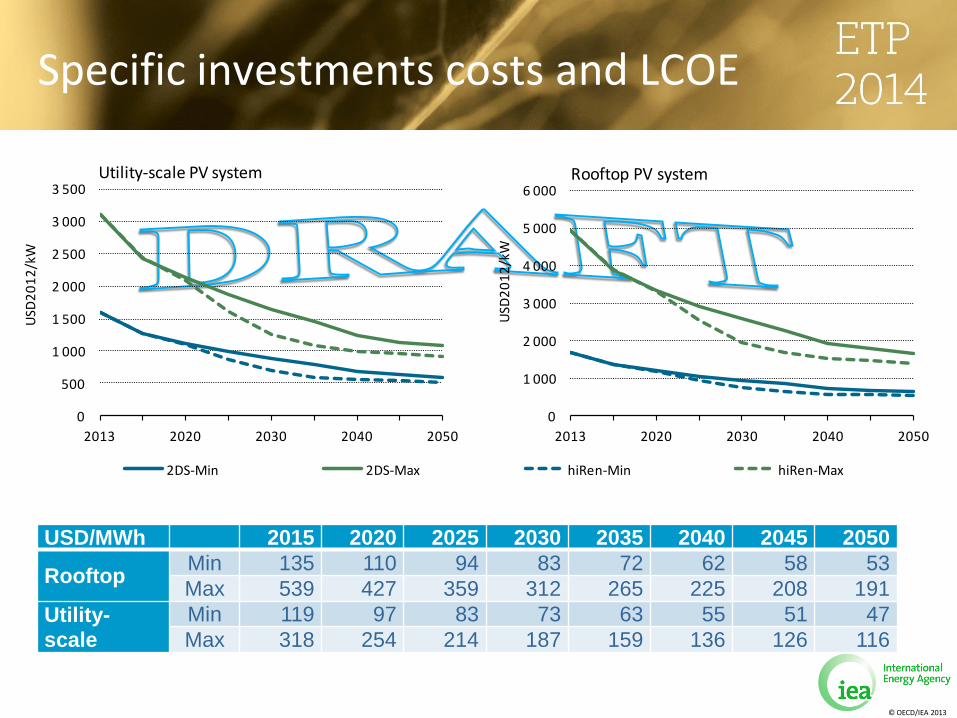
Specific investments costs and LCOE
USD/MWh 2015 2020 2025 2030 2035 2040 2045 2050
Rooftop Min 135 110 94 83 72 62 58 53 Max 539 427 359 312 265 225 208 191
Utility-
scale Min 119 97 83 73 63 55 51 47 Max 318 254 214 187 159 136 126 116
0
500
1 000
1 500
2 000
2 500
3 000
3 500
2013 2020 2030 2040 2050
USD
20
12
/kW
Utility-scale PV system
2DS-Min 2DS-Max hiRen-Min hiRen-Max
0
1 000
2 000
3 000
4 000
5 000
6 000
2013 2020 2030 2040 2050
USD
20
12
/kW
Rooftop PV system
© OECD/IEA 2013
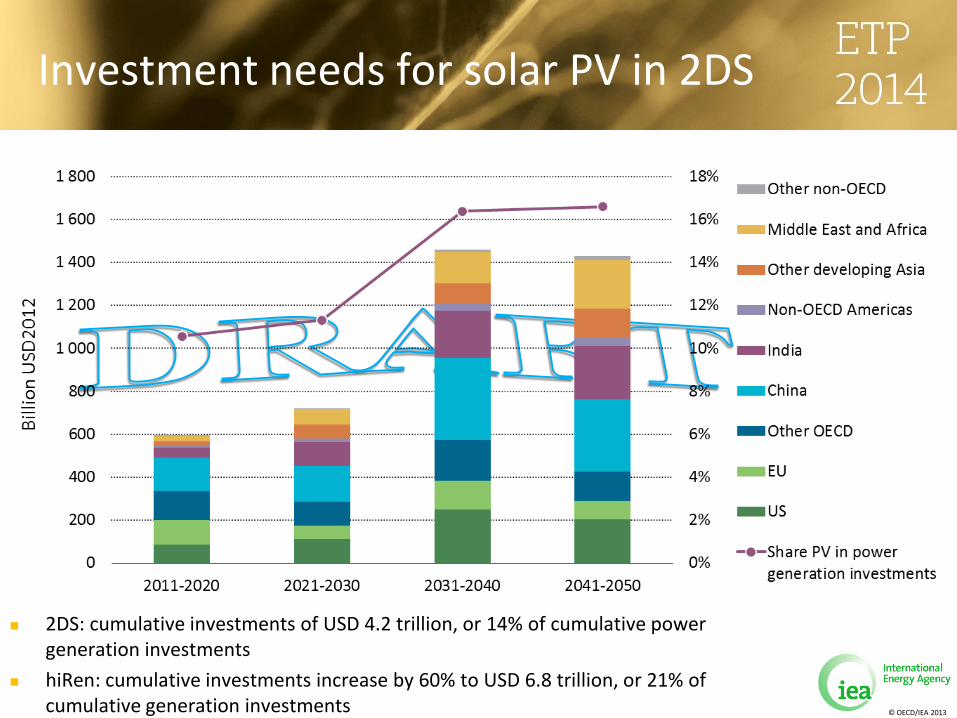
Investment needs for solar PV in 2DS
2DS: cumulative investments of USD 4.2 trillion, or 14% of cumulative power generation investments
hiRen: cumulative investments increase by 60% to USD 6.8 trillion, or 21% of cumulative generation investments
© OECD/IEA 2013
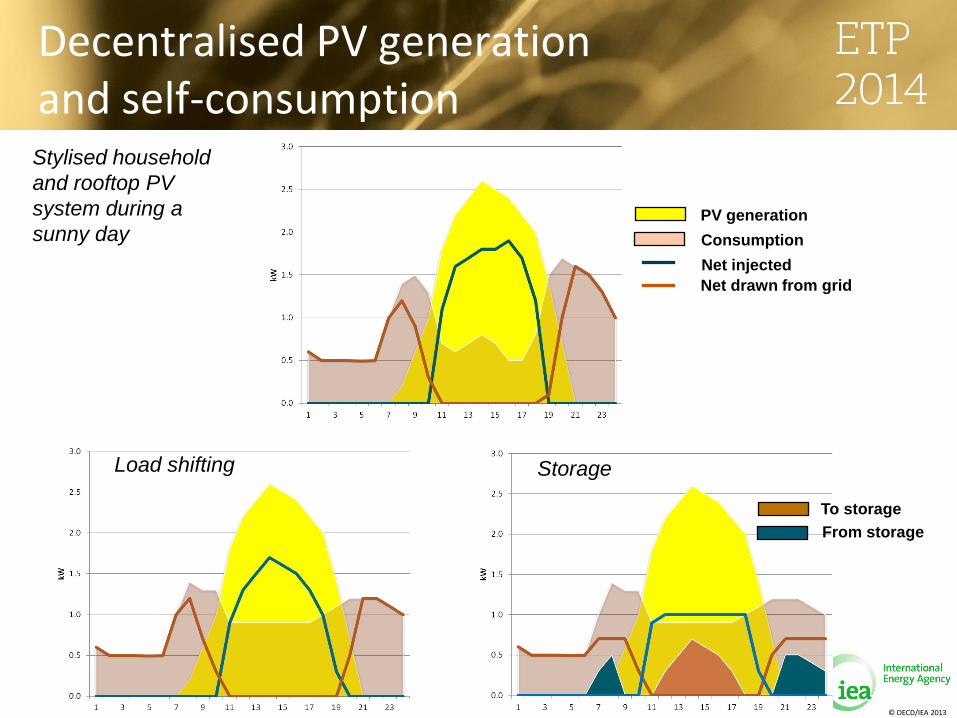
Decentralised PV generation and self-consumption
PV generation
Consumption
Net injected
Net drawn from grid
Stylised household
and rooftop PV
system during a
sunny day
Load shifting
To storage
From storage
Storage
© OECD/IEA 2013
Thank you!


