Solar Radio Bursts and Space Weather Stephen M. White Dept. of Astronomy, University of Maryland, College Park, MD 20742 USA Abstract. Space Weather is the study of the conditions in the solar wind that can affect life on the surface of the Earth, particularly the increasingly technologically sophisticated devices that are part of modern life. Solar radio observations are relevant to such phenomena because they generally originate as events in the solar atmosphere, including flares, coronal mass ejections and shocks, that produce electromagnetic and particle radiations that impact the Earth. Low–frequency solar radio emission arises in the solar atmosphere at the levels where these events occur: we can use frequency as a direct measure of density, and an indirect measure of height, in the atmosphere. The main radio burst types are described and illustrated using data from the Green Bank Solar Radio Burst Spectrometer, and their potential use as diagnostics of Space Weather is discussed. 1. Introduction Low–frequency (below 100 MHz) solar radio bursts were amongst the first radio phenomena studied by radar scientists who turned their radio equipment to the skies after returning from World War II. In this paper we take advantage of exceptionally clean radio spectra of such bursts acquired with the Green Bank Solar Radio Burst Spectrometer to show exampes of these bursts, and to discuss their relationship with space weather phenomena that are of increasing importance in the modern technological world. We will not attempt an exhaustive review of the history of these phenomena, but refer the reader instead to other more comprehensive works: specifically, the books by Kundu (1965) and McLean and Labrum (1985) for observational reviews, Zheleznyakov (1970), Melrose (1980) and Benz (2002) for the theory of radio emission in these bursts, and Pick (2004) and Schwenn (2006) for the relationship with space weather. The value of solar radio bursts at low frequencies lies in the fact that they originate in the same layers of the solar atmosphere in which geo–effective disturbances probably originate: the layers where energy is released in solar flares, where energetic particles are accelerated, and where coronal mass ejections (CMEs) are launched. We are confident of this because at low frequencies, most emis- sion takes the form of plasma emission. Plasma emission is a resonant process in which electrostatic Langmuir waves at the electron plasma frequency, ν p = 9000 √ n e where n e (cm −3 ) is the ambient electron number density, are driven to very high effective brightness temperatures by coherent inter- action with a beam or a loss–cone pitch–angle distribution and then convert to propagating transverse electromagnetic waves at ν p or its harmonic, 2ν p . The plasma frequency at the canonical active– region density of 10 9 cm −3 is 300 MHz. Radiation at ν p is damped by collisional opacity, which is proportional to ν 4 p , and so this emission is typically seen only at low frequencies (i.e., low densities) or when the ambient plasma is very hot. For what appears on the surface to be an exotic mechanism, plasma emission is remarkably prevalent in the solar atmosphere, appearing in some form in quite a large fraction of flares (Benz et al., 2005; Benz et al., 2007). It is not the only emission mechanism operating at frequencies below 1000 MHz, however. Optically–thick thermal bremsstrahlung emission dominates the quiet Sun in this range, producing brightness temperatures of order 10 6 K, while electron cyclotron maser emission, operating at the fundamental of the electron gyrofrequency, ν B = 2.8 × 10 6 B gauss , and at the harmonic 2ν B (Holman et al., 1980; Melrose and Dulk, 1982), provides a better explanation of the properties of some emissions in this range (Benz, 2004). In this paper we will mostly discuss emission below 100 MHz, where plasma emission is believed to dominate most of the observed burst types.
Transcript
Solar Radio Bursts and Space Weather
Stephen M. WhiteDept. of Astronomy, University of Maryland, College Park, MD 20742 USA
Abstract. Space Weather is the study of the conditions in the solar wind that can affect life on the surface of the Earth,particularly the increasingly technologically sophisticated devices that are part of modern life. Solar radio observations arerelevant to such phenomena because they generally originate as events in the solar atmosphere, including flares, coronalmass ejections and shocks, that produce electromagnetic and particle radiations that impact the Earth. Low–frequency solarradio emission arises in the solar atmosphere at the levels where these events occur: we can use frequency as a directmeasure of density, and an indirect measure of height, in the atmosphere. The main radio burst types are described andillustrated using data from the Green Bank Solar Radio Burst Spectrometer, and their potential use as diagnostics of SpaceWeather is discussed.
1. Introduction
Low–frequency (below 100 MHz) solar radio bursts were amongst the first radio phenomena studiedby radar scientists who turned their radio equipment to the skies after returning from World War II.In this paper we take advantage of exceptionally clean radio spectra of such bursts acquired withthe Green Bank Solar Radio Burst Spectrometer to show exampes of these bursts, and to discusstheir relationship with space weather phenomena that are of increasing importance in the moderntechnological world. We will not attempt an exhaustive review of the history of these phenomena, butrefer the reader instead to other more comprehensive works: specifically, the books by Kundu (1965)andMcLean and Labrum (1985) for observational reviews, Zheleznyakov (1970), Melrose (1980) andBenz (2002) for the theory of radio emission in these bursts, and Pick (2004) and Schwenn (2006) forthe relationship with space weather.The value of solar radio bursts at low frequencies lies in the fact that they originate in the same
layers of the solar atmosphere in which geo–effective disturbances probably originate: the layerswhere energy is released in solar flares, where energetic particles are accelerated, and where coronalmass ejections (CMEs) are launched. We are confident of this because at low frequencies, most emis-sion takes the form of plasma emission. Plasma emission is a resonant process in which electrostaticLangmuir waves at the electron plasma frequency, νp = 9000√ne where ne (cm−3) is the ambientelectron number density, are driven to very high effective brightness temperatures by coherent inter-action with a beam or a loss–cone pitch–angle distribution and then convert to propagating transverseelectromagnetic waves at νp or its harmonic, 2νp. The plasma frequency at the canonical active–region density of 109 cm−3 is 300 MHz. Radiation at νp is damped by collisional opacity, which isproportional to ν4p, and so this emission is typically seen only at low frequencies (i.e., low densities)or when the ambient plasma is very hot.For what appears on the surface to be an exotic mechanism, plasma emission is remarkably
prevalent in the solar atmosphere, appearing in some form in quite a large fraction of flares (Benzet al., 2005; Benz et al., 2007). It is not the only emission mechanism operating at frequenciesbelow 1000 MHz, however. Optically–thick thermal bremsstrahlung emission dominates the quietSun in this range, producing brightness temperatures of order 106 K, while electron cyclotron maseremission, operating at the fundamental of the electron gyrofrequency, νB = 2.8 × 10⁶Bgauss, and atthe harmonic 2νB (Holman et al., 1980; Melrose and Dulk, 1982), provides a better explanation of theproperties of some emissions in this range (Benz, 2004). In this paper we will mostly discuss emissionbelow 100 MHz, where plasma emission is believed to dominate most of the observed burst types.
Figure 1. A simple isolated Type III burst observed with the low–frequency system of the Green Bank Solar Radio BurstSpectrometer on December 7, 2006. The frequency range on this day was 12 to 70 MHz. This figure uses a format commonto the all the plots of dynamic spectra in this paper: in order to exploit the black–and–white display, the display range isinverted so that darker pixels represent brighter emission. The bottom level of the display range is set so that the backgroundnoise level is just visible. The light curves in the lower panel of this plot show a frequency–integrated radio light curve (solidline, 1–second time resolution) and for comparison, a soft X–ray light curve from the detectors on the GOES satellites(dashed line, 3–second time resolution). The two light curves are scaled arbitrarily to fit on the same plot: solar flares aregenerally obvious in the GOES soft X–ray light curves as large increases above the apparent noise level. In this case therewas no flare in conjunction with the Type III burst.
2. Space Weather
The conditions in the solar wind in the Earth’s vicinity are now referred to generically as “SpaceWeather”. These conditions include the solar wind speed and density, magnetic field strength andorientation, and energetic particle levels. They are largely controlled by the Sun, which is the sourceof the solar wind as well as of coronal mass ejections that impact the Earth with high densitiesand magnetic field strengths travelling at up to thousands of km s−1, and of flares and eruptionsthat accelerate particles to damagingly high energies and send them towards the Earth. The Earth’smagnetosphere and atmosphere have historically protected us from most of the potentially damagingeffects of Space Weather. The magnetosphere’s closed magnetic field lines cushion us from the shocksprovided by changing conditions in the solar wind, and deflect much of the damaging ionized radiationflux from the Sun. The atmosphere absorbs most of the large flux of ionizing ultraviolet, extremeultraviolet and soft X–ray photons produced by solar flares that would otherwise damage biologicalcells, and life has adapted to survive the resulting conditions at the surface of the Earth.
Solar Radio Bursts 3
But the increasing reliance of modern society on technologically advanced electronic systems hasresulted in vulnerability to electromagnetic and particle influences from the sources external to theEarth. The inter–connected international power grids contain long–range electrical connections thatare susceptible to the large–scale electric fields generated when the magnetosphere is compressed bydisturbances in the solar wind, resulting in voltage and current overloads that can shut down powersupplies to millions of people. Long–distance oil and gas pipelines, particularly at high latitudes, aresimilarly subjected to currents that cause damaging corrosion. Use of global positioning data fromsatellites is becoming widespread and many industries now depend on such data: air traffic is movingtowards relying entirely on such technology. But the technology requires precise timing of radiosignals passing through the Earth’s ionosphere, where changing conditions caused by Space Weathereffects can disrupt measurements. Cell phones rely on communications at microwave frequencieswhere the Sun can cause harmful interference during flares, disrupting service. Other ground–basedradio communication methods require low–absorption paths through the atmosphere that can be de-stroyed when ionizing radiation from the Sun increases the charged particle densities in the lowerionosphere. With increased astronaut activity expected in coming years as NASA sends missions tothe Moon and Mars, there is concern about the possibility of deadly radiation storms occurring duringmanned missions. There are frequent losses of satellites in low–Earth orbit due to increased drag fromthe atmosphere during periods of high solar activity when the upper atmosphere is heated by ionizingphoton fluxes and expands outwards, while all satellites are susceptible to radiation damage in criticalcomputing components that can result in complete loss of control. The commercial implications ofSpace Weather are now widely recognized and insurance companies in particular are paying attentionto its effects on their industry.For all of these reasons, the study of Space Weather has become an important practical task in
addition to the intellectual value of understanding the physical processes involved. Since most ofSpace Weather’s effects originate in the Sun’s atmosphere, any diagnostics there can potentially bevaluable. Radio observations sample most of the activity in the Sun’s atmosphere and are expected toplay an important role in monitoring Space Weather sources.
3. The Green Bank Solar Radio Burst Spectrometer
The Green Bank Solar Radio Burst Spectrometer (SRBS) has been operating routinely since January2004. Funded by the National Science Foundation under a grant to the National Radio AstronomyObservatory (NRAO: principal investigator, Tim Bastian), SRBS takes advantage of the nationalradio–quiet zone around the Green Bank Observatory in West Virginia to obtain low–noise spectra ofsolar radio bursts from the ionospheric cutoff at about 10 MHz up to 1000 MHz. Three frequencyranges are served by different feeds: (a) a long–wavelength dipole antenna, currently the “coat–hanger” type designed by Bill Erickson and tested for the Long Wavelength Array, has been operatingfrom 18–70 MHz since 2004; (b) a 200-1100 MHz feed mounted at the prime focus of a 13.7 m dish(donated by NRAO to the project) has been operating since mid 2005; and (c) a 70–300 MHz feedmounted above the feed support for the 13.7 m dish but pointing outwards was installed in mid 2006and is currently (early 2007) being commissioned.Each receiver feeds a commercial spectrum analyzer that sweeps through each frequency range of
order 1000 times per second with of order 1000 spectral channels each, and the individual sweeps arecurrently binned up to 1 second time resolution. The resulting data are very high quality spectra withlow background levels. The daily data are processed by background subtraction and are available overthe web at http://gbsrbs.nrao.edu.
Figure 2. This figure plots fits of the temporal properties of the Type III burst in Fig. 1 as a function of frequency. Theupper panel shows the time delay (after 16:19:00) of the arrival of Type III emission as a function of frequency, with circlesymbols representing the time at which the burst reaches 50% of its maximum level at each frequency in the rise phase, andthe asterisks showing the time of the peak emission. The lower panel shows the duration of the burst, measured between thehalf–maximum points at each frequency.
An example of the quality of the data is shown in Figure 1, which is an isolated Type III burstobserved on December 7, 2006. The display range has been chosen so that the background can beseen in addition to the burst: in processing of the spectrum, narrow line features have been removed aswell as a smooth background (containing the galactic background at low frequencies as well as someresidual broader interference features). The final spectrum shows no prominent interference featuresdespite covering a low–frequency range generally notorious for interference. The most prominentartefacts are residual varying emission near 20 MHz from an interference source, and the fall–off inthe response of the dipole feed at high frequencies. The most common problem we find at the GreenBank site is a sporadic local broadband emission strongly modulated in frequency, but it was notpresent during this event. In summer, sporadic ionospheric E–layers are also commonplace in WestVirginia and we see their effects in the presence of a digital TV signal in the spectra from 60–65 MHz,believed to be reflected in from Pittsburgh some distance away.
Solar Radio Bursts 5
20
30
40
50
60
70F
requ
ency
(M
Hz)
GBSRBS 20050607S
umm
ed li
ght c
urve
15:43 15:44 15:45 15:46 15:47 15:48 15:49
Time (UT) 20050607
GBSRBS
GOES
Type V
Type III
Figure 3. An example of a Type V burst, typically described as the extended phase of a Type III burst. In this example aType III is observed as a precursor at about 15:44:30, and the Type V starts at 15:45:00 and lasts until 15:46:30 at 20 MHz.
4. Solar Radio Bursts
Solar radio bursts were amongst the first phenomena identified as targets for radio astronomy. Solarradio bursts at frequencies below a few hundred MHz were classified into 5 types in the 1960s (Wildet al., 1963). For SpaceWeather studies, three of the burst types are most relevant, and we discuss eachof these separately below: Types II, III, and IV. Here we mention that Type I bursts are a non–flare–related phenomenon, consisting of a continuum component and a burst component. The continuum,also often referred to as a “noise storm”, typically covers the frequency range 100–400 MHz, withvariations on timescales of hours. The long duration of this emission suggests that it is due to energeticelectrons trapped on closed coronal magnetic field lines. The associated Type I bursts are brief (oforder seconds duration) and very narrow band, and tend to occur in drifting chains of 10–20 MHzbandwidth. Because they are not clearly associated with energy releases visible in other wavelengthranges, noise storms are an intriguing sign that energy release can continue in the corona on longtimescales, but the absence of diagnostics at other wavelengths also makes them very difficult tostudy. Imaging observations with the Nancay Radio Heliograph generally show compact radio sourcesin the appropriate frequency range over most flare–productive active regions, even though they are notvisible in radio dynamic spectra (which are not optimal for low–level broadband features), indicatingthat such sources, and the necessary associated energy releases, are quite common in the active solarcorona.
6 S. M. White
20
30
40
50
60
70F
requ
ency
(M
Hz)
GBSRBS 20050710S
umm
ed li
ght c
urve
21:00 21:10 21:20 21:30 21:40 21:50 22:00
Time (UT) 20050710
GBSRBS
GOESFlare
Non-flare Type IIIs
Figure 4. Dynamic spectrum of over an hour on a day of activity, showing Type III events occurring both in conjunctionwith a solar flare (at 21:40 UT) and in the absence of flare activity (between 21:10 and 21:35 UT).
5. Type III bursts
Type III bursts are brief radio bursts that drift very rapidly in frequency versus time (Fig. 1). Becausethe emission is at the plasma frequency (or its harmonic), the drift in frequency with time can bedirectly converted into a drift from high to low ambient coronal density with time. Coronal densitymodels can then be used to infer a velocity for the exciter. In Figure 2 we show measurements ofthe arrival time and duration of the burst in Fig. 1 as a function of frequency: it drifts from 50 to20 MHz in about 3 seconds, or 10 MHz s−1. (Drift rates at higher frequencies are faster, becausethe density scale heights lower in the atmosphere are smaller, and a disturbance at constant speedwill therefore have a higher frequncy drift rate.) To take an example, in the Newkirk coronal densitymodel (Newkirk, 1961) these two frequencies correspond to heights of 0.5 and 1.1 R�, implying aspeed of almost half the speed of light. The inferred speed clearly depends on which of the manycoronal density models one applies, but the general result is that for (relatively) “fast–drift” bursts(Type III bursts have consistently the fastest drift rates of bursts at metric wavelengths), the exciterspeeds tend to be of order one–tenth the speed of light, and accordingly the only plausible drivers forType III bursts are beams of electrons of energies up to tens of keV. Such beams of electrons havelong been known to be very efficient producers of electrostatic Langmuir waves via the bump–in–tailinstability. They can be seen to start at densities corresponding to the very low corona (frequenciesup to several GHz) and propagate through the SRBS frequency range all the way out to 1 AU, wheretheir electrons can be detected in–situ by spacecraft in the solar wind.
Solar Radio Bursts 7
20
30
40
50
60
70F
requ
ency
(M
Hz)
GBSRBS 20050113S
umm
ed li
ght c
urve
18:58 19:00 19:02 19:04 19:06 19:08 19:10 19:12
Time (UT) 20050113
GBSRBS
GOES
Type IIIs
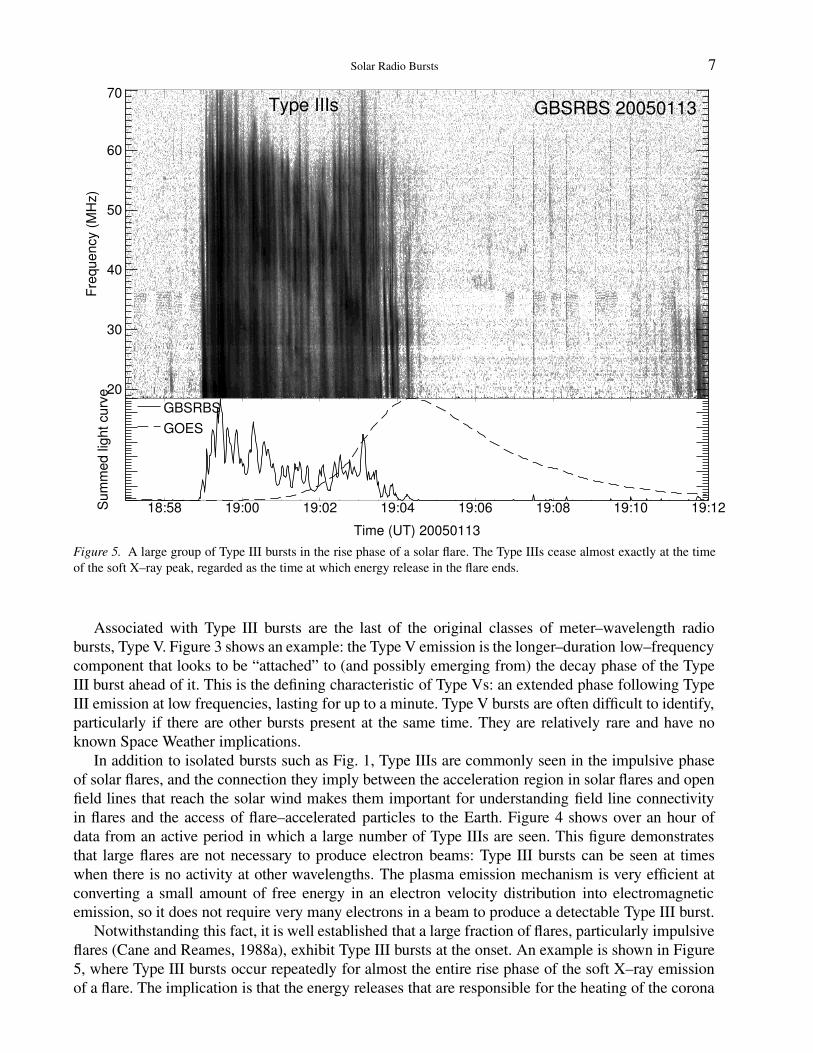
Figure 5. A large group of Type III bursts in the rise phase of a solar flare. The Type IIIs cease almost exactly at the timeof the soft X–ray peak, regarded as the time at which energy release in the flare ends.
Associated with Type III bursts are the last of the original classes of meter–wavelength radiobursts, Type V. Figure 3 shows an example: the Type V emission is the longer–duration low–frequencycomponent that looks to be “attached” to (and possibly emerging from) the decay phase of the TypeIII burst ahead of it. This is the defining characteristic of Type Vs: an extended phase following TypeIII emission at low frequencies, lasting for up to a minute. Type V bursts are often difficult to identify,particularly if there are other bursts present at the same time. They are relatively rare and have noknown Space Weather implications.In addition to isolated bursts such as Fig. 1, Type IIIs are commonly seen in the impulsive phase
of solar flares, and the connection they imply between the acceleration region in solar flares and openfield lines that reach the solar wind makes them important for understanding field line connectivityin flares and the access of flare–accelerated particles to the Earth. Figure 4 shows over an hour ofdata from an active period in which a large number of Type IIIs are seen. This figure demonstratesthat large flares are not necessary to produce electron beams: Type III bursts can be seen at timeswhen there is no activity at other wavelengths. The plasma emission mechanism is very efficient atconverting a small amount of free energy in an electron velocity distribution into electromagneticemission, so it does not require very many electrons in a beam to produce a detectable Type III burst.Notwithstanding this fact, it is well established that a large fraction of flares, particularly impulsive
flares (Cane and Reames, 1988a), exhibit Type III bursts at the onset. An example is shown in Figure5, where Type III bursts occur repeatedly for almost the entire rise phase of the soft X–ray emissionof a flare. The implication is that the energy releases that are responsible for the heating of the corona
8 S. M. White
Open to closed Closed to closed Interchange
Figure 6. Magnetic reconnection topologies that may apply in flares. Three models are shown before (upper row) and after(lower row) reconnection. The left column shows reconnection of two open field lines in a “helmet–streamer” configurationto produce one closed field line and one open field line no longer connected to the solar surface at either end; the middlecolumn shows the “quadrupolar” configuration in which two closed field lines reconnect to produce two new closed fieldlines; and the right column shows the case where one open and one closed field line swap topology.
to soft X–ray temperatures (107 K) also result in the acceleration of electrons that escape as beams onopen magnetic field lines, and so such Type III bursts potentially form a diagnostic of energy releaseand acceleration. Aschwanden et al. (1993) found cases where both upgoing and downgoing electronbeams produced radio signatures, originating in a frequency range corresponding to a density of over109 cm−3, and also suggested that the downgoing beams were well–correlated with particle precipita-tion into the solar chromosphere revealed by structure in the hard X–ray emission time profile, furtherconnecting the Type III bursts to the main energy release events in flares.The presence of Type III bursts generated by the energy release in flares has implications for flare
models, and therefore for Space Weather prediction, because the electron beams are seen to propagateout to regions of very low density and therefore must be on open field lines. We believe that flareenergy release involves magnetic energy density stored in the corona in a form, such as sheared non–potential magnetic fields, that is available for conversion to particle energy (thermal and nonthermal)because no other medium that we know of offers the possibility of storing sufficient energy to explainlarge solar flares (Wu et al., 1989). Conversion of magnetic energy into particle energy may takeplace as a by–product of the mechanism of magnetic reconnection, in which magnetic field linesmay change topology and connectivity (field lines may be cut and then reconnected to other fieldlines, a non–ideal MHD process). The strongest magnetic fields in the solar photosphere occur insunspots: most of the field lines passing through strong field regions appear to close within the solaratmosphere (i.e., both footpoints are connected to the solar photosphere), which suggests that theenergy available for flares is probably stored on closed field lines. However, that need not be thecase and open field lines (which have one end rooted in the solar photosphere and the other pulledout into the solar wind) also may be involved. A popular model for long–duration flares and theassociated coronal mass ejections involves a so–called “helmet–streamer” configuration (Figure 6) inwhich closed loop field lines lie under a current sheet which separates regions of open field lines of
Solar Radio Bursts 9
opposite magnetic polarity: reconnection at the top of the loop creates new closed field lines (as wellas field lines not rooted in the solar surface) and releases energy (see the discussion of flare models inAschwanden, 2004). In this model open field lines are an intrinsic part of the energy release process,and it seems natural that particles accelerated in the energy release would find their way onto openfield lines. However, Type III bursts are mostly found in the flash phase of very impulsive flares (Caneand Reames, 1988a), which are not thought to be due to the helmet–streamer model. Other modelsapplied to very impulsive flares involve interactions between pairs of closed loops (the middle columnof Fig. 6), such as when loops carrying magnetic flux emerging from beneath the solar photospherereconnect with pre–existing loops in the solar corona. In such models the outcome of reconnectionis two new closed loops, and then no open field lines are involved, making it difficult to see howType III bursts could originate in the energy release region. Another class of flare models involvesreconnection between one open field line and one closed field line, in which topology is switched,and in this model we again have open field lines as an intrinsic part of energy release.In addition, a class of Type III bursts that occurs somewhat after (typically 10 minutes or so, during
Type II emission) the impulsive phase has been reported to show a very high degree of association withsolar energetic particle events (Cane et al., 2002). These bursts occur in groups and are labelled TypeIII-l; they are commonly seen below 14 MHz as well as in the SRBS range. Their association withsolar energetic particle (SEP) events has made them an important topic of current studies. However,we have not seen any clear examples of this type of burst with SRBS so we do not present an examplehere. Initially it was thought that these fast drift bursts might originate in a Type II shock, since theyoften occur at the same time (i.e., well after the onset of the impulsive phase, hence a phenomenonquite different from the impulsive–phase Type IIIs discussed above) and in a similar frequency range(Dulk et al., 2000).Cane et al. (2002) found that nearly all solar energetic proton events are preceded by such groups
of Type III-l bursts, and that they are particularly prominent in dynamic spectra below the ionosphericcutoff at about 10 MHz. Since the Type III bursts in a Type III-l group often started at frequenciesabove the Type II emission visible in dynamic spectra at the same time, they argued that the TypeIII-ls had to originate lower in the corona than the Type II shock, and thus they were unlikely tooriginate in the Type II shock or in any shock associated with a fast CME, which is likely to be aheadof the Type II emission. This implies that the source of the Type III-l emission and, by implication,any associated energetic protons, was more likely to be in the flare region, and that open field linesmust connect the acceleration region to the solar wind. This picture is in contrast to the belief thatlarge gradual solar energetic particle (SEP) events are due to acceleration of particles by large coronalmass ejections (Reames, 1999). The association of Type III-l with SEPs is still being investigated andthe exact relationship is by no means settled, but if it holds up then their observation, occurring up totens of minutes before the arrival of the corresponding SEPs at the Earth, would hold promise as aSpace Weather diagnostic.
6. Type II bursts
Type II bursts typically occur at around the time of the soft X–ray peak in a solar flare and areidentified by a slow drift to lower frequencies with time in dynamic spectra, the frequent presenceof both fundamental and second–harmonic bands (with a frequency ratio of 2), and splitting of eachof these bands into two traces. The frequency drift rate is typically two orders of magnitude slowerthan that of the (“fast–drift”) Type III bursts, so the two burst types are readily distinguished. Figure 7shows a classic example of a flare in which Type III bursts occur at the onset of the event and a Type IIburst is seen to start near the peak of the soft X–ray emission. Both fundamental and harmonic lanes
10 S. M. White
20
30
40
50
60
Fre
quen
cy (
MH
z)GBSRBS 20040824
Sum
med
ligh
t cur
ve
21:00 21:10 21:20 21:30 21:40
Time (UT) 20040824
GBSRBS
GOES
Type IIIs
Type II 2nd harmonic
Type IIfundamental
Figure 7. Classic Type III/II event: in the early rise of the impulsive phase of the flare (shown here by the onset of softX–rays seen by the GOES satellite in the lower panel) a group of fast–drift Type III bursts is seen, followed after the softX–ray peak by a fundamental–harmonic Type II burst with both lanes showing obvious splitting. This was a small (GOESclass B5) flare.
are visible, and both show splitting. In rare events, a third harmonic trace can also be seen (Zlotniket al., 1998).The emission mechanism of Type II bursts is assumed to be plasma emission at the plasma fre-
quency and its harmonic. The observed frequency drift rate can be converted into a velocity if thedependence of electron density ne on height is known, and it is found that a typical speed is of order1000 km s−1, or somewhat larger than the typical Alfven speed in the corona. For this reason TypeII bursts are agreed to be evidence for shocks in the corona, rendered visible by the radiation ofelectrons that they accelerate. There is almost always a delay between the flare onset and the start ofType II emission, which is attributed to the variation of the Alfven speed with height in the corona: theAlfven speed vA (∝ B/
√ne) is high in the low corona where magnetic field strengths are large, anddecreases with height because B typically falls off much more quickly with height than does density.A shock cannot form unless a disturbance exceeds the local magnetosonic fast mode speed, whichis essentially vA in the low–plasma–β solar corona. As height increases, vA decreases and the Machnumber of a disturbance moving at a constant speed increases, producing a stronger shock.The shocks that produce Type II emission have never been unambiguously identified at other
wavelengths, although possible associations have been suggested and include coronal mass ejections,Moreton waves, and soft X–ray ejecta. Type II bursts are always seen in conjunction with flares,even though some of those flares are very small events, and there is a very healthy controversy asto whether the shocks are driven by CMEs or by some other flare phenomenon: with the improved
Solar Radio Bursts 11
20
30
40
50
60
Fre
quen
cy (
MH
z)GBSRBS 20040716
Sum
med
ligh
t cur
ve
13:50 13:55 14:00 14:05 14:10
Time (UT) 20040716
GBSRBS
GOES
Type II
Figure 8. A ghostly Type II burst from a very large X3 flare. This flare produced a “short–wave fadeout”: the large fluxof extreme ultraviolet and soft X–ray photons early in the flare produced additional ionization in the ionosphere, whichincreased the absorption of radio emission from the Sun passing through the ionosphere. This absorption is visible in thefigure in the lack of background noise starting near 13:53 UT at low frequencies, extending up to 60 MHz at the peak of theX–ray emission. A short section of one split lane of Type II emission is visible through this absorption from 13:59 to 14:03UT.
coverage and sensitivity of coronagraphs in recent years, the correlation between Type II bursts andthe presence of a coronal mass ejection (CME) has become increasingly tight, lending support to theidea that the shocks that produce Type II bursts are being driven by CMEs, without resolving the issue(Cliver et al., 1999; Gopalswamy et al., 1998; Cliver, 1999; Gopalswamy, 2000; Shanmugaraju et al.,2003; Cliver et al., 2004; Cane and Erickson, 2005). The particle acceleration exhibited by Type–II driving shocks, and their associations with flares and/or CMEs, make them important for SpaceWeather studies.Type II bursts are generally a low–frequency phenomenon, with most being detected below 100
MHz. In the first 18 months of operation of SRBS, only 1 Type II event was reported in SRBS’stime range that was not seen below 70 MHz by SRBS. Of the 31 Type IIs observed by SRBS in thisperiod, 3 events did not produce detectable CMEs (i.e., the images from the LASCO coronagraph onthe SOHO satellite cover the interval of the event but do not show an eruption). The largest of theevents is shown in Figure 8: this was a GOES class X4 flare which produced a short wave fadeout(due to additional absorption in the D layer of the ionosphere resulting from the ionizing EUV andsoft X–ray flux of the flare). This fadeout may obscure some of the radio emission from this event,but a short period of Type II emission, with the normal frequency drift rate and showing split–bandfeatures, is clearly present.
Figure 9. An event in which two separate traces of fundamental–harmonic Type II emission are visible simultaneously.The pairs are labelled IIa F (fundamental) and H (harmonic), IIb F and H. The two pairs show very different drift rates (IIahas the faster drift rate): an interpretation is that a large scale shock is propagating through the corona and producing TypeII emission in two distinct regions with very different density gradients along the direction of propagation. This was a large(GOES class M9) solar flare with a coronal mass ejection.
Assessing the significance of the non–detection of a CME is complicated by viewing angle effects:because of the geometry of white–light scattering, CMEs occurring at the solar limb are much easierto detect in coronagraph images than are events that appear to be projected against the bright solardisk, and this effect will lower the degree of association of CMEs with Type IIs. Yashiro et al. (2005)conclude that half of all CMEs produced by GOES C–class flares were not detected by LASCO, butthat detection of CMEs is complete for flares at GOES class X3 or larger, irrespective of the longitudeof the event. This event occurred at a longitude of E35, and any CME should have been detectable byLASCO based on the study of Yashiro et al. (2005).The standard picture of Type II bursts is of electrons accelerated by a broad shock front propa-
gating through the corona: if the shock is being driven by a CME, then we know from coronagraphobservations that the shock front should cover a large area. Given this picture, it seems odd that theType II lanes are usually relatively narrowband and well–defined, since emission at many widely–separated locations in the corona should be at very different electron densities, and thus cover a widefrequency range at any given instant. Electron acceleration might not occur everywhere on the shockfront: for example, it is quite possible that acceleration only takes place where the shock front isorthogonal to the local magnetic field, and this would limit the range of locations in which emissionoccurs. More complex events are seen: in particular, Type IIs in which two sets of harmonic lanesare seen simultaneously are not uncommon. An example is shown in Figure 9, in which the two pairs
Figure 10. A classic Type II–IV event from a large (GOES class X2) flare. In this class of event there are often no Type IIIbursts in the impulsive phase: a Type II burst occurs at around the time of the soft X–ray maximum, and is then followedby a broadband Type IV emission which, as in this case, may drift to lower frequencies with time. Note that a short–wavefadeout is also evident in this event as a decrease in the apparent background noise level from 17:32 UT onwards.
of lanes clearly have different drift rates. These could indicate emission from two different locationswithin a large–scale shock, such as we would expect from a monolithic disturbance such as a CME,or alternatively they could be due to the presence of two separate, more localized shocks in this event.There continues to be a great deal of research on the relationship between Type II radio bursts,
CMEs and particle acceleration, and the Space Weather applications remain unclear.
7. Type IV bursts
Type IV bursts are broadband quasi–continuum features associated with the decay phase of solarflares. They are attributed to electrons trapped in closed field lines in the post–flare arcades producedby flares; their presence implies ongoing acceleration somewhere in these arcades, possibly at the topsof the loops in a “helmet–streamer” configuration. Although they are not as common as Type II and IIIbursts, and there has been somewhat less work on their properties (Cane and Reames, 1988a; LaBelleet al., 2003; Zlotnik et al., 2003; Magdalenic et al., 2005; Pick et al., 2005), Type IV bursts have longbeen of interest in Space Weather studies because they have a high degree of association with solarenergetic particle events.Figure 10 shows a stereotypical example of a Type IV burst: in this event there are no Type III
bursts at onset (although a significant short–wave fadeout is present) and the first meter–wavelength
14 S. M. White
20
30
40
50
60
Fre
quen
cy (
MH
z)GBSRBS 20040725
Sum
med
ligh
t cur
ve
14:30 14:45 15:00 15:15 15:30 15:45 16:00
Time (UT) 20040725
GBSRBS
GOES
Figure 11. An example of a Type IV burst associated with a GOES class M1 flare. The burst is a broadband emissionlasting for several hours, but with modulation in time that can resemble a large group of individual fast–drift bursts.
radio emission seen is a Type II burst at the peak of the soft X–ray emission. As the Type II movesdown towards the ionospheric cutoff, a broadband continuum appears with substructure, notablybroadband modulations on timescales of seconds resembling fast–drift bursts. This is a Type IV burst,and as in this case it can last for an hour or longer. Unlike Type II events, Type IV events are almostalways associated with large flares, and usually those with long durations (Cane and Reames, 1988a).Cane and Reames (1988b) also showed that Type IV events do tend to be associated with Type IIevents: in their study 88% of over 200 Type IV bursts observed by the Culgoora Observatory werepreceded by Type II events, whereas only about one–third of all Type II bursts are followed by a TypeIV burst. This event was associated with a CME at the west limb, with the relatively low speed of 600km s−1, but no energetic particle event was detected.Despite the high correlation of Type IV bursts with Type II bursts, the production of Type IV bursts
seems to be a peculiarity associated with certain active regions. A remarkable example occurred withAR 10786 in July, 2005: after July 5, this active region produced at least 6 recorded Type IV burstsand not one of them was preceded by a Type II burst. Regular observers notice that Type IV burststend to be associated with certain active regions: other regions may be prolific producers of Type IIbursts and never produce Type IVs.Figure 11 shows another example of a long–duration Type IV in which the rapid modulation and
the presence of substructure are clearly visible. Substructure within Type IV bursts is, in fact, a majorsource of confusion for observers identifying Type II bursts: inspection of dynamic spectra suggeststhat in the first 18 months of operation of SRBS, 27 Type II bursts were reported in Solar Geophysical
Solar Radio Bursts 15
Data and of these 3 were not Type II bursts, but rather were structures within the Type IV burstswhich resembled slow–drift features, but occurring well after the impulsive phase of the associatedflares. The properties of and models for the substructure in Type IV bursts have been discussed byAurass et al. (2003) and Zlotnik et al. (2003). The broadband and non–drifting nature of Type IVemission has led to the widespread belief that they are due to electrons trapped on closed magneticfield lines. In such a geometry, short–duration modulations can be produced by repeated injectionsof energetic electrons into a loop. Such injections imply the occurrence of repeated small energyreleases associated with the acceleration of such electrons. A natural location for the accelerator is atthe top of the post–flare loop systems commonly associated with the long–duration flares that tendto produce Type IV bursts: the long gradual rise of such loop systems and their ongoing soft X–rayemission have led to the idea that they experience energy release that is distinct from the impulsiveenergy release responsible for the flare itself, and some portion of such an energy release could beused to accelerate electrons that then produce Type IV emission on closed field lines in the arcade.Imaging observations at metric wavelengths tend to show that most Type IV bursts are stationary inthe corona, but the association with the top of post–flare loop arcades could not be confirmed directlydue to the low spatial resolution typical of long wavelengths. However, in the well–known event of2002 April 21 Kundu et al. (2004) were able to show that there was non–thermal gyrosynchrotronemission at microwave frequencies (where high–spatial–resolution images were available) at the baseof the post–flare arcade in that event at the same time as Type IV emission was seen in a dynamicspectrum at decimetric wavelengths, consistent with the general picture of Type IV events.A sub–class of Type IV bursts, known as “moving Type IVs”, is of great interest because they
are seen to move in images at speeds similar to CME speeds, but they are difficult to separate fromstationary Type IV events just from their spectral characteristics alone. Moving Type IV bursts arepredominantly a low–frequency phenomenon, occurring at frequencies below 100 MHz, and due tothe scarcity of imaging capability at such low frequencies presently (soon to be remedied by theconstruction of the Long Wavelength Array in the U.S.), they have been almost impossible to identifyfor some time. For this reason, and because of their relative rarity, there has been little research onthem in recent years.
8. Other bursts
Figure 12 shows another class of burst less often discussed than the burst types above and muchharder to identify. This is a continuum emission occurring during the impulsive phase of a flare. Inthis event it takes the form of an extremely bright low–frequency broadband continuum, showingsome modulation in time but generally little characteristic structure in the dynamic spectrum. It wasproduced by a large (GOES class M8) flare. Originally all broadband continua were called Type IVbursts, but over the years it was realized that this was inadequate for the range of characteristicssuch continua exhibit, and so many subclasses of Type IV burst were developed that the term wasno longer useful (see the comprehensive historical discussion by Robinson, 1985). The term “TypeIV” burst is now generally reserved for the two classes of event described in the preceding section:continua occurring after the impulsive phase of a flare, generally after a Type II event and stationaryin the corona, and moving Type IV events which appear similar in dynamic spectra but move rapidlyoutwards. Other emissions occurring in the impulsive phase (i.e., during the rise and peak of thesoft X–ray emission from the event) that are not clearly fast drift Type III bursts or slower–driftwell defined Type II bursts now tend to be called “flare continuum”, or “flare continuum early” inthe terminology of Robinson (1985), who wanted to distinguish it from broadband continua seenlater in flares. In practice, there seems to be little in the way of characteristic features that identify
Figure 12. An extremely bright (but difficult to classify) radio burst. This was from a GOES class X1 flare, and wasfollowed several minutes later by a Type IV burst clearly separated from the emission shown here. There may be afundamental–harmonic pair feature with drift rate similar to a Type II burst in the earliest stage, at 16:42 UT (labelledII-F and II-H). The subsequent emission (labelled ”FC”) gets brighter as frequency decreases. This may be a form of “earlyflare continuum” (Robinson 1985).
flare continuum apart from its timing relative to the impulsive phase and its broadband nature, and(speaking personally) it seems to be more useful as a designation of what an emission is not (i.e., theother well known burst types), rather than what it is.The event shown in Fig. 12 occurred near disk center in conjunction with a very fast halo CME
and a gradual–rise solar proton event. It was also associated with a major interplanetary radio burst(consistent with the bright low–frequency emission in Fig. 12) and emission seen all the way out tothe Earth’s orbit. Thus, this was an event with significant Space Weather effects, but at present there isno particular reason to view the flare continuum emission in the dynamic spectrum of this one eventas a significant diagnostic.One other Space Weather radio diagnostic that may become more important is the detection of
synchrotron emission from the leading edge of coronal mass ejections. This possibility was demon-strated by Bastian et al. (2001) using images from the Nancay Radio Heliograph: at frequencies from169 to 408 MHz, they found a beautiful arc–shaped feature in radio images, expanding as it movedoutwards at a speed matching that of a CME visible in coronagraph data, and coincident with it in thesingle coronagraph image taken while the radio source was visible. From the radio spectrum and therelatively weak brightness temperature of the emission, Bastian et al. (2001) inferred that the emissionmechanism was synchrotron emission in the magnetic fields associated with the coronal mass ejectionfrom electrons accelerated by a shock driven into the solar wind by the CME. The emission was not
Solar Radio Bursts 17
visible in dynamic spectra of the radio event, and indeed, due to the limited dynamic range of theradio images, probably would not have been visible if the normally much brighter plasma emissionsources low in the corona were not suppressed because the flare region was beyond the limb. Suchdata offer the possibility of directly imaging the locations of acceleration by shocks driven by CMEs,and further data are required to determine the relationship between the accelerated electrons seen inthe radio images and the energetic protons that pose a threat to astronauts and to satellite operations,but as more low–frequency imaging facilities become available, with the possibility of imaging atfrequencies selected to be devoid of bright plasma emission sources, this promises to be a productivearea of Space Weather research.
9. Conclusions
The nature of low–frequency solar radio bursts and their potential for the study of Space Weatherhas been discussed. We have shown that Type III bursts are indicators of acceleration of electrons,and of the access of those electrons to open field lines, i.e., magnetic field lines in the corona thatdo not close within the solar atmosphere but instead become part of the solar wind and potentiallyfeed energetic particles to the Earth’s location. The common occurrence of Type III bursts early inthe rise of impulsive solar flares may indicate that open field lines are an essential part of models forenergy release by magnetic fields in such flares. Type II bursts are indicators of shocks in the solaratmosphere, and the nature of the driver of those shocks remains a subject of intense interest. Theredo seem to be some large events in which coronal mass ejections are not seen, when we would expectthem to be easily detectable if present. CMEs clearly do produce detectable synchrotron emissionthat outlines the leading edge of the eruption, and this promises to be a valuable diagnostic in futureimaging data. Type IV bursts continue to have a strong association with large long–duration flares thatare often the source of energetic particle events in the solar wind, and they are evidence that particleacceleration continues in the solar corona long after the impulsive phase of a flare.Solar radio observations will continue to play an important role in Space Weather studies because
they are sensitive to the regions of the solar atmosphere in which many Space Weather phenomenaoriginate. They can also see features that are not visible at other wavelengths, and thus complementother facilities such as satellite–borne coronagraph instrumentation.
Acknowledgements
SRBS is supported by an NSF Division of Atmospheric Sciences grant under the National SpaceWeather program. Tim Bastian is the principal investigator for SRBS and Rich Bradley (both ofNRAO) is the chief engineer. Scientific activities with SRBS are supported by NASA Living With aStar grant NNX06AC18G.
References
Aschwanden, M. J.: 2004, Physics of the Solar Corona. An Introduction. Berlin: Springer.Aschwanden, M. J., A. O. Benz, and R. A. Schwartz: 1993. Astrophys. J. 417, 790.Aurass, H., K.-L. Klein, E. Y. Zlotnik, and V. V. Zaitsev: 2003. Astron. Astrophys. 410, 1001–1010.Bastian, T. S., M. Pick, A. Kerdraon, D. Maia, and A. Vourlidas: 2001. Astrophys. J. Letters 558, 65.Benz, A. O.: 2002, Plasma Astrophysics. Kinetic Processes in Solar and Stellar Coronae. Dordrecht: Kluwer AcademicPublishers.
18 S. M. White
Benz, A. O.: 2004. In: D. E. Gary and C. U. Keller (eds.): Solar and Space Weather Radiophysics. Dordrecht, pp. 203–221.Benz, A. O., R. Brajsa, and J. Magdalenic: 2007. Solar Phys. 240, 240–263.Benz, A. O., P. C. Grigis, A. Csillaghy, and P. Saint-Hilaire: 2005. Solar Phys. 226, 121–142.Cane, H. V. and W. C. Erickson: 2005. Astrophys. J. 623, 1180–1194.Cane, H. V., W. C. Erickson, and N. P. Prestage: 2002. J. Geophys. Res. 107, 1315–1333.Cane, H. V. and D. V. Reames: 1988a. Astrophys. J. 325, 895.Cane, H. V. and D. V. Reames: 1988b. Astrophys. J. 325, 901.Cliver, E. W.: 1999. J. Geophys. Res. 104, 4743–4748.Cliver, E. W., N. V. Nitta, B. J. Thompson, and J. Zhang: 2004. Solar Phys. 225, 105–139.Cliver, E. W., D. F. Webb, and R. A. Howard: 1999. Solar Phys. 187, 89–114.Dulk, G. A., Y. Leblanc, T. S. Bastian, and J.-L. Bougeret: 2000. J. Geophys. Res. 105, 27343–27352.Gopalswamy, N.: 2000. In: M. L. G. R. G. Stone, K. W. Weiler and J.-L. Bougeret (eds.): Radio Astronomy at LongWavelengths. Washington, DC, p. 123.
Gopalswamy, N., M. L. Kaiser, R. P. Lepping, S. W. Kahler, D. Ogilvie, T. Berdichevsky, T. Kondo, T. Isobe, and M.Akioka: 1998. J. Geophys. Res. 103, 307.
Holman, G. D., D. Eichler, and M. R. Kundu: 1980. In: M. R. Kundu and T. E. Gergely (eds.): IAU Symposium 86: RadioPhysics of the Sun. Dordrecht, p. 457.
Kundu, M. R.: 1965, Solar Radio Astronomy. New York: Interscience Publishers.Kundu, M. R., V. I. Garaimov, S. M. White, and S. Krucker: 2004. Astrophys. J. 600, 1052–1060.LaBelle, J., R. A. Treumann, P. H. Yoon, and M. Karlicky: 2003. Astrophys. J. 593, 1195–1207.Magdalenic, J., B. Vrsnak, P. Zlobec, M. Messerotti, and M. Temmer: 2005. In: Solar Magnetic Phenomena (Astronomyand Astrophysics Space Science Library, vol. 320). Dordrecht, pp. 259–262.
McLean, D. J. and N. R. Labrum: 1985, Solar Radiophysics. Cambridge: Cambridge University Press.Melrose, D. B.: 1980, Plasma Astrophysics. New York: Gordon and Breach.Melrose, D. B. and G. A. Dulk: 1982. Astrophys. J. 259, 844.Newkirk, G. J.: 1961. Astrophys. J. 133, 983.Pick, M.: 2004. In: D. E. Gary and C. U. Keller (eds.): Solar and Space Weather Radiophysics. Dordrecht, pp. 17–45.Pick, M., P. Demoulin, S. Krucker, O. Malandraki, and D. Maia: 2005. Astrophys. J. 625, 1019–1026.Reames, D. V.: 1999. Space Science Reviews 90, 413–491.Robinson, R. D.: 1985. In: D. J. McLean and N. R. Labrum (eds.): Solar Radiophysics. Cambridge, p. 385.Schwenn, R.: 2006. Living Reviews in Solar Physics 3, 2.Shanmugaraju, A., Y.-J. Moon, M. Dryer, and S. Umapathy: 2003. Solar Phys. 215, 161–184.Wild, J. P., S. F. Smerd, and A. A. Weiss: 1963. Ann. Rev. Astron. Astrophys. 1, 291.Wu, S. T. et al.: 1989. In: M. R. Kundu, B.Woodgate, and E. J. Schmahl (eds.): Energetic Phenomena on the Sun. Dordrecht,p. 379.
Yashiro, S., N. Gopalswamy, S. Akiyama, G. Michalek, and R. A. Howard: 2005. Journal of Geophysical Research (SpacePhysics) 110, A12S05.
Zheleznyakov, V. V.: 1970, Radio Emission of the Sun and the Planets. Oxford: Pergamon Press Ltd.Zlotnik, E. Y., A. Klassen, K.-L. Klein, H. Aurass, and G. Mann: 1998. Astron. Astrophys. 331, 1087–1098.Zlotnik, E. Y., V. V. Zaitsev, H. Aurass, G. Mann, and A. Hofmann: 2003. Astron. Astrophys. 410, 1011–1022.