Page 1
SOLAR STORMS EFFECTS ON NUCLEAR AND
ELECTRICAL INSTALLATIONS 2/17/2018
“There are only two kinds of people who are really fascinating: people who know absolutely everything,
and people who absolutely know nothing.”
Oscar Wilde, Irish author.
INTRODUCTION
The Earth is subject to an 11-year cycle of periods of increased solar activity, as
astronomers have known for centuries. They are associated with visible sun spots on the
surface of the sun. The events begin with thermonuclear explosion on the sun that swell up
and bursts open on the sun’s surface, releasing radiation and charged particles trapped in
the solar wind. The charged particles have a speed of 4 million miles per hour (mph) when
they reach the Earth. In solar flares, the emitted radiation covers the entire electromagnetic
spectrum of radio waves, microwave, x-rays, gamma rays, as well as ultra-violet (UV).
These electromagnetic bursts reach the Earth about eight minutes after leaving the sun.
Proton storms follow taking about four hours to reach the Earth.
The continuous but variable flow of particles and magnetic fields from the sun
creates gusts that can quickly reach the Earth. Within hours, a Coronal Mass Ejection
(CME), accompanied by an Aurora Borealis or “Northern Lights” or an Aurora Australis
or “Southern Lights” bombards the Earth with geomagnetic disturbances.
Solar storms can disrupt communication and navigational equipment, damage
satellites, and even cause blackouts by damaging power plants and electrical grid
components. In 1972, AT&T had to redesign its transatlantic cable power system after a
major solar flare that made interstate phone communication impossible. In 1989, a strong
solar storm knocked out the power grid in Québec, Canada, causing 6 million people to
lose power. Solar storms can bring additional radiation around the north and south poles; a
risk that forces airlines to reroute flights.
Figure 1. Blackout of August 14, 2003, before and after in the central and eastern USA
and Canada. Source: NOAA.
Page 2
Figure 2. Solar flare showing the thermonuclear reactions in sun spots and the magnetic
fields eminences. Source: NASA.
Page 3
Figure 3. Coronal Mass Ejections (CMIs) hitting Earth, May 27, 2017, and February 17,
2018. Source: NOAA.
Page 4
Figure 4. Geomagnetic Planetary K-index at different locations around May 28, 2017. A
coronal mass ejection (CME) produced during the early UTC hours of May 23, 2017 hit
Earth’s magnetic field at 15:36 UTC on May 27, more than 24 hours after it was
expected. Although the solar wind speed was relatively slow, the embedded magnetic
field had a prolonged period of southward Bz that managed to spark a G3 – Strong
geomagnetic storm. Planetary K-index at Boulder, Colorado, February 17, 2018. Source:
NOAA.
POSSIBLE EFFECTS
On July 23, 2012, Earth had a near miss with a Coronal Mass Ejection (CME), from
the most powerful storm on the sun in over 150 years. The Earth missed a direct hit through
lucky timing as the sun’s aim narrowly turned away from the Earth. Had it occurred a week
earlier, it would have hit the Earth.
It is believed a direct CME hit would have the potential to seriously damage the
communication networks, the Global Positioning System (GPS) and electrical grids to
cause widespread blackout. It could disable anything that plugs into a wall socket. Water
supplies largely rely on electric pumps and would also be damaged.
According to a study by the National Academy of Sciences, the total economic
impact could exceed $2 trillion or 20 times greater than the costs of a Hurricane Katrina.
Electrical transformers damaged by such a storm might take years to repair.”
Physicist Pete Riley, published a paper titled “On the probability of occurrence of
extreme space weather events,” that calculated that the odds of a solar storm strong enough
to disrupt our lives in the next 10 years is 12 percent.
Page 5
Figure 5. Solar sunspots cycle prediction. Source: NOAA.
Solar storms have effects on:
1. Radio communications fadeouts,
2. Auroras Borealis and Australis,
3. Disruptions in electrical grid power lines,
4. Disruption in radio transmission,
5. Geomagnetic storms,
6. Ionospheric storms,
7. Radiation hazards to astronauts.
8. Power plants shutdowns.
Page 6
Figure 6. Real time solar storm density, speed and temperature. May 27, 2017. Source:
NOAA.
Page 7
Figure 7. Solar-Terrestrial geomagnetic data. Source: NOAA.
Figure 8. Geomagnetic storm. May 27, 2017. Global view. Storm affected airlines when
British Airways had to cancel all flights. Power outages occurred in Karachi, Pakistan.
Source: NOAA.
Page 8
Figure 9. Geomagnetic storm. May 27, 2017. North American view. Power outages
occurred to Ameren-Illinois, Kenosha, Wisconsin. Source: NOAA.
Under G3 – Strong geomagnetic storm (K-index of 7) threshold, the area of impact
is primarily poleward of 50 degrees Geomagnetic Latitude. Power system voltage
irregularities are possible and false alarms may be triggered on some protection devices.
Spacecraft systems may experience surface charging and increased drag on low Earth-orbit
satellites and orientation problems may occur. Intermittent satellite navigation (GPS)
problems, including loss-of-lock and increased range error may occur. HF (high frequency)
radio may be intermittent, aurora may be seen as low as Pennsylvania to Iowa to Oregon.
SOLAR STORMS PROGRESSION
Solar storms affecting the Earth progress in three stages, not all of which occur in
any given storm:
1. High energy x-rays and ultraviolet radiation ionizes the Earth's upper atmosphere,
interfering with radio communications.
2. Fast protons and electrons charged particles form a radiation storm, potentially affecting
astronauts in Earth orbit.
3. A Coronal Mass Ejection (CME) of slower moving cloud of charged particles that can
take several days to reach the Earth's atmosphere. When a CME hits the Earth’s
atmosphere, the solar particles can interact with the Earth's magnetic field to produce
powerful electromagnetic fluctuations.
The most damaging emissions from solar storms travel slowly enough to be
detected by sun-watching satellites well before the particles strike the Earth’s atmosphere,
giving about 20 hours of warning-time to allow for mitigating measures. For instance,
Page 9
power companies could protect valuable transformers by taking them offline before the
storm strikes. That would produce local blackouts, but they would not last for long.
CORONAL MASS EJECTIONS, CMEs
Coronal mass ejections stream toward Earth at more than 4 million mph. When they
hit the Earth’s magnetic field, they energize it and cause it to fluctuate. In a moderate or
strong storm, these fluctuations can temporarily impair navigation, power, satellite and
other electrical systems.
When such events are imminent, power grid managers and other electrical systems
operators watch space weather forecasts. Satellite operators switch into a standby mode
and temporarily forgo communication between ground control and spacecraft in orbit to
prevent the garbling of messages. Airlines reroute planes that normally follow the fuel-
saving polar routes. Along those routes, pilots depend on High Frequency (HF) radio
communications that are vulnerable to disruptions by space weather.
Expecting a major disruption, on Monday, January 23, 2012 airlines rerouted
airplanes flights away from the poles. Radio communications were hampered by the strong
radiation storm. Some “soft” or correctable errors occurred on satellite systems that are
associated with the solar radiation storm.
SOLAR WIND AND SOLAR STORMS
Figure 10. Solar Coronal Mass Ejection (CME) interaction with The Earth’s magnetic
field. Source: NASA/Goddard.
Page 10
Figure 11. Solar wind and storms interaction with the Earth’s magnetic field. Note that
the sun is one million times the size of the Earth. Source: NOAA.
Figure 12. Charged particles trajectories in the Earth’s magnetic field.
Figure 13. Aurora Borealis space weather forecast, January 24. 2012. The sunlit side of
Earth is indicated by the lighter blue of the ocean. The sub-solar point is also shown as a
yellow dot but only if the sub-solar point is in the view of the chosen image. The day-
Page 11
night line or terminator is shown as a yellow line. The red line about 1,000 km
equatorward of the aurora indicates how far away viewers on the ground might see the
aurora assuming good viewing conditions. Source: NOAA.
Figure 14. Aurora Borealis space weather forecast, January 24. 2012. The graph shows
the intensity and location of the aurora as expected for the time shown at the bottom of
the map. The forecast is based on current solar wind conditions and the average time for
the solar wind to propagate from the ACE satellite at L1 to Earth. The model produces an
estimate of the intensity of the aurora. In this product a linear relationship between
intensity and viewing probability is assumed. This relationship is validated by
comparison with data from the UVI instrument on the NASA POLAR Satellite. Source:
NOAA.
Figure 15. Aurora Borealis in Tromsoe, Northern Norway from the January 2012 event.
Source: NOAA.
Page 12
Figure 16. GOES Satellite 5-minute averaged integral proton flux (protons/cm2-s-sr) as
measured by the SWPC primary GOES satellite for energy thresholds of >=10, >=50, and
>=100 MeV. SWPC's proton event threshold is 10 protons/cm2-s-sr at >=10 MeV. Large
particle fluxes have been associated with satellite single event upsets (SEUs). Source:
NOAA.
A solar storm has a bow shock that is stopped by the Earth’s protective
magnetosphere. The magnetic cloud of plasma can extend to 30 million miles in width by
the time it reaches the Earth.
The magnetic field orientation of a Coronal Mass Ejection (CME) is a major factor
as to whether the Earth will suffer many consequences from any given CME. After a CME
blasts from the sun towards Earth, a cloud of charged particles impacts our magnetosphere
within 2 to 4 days.
Figure 17. Coronal Mass Ejection (CME) 2002. Source: Solar Dynamic Observatory
(SDO) NASA.
Page 13
Figure 18. Coronal Mass Ejection (CME), June 7, 2011. Source: Solar Dynamic
Observatory (SDO) NASA.
The Earth is effectively electrically connected to the sun by a large-scale circuit.
The consequences are dramatic: disruptions to communications satellites, interference with
Global Positioning Systems (GPS) and air traffic control. The phenomenon can take down
the high-voltage electric transmission system over wide swaths of the planet, blacking-out
more than 130 million people in the USA alone.
Secondary effects due to the loss of the electrical grid involve nuclear power plants
shutdowns, water system failures, severe disruptions to natural gas pipelines, factories shut
down for weeks or months, food rotting in unrefrigerated warehouses, and costs to the
world economy. The cost of the damage caused by a CME to the USA could total $1-2
trillion. More than 300 grounded electrical high-voltage transformers in the USA suffer
damages so serious that they need to be replaced, putting intolerable strain on an already
stressed supply chain.
Recovery takes as much as a decade, as the results would wreak havoc with the
USA and world infrastructure and economy. This is fact, not science fiction according to
the office of emergency response at the Federal Energy Regulatory Commission (FERC).
It occurred before but with far less severe economic consequences. It is likely to happen
again following a higher activity in the solar cycle.
EFFECT ON NUCLEAR POWER PLANTS
In 1989 a solar storm affected the Salem Pressurized Water Reactor (PWR) in New
Jersey. The 1,160 MWe Salem-1 nuclear power plant is located on an artificial island at
the mouth of the Delaware River, along with two other nuclear units.
Page 14
The solar storm induced a large current into the PJM 500-kV transmission system,
which damaged the Salem Unit 1 step-up transformer, resulting in a large melted mass of
copper and copper shot.
The transformer’s winding insulation confined the damage, and the plant did not
trip-off during the solar flare. The plant operators discovered the damage after the storm.
The transformer had to be replaced, at a cost of millions of dollars.
GEOMAGNETICALLY INDUCED CURRENT (GIC)
As the charged solar particles in the solar wind arrive at the Earth, they cause rapid
fluctuations of the Earth’s geomagnetic field. Induced Earth-surface potential and
Geomagnetically Induced Currents (GICs), occur. GIC appears as a quasi-DC current or
an AC waveform with a period of several minutes and appears as a DC current to the bulk
electric grid system.
The consequences of this DC current are to drive transformer cores into saturation.
This causes significant heating from stray flux, increases the Volts Ampère Reactive
(VAR) power losses that depress system voltages, and can damage the transformer itself.
MULTIPLE CONTINCENCY INCIDENT (MCI)
The induced currents can precipitate a Multiple Contingency incident (MCI) which,
under certain operating conditions, can jeopardize the integrity of the bulk electric systems
in North America.
The harmonic currents can cause the over-current relays to trip the capacitor banks
because capacitors offer a lower impedance path for the harmonics. The static VAR power
compensators can trip for over-current or over-voltage protection.
The complex events resulting from the induced currents can take the electrical
generators down along with the whole electric grid, as the electrical generators are not
immune to the harmonic currents. Those units that do not trip are still susceptible to damage
from turbine blade vibrations and possible blades ejection.
EFFECT ON THE NORTH AMERICAN POWER GRID, 1989
When a solar storm strikes the Earth’s magnetosphere, it creates a gust in the solar
wind. On Friday March 10, 1989 such a storm affected northern Canada in a matter of days.
The arrival of the solar particles caused severe disturbances in the planet’s magnetic field.
According to a description by NASA:
“On Friday March 10, 1989, astronomers witnessed a powerful
explosion on the sun. Within minutes, tangled magnetic forces on the sun
had released a billion-ton cloud of gas. It was like the energy of thousands
of nuclear bombs exploding at the same time. The storm cloud rushed out
from the sun, straight towards Earth, at a million miles an hour. The solar
flare that accompanied the outburst immediately caused short-wave radio
interference, including the jamming of radio signals from Radio Free
Page 15
Europe into Russia. It was thought that the signals had been jammed by the
Kremlin, but it was only the sun acting up!”
On March 13, 1989 seven static VAR compensators on Hydro-Québec’s, HQ giant
La Grande high-voltage transmission network shut down in a matter of seconds. An
induced direct current from the solar storm caused the transmission system voltage to drop,
frequency to rise, and the line to trip off.
The rest of the HQ transmission system collapsed in seconds. It took nine hours to
restore 18,000 MWe of power to the network. The solar storm left considerable wreckage
in its path, including two La Grande 4 generating station step-up transformers, thyristor
and capacitor banks at several units, and static VAR compensators across the system that
were damaged or destroyed.
The effects on the North American electrical grid that connects Canada and the
USA, except for the state of Texas that is connected to the Mexico’s electrical power grid,
were significant.
The Québec blackout was not localized. Some of the USA electrical utilities were
affected. New York Power Authority lost 150 MWe of capacity the moment the Québec
power grid collapsed. The New England Power Pool lost 1,410 MWe at about the same
time. Service to 96 electrical utilities in New England was interrupted while other reserves
of electrical power were brought online.
The USA had some excess spare capacity at the time. Across the USA, 200 power
grid problems erupted within minutes of the start of the March 13, 1989 solar storm,
without causing a complete blackout.
EFFECT ON COMMUNICATION SATELLITES
Some communication satellites tumbled out of control in space for several hours.
NASA’s TDRS-1 communication satellite recorded over 250 anomalies as high-energy
particles impacted the satellite’s sensitive electronics.
In the Space Shuttle Discovery, a sensor on one of the tanks supplying hydrogen to
a fuel cell was showing unusually high pressure readings on March 13, 1989. The problem
went away just as mysteriously after the solar storm subsided.
Of particular concern are disruptions to the Global Positioning System (GPS),
which has become ubiquitous in cellular phones, ships, airplanes, and automobiles. A $13
billion industry in 2003, the GPS system is predicted to grow to nearly $1 trillion by 2017.
GLOBAL EFFECTS, 1989
Large geomagnetic storms can have a global reach and produce impacts to other
developed power grids around the world. In the UK, the March 10, 1989 storm is suspected
to have caused damage to two 400 kV transformers. Since 1989, the operators of the UK
power system equipped their grid with transmission system static VAR and switched-
capacitance devices for system voltage regulation. This makes their system less vulnerable
to future geomagnetic storms.
Page 16
Recent and lower intensity storms reached the Southern Hemisphere producing
lower intensity, but long duration GIC disturbances in South Africa that caused permanent
damages and loss of 15 EHV transformers in the South African Eskom system.
EARLIER SOLAR STORMS EVENTS, 1859, 1921, 2003
The 1859 largest known storm, called the “Carrington Event,” after the British
astronomer Richard Carrington struck Earth. During the Carrington Event, Northern Lights
were reported as far south as Cuba and Honolulu, while Southern Lights were seen as far
north as Santiago, Chile. The flares were so powerful that people in the northeastern USA
could read newspaper print just from the light of the aurora borealis. The geomagnetic
disturbances were strong enough that USA telegraph operators reported sparks leaping
from their equipment, with some setting equipment fires.
A space storm's impact is measured in nano-Teslas (nT). The lower the figure, the
more powerful the storm. A moderate storm is around -100 nT; extreme storms log in
around -300 nT. The Carrington solar storm was three times more powerful than the
strongest space storm in modern memory; the one that cut power to an entire Canadian
province, Québec, in 1989. The 1989 coronal mass ejection that centered on Québec
measured -589 nT. Carrington’s 1859 solar storm was estimated to have been -1,760 nT.
Another solar storm struck the Earth in May 1921, causing substantial destruction.
Government experts have defined the 1921 storm as a 1 in a 100 years event. This does not
mean it cannot happen more frequently than that, but gives an indication of its severity.
A minor solar storm in October-November 2003 took down the USA Federal
Aviation Administration’s new Global Positioning System, GPS-based navigation system
for 30 hours and damaged electrical systems from Scandinavia to South Africa. These
"Halloween Storms" of 2003 interfered with satellite communications, produced a brief
power outage in Sweden, and lighted up the skies with ghostly auroras as far south as
Florida and Texas.
SOLAR STORM, 2011
Figure 19. Solar storm on February 16, 2011. Source: NOAA.
Page 17
Bright and dark regions of the sun in appeared in a solar x-ray image at the NOAA's
Space Weather Prediction Center showed enhanced solar wind on February 16, 2011 with
magnetic storminess. Effects included temporary radio blackouts, re-routed airplanes,
increased risk of damage to electrical grids and satellites and brilliant auroras.
SOLAR STORM, MARCH 2012
On March 6, 2012, X-class flares occurred. A double burst on March 6, 2012 was
followed by another X1.1-class flare. A Coronal Mass Ejection (CME) associated with the
R3 (Strong) Radio Blackout event from 0024 UTC March 7 (7:24 p.m. EST March 6)
continued to affect the Earth and G3 (Strong) storming levels were observed. The magnetic
field orientation needed to cause strong geomagnetic storming did occur overnight. It got
off to a slow start and reached predicted levels. The Solar Radiation Storm levels remained
at the S2 (Moderate) levels, flattening out in response to a new, R2 (Moderate) solar flare
occurring at 0353 UTC March 9 (10:53 p.m. EST March 8). This R2 event had an
associated CME with a resulting geomagnetic storm.
Figure 20. Solar flare visual picture on March 5, 2012 at the 11429 location. Source:
NOOA.
Page 18
Figure 21. Infrared and x-ray pictures of the March 5, 2012, showing onset of the Coronal
Mass Ejection. Source: NOAA.
Figure 22. Plot showing three days of 5-minute solar x-ray flux values measured on the
SWPC primary GOES satellite. One low value may appear prior to eclipse periods.
Source: NOAA.
EFFECT ON MODERN ELECTRICAL SYSTEMS,
INTERCONNECTEDNESS, CASCADE FAILURE
The big concern from solar flare is their possible impact on the electrical grid, since
power surges caused by solar particles could blow out giant transformers. Such
transformers can take a long time to replace, especially if hundreds are destroyed at once.
Page 19
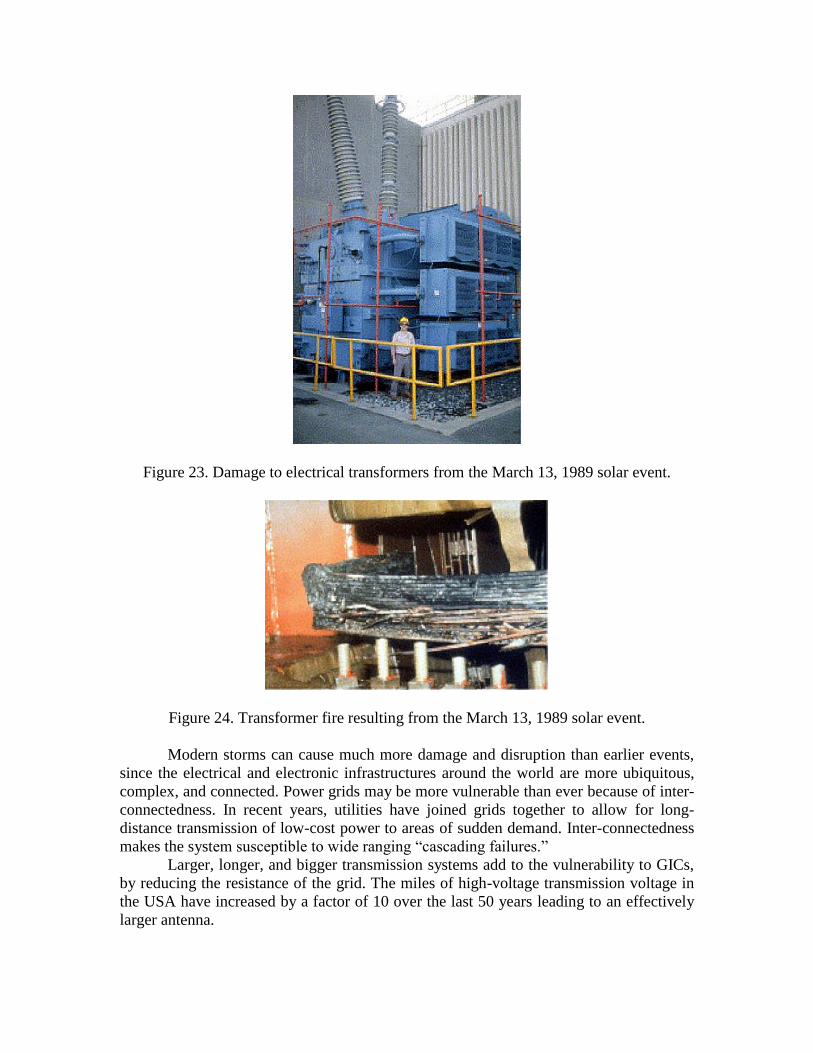
Figure 23. Damage to electrical transformers from the March 13, 1989 solar event.
Figure 24. Transformer fire resulting from the March 13, 1989 solar event.
Modern storms can cause much more damage and disruption than earlier events,
since the electrical and electronic infrastructures around the world are more ubiquitous,
complex, and connected. Power grids may be more vulnerable than ever because of inter-
connectedness. In recent years, utilities have joined grids together to allow for long-
distance transmission of low-cost power to areas of sudden demand. Inter-connectedness
makes the system susceptible to wide ranging “cascading failures.”
Larger, longer, and bigger transmission systems add to the vulnerability to GICs,
by reducing the resistance of the grid. The miles of high-voltage transmission voltage in
the USA have increased by a factor of 10 over the last 50 years leading to an effectively
larger antenna.
Page 20
SOCIETAL AND ECONOMIC IMPACTS, PREPAREDNESS
Considering the potential effects of an event similar of the May 1921 storm on the
modern USA grid system, the risks involved loss of more than 350 high-voltage
transformers and power outages to more than 130,000 million Americans.
The loss of electricity would spread across the physical infrastructure and would
include water distribution affected within several hours; perishable foods and medications
lost in 12-24 hours; loss of heating/air conditioning, sewage disposal, phone service, and
fuel re-supply.
The threat of geomagnetic storms is well understood in the electrical utility
industry, and much effort is being devoted to understanding and preparing for this
contingency.
Figure 25. Solar storms effects on the Earth’s protective Van Allen magnetic fields.
Source: NASA.
The Electric Power Research Institute, EPRI has been devoting considerable effort
to studying geomagnetic storms since the 1989 event. It has produced voluminous work on
the impacts of solar storms on electric systems, working through its SUNBURST project,
which aims to “monitor, study, and mitigate” geomagnetically-induced currents on the
power grid.
With the solar cycle just passing the minimum and solar storm activity at a 50-year
record low in 2010, it was easy to temporarily forget about solar storms and GICs.
HIGH IMPACT LOW FREQUENCY (HILF) EVENTS
Page 21
Solar storms, though potentially catastrophic, are not very predictable, in either
frequency or strength. They represent what the utility industry calls High-Impact Low-
Frequency (HILF) risks.
Solar storms are grouped with electromagnetic pulse events, which might be caused
by the detonation of nuclear devices in the upper atmosphere by an adversary hoping to
take down the high-voltage grid by causing an Electro Magnetic Pulse (EMP) event.
Other HILF risks in the utility planning process include conventional weather
effects, including tornadoes and hurricanes.
Utilities have spent large amounts on preparations for HILF risks, but passing costs
on to customers, either in advance, or after a catastrophe, will be difficult in a political
environment characterized by an anti-rate-increase attitude.
The insurance company Zürich Services Corporation published an analysis of the
exposure of various industries to solar storms, including the prospect of replacing large
high-voltage, grounded transformers at $10 million a pop. The study concluded that a large
solar storm would be an event “beyond insurance.”
RECOVERY TRANSFORMERS, RecX PROJECT
EPRI and the Department of Homeland Security, DHS worked on a project to
design prototype recovery transformers that could temporarily replace damaged equipment
after a storm.
The Recovery Transformer, RecX Project would build and pre-position truck-
mounted single-phase 345 kV transformers as temporary fixes if a conventional three-
phase, 345- kV machine were damaged.
The idea is to design a transformer that is smaller and easier to transport and quick
to install. The goal of the project is to produce solid-state transformers that are smaller and
lighter and could be transported by helicopter.
Storms 10 times worse than the 1989 event can occur and have occurred and offer
a significant challenge since it would be the largest natural disaster the USA could face and
needs to survive.
HIGH-ALTITUDE NUCLEAR ELECTROMAGNETIC PULSE
(HEMP); NUCLEAR ELECTROMAGNETIC PULSE (NEMP), HIGH
POWER RADIO FREQUENCY (HPRF) DEVICES
In the Information Age, a Nuclear EMP attack that can disable the communications
and computer networks and hence eliminate the second strike retaliatory ability of a
potential opponent against a first strike, falls under the category of electronic warfare or
information warfare, not nuclear warfare. The military doctrines of China and Russia
define information warfare as embracing a spectrum ranging from computer viruses to
nuclear NEMP attack. A state adopting a no-first-use policy, such as India, is compelled to
implement robust NEMP protections. A country that has lost its advanced technology
capabilities to a NEMP attack, short of surrendering, would end up fighting with tactics
and technology going back to the 19th century at a great disadvantage. India, Pakistan, and
Page 22
Israel possess missiles and nuclear weapons giving them the capability to make NEMP
attacks against their regional adversaries.
An article in the “Indian Express” on 17 September 17, 1999, by a member of
India’s Institute of Defense Studies Analysis openly advocates that India be prepared to
make a preemptive NEMP attack, both for reasons of military necessity and on
humanitarian grounds:
“A study conducted in the U.S. during the late 1980s reported that a
high-yield device exploded about 500 kilometers above the ground can
generate an electromagnetic pulse (EMP) of the order of 50,000 volts over
a radius of 2,500 kilometers around the point of burst which would be
collected by any exposed conductor. Such an attack will not cause any blast
or thermal effects on the ground below but it can produce a massive
breakdown in the communications system....It is certain that most of the
land communication networks and military command control links will be
affected and it will undermine our capability to retaliate. This, in fact, is the
most powerful incentive for a preemptive attack. And a high-altitude exo-
atmospheric explosion may not even kill a bird on the ground.”
An NEMP attack is regarded by some analysts as a legitimate use of nuclear
weapons, because NEMP would inflict no or few prompt civilian casualties. A NEMP
attack appears to be a unique exception to the general stigma attached to nuclear weapons
use by most of the international community in public statements. Some analysts in Japan
and Germany; nations that historically have been most condemnatory of nuclear and other
weapons of mass destruction in official and unofficial forums appear to regard an NEMP
attack as morally defensible and a legitimate use of nuclear devices.
The USA’s 1.44 Mt of TNT equivalent W49 warhead used for the “Starfish Prime”
high-altitude test E3 component could have produced more than 5000 nTesla/min field
strength. A disturbance in the USA of 4800 nTesla/min is estimated to likely damage about
365 large transformers in the power grid, and would leave about 40 percent of the USA
population without electrical power for as long as 4 to 10 years due to the loss of large
transformers that would have to be custom-built in other countries if power was not
available for the two USA plants that are able to make these transformers [3].
Page 23
Figure 26. “Starfish Prime” nuclear test on July 8, 1962, a part of “Operation Fishbowl,”
at Johnston Island as observed at Honolulu, Hawaii, 897 miles away. It damaged 300
street lights [3].
Underground power lines can be affected. Overhead power lines wire insulators
would be damaged, resulting in a short circuit on the power lines and some power lines
detaching from the poles and falling to the ground.
At a testimony before the USA Congress House Armed Services Committee on
October 7, 1999, Dr. Lowell Wood, describing the Starfish Prime and the related EMP-
producing nuclear tests in 1962, stated [3]:
“Most fortunately, these tests took place over Johnston Island in the
mid-Pacific rather than the Nevada Test Site, or electromagnetic pulse
would still be indelibly imprinted in the minds of the citizenry of the western
U.S., as well as in the history books. As it was, significant damage was done
to both civilian and military electrical systems throughout the Hawaiian
Islands, over 800 miles away from ground zero. The origin and nature of
this damage was successfully obscured at the time -- aided by its mysterious
character and the essentially incredible truth.”
REFERENCES
1. Kennedy Maize, “The Great Solar Storm of 2012?” Power, January, 2, 2011.
2. V. J. Pizzo, S. M. Hill, C. C. Balch, D. A. Biesecker, P. Bornmann, E. Hildner, R. N.
Grubb, E. G. Chipman, J. M. Davis, K. S. Wallace, K. Russell, S. A. Cauffman, T. T. Saha,
and G. D. Bethiume, “The NOAA GOES-12 Solar X-ray Imager (SXI) 2. Performance,
Solar Physics, 226:283-315, 2005.
Page 24
3. Jerry Emanuelson, “An Introduction to Nuclear Electromagnetic Pulse,” Future
Science, http://www.futurescience.com/emp.html
APPENDIX I
VOLT AMPERE REACTIVE, APPARENT POWER Q
In Alternating Current, AC power transmission and distribution, the Volt Ampère
Reactive power or VAR is a unit used to measure the apparent reactive power Q in an AC
electric power system where:
Reactive Power Q =V .A sin
where:V = rms voltage
A = rmscurrent
= phase angle between voltage and current
rms rms
rms
rms
(1)
Since AC power has a varying voltage, efficient power systems must vary the
current in synchrony with the voltage.
VARs measure the unsynchronized “leading or “lagging” currents. VARs are the
product of the root mean square, rms voltage and current, or the apparent power, multiplied
by the sine of the phase angle between the voltage and the current.
When the phase angle between the load voltage and load current is out of phase by
90 degrees, this defines the VAR-reactive as:
VAR =V .A sin 90 V .A [Volt.Ampere]o
rms rms rms rms (2)
Note that the apparent power Q is different from the real power P.
APPENDIX II
NOAA SPACE WEATHER SCALE FOR GEOMAGNETIC STORMS
The K index is a 3-hourly quasi-logarithmic local index of geomagnetic activity
relative to an assumed quiet-day curve for the recording site. Its range is from 0 (quiet) to
9 (severely disturbed). The K index measures the deviation of the most disturbed
component.
The Kp is an index used to indicate the severity of the global magnetic disturbances
in near-Earth space. It is based on the average of weighted K indices at 13 ground magnetic
field observatories. It is based on the range of the magnetic field variation within 3 hour
intervals that is caused by phenomena other than the diurnal variation and the long-term
components of the storm time variations. The values of the Kp range from 0 (very quiet)
to 9 (very disturbed) in 28 discrete steps, resulting in values of 0, 0+, 1-, 1, 1+, 2-, 2, 2+,...9.
An Estimated Kp is calculated by NOAA in near-real-time. The official, after-the-
fact, 3-hourly planetary index of geomagnetic activity is calculated twice per month by the
Page 25
German GeoForschungsZentrum (GFZ) (Research Center for Geosciences), from the K
indexes observed at 13 stations primarily in the Northern Hemisphere. The Kp indices,
which date from 1932, are used to determine the ap indices.
The ap index in turn is a mean, 3-hourly “equivalent amplitude” of magnetic
activity based on K index data from a planetary network of 11 Northern and 2 Southern
Hemisphere magnetic observatories between the geomagnetic latitudes of 46° and 6° by
the lnstitut fur Geophysik at Göttingen, Germany; ap values are given in units of 2 nT.
Category Effect Physical
measure
Average
Frequency
(1 cycle =
11 years)
Scale Descriptor Duration of event will influence severity of effects
Geomagnetic Storms Kp
values*
Number of
storm
events when
Kp level
was met;
(number of
storm days)
G 5 Extreme Power systems: Widespread voltage control problems and
protective system problems can occur, some grid systems may
experience complete collapse or blackouts. Transformers may
experience damage.
Spacecraft operations: May experience extensive surface
charging, problems with orientation, uplink/downlink and tracking
satellites.
Other systems: Pipeline currents can reach hundreds of amps,
High Frequency (HF) radio propagation may be impossible in
many areas for one to two days, satellite navigation may be
degraded for days, low-frequency radio navigation can be out for
hours, and aurora has been seen as low as Florida and southern
Texas (typically 40° geomagnetic lat.)**.
Kp = 9 4 per cycle
(4 days per
cycle)
G 4 Severe Power systems: Possible widespread voltage control problems and
some protective systems will mistakenly trip out key assets from
the grid.
Spacecraft operations: May experience surface charging and
tracking problems, corrections may be needed for orientation
problems.
Other systems: Induced pipeline currents affect preventive
measures, HF radio propagation sporadic, satellite navigation
degraded for hours, low-frequency radio navigation disrupted, and
aurora has been seen as low as Alabama and northern California
(typically 45° geomagnetic lat.)**.
Kp = 8,
includin
g a 9-
100 per
cycle
(60 days per
cycle)
G 3 Strong Power systems: Voltage corrections may be required, false alarms
triggered on some protection devices.
Spacecraft operations: Surface charging may occur on satellite
components, drag may increase on low-Earth-orbit satellites, and
corrections may be needed for orientation problems.
Other systems: Intermittent satellite navigation and low-frequency
radio navigation problems may occur, HF radio may be
intermittent, and aurora has been seen as low as Illinois and Oregon
(typically 50° geomagnetic lat.)**.
Kp = 7 200 per
cycle
(130 days
per cycle)
Page 26
G 2 Moderate Power systems: High-latitude power systems may experience
voltage alarms, long-duration storms may cause transformer
damage.
Spacecraft operations: Corrective actions to orientation may be
required by ground control; possible changes in drag affect orbit
predictions.
Other systems: HF radio propagation can fade at higher latitudes,
and aurora has been seen as low as New York and Idaho (typically
55° geomagnetic lat.)**.
Kp = 6 600 per
cycle
(360 days
per cycle)
G 1 Minor Power systems: Weak power grid fluctuations can occur.
Spacecraft operations: Minor impact on satellite operations
possible.
Other systems: Migratory animals are affected at this and higher
levels; aurora is commonly visible at high latitudes (northern
Michigan and Maine)**.
Kp = 5 1700 per
cycle
(900 days
per cycle)
* The Kp-index used to generate these messages is derived from a real-time network of observatories the report data to
SWPC in near real-time. In most cases the real-time estimate of the Kp index will be a good approximation to the official
Kp indices that are issued twice per month by the German GeoForschungsZentrum (GFZ) (Research Center for
Geosciences).
** For specific locations around the globe, use geomagnetic latitude to determine likely sightings
APPENDIX III
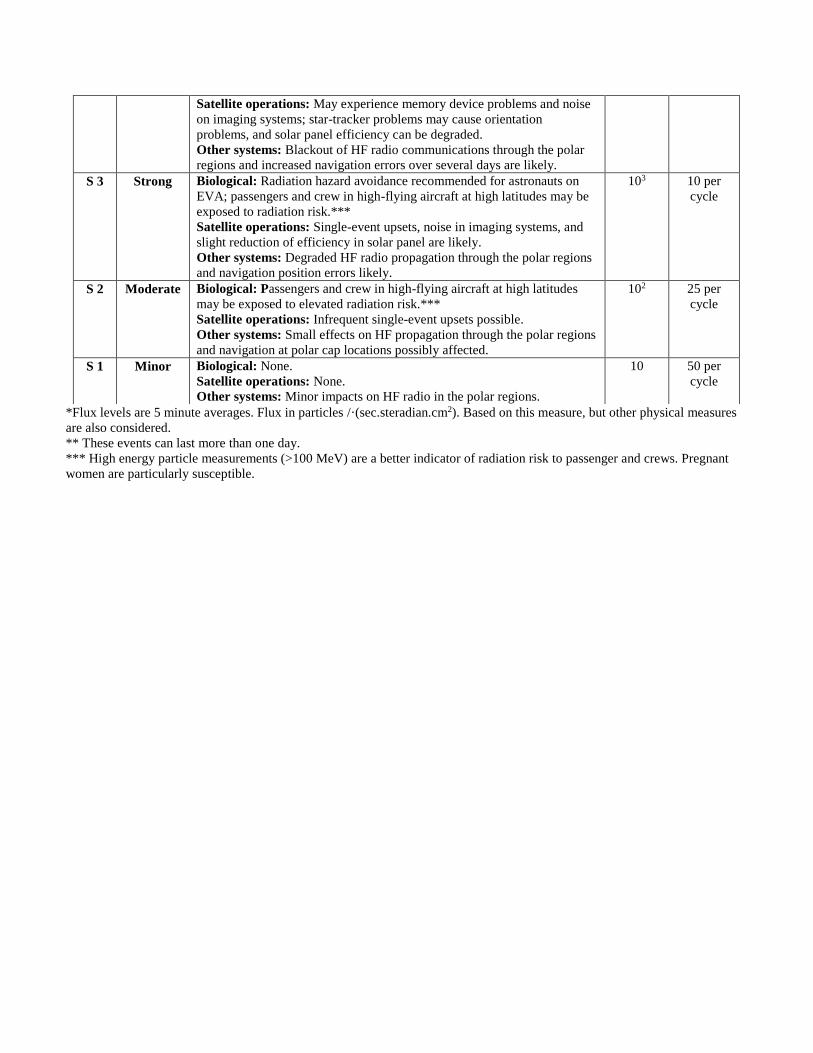
NOAA SPACE WEATHER SCALE FOR SOLAR RADIATION
STORMS
Category Effect Physical
measure
Average
Frequency
(1 cycle =
11 years)
Scale Descriptor Duration of event will influence severity of effects
Solar Radiation Storms
Flux
level of
>= 10
MeV
particles
(ions)*
Number
of events
when flux
level was
met
(number
of storm
days**)
S 5 Extreme Biological: Unavoidable high radiation hazard to astronauts on Extra-
Vehicular Activity (EVA); passengers and crew in high-flying aircraft at
high latitudes may be exposed to radiation risk.***
Satellite operations: Satellites may be rendered useless, memory impacts
can cause loss of control, may cause serious noise in image data, star-
trackers may be unable to locate sources; permanent damage to solar
panels possible.
Other systems: Complete blackout of High Frequency (HF)
communications possible through the polar regions, and position errors
make navigation operations extremely difficult.
105 Fewer
than 1 per
cycle
S 4 Severe Biological: Unavoidable radiation hazard to astronauts on EVA;
passengers and crew in high-flying aircraft at high latitudes may be
exposed to radiation risk.***
104 3 per
cycle
Page 27
*Flux levels are 5 minute averages. Flux in particles /·(sec.steradian.cm2). Based on this measure, but other physical measures
are also considered.
** These events can last more than one day.
*** High energy particle measurements (>100 MeV) are a better indicator of radiation risk to passenger and crews. Pregnant
women are particularly susceptible.
Satellite operations: May experience memory device problems and noise
on imaging systems; star-tracker problems may cause orientation
problems, and solar panel efficiency can be degraded.
Other systems: Blackout of HF radio communications through the polar
regions and increased navigation errors over several days are likely.
S 3 Strong Biological: Radiation hazard avoidance recommended for astronauts on
EVA; passengers and crew in high-flying aircraft at high latitudes may be
exposed to radiation risk.***
Satellite operations: Single-event upsets, noise in imaging systems, and
slight reduction of efficiency in solar panel are likely.
Other systems: Degraded HF radio propagation through the polar regions
and navigation position errors likely.
103 10 per
cycle
S 2 Moderate Biological: Passengers and crew in high-flying aircraft at high latitudes
may be exposed to elevated radiation risk.***
Satellite operations: Infrequent single-event upsets possible.
Other systems: Small effects on HF propagation through the polar regions
and navigation at polar cap locations possibly affected.
102 25 per
cycle
S 1 Minor Biological: None.
Satellite operations: None.
Other systems: Minor impacts on HF radio in the polar regions.
10 50 per
cycle