March 2009 Solar Survey A Collaboration between the City of San Diego and the California Center for Sustainable Energy Funded Through the U.S. Department of Energy's Solar America Cities Partnership
Transcript
March 2009
Solar Survey A Collaboration between the City of San Diego and the
California Center for Sustainable Energy Funded Through the
U.S. Department of Energy's Solar America Cities Partnership
3. Next Steps ........................................................................................................... 18
3.1 Focus Group Follow-up Questions ................................................................ 19
3.2 Best in Class in California ............................................................................ 20
2
1 Overview
1.1 Purpose
The purpose of the survey was to understand the motivation, challenges and
benefits perceived by individuals who decided to install solar systems in the City
of San Diego. Approximately 2000 surveys were sent, and 641 surveys were
completed. The primary response was from the residential sector. Individuals
had the option to reply electronically, using Survey Monkey, or to complete a
paper survey. All responses were combined and checked to ensure that there were
no duplicates.
1.2 Conclusions from Data
Based on the responses of 641 individuals and businesses with solar installed on
their properties, the following conclusions have been made:
1. Traditional media does not appear to be very effective in promoting installation of solar power. Only 4% of respondents indicated that they found a solar installer using TV, radio, or print media advertisements. More than 50% of respondents said that they used the internet or personal referrals to find their solar installer. (See Question 3.)
2. Subsidies and tax incentives continue to be a critical factor in deciding whether to purchase solar. Respondents indicated that their primary reason for installing solar was “to reduce the electric bill”. However, without a rebate, no more than 20% of respondents would have installed solar panels. (See Question 6.)
3. There are three key barriers identified in the solar installation process: 1) permitting & inspections; 2) technical issues; and 3) availability of solar panels. It should be noted that 56% of the respondents stated that they did not encounter any barriers. Sixteen percent identified the knowledge of City staff reviewing the permits, as well as the inspection time and cost, as a barrier. This is tied to contractors’ knowledge, experience, and familiarity with the permitting process. The City may reduce this barrier by improving the training of solar permitting staff and developing
3
outreach programs which target solar system designers and installers. (See Question 5.)
4. Incentives for residents and businesses to produce beyond 100% of their electricity needs would be extremely useful. Many respondents indicated that they desired a larger system, but the finances did not work out because SDG&E does not pay net producers. (See Questions 5 and 11.)
5. Greater emphasis needs to be placed on performing energy efficiency audits and upgrades in conjunction with solar PV system installation. Thirteen percent of respondents said they did no energy efficiency upgrades in conjunction with their system installation. (See Question 7.)
4
2 Analysis
1. How many years have you occupied this property?
Total Respondents: 466
0
10
20
30
40
50
60
70
80
90
100
0-2
3-4
5-6
7-8
9-1
0
11
-12
13
-14
15
-16
17
-18
19
-20
21
-22
23
-24
25
-26
27
-28
29
-30
31
-32
33
-34
35
-36
37
-38
39
-40
41
-42
43
-44
45
-46
47
-48
49
-50
50
+
Nu
mb
er
of
Re
spo
nd
en
ts
Years Occupied
Building Occupancy Time Histogram
0.00
1.00
2.00
3.00
4.00
5.00
6.00
2001 2002 2003 2004 2005 2006 2007 2008
Average System Size of Respondents
5
2. Who purchased the solar installation for this property?
Number of Responses: 466
Decisions seem to be personally motivated. While 83% said it was their own decision to put solar on their building, many of those who responded “Builder Install” mentioned that solar was an upgrade option. This indicates a personal buying decision, which means that the true “personal decision” component comprises up to 92% of responses.
83%
9%
7%1%
Who purchased the solar installation for this property?
Current Owner
Builder
A Previous Owner
Other (please explain)
6
3. How did you find your solar installer?
Number of Responses: 405
Based on the response data:
o The internet and personal referrals were the predominant method for selecting an installer (25% and 27% respectively). A professional reference was the third strongest response, representing 11% of the total.
o Traditional media (TV, radio, and print) only had 18 total responses (4%).
o Based on survey data, direct mail and cold calls represented the least effective method with zero responses
o Overall 48% of responses show a preference for personal interaction through recognized retailers, information distributors, personal referrals, and fairs / home shows.
22
0
28
35
35
108
10
46
8
12
101
0 20 40 60 80 100 120
California Center for Sustainable Energy …
Direct Mail / Cold Call
Fair / Home Show
In-Store Display
Other (please explain)
Personal Reference
Print Ad
Professional Reference
Radio/Television
Self Install
Yellow pages / Internet search engine
How did you find your solar installer?
7
4. Were you satisfied with the solar installation process?
Number of Responses: 398
The majority of respondents were satisfied with the installation process. This may indicate that the majority of solar installers are knowledgeable and efficient.
Of the 5% who said “No”, the primary reasons included:
o inexperience
o Length of time to install was longer than expected
Yes95%
No5%
Were you satisfied with the solar installation process?
8
5. What, if any, were some barriers you encountered? (multiple responses possible)
Number of Responses: 511
Results show that 56% of respondents felt there were no barriers to a solar installation.
The most common single response was permitting issues.
0.00
0.05
0.10
0.15
0.20
2001 2002 2003 2004 2005 2006 2007 2008
Average Permitting Barriers per Response
0.00
0.20
0.40
0.60
0.80
2001 2002 2003 2004 2005 2006 2007 2008
Average Barriers per Response
286
30
44
34
17
14
22
25
10
8
5
16
0 50 100 150 200 250 300 350
None
Cost
Permitting
Inspections
Availability of Solar Panels
Shading
Roof Orientation
Installer
Electric Panel
Home Owner's Association
Inverter
Other
What, if any, were some of the barriers you encountered when installing solar? (multiple responses possible)
9
Sixteen percent indicated that the permitting and inspection process was an impediment to the solar installation. This is a shared responsibility between City staff and installers to be knowledgeable about the permitting requirements.
The HOA barrier was not significantly large; however this may be another area in which the City can intercede to support solar.
Technical issues:
o Four percent indicated shading and roof orientation issues. Increased outreach to builders and architects regarding building orientation and shading issues could help reduce these barriers.
o Eight percent indicated that the installer’s knowledge, the inverter, and/or the electrical panel were barriers.
o Three percent responded that availability of the solar modules was an issue for them.
Since multiple responses were possible, those that chose “Other” were usually follow-up comments expanding on the designated list of options they selected.
10
6. Would you have installed your solar system without a rebate offered?
Number of Responses: 401
Results indicate that while 21% of individuals would still purchase solar panels without a rebate or subsidy, these incentives are still the main driver in making the final decision to install solar.
Over time there has been little change in the percent of individuals who would have installed solar without a rebate.
Yes21%
No79%
Would you have installed your solar system without a rebate offered?
0%
10%
20%
30%
40%
50%
60%
70%
80%
90%
100%
2001 2002 2003 2004 2005 2006 2007 2008
Would you have installed without incentives?
No
Yes
11
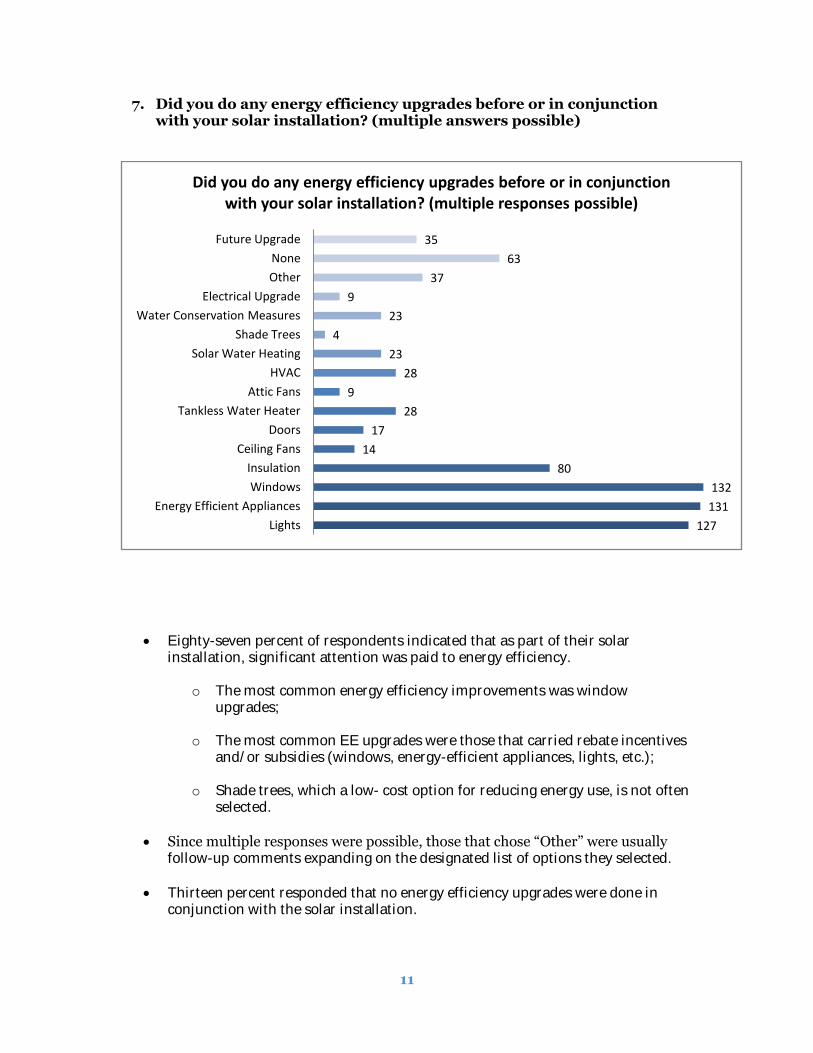
7. Did you do any energy efficiency upgrades before or in conjunction with your solar installation? (multiple answers possible)
Eighty-seven percent of respondents indicated that as part of their solar installation, significant attention was paid to energy efficiency.
o The most common energy efficiency improvements was window
upgrades;
o The most common EE upgrades were those that carried rebate incentives and/or subsidies (windows, energy-efficient appliances, lights, etc.);
o Shade trees, which a low- cost option for reducing energy use, is not often selected.
Since multiple responses were possible, those that chose “Other” were usually follow-up comments expanding on the designated list of options they selected.
Thirteen percent responded that no energy efficiency upgrades were done in conjunction with the solar installation.
127
131
132
80
14
17
28
9
28
23
4
23
9
37
63
35
Lights
Energy Efficient Appliances
Windows
Insulation
Ceiling Fans
Doors
Tankless Water Heater
Attic Fans
HVAC
Solar Water Heating
Shade Trees
Water Conservation Measures
Electrical Upgrade
Other
None
Future Upgrade
Did you do any energy efficiency upgrades before or in conjunction with your solar installation? (multiple responses possible)
12
8. Are you more conscious of your energy use after installing your solar system?
Number of Responses: 406
Seventy-seven percent of respondents are more conscious of their energy use since installing solar panels.
Of the 23% who said “No”, those same people stated that their motivation for installing solar panels included:
o “To live green and/or reduce your carbon footprint” (64%)
o “To reduce the energy bill” (70%)
o “To reduce dependence on outside energy sources”. (53%)
No23%
Yes77%
Are you more conscious of your energy use after installing your solar system?
13
9. There may have been many factors that influenced your decision to use solar. Which TWO were the most important to you? (multiple responses)
The desire to save money still remains the primary motivator to install solar. However, the data also indicates “going green” as a significant motivation.
297
214
283
46
0
50
100
150
200
250
300
350
To reduce the energy bill
To reduce dependence on outside energy
sources
To live "green" and/or reduce your carbon
footprint
Other
There may have been many factors that influenced your decision to use solar. Which TWO were the most important to you? (multiple
responses possible)
14
10. Have you had questions or comments from your neighbors about your solar installation regarding the following choices? (multiple responses possible)
Total Responses: 495
The data shows that the primary area of interest was financial, including the cost of the installation (27%), the payback (26%), and savings realized by the owner (21%),
Negative feedback only represents 1% of the total.
134
105
129
24
23
36
25
12
7
0 20 40 60 80 100 120 140 160
Cost
Savings
General Interest
Payback Period
Satisfaction
Installer
Functionality
Aesthetics (Positive)
Aesthetics (Negative)
Have you had questions or comments from your neighbors about your solar installation regarding the following choices? (multiple
responses possible)
15
11. Do you feel you are saving money on your electric bill as a result of your solar installation?
Number of Responses: 450
Yes97%
No3%
Do you feel you are saving money on your electric bill as a result of your solar installation?
16
12. Did any of your friends or relatives install a solar system due to your example?
Total Respondents: 643
With 28% of respondents claiming that friends/relatives installed solar because of them, the data supports the previous question which showed that 27% of respondents found their solar installer using a personal reference. This also indicates that firsthand experience and feedback is significant in helping to promote solar to interested parties.
Yes28%
No72%
Did any of your friends or relatives install a solar system due to your example?
17
13. Would you expect your solar installation to increase the value of your home?
Number of Responses: 453
Yes93%
No7%
Would you expect your solar installation to increase the value of your home?
0.00
2.00
4.00
6.00
8.00
10.00
12.00
14.00
16.00
18.00
20.00
Normalized expected increase in home value($/kW)
18
With normalized data we see that most respondents expect between $4-5,000 increase per kW installed.
While the majority agrees that investing in solar PV will increase the value of their homes, the actual estimations vary significantly. Even under normalized conditions we see that there are still a number of outliers that expect large increases in the value of their house post-install.
19
3. Next Steps
After analysis of the survey results, more clarification is needed to determine
barriers and incentives to installing solar. This can be accomplished in two ways:
focus groups and researching national best in class.
3.1 Focus Group Follow-up Questions
1. Real Estate & Home Appraisers a. What difficulties do you face when selling (or valuating) a solar home?
i. What could be done to remove these barriers? b. How do you appraise the value of solar water heating vs. photovoltaic? c. How does a solar installation affect the value of the home?
i. Are there clear guidelines that help assess the value a solar install adds / subtracts?
ii. What factors would you need to better appraise the value of solar (system age, capacity, original costs, kWh production, etc.)?
d. Do you evaluate the functionality of solar system before putting the home on the market (i.e. ensuring the solar system is up to code, producing at maximum capacity, has the proper meter, disconnects, etc.)
e. Do you highlight solar systems as a value added feature on a home when putting it on the market?
f. Would a home energy rating (i.e. HERS) be beneficial to sales/marketing?
g. When a home has solar what questions do potential buyers ask?
2. City Permitting Officials a. How familiar are you with solar installations? b. What are the problems / barriers you find when dealing with solar
permits? c. What can the City do that would help you streamline the permitting
process? d. What can builders / contractors / architects do to help streamline the
permitting / inspection process for you? e. Do you feel you are / were adequately trained in solar permitting
requirements / specifications? f. Are you aware of solar permitting “best practices”?
3. Previous Solar Customers
a. Do you think having Solar installed on your property has increased its value?
20
b. Do you think having an energy rating with quantitative measurements / values on the performance of your property would be beneficial (e.g. expected yearly energy usage, Net Zero energy, etc)? Why or why not?
c. Did you do an energy audit in conjunction with your solar install? Why or why not?
d. Did you perform any energy efficiency upgrades before, during or after your systems installation?
e. Have there been any unexpected issues that have come up since installing solar on your property?
f. What can be done to make it easier for someone interested in solar to install it?
g. Are you familiar with what passive solar is?
3.2 Best in Class in California
1. San Francisco’s “GoSolarSF” Program: GoSolarSF is the largest municipal solar incentive program in the USA. Encourages
residents to hire local installers by providing additional rebates & a training program
to help certify local contractors; includes an “environmental justice” clause which
provides even greater incentive to those who are low income and/or live in areas that
have been “traditionally affected by pollution from energy generation” in San
Francisco.
Additional Benefits:
Permitting fee is only $85, far below Nor. Cal average of 212$ Streamlined permitting process
2. City of San Jose – Solar Permitting Process Identified in a study by the Sierra Club, San Jose is one of 4 cities in Northern
California that has an “over-the-counter” permitting process for most Solar
installations. San Jose, by defining what criteria qualifies a project for over-the-
counter permitting greatly reduces the time frame for a project and reduces cost by
eliminating extra man-hours.
Criteria that qualify a project for over-the-counter permitting include:
1. Total panel weight (including frame) is not greater than 5 lbs. per square foot.
2. Maximum concentrated load at each point of support does not exceed 40 lbs.
3. Maximum height above roof surface does not exceed 18 inches.
21
3. Sonoma County’s “Solar Sonoma County” Program This began with a smaller, city wide program called “Solar Sebastopol” but because of
the high level of success realized, expanded into a county wide program. This
program helped to centralize all of the information into one website which helps to
knowledge barriers. Additionally, the program has engaged the participation of a full
range of stakeholders including banks, installers, real estate professionals, NPO’s,
vendors, schools and individual citizens.
Successes include a reduction in knowledge and accessibility barriers. Education
outreach and partnerships with schools has helped to improve knowledge of the how
solar works and how to obtain financing; the full range of stakeholders guarantees
consistency and cooperation throughout the entire program.
4. City of Berkley – Inspector Training The City of Berkley’s inspectors have been identified as being exceptionally
knowledgeable in what to look for when inspecting a solar install. This helps to
reduce time needed inspect solar installations and prevents unnecessary delays due
to inspectors’ lack of knowledge.
The City Planning Department also offers free non-binding design review evaluation
of solar equipment installations; this facilitates a positive back and forth with the
designer/contractor early in the process and prevents expensive design revisions