Report prepared for: The World Bank Washington, D.C. COST REDUCTION STUDY FOR SOLAR THERMAL POWER PLANTS FINAL REPORT May 5, 1999 Prepared by Enermodal Engineering Limited 650 Riverbend Drive Kitchener, ON N2K 3S2 Tel: 519-743-8777 Fax: 519-743-8778 e-mail: [email protected]in association with Marbek Resource Consultants Ltd. Suite 500, 1355 Bank St Ottawa, Ontario
Marbek Resource Consultants Ltd.Suite 500, 1355 Bank St
Ottawa, Ontario
Cost Reduction Study for Solar Thermal Power Plants
Page ii Enermodal Engineering Ltd./Marbek Resource Consultants Ltd. May 1999
Cost Reduction Study for Solar Thermal Power Plants
May 1999 Enermodal Engineering Ltd./Marbek Resource Consultants Ltd. Page iii
EXECUTIVE SUMMARYRecent concern over the problem of climate change has generated renewed interest in SolarThermal Power Plants (STPP) as a means of generating electricity. STPPs, although moreexpensive than conventional fossil-fuel power plants, release much less carbon dioxide andother pollutants. There are several applications for World Bank/GEF funding for STPPs indeveloping countries. The purpose of this report is:
• to assess the current and future cost competitiveness of STPPs with conventional powersystems,
• to determine the market potential for STPP with particular emphasis on developingcountries, and
• to identify an overall strategy for promoting accelerated development of STPP, includingrecommended roles for the key players (in particular the GEF).
The market for STPP is large and could reach an annual installation rate of 2000 MW. The bestregions for STPP are Southern Africa, Mediterranean countries (including North Africa, MiddleEast and Southern Europe), India, parts of South America, Southwest U.S./northern Mexico andAustralia. The operating characteristics of STPPs are relatively well matched with theintermediate and peak electricity load requirements in these regions.
Two types of collectors have been used in STPPs: parabolic trough and central receiver.Electricity is generated by incorporating the solar collectors with a Rankine cycle power plant oras an add-on to a natural gas combined cycle (referred to as an ISCCS). STPPs in southernCalifornia, with a total output of 354 MW, have operated reliably over the past 15 years.
New parabolic trough STPPs are estimated to have a capital cost (in developing countries) thatis $2,000 to $3,000 per kilowatt or 2.5 to 3.5 times that of conventional Rankine-cycle plants.Central receiver STPPs are less mature than parabolic trough and will require severalsuccessful projects to scale up to reasonable sizes. The current costs of central receiver STPPsare close to $4,200 per kilowatt or five times that of conventional Rankine-cycle plants.
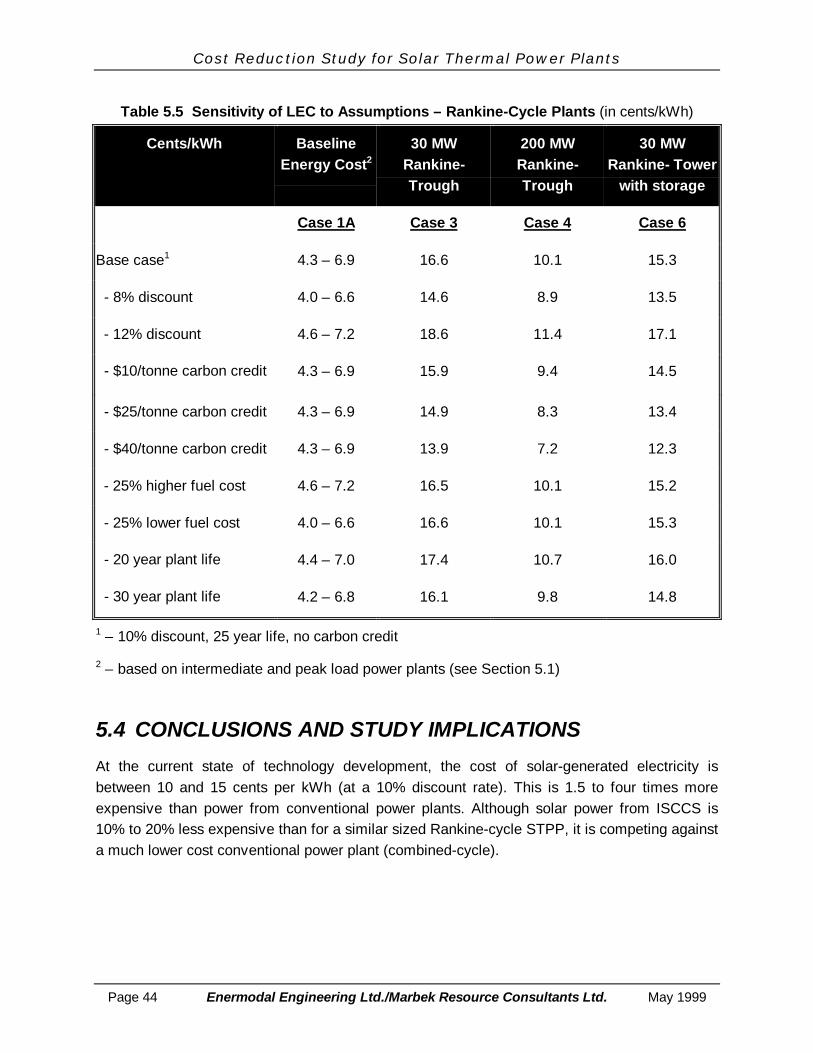
At the current state of technology development, the cost of solar-generated electricity isbetween 10 and 15 cents per kWh (at a 10% discount rate). This is two to four times moreexpensive than power from conventional power plants. Although solar power from ISCCS is10% to 20% less expensive than for a similar sized Rankine-cycle STPP, it is competing againsta much lower cost conventional power plant (combined-cycle).
Two approaches were used to predict the future cost performance of STPP: an engineeringapproach based on known technical improvements and cost reductions from commercializationand an experience curve approach. The two approaches yielded similar results. The cost-per-
Cost Reduction Study for Solar Thermal Power Plants
Page iv Enermodal Engineering Ltd./Marbek Resource Consultants Ltd. May 1999
kilowatt of trough plants are expected to fall by 40% and central receiver systems are expectedto fall by over 60%. The cost of electricity from conventional power plants is expected to stayconstant over the next twenty years.
The solar Levelized Energy Cost (LEC) is expected to fall to less than half current values as aresult of performance improvements and cost reductions. At these costs, the potential forSTPPs to compete with Rankine cycle plants (coal, gas or oil fired) is promising. In the long-term, the LEC for Trough Rankine plants is expected to be within the cost range forconventional peaking plants. If a credit for reduced carbon emissions is included, all STPPshave a lower LEC than coal-fired Rankine plants. ISCCS plants are not expected to producepower that is less expensive than a gas-fired combined-cycle plant.
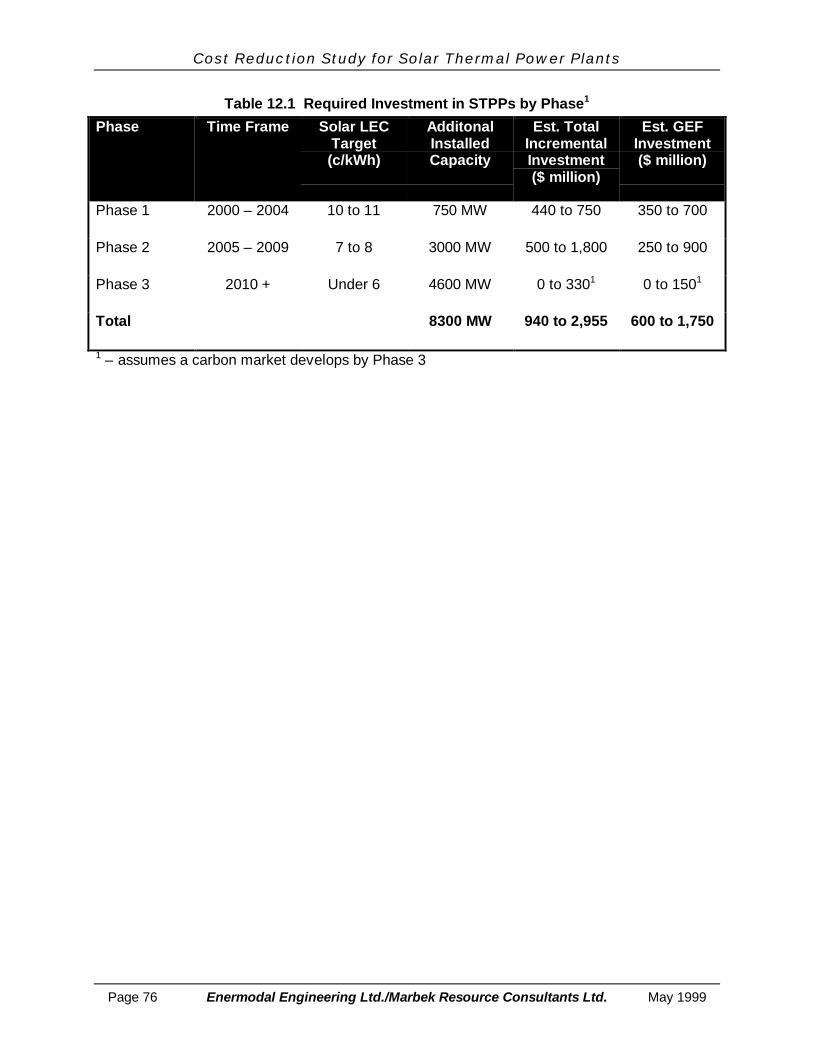
Given the promising results, a three-phase development plan is recommended to commercializeSTPPs as summarized below. The three phases are market awareness, market expansion andmarket acceptance. GEF support is critical to the success of this plan.
Required Investment in STPPs by Phase1
Phase Time Frame Solar LECTarget(c/kWh)
AdditonalInstalledCapacity
Est. TotalIncrementalInvestment($ million)
Est. GEFInvestment($ million)
Phase 1 2000 – 2004 10 to 11 750 MW 440 to 750 350 to 700
Phase 2 2005 – 2009 7 to 8 3000 MW 500 to 1,800 250 to 900
Phase 3 2010 + Under 6 4600 MW 0 to 3301 0 to 1501
Total 8300 MW 940 to 2,955 600 to 1,750
1 – assumes a carbon market develops by Phase 3
In Phase 1, the GEF would need to provide financial support in the order of $350 to 700 millionto fund approximately nine projects. The support would be in the range of $550 to $1000/kW.
In Phase 2, a further 3,000 MW of installed capacity would be supported. The total support costis estimated at $500 million to $1.8 billion ($350 to 750/kW). Additional financial partners areexpected to emerge, so that GEF support would only be a portion of these values.
In Phase 3, the emergence of carbon credits could mean that STPPs are cost effective and onlymodest financial support is required (under $330 million). The total support required tocommercialize STPPs is estimated at between $1 and $3 billion; approximately 60% of whichwould need to come from the GEF. The annual GEF investment is estimated at between $60and $160 million.
Cost Reduction Study for Solar Thermal Power Plants
May 1999 Enermodal Engineering Ltd./Marbek Resource Consultants Ltd. Page v
The success of the commercialization will depend on several factors. First and most importantlyis whether the cost and performance goals for STPPs are met. The goals are 10 to 11cents/kWh at the end of Phase 1, 7 to 8 cents/kWh at the end of Phase 2 and under 6 cents inPhase 3. Second, cost parity is based on a financial credit for reduced carbon emissions. Ifthere is no carbon trading, carbon credits or carbon tax, the adoption of STPPs will be reducedor slowed. Third, trade, tax and other economic barriers must not penalize the solar option.Real-life financing issues can have a major impact on the adoption of any technology. The studywas performed as an economic analysis, not a financial analysis.
The GEF can play a major role in all three of these factors, ensuring that a cost-effectivetechnology is developed, a program of carbon credits or trading is implemented and financialbarriers are limited.
Cost Reduction Study for Solar Thermal Power Plants
Page vi Enermodal Engineering Ltd./Marbek Resource Consultants Ltd. May 1999
ACKNOWLEDGEMENTSThis report was prepared by Enermodal Engineering Limited (Stephen Carpenter and StephenKemp) and Marbek Resources Consultants Ltd. (Paul Robillard and Sean Whittaker) for theWorld Bank. The authors would like to acknowledge the assistance and guidance of World Bankstaff (Richard Spencer, Charles Feinstein and Rohan Singh) throughout this project. Thetechnical support of SunLab (National Renewable Energy Laboratory and Sandia NationalLaboratories) staff (Tom Williams, Hank Price and Greg Kolb) was critical to the preparation ofthis report. Finally, the authors would like to thank the numerous industry members whoprovided a critical review of the project through its various stages.
DISCLAIMERThis report was prepared by Enermodal Engineering Limited and Marbek Resource ConsultantsLtd. for the World Bank. The views in this report are those of the authors and do not representWorld Bank opinion or policy. This is a draft report that has been circulated for review andcomment to a limited audience. This report is not for general circulation. No warranty isexpressed or implied about the usefulness of the information presented in this report.
Cost Reduction Study for Solar Thermal Power Plants
May 1999 Enermodal Engineering Ltd./Marbek Resource Consultants Ltd. Page vii
Table of Contents
EXECUTIVE SUMMARY ........................................................................................................... iii
ACKNOWLEDGEMENTS ......................................................................................................... vi
Table of Contents ................................................................................................................... vii
List of Figures ...........................................................................................................................x
List of Tables............................................................................................................................xi
1.3 SOLAR COLLECTOR TYPES ...........................................................................................61.3.1 Parabolic Troughs.....................................................................................................61.3.2 Central Receivers......................................................................................................8
1.4 SOLAR THERMAL POWER CONVERSION SYSTEMS....................................................91.4.1 Rankine-Cycle Systems ..........................................................................................101.4.2 Integrated Solar Combined Cycle Systems .............................................................111.4.3 Hybrid Solar/Rankine-Cycle Generation Systems ...................................................13
3.2 PARABOLIC TROUGH STPP..........................................................................................213.2.1 Background.............................................................................................................213.2.2 Parabolic Trough - Systems Assessed in This Study ..............................................233.2.3 Parabolic Trough - System Cost & Performance .....................................................24
3.3 CENTRAL RECEIVER SYSTEMS ...................................................................................283.3.1 Background.............................................................................................................283.3.2 Central Receiver - Systems Assessed in this Study ................................................293.3.3 Central Receiver - System Costs & Performance....................................................30
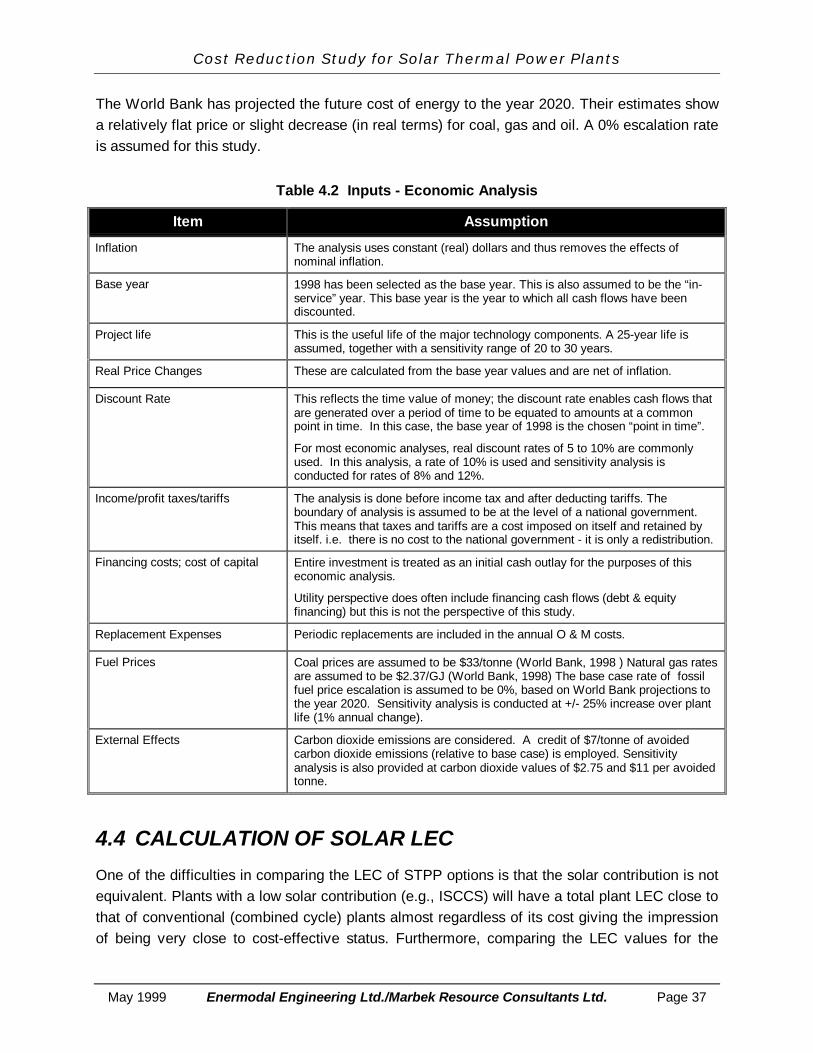
4.3 METHODOLOGY.............................................................................................................344.3.1 Overview.................................................................................................................344.3.2 Public vs. Private Perspective .................................................................................354.3.3 Economic Assumptions Employed in this Analysis ..................................................36
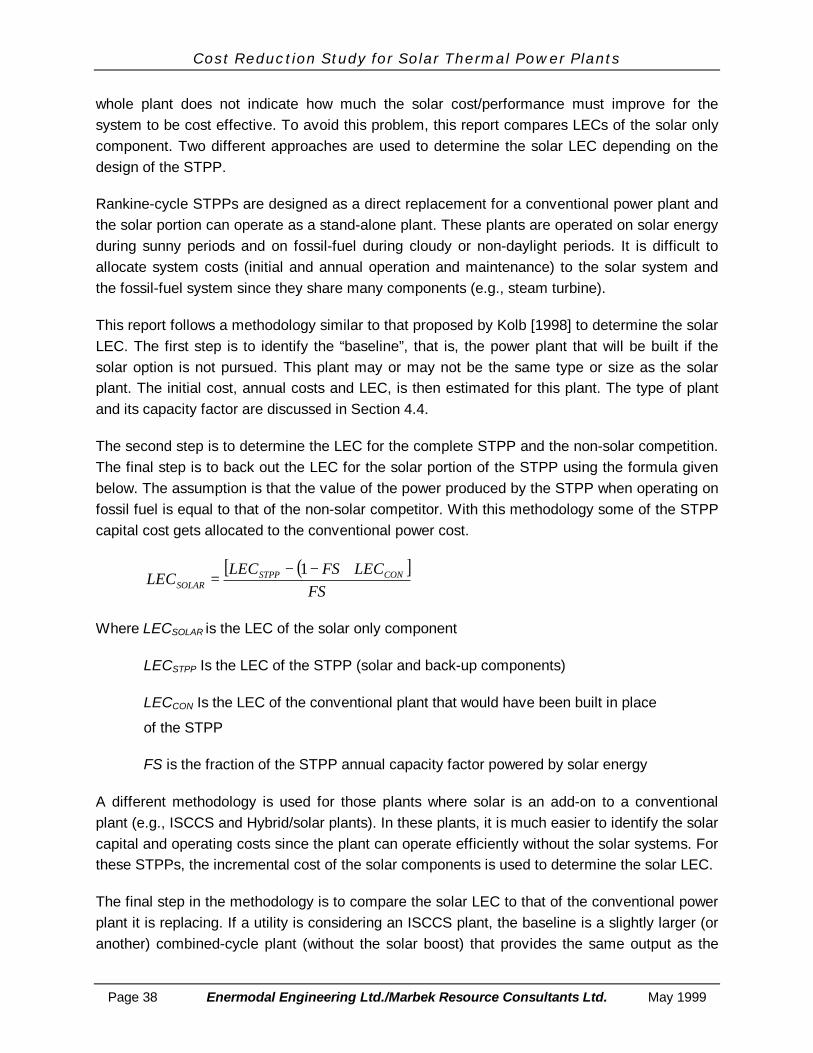
4.4 CALCULATION OF SOLAR LEC .....................................................................................37
5. CURRENT LEVELIZED ENERGY COSTS ..........................................................................40
5.1 CONVENTIONAL POWER PLANTS................................................................................40
Figure 3.1 Aerial View of the SEGS III-VII Plants at Kramer Junction ......................................22
Figure 3.2 Current Estimates of Rankine-Cycle Solar Plant Specific Cost................................27
Figure 3.3 Solar Two Central Receiver ....................................................................................29
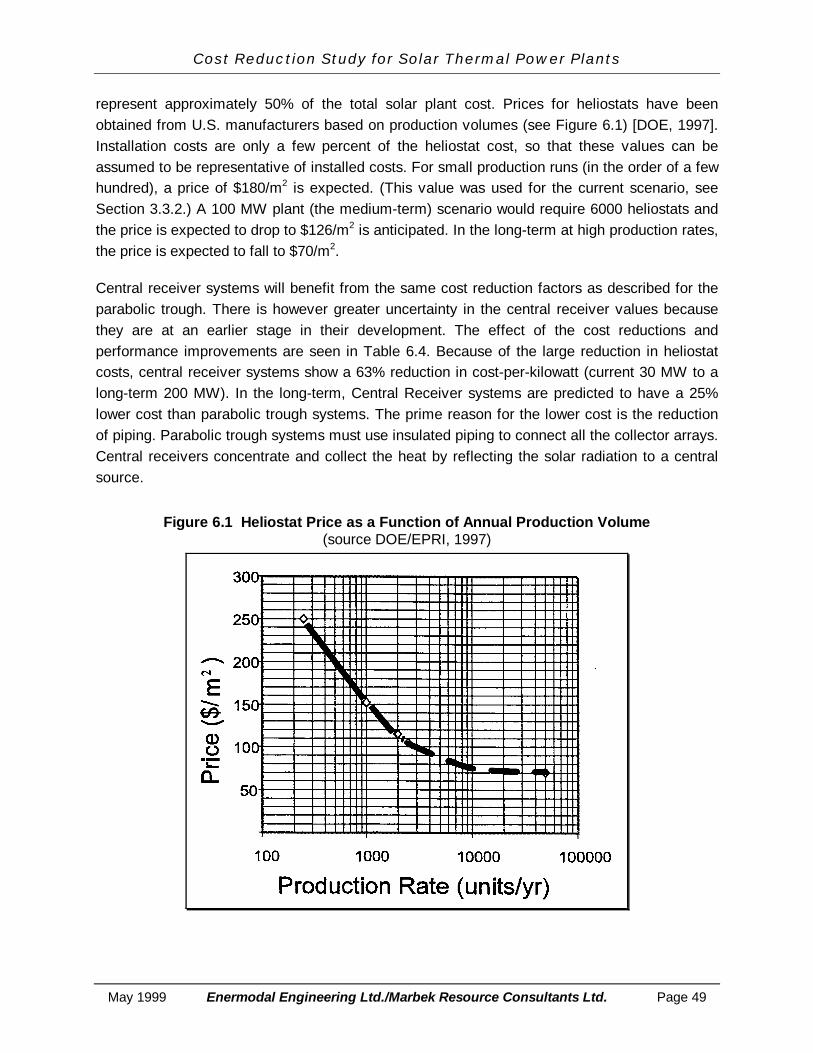
Figure 6.1 Heliostat Price as a Function of Annual Production Volume (sourceDOE/EPRI, 1997) ..............................................................................................................49
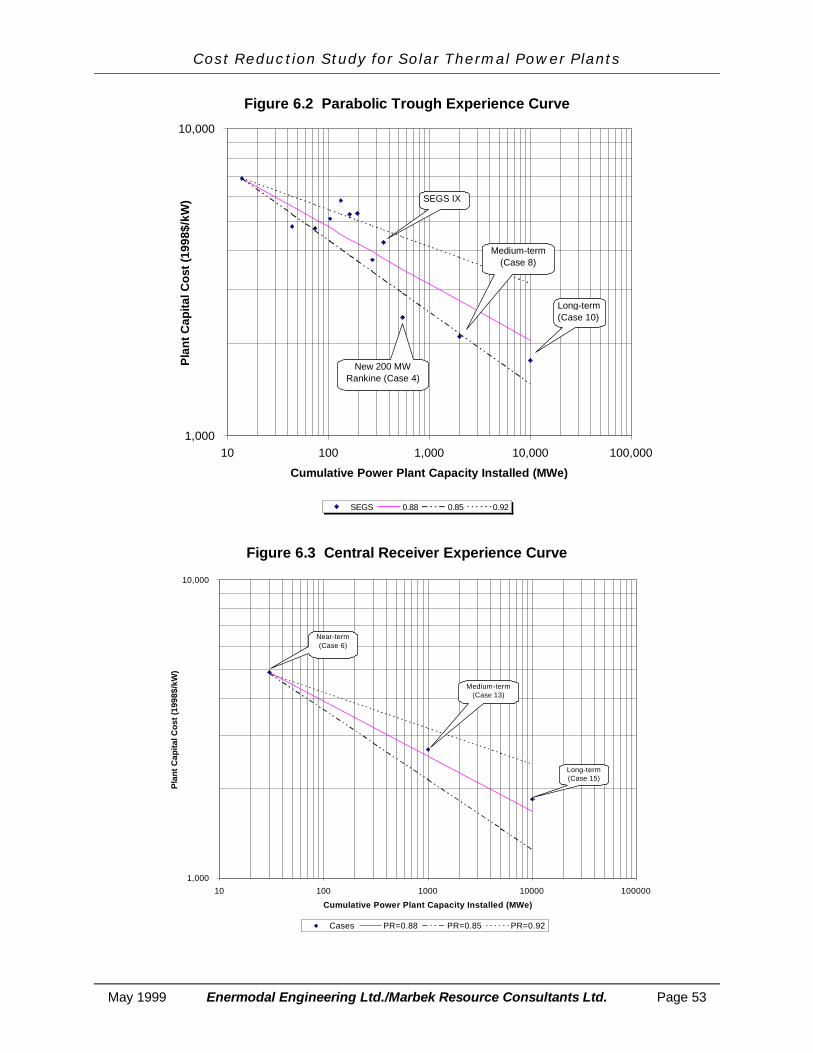
Figure 6.3 Central Receiver Experience Curve ........................................................................53
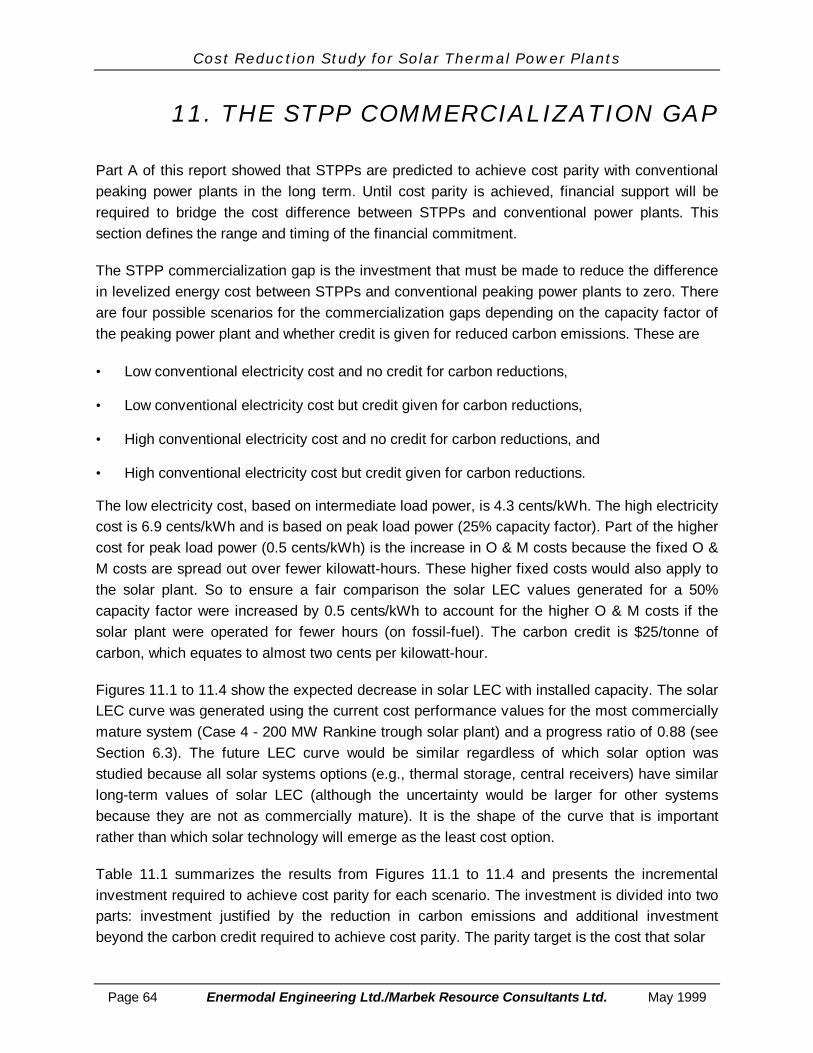
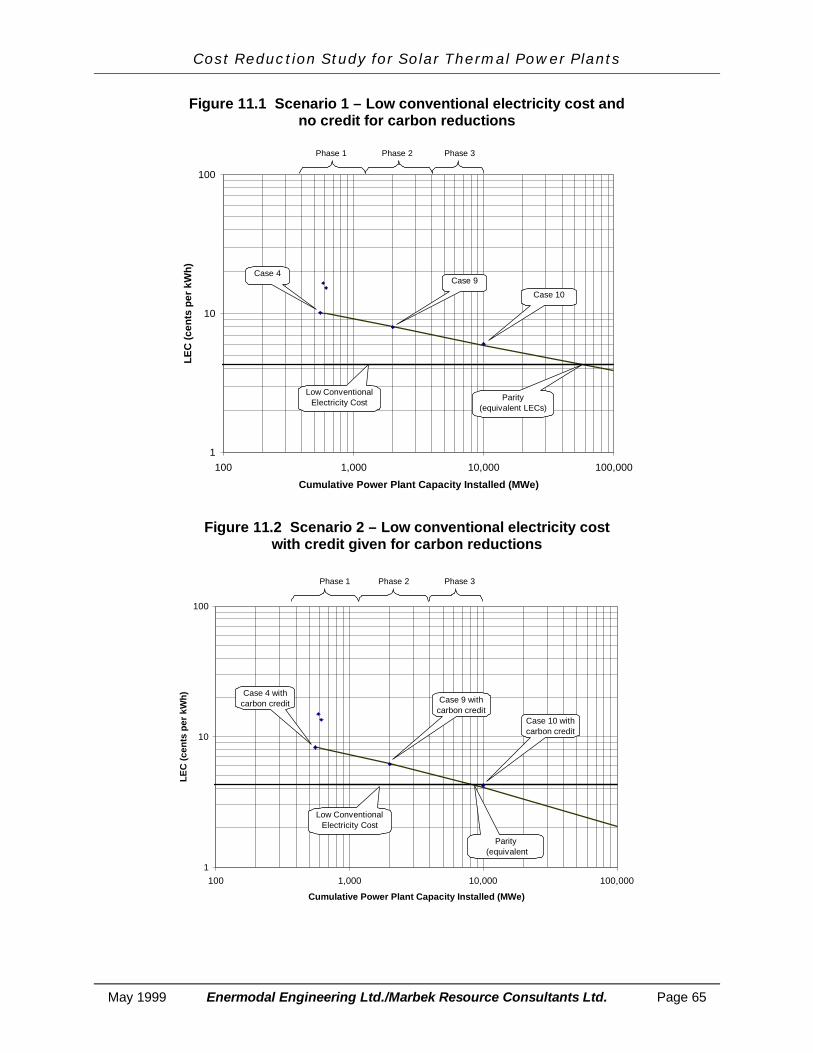
Figure 11.1 Scenario 1 – Low conventional electricity cost and no credit for carbonreductions..........................................................................................................................65
Figure 11.2 Scenario 2 – Low conventional electricity cost with credit given for carbonreductions..........................................................................................................................65
Figure 11.3 Scenario 3 – High conventional electricity cost and no credit for carbonreductions..........................................................................................................................66
Figure 11.4 Scenario 4 – High conventional electricity cost with credit given for carbonreductions..........................................................................................................................66
Cost Reduction Study for Solar Thermal Power Plants
May 1999 Enermodal Engineering Ltd./Marbek Resource Consultants Ltd. Page xi
List of TablesTable 1.1 STPP Cases Examined in This Study ......................................................................15
Table 2.1 Annual Solar Radiation Values in Locations Suitable for STPP................................17
Table 2.2 Typical Operating Hours for Conventional Power Plants ..........................................20
Table 3.1 Characteristics of the Luz SEGS Plants ...................................................................23
Table 3.2 Details of Parabolic Trough STPP............................................................................24
Table 3.3 Estimated Current Performance of Parabolic Trough STPP.....................................26
Table 3.4 Estimated Current Cost of Parabolic Trough STPP (in $/kW total plant output)........26
Table 3.5 Cost of Parabolic Trough STPP as listed in Recent Feasibility Studies ....................27
Table 3.6 Details of Central Receiver STPP ............................................................................30
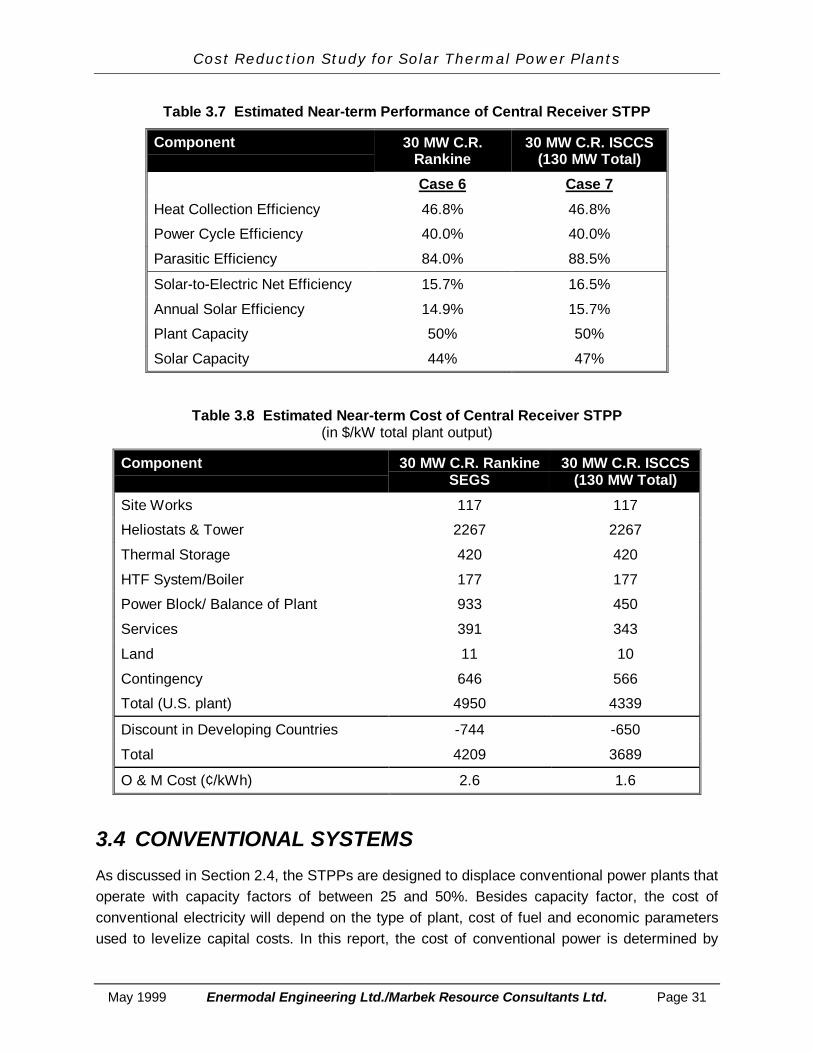
Table 3.7 Estimated Near-term Performance of Central Receiver STPP .................................31
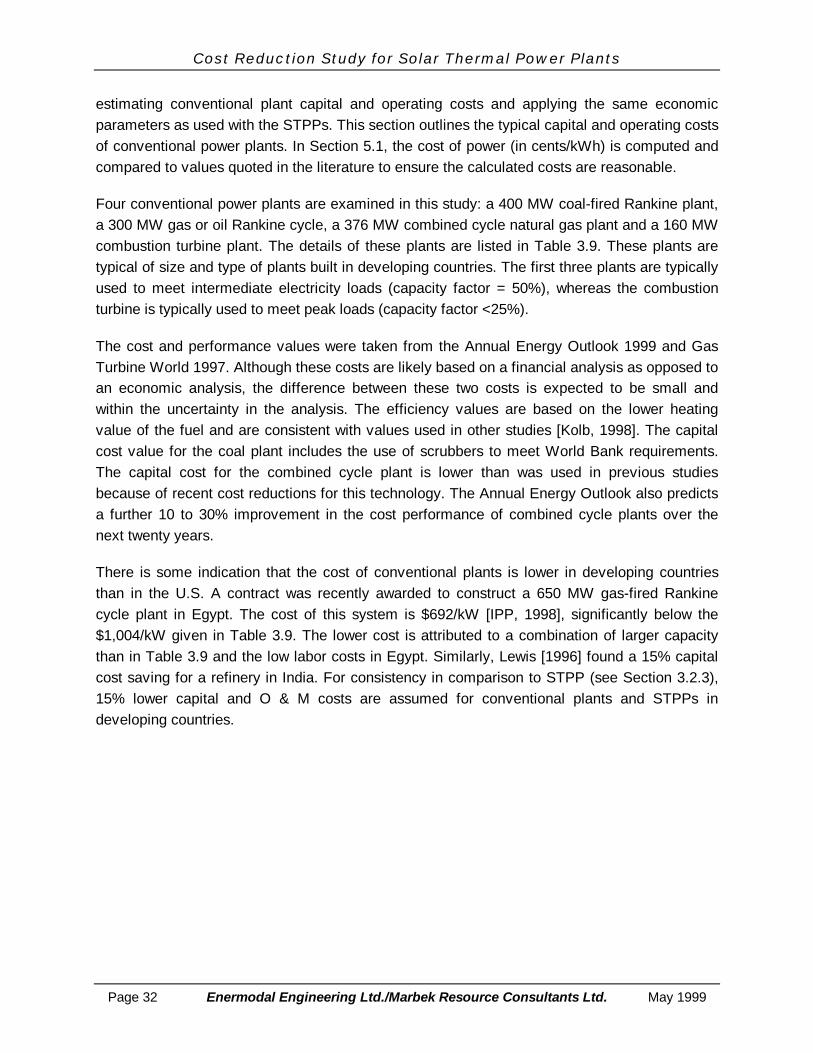
Table 3.8 Estimated Near-term Cost of Central Receiver STPP (in $/kW total plantoutput) ...............................................................................................................................31
Table 3.9 Estimated Current U.S. Cost and Performance of Conventional Power Plants.........33
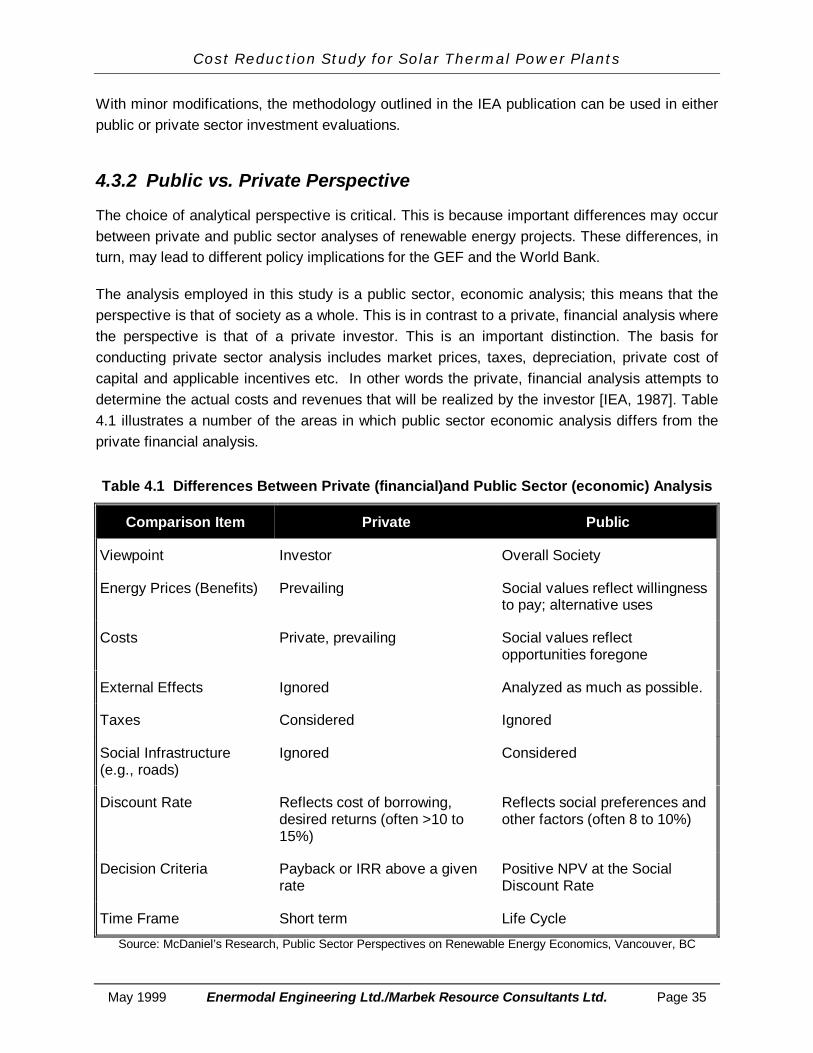
Table 4.1 Differences Between Private (financial)and Public Sector (economic) Analysis........35
Table 5.1 Current LEC for Intermediate and Peak Conventional Power Plants (incents/kWh) ........................................................................................................................41
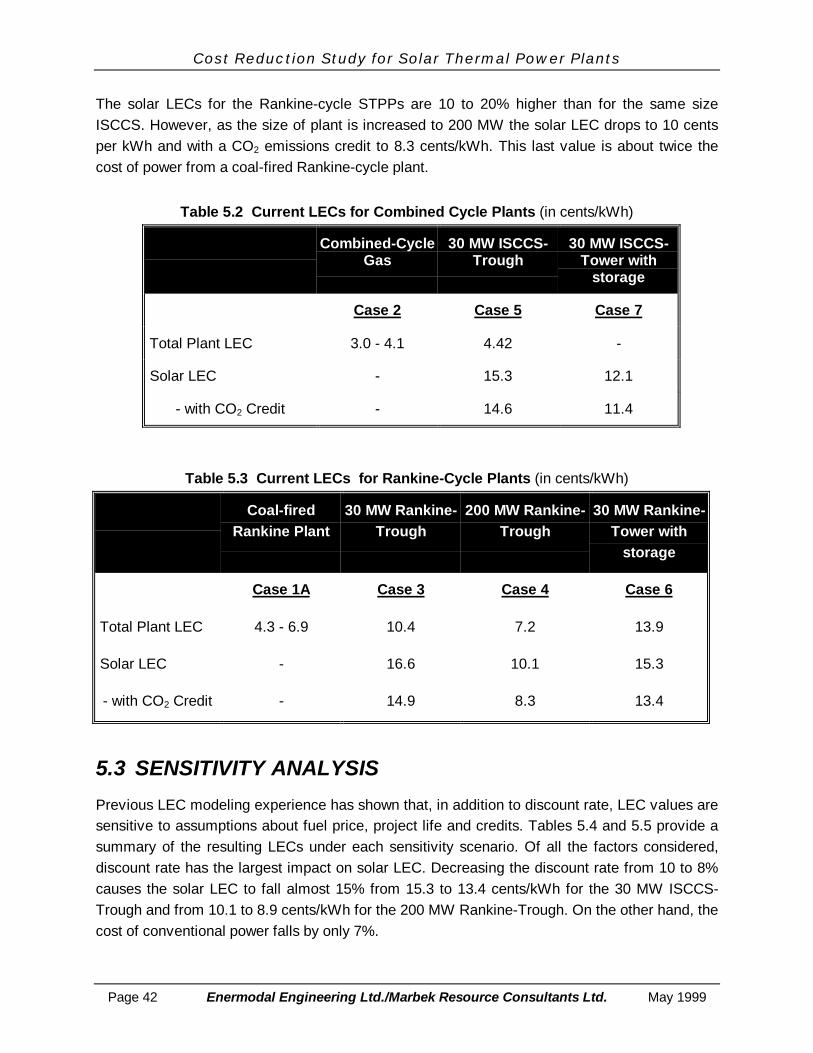
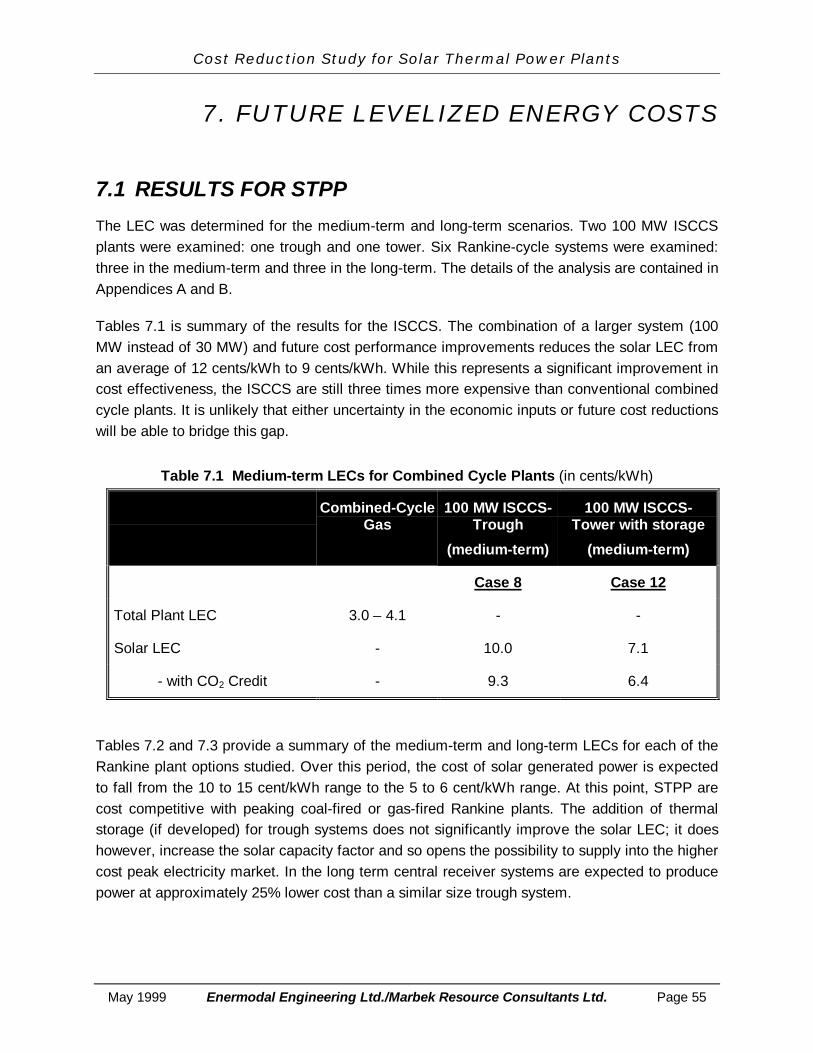
Table 5.2 Current LECs for Combined Cycle Plants (in cents/kWh).........................................42
Table 5.3 Current LECs for Rankine-Cycle Plants (in cents/kWh)...........................................42
Table 5.4 Sensitivity of LEC to Assumptions – Combined Cycle Plants (in cents/kWh)............43
Table 5.5 Sensitivity of LEC to Assumptions – Rankine-Cycle Plants (in cents/kWh)...............44
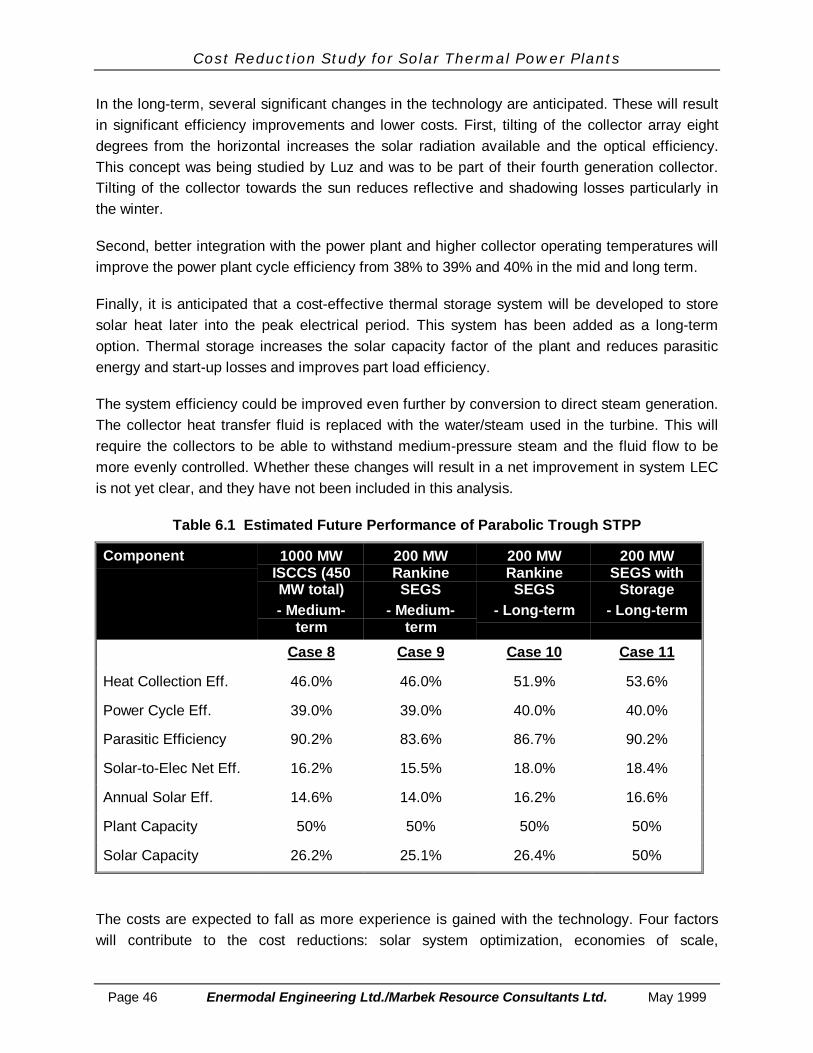
Table 6.1 Estimated Future Performance of Parabolic Trough STPP.......................................46
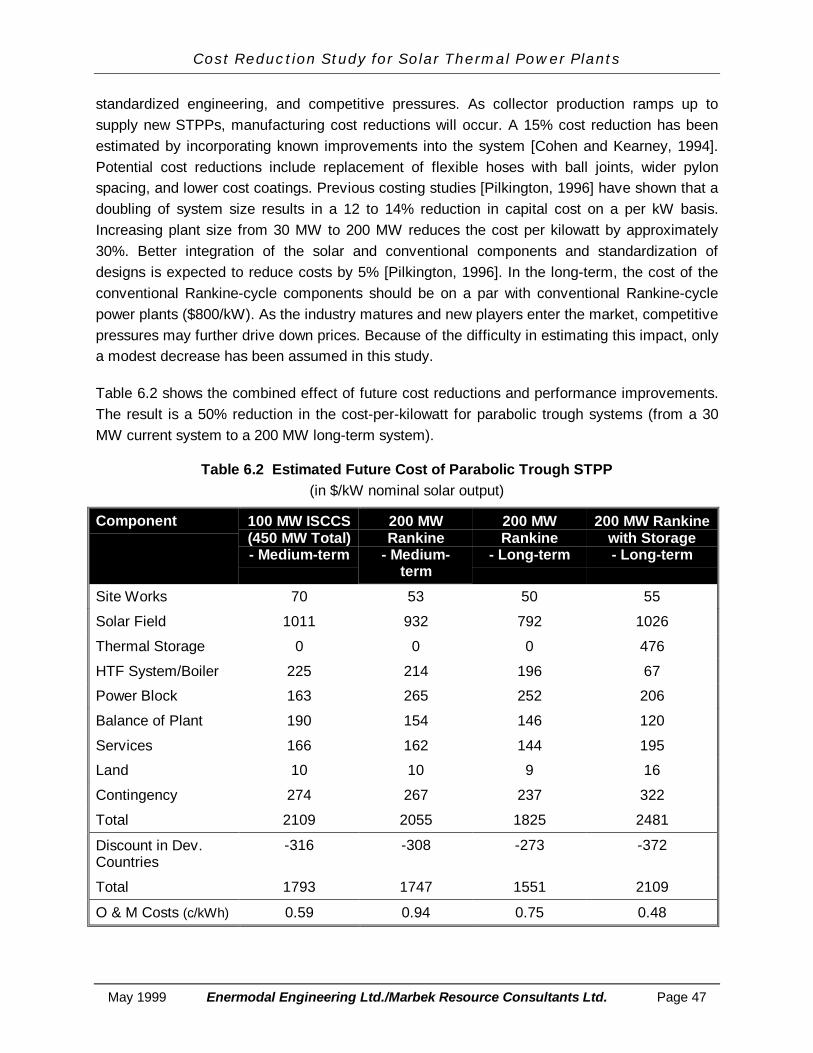
Table 6.2 Estimated Future Cost of Parabolic Trough STPP ...................................................47
Table 6.3 Estimated Future Performance of Central Receiver STPP .......................................48
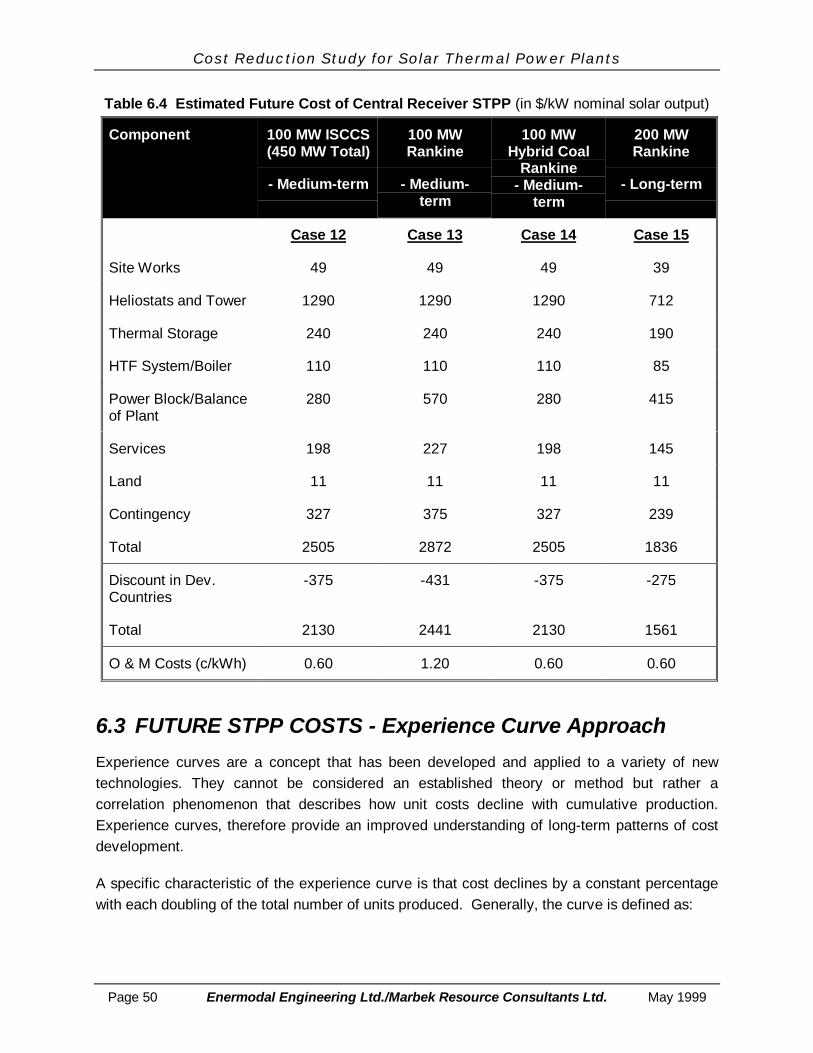
Table 6.4 Estimated Future Cost of Central Receiver STPP (in $/kW nominal solaroutput) ...............................................................................................................................50
Table 12.1 Required Investment in STPPs by Phase1 .............................................................76
Cost Reduction Study for Solar Thermal Power Plants
Page xii Enermodal Engineering Ltd./Marbek Resource Consultants Ltd. May 1999
Cost Reduction Study for Solar Thermal Power Plants
May 1999 Enermodal Engineering Ltd./Marbek Resource Consultants Ltd. Page 1
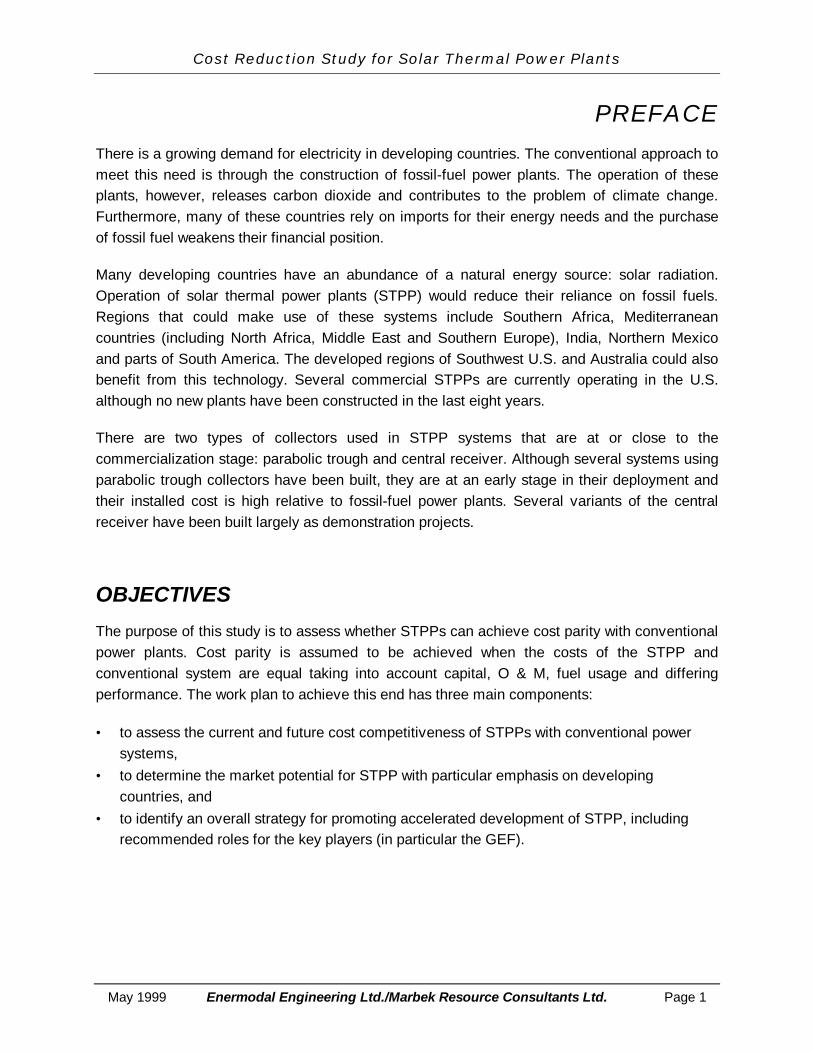
PREFACEThere is a growing demand for electricity in developing countries. The conventional approach tomeet this need is through the construction of fossil-fuel power plants. The operation of theseplants, however, releases carbon dioxide and contributes to the problem of climate change.Furthermore, many of these countries rely on imports for their energy needs and the purchaseof fossil fuel weakens their financial position.
Many developing countries have an abundance of a natural energy source: solar radiation.Operation of solar thermal power plants (STPP) would reduce their reliance on fossil fuels.Regions that could make use of these systems include Southern Africa, Mediterraneancountries (including North Africa, Middle East and Southern Europe), India, Northern Mexicoand parts of South America. The developed regions of Southwest U.S. and Australia could alsobenefit from this technology. Several commercial STPPs are currently operating in the U.S.although no new plants have been constructed in the last eight years.
There are two types of collectors used in STPP systems that are at or close to thecommercialization stage: parabolic trough and central receiver. Although several systems usingparabolic trough collectors have been built, they are at an early stage in their deployment andtheir installed cost is high relative to fossil-fuel power plants. Several variants of the centralreceiver have been built largely as demonstration projects.
OBJECTIVES
The purpose of this study is to assess whether STPPs can achieve cost parity with conventionalpower plants. Cost parity is assumed to be achieved when the costs of the STPP andconventional system are equal taking into account capital, O & M, fuel usage and differingperformance. The work plan to achieve this end has three main components:
• to assess the current and future cost competitiveness of STPPs with conventional powersystems,
• to determine the market potential for STPP with particular emphasis on developingcountries, and
• to identify an overall strategy for promoting accelerated development of STPP, includingrecommended roles for the key players (in particular the GEF).
Cost Reduction Study for Solar Thermal Power Plants
Page 2 Enermodal Engineering Ltd./Marbek Resource Consultants Ltd. May 1999
METHODOLOGY
This project has been conducted in two parts. They are:
Part A - Situation Assessment
Part B - Strategy and Implementation Plan
The Part A Situation Assessment addresses the current context confronting STPPs. Thisnecessarily addresses such important considerations as technology configuration, installationand operation costs, performance efficiency and, estimated market potential. In addition toexamining and reporting current status, the Situation Assessment also draws on a combinationof engineering, empirical and literature resources in order to present a set of baseline forecastsof expected future STPP cost and performance data. These baseline future STPP cost andperformance forecasts are then contrasted with those for comparable conventional utility powergeneration systems. The comparison of baseline forecasts provides a basis for estimating themagnitude of the investment (and related conditions) that are required to reach parity with theexpected future costs of conventional power generation technologies.
The second part of the study focuses on a development plan for closing the gap identified inPart A. This part of the study examines preferred roles for international organizations such asthe World Bank and The Global Environment Facility (GEF), together with expected total levelsof investment required to achieve the objective of cost parity. The implementation strategy alsoidentifies possible exit strategies for the GEF.
This study was conducted within a relatively short time frame because of the need to respond tocurrent requests for World Bank funding of several STPPs. Given the time constraints andmagnitude of the project scope, the study team relied on the technical expertise of SunLabpersonnel and several recent reports on STPPs in assessing the cost and performance ofSTPPs. Thus, for the most part this report is a “due diligence” assessment of STPPs rather thanoriginal research.
Cost Reduction Study for Solar Thermal Power Plants
May 1999 Enermodal Engineering Ltd./Marbek Resource Consultants Ltd. Page 3
PART A
SITUATION ASSESSMENT
Cost Reduction Study for Solar Thermal Power Plants
Page 4 Enermodal Engineering Ltd./Marbek Resource Consultants Ltd. May 1999
1. SOLAR THERMAL TECHNOLOGIES:OVERVIEW
1.1 INTRODUCTION
The solar thermal power plants (STPPs) that are addressed in this study consist of two majorcomponents: a solar collector that converts solar radiation into thermal heat and a powerconversion system that converts the heat into electricity. There is a variety of solar and powerconversion technologies that can be combined in different ways (including the addition ofthermal storage) to produce electricity. To ensure consistent use of terminology, this sectionbegins with a brief definition of the technology terms as they are used throughout this report.This is followed by a brief description of the solar collector and power generation technologiesthat are assessed in this study. A brief description of solar storage systems is also provided.The section concludes with an overview of future STPP developments.
1.2 DEFINITIONS
1.2.1 Plant Description
In describing a given plant configuration, it is important to use a standard nomenclature to avoidconfusion between the various STPP options. The term “SEGS” (Solar Electric GenerationStation) has traditionally been a generic term relating to the parabolic trough technologies thatemployed the Rankine cycle with 75% solar and 25% fossil fuel input. The parabolic troughSTPPs installed in California by Luz International are termed SEGS I through IX. For this report,the term SEGS refers only to these installations.
In this report, the designation for a given STPP will be of this form:
For fossil-fuel power plants, the <Solar collector type> is replaced with the fuel type. A briefdiscussion of each term is given below:
Cost Reduction Study for Solar Thermal Power Plants
May 1999 Enermodal Engineering Ltd./Marbek Resource Consultants Ltd. Page 5
Nominal Power:This is the maximum gross power that the power plant can produce using solar energy or fossilfuel energy. For hybrid systems (systems that operate on solar and fossil fuel at the same time)only the solar power output is listed, given in megawatts (MW).
Power Conversion:Thermal energy from a power source is converted to electrical energy in a power conversionsystem consisting of one or more turbines. For the purposes of this study, two power conversionsystems are examined: Rankine cycle and Combined Cycle systems.
Solar Collector Type:A solar collector is used to concentrate solar radiation onto a receiver where heat transfer to afluid takes place. In this study, two concentrating solar thermal collection technologies areexamined: parabolic troughs (or “troughs”) and solar central receivers (often termed “powertowers”).
Fuel Type:This refers to the type of fossil fuel consumed in the non-solar part of the power plant. If thepower conversion equipment is a Rankine cycle, then fuels such as natural gas, coal (scrubbed)and fuel oil no. 2 may be used. In the case of a Combined Cycle system, natural gas is thepreferred fuel.
Options:These options may apply to any type of plant. Storage refers to a system that allows for thestorage of excess thermal energy from the STPPs solar collector. This energy can then be usedduring periods when solar insolation is reduced (cloudy periods or at night).
ExampleA typical designation may look like this: 30 MW ISCCS -Trough
This designates a STPP with 30 MW nominal power, parabolic trough concentrating solarthermal collectors, and an Integrated Solar Combined Cycle System power conversionconfiguration. In this case, it is assumed that no thermal storage is involved and that the fuelused is natural gas.
1.2.2 Plant Operation Definitions
Heat Collection Efficiency: The percentage of the incident solar radiation that is converted tousable heat by the solar collector
Power Cycle Efficiency: The percentage of the thermal energy that is converted electricalenergy (gross)
Cost Reduction Study for Solar Thermal Power Plants
Page 6 Enermodal Engineering Ltd./Marbek Resource Consultants Ltd. May 1999
Parasitic Efficiency: The conversion from gross efficiency to net efficiency accounting forlosses from parasitic electric power to operate the plant and losses from start-up and part loadoperation (assumed to be 5%).
Solar-to-Electric Net Efficiency: The net operating efficiency of the plant, or the percent of theincident solar radiation that is converted to electricity for the grid
Annual Solar Efficiency: The Solar-to-Electric Net Efficiency on an annual basis accounting forplant downtime (5%) and below optimum performance (5%).
Plant Capacity Factor: The annual electricity output divided by the maximum plant output orthe percentage of the time the plant is operating (at full load)
Solar Capacity Factor: The annual electricity output provided by solar energy divided by themaximum plant output or the percentage of the time the plant is operating (at full load) on solar.The ratio of the solar capacity factor to the plant capacity factor is the fraction of the plant outputprovided by solar energy.
1.3 SOLAR COLLECTOR TYPES
The solar collector is the first major component of the STPP. This report focuses on parabolictroughs and central receivers because they are judged to be the only solar thermal technologiesthat can make a significant contribution to the electrical grid in the near to medium-term (to2010). Furthermore, troughs and towers are designed for large-scale grid applications, whereasother solar technologies such as solar dishes are better suited to distributed small-scaleapplication.
1.3.1 Parabolic Troughs
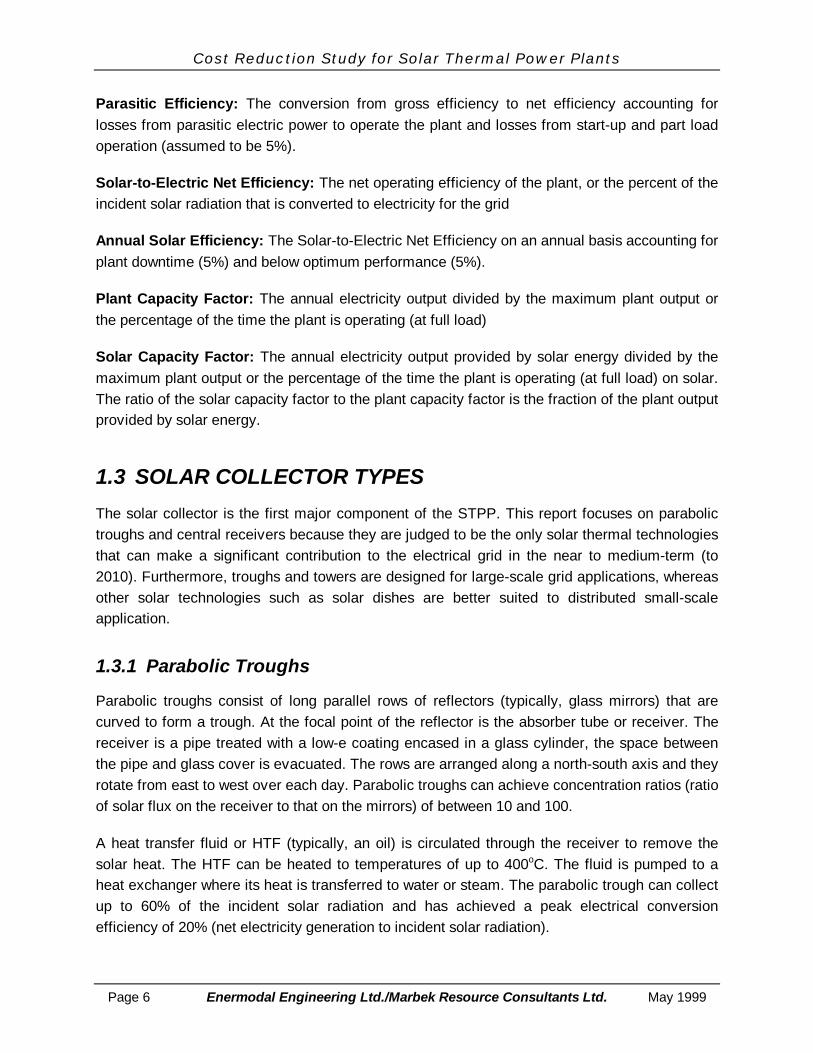
Parabolic troughs consist of long parallel rows of reflectors (typically, glass mirrors) that arecurved to form a trough. At the focal point of the reflector is the absorber tube or receiver. Thereceiver is a pipe treated with a low-e coating encased in a glass cylinder, the space betweenthe pipe and glass cover is evacuated. The rows are arranged along a north-south axis and theyrotate from east to west over each day. Parabolic troughs can achieve concentration ratios (ratioof solar flux on the receiver to that on the mirrors) of between 10 and 100.
A heat transfer fluid or HTF (typically, an oil) is circulated through the receiver to remove thesolar heat. The HTF can be heated to temperatures of up to 400oC. The fluid is pumped to aheat exchanger where its heat is transferred to water or steam. The parabolic trough can collectup to 60% of the incident solar radiation and has achieved a peak electrical conversionefficiency of 20% (net electricity generation to incident solar radiation).
Cost Reduction Study for Solar Thermal Power Plants
May 1999 Enermodal Engineering Ltd./Marbek Resource Consultants Ltd. Page 7
Nine trough systems were constructed in the 1980s and are currently generating 354 MW ofelectricity in Southern California. Three types of collectors were used over this period, however,the basic size and construction are similar. The troughs are approximately 5 meters wide inrows up to 100 meters long. See Section 3.2 for a more complete description of these plants.
Figure 1.1 Trough Principle (courtesy of Pilkington Solar International)
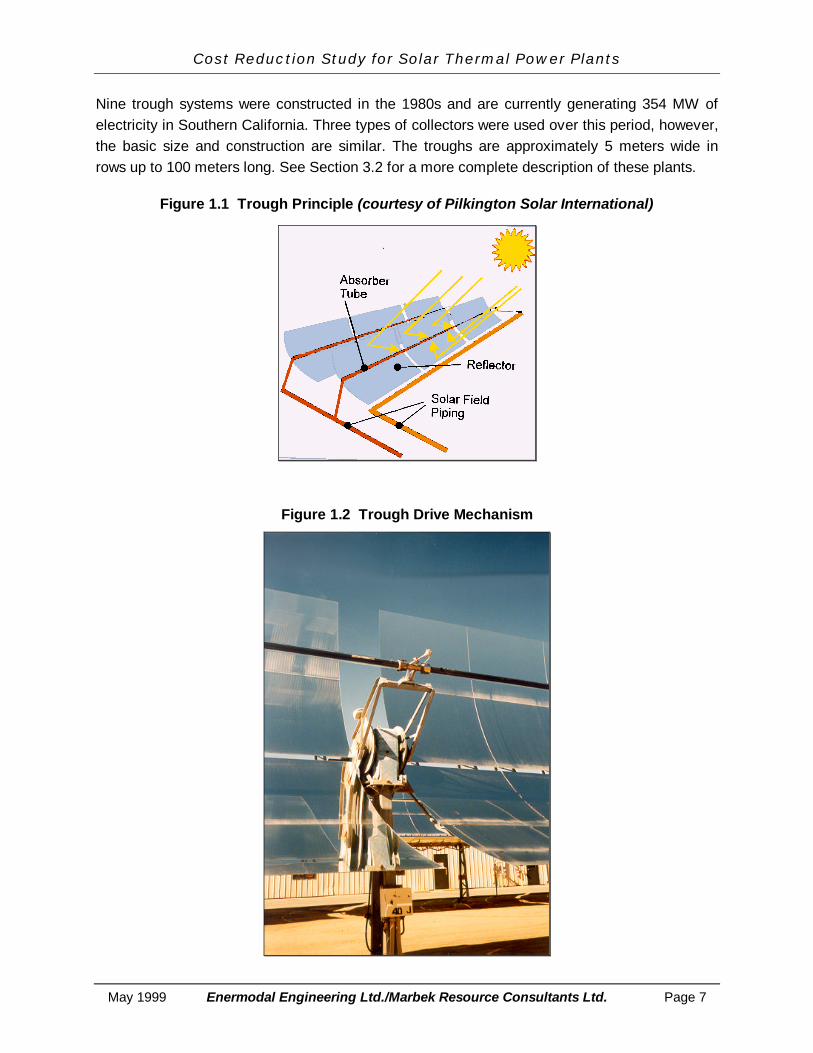
Figure 1.2 Trough Drive Mechanism
Cost Reduction Study for Solar Thermal Power Plants
Page 8 Enermodal Engineering Ltd./Marbek Resource Consultants Ltd. May 1999
1.3.2 Central Receivers
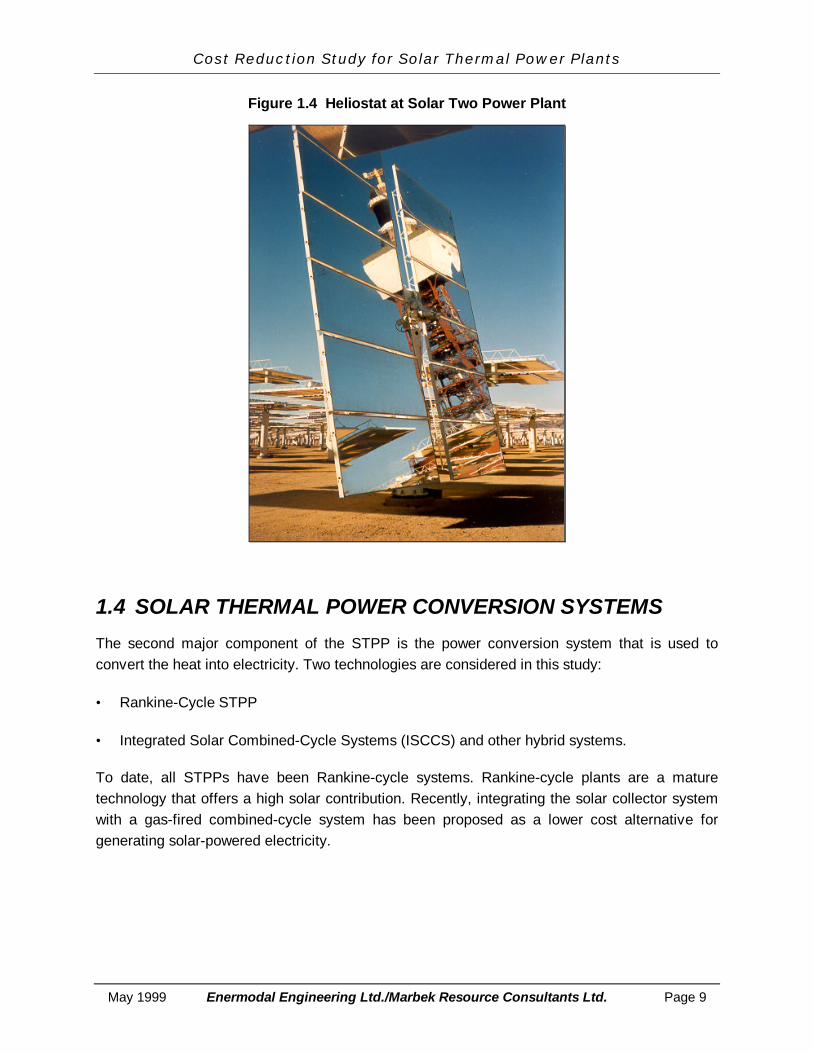
Central receivers, or power towers, consist of a central tower surrounded by a large array ofmirrors or heliostats. The heliostats are flat mirrors that track the sun on two axes (east to westand up and down). The heliostats reflect the sun’s rays onto the central receiver. The sun’senergy is transferred to a fluid: water, air, liquid metal and molten salt have been used. This fluidis then pumped to a heat exchanger or directly to a turbine generator.
Central receivers can achieve higher concentration ratios (800) and therefore higher deliverytemperatures than parabolic troughs (up to 565oC). The solar collection efficiency isapproximately 46% and the peak electrical conversion efficiency (i.e., conversion from solarradiation to electricity) is 23%.
Several Central receiver demonstration projects have been constructed around the world andone commercial plant was built in Southern California: Solar One. Solar One was recentlymodified and is now referred to as Solar Two. For more information on these systems seeSection 3.3.
Figure 1.3 Tower Principle
(courtesy of Pilkington Solar International)
Cost Reduction Study for Solar Thermal Power Plants
May 1999 Enermodal Engineering Ltd./Marbek Resource Consultants Ltd. Page 9
Figure 1.4 Heliostat at Solar Two Power Plant
1.4 SOLAR THERMAL POWER CONVERSION SYSTEMS
The second major component of the STPP is the power conversion system that is used toconvert the heat into electricity. Two technologies are considered in this study:
• Rankine-Cycle STPP
• Integrated Solar Combined-Cycle Systems (ISCCS) and other hybrid systems.
To date, all STPPs have been Rankine-cycle systems. Rankine-cycle plants are a maturetechnology that offers a high solar contribution. Recently, integrating the solar collector systemwith a gas-fired combined-cycle system has been proposed as a lower cost alternative forgenerating solar-powered electricity.
Cost Reduction Study for Solar Thermal Power Plants
Page 10 Enermodal Engineering Ltd./Marbek Resource Consultants Ltd. May 1999
1.4.1 Rankine-Cycle Systems
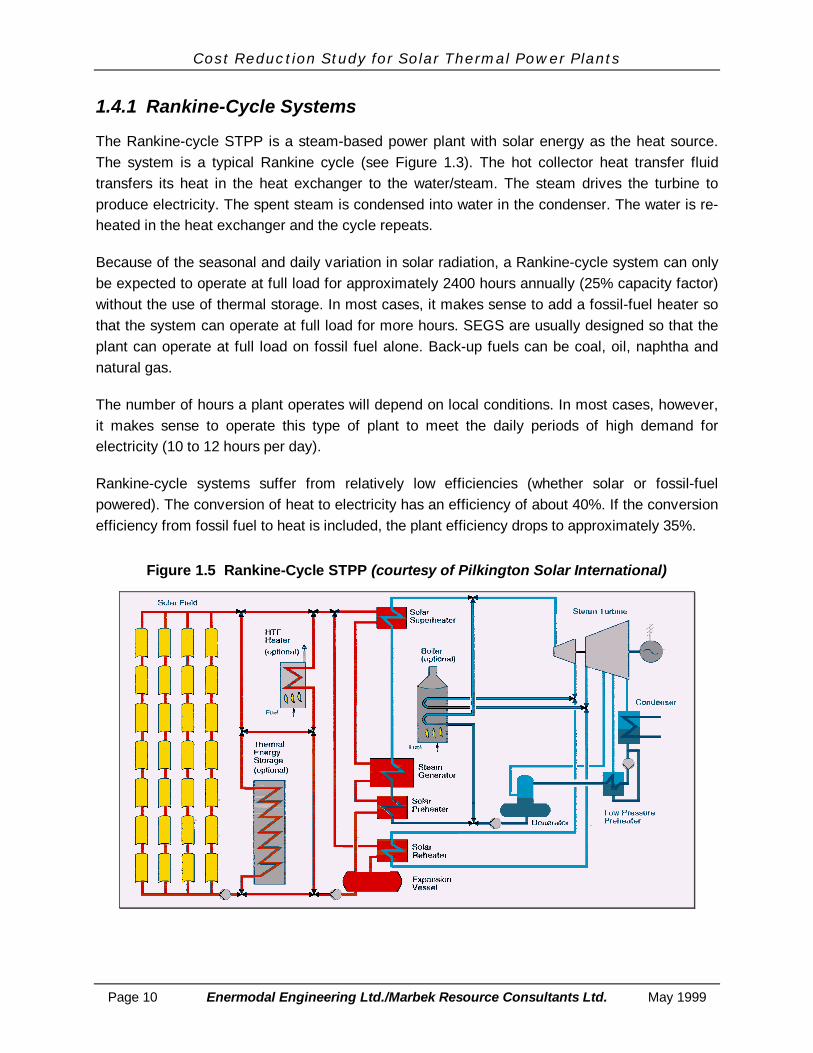
The Rankine-cycle STPP is a steam-based power plant with solar energy as the heat source.The system is a typical Rankine cycle (see Figure 1.3). The hot collector heat transfer fluidtransfers its heat in the heat exchanger to the water/steam. The steam drives the turbine toproduce electricity. The spent steam is condensed into water in the condenser. The water is re-heated in the heat exchanger and the cycle repeats.
Because of the seasonal and daily variation in solar radiation, a Rankine-cycle system can onlybe expected to operate at full load for approximately 2400 hours annually (25% capacity factor)without the use of thermal storage. In most cases, it makes sense to add a fossil-fuel heater sothat the system can operate at full load for more hours. SEGS are usually designed so that theplant can operate at full load on fossil fuel alone. Back-up fuels can be coal, oil, naphtha andnatural gas.
The number of hours a plant operates will depend on local conditions. In most cases, however,it makes sense to operate this type of plant to meet the daily periods of high demand forelectricity (10 to 12 hours per day).
Rankine-cycle systems suffer from relatively low efficiencies (whether solar or fossil-fuelpowered). The conversion of heat to electricity has an efficiency of about 40%. If the conversionefficiency from fossil fuel to heat is included, the plant efficiency drops to approximately 35%.
Figure 1.5 Rankine-Cycle STPP (courtesy of Pilkington Solar International)
Cost Reduction Study for Solar Thermal Power Plants
May 1999 Enermodal Engineering Ltd./Marbek Resource Consultants Ltd. Page 11
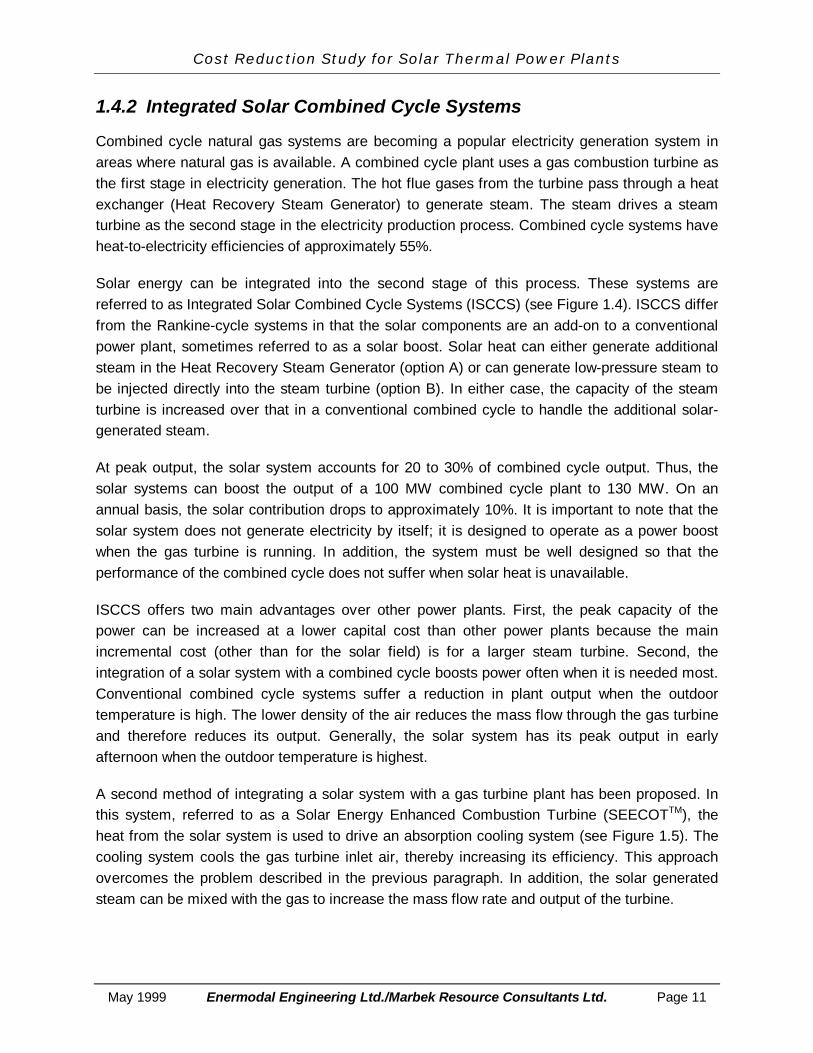
1.4.2 Integrated Solar Combined Cycle Systems
Combined cycle natural gas systems are becoming a popular electricity generation system inareas where natural gas is available. A combined cycle plant uses a gas combustion turbine asthe first stage in electricity generation. The hot flue gases from the turbine pass through a heatexchanger (Heat Recovery Steam Generator) to generate steam. The steam drives a steamturbine as the second stage in the electricity production process. Combined cycle systems haveheat-to-electricity efficiencies of approximately 55%.
Solar energy can be integrated into the second stage of this process. These systems arereferred to as Integrated Solar Combined Cycle Systems (ISCCS) (see Figure 1.4). ISCCS differfrom the Rankine-cycle systems in that the solar components are an add-on to a conventionalpower plant, sometimes referred to as a solar boost. Solar heat can either generate additionalsteam in the Heat Recovery Steam Generator (option A) or can generate low-pressure steam tobe injected directly into the steam turbine (option B). In either case, the capacity of the steamturbine is increased over that in a conventional combined cycle to handle the additional solar-generated steam.
At peak output, the solar system accounts for 20 to 30% of combined cycle output. Thus, thesolar systems can boost the output of a 100 MW combined cycle plant to 130 MW. On anannual basis, the solar contribution drops to approximately 10%. It is important to note that thesolar system does not generate electricity by itself; it is designed to operate as a power boostwhen the gas turbine is running. In addition, the system must be well designed so that theperformance of the combined cycle does not suffer when solar heat is unavailable.
ISCCS offers two main advantages over other power plants. First, the peak capacity of thepower can be increased at a lower capital cost than other power plants because the mainincremental cost (other than for the solar field) is for a larger steam turbine. Second, theintegration of a solar system with a combined cycle boosts power often when it is needed most.Conventional combined cycle systems suffer a reduction in plant output when the outdoortemperature is high. The lower density of the air reduces the mass flow through the gas turbineand therefore reduces its output. Generally, the solar system has its peak output in earlyafternoon when the outdoor temperature is highest.
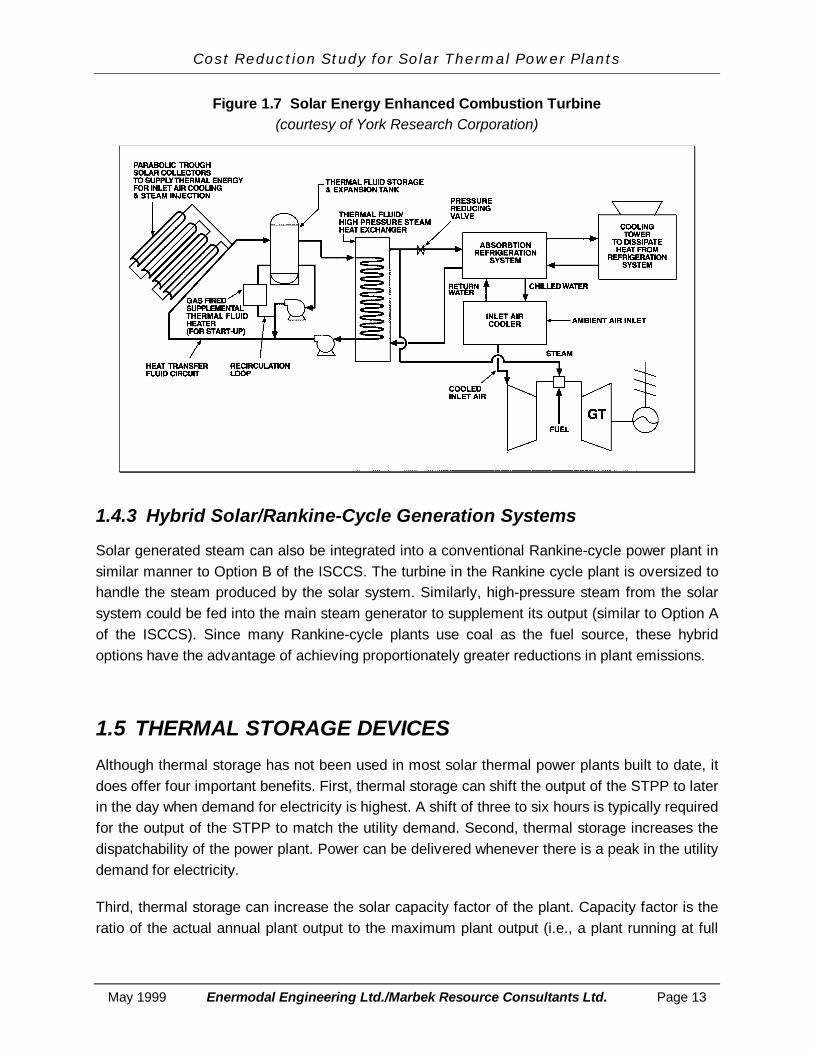
A second method of integrating a solar system with a gas turbine plant has been proposed. Inthis system, referred to as a Solar Energy Enhanced Combustion Turbine (SEECOTTM), theheat from the solar system is used to drive an absorption cooling system (see Figure 1.5). Thecooling system cools the gas turbine inlet air, thereby increasing its efficiency. This approachovercomes the problem described in the previous paragraph. In addition, the solar generatedsteam can be mixed with the gas to increase the mass flow rate and output of the turbine.
Cost Reduction Study for Solar Thermal Power Plants
Page 12 Enermodal Engineering Ltd./Marbek Resource Consultants Ltd. May 1999
The net effect is that the increase in turbine output is many times larger than the energyrequired to generate the steam and to cool the air. The developers of the system attribute thisbenefit to the solar system, whereas it is really a result of the mechanical cooling system thatcould be driven by any energy source. Many utilities have recognized this benefit andmechanically cool the inlet air to the turbine (albeit with conventional power not solar energy).
Figure 1.6 Integrated Solar/Combined Cycle System(courtesy of Pilkington Solar International)
Cost Reduction Study for Solar Thermal Power Plants
May 1999 Enermodal Engineering Ltd./Marbek Resource Consultants Ltd. Page 13
Figure 1.7 Solar Energy Enhanced Combustion Turbine(courtesy of York Research Corporation)
1.4.3 Hybrid Solar/Rankine-Cycle Generation Systems
Solar generated steam can also be integrated into a conventional Rankine-cycle power plant insimilar manner to Option B of the ISCCS. The turbine in the Rankine cycle plant is oversized tohandle the steam produced by the solar system. Similarly, high-pressure steam from the solarsystem could be fed into the main steam generator to supplement its output (similar to Option Aof the ISCCS). Since many Rankine-cycle plants use coal as the fuel source, these hybridoptions have the advantage of achieving proportionately greater reductions in plant emissions.
1.5 THERMAL STORAGE DEVICES
Although thermal storage has not been used in most solar thermal power plants built to date, itdoes offer four important benefits. First, thermal storage can shift the output of the STPP to laterin the day when demand for electricity is highest. A shift of three to six hours is typically requiredfor the output of the STPP to match the utility demand. Second, thermal storage increases thedispatchability of the power plant. Power can be delivered whenever there is a peak in the utilitydemand for electricity.
Third, thermal storage can increase the solar capacity factor of the plant. Capacity factor is theratio of the actual annual plant output to the maximum plant output (i.e., a plant running at full
Cost Reduction Study for Solar Thermal Power Plants
Page 14 Enermodal Engineering Ltd./Marbek Resource Consultants Ltd. May 1999
output 100% of the time). In systems without storage, the annual solar capacity factor is limitedto approximately 25%. The size of the solar field can be increased and thermal storage added toincrease the annual solar capacity factor to over 50%. Fourth, increasing the solar capacityfactor means that the fossil-fuel components of the power plant can be eliminated, making it nolonger necessary for the plant to be close to a source of fuel.
The first parabolic trough system in the U.S. used two large hot and cold storage tanks toprovide three hours of thermal storage. The collector heat transfer fluid was also the heatstorage fluid. This system is, however, restricted to low operating temperatures (307oC). TheHTF in the higher temperature parabolic trough systems is too expensive to serve as the heatstorage medium. A suitable storage medium has yet to be proven but systems using concreteand steel have been proposed.
The higher temperatures in central receiver systems allow molten nitrate salt to act as both theHTF and the storage material (as used in the Solar Two plant). Molten nitrate salt is low-cost,stable and non-toxic.
1.6 FUTURE SOLAR GRID-CONNECTED TECHNOLOGIES
There are several solar thermal technologies that are at the research stage and worthy ofmention. Two of the most promising technologies are solar dishes and photovoltaics. A solardish is a parabolic dish with a heat engine located at the focal point. The heat engine usesStirling or Brayton cycles to produce power within the dish. Peak electrical efficiencies of up to30% have been achieved. Photovoltaics or solar cells convert sunlight directly into electricityand are commonly used to supply electricity for off-grid applications. Commercial solar cellshave electrical conversion efficiencies of up to 16%, although most operate at closer to 10%efficiency.
Currently, these systems produce power that is at least three time more expensive thanparabolic trough systems [DOE/EPRI, 1997]. The DOE/EPRI study projected that withtechnological advances these systems may be able to produce power at a lower cost by theyear 2030.
Two more-speculative technologies are solar chimneys and solar ponds. The solar chimneyconsists of a large glazed area with a chimney in the middle. Air under the glazing is heated bythe sun and rises up the chimney. A wind turbine in the chimney converts this motion intoelectricity. In a solar pond, layers of water with increasing salt content fill a shallow pond. Thesun’s rays are absorbed in the lower layers of the pond. The temperature gradient between theupper and lower layers of the pond drives a heat engine. Both of these systems are simple andrelatively low cost. Their primary disadvantage is low solar conversion efficiency (under 1%).
Cost Reduction Study for Solar Thermal Power Plants
May 1999 Enermodal Engineering Ltd./Marbek Resource Consultants Ltd. Page 15
1.7 SUMMARY
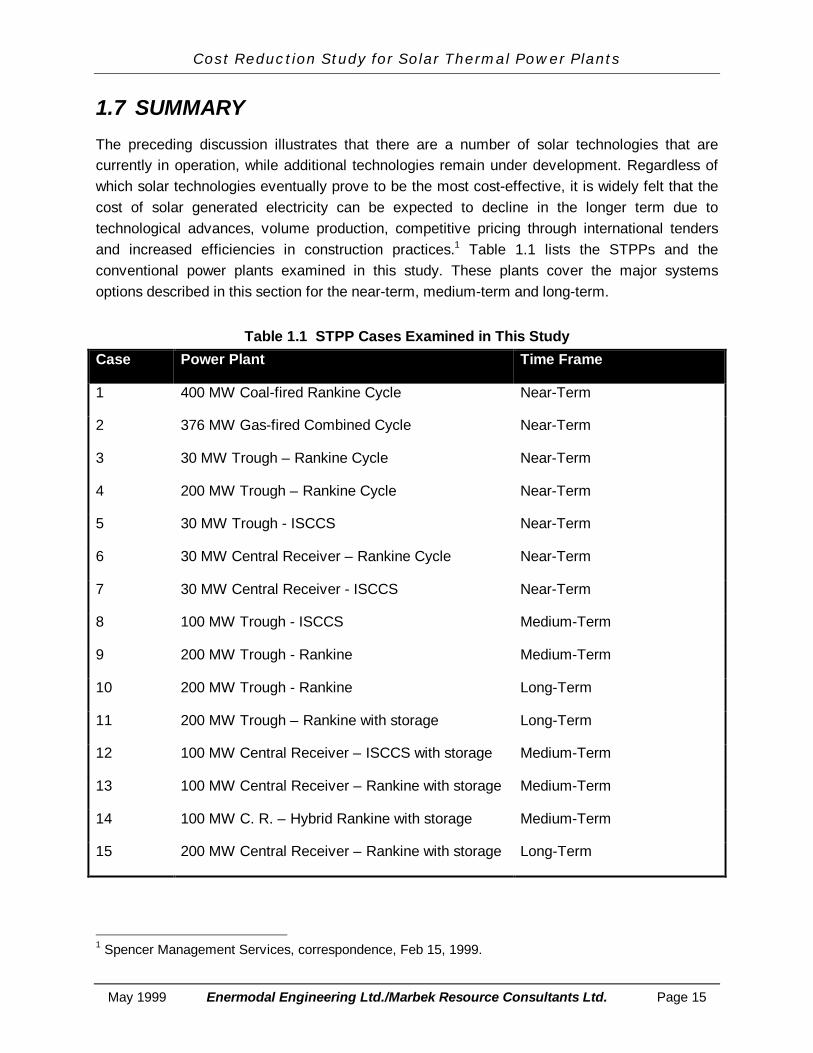
The preceding discussion illustrates that there are a number of solar technologies that arecurrently in operation, while additional technologies remain under development. Regardless ofwhich solar technologies eventually prove to be the most cost-effective, it is widely felt that thecost of solar generated electricity can be expected to decline in the longer term due totechnological advances, volume production, competitive pricing through international tendersand increased efficiencies in construction practices.1 Table 1.1 lists the STPPs and theconventional power plants examined in this study. These plants cover the major systemsoptions described in this section for the near-term, medium-term and long-term.
Table 1.1 STPP Cases Examined in This StudyCase Power Plant Time Frame
1 400 MW Coal-fired Rankine Cycle Near-Term
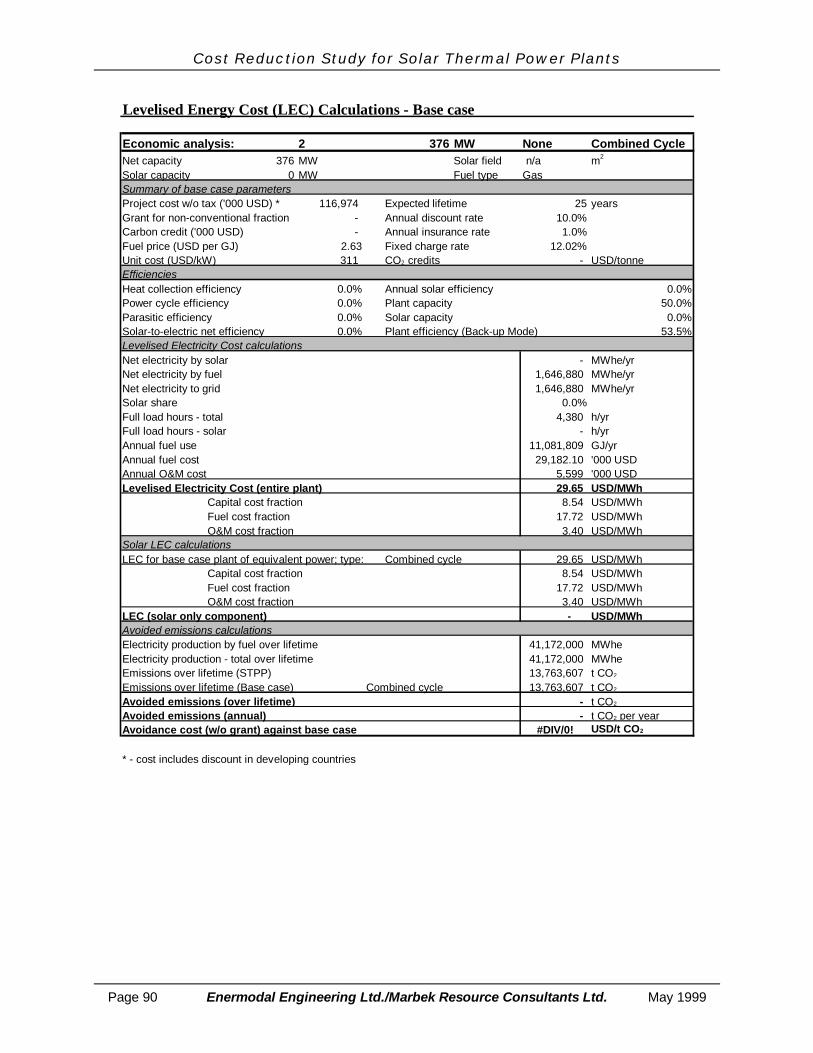
2 376 MW Gas-fired Combined Cycle Near-Term
3 30 MW Trough – Rankine Cycle Near-Term
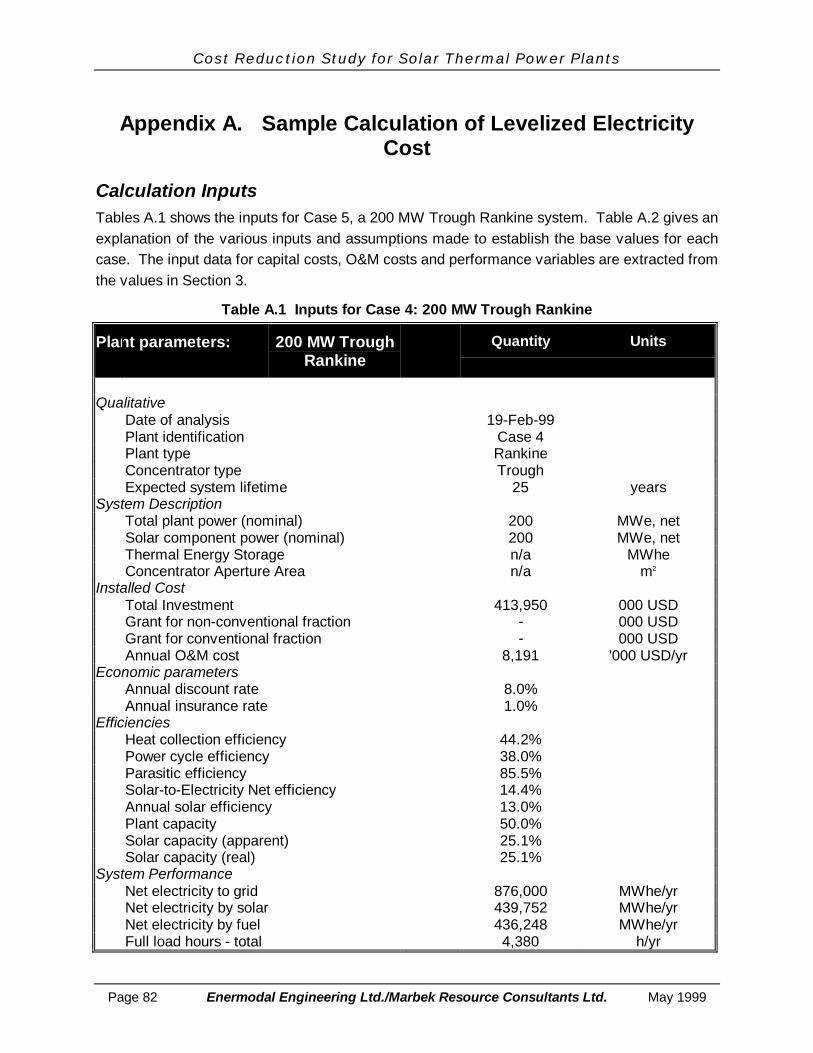
4 200 MW Trough – Rankine Cycle Near-Term
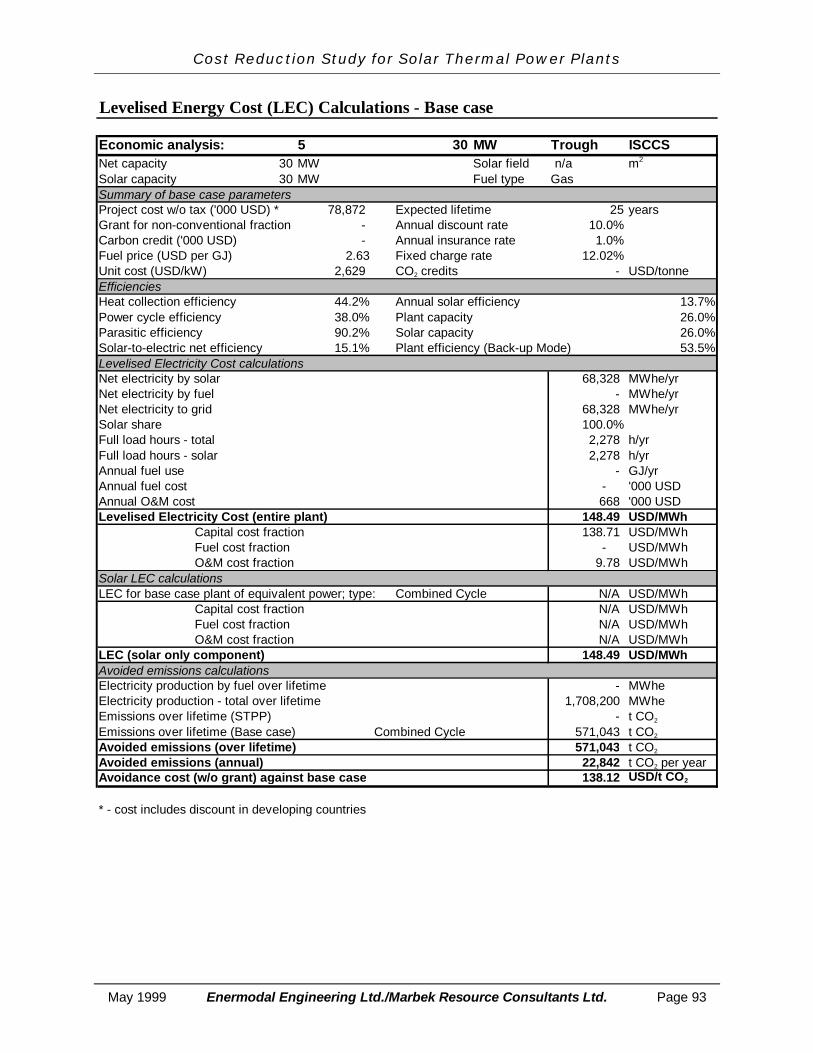
5 30 MW Trough - ISCCS Near-Term
6 30 MW Central Receiver – Rankine Cycle Near-Term
7 30 MW Central Receiver - ISCCS Near-Term
8 100 MW Trough - ISCCS Medium-Term
9 200 MW Trough - Rankine Medium-Term
10 200 MW Trough - Rankine Long-Term
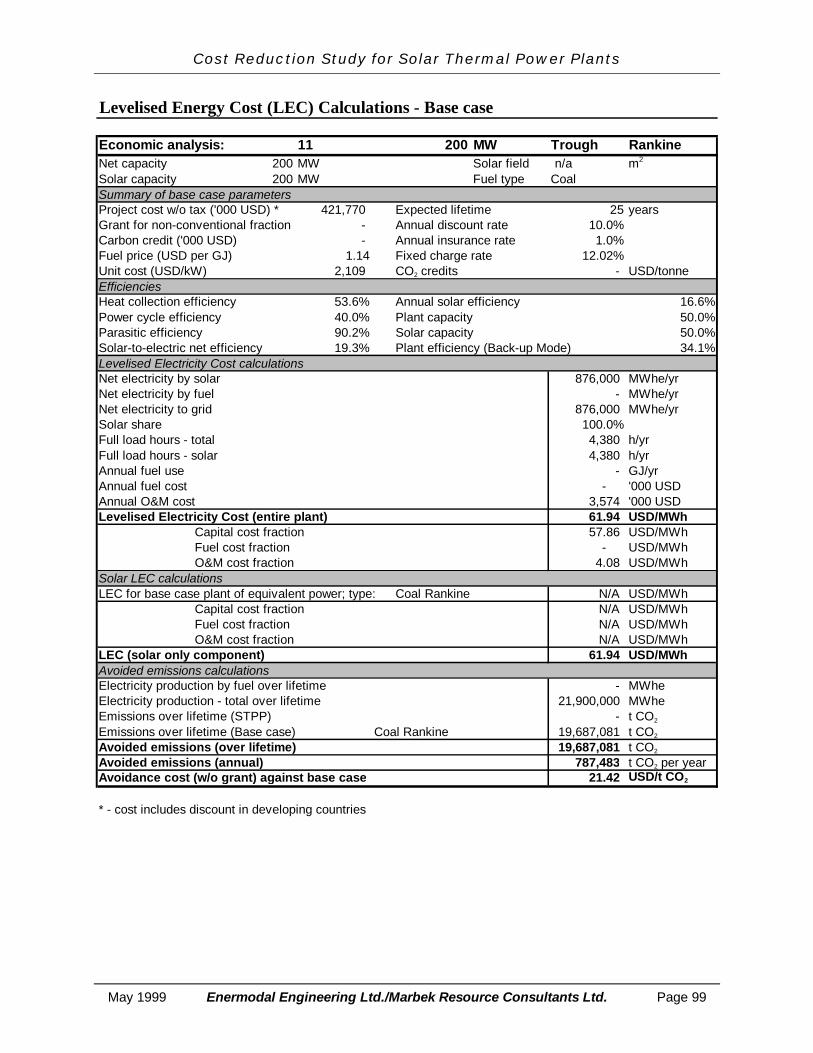
11 200 MW Trough – Rankine with storage Long-Term
12 100 MW Central Receiver – ISCCS with storage Medium-Term
13 100 MW Central Receiver – Rankine with storage Medium-Term
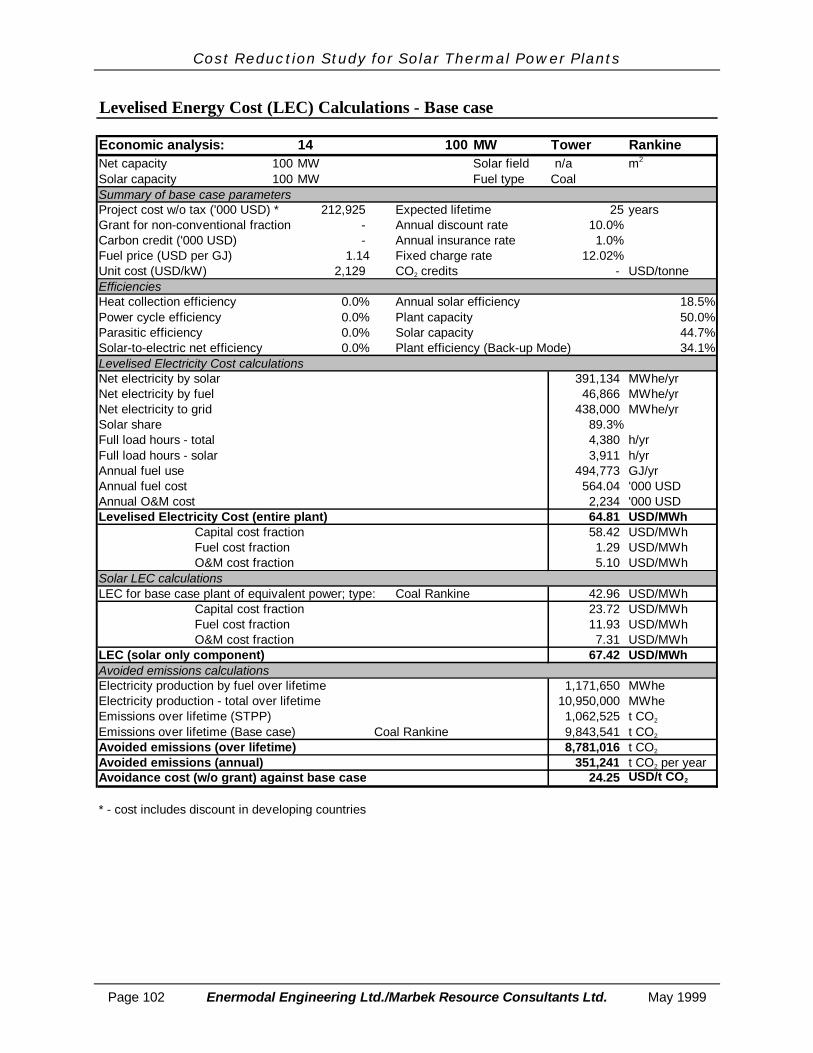
14 100 MW C. R. – Hybrid Rankine with storage Medium-Term
15 200 MW Central Receiver – Rankine with storage Long-Term
1 Spencer Management Services, correspondence, Feb 15, 1999.
Cost Reduction Study for Solar Thermal Power Plants
Page 16 Enermodal Engineering Ltd./Marbek Resource Consultants Ltd. May 1999
2. THE MARKET FOR STPP
2.1 INTRODUCTION
The second important consideration addressed by this study is whether there is sufficientmarket potential to fully support the increased scale of STPP production that would be requiredto achieve price parity with conventional electricity generation options. As such, this sectionbriefly identifies suitable market regions for STPPs together with forecast rates of growth inelectricity demand. Solar-generated electricity is available only during daylight hours (althoughwith storage it can be available into the evening to provide a better match to the utility loadcurve). Therefore, this section also provides a review of typical electricity load curves in thecandidate regions and comments on the compatibility of the STPPs with local loads.
2.2 SUITABLE REGIONS FOR STPP
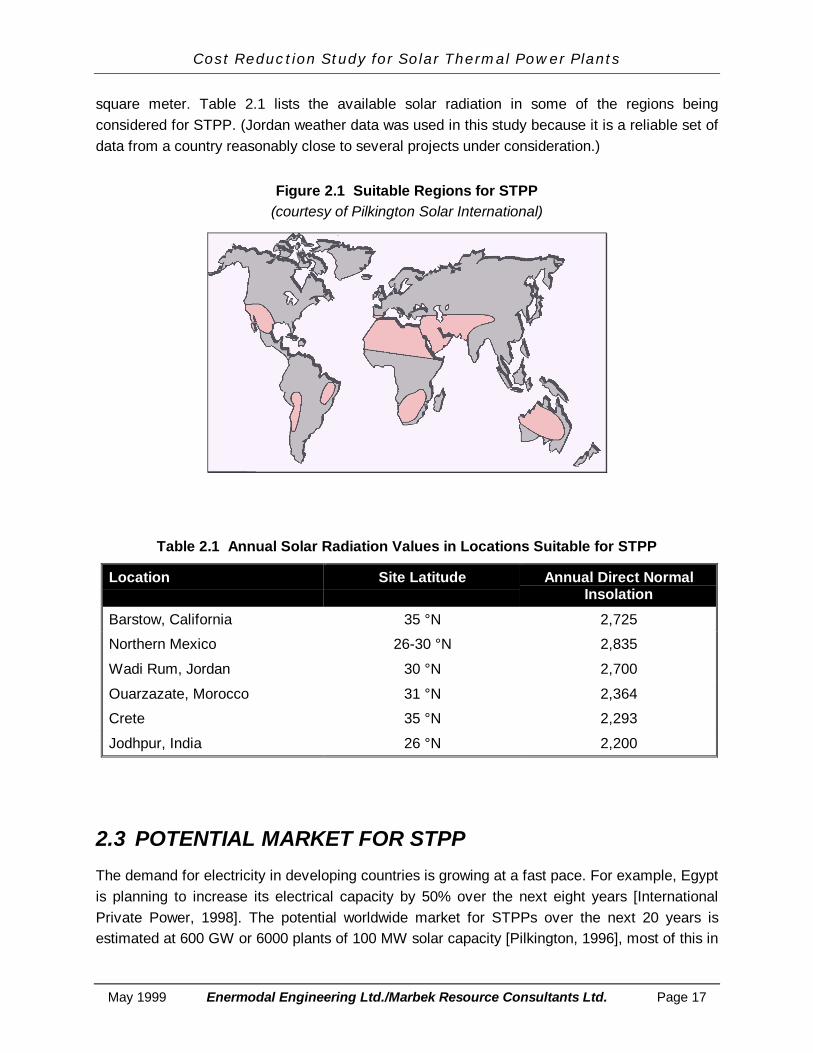
Concentrating solar collectors, such as parabolic troughs and central receivers, can onlyconcentrate direct solar radiation (as opposed to diffuse solar radiation). Thus, STPP will onlyperform well in very sunny locations, specifically the arid and semi-arid regions of the world.Although the tropics can have high solar radiation, the high diffuse solar radiation and long rainyseasons make these regions less desirable for STPP. Figure 2.1 shows the promising regionsfor STPP. These regions can be divided into six geographic areas:
• Southern Africa,
• Mediterranean countries (including North Africa, Middle East and Southern Europe),
• Parts of India and Pakistan,
• Parts of Brazil and Chile,
• Mexico and southwest U.S., and
• Australia.
With the exception of the Southern Europe, Southwest U.S. and Australia, the countries in theseregions could qualify for World Bank/GEF support.
Suitable regions for STPP should have annual solar radiation values of at least 1700 kWh persquare meter. The best sites for STPP have solar radiation values in excess of 2700 kWh per
Cost Reduction Study for Solar Thermal Power Plants
May 1999 Enermodal Engineering Ltd./Marbek Resource Consultants Ltd. Page 17
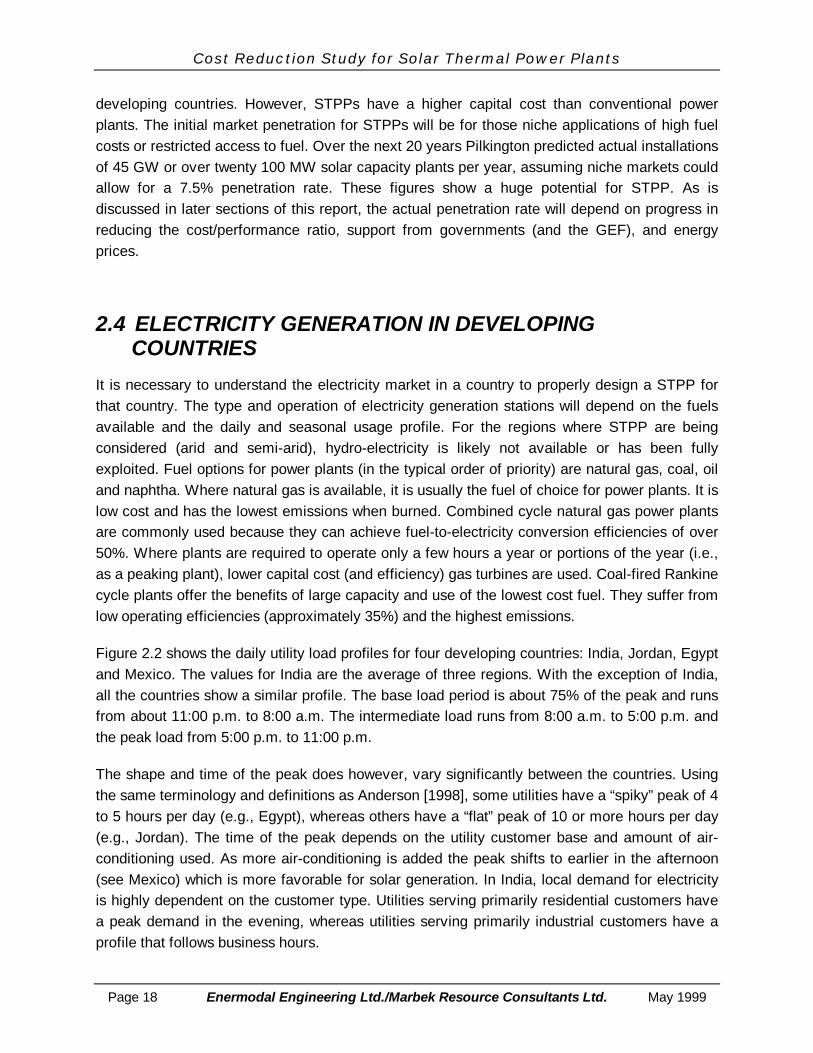
square meter. Table 2.1 lists the available solar radiation in some of the regions beingconsidered for STPP. (Jordan weather data was used in this study because it is a reliable set ofdata from a country reasonably close to several projects under consideration.)
Figure 2.1 Suitable Regions for STPP(courtesy of Pilkington Solar International)
Table 2.1 Annual Solar Radiation Values in Locations Suitable for STPP
Location Site Latitude Annual Direct NormalInsolation
Barstow, California 35 °N 2,725
Northern Mexico 26-30 °N 2,835
Wadi Rum, Jordan 30 °N 2,700
Ouarzazate, Morocco 31 °N 2,364
Crete 35 °N 2,293
Jodhpur, India 26 °N 2,200
2.3 POTENTIAL MARKET FOR STPP
The demand for electricity in developing countries is growing at a fast pace. For example, Egyptis planning to increase its electrical capacity by 50% over the next eight years [InternationalPrivate Power, 1998]. The potential worldwide market for STPPs over the next 20 years isestimated at 600 GW or 6000 plants of 100 MW solar capacity [Pilkington, 1996], most of this in
Cost Reduction Study for Solar Thermal Power Plants
Page 18 Enermodal Engineering Ltd./Marbek Resource Consultants Ltd. May 1999
developing countries. However, STPPs have a higher capital cost than conventional powerplants. The initial market penetration for STPPs will be for those niche applications of high fuelcosts or restricted access to fuel. Over the next 20 years Pilkington predicted actual installationsof 45 GW or over twenty 100 MW solar capacity plants per year, assuming niche markets couldallow for a 7.5% penetration rate. These figures show a huge potential for STPP. As isdiscussed in later sections of this report, the actual penetration rate will depend on progress inreducing the cost/performance ratio, support from governments (and the GEF), and energyprices.
2.4 ELECTRICITY GENERATION IN DEVELOPING COUNTRIES
It is necessary to understand the electricity market in a country to properly design a STPP forthat country. The type and operation of electricity generation stations will depend on the fuelsavailable and the daily and seasonal usage profile. For the regions where STPP are beingconsidered (arid and semi-arid), hydro-electricity is likely not available or has been fullyexploited. Fuel options for power plants (in the typical order of priority) are natural gas, coal, oiland naphtha. Where natural gas is available, it is usually the fuel of choice for power plants. It islow cost and has the lowest emissions when burned. Combined cycle natural gas power plantsare commonly used because they can achieve fuel-to-electricity conversion efficiencies of over50%. Where plants are required to operate only a few hours a year or portions of the year (i.e.,as a peaking plant), lower capital cost (and efficiency) gas turbines are used. Coal-fired Rankinecycle plants offer the benefits of large capacity and use of the lowest cost fuel. They suffer fromlow operating efficiencies (approximately 35%) and the highest emissions.
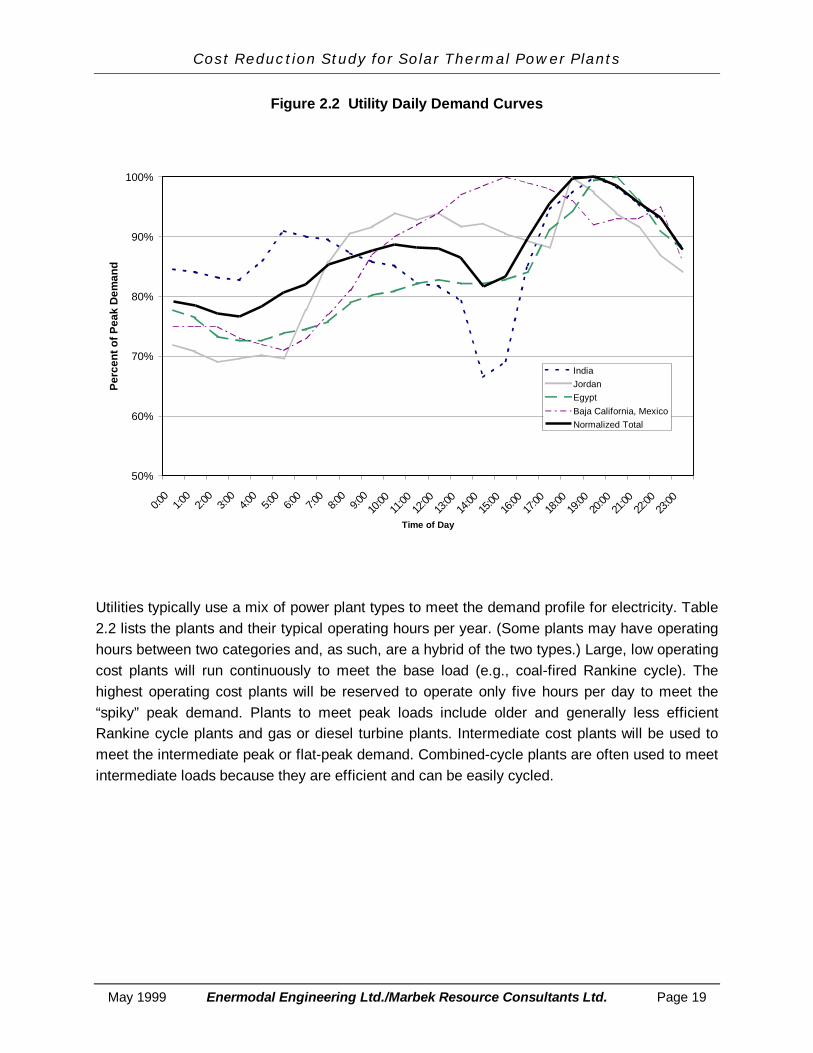
Figure 2.2 shows the daily utility load profiles for four developing countries: India, Jordan, Egyptand Mexico. The values for India are the average of three regions. With the exception of India,all the countries show a similar profile. The base load period is about 75% of the peak and runsfrom about 11:00 p.m. to 8:00 a.m. The intermediate load runs from 8:00 a.m. to 5:00 p.m. andthe peak load from 5:00 p.m. to 11:00 p.m.
The shape and time of the peak does however, vary significantly between the countries. Usingthe same terminology and definitions as Anderson [1998], some utilities have a “spiky” peak of 4to 5 hours per day (e.g., Egypt), whereas others have a “flat” peak of 10 or more hours per day(e.g., Jordan). The time of the peak depends on the utility customer base and amount of air-conditioning used. As more air-conditioning is added the peak shifts to earlier in the afternoon(see Mexico) which is more favorable for solar generation. In India, local demand for electricityis highly dependent on the customer type. Utilities serving primarily residential customers havea peak demand in the evening, whereas utilities serving primarily industrial customers have aprofile that follows business hours.
Cost Reduction Study for Solar Thermal Power Plants
May 1999 Enermodal Engineering Ltd./Marbek Resource Consultants Ltd. Page 19
Figure 2.2 Utility Daily Demand Curves
50%
60%
70%
80%
90%
100%
0:00
1:00
2:00
3:00
4:00
5:00
6:00
7:00
8:00
9:00
10:00
11:00
12:00
13:00
14:00
15:00
16:00
17:00
18:00
19:00
20:00
21:00
22:00
23:00
Time of Day
Per
cent
of P
eak
Dem
and
IndiaJordanEgyptBaja California, MexicoNormalized Total
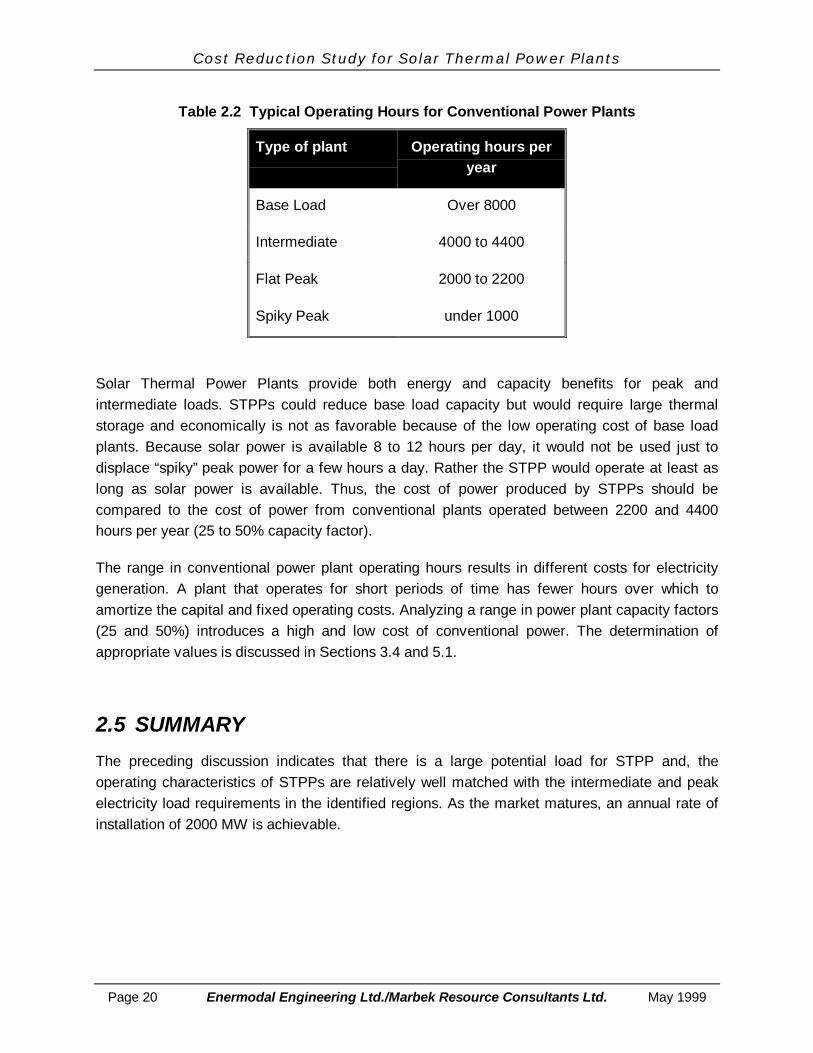
Utilities typically use a mix of power plant types to meet the demand profile for electricity. Table2.2 lists the plants and their typical operating hours per year. (Some plants may have operatinghours between two categories and, as such, are a hybrid of the two types.) Large, low operatingcost plants will run continuously to meet the base load (e.g., coal-fired Rankine cycle). Thehighest operating cost plants will be reserved to operate only five hours per day to meet the“spiky” peak demand. Plants to meet peak loads include older and generally less efficientRankine cycle plants and gas or diesel turbine plants. Intermediate cost plants will be used tomeet the intermediate peak or flat-peak demand. Combined-cycle plants are often used to meetintermediate loads because they are efficient and can be easily cycled.
Cost Reduction Study for Solar Thermal Power Plants
Page 20 Enermodal Engineering Ltd./Marbek Resource Consultants Ltd. May 1999
Table 2.2 Typical Operating Hours for Conventional Power Plants
Type of plant Operating hours peryear
Base Load Over 8000
Intermediate 4000 to 4400
Flat Peak 2000 to 2200
Spiky Peak under 1000
Solar Thermal Power Plants provide both energy and capacity benefits for peak andintermediate loads. STPPs could reduce base load capacity but would require large thermalstorage and economically is not as favorable because of the low operating cost of base loadplants. Because solar power is available 8 to 12 hours per day, it would not be used just todisplace “spiky” peak power for a few hours a day. Rather the STPP would operate at least aslong as solar power is available. Thus, the cost of power produced by STPPs should becompared to the cost of power from conventional plants operated between 2200 and 4400hours per year (25 to 50% capacity factor).
The range in conventional power plant operating hours results in different costs for electricitygeneration. A plant that operates for short periods of time has fewer hours over which toamortize the capital and fixed operating costs. Analyzing a range in power plant capacity factors(25 and 50%) introduces a high and low cost of conventional power. The determination ofappropriate values is discussed in Sections 3.4 and 5.1.
2.5 SUMMARY
The preceding discussion indicates that there is a large potential load for STPP and, theoperating characteristics of STPPs are relatively well matched with the intermediate and peakelectricity load requirements in the identified regions. As the market matures, an annual rate ofinstallation of 2000 MW is achievable.
Cost Reduction Study for Solar Thermal Power Plants
May 1999 Enermodal Engineering Ltd./Marbek Resource Consultants Ltd. Page 21
3. STPP COST & PERFORMANCE EXPERIENCETO DATE
3.1 INTRODUCTION
The preceding sections have provided an overview of the current STPP technologies and haveconfirmed that the potential market size is sufficiently large to support large-scale deployment,provided that cost and performance requirements can be met.
This section provides a summary of the STPP installation and operating experience to date. Abrief historical background is provided for each technology, together with a summary ofinstallation and operating costs. Accumulated experience related to other key operatingconsiderations, such as capacity factors, reliability, etc., are also reported from the availableliterature sources. Comparable data is also provided for the two conventional power plants thatserve as the study’s baseline. The information in this section provides the basis for the inputsinto the calculation of levelized energy costs that are presented in the next section.
3.2 PARABOLIC TROUGH STPP
3.2.1 Background
Parabolic trough STPPs are the most mature of the solar thermal power plants. Between 1984and 1991, Luz International Ltd. constructed nine Rankine-cycle SEGS plants in the MojaveDesert of southern California. The details of these plants are summarized in Table 3.1. The firstplant included a large thermal storage reservoir and no back-up heat source. The remainingeight plants use natural gas as the back-up heating fuel to a maximum of 25% of the energyinput (as limited by U.S. federal law to qualify as a solar plant). No storage was used. Luzdesigned, built, supplied the collectors and operated the plants. The power was sold toSouthern California Edison (SCE) under a long-term contract. The size, performance andefficiency increased with each successive plant. Similarly, the cost per kilowatt fell with eachplant. The cost of power production from these plants fell by almost 60% over this time period.
Luz filed for bankruptcy in 1991 primarily because of the reduction in solar credits from thegovernment and declining energy prices. Following the failure of the Luz Corporation, the plantshave continued to operate for upwards of 15 years demonstrating the reliability of thetechnology. The plants have consistently exceeded their design capacity during the utility peaksummer period.
Cost Reduction Study for Solar Thermal Power Plants
Page 22 Enermodal Engineering Ltd./Marbek Resource Consultants Ltd. May 1999
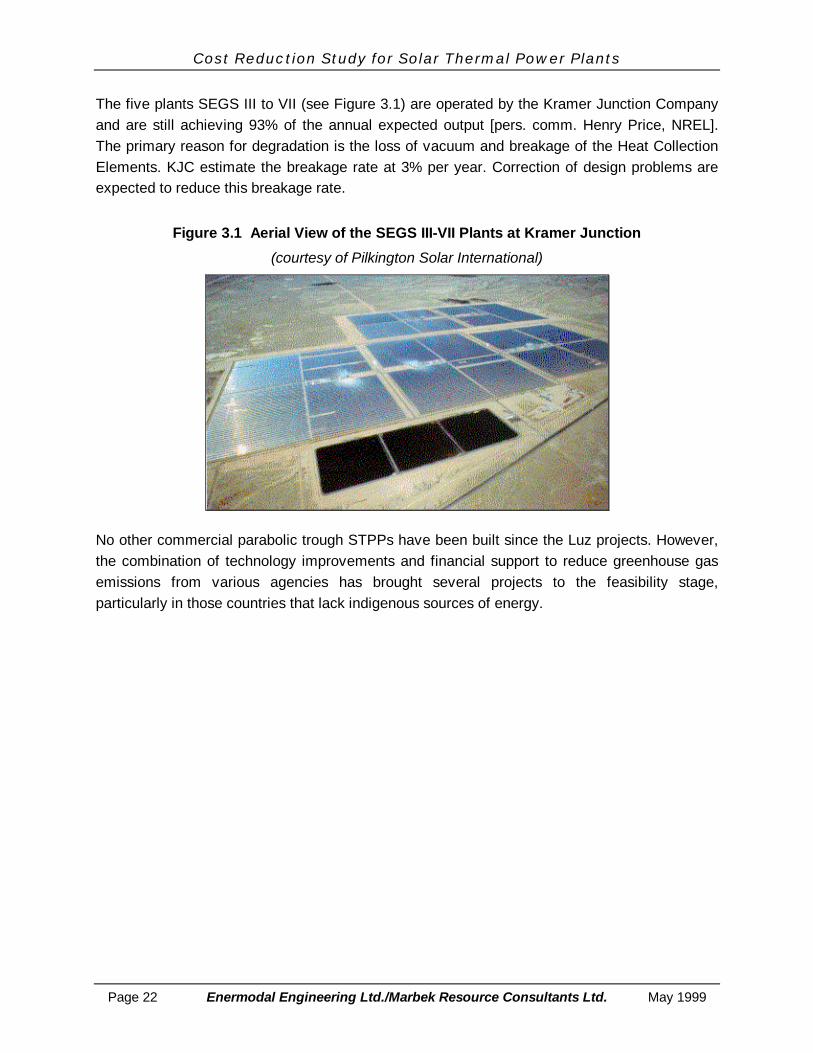
The five plants SEGS III to VII (see Figure 3.1) are operated by the Kramer Junction Companyand are still achieving 93% of the annual expected output [pers. comm. Henry Price, NREL].The primary reason for degradation is the loss of vacuum and breakage of the Heat CollectionElements. KJC estimate the breakage rate at 3% per year. Correction of design problems areexpected to reduce this breakage rate.
Figure 3.1 Aerial View of the SEGS III-VII Plants at Kramer Junction
(courtesy of Pilkington Solar International)
No other commercial parabolic trough STPPs have been built since the Luz projects. However,the combination of technology improvements and financial support to reduce greenhouse gasemissions from various agencies has brought several projects to the feasibility stage,particularly in those countries that lack indigenous sources of energy.
Cost Reduction Study for Solar Thermal Power Plants
May 1999 Enermodal Engineering Ltd./Marbek Resource Consultants Ltd. Page 23
3.2.2 Parabolic Trough - Systems Assessed in This Study
Two parabolic trough STPPs are examined: Rankine-cycle and ISCCS. ISCCS are generallyseen as the “market entry” system for STPPs. They have a low solar capacity and therefore lowincremental cost and risk. There are several ISCCS proposed for developing countries (withsupport requested from the GEF), typically a 100 MW combined cycle plant with a 30 MW solarboost. In the future, the size of this plant could be increased to 350 MW with a 100 MW solarboost.
In the longer term, as the costs of STPP decrease, there will be a desire to increase the solarcapacity beyond the 10% achievable with ISCCS. Rankine-cycle will become the preferredsystem. Two sizes of SEGS systems are examined. The cost and performance of a 30 MWplant is studied so that a direct comparison can be made to the ISCCS plants. The preferredsize of Rankine cycle SEGS is 200 MW. At this size, most of the economies of scale have beenachieved. Although this size is larger than previous SEGS plants, there is no technical reason
Cost Reduction Study for Solar Thermal Power Plants
Page 24 Enermodal Engineering Ltd./Marbek Resource Consultants Ltd. May 1999
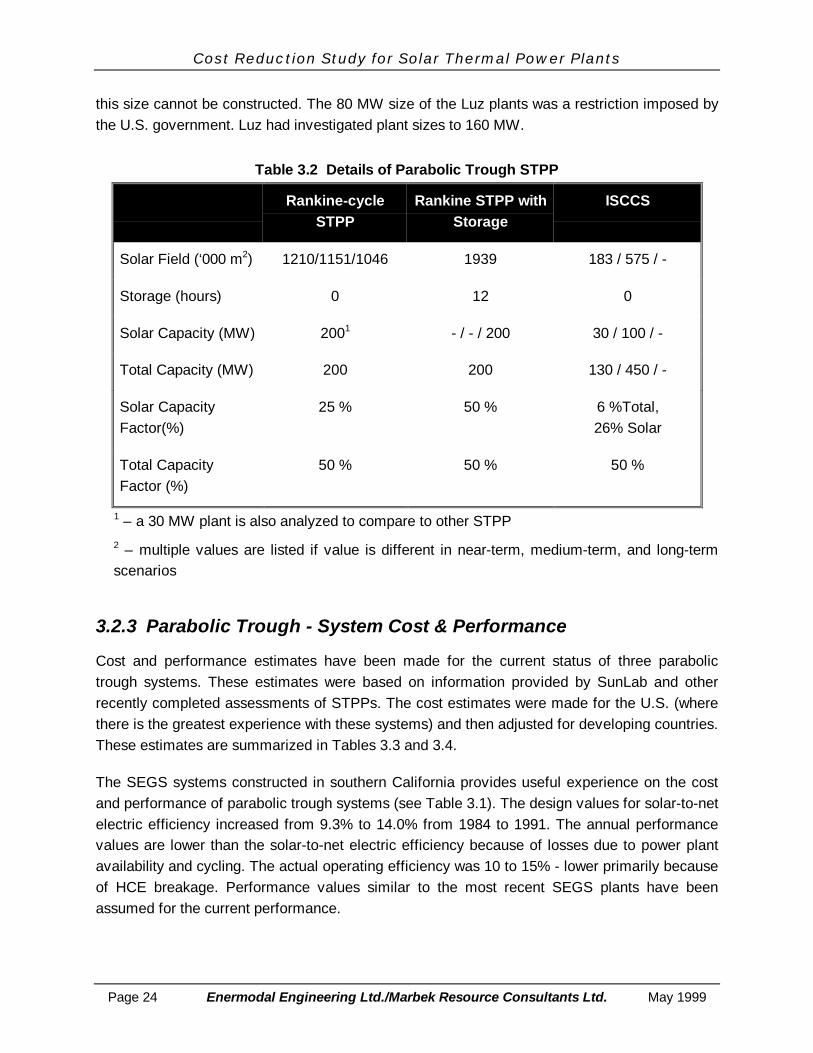
this size cannot be constructed. The 80 MW size of the Luz plants was a restriction imposed bythe U.S. government. Luz had investigated plant sizes to 160 MW.
Table 3.2 Details of Parabolic Trough STPP
Rankine-cycleSTPP
Rankine STPP withStorage
ISCCS
Solar Field (‘000 m2) 1210/1151/1046 1939 183 / 575 / -
Storage (hours) 0 12 0
Solar Capacity (MW) 2001 - / - / 200 30 / 100 / -
Total Capacity (MW) 200 200 130 / 450 / -
Solar CapacityFactor(%)
25 % 50 % 6 %Total,26% Solar
Total CapacityFactor (%)
50 % 50 % 50 %
1 – a 30 MW plant is also analyzed to compare to other STPP2 – multiple values are listed if value is different in near-term, medium-term, and long-termscenarios
3.2.3 Parabolic Trough - System Cost & Performance
Cost and performance estimates have been made for the current status of three parabolictrough systems. These estimates were based on information provided by SunLab and otherrecently completed assessments of STPPs. The cost estimates were made for the U.S. (wherethere is the greatest experience with these systems) and then adjusted for developing countries.These estimates are summarized in Tables 3.3 and 3.4.
The SEGS systems constructed in southern California provides useful experience on the costand performance of parabolic trough systems (see Table 3.1). The design values for solar-to-netelectric efficiency increased from 9.3% to 14.0% from 1984 to 1991. The annual performancevalues are lower than the solar-to-net electric efficiency because of losses due to power plantavailability and cycling. The actual operating efficiency was 10 to 15% - lower primarily becauseof HCE breakage. Performance values similar to the most recent SEGS plants have beenassumed for the current performance.
Cost Reduction Study for Solar Thermal Power Plants
May 1999 Enermodal Engineering Ltd./Marbek Resource Consultants Ltd. Page 25
The cost of parabolic trough plants has fallen over the past 15 years. The cost of the SEGSplants in California fell from $4500/kW to just under $3000/kW between 1984 and 1991 (incurrent $). Based on this experience and cost reductions achieved in the intervening years, thecurrent capital cost is estimated at $3495/kW for a 30 MW plant and $2435/kW for a 200 MWplant. The range in these two prices shows the large impact of system size on capital cost.These values are for a plant constructed in the U.S.
Figure 3.2 shows the estimated costs of parabolic trough plants from recently completedfeasibility studies (Table 3.5) and a line representing the estimated cost for plants in the U.S.The costs for Rankine STPPs range from $2200/kW to $3400/kW. All of these plants appear tobe slightly lower in cost than the U.S. values for the same capacity. The percentage reduction isnot a constant. Spencer Management Associates, 1994 found that because of lower labor costs,the cost of a STPP was 19% cheaper in Mexico than in the U.S. Other cases showed higherand lower reductions. The average difference between the U.S. costs and those from thefeasibility studies for developing countries was close to 15%. In this report, a 15% discount hasbeen applied to the U.S.-based costs to estimate the cost of all STPPs constructed indeveloping countries.
The same costing methodology was used to estimate the solar portion of the ISCCS and theRankine STPP, so that these two system types can be compared directly. The costs in Table3.4 for the ISCCS are for the incremental solar portion. The total plant cost for this system isestimated at $1080/kW in the U.S. If this total ISCCS cost is reduced by 15% to $918/kW, it iscomparable to the results of the 1998 Morocco study ($877). The costs for the Mexico study arehigher but they do not reflect the recent reduction in conventional combined cycle costs.
The operation and maintenance costs for the complex of SEGS III to VII are currently runningbetween 3 and 3.5 cents per kWh [pers. com. Mr. S. Frier, KJC, 1999]. The O & M costs on aper kilowatt-hour basis are high at these plants because of their small size (30 MW) and therelatively high failure rate of the HCE. SunLab estimates that O & M costs for a new design of30 MW plant would be a third lower at 1.9 cents/kWh. O & M costs for one 200 MW plant wouldbe lower still (at 1.1 cents per kWh) because the same number of operators can be used for thislarger plant.
Annual O & M costs for STPP have been estimated at 0.7 to 1.1 cents/kWh in Mexico [SpencerManagement Associates, 1994] and 1.0 cents/kWh in Jordan [Geyer, 1997]. These values areslightly lower than the values given in Table 3.4, again suggesting that costs are lower indeveloping countries. Accordingly, the O & M costs listed in Table 3.4 are reduced by 15% forthe analysis of developing country projects in this report.
Cost Reduction Study for Solar Thermal Power Plants
Page 26 Enermodal Engineering Ltd./Marbek Resource Consultants Ltd. May 1999
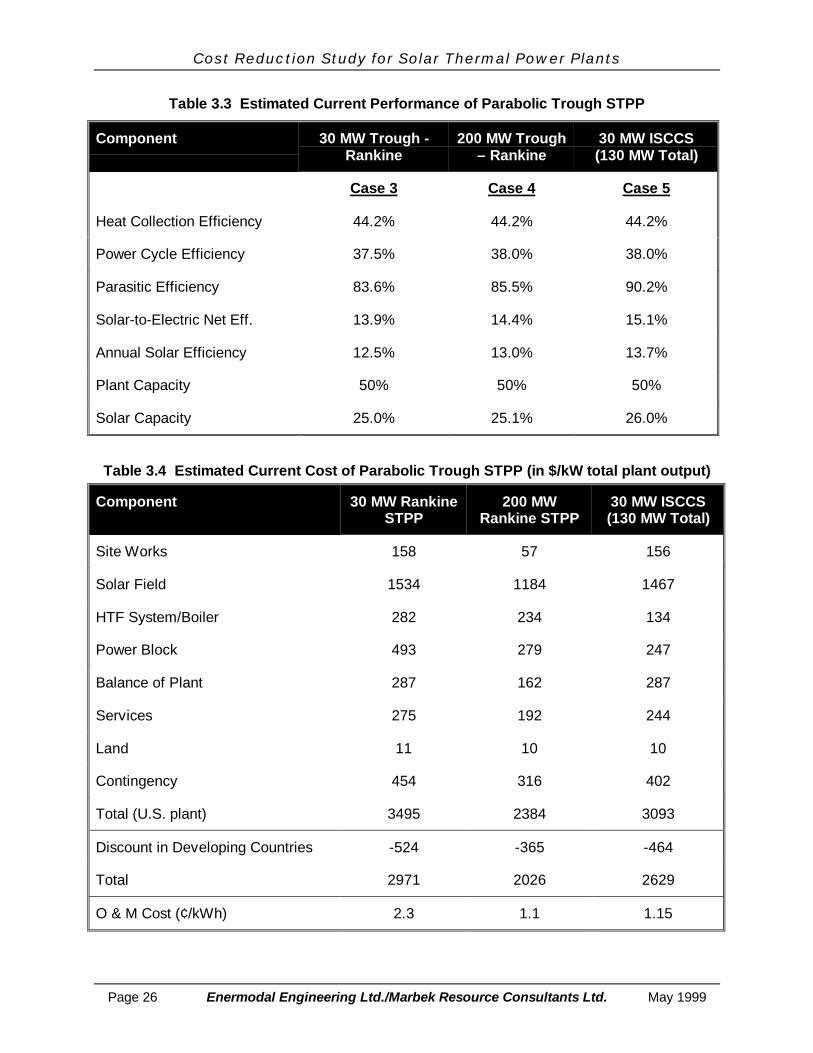
Table 3.3 Estimated Current Performance of Parabolic Trough STPP
Component 30 MW Trough -Rankine
200 MW Trough– Rankine
30 MW ISCCS(130 MW Total)
Heat Collection Efficiency
Case 3
44.2%
Case 4
44.2%
Case 5
44.2%
Power Cycle Efficiency 37.5% 38.0% 38.0%
Parasitic Efficiency 83.6% 85.5% 90.2%
Solar-to-Electric Net Eff. 13.9% 14.4% 15.1%
Annual Solar Efficiency 12.5% 13.0% 13.7%
Plant Capacity 50% 50% 50%
Solar Capacity 25.0% 25.1% 26.0%
Table 3.4 Estimated Current Cost of Parabolic Trough STPP (in $/kW total plant output)
Component 30 MW RankineSTPP
200 MWRankine STPP
30 MW ISCCS(130 MW Total)
Site Works 158 57 156
Solar Field 1534 1184 1467
HTF System/Boiler 282 234 134
Power Block 493 279 247
Balance of Plant 287 162 287
Services 275 192 244
Land 11 10 10
Contingency 454 316 402
Total (U.S. plant) 3495 2384 3093
Discount in Developing Countries -524 -365 -464
Total 2971 2026 2629
O & M Cost (¢/kWh) 2.3 1.1 1.15
Cost Reduction Study for Solar Thermal Power Plants
May 1999 Enermodal Engineering Ltd./Marbek Resource Consultants Ltd. Page 27
Table 3.5 Cost of Parabolic Trough STPP as listed in Recent Feasibility Studies
Figure 3.2 Current Estimates of Rankine-Cycle Solar Plant Specific Cost
1000
1500
2000
2500
3000
3500
4000
0 50 100 150 200 250
Plant Size (MW)
Cos
t ($/
kW)
Morocco
India
MexicoJordan
Current (USA)
Cost Reduction Study for Solar Thermal Power Plants
Page 28 Enermodal Engineering Ltd./Marbek Resource Consultants Ltd. May 1999
3.3 CENTRAL RECEIVER SYSTEMS
3.3.1 Background
Although solar central receivers are less commercially mature than parabolic trough systems,approximately 10 solar central receiver systems have been constructed throughout the world.Most of these plants are research or proof-of-concept plants of only 1 to 2 MW. Solar One insouthern California was planned as a commercial project but at 10 MW, this project was really apilot demonstration system.
Solar One was built in 1981 and operated from 1982 to 1988. The plant used 1818 heliostats toreflect sunlight onto a central receiver. Water was converted into steam and used to drive a 10MW turbine. The heat from the solar-heated steam could also be stored in a storage tank filledwith rocks and sand using oil as the heat transfer fluid. The stored heat was used to generatepower for up to four hours after sunset.
This project proved the technical feasibility of the central receiver concept. The system also hadhigh reliability with 96% availability during sunlight hours. The system did however, suffer fromlow annual efficiency (only a 7% heat-to-electricity efficiency) and intermittent turbine operationcaused by transient clouds.
Solar One was redesigned in the early 1990’s to overcome its limitations. The system HTF wasconverted from water/steam to molten salt. Molten salt is inexpensive and allows for higherstorage temperatures (290oC). The main disadvantage is that it becomes solid below 220oC andtherefore must be maintained above this temperature. The receiver and storage tanks werereplaced in order to use the new fluid. All pipes that carry the molten salt were heat-traced toavoid freezing the salt.
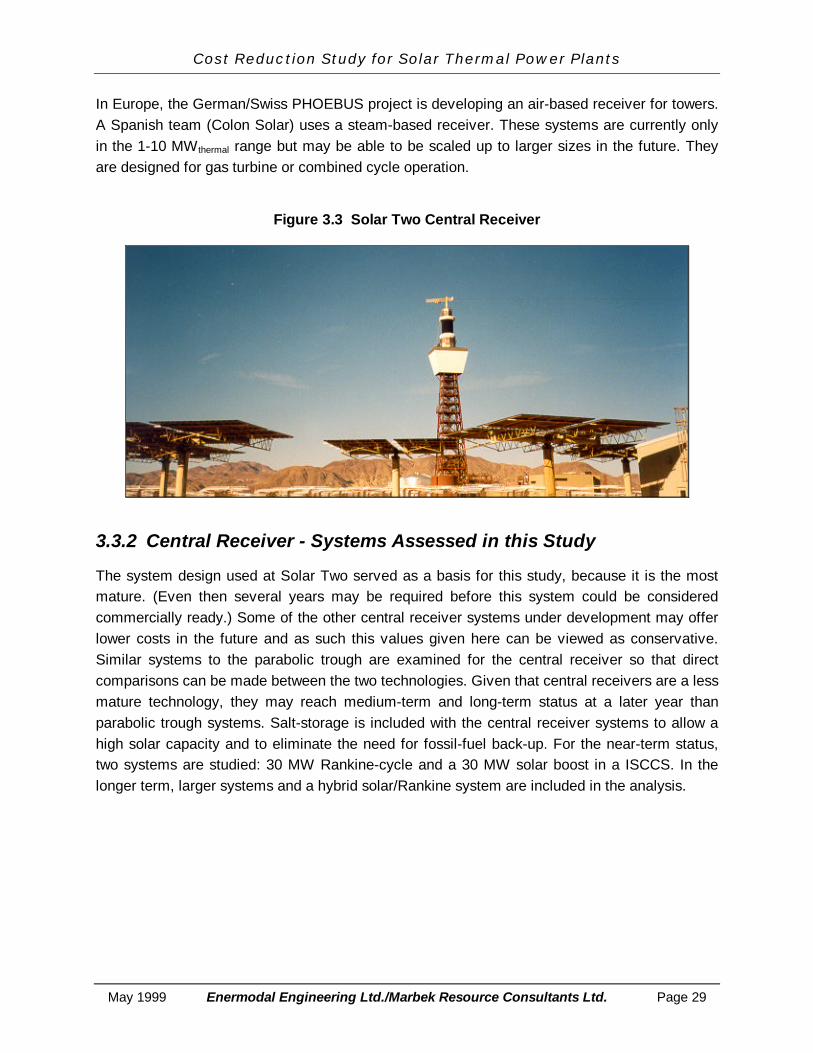
Solar Two (see Figure 3.3) began operation in November 1997 and operated fairly consistentlyfor the next year. Preliminary measurements showed that the plant was operating near designexpectations (8% efficiency). Parasitic power required to keep the molten salt from freezing wasinitially quite high. Changes in operating strategy and modifications in the design reducedparasitic power to acceptable levels.
In November 1998, the feeder pipe to the receiver collapsed because of an unforeseen transferof loads. The system was repaired and the plant ran until April 1999 – the end of thedemonstration phase. Solar Two has successfully demonstrated the concept of molten saltstorage. The heliostats have held up well over the almost 20 years that the plant has been inexistence.
Cost Reduction Study for Solar Thermal Power Plants
May 1999 Enermodal Engineering Ltd./Marbek Resource Consultants Ltd. Page 29
In Europe, the German/Swiss PHOEBUS project is developing an air-based receiver for towers.A Spanish team (Colon Solar) uses a steam-based receiver. These systems are currently onlyin the 1-10 MWthermal range but may be able to be scaled up to larger sizes in the future. Theyare designed for gas turbine or combined cycle operation.
Figure 3.3 Solar Two Central Receiver
3.3.2 Central Receiver - Systems Assessed in this Study
The system design used at Solar Two served as a basis for this study, because it is the mostmature. (Even then several years may be required before this system could be consideredcommercially ready.) Some of the other central receiver systems under development may offerlower costs in the future and as such this values given here can be viewed as conservative.Similar systems to the parabolic trough are examined for the central receiver so that directcomparisons can be made between the two technologies. Given that central receivers are a lessmature technology, they may reach medium-term and long-term status at a later year thanparabolic trough systems. Salt-storage is included with the central receiver systems to allow ahigh solar capacity and to eliminate the need for fossil-fuel back-up. For the near-term status,two systems are studied: 30 MW Rankine-cycle and a 30 MW solar boost in a ISCCS. In thelonger term, larger systems and a hybrid solar/Rankine system are included in the analysis.
Cost Reduction Study for Solar Thermal Power Plants
Page 30 Enermodal Engineering Ltd./Marbek Resource Consultants Ltd. May 1999
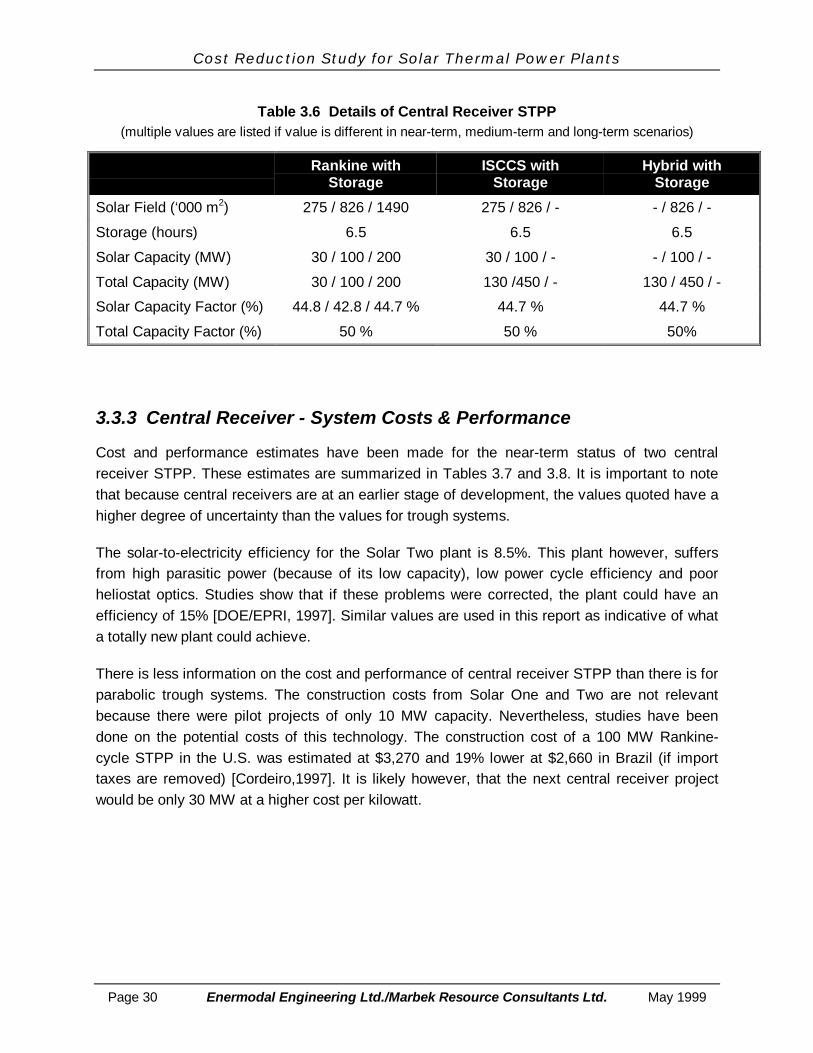
Table 3.6 Details of Central Receiver STPP(multiple values are listed if value is different in near-term, medium-term and long-term scenarios)
Rankine withStorage
ISCCS withStorage
Hybrid withStorage
Solar Field (‘000 m2) 275 / 826 / 1490 275 / 826 / - - / 826 / -
3.3.3 Central Receiver - System Costs & Performance
Cost and performance estimates have been made for the near-term status of two centralreceiver STPP. These estimates are summarized in Tables 3.7 and 3.8. It is important to notethat because central receivers are at an earlier stage of development, the values quoted have ahigher degree of uncertainty than the values for trough systems.
The solar-to-electricity efficiency for the Solar Two plant is 8.5%. This plant however, suffersfrom high parasitic power (because of its low capacity), low power cycle efficiency and poorheliostat optics. Studies show that if these problems were corrected, the plant could have anefficiency of 15% [DOE/EPRI, 1997]. Similar values are used in this report as indicative of whata totally new plant could achieve.
There is less information on the cost and performance of central receiver STPP than there is forparabolic trough systems. The construction costs from Solar One and Two are not relevantbecause there were pilot projects of only 10 MW capacity. Nevertheless, studies have beendone on the potential costs of this technology. The construction cost of a 100 MW Rankine-cycle STPP in the U.S. was estimated at $3,270 and 19% lower at $2,660 in Brazil (if importtaxes are removed) [Cordeiro,1997]. It is likely however, that the next central receiver projectwould be only 30 MW at a higher cost per kilowatt.
Cost Reduction Study for Solar Thermal Power Plants
May 1999 Enermodal Engineering Ltd./Marbek Resource Consultants Ltd. Page 31
Table 3.7 Estimated Near-term Performance of Central Receiver STPP
Component 30 MW C.R.Rankine
30 MW C.R. ISCCS(130 MW Total)
Case 6 Case 7
Heat Collection Efficiency 46.8% 46.8%
Power Cycle Efficiency 40.0% 40.0%
Parasitic Efficiency 84.0% 88.5%
Solar-to-Electric Net Efficiency 15.7% 16.5%
Annual Solar Efficiency 14.9% 15.7%
Plant Capacity 50% 50%
Solar Capacity 44% 47%
Table 3.8 Estimated Near-term Cost of Central Receiver STPP(in $/kW total plant output)
Component 30 MW C.R. RankineSEGS
30 MW C.R. ISCCS(130 MW Total)
Site Works 117 117
Heliostats & Tower 2267 2267
Thermal Storage 420 420
HTF System/Boiler 177 177
Power Block/ Balance of Plant 933 450
Services 391 343
Land 11 10
Contingency 646 566
Total (U.S. plant) 4950 4339
Discount in Developing Countries -744 -650
Total 4209 3689
O & M Cost (¢/kWh) 2.6 1.6
3.4 CONVENTIONAL SYSTEMS
As discussed in Section 2.4, the STPPs are designed to displace conventional power plants thatoperate with capacity factors of between 25 and 50%. Besides capacity factor, the cost ofconventional electricity will depend on the type of plant, cost of fuel and economic parametersused to levelize capital costs. In this report, the cost of conventional power is determined by
Cost Reduction Study for Solar Thermal Power Plants
Page 32 Enermodal Engineering Ltd./Marbek Resource Consultants Ltd. May 1999
estimating conventional plant capital and operating costs and applying the same economicparameters as used with the STPPs. This section outlines the typical capital and operating costsof conventional power plants. In Section 5.1, the cost of power (in cents/kWh) is computed andcompared to values quoted in the literature to ensure the calculated costs are reasonable.
Four conventional power plants are examined in this study: a 400 MW coal-fired Rankine plant,a 300 MW gas or oil Rankine cycle, a 376 MW combined cycle natural gas plant and a 160 MWcombustion turbine plant. The details of these plants are listed in Table 3.9. These plants aretypical of size and type of plants built in developing countries. The first three plants are typicallyused to meet intermediate electricity loads (capacity factor = 50%), whereas the combustionturbine is typically used to meet peak loads (capacity factor <25%).
The cost and performance values were taken from the Annual Energy Outlook 1999 and GasTurbine World 1997. Although these costs are likely based on a financial analysis as opposed toan economic analysis, the difference between these two costs is expected to be small andwithin the uncertainty in the analysis. The efficiency values are based on the lower heatingvalue of the fuel and are consistent with values used in other studies [Kolb, 1998]. The capitalcost value for the coal plant includes the use of scrubbers to meet World Bank requirements.The capital cost for the combined cycle plant is lower than was used in previous studiesbecause of recent cost reductions for this technology. The Annual Energy Outlook also predictsa further 10 to 30% improvement in the cost performance of combined cycle plants over thenext twenty years.
There is some indication that the cost of conventional plants is lower in developing countriesthan in the U.S. A contract was recently awarded to construct a 650 MW gas-fired Rankinecycle plant in Egypt. The cost of this system is $692/kW [IPP, 1998], significantly below the$1,004/kW given in Table 3.9. The lower cost is attributed to a combination of larger capacitythan in Table 3.9 and the low labor costs in Egypt. Similarly, Lewis [1996] found a 15% capitalcost saving for a refinery in India. For consistency in comparison to STPP (see Section 3.2.3),15% lower capital and O & M costs are assumed for conventional plants and STPPs indeveloping countries.
Cost Reduction Study for Solar Thermal Power Plants
May 1999 Enermodal Engineering Ltd./Marbek Resource Consultants Ltd. Page 33
Table 3.9 Estimated Current U.S. Cost and Performance of Conventional Power Plants
Component 160 MWCombustion
Turbine
400 MWRankine
ScrubbedCoal
300 MWRankineGas/Oil
376 MWCombinedCycle Gas
Case 0 Case 1A Case 1B Case 2
Annual Power PlantEfficiency
27.4% 34.4% 34.4% 53.5%
Capital Cost ($/kW) $329/kW $1016/kW $1,004/kW $366/kW
Annual O & M Cost(¢/kWh)
0.30(25% C.F.)
0.86 to 1.38 0.75 to 1.25 0.40 to 0.75
The price for coal and natural gas is location dependent. In Egypt, the price for natural gas is$1/GJ [Geyer, 1996] whereas in Morocco the price is over $3/GJ [Pilkington, 1998]. In this studya median value of $2.37/GJ ($2.50 per MMBTU) is used, equal to the World Bank value forEurope [1998]. Sensitivity studies to energy price are performed. The price for coal using thesame reference is $33 per metric ton ($1.14/GJ). All fuel costs are based on the higher heatingvalue.
3.5 SUMMARY
Parabolic trough SEGS plants in southern California, with a total output of 354 MW, haveoperated reliably over the past 15 years. The maintenance costs for these plants, although high,have fallen with time. New, larger plants are expected to have O & M costs approximately twicethat of conventional Rankine cycle plants. New parabolic trough STPPs are estimated to have acapital cost (in developing countries) that is $2,000 to $3,000 per kilowatt of solar capacity or2.5 to 3.5 times that of conventional Rankine-cycle plants.
Central receiver STPPs are less mature than parabolic trough and will require severalsuccessful projects to scale up to reasonable sizes. The near-term costs of central receiverSTPPs are close to $4,200 per kilowatt or five times that of conventional Rankine-cycle plants.
Cost Reduction Study for Solar Thermal Power Plants
Page 34 Enermodal Engineering Ltd./Marbek Resource Consultants Ltd. May 1999
4. METHODOLOGY FOR CALCULATINGLEVELIZED ENERGY COST
4.1 INTRODUCTION
This section builds on the data presented in Section 3 and develops levelized energy costs(LEC) for each of the solar and conventional systems discussed previously. Experience hasillustrated that the calculation of levelized energy costs for renewable energy sources is bothcomplex and often subject to debate. Moreover, calculated results can be significantlyinfluenced by the methodology and the assumptions employed. Consequently, this sectionbegins with an overview of the methodology and general economic assumptions employed inthe calculation of LECs. This is followed by a discussion of the specific cost and performanceinputs used.
4.2 LEC DEFINITION
Levelized energy cost (LEC) refers to a calculated stream of equal cash flows whose NPV isequal to that of a given stream of variable cash flows. If a project’s levelized annual cash flow isdivided by the annual amount of energy produced, the result is referred to as the levelized costof energy. This result is widely used to compare competing energy sources and is normallycalculated using constant dollars (i.e., in real terms that are net of inflation) [IEA, 1991]. TheLEC is the sum of the annual fuel cost, annual operation and maintenance cost and the productof the capital cost times the fixed charge rate.
4.3 METHODOLOGY
4.3.1 Overview
The methodology employed in the calculation of the levelized electricity costs is based on theprocedures outlined in the International Energy Agency (IEA) publication entitled, “Guidelines forThe Economic Analysis of Renewable Energy Technology Applications” [1991]. Themethodology outlined in the IEA publication has been developed explicitly to address thechallenges posed in attempting to assess the economic feasibility of renewable energytechnologies, which unlike conventional energy sources, do not have decades of experience.
Cost Reduction Study for Solar Thermal Power Plants
May 1999 Enermodal Engineering Ltd./Marbek Resource Consultants Ltd. Page 35
With minor modifications, the methodology outlined in the IEA publication can be used in eitherpublic or private sector investment evaluations.
4.3.2 Public vs. Private Perspective
The choice of analytical perspective is critical. This is because important differences may occurbetween private and public sector analyses of renewable energy projects. These differences, inturn, may lead to different policy implications for the GEF and the World Bank.
The analysis employed in this study is a public sector, economic analysis; this means that theperspective is that of society as a whole. This is in contrast to a private, financial analysis wherethe perspective is that of a private investor. This is an important distinction. The basis forconducting private sector analysis includes market prices, taxes, depreciation, private cost ofcapital and applicable incentives etc. In other words the private, financial analysis attempts todetermine the actual costs and revenues that will be realized by the investor [IEA, 1987]. Table4.1 illustrates a number of the areas in which public sector economic analysis differs from theprivate financial analysis.
Table 4.1 Differences Between Private (financial)and Public Sector (economic) Analysis
Comparison Item Private Public
Viewpoint Investor Overall Society
Energy Prices (Benefits) Prevailing Social values reflect willingnessto pay; alternative uses
Costs Private, prevailing Social values reflectopportunities foregone
External Effects Ignored Analyzed as much as possible.
Taxes Considered Ignored
Social Infrastructure(e.g., roads)
Ignored Considered
Discount Rate Reflects cost of borrowing,desired returns (often >10 to15%)
Reflects social preferences andother factors (often 8 to 10%)
Decision Criteria Payback or IRR above a givenrate
Positive NPV at the SocialDiscount Rate
Time Frame Short term Life Cycle
Source: McDaniel’s Research, Public Sector Perspectives on Renewable Energy Economics, Vancouver, BC
Cost Reduction Study for Solar Thermal Power Plants
Page 36 Enermodal Engineering Ltd./Marbek Resource Consultants Ltd. May 1999
One important reason for employing a public sector economic approach to the assessment ofsolar energy options is that price does not always reflect all of the considerations relevant todecision makers. Within the context of this study, one particularly important example is thetreatment of external effects, such as greenhouse gas emissions created by each of theelectricity generating options. In a private sector analysis, these emissions are ignored;however, consideration of greenhouse gas emissions is an important driver in the current study.
Similarly, it is important to recognize that the conventional technologies and fuels (that providethe “parity target” for the solar technologies) have themselves been affected by subsidies orincentives over many years. In many countries, activities such as petroleum exploration, drillingand pipeline development have received substantial public development support thatnecessarily influences their current price. Similarly, the conventional power generation systemsincluded in this study are mature technologies. The STPP technologies, on the other hand, arein the early development stage and consequently, the prices prevailing today are notnecessarily indicative of the prices that may prevail in the future, under conditions of enhancedmarket share. (This is addressed in Section 5).
4.3.3 Economic Assumptions Employed in this Analysis
Previous experience with the calculation of LECs has shown that even modest changes to inputassumptions (e.g., discount rate, fuel escalation rates etc.) can very significantly affect theresulting LEC. The major economic assumptions that are employed in this analysis aredescribed below and summarized in Table 4.2, together with suggested ranges for sensitivityanalysis. The technology specific cost and performance inputs are presented in the Sections 3(current) and 6 (future).
Climate change as a result of greenhouse gas emissions is a societal problem. The impact onLEC of a credit for reduced emissions is studied in this report. The World Bank has found that aprice of $10 to $40 per ton of carbon (or $2.75 to $11 per ton of CO2) is likely to reflect the pricerange of carbon in a future carbon market [pers. com. Charles Feinstein, World Bank].
A 25-year assumed plant life is typically used in the power plant industry. Because of therelatively high discount rate, assuming a longer plant life has little impact on the LEC. TheSEGS plants in southern California have been operating for up to 15 years with little indicationthat they would not last 25 years.
Most studies of STPP have used a discount rate of 8% and this value is used in this report. TheWorld Bank however, typically uses a 10 to 12% discount rate in assessing projects indeveloping countries. Although this rate is high by developed world standards, it reflects thehigh opportunity cost for other investments in these countries. The sensitivity of the LEC tohigher discount rates is studied.
Cost Reduction Study for Solar Thermal Power Plants
May 1999 Enermodal Engineering Ltd./Marbek Resource Consultants Ltd. Page 37
The World Bank has projected the future cost of energy to the year 2020. Their estimates showa relatively flat price or slight decrease (in real terms) for coal, gas and oil. A 0% escalation rateis assumed for this study.
Table 4.2 Inputs - Economic Analysis
Item Assumption
Inflation The analysis uses constant (real) dollars and thus removes the effects ofnominal inflation.
Base year 1998 has been selected as the base year. This is also assumed to be the “in-service” year. This base year is the year to which all cash flows have beendiscounted.
Project life This is the useful life of the major technology components. A 25-year life isassumed, together with a sensitivity range of 20 to 30 years.
Real Price Changes These are calculated from the base year values and are net of inflation.
Discount Rate This reflects the time value of money; the discount rate enables cash flows thatare generated over a period of time to be equated to amounts at a commonpoint in time. In this case, the base year of 1998 is the chosen “point in time”.
For most economic analyses, real discount rates of 5 to 10% are commonlyused. In this analysis, a rate of 10% is used and sensitivity analysis isconducted for rates of 8% and 12%.
Income/profit taxes/tariffs The analysis is done before income tax and after deducting tariffs. Theboundary of analysis is assumed to be at the level of a national government.This means that taxes and tariffs are a cost imposed on itself and retained byitself. i.e. there is no cost to the national government - it is only a redistribution.
Financing costs; cost of capital Entire investment is treated as an initial cash outlay for the purposes of thiseconomic analysis.
Utility perspective does often include financing cash flows (debt & equityfinancing) but this is not the perspective of this study.
Replacement Expenses Periodic replacements are included in the annual O & M costs.
Fuel Prices Coal prices are assumed to be $33/tonne (World Bank, 1998 ) Natural gas ratesare assumed to be $2.37/GJ (World Bank, 1998) The base case rate of fossilfuel price escalation is assumed to be 0%, based on World Bank projections tothe year 2020. Sensitivity analysis is conducted at +/- 25% increase over plantlife (1% annual change).
External Effects Carbon dioxide emissions are considered. A credit of $7/tonne of avoidedcarbon dioxide emissions (relative to base case) is employed. Sensitivityanalysis is also provided at carbon dioxide values of $2.75 and $11 per avoidedtonne.
4.4 CALCULATION OF SOLAR LEC
One of the difficulties in comparing the LEC of STPP options is that the solar contribution is notequivalent. Plants with a low solar contribution (e.g., ISCCS) will have a total plant LEC close tothat of conventional (combined cycle) plants almost regardless of its cost giving the impressionof being very close to cost-effective status. Furthermore, comparing the LEC values for the
Cost Reduction Study for Solar Thermal Power Plants
Page 38 Enermodal Engineering Ltd./Marbek Resource Consultants Ltd. May 1999
whole plant does not indicate how much the solar cost/performance must improve for thesystem to be cost effective. To avoid this problem, this report compares LECs of the solar onlycomponent. Two different approaches are used to determine the solar LEC depending on thedesign of the STPP.
Rankine-cycle STPPs are designed as a direct replacement for a conventional power plant andthe solar portion can operate as a stand-alone plant. These plants are operated on solar energyduring sunny periods and on fossil-fuel during cloudy or non-daylight periods. It is difficult toallocate system costs (initial and annual operation and maintenance) to the solar system andthe fossil-fuel system since they share many components (e.g., steam turbine).
This report follows a methodology similar to that proposed by Kolb [1998] to determine the solarLEC. The first step is to identify the “baseline”, that is, the power plant that will be built if thesolar option is not pursued. This plant may or may not be the same type or size as the solarplant. The initial cost, annual costs and LEC, is then estimated for this plant. The type of plantand its capacity factor are discussed in Section 4.4.
The second step is to determine the LEC for the complete STPP and the non-solar competition.The final step is to back out the LEC for the solar portion of the STPP using the formula givenbelow. The assumption is that the value of the power produced by the STPP when operating onfossil fuel is equal to that of the non-solar competitor. With this methodology some of the STPPcapital cost gets allocated to the conventional power cost.
( )[ ]FS
LECFSLECLEC CONSTPP
SOLAR⋅−−= 1
Where LECSOLAR is the LEC of the solar only component
LECSTPP Is the LEC of the STPP (solar and back-up components)
LECCON Is the LEC of the conventional plant that would have been built in place
of the STPP
FS is the fraction of the STPP annual capacity factor powered by solar energy
A different methodology is used for those plants where solar is an add-on to a conventionalplant (e.g., ISCCS and Hybrid/solar plants). In these plants, it is much easier to identify the solarcapital and operating costs since the plant can operate efficiently without the solar systems. Forthese STPPs, the incremental cost of the solar components is used to determine the solar LEC.
The final step in the methodology is to compare the solar LEC to that of the conventional powerplant it is replacing. If a utility is considering an ISCCS plant, the baseline is a slightly larger (oranother) combined-cycle plant (without the solar boost) that provides the same output as the
Cost Reduction Study for Solar Thermal Power Plants
May 1999 Enermodal Engineering Ltd./Marbek Resource Consultants Ltd. Page 39
integrated solar/combined cycle plant. As will be shown later in Section 5.1, combined cycleplants have the lowest LEC. Nevertheless, utilities are still constructing Rankine-cycle plants.For example, Egypt recently awarded a contract to construct a 650 MW gas-fired Rankine-cycleplant [IPP, 1998]. There are several potential reasons for this:
• Natural gas is not available for a combined-cycle plant,
• A mixture of generating technologies is desired to avoid being too dependent on onetechnology,
• Local designers and/or plant operators are more familiar with Rankine-cycle plants, and
• Rankine-cycle equipment may be available locally.
If a utility decides on a Rankine cycle power plant then the competing solar alternative is aRankine-cycle STPP. Thus in this report, ISCCS will be compared against a Combined Cyclegas plant and Rankine-cycle STPPs will be compared to a conventional Rankine-cycle powerplant with either coal or natural gas as the fuel.
Cost Reduction Study for Solar Thermal Power Plants
Page 40 Enermodal Engineering Ltd./Marbek Resource Consultants Ltd. May 1999
5. CURRENT LEVELIZED ENERGY COSTS
5.1 CONVENTIONAL POWER PLANTS
The current LEC was determined for coal and gas-fired power plants. The results aresummarized in Table 5.1 and are based on 50% and 25% capacity factors and a discount rateof 10%. For 50% capacity factor plants, the electricity generation costs range from 3.0cents/kWh (for combined-cycle gas plants) to 5.6 cents/kWh (for gas-fired Rankine cycleplants). Anderson [1988] has evaluated the LEC for different power plant capacity factors. Hequotes a value of 6.3 cents/kWh for 50% capacity factor gas-fired power plants: an LEC close tothe value in Table 5.1. Although gas-fired Rankine-cycle plants have a higher LEC than coal-fired plants, they benefit from lower carbon dioxide emissions. If the cost of carbon emissionsare included, these two plants have almost the same cost of power. In this study, the cost ofintermediate load power is taken as 4.3 cents/kWh with emissions based on a coal-fired plant.
Table 3.1 gives a cost for a 25% capacity factor plant as 5.6 cents/kWh. Peaking power inJordan has a cost of production of 6.3 cents/kWh [Geyer, 1997]. Anderson [1998] quotes a priceof 8.3 cents/kWh for a 25% capacity factor plant. These values bracket the costs calculated for25% capacity factor plants. A mid-range energy cost of 6.9 cents/kWh is used in this study for25% capacity factor power.
The calculated costs for 25 and 50% capacity factor power are used as a high and low scenariowith which to compare STPP power production costs. These conventional costs are nothowever, the highest and lowest costs of energy. Power plants meeting the base load or usinglow cost fuel will have a lower electricity production cost. Power plants operated to meet a spikypeak or using high cost fuel will have a higher electricity production cost.
Cost Reduction Study for Solar Thermal Power Plants
May 1999 Enermodal Engineering Ltd./Marbek Resource Consultants Ltd. Page 41
Table 5.1 Current LEC for Intermediate and Peak Conventional Power Plants(in cents/kWh)
LEC (¢/kWh) 160 MWCombustion
Turbine
400 MWRankine – Coal
300 MWRankine - Gas
376 MWCombined
Cycle
Case 0 Case 1A Case 1B Case 2
Capacity Factor 25% 50% 50% 50%
Capital Cost 1.8 2.4 2.2 0.9
Fuel Cost 3.5 1.2 2.7 1.8
O & M Cost 0.3 0.7 0.6 0.3
Total 5.6 4.3 5.6 3.0
5.2 STPP
The LEC was determined for five STPPs: three trough plants and two central receiver plants.The details of these plants are summarized below. All plants are compared on the basis of thesame capacity factor, although their solar share varies considerably. The details of the analysisare contained in Appendices A and B.
Tables 5.1 and 5.2 provide a summary of the current LECs for each of the options studied. If theLEC for the STPP is less than that of the conventional plant, the STPP is deemed to be cost-effective. LEC values are given for the total STPP (a mixture of solar and fossil-fuel generatedelectricity) and the solar only portion. In calculating the solar only portion of the plant LEC, thefossil-fuel generated electricity is assumed to have a value equal to the LEC for the power plantit is replacing. Since coal-fired Rankine-cycle plants have a lower cost than gas-fired Rankineplants, the coal plant is used as the reference case.
The ISCCS plants produce power at a 70% premium over combined cycle gas plants. The solarportion of the plant has a LEC that is over 12 cents/kWh: three to four times that of a combinedcycle plant. The solar LEC for the Tower is less than for the Trough because of the use ofthermal storage. The solar capacity factor for the Tower is almost twice that of the Troughmeaning that the solar boost runs for almost twice as many hours. A credit of $25 per tonne ofcarbon displaced reduces the solar LEC by only a small amount – 0.7 cents/kWh.
Cost Reduction Study for Solar Thermal Power Plants
Page 42 Enermodal Engineering Ltd./Marbek Resource Consultants Ltd. May 1999
The solar LECs for the Rankine-cycle STPPs are 10 to 20% higher than for the same sizeISCCS. However, as the size of plant is increased to 200 MW the solar LEC drops to 10 centsper kWh and with a CO2 emissions credit to 8.3 cents/kWh. This last value is about twice thecost of power from a coal-fired Rankine-cycle plant.
Table 5.2 Current LECs for Combined Cycle Plants (in cents/kWh)
Combined-CycleGas
30 MW ISCCS-Trough
30 MW ISCCS-Tower with
storage
Case 2 Case 5 Case 7
Total Plant LEC 3.0 - 4.1 4.42 -
Solar LEC - 15.3 12.1
- with CO2 Credit - 14.6 11.4
Table 5.3 Current LECs for Rankine-Cycle Plants (in cents/kWh)
Coal-firedRankine Plant
30 MW Rankine-Trough
200 MW Rankine-Trough
30 MW Rankine-Tower with
storage
Case 1A Case 3 Case 4 Case 6
Total Plant LEC 4.3 - 6.9 10.4 7.2 13.9
Solar LEC - 16.6 10.1 15.3
- with CO2 Credit - 14.9 8.3 13.4
5.3 SENSITIVITY ANALYSIS
Previous LEC modeling experience has shown that, in addition to discount rate, LEC values aresensitive to assumptions about fuel price, project life and credits. Tables 5.4 and 5.5 provide asummary of the resulting LECs under each sensitivity scenario. Of all the factors considered,discount rate has the largest impact on solar LEC. Decreasing the discount rate from 10 to 8%causes the solar LEC to fall almost 15% from 15.3 to 13.4 cents/kWh for the 30 MW ISCCS-Trough and from 10.1 to 8.9 cents/kWh for the 200 MW Rankine-Trough. On the other hand, thecost of conventional power falls by only 7%.
Cost Reduction Study for Solar Thermal Power Plants
May 1999 Enermodal Engineering Ltd./Marbek Resource Consultants Ltd. Page 43
The values currently being considered for carbon credit have a significant impact on solar LEC.The maximum likely credit being considered ($40/tonne carbon) reduces solar LEC by 1cent/kWh when displacing natural gas and 2 cents/kWh when displacing coal. A 25% increasein fuel costs has no impact on solar LEC but increases the conventional power plant LEC by 0.3to 0.4 cents/kWh. Increasing plant life to 30 years decreases the solar LEC by only 4%.
Table 5.4 Sensitivity of LEC to Assumptions – Combined Cycle Plants (in cents/kWh)
Baseline EnergyCost2
30 MW ISCCS-Trough
30 MW ISCCS-Tower with
storage
Case 2 Case 5 Case7
Base case1 3.0 – 4.1 15.3 12.1
- 8% discount 2.8 – 3.9 13.4 10.6
- 12% discount 3.1 – 4.2 17.3 13.7
- $10/tonne carbon credit 3.0 – 4.1 15.0 11.9
- $25/tonne carbon credit 3.0 – 4.1 14.6 11.4
- $40/tonne carbon credit 3.0 – 4.1 14.2 11.0
- 25% higher fuel cost 3.4 – 4.5 15.3 12.1
- 25% lower fuel cost 2.5 – 3.6 15.3 12.1
- 20 year plant life 3.0 – 4.1 16.2 12.8
- 30 year plant life 2.9 – 4.0 14.8 11.8
1 – 10% discount, 25 year life, no carbon credit
2 – based on a combined cycle gas plant operating at 50 and 25% capacity factors
Cost Reduction Study for Solar Thermal Power Plants
Page 44 Enermodal Engineering Ltd./Marbek Resource Consultants Ltd. May 1999
Table 5.5 Sensitivity of LEC to Assumptions – Rankine-Cycle Plants (in cents/kWh)
Cents/kWh BaselineEnergy Cost2
30 MWRankine-Trough
200 MWRankine-Trough
30 MWRankine- Tower
with storage
Case 1A Case 3 Case 4 Case 6
Base case1 4.3 – 6.9 16.6 10.1 15.3
- 8% discount 4.0 – 6.6 14.6 8.9 13.5
- 12% discount 4.6 – 7.2 18.6 11.4 17.1
- $10/tonne carbon credit 4.3 – 6.9 15.9 9.4 14.5
- $25/tonne carbon credit 4.3 – 6.9 14.9 8.3 13.4
- $40/tonne carbon credit 4.3 – 6.9 13.9 7.2 12.3
- 25% higher fuel cost 4.6 – 7.2 16.5 10.1 15.2
- 25% lower fuel cost 4.0 – 6.6 16.6 10.1 15.3
- 20 year plant life 4.4 – 7.0 17.4 10.7 16.0
- 30 year plant life 4.2 – 6.8 16.1 9.8 14.8
1 – 10% discount, 25 year life, no carbon credit
2 – based on intermediate and peak load power plants (see Section 5.1)
5.4 CONCLUSIONS AND STUDY IMPLICATIONS
At the current state of technology development, the cost of solar-generated electricity isbetween 10 and 15 cents per kWh (at a 10% discount rate). This is 1.5 to four times moreexpensive than power from conventional power plants. Although solar power from ISCCS is10% to 20% less expensive than for a similar sized Rankine-cycle STPP, it is competing againsta much lower cost conventional power plant (combined-cycle).
Cost Reduction Study for Solar Thermal Power Plants
May 1999 Enermodal Engineering Ltd./Marbek Resource Consultants Ltd. Page 45
6. FUTURE COST AND PERFORMANCE
6.1 INTRODUCTION
The preceding section illustrated that the current LECs for solar technologies are approximately1.5 to four times greater than those for conventional intermediate and peak load power plants.However, this current cost gap may not continue in the longer term, particularly if there issupport for commercialization of STPPs. This section, therefore, examines expected futurecosts for both conventional and solar alternatives.
The objective is to determine the scope of expected future price differences under varying levelsof future technology market penetration. These results will, therefore, help to determine thescope of investment required and the possible parameters of public sector support required, ifany, to close the gap. Subsequent stages of the analysis will then address whether or not thisrequired level of investment is feasible or not.
The discussion of future prices for the solar alternatives is more difficult, as they are notcurrently fully commercialized technologies and prices have scope for future declines. Twoapproaches were employed in attempting to determine likely future STPP prices:
• Engineering estimates of likely future cost or performance improvements were developedbased on known technical improvements and likely cost reductions through mass productionand commercialization. This analysis was done on a sub component basis and aggregated.
• Expected STPP technology cost reductions were analyzed, using the concept of experiencecurves.
The remainder of this section presents the results of these two approaches.
6.2 FUTURE STPP COSTS - Engineering Approach
6.2.1 Parabolic Trough
The future cost and performance of the parabolic trough STPP was examined for two time-periods: medium-term and long-term (see Table 6.1). In the medium-term, the collectorefficiency is expected to increase approximately two percentage points primarily because of animproved absorber coating (solar absorptivity of 96% and an emmissivity of 7% at 350oC).
Cost Reduction Study for Solar Thermal Power Plants
Page 46 Enermodal Engineering Ltd./Marbek Resource Consultants Ltd. May 1999
In the long-term, several significant changes in the technology are anticipated. These will resultin significant efficiency improvements and lower costs. First, tilting of the collector array eightdegrees from the horizontal increases the solar radiation available and the optical efficiency.This concept was being studied by Luz and was to be part of their fourth generation collector.Tilting of the collector towards the sun reduces reflective and shadowing losses particularly inthe winter.
Second, better integration with the power plant and higher collector operating temperatures willimprove the power plant cycle efficiency from 38% to 39% and 40% in the mid and long term.
Finally, it is anticipated that a cost-effective thermal storage system will be developed to storesolar heat later into the peak electrical period. This system has been added as a long-termoption. Thermal storage increases the solar capacity factor of the plant and reduces parasiticenergy and start-up losses and improves part load efficiency.
The system efficiency could be improved even further by conversion to direct steam generation.The collector heat transfer fluid is replaced with the water/steam used in the turbine. This willrequire the collectors to be able to withstand medium-pressure steam and the fluid flow to bemore evenly controlled. Whether these changes will result in a net improvement in system LECis not yet clear, and they have not been included in this analysis.
Table 6.1 Estimated Future Performance of Parabolic Trough STPP
Component 1000 MWISCCS (450MW total)- Medium-
term
200 MWRankineSEGS
- Medium-term
200 MWRankineSEGS
- Long-term
200 MWSEGS with
Storage- Long-term
Case 8 Case 9 Case 10 Case 11
Heat Collection Eff. 46.0% 46.0% 51.9% 53.6%
Power Cycle Eff. 39.0% 39.0% 40.0% 40.0%
Parasitic Efficiency 90.2% 83.6% 86.7% 90.2%
Solar-to-Elec Net Eff. 16.2% 15.5% 18.0% 18.4%
Annual Solar Eff. 14.6% 14.0% 16.2% 16.6%
Plant Capacity 50% 50% 50% 50%
Solar Capacity 26.2% 25.1% 26.4% 50%
The costs are expected to fall as more experience is gained with the technology. Four factorswill contribute to the cost reductions: solar system optimization, economies of scale,
Cost Reduction Study for Solar Thermal Power Plants
May 1999 Enermodal Engineering Ltd./Marbek Resource Consultants Ltd. Page 47
standardized engineering, and competitive pressures. As collector production ramps up tosupply new STPPs, manufacturing cost reductions will occur. A 15% cost reduction has beenestimated by incorporating known improvements into the system [Cohen and Kearney, 1994].Potential cost reductions include replacement of flexible hoses with ball joints, wider pylonspacing, and lower cost coatings. Previous costing studies [Pilkington, 1996] have shown that adoubling of system size results in a 12 to 14% reduction in capital cost on a per kW basis.Increasing plant size from 30 MW to 200 MW reduces the cost per kilowatt by approximately30%. Better integration of the solar and conventional components and standardization ofdesigns is expected to reduce costs by 5% [Pilkington, 1996]. In the long-term, the cost of theconventional Rankine-cycle components should be on a par with conventional Rankine-cyclepower plants ($800/kW). As the industry matures and new players enter the market, competitivepressures may further drive down prices. Because of the difficulty in estimating this impact, onlya modest decrease has been assumed in this study.
Table 6.2 shows the combined effect of future cost reductions and performance improvements.The result is a 50% reduction in the cost-per-kilowatt for parabolic trough systems (from a 30MW current system to a 200 MW long-term system).
Table 6.2 Estimated Future Cost of Parabolic Trough STPP(in $/kW nominal solar output)
Component 100 MW ISCCS(450 MW Total)- Medium-term
200 MWRankine
- Medium-term
200 MWRankine
- Long-term
200 MW Rankinewith Storage- Long-term
Site Works 70 53 50 55
Solar Field 1011 932 792 1026
Thermal Storage 0 0 0 476
HTF System/Boiler 225 214 196 67
Power Block 163 265 252 206
Balance of Plant 190 154 146 120
Services 166 162 144 195
Land 10 10 9 16
Contingency 274 267 237 322
Total 2109 2055 1825 2481
Discount in Dev.Countries
-316 -308 -273 -372
Total 1793 1747 1551 2109
O & M Costs (c/kWh) 0.59 0.94 0.75 0.48
Cost Reduction Study for Solar Thermal Power Plants
Page 48 Enermodal Engineering Ltd./Marbek Resource Consultants Ltd. May 1999
6.2.2 Central Receiver
The cost and performance of central receiver systems are expected to improve significantly inthe mid- and long-term. Because this technology is less mature than the parabolic trough, moredramatic improvements are expected. Table 6.3 lists the expected system performance valuesbased on values provided by SunLab. The first improvement in the performance of the centralreceiver system will be the addition of a selective surface on the receiver. The reduction ofsurface emmissivity from 85% to 20% is expected to reduce heat losses by 60% and improveoverall collection efficiency from 46% to 49%. In the long-term, collector efficiency will increaseto 52% through a 2% increase in receiver absorbtivity (94 to 96%), and higher mirror reflectivitybecause of improved coatings and better mirror washing.
As the plants are made larger, the power cycle efficiency will improve slightly from 40 to 43%.The combination of larger plants, better operating procedures and higher solar capacity factorwill reduce parasitic losses to keep the salt a liquid.
Table 6.3 Estimated Future Performance of Central Receiver STPP(all systems have thermal storage)
Component 100 MW ISCCS(450 MW Total)
- Medium-term
100 MWRankine
- Medium-term
100 MWHybrid Coal
Rankine- Medium-
term
200 MWRankine
- Long-term
Case 12 Case 13 Case 14 Case 15
Heat Collection Eff. 49.3% 49.3% 49.3% 52.1%
Power Cycle Eff. 43% 43% 43% 43%
Parasitic Efficiency 87.0% 82.9% 87.0% 90.6%
Solar-to-Elec. Net Eff. 18.5% 17.6% 18.5% 20.3%
Annual Solar Eff. 17.6% 16.7% 17.6% 19.3%
Plant Capacity 50% 50% 50% 50%
Solar Capacity 47% 45% 47% 50%
The costs of central receiver STPP are expected to drop significantly as this technology iscommercialized. The largest cost reductions are expected with the heliostats. Heliostats
Cost Reduction Study for Solar Thermal Power Plants
May 1999 Enermodal Engineering Ltd./Marbek Resource Consultants Ltd. Page 49
represent approximately 50% of the total solar plant cost. Prices for heliostats have beenobtained from U.S. manufacturers based on production volumes (see Figure 6.1) [DOE, 1997].Installation costs are only a few percent of the heliostat cost, so that these values can beassumed to be representative of installed costs. For small production runs (in the order of a fewhundred), a price of $180/m2 is expected. (This value was used for the current scenario, seeSection 3.3.2.) A 100 MW plant (the medium-term) scenario would require 6000 heliostats andthe price is expected to drop to $126/m2 is anticipated. In the long-term at high production rates,the price is expected to fall to $70/m2.
Central receiver systems will benefit from the same cost reduction factors as described for theparabolic trough. There is however greater uncertainty in the central receiver values becausethey are at an earlier stage in their development. The effect of the cost reductions andperformance improvements are seen in Table 6.4. Because of the large reduction in heliostatcosts, central receiver systems show a 63% reduction in cost-per-kilowatt (current 30 MW to along-term 200 MW). In the long-term, Central Receiver systems are predicted to have a 25%lower cost than parabolic trough systems. The prime reason for the lower cost is the reductionof piping. Parabolic trough systems must use insulated piping to connect all the collector arrays.Central receivers concentrate and collect the heat by reflecting the solar radiation to a centralsource.
Figure 6.1 Heliostat Price as a Function of Annual Production Volume(source DOE/EPRI, 1997)
Cost Reduction Study for Solar Thermal Power Plants
Page 50 Enermodal Engineering Ltd./Marbek Resource Consultants Ltd. May 1999
Table 6.4 Estimated Future Cost of Central Receiver STPP (in $/kW nominal solar output)
Component 100 MW ISCCS(450 MW Total)
- Medium-term
100 MWRankine
- Medium-term
100 MWHybrid Coal
Rankine- Medium-
term
200 MWRankine
- Long-term
Case 12 Case 13 Case 14 Case 15
Site Works 49 49 49 39
Heliostats and Tower 1290 1290 1290 712
Thermal Storage 240 240 240 190
HTF System/Boiler 110 110 110 85
Power Block/Balanceof Plant
280 570 280 415
Services 198 227 198 145
Land 11 11 11 11
Contingency 327 375 327 239
Total 2505 2872 2505 1836
Discount in Dev.Countries
-375 -431 -375 -275
Total 2130 2441 2130 1561
O & M Costs (c/kWh) 0.60 1.20 0.60 0.60
6.3 FUTURE STPP COSTS - Experience Curve Approach
Experience curves are a concept that has been developed and applied to a variety of newtechnologies. They cannot be considered an established theory or method but rather acorrelation phenomenon that describes how unit costs decline with cumulative production.Experience curves, therefore provide an improved understanding of long-term patterns of costdevelopment.
A specific characteristic of the experience curve is that cost declines by a constant percentagewith each doubling of the total number of units produced. Generally, the curve is defined as:
Cost Reduction Study for Solar Thermal Power Plants
May 1999 Enermodal Engineering Ltd./Marbek Resource Consultants Ltd. Page 51
C cum = Co x CUM b
where:
C cum is the cost per unit as a function of output.
Co is the cost of the first unit produced
CUM is the cumulative production over time and
b is the experience index.
The experience index is used to calculate the relative cost reduction (1 - 2b) for each doubling ofthe cumulative production. The value (2b) is called the progress ratio (PR) and is used toexpress the progress of cost reductions. A PR of 80%, for example, means that costs arereduced by 20% each time that the cumulative production is doubled. [Neij, 1997]
The cost reduction of the experience curve refers to total costs (labor, capital, R&D, etc). Theexperience process is a long-term development process which represents the combined effectof a number of parameters. The sources of cost reductions are:
• production changes (process innovations, learning effects and scaling effects)
Cost reductions depend on the diffusion and adoption of new technologies, and vice versa;costs fall when production is expanded and market demand is expanded when costs fall.
STPP technologies are modular and therefore provide greater opportunity for factory-basedautomatic production. They are, therefore, susceptible to cost reductions. It should be noted thata technology break through would result in a discontinuity in the experience curve. This couldmean faster cost reductions from current conditions than indicated by the experience curve.
Table 6.5 shows Progress Ratios for a range of relevant technology types. Given that STPPtechnology is of a modular nature, a PR range of 0.70 to 0.95 may be expected.
Cost Reduction Study for Solar Thermal Power Plants
Page 52 Enermodal Engineering Ltd./Marbek Resource Consultants Ltd. May 1999
Table 6.5. Progress Ratios for Selected Technologies (source: Neij, 1997)
Average in the literature Range in the literature
Plants: 0.90 0.82 to 1.0
Large scale > 1.0
Wind 0.96
Small scale 0.87
Fuel Cells1 0.84
Module Technologies 0.80 0.70 to 0.95
Photovoltaics 0.80
Continuous Processes 0.78 0.64 to 0.901 – Hosier, R. and Larson, E., 1999. GEF Participation in Fuel Cell Commercialization
Parabolic Troughs
By plotting the existing data for installed capital costs (adjusted to 1998$) for SEGS I to IX asshown in Figure 6.2, we see that a PR of 0.88 approximates the cost reduction trends for thetrough technologies. As noted by Neij, a reliable estimate of the PR for any technology can onlybe made after many doublings of experience. Since at most there has only been 3 doublings incapacity, it is advisable to judge future cost reductions using a range of progress ratios. Forparabolic troughs, a lower PR of 0.85 and an upper PR of 0.92 provide reasonable experiencecurve guidelines (see Figure 6.2). The area in between these two curves gives an indication ofthe cost range of future STPP technologies. The cost performance estimates developed inSection 6.2 for mid- and long-term trough technologies generally fall in the range projected bythe upper and lower experience curves.
Central Receivers
Determination of the progress ratio for central receiver technologies is difficult due to the limitedcommercialization of this STPP. However, given the many similarities between troughs andcentral receivers, it is safe to assume that they will follow the same experience curves. Figure6.3 is based on the near-term estimate for central receivers as the starting point, along withexperience curves of 0.85, 0.88 and 0.92 emanating from this point. The projections for mid-and long-term cost performance estimates from Section 6.2 are also plotted. Again, theprojected future costs fall well within the range established by the experience curves. Based onthis analysis, it is assumed that the future cost performance projections are reasonable and areused in the calculation of future solar LEC.
Cost Reduction Study for Solar Thermal Power Plants
May 1999 Enermodal Engineering Ltd./Marbek Resource Consultants Ltd. Page 53
Figure 6.2 Parabolic Trough Experience Curve
1,000
10,000
10 100 1,000 10,000 100,000
Cumulative Power Plant Capacity Installed (MWe)
Pla
nt C
apita
l Cos
t (19
98$/
kW)
SEGS 0.88 0.85 0.92
SEGS IX
Long-term (Case 10)
Medium-term (Case 8)
New 200 MW Rankine (Case 4)
Figure 6.3 Central Receiver Experience Curve
1,000
10,000
10 100 1000 10000 100000
Cumulative Power Plant Capacity Installed (MWe)
Pla
nt C
apita
l Cos
t (19
98$/
kW)
Cases PR=0.88 PR=0.85 PR=0.92
Near-term(Case 6)
Long-term (Case 15)
Medium-term (Case 13)
Cost Reduction Study for Solar Thermal Power Plants
Page 54 Enermodal Engineering Ltd./Marbek Resource Consultants Ltd. May 1999
6.4 BASELINE TECHNOLOGIES
The baseline electricity generation options are mature technologies. No significant capital costdecline is expected for Rankine-cycle systems over the next 20 years [DOE, 1998]. In fact, coalplants might become more expensive, as requirements for further improvements to plantenvironmental performance are demanded. The experience curves of large electricitygenerating facilities such as coal-fired plants have shown cost increases over time PR>100% -primarily due to the addition of environment and safety features to plants [Neij, 1997].
Modest performance improvements and cost reductions are predicted for combined cycle plants[DOE, 1998]. These changes might result in a slight decrease in combined cycle electricitycosts.
Average future costs of conventional grid-connected electricity are expected to be in the rangeof 2.4¢ to 5¢/ kWh. The upper price range of 5¢ is expected to be for large scale coal plantswhile the lower range is expected to be for new combined cycle power plants with natural gasprices of $US 2.2/GJ [Energy Policy – Vol. 23, 1997 – pg. 1103]. These prices are consistentwith the 50% capacity factor energy prices quoted in Section 5.1. Peak electrical power will ofcourse have a higher cost.
These baseline future cost levels represent the longer-term targets that the STPP systems mustmeet if they are to achieve widespread market penetration.
6.5 CONCLUSIONS
Two approaches were used to predict the future cost performance of STPP: an engineeringapproach based on known technical improvements and cost reductions from commercializationand the experience curve approach. The two approaches yielded similar results. The cost-per-kilowatt of trough plants are expected to fall by 40% and central receiver systems are expectedto fall by over 60%. The cost of electricity from conventional power plants is expected to stayconstant over the next twenty years.
Cost Reduction Study for Solar Thermal Power Plants
May 1999 Enermodal Engineering Ltd./Marbek Resource Consultants Ltd. Page 55
7. FUTURE LEVELIZED ENERGY COSTS
7.1 RESULTS FOR STPP
The LEC was determined for the medium-term and long-term scenarios. Two 100 MW ISCCSplants were examined: one trough and one tower. Six Rankine-cycle systems were examined:three in the medium-term and three in the long-term. The details of the analysis are contained inAppendices A and B.
Tables 7.1 is summary of the results for the ISCCS. The combination of a larger system (100MW instead of 30 MW) and future cost performance improvements reduces the solar LEC froman average of 12 cents/kWh to 9 cents/kWh. While this represents a significant improvement incost effectiveness, the ISCCS are still three times more expensive than conventional combinedcycle plants. It is unlikely that either uncertainty in the economic inputs or future cost reductionswill be able to bridge this gap.
Table 7.1 Medium-term LECs for Combined Cycle Plants (in cents/kWh)
Combined-CycleGas
100 MW ISCCS-Trough
(medium-term)
100 MW ISCCS-Tower with storage
(medium-term)
Case 8 Case 12
Total Plant LEC 3.0 – 4.1 - -
Solar LEC - 10.0 7.1
- with CO2 Credit - 9.3 6.4
Tables 7.2 and 7.3 provide a summary of the medium-term and long-term LECs for each of theRankine plant options studied. Over this period, the cost of solar generated power is expectedto fall from the 10 to 15 cent/kWh range to the 5 to 6 cent/kWh range. At this point, STPP arecost competitive with peaking coal-fired or gas-fired Rankine plants. The addition of thermalstorage (if developed) for trough systems does not significantly improve the solar LEC; it doeshowever, increase the solar capacity factor and so opens the possibility to supply into the highercost peak electricity market. In the long term central receiver systems are expected to producepower at approximately 25% lower cost than a similar size trough system.
Cost Reduction Study for Solar Thermal Power Plants
Page 56 Enermodal Engineering Ltd./Marbek Resource Consultants Ltd. May 1999
Table 7.2 Medium-term LECs for Rankine-Cycle Plants (in cents/kWh)
Coal-firedRankine Plant
200 MWRankine-Trough
100 MW Rankine-Tower with
storage
100 MWHybrid/Rankine-
Tower withstorage
Case 9 Case 13 Case 14
Total Plant LEC 4.3 – 6.9 6.1 7.9 7.0
Solar LEC - 8.0 8.6 9.6
- with CO2 Credit - 6.2 6.7 7.8
Table 7.3 Long-term LECs for Rankine-Cycle Plants (in cents/kWh)
Coal-firedRankine Plant
200 MWRankine-Trough
200 MW Rankine– Trough with
storage
200 MWRankine- Tower
with storage
Case 10 Case 11 Case 15
Total Plant LEC 4.3 – 6.9 5.2 6.1 4.9
Solar LEC - 6.0 6.1 5.0
- with CO2 Credit - 4.2 4.3 3.2
7.2 SENSITIVITY ANALYSIS
A sensitivity study was conducted on the long-term value of solar LEC to model inputs.Regardless of model inputs, the LEC for all solar options fell within the range for conventionalpower. With carbon dioxide credits considered, all STPPs have LECs below that of the lowestcost coal-fired Rankine plant.
Cost Reduction Study for Solar Thermal Power Plants
May 1999 Enermodal Engineering Ltd./Marbek Resource Consultants Ltd. Page 57
Table 7.4 Sensitivity of Long-term LEC to Assumptions – Rankine-Cycle Plants(in cents/kWh)
Cents/kWh Coal-firedRankine
Plant2
200 MWRankine-Trough
200 MWRankine-
Trough withstorage
200 MWRankine- Tower
with storage
Case 10 Case 11 Case 15
Base case1 4.3 – 6.9 6.0 6.1 5.0
- 8% discount 4.0 – 6.6 5.3 5.4 4.4
- 12% discount 4.6 – 7.2 6.9 7.0 5.6
- $10/tonne carbon credit 4.3 – 6.9 5.3 5.4 4.3
- $25/tonne carbon credit 4.3 – 6.9 4.2 4.3 3.2
- $40/tonne carbon credit 4.3 – 6.9 3.1 3.2 2.1
- 25% fuel cost increase 4.6 – 7.2 6.0 6.1 5.0
- 25% fuel cost decrease 4.0 – 6.6 6.0 6.1 5.0
- 20 year plant life 4.4 – 7.0 6.4 6.5 5.3
- 30 year plant life 4.2 – 6.8 5.9 5.9 4.8
1 – 10% discount, 25 year life, no carbon credit, 2 – range is for 50 and 25% capacity factors
7.3 CONCLUSIONS
The solar LEC is expected to fall to less than half current values as a result of performanceimprovements and cost reductions. Even with these improvements, the solar portion of ISCCSplants will produce power that is still more expensive than a combined-cycle plant firing on gasat current price levels. ISCCS plants may be an effective short-term strategy to get STPP re-started but they require cost reductions beyond those currently foreseen to be cost competitivewith natural gas combined-cycle plants.
The potential for STPP to compete with Rankine cycle plants (either coal, gas or oil) ispromising. In the long-term, LEC for Trough Rankine plants are expected to be within the costrange for conventional peaking plants. STPPs with a credit for CO2 reduction have a lower LECthan coal-fired Rankine plants.
Cost Reduction Study for Solar Thermal Power Plants
Page 58 Enermodal Engineering Ltd./Marbek Resource Consultants Ltd. May 1999
8. CONCLUSIONS TO PART ANew parabolic trough STPPs are estimated to have a capital cost (in developing countries) thatis $2,000 to $3,000 per kilowatt, or 2.5 to 3.5 times that of conventional Rankine-cycle plants.Central receiver STPPs are less mature than parabolic trough and will require severalsuccessful projects to scale up to reasonable sizes. The near-term costs of central receiverSTPPs are close to $4,200 per kilowatt or five times that of conventional Rankine-cycle plants.
At the current state of technology development, the cost of solar-generated electricity isbetween 10 and 15 cents per kWh (at a 10% discount rate). This is 1.5 to 4 times moreexpensive than power from conventional power plants. Although solar power from ISCCS is10% to 20% less expensive than for a similar sized Rankine-cycle STPP, it is competing againsta much lower cost conventional power plant (combined-cycle).
The cost-per-kilowatt of trough plants are expected to fall by 40% and central receiver systemsare expected to fall by over 60%. The cost of electricity from conventional power plants isexpected to stay constant over the next twenty years.
The solar Levelized Energy Cost (LEC) is expected to fall to less than half current values as aresult of performance improvements and cost reductions. Even with these improvements, thesolar portion of ISCCS plants will produce power that is more expensive than a combined cycleplant.
The potential for STPP to compete with Rankine cycle plants (either coal, gas or oil) ispromising. In the long-term, the LEC cost for Trough Rankine plants will be within the expectedrange for conventional power plants. If a credit is included for reduced carbon emissions, allSTPPs have a lower LEC than coal-fired Rankine plants.
Cost Reduction Study for Solar Thermal Power Plants
May 1999 Enermodal Engineering Ltd./Marbek Resource Consultants Ltd. Page 59
PART B:
STRATEGY AND IMPLEMENTATIONPLAN
Cost Reduction Study for Solar Thermal Power Plants
Page 60 Enermodal Engineering Ltd./Marbek Resource Consultants Ltd. May 1999
9. INTRODUCTION TO PART BIn Part A of this report it was shown that in the mid to long-term, solar thermal power plants canprovide power at a cost that is competitive with conventional electricity generating plants. Theeconomics look best when competing with peaking or older fossil-fuel plants and look lesspromising when competing with new high-efficiency combined cycle gas plants. While there maybe some niche cases where STPPs are cost effective today, a strategic development program isneed to commercialize this technology for the more broad-based electricity market. If adevelopment program is not pursued the result will be a lost opportunity to simultaneouslyrespond to a growing demand for electricity supply while contributing to reduced levels ofcarbon emissions.
Part B presents the strategic development plan. Consistent with the scope of this study, thefollowing areas are addressed:
• Market Development Strategy
• Assessment of the Commercialization Gap
• The Proposed Development Phases
• GEF Entrance and Exit Strategy
• Conclusion & Next Steps
Cost Reduction Study for Solar Thermal Power Plants
May 1999 Enermodal Engineering Ltd./Marbek Resource Consultants Ltd. Page 61
10. MARKET DEVELOPMENT STRATEGY
10.1 MARKET DEVELOPMENT STEPS
A general characterization of the market diffusion for STPPs (or most technologies) is asfollows:
1. Research and Development: New technology is explored at a small scale and evaluated forthe potential to be significantly better than existing approaches.
2. Pilot scale operation: System level testing of components provides proof of concept andvalidates predicted component interactions and system operating characteristics. The size ofoperation is sufficient to allow reliable engineering scale-up to commercial size applications.
3. Commercial validation plants: Construction and long-term operation of early projects in acommercial environment. Operation of these projects validates the business and economicvalidity of the design, and provides an element of economic risk reduction that goes beyond thatwhich is accomplished at pilot scale operations.
4. Commercial niche plants: Sales of technology into high-valued market applications thatsupports the technology costs. Costs are reduced due to learning effects, manufacturingeconomies of scale, and sustaining product improvements.
5. Market expansion: As cost decreases and other attributes improve, sales become possiblein a broader range of market applications. The expanded market further reduces cost.
6. Market acceptance: The technology becomes competitive with conventional alternatives andbecomes the desired choice in its market. The cost of the technology levels out and the marketreaches maturity.
In examining this market diffusion model, Steps 1-3 focus on design validation and riskreduction. These steps are outside of the main role of the GEF. STPPs are beyond these firstthree steps, with the exceptions of central receivers and thermal storage for trough systems.The objective of GEF support would be to move STPPs through Steps 4 to 6, referred to asPhases 1, 2 and 3 in this report.
Cost Reduction Study for Solar Thermal Power Plants
Page 62 Enermodal Engineering Ltd./Marbek Resource Consultants Ltd. May 1999
10.2 MARKET BARRIERS
To develop a plan for market expansion, it is necessary to understand the barriers STPPs faceand must overcome.
Dormant Industry: Although the construction of STPPs was active in southern California in the1980s, there has been no new construction activity since then. The capability to construct thesolar collectors needed in STPPs still exists at companies such as Pilkington Solar (Germany),SOLEL (Israel), and IST (U.S.) but these organizations will have to re-activate or scale-upproduction lines. As a result there will be an initial cost premium for the solar equipment andthese companies may be hesitant to invest in new production processes unless a sustainablemarket is foreseen.
High Capital Cost: Perhaps the largest impediment to the purchase of STPPs is the highcapital cost relative to conventional fossil-fuel plants. In the short term, the capital cost of STPPswill be 2.5 to 3.5 times the capital cost of conventional plants. Longer term projections call forthis difference to fall to approximately two times. At that time, the higher capital cost of STPPs isexpected to be compensated by the savings in fuel costs and credits for carbon reductions,making the STPPs competitive with conventional systems.
New Technology/Risk of Failure: Although STPPs have had a reasonably successful recordof operation for almost twenty years in southern California, many potential purchasers will viewSTPPs as a new technology. With any new technology there is a risk of failure or not performingup to expectations. New purchasers will also experience one time start-up costs associated withsystem design, grid integration, training, and setting up of operating procedures. Thus, even ifSTPPs were equal in cost to conventional power plants, there would be some resistance toswitch to this new technology.
Regressive Tax or Financial Policies: Some countries have financial policies that will slow theadoption of STPPs. For example, Brazil applies a high duty on all imports including solarequipment, whereas imported fuels for conventional power plants are usually not subject toduties. Given the current small market for STPPs, it is not economically justified to have solarcollector production facilities in each country. In establishing a support program for STPPs, it isimportant that funds go towards commercializing the technology and not into a country’s generalrevenues.
10.3 STRATEGIC OBJECTIVES
The longer-term objective is the attainment of commercial competitiveness for STPPs vis-à-visconventional electricity generation systems. Attainment of this objective will enablegovernments, utilities and eventually the private sector, to respond to the growing demand for
Cost Reduction Study for Solar Thermal Power Plants
May 1999 Enermodal Engineering Ltd./Marbek Resource Consultants Ltd. Page 63
electricity supply in a more environmentally benign manner than available through conventionaloptions.
To meet this objective, it will be necessary to effectively address and overcome the marketbarriers identified above. In the short term, two of those market barriers are particularly critical,namely:
Dormant industry – The industry development process must be rekindled.
Cost – Through a next round of STPP construction, experience must verify that continued costand performance improvements can meet the forecast levels
Cost Reduction Study for Solar Thermal Power Plants
Page 64 Enermodal Engineering Ltd./Marbek Resource Consultants Ltd. May 1999
11. THE STPP COMMERCIALIZATION GAPPart A of this report showed that STPPs are predicted to achieve cost parity with conventionalpeaking power plants in the long term. Until cost parity is achieved, financial support will berequired to bridge the cost difference between STPPs and conventional power plants. Thissection defines the range and timing of the financial commitment.
The STPP commercialization gap is the investment that must be made to reduce the differencein levelized energy cost between STPPs and conventional peaking power plants to zero. Thereare four possible scenarios for the commercialization gaps depending on the capacity factor ofthe peaking power plant and whether credit is given for reduced carbon emissions. These are
• Low conventional electricity cost and no credit for carbon reductions,
• Low conventional electricity cost but credit given for carbon reductions,
• High conventional electricity cost and no credit for carbon reductions, and
• High conventional electricity cost but credit given for carbon reductions.
The low electricity cost, based on intermediate load power, is 4.3 cents/kWh. The high electricitycost is 6.9 cents/kWh and is based on peak load power (25% capacity factor). Part of the highercost for peak load power (0.5 cents/kWh) is the increase in O & M costs because the fixed O &M costs are spread out over fewer kilowatt-hours. These higher fixed costs would also apply tothe solar plant. So to ensure a fair comparison the solar LEC values generated for a 50%capacity factor were increased by 0.5 cents/kWh to account for the higher O & M costs if thesolar plant were operated for fewer hours (on fossil-fuel). The carbon credit is $25/tonne ofcarbon, which equates to almost two cents per kilowatt-hour.
Figures 11.1 to 11.4 show the expected decrease in solar LEC with installed capacity. The solarLEC curve was generated using the current cost performance values for the most commerciallymature system (Case 4 - 200 MW Rankine trough solar plant) and a progress ratio of 0.88 (seeSection 6.3). The future LEC curve would be similar regardless of which solar option wasstudied because all solar systems options (e.g., thermal storage, central receivers) have similarlong-term values of solar LEC (although the uncertainty would be larger for other systemsbecause they are not as commercially mature). It is the shape of the curve that is importantrather than which solar technology will emerge as the least cost option.
Table 11.1 summarizes the results from Figures 11.1 to 11.4 and presents the incrementalinvestment required to achieve cost parity for each scenario. The investment is divided into twoparts: investment justified by the reduction in carbon emissions and additional investmentbeyond the carbon credit required to achieve cost parity. The parity target is the cost that solar
Cost Reduction Study for Solar Thermal Power Plants
May 1999 Enermodal Engineering Ltd./Marbek Resource Consultants Ltd. Page 65
Figure 11.2 Scenario 2 – Low conventional electricity costwith credit given for carbon reductions
1
10
100
100 1,000 10,000 100,000
Cumulative Power Plant Capacity Installed (MWe)
LEC
(cen
ts p
er k
Wh)
Case 10 with carbon credit
Low Conventional Electricity Cost
Case 4 with carbon credit Case 9 with
carbon credit
Parity (equivalent
LECs)
Phase 1 Phase 2 Phase 3
Cost Reduction Study for Solar Thermal Power Plants
Page 66 Enermodal Engineering Ltd./Marbek Resource Consultants Ltd. May 1999
Figure 11.3 Scenario 3 – High conventional electricity costand no credit for carbon reductions
1
10
100
100 1,000 10,000 100,000
Cumulative Power Plant Capacity Installed (MWe)
LEC
(cen
ts p
er k
Wh)
Case 10
High Conventional Electricity Cost
Case 4Case 9
Parity (equivalent LECs)
Phase 1 Phase 2 Phase 3
Figure 11.4 Scenario 4 – High conventional electricity costwith credit given for carbon reductions
1
10
100
100 1,000 10,000 100,000
Cumulative Power Plant Capacity Installed (MWe)
LEC
(cen
ts p
er k
Wh)
Case 10 with carbon credit
High Conventional Electricity Cost
Case 4 with carbon credit Case 9 with
carbon credit
Parity (equivalent LECs)
Phase 1 Phase 2 Phase 3
Cost Reduction Study for Solar Thermal Power Plants
May 1999 Enermodal Engineering Ltd./Marbek Resource Consultants Ltd. Page 67
power must achieve to compete with conventional power. For the scenarios with carbon credits,it is assumed that the STPP carbon savings can be used to buy down the cost of solar power.
There is a wide range in the total incremental level of investment to achieve cost parity from$0.5 billion to $9.7 billion. Scenario 1 is pessimistic since it assumes no carbon credits willemerge and no niche markets with high electricity costs can be identified. If future society isunwilling to pay for reductions in carbon emissions, then the whole role of the GEF is inquestion. This scenario does show, however, that STPPs will likely need carbon credits tocompete with conventional electricity production.
Assuming a market for carbon credits develops, then Scenarios 2 and 4 bracket the range ofinvestment to achieve cost parity. The total incremental investment is between $0.5 and $4.1billion, however, two-thirds of this investment is a financial recognition of the carbon reductionbenefit of STPPs. The incremental investment to achieve cost parity beyond carbon credits isbetween $0.13 and $1.43 billion. There may be a need for additional funding (perhaps 10%) tocompensate for investor risk and to study the progress in achieving program goals.
The goal of the development plan is to reduce solar LEC to under 8.7 cents/kWh to competewith peak electricity power and to under 6.1 cents/kWh to compete with intermediate loadpower. Since the total potential market for STPPs is estimated at 600,000 MW, only a 1.5%penetration rate over the next 20 years is needed to achieve the lower cost parity target.
Cost Reduction Study for Solar Thermal Power Plants
Page 68 Enermodal Engineering Ltd./Marbek Resource Consultants Ltd. May 1999
12. PROPOSED DEVELOPMENT PLAN
12.1 OVERVIEW
The proposed STPP development plan is divided into three phases:
Phase 1 - Niche Market Awareness (near-term)
Phase 2 - Market Expansion (medium-term), and
Phase 3 - Market Acceptance (longer-term).
As is outlined below, each of these phases has different technological, financial andcommercialization objectives. The goal of the first phase is to rekindle interest in the technologyand increase awareness of several promising STPP options. The goal of the second phase is toscale-up production and plant size to achieve performance increases and cost reductions. In thefinal phase, the goal is for the technology to achieve cost competitiveness with main streamconventional power plants.
The proposed role of the Global Environment Facility (GEF) would vary in each phase. GEFsupport is most critical to Phase 1. Based on the study’s findings to date, it is believed thatwithout GEF support for Phase 1, further development will not occur. However, at theconclusion of Phase 1, additional options and potential contributors are expected to emerge.
As discussed in the following text, careful evaluation of the results of Phase 1 is essential. In theworst case scenario, GEF may choose to exit at the conclusion of Phase 1 if the results of thisadditional STPP capacity do not show that the actual STPP cost and performanceimprovements are within the forecast levels. Alternately, in the more optimistic scenario, if theactual results fall within, or better than, the forecast levels, then it is expected that additionalfinancing will become available that will enable the GEF to gradually withdraw its financialcontribution.
The remainder of this section provides further discussion of each proposed phase of theDevelopment Plan. The discussion of each phase is structured as follows:
• Specific Development Objectives
• Target Systems
• Target Markets
• Required Investment Levels
• GEF Role and Exit Strategies
Cost Reduction Study for Solar Thermal Power Plants
May 1999 Enermodal Engineering Ltd./Marbek Resource Consultants Ltd. Page 69
12.2 PHASE 1 – MARKET AWARENESS
12.2.1 Phase 1 Objectives
The Phase 1 objectives are to:
• rekindle interest in STPPs in relevant developing countries,
• allow the industry to start-up production processes,
• determine the current cost and performance of STPPs, and
• evaluate new STPPs concepts to see if they have promise for long term commercialization.
To meet these objectives requires a concerted and regionally diverse market awareness phase.
12.2.2 Target Systems – Phase 1
Since the last SEGS plant was built in 1990, many concepts to improve the cost performance ofSTPPs have been developed, but not evaluated at the commercial plant scale. The costperformance of solar Rankine cycle plants can be improved by increasing the plant size to 200MW, and, in the longer term, tilting the arrays towards the sun and adding thermal storage.Methods of integrating the solar field with conventional combined cycle plants have beenproposed by Pilkington [1996], Bechtel [1998] and York Research Corporation [1998]. Thesesystems offer lower solar power costs and reduced risk. Testing at Solar Two has shown thatthe concepts of central receiver and solar thermal storage are technically feasible but they haveyet to be evaluated in a true utility setting. If STPPs are to move down the cost performancecurve, it is essential that these new concepts be evaluated in commercial-scale power plants.
The main activity for Phase 1 is to increase market awareness by funding one or two STPPs ineach region of interest (Mexico, Brazil, North Africa, Southern Africa, Middle East, andIndia/Pakistan), or approximately nine projects. These systems will likely be smaller than theoptimum of over 200 MW because of the need to minimize investor risk and to start-upproduction processes. Assuming an average solar plant size of 80 MW, the demonstrationphase would cover the installation of approximately 750 MW of solar power.
Ideally the awareness campaign should fund several different STPP concepts so that theirtechnical and financial viability can begin to be assessed. It is recommended however, thatfunding or support programs be technology neutral. The choice of system type and size shouldbe made by the local country and the developer. In this way, the market place can begin to pointto the “winning technologies”, thereby avoiding spending support dollars on “dead-end
Cost Reduction Study for Solar Thermal Power Plants
Page 70 Enermodal Engineering Ltd./Marbek Resource Consultants Ltd. May 1999
technologies”. Concepts that are less developed (e.g., central receivers, trough systems withstorage) may require research and development support from governments or industry but thisis outside the role of the GEF.
12.2.3 Target Markets – Phase 1
In this Phase 1, it is recommended that the initial market focus should be in those marketswhere the conditions for STPPs are currently most promising. Previous experience shows thatthese conditions are:
High Solar Resource: The performance of STPPs will be highest in sunny regions. In Section2.2, suitable regions for STPPs are identified. Within these regions, the solar resource variesfrom 1700 to 2900 kWh/m2. Those regions with a solar resource in the upper half of this rangewill have the best performance. These regions in developing countries include northern Mexico,Egypt, Jordan and other parts of the Middle East.
High Fossil-Fuel Prices: STPPs will have the largest cost savings when displacing high costfuels, such as diesel, oil and naphtha. These fuels are used in Morocco, Crete and India. Coal,although a low-cost fuel, has the highest pollution emissions. The credit for reduced carbonemissions will more than offset the low cost of this fuel.
Daytime Peaking Utility: In most developing countries, the peak electricity demand is in the 5pm to 11 pm period. This peak is shifting however, to earlier in the day as air-conditioning loadsare added to the system. In northern Mexico, for example the peak is at 3 pm (see Figure 2.2).As this shift occurs the output from the solar plant can be used to displace peak electricitygenerating plants. The solar power is thus competing against more expensive conventionalpower. Utilities in developing countries typically have a requirement for 10 to 15% of the systemcapacity for peak power and another 10 to 15% for intermediate power.
Inefficient Conventional Power Plants: New combined cycle natural gas power plants canhave efficiencies of over 50%. However, most utilities have a mixture of power plants. STPPswill look most favorable when displacing either older power plants or Rankine or combustionturbine plants operated to meet the peak electrical load.
Local Support for STPPs: Several countries are supportive of STPPs. Rather than placingimport duties or trade barriers on solar equipment, these countries are encouraging the adoptionof this more environmentally appropriate technology. For example, Spain is willing to pay apremium for solar generated electricity and the European Union is supporting the project inCrete.
Cost Reduction Study for Solar Thermal Power Plants
May 1999 Enermodal Engineering Ltd./Marbek Resource Consultants Ltd. Page 71
Access to Water and the Grid: Power plants (whether solar or fossil fuel) need water forcooling and access to the electric grid (to transmit the power to the load). While at first it mayseem a challenge to have access to water in sunny arid regions, most regions being consideredfor STPPs border a large body of water. Thus, access to water and the grid is essentially a localsiting issue.
The Phase 1 STPP installations should target those regions where several of the aboveconditions are met.
12.2.4 Required Investment – Phase 1
Because this is the start-up (or re-starting) phase of STPPs, the funding requirements for theseprojects will be high on a $/kW basis. The total dollar investment is less than Phase 2 (seeSection 12.3) because only a few projects are funded. Because there is no system in place forselling or trading carbon credits, financial support will have to cover the full cost differentialbetween STPPs and conventional power. Depending on the cost of power displaced, thefinancial support to achieve cost parity will range from $400 to $750 million or $550 to $1000 perkW. An additional payment (perhaps 10%) may be required to compensate for the risk of thesefirst few systems.
12.2.5 Proposed GEF Role and Exit Strategies – Phase 1
The support funding for this Phase 1 will have to come almost entirely from the GEF. No otherfunding agency has emerged in the nine years since the last STPP was built. Thus, the GEFhas to show a commitment to this technology in order to encourage other funding agencies tocome forward and to convince the private sector that there is a market for STPPs.
The implementation strategy would have the GEF fund the full incremental cost for the first fourprojects. These would likely be the projects that have been submitted for GEF funding. Theremaining five projects would be selected through an open solicitation based on the lowestfunding request (per kWh). Proponents would be encouraged to locate the best applications forSTPPs, develop the most cost-effective systems and solicit support from other organizations.This technique may allow the GEF to reduce their level of financial support.
A final aspect of this phase is performance monitoring. Because new concepts are being tried, itis important the cost, performance and reliability of the systems be documented and shared withthe solar thermal community. This exchange of information will help to identify problems thatneed to be corrected.
The assessment of STPP progress to the end of Phase 1 will provide the basis for the GEF’sfirst exit decision. As outlined previously, the solar (not total plant) levelized energy cost are
Cost Reduction Study for Solar Thermal Power Plants
Page 72 Enermodal Engineering Ltd./Marbek Resource Consultants Ltd. May 1999
forecast to be in the range of 10 to 11 cents/kWh (for a 200 MW system). The actual cost andperformance data from Phase 1 installations will, therefore, provide a readily measurableindicator of progress to date. If the cost of solar power is significantly above these values(corrected for size of system – see Figure 3.2), then the GEF should reconsider future support.If on the other hand, the cost per kilowatt-hour is equal to or below this value, then Phase 2should proceed.
12.3 PHASE 2 – MARKET EXPANSION
12.3.1 Phase 2 Objectives
Once STPPs have been demonstrated in the regions of interest, the next phase in thedevelopment process is to scale-up the technology and expand the market. The purpose of themarket expansion phase is:
• develop larger systems to benefit from economies of scale,
• continue with product development to improve performance and lower costs,
• create a market large enough that manufacturers can justify construction of production lines,and
• standardize system designs.
The desired result for this phase is to lower the solar LEC so that STPPs can compete withconventional power assuming a carbon market develops. This means that the solar LEC mustfall to approximately 7.5 cents/kWh.
12.3.2 Target Systems – Phase 2
Most of the projects that have been submitted to the World Bank/GEF for support are smaller(30 to 100 MW) than the optimum size (200 MW or more). While it makes sense in thedemonstration phase to evaluate modest size systems, in the scale-up phase the size of thesystems should be increased to benefit from economies of scale. It has been estimated that foreach doubling of plant size, the system cost falls by 12% [Pilkington, 1996]. By the time systemsize has reached 200 MW most of the economy-of-scale benefit has been achieved.
As the systems reach an optimum size, there will be a tendency to standardize the systemdesign. A standard design will help to improve the system cost performance by reducing design
Cost Reduction Study for Solar Thermal Power Plants
May 1999 Enermodal Engineering Ltd./Marbek Resource Consultants Ltd. Page 73
costs, streamlining equipment procurement and minimizing construction and start-up problems.There will also be a need to standardize and make widely available design and site selectiontools, so that utility planners and designers can evaluate the solar option.
The results of the market awareness phase will identify areas for potential improvement insystem performance and opportunities for cost reductions. It is important in the scale-up phaseto continue with research, development and demonstration of STPPs. Possible improvements inthis phase are better performing mirror and receiver coatings, development of thermal storagesystems for parabolic troughs, direct steam generation in the collectors and better integrationwith the balance of plant.
Perhaps the most important goal in this phase is to increase market demand so that a STPPindustry can develop. Today, there are only a handful of collector manufacturers and STPPproject developers. As the market increases, the existing players will be able to scale-up theiroperations and new players will enter the market. This will drive down costs for two reasons.First, manufacturers will be able to justify expenditures into more efficient production lines.Second, new players will introduce competitive pressures to lower costs and improveperformance.
12.3.3 Target Markets –Phase 2
In this phase, 3000 MW of additional solar capacity is installed, or fifteen 200 MW plants. Thecost of solar power is expected to fall from over 10 cents/kWh to between 7 and 8 cents perkWh. At this price level, STPPs should be able to provide power at a cost competitive withconventional sources if credits are given for carbon reductions. As the cost of the technologyfalls, the market for STPPs should move beyond niche applications and open up to peak loadapplications regardless of the conventional fuel source.
12.3.4 Required Investment Levels – Phase 2
This phase represents an increased investment over Phase 1 and in some scenarios the largestinvestment. Depending on the cost of power displaced, the financial support to achieve costparity will range from $0.5 to $1.8 billion or $350 to $600 per kW.
12.3.5 GEF Role and Exit Strategies – Phase 2
New funding partners may emerge in the market expansion phase provided the WorldBank/GEF continues to show their support for this technology. Possible other funding partnersinclude the OECF and the KfW. Given these various alternative funding sources, it is assumed
Cost Reduction Study for Solar Thermal Power Plants
Page 74 Enermodal Engineering Ltd./Marbek Resource Consultants Ltd. May 1999
that the GEF will be able to reduce their level of support from close to 100% in the marketawareness phase to an average of 50% in this phase. Thus, the level of GEF support will rangefrom $250 to $900 million.
In addition, more countries may follow Spain’s lead and pay a premium for solar generatedelectricity or penalize carbon-emitting energy technologies. Some developed countries(especially those with local solar collector manufacturing plants) may provide support to solarprojects as part of their international aid package to developing countries.
The assessment of STPP progress to the end of Phase 2 will provide the basis for the GEF’ssecond exit decision. The solar levelized energy cost are forecast to be in the range of 7 to 8cents/kWh at the end of this phase. If the cost of solar power is significantly above these values,then the GEF should reconsider future support. If on the other hand, the cost per kilowatt-hour isequal to or below this value, then Phase 3 should proceed.
12.4 PHASE 3 – MARKET ACCEPTANCE
12.4.1 Phase 3 Objectives
The final part in the development plan is the market acceptance phase. The goal for this phaseis to set up the necessary market structure so that STPP can compete with conventional powerplants without financial support from the GEF or others.
12.4.2 Target Systems and Markets – Phase 3
As the solar option matures, STPPs will compete in the broad electricity market and not justniche markets. With decreasing costs, STPPs will displace intermediate electricity loads andperhaps base load in regions with high fuel costs. It is expected that STPPs will be designed tohave higher capacity factors and operate more as stand-alone systems.
12.4.3 Required Investment Levels – Phase 3
The investment requirement in this phase is the most difficult to estimate and subject to thewidest variation. The cost of solar generated electricity is expected to fall close to conventionalpower values. A small difference in solar costs can have a huge impact on the marketpenetration. Similarly, the existence of carbon credits will have major impact on the marketacceptance of STPPs.
Cost Reduction Study for Solar Thermal Power Plants
May 1999 Enermodal Engineering Ltd./Marbek Resource Consultants Ltd. Page 75
If there is a program of carbon credits or trading, STPPs will likely not require any support fromthe GEF under the high conventional energy cost scenario. Under the low conventional energycost scenario, an investment of $330 million would be required (beyond the credit for carbonemission reduction). This translates into $100/kW. After this STPPs should be able to competewithout any financial support.
Without a program for carbon credits a significant support program may be required to achievecost parity. If a carbon market does not develop in the long-term, this implies society does notplace a value on reducing greenhouse gas emissions. In this scenario, there is no role or needfor the GEF and the GEF would not be required to support STPPs or other technologies thatreduce greenhouse gases.
12.4.4 Role of GEF and Exit Strategies – Phase 3
Assuming successful Phases 1 and 2, the market acceptance phase is expected to lead to costparity of STPPs with conventional fossil fuel plants, particularly if carbon credits are available.The most important role the GEF can provide in this phase is to encourage the adoption ofcarbon credits. If successful, only modest financial support from the GEF would be required inthis phase. This provides the final exit strategy for the GEF.
The success of the commercialization will depend on several factors. First and most importantlyis whether the cost and performance goals for STPPs are met. Second, cost parity is based ona financial credit for reduced carbon emissions. If there is no carbon trading, carbon credits orcarbon tax, the adoption of STPPs will be reduced or slowed. Third, trade, tax and othereconomic barriers must not penalize the solar option. The study was performed as an economicanalysis, not a financial analysis. Real-life financing issues can have a major impact on theadoption of any technology.
The GEF can play a major role in all three of these areas, ensuring that a cost-effectivetechnology is developed, a program of carbon credits or trading is implemented and financialbarriers are limited. The next section specifically defines the next steps in realizing the potentialfor solar thermal power plants.
12.5 SUMMARY
Table 12.1 summarizes the requirements for each of the three phases in the development plan.The total investment for the GEF is estimated at $600 million to $1.75 billion for the threephases (assuming a carbon market develops by Phase 3). This corresponds to an annualinvestment of between $60 and $160 million per year over the next ten years.
Cost Reduction Study for Solar Thermal Power Plants
Page 76 Enermodal Engineering Ltd./Marbek Resource Consultants Ltd. May 1999
Table 12.1 Required Investment in STPPs by Phase1
Phase Time Frame Solar LECTarget(c/kWh)
AdditonalInstalledCapacity
Est. TotalIncrementalInvestment($ million)
Est. GEFInvestment($ million)
Phase 1 2000 – 2004 10 to 11 750 MW 440 to 750 350 to 700
Phase 2 2005 – 2009 7 to 8 3000 MW 500 to 1,800 250 to 900
Phase 3 2010 + Under 6 4600 MW 0 to 3301 0 to 1501
Total 8300 MW 940 to 2,955 600 to 1,750
1 – assumes a carbon market develops by Phase 3
Cost Reduction Study for Solar Thermal Power Plants
May 1999 Enermodal Engineering Ltd./Marbek Resource Consultants Ltd. Page 77
13. THE NEXT STEPS FOR THE WORLDBANK/GEF
The GEF is poised to play a key role in the development of STPPs. The key steps to beundertaken are listed below.
Provide specific guidance to industry on GEF involvement in commercialization of STPP.The GEF needs to provide specific information to industry on the role that the GEF intends toplay in commercializing this technology. This will help both industry and governmental R&Dorganizations target their activities. Indications of the desire to play a long-term role wouldreduce the risk to industry for making investments in developing the technology.
Use current role as an advocate for STPPs. The GEF and World Bank are looked to aroundthe world as the key organization today essential for commercial deployment of STPPtechnology. Promoting this technology to governmental organizations and the private sectoraround the world will help increase interest in this technology.
Establish consultation role between Bank, industry and R&D Organizations. The WorldBank and GEF should coordinate their activities with industry and R&D organizations. TheWorld Bank is in a position to provide their perspectives on market trends that could be highlyvaluable to industry and R&D organizations. Similarly, World Bank and GEF initiatives should beflexible enough to take advantage of new developments in the technology.
Establish cost reduction targets for providing support. The GEF should establish aprogram that provides reducing contributions with installed capacity. The contributions arebased on the achieving certain cost performance goals. This approach would focus industry ondeveloping cost-effective applications and systems. Another benefit of the approach is that itwould provide an exit strategy for the GEF. If cost performance goals are not met, then GEFsupport should be curtailed.
Cost Reduction Study for Solar Thermal Power Plants
Page 78 Enermodal Engineering Ltd./Marbek Resource Consultants Ltd. May 1999
14. CONCLUSIONS TO PART B
A three-phase development plan is required to commercialize STPPs: market awareness,market expansion and market acceptance. GEF support is critical to the success of this plan.
In Phase 1, the GEF would need to provide financial support in the order of $350 to 700 millionto fund approximately nine projects (750 MW). The support would be in the range of $550 to$1000/kW.
In Phase 2, a further 3,000 MW of installed capacity would be supported. The total support costis estimated at $500 million to $1.8 billion ($350 to 600/kW). Additional financial partners areexpected to emerge, so that GEF support would only be a portion of these values.
In Phase 3, the emergence of carbon credits could mean that STPPs are cost effective and onlymodest financial support is required (less than $330 million). The total support required tocommercialize STPPs is estimated at between $1 and $3 billion; approximately 60% of whichwould need to come from the GEF. The annual GEF investment is estimated at between $60and $160 million.
The success of the commercialization will depend on several factors. First and most importantlyis whether the cost and performance goals for STPPs are met. The goals are 10 to 11cents/kWh at the end of Phase 1, 7 to 8 cents/kWh at the end of Phase 2 and under 6 cents inPhase 3. Second, cost parity is based on a financial credit for reduced carbon emissions. Ifthere is no carbon trading, carbon credits or carbon tax, the adoption of STPPs will be reducedor slowed. Third, trade, tax and other economic barriers must not penalize the solar option.Real-life financing issues can have a major impact on the adoption of any technology. The studywas performed as an economic analysis, not a financial analysis.
The GEF can play a major role in all three of these factors, ensuring that a cost-effectivetechnology is developed, a program of carbon credits or trading is implemented and financialbarriers are limited.
Cost Reduction Study for Solar Thermal Power Plants
May 1999 Enermodal Engineering Ltd./Marbek Resource Consultants Ltd. Page 79
15. REFERENCESAnderson, 1998. The Economics of Photovoltaic Technologies. Paper prepared by DennisAnderson, Imperial College of Science, Technology and Medicine for the World Bank
Bohn, 1995. Combined Cycle Power Tower. Proceedings of the 1995 ASME/JSME/JSESInternational Solar Energy Conference, March 19-24, 1995. Prepared by M. Bohn, T. Williams,H. Price.
Cordeiro, 1997. START Mission to Brazil – May 5-9, 1997. Prepared for International EnergyAgency (IEA) Solar Power and Chemical Energy Systems. Prepared by Patricia Cordeiro,Sandia National Laboratories, Albuquerque, New Mexico.
DOE/EPRI, 1997. Renewable Energy Technology Characterizations. Prepared by EPRI andU.S. Department of Energy. Palo Alto, California and Washington, D.C.
DOE, 1998. Annual Energy Outlook 1999 – Electricity Market Module. Prepared by the U.S.Department of Energy, Washington, D.C.
Fichtner Development Engineering, Engineers India Ltd., 1995. Comprehensive FeasibilityReport – Solar Thermal Power Plant – Mathania Rajasthan. Prepared for Rajasthan EnergyDevelopment Agency.
Geyer, 1996. IEA Solar PACES START Mission to Egypt – February 23-29. 1996. Prepared forMinistry of Electricity & Energy, New & Renewable Energy Authority. Edited by Dr. MichaelGeyer, Alméria.
Geyer, 1997. START Mission to Jordan – March, 1997. Prepared for International EnergyAgency Solar Power and Chemical Energy Systems. Prepared by Michael Geyer and RainerKistner, Alméria.
ISCCS, 1998. Integrated Solar Combined Cycle System Subcontract ADC – 8-18466-01 FinalReport. Prepared for National Renewable Energy Laboratory. Prepared by Bechtel Corporation,San Francisco, California
IEA, 1991 “Guidelines for The Economic Analysis of Renewable Energy TechnologyApplications”
International Private Power Quarterly, 1998. Egypt. Fourth Quarter 1998.
Kolb, 1997. Economic Evaluation of Solar-Only and Hybrid Power Towers Using Molten-SaltTechnology. Prepared for Elsevier Science Ltd., Great Britain. Prepared by Gregory J. Kolb,
Cost Reduction Study for Solar Thermal Power Plants
Page 80 Enermodal Engineering Ltd./Marbek Resource Consultants Ltd. May 1999
Solar Thermal Technology Department, Sandia National Laboratories, Albuquerque, NewMexico.
Lewis, 1996. India’s Refining Prospects Linked to Economic Growth. June 10, 1996, Oil andGas Journal.
Neij, 1997. Use of Experience Curves to Analyse the Prospects for Diffusion and Adoption ofRenewable Energy Technology. Energy Policy, 1997, Elsevier Science Ltd., Great Britain.
Pilkington, 1996. Status Report on Solar Trough Power Plants. Prepared for the GermanFederal Ministry for Education, Science, Research and Technology. Prepared by PilkingtonSolar International GmbH, Cologne, Germany.
Pilkington, 1998. Prefeasibility Study – Solar Thermal Trough Power Plant for NorthernMorocco. Prepared for the European Commission Directorate General 1,INFRAST/ME1/B74100/96/002/A5. Prepared by Pilkington Solar International GmbH withcontributions from INTEC, Cologne, Germany.
Spencer Management Associates, 1994. Integrated Solar Combined Cycle Systems (ISCCS)Using Solar Parabolic Trough Technology – Phase IA Technical and Economic Review.Prepared for Sub-Secretario de Electricidad Parastate Department of Energy, Mines & Industry(SEMIP), Gerente de Proyectos Geotermoelecticos Comision Federal de Electricidad (CFE),The Rockefeller Foundation, The World Bank. Prepared by Spencer Management Associates,Diablo, California.
World Bank, 1998. Commodity Markets and the Developing Countries. Prepared by the WorldBank, Washington, D.C.
Cost Reduction Study for Solar Thermal Power Plants
May 1999 Enermodal Engineering Ltd./Marbek Resource Consultants Ltd. Page 81
Cost Reduction Study for Solar Thermal Power Plants
Page 82 Enermodal Engineering Ltd./Marbek Resource Consultants Ltd. May 1999
Appendix A. Sample Calculation of Levelized ElectricityCost
Calculation InputsTables A.1 shows the inputs for Case 5, a 200 MW Trough Rankine system. Table A.2 gives anexplanation of the various inputs and assumptions made to establish the base values for eachcase. The input data for capital costs, O&M costs and performance variables are extracted fromthe values in Section 3.
Table A.1 Inputs for Case 4: 200 MW Trough Rankine
Plant parameters: 200 MW TroughRankine
Quantity Units
QualitativeDate of analysis 19-Feb-99Plant identification Case 4Plant type RankineConcentrator type TroughExpected system lifetime 25 years
System DescriptionTotal plant power (nominal) 200 MWe, netSolar component power (nominal) 200 MWe, netThermal Energy Storage n/a MWheConcentrator Aperture Area n/a m2
System PerformanceNet electricity to grid 876,000 MWhe/yrNet electricity by solar 439,752 MWhe/yrNet electricity by fuel 436,248 MWhe/yrFull load hours - total 4,380 h/yr
Cost Reduction Study for Solar Thermal Power Plants
May 1999 Enermodal Engineering Ltd./Marbek Resource Consultants Ltd. Page 83
FuelBaseline Fuel (Coal or Gas) CoalFuel cost 1.14 $/GJAnnual CO2 credits 0 USD per tonneSpecific emissions 0.827
0.226Tonnes CO2/MWheTonnes C/MWhe
Net conversion efficiency for fuel (HHV) 35.5%Net conversion for solar backup (HHV) 30.7%
Emissions data / base caseBase Case (Coal Rankine or Combined Cycle) Coal RankineSpecific emissions of base case 0.827
Table A.2 Explanation of inputs for engineering model
Variable Notes Value
Expected systemlifetime
This is the useful life of the plant Results are based on 25 year lifetime
Total Plant Power(nominal)
Maximum overall plant output, includingboth solar and fossil-fuel components
Case-dependent
Solar componentpower
The maximum output of the solarcomponent. This number is included inthe Total Plant Power
Case-dependent
Total Investment Installed cost for plant including siteworks, solar field, HTF system etc.
Case-dependent
Annual O&Mcosts
Annual cost for all operation andmaintenance
Case-dependent
Discount Rate see Table 4.2 Results based on 10% discount ratePlant Capacity Percentage of time during year that plant
runs at maximum (nominal) powerSet at 50% for all cases
Solar Capacity Percentage of time during year that thesolar component runs at full power
Case-dependent
Fuel costs Expressed in USD per GJ 1.14 USD/GJ for coal, 2.37 USD/GJ forgas
Specificemissions
Tonnes of CO2 released as a function ofplant power output and powerconversion type
0.093 tC/MWh for Gas CombinedCycle, 0.226 tC/MWh for Coal Rankine(Kolb, 1996)
Fuel conversionefficiency
Reflects the energy conversion efficiencyof the power plant. The conversionefficiency of a fuel plant in solar backupmode is lower than that of a fuel-onlyplant
Coal Rankine:- 35.5% fuel-only plant- 28.0% or 30.7% in backup modeGas Combined Cycle:- 48.3% fuel-only plant- 45.5% in backup mode
Base case data For STPP ISCCS-type plants, a fuel-onlyGas Combined Cycle plant is used forcomparison. For STPP Coal Rankineplants, a coal plant is used forcomparison
Cost Reduction Study for Solar Thermal Power Plants
Page 84 Enermodal Engineering Ltd./Marbek Resource Consultants Ltd. May 1999
Calculations for Case 4:
The IEA Methodology is used to calculate the Levelized Electricity Cost. A complete calculationfor Case 4 (200 MW Trough Rankine) is shown below to demonstrate the methodology andassumptions.
Levelized Electricity Cost (LEC) calculations
Where: FCR = fixed charge rate
I = Installed capital costs
OM = Annual operation and maintenance costs in year zero
L = Annual expenses for input energy
C = Annual CO2 reduction credit
E = Annual energy production (Wh)
( )( )
21
111FCR
kp
dt
t
n
= + +=∑
Where: n = Lifetime of the plant (years)
kd= discount rate
p1 = insurance rate
Where: LECSTPP = LEC of STPP
FS = solar share (full load hours solar / full load hours plant)
LECCon = LEC of equivalent conventional plant
( )( )
1 LECFCR I OM L C
EPlant = ⋅ + + −
LECLEC FS LEC
FSsolar
STPP Con= − − ⋅( )1
Cost Reduction Study for Solar Thermal Power Plants
May 1999 Enermodal Engineering Ltd./Marbek Resource Consultants Ltd. Page 85
Fixed charge rate = using equation (2) at n=25 years and kd = 8%
= 9.37% + 1.00%
= 10.37 %
Net electricity to grid = Total Plant Power x Plant Capacity Factor x Hours Per Year
= 200 MW x 0.5 x 8760
= 876,000 MWh per year
Solar Capacity factor = Relative Solar Capacity x Solar component power / Total plant power
= 0.251 x 200 MW / 200 MW
= 0.251 (or 25.1%)
Net electricity by solar = Nominal Power x Solar Capacity Factor x Hours per year
= 200 MW x 0.251 x 8760
= 439,752 MWh per year
Net electricity by fuel = Net electricity to grid – Net electricity by solar
= 436,248 MWh per year
Fuel consumed = Net electricity by fuel x (Wh to J Conversion) / Conversion efficiency
= (436,248 MWh) x (3.6 GJ/MWh) / 0.307
= 5,115,612 GJ
Note: 30.7% is the conversion efficiency of a Rankine plant in backup mode.
Annual fuel cost = Fuel consumed x Fuel cost
= 5,115,612 GJ x 1.1.4 USD/GJ
= 5,831,797 USD
Annual O & M cost = O&M cost factor x Net electricity to grid
Cost Reduction Study for Solar Thermal Power Plants
Page 86 Enermodal Engineering Ltd./Marbek Resource Consultants Ltd. May 1999
= (0.935 cents/kWh) / (100 cents/USD) x (876,000 MWh) x
(1000 kWh/MWh)
= 8,190,600 USD
CO2 emissions (STPP) = Net electricity by fuel x Emissions factor
= 436,248 MWh x 0.827 tonnes CO2/MWh
= 360,777 tonnes CO2
Carbon emissions (base) = Net electricity to grid x Emissions factor
= 876,000 MWh x 0.827 tonnes CO2/MWh
= 724,452 tonnes CO2
Annual avoided emissions = CO2 emissions (base) – CO2 emissions (STPP)
= 724,452 – 360,777
= 363,675 tonnes CO2/year or 99,184 tonnes Carbon/year
Note: Number different on spreadsheet due to rounding
Cost of avoided emissions = Total Investment / Lifetime avoided emissions
= 413,950,000 USD / (363,675 tonnes CO2/year x 25 years)
= 45.53 USD/tonne CO2
Annual CO2 credits = Annual avoided emissions x Emissions credits
LEC (conventional) = [(0.1037) x (864.45 x 200,000) + (0.731 / 100 * 876,000,000) +
(3.6 x 876,000,000/ 0.344 x 1.14 / 1000)] / 876,000
Cost Reduction Study for Solar Thermal Power Plants
May 1999 Enermodal Engineering Ltd./Marbek Resource Consultants Ltd. Page 87
= 39.70 USD per MWh
Note: Because the base case plant runs as a fuel-only plant, its efficiency is greater than that ofa backup plant. Thus efficiency = 34.4% rather than 30.7%
Cost Reduction Study for Solar Thermal Power Plants
Page 88 Enermodal Engineering Ltd./Marbek Resource Consultants Ltd. May 1999
Appendix B. Results of LEC Analysis for all Cases
This appendix contains the analysis of the 15 cases studied. The format is similar to thatpresented in other reports [Pilkington, 1996] so that these results can be easily compared to theresults of other studies.
Cost Reduction Study for Solar Thermal Power Plants
May 1999 Enermodal Engineering Ltd./Marbek Resource Consultants Ltd. Page 89
Levelised Energy Cost (LEC) Calculations - Base case
Economic analysis: 1 400 MW None RankineNet capacity 400 MW Solar field n/a m2
Solar capacity 0 MW Fuel type CoalSummary of base case parametersProject cost w/o tax ('000 USD) * 345,780 Expected lifetime 25 yearsGrant for non-conventional fraction - Annual discount rate 10.0%Carbon credit ('000 USD) - Annual insurance rate 1.0%Fuel price (USD per GJ) 1.14 Fixed charge rate 12.02%Unit cost (USD/kW) 864 CO2 credits - USD/tonneEfficienciesHeat collection efficiency 0.0% Annual solar efficiency 0.0%Power cycle efficiency 0.0% Plant capacity 50.0%Parasitic efficiency 0.0% Solar capacity 0.0%Solar-to-electric net efficiency 0.0% Plant efficiency (Back-up Mode) 34.4%Levelised Electricity Cost calculationsNet electricity by solar - MWhe/yrNet electricity by fuel 1,752,000 MWhe/yrNet electricity to grid 1,752,000 MWhe/yrSolar share 0.0%Full load hours - total 4,380 h/yrFull load hours - solar - h/yrAnnual fuel use 18,334,884 GJ/yrAnnual fuel cost 20,901.77 '000 USDAnnual O&M cost 12,807 '000 USDLevelised Electricity Cost (entire plant) 42.96 USD/MWh
LEC (solar only component) - USD/MWhAvoided emissions calculationsElectricity production by fuel over lifetime 43,800,000 MWheElectricity production - total over lifetime 43,800,000 MWheEmissions over lifetime (STPP) 39,374,163 t CO2
Emissions over lifetime (Base case) Coal Rankine 39,374,163 t CO2
Avoided emissions (over lifetime) - t CO2
Avoided emissions (annual) - t CO2 per yearAvoidance cost (w/o grant) against base case #DIV/0! USD/t CO2
* - cost includes discount in developing countries
Cost Reduction Study for Solar Thermal Power Plants
Page 90 Enermodal Engineering Ltd./Marbek Resource Consultants Ltd. May 1999
Levelised Energy Cost (LEC) Calculations - Base case
Economic analysis: 2 376 MW None Combined CycleNet capacity 376 MW Solar field n/a m2
Solar capacity 0 MW Fuel type GasSummary of base case parametersProject cost w/o tax ('000 USD) * 116,974 Expected lifetime 25 yearsGrant for non-conventional fraction - Annual discount rate 10.0%Carbon credit ('000 USD) - Annual insurance rate 1.0%Fuel price (USD per GJ) 2.63 Fixed charge rate 12.02%Unit cost (USD/kW) 311 CO2 credits - USD/tonneEfficienciesHeat collection efficiency 0.0% Annual solar efficiency 0.0%Power cycle efficiency 0.0% Plant capacity 50.0%Parasitic efficiency 0.0% Solar capacity 0.0%Solar-to-electric net efficiency 0.0% Plant efficiency (Back-up Mode) 53.5%Levelised Electricity Cost calculationsNet electricity by solar - MWhe/yrNet electricity by fuel 1,646,880 MWhe/yrNet electricity to grid 1,646,880 MWhe/yrSolar share 0.0%Full load hours - total 4,380 h/yrFull load hours - solar - h/yrAnnual fuel use 11,081,809 GJ/yrAnnual fuel cost 29,182.10 '000 USDAnnual O&M cost 5,599 '000 USDLevelised Electricity Cost (entire plant) 29.65 USD/MWh
LEC (solar only component) - USD/MWhAvoided emissions calculationsElectricity production by fuel over lifetime 41,172,000 MWheElectricity production - total over lifetime 41,172,000 MWheEmissions over lifetime (STPP) 13,763,607 t CO2
Emissions over lifetime (Base case) Combined cycle 13,763,607 t CO2
Avoided emissions (over lifetime) - t CO2
Avoided emissions (annual) - t CO2 per yearAvoidance cost (w/o grant) against base case #DIV/0! USD/t CO2
* - cost includes discount in developing countries
Cost Reduction Study for Solar Thermal Power Plants
May 1999 Enermodal Engineering Ltd./Marbek Resource Consultants Ltd. Page 91
Levelised Energy Cost (LEC) Calculations - Base case
Economic analysis: 3 30 MW Trough RankineNet capacity 30 MW Solar field n/a m2
Solar capacity 30 MW Fuel type CoalSummary of base case parametersProject cost w/o tax ('000 USD) * 89,123 Expected lifetime 25 yearsGrant for non-conventional fraction - Annual discount rate 10.0%Carbon credit ('000 USD) - Annual insurance rate 1.0%Fuel price (USD per GJ) 1.14 Fixed charge rate 12.02%Unit cost (USD/kW) 2,971 CO2 credits - USD/tonneEfficienciesHeat collection efficiency 44.2% Annual solar efficiency 12.5%Power cycle efficiency 37.5% Plant capacity 50.0%Parasitic efficiency 83.6% Solar capacity 25.0%Solar-to-electric net efficiency 13.9% Plant efficiency (Back-up Mode) 31.1%Levelised Electricity Cost calculationsNet electricity by solar 65,700 MWhe/yrNet electricity by fuel 65,700 MWhe/yrNet electricity to grid 131,400 MWhe/yrSolar share 50.0%Full load hours - total 4,380 h/yrFull load hours - solar 2,190 h/yrAnnual fuel use 760,514 GJ/yrAnnual fuel cost 866.99 '000 USDAnnual O&M cost 2,569 '000 USDLevelised Electricity Cost (entire plant) 107.65 USD/MWh
LEC (solar only component) 172.35 USD/MWhAvoided emissions calculationsElectricity production by fuel over lifetime 1,642,500 MWheElectricity production - total over lifetime 3,285,000 MWheEmissions over lifetime (STPP) 1,633,205 t CO2
Emissions over lifetime (Base case) Coal Rankine 2,953,062 t CO2
Avoided emissions (over lifetime) 1,319,857 t CO2
Avoided emissions (annual) 52,794 t CO2 per yearAvoidance cost (w/o grant) against base case 67.52 USD/t CO2
* - cost includes discount in developing countries
Cost Reduction Study for Solar Thermal Power Plants
Page 92 Enermodal Engineering Ltd./Marbek Resource Consultants Ltd. May 1999
Levelised Energy Cost (LEC) Calculations - Base case
Economic analysis: 4 200 MW Trough RankineNet capacity 200 MW Solar field n/a m2
Solar capacity 200 MW Fuel type CoalSummary of base case parametersProject cost w/o tax ('000 USD) * 405,280 Expected lifetime 25 yearsGrant for non-conventional fraction - Annual discount rate 10.0%Carbon credit ('000 USD) - Annual insurance rate 1.0%Fuel price (USD per GJ) 1.14 Fixed charge rate 12.02%Unit cost (USD/kW) 2,026 CO2 credits - USD/tonneEfficienciesHeat collection efficiency 44.2% Annual solar efficiency 13.0%Power cycle efficiency 38.0% Plant capacity 50.0%Parasitic efficiency 85.5% Solar capacity 25.1%Solar-to-electric net efficiency 14.4% Plant efficiency (Back-up Mode) 34.1%Levelised Electricity Cost calculationsNet electricity by solar 439,752 MWhe/yrNet electricity by fuel 436,248 MWhe/yrNet electricity to grid 876,000 MWhe/yrSolar share 50.2%Full load hours - total 4,380 h/yrFull load hours - solar 2,199 h/yrAnnual fuel use 4,605,551 GJ/yrAnnual fuel cost 5,250.33 '000 USDAnnual O&M cost 8,191 '000 USDLevelised Electricity Cost (entire plant) 70.94 USD/MWh
LEC (solar only component) 98.70 USD/MWhAvoided emissions calculationsElectricity production by fuel over lifetime 10,906,200 MWheElectricity production - total over lifetime 21,900,000 MWheEmissions over lifetime (STPP) 9,890,420 t CO2
Emissions over lifetime (Base case) Coal Rankine 19,687,081 t CO2
Avoided emissions (over lifetime) 9,796,661 t CO2
Avoided emissions (annual) 391,866 t CO2 per yearAvoidance cost (w/o grant) against base case 41.37 USD/t CO2
* - cost includes discount in developing countries
Cost Reduction Study for Solar Thermal Power Plants
May 1999 Enermodal Engineering Ltd./Marbek Resource Consultants Ltd. Page 93
Levelised Energy Cost (LEC) Calculations - Base case
Economic analysis: 5 30 MW Trough ISCCSNet capacity 30 MW Solar field n/a m2
Solar capacity 30 MW Fuel type GasSummary of base case parametersProject cost w/o tax ('000 USD) * 78,872 Expected lifetime 25 yearsGrant for non-conventional fraction - Annual discount rate 10.0%Carbon credit ('000 USD) - Annual insurance rate 1.0%Fuel price (USD per GJ) 2.63 Fixed charge rate 12.02%Unit cost (USD/kW) 2,629 CO2 credits - USD/tonneEfficienciesHeat collection efficiency 44.2% Annual solar efficiency 13.7%Power cycle efficiency 38.0% Plant capacity 26.0%Parasitic efficiency 90.2% Solar capacity 26.0%Solar-to-electric net efficiency 15.1% Plant efficiency (Back-up Mode) 53.5%Levelised Electricity Cost calculationsNet electricity by solar 68,328 MWhe/yrNet electricity by fuel - MWhe/yrNet electricity to grid 68,328 MWhe/yrSolar share 100.0%Full load hours - total 2,278 h/yrFull load hours - solar 2,278 h/yrAnnual fuel use - GJ/yrAnnual fuel cost - '000 USDAnnual O&M cost 668 '000 USDLevelised Electricity Cost (entire plant) 148.49 USD/MWh
LEC (solar only component) 148.49 USD/MWhAvoided emissions calculationsElectricity production by fuel over lifetime - MWheElectricity production - total over lifetime 1,708,200 MWheEmissions over lifetime (STPP) - t CO2
Emissions over lifetime (Base case) Combined Cycle 571,043 t CO2
Avoided emissions (over lifetime) 571,043 t CO2
Avoided emissions (annual) 22,842 t CO2 per yearAvoidance cost (w/o grant) against base case 138.12 USD/t CO2
* - cost includes discount in developing countries
Cost Reduction Study for Solar Thermal Power Plants
Page 94 Enermodal Engineering Ltd./Marbek Resource Consultants Ltd. May 1999
Levelised Energy Cost (LEC) Calculations - Base case
Economic analysis: 6 30 MW Tower RankineNet capacity 30 MW Solar field n/a m2
Solar capacity 30 MW Fuel type CoalSummary of base case parametersProject cost w/o tax ('000 USD) * 126,276 Expected lifetime 25 yearsGrant for non-conventional fraction - Annual discount rate 10.0%Carbon credit ('000 USD) - Annual insurance rate 1.0%Fuel price (USD per GJ) 1.14 Fixed charge rate 12.02%Unit cost (USD/kW) 4,209 CO2 credits - USD/tonneEfficienciesHeat collection efficiency 46.8% Annual solar efficiency 14.9%Power cycle efficiency 40.0% Plant capacity 50.0%Parasitic efficiency 84.0% Solar capacity 44.0%Solar-to-electric net efficiency 15.7% Plant efficiency (Back-up Mode) 31.1%Levelised Electricity Cost calculationsNet electricity by solar 115,632 MWhe/yrNet electricity by fuel 15,768 MWhe/yrNet electricity to grid 131,400 MWhe/yrSolar share 88.0%Full load hours - total 4,380 h/yrFull load hours - solar 3,854 h/yrAnnual fuel use 182,523 GJ/yrAnnual fuel cost 208.08 '000 USDAnnual O&M cost 2,904 '000 USDLevelised Electricity Cost (entire plant) 139.17 USD/MWh
LEC (solar only component) 152.28 USD/MWhAvoided emissions calculationsElectricity production by fuel over lifetime 394,200 MWheElectricity production - total over lifetime 3,285,000 MWheEmissions over lifetime (STPP) 391,969 t CO2
Emissions over lifetime (Base case) Coal Rankine 2,953,062 t CO2
Avoided emissions (over lifetime) 2,561,093 t CO2
Avoided emissions (annual) 102,444 t CO2 per yearAvoidance cost (w/o grant) against base case 49.31 USD/t CO2
* - cost includes discount in developing countries
Cost Reduction Study for Solar Thermal Power Plants
May 1999 Enermodal Engineering Ltd./Marbek Resource Consultants Ltd. Page 95
Levelised Energy Cost (LEC) Calculations - Base case
Economic analysis: 7 30 MW Tower ISCCSNet capacity 30 MW Solar field n/a m2
Solar capacity 30 MW Fuel type GasSummary of base case parametersProject cost w/o tax ('000 USD) * 110,645 Expected lifetime 25 yearsGrant for non-conventional fraction - Annual discount rate 10.0%Carbon credit ('000 USD) - Annual insurance rate 1.0%Fuel price (USD per GJ) 2.63 Fixed charge rate 12.02%Unit cost (USD/kW) 3,688 CO2 credits - USD/tonneEfficienciesHeat collection efficiency 46.8% Annual solar efficiency 15.7%Power cycle efficiency 40.0% Plant capacity 47.0%Parasitic efficiency 88.5% Solar capacity 47.0%Solar-to-electric net efficiency 16.6% Plant efficiency (Back-up Mode) 53.5%Levelised Electricity Cost calculationsNet electricity by solar 123,516 MWhe/yrNet electricity by fuel - MWhe/yrNet electricity to grid 123,516 MWhe/yrSolar share 100.0%Full load hours - total 4,117 h/yrFull load hours - solar 4,117 h/yrAnnual fuel use - GJ/yrAnnual fuel cost - '000 USDAnnual O&M cost 1,680 '000 USDLevelised Electricity Cost (entire plant) 121.25 USD/MWh
LEC (solar only component) 121.25 USD/MWhAvoided emissions calculationsElectricity production by fuel over lifetime - MWheElectricity production - total over lifetime 3,087,900 MWheEmissions over lifetime (STPP) - t CO2
Emissions over lifetime (Base case) Combined Cycle 1,032,271 t CO2
Avoided emissions (over lifetime) 1,032,271 t CO2
Avoided emissions (annual) 41,291 t CO2 per yearAvoidance cost (w/o grant) against base case 107.19 USD/t CO2
* - cost includes discount in developing countries
Cost Reduction Study for Solar Thermal Power Plants
Page 96 Enermodal Engineering Ltd./Marbek Resource Consultants Ltd. May 1999
Levelised Energy Cost (LEC) Calculations - Base case
Economic analysis: 8 100 MW Trough ISCCSNet capacity 100 MW Solar field n/a m2
Solar capacity 100 MW Fuel type GasSummary of base case parametersProject cost w/o tax ('000 USD) * 179,265 Expected lifetime 25 yearsGrant for non-conventional fraction - Annual discount rate 10.0%Carbon credit ('000 USD) - Annual insurance rate 1.0%Fuel price (USD per GJ) 2.63 Fixed charge rate 12.02%Unit cost (USD/kW) 1,793 CO2 credits - USD/tonneEfficienciesHeat collection efficiency 46.0% Annual solar efficiency 14.6%Power cycle efficiency 39.0% Plant capacity 26.2%Parasitic efficiency 90.2% Solar capacity 26.2%Solar-to-electric net efficiency 16.2% Plant efficiency (Back-up Mode) 53.5%Levelised Electricity Cost calculationsNet electricity by solar 229,512 MWhe/yrNet electricity by fuel - MWhe/yrNet electricity to grid 229,512 MWhe/yrSolar share 100.0%Full load hours - total 2,295 h/yrFull load hours - solar 2,295 h/yrAnnual fuel use - GJ/yrAnnual fuel cost - '000 USDAnnual O&M cost 1,151 '000 USDLevelised Electricity Cost (entire plant) 98.87 USD/MWh
LEC (solar only component) 98.87 USD/MWhAvoided emissions calculationsElectricity production by fuel over lifetime - MWheElectricity production - total over lifetime 5,737,800 MWheEmissions over lifetime (STPP) - t CO2
Emissions over lifetime (Base case) Combined Cycle 1,918,120 t CO2
Avoided emissions (over lifetime) 1,918,120 t CO2
Avoided emissions (annual) 76,725 t CO2 per yearAvoidance cost (w/o grant) against base case 93.46 USD/t CO2
* - cost includes discount in developing countries
Cost Reduction Study for Solar Thermal Power Plants
May 1999 Enermodal Engineering Ltd./Marbek Resource Consultants Ltd. Page 97
Levelised Energy Cost (LEC) Calculations - Base case
Economic analysis: 9 200 MW Trough RankineNet capacity 200 MW Solar field n/a m2
Solar capacity 200 MW Fuel type CoalSummary of base case parametersProject cost w/o tax ('000 USD) * 349,350 Expected lifetime 25 yearsGrant for non-conventional fraction - Annual discount rate 10.0%Carbon credit ('000 USD) - Annual insurance rate 1.0%Fuel price (USD per GJ) 1.14 Fixed charge rate 12.02%Unit cost (USD/kW) 1,747 CO2 credits - USD/tonneEfficienciesHeat collection efficiency 46.0% Annual solar efficiency 14.0%Power cycle efficiency 39.0% Plant capacity 50.0%Parasitic efficiency 83.6% Solar capacity 25.1%Solar-to-electric net efficiency 15.0% Plant efficiency (Back-up Mode) 34.1%Levelised Electricity Cost calculationsNet electricity by solar 439,752 MWhe/yrNet electricity by fuel 436,248 MWhe/yrNet electricity to grid 876,000 MWhe/yrSolar share 50.2%Full load hours - total 4,380 h/yrFull load hours - solar 2,199 h/yrAnnual fuel use 4,605,551 GJ/yrAnnual fuel cost 5,250.33 '000 USDAnnual O&M cost 6,999 '000 USDLevelised Electricity Cost (entire plant) 61.91 USD/MWh
LEC (solar only component) 80.71 USD/MWhAvoided emissions calculationsElectricity production by fuel over lifetime 10,906,200 MWheElectricity production - total over lifetime 21,900,000 MWheEmissions over lifetime (STPP) 9,890,420 t CO2
Emissions over lifetime (Base case) Coal Rankine 19,687,081 t CO2
Avoided emissions (over lifetime) 9,796,661 t CO2
Avoided emissions (annual) 391,866 t CO2 per yearAvoidance cost (w/o grant) against base case 35.66 USD/t CO2
* - cost includes discount in developing countries
Cost Reduction Study for Solar Thermal Power Plants
Page 98 Enermodal Engineering Ltd./Marbek Resource Consultants Ltd. May 1999
Levelised Energy Cost (LEC) Calculations - Base case
Economic analysis: 10 200 MW Trough RankineNet capacity 200 MW Solar field n/a m2
Solar capacity 200 MW Fuel type CoalSummary of base case parametersProject cost w/o tax ('000 USD) * 310,250 Expected lifetime 25 yearsGrant for non-conventional fraction - Annual discount rate 10.0%Carbon credit ('000 USD) - Annual insurance rate 1.0%Fuel price (USD per GJ) 1.14 Fixed charge rate 12.02%Unit cost (USD/kW) 1,551 CO2 credits - USD/tonneEfficienciesHeat collection efficiency 51.9% Annual solar efficiency 16.2%Power cycle efficiency 40.0% Plant capacity 50.0%Parasitic efficiency 86.7% Solar capacity 26.4%Solar-to-electric net efficiency 18.0% Plant efficiency (Back-up Mode) 34.1%Levelised Electricity Cost calculationsNet electricity by solar 462,528 MWhe/yrNet electricity by fuel 413,472 MWhe/yrNet electricity to grid 876,000 MWhe/yrSolar share 52.8%Full load hours - total 4,380 h/yrFull load hours - solar 2,313 h/yrAnnual fuel use 4,365,100 GJ/yrAnnual fuel cost 4,976.21 '000 USDAnnual O&M cost 5,585 '000 USDLevelised Electricity Cost (entire plant) 54.62 USD/MWh
LEC (solar only component) 65.04 USD/MWhAvoided emissions calculationsElectricity production by fuel over lifetime 10,336,800 MWheElectricity production - total over lifetime 21,900,000 MWheEmissions over lifetime (STPP) 9,374,053 t CO2
Emissions over lifetime (Base case) Coal Rankine 19,687,081 t CO2
Avoided emissions (over lifetime) 10,313,029 t CO2
Avoided emissions (annual) 412,521 t CO2 per yearAvoidance cost (w/o grant) against base case 30.08 USD/t CO2
* - cost includes discount in developing countries
Cost Reduction Study for Solar Thermal Power Plants
May 1999 Enermodal Engineering Ltd./Marbek Resource Consultants Ltd. Page 99
Levelised Energy Cost (LEC) Calculations - Base case
Economic analysis: 11 200 MW Trough RankineNet capacity 200 MW Solar field n/a m2
Solar capacity 200 MW Fuel type CoalSummary of base case parametersProject cost w/o tax ('000 USD) * 421,770 Expected lifetime 25 yearsGrant for non-conventional fraction - Annual discount rate 10.0%Carbon credit ('000 USD) - Annual insurance rate 1.0%Fuel price (USD per GJ) 1.14 Fixed charge rate 12.02%Unit cost (USD/kW) 2,109 CO2 credits - USD/tonneEfficienciesHeat collection efficiency 53.6% Annual solar efficiency 16.6%Power cycle efficiency 40.0% Plant capacity 50.0%Parasitic efficiency 90.2% Solar capacity 50.0%Solar-to-electric net efficiency 19.3% Plant efficiency (Back-up Mode) 34.1%Levelised Electricity Cost calculationsNet electricity by solar 876,000 MWhe/yrNet electricity by fuel - MWhe/yrNet electricity to grid 876,000 MWhe/yrSolar share 100.0%Full load hours - total 4,380 h/yrFull load hours - solar 4,380 h/yrAnnual fuel use - GJ/yrAnnual fuel cost - '000 USDAnnual O&M cost 3,574 '000 USDLevelised Electricity Cost (entire plant) 61.94 USD/MWh
LEC (solar only component) 61.94 USD/MWhAvoided emissions calculationsElectricity production by fuel over lifetime - MWheElectricity production - total over lifetime 21,900,000 MWheEmissions over lifetime (STPP) - t CO2
Emissions over lifetime (Base case) Coal Rankine 19,687,081 t CO2
Avoided emissions (over lifetime) 19,687,081 t CO2
Avoided emissions (annual) 787,483 t CO2 per yearAvoidance cost (w/o grant) against base case 21.42 USD/t CO2
* - cost includes discount in developing countries
Cost Reduction Study for Solar Thermal Power Plants
Page 100 Enermodal Engineering Ltd./Marbek Resource Consultants Ltd. May 1999
Levelised Energy Cost (LEC) Calculations - Base case
Economic analysis: 12 100 MW Tower ISCCSNet capacity 100 MW Solar field n/a m2
Solar capacity 100 MW Fuel type GasSummary of base case parametersProject cost w/o tax ('000 USD) * 212,925 Expected lifetime 25 yearsGrant for non-conventional fraction - Annual discount rate 10.0%Carbon credit ('000 USD) - Annual insurance rate 1.0%Fuel price (USD per GJ) 2.63 Fixed charge rate 12.02%Unit cost (USD/kW) 2,129 CO2 credits - USD/tonneEfficienciesHeat collection efficiency 49.3% Annual solar efficiency 18.5%Power cycle efficiency 43.0% Plant capacity 44.7%Parasitic efficiency 0.0% Solar capacity 44.7%Solar-to-electric net efficiency 0.0% Plant efficiency (Back-up Mode) 53.5%Levelised Electricity Cost calculationsNet electricity by solar 391,134 MWhe/yrNet electricity by fuel - MWhe/yrNet electricity to grid 391,134 MWhe/yrSolar share 100.0%Full load hours - total 3,911 h/yrFull load hours - solar 3,911 h/yrAnnual fuel use - GJ/yrAnnual fuel cost - '000 USDAnnual O&M cost 1,995 '000 USDLevelised Electricity Cost (entire plant) 70.52 USD/MWh
LEC (solar only component) 70.52 USD/MWhAvoided emissions calculationsElectricity production by fuel over lifetime - MWheElectricity production - total over lifetime 9,778,350 MWheEmissions over lifetime (STPP) - t CO2
Emissions over lifetime (Base case) Combined Cycle 3,268,857 t CO2
Avoided emissions (over lifetime) 3,268,857 t CO2
Avoided emissions (annual) 130,754 t CO2 per yearAvoidance cost (w/o grant) against base case 65.14 USD/t CO2
* - cost includes discount in developing countries
Cost Reduction Study for Solar Thermal Power Plants
May 1999 Enermodal Engineering Ltd./Marbek Resource Consultants Ltd. Page 101
Levelised Energy Cost (LEC) Calculations - Base case
Economic analysis: 13 100 MW Tower RankineNet capacity 100 MW Solar field n/a m2
Solar capacity 100 MW Fuel type CoalSummary of base case parametersProject cost w/o tax ('000 USD) * 244,120 Expected lifetime 25 yearsGrant for non-conventional fraction - Annual discount rate 10.0%Carbon credit ('000 USD) - Annual insurance rate 1.0%Fuel price (USD per GJ) 1.14 Fixed charge rate 12.02%Unit cost (USD/kW) 2,441 CO2 credits - USD/tonneEfficienciesHeat collection efficiency 0.0% Annual solar efficiency 17.6%Power cycle efficiency 0.0% Plant capacity 50.0%Parasitic efficiency 0.0% Solar capacity 42.2%Solar-to-electric net efficiency 0.0% Plant efficiency (Back-up Mode) 34.1%Levelised Electricity Cost calculationsNet electricity by solar 369,234 MWhe/yrNet electricity by fuel 68,766 MWhe/yrNet electricity to grid 438,000 MWhe/yrSolar share 84.3%Full load hours - total 4,380 h/yrFull load hours - solar 3,692 h/yrAnnual fuel use 725,975 GJ/yrAnnual fuel cost 827.61 '000 USDAnnual O&M cost 4,468 '000 USDLevelised Electricity Cost (entire plant) 79.07 USD/MWh
LEC (solar only component) 85.79 USD/MWhAvoided emissions calculationsElectricity production by fuel over lifetime 1,719,150 MWheElectricity production - total over lifetime 10,950,000 MWheEmissions over lifetime (STPP) 1,559,032 t CO2
Emissions over lifetime (Base case) Coal Rankine 9,843,541 t CO2
Avoided emissions (over lifetime) 8,284,509 t CO2
Avoided emissions (annual) 331,380 t CO2 per yearAvoidance cost (w/o grant) against base case 29.47 USD/t CO2
* - cost includes discount in developing countries
Cost Reduction Study for Solar Thermal Power Plants
Page 102 Enermodal Engineering Ltd./Marbek Resource Consultants Ltd. May 1999
Levelised Energy Cost (LEC) Calculations - Base case
Economic analysis: 14 100 MW Tower RankineNet capacity 100 MW Solar field n/a m2
Solar capacity 100 MW Fuel type CoalSummary of base case parametersProject cost w/o tax ('000 USD) * 212,925 Expected lifetime 25 yearsGrant for non-conventional fraction - Annual discount rate 10.0%Carbon credit ('000 USD) - Annual insurance rate 1.0%Fuel price (USD per GJ) 1.14 Fixed charge rate 12.02%Unit cost (USD/kW) 2,129 CO2 credits - USD/tonneEfficienciesHeat collection efficiency 0.0% Annual solar efficiency 18.5%Power cycle efficiency 0.0% Plant capacity 50.0%Parasitic efficiency 0.0% Solar capacity 44.7%Solar-to-electric net efficiency 0.0% Plant efficiency (Back-up Mode) 34.1%Levelised Electricity Cost calculationsNet electricity by solar 391,134 MWhe/yrNet electricity by fuel 46,866 MWhe/yrNet electricity to grid 438,000 MWhe/yrSolar share 89.3%Full load hours - total 4,380 h/yrFull load hours - solar 3,911 h/yrAnnual fuel use 494,773 GJ/yrAnnual fuel cost 564.04 '000 USDAnnual O&M cost 2,234 '000 USDLevelised Electricity Cost (entire plant) 64.81 USD/MWh
LEC (solar only component) 67.42 USD/MWhAvoided emissions calculationsElectricity production by fuel over lifetime 1,171,650 MWheElectricity production - total over lifetime 10,950,000 MWheEmissions over lifetime (STPP) 1,062,525 t CO2
Emissions over lifetime (Base case) Coal Rankine 9,843,541 t CO2
Avoided emissions (over lifetime) 8,781,016 t CO2
Avoided emissions (annual) 351,241 t CO2 per yearAvoidance cost (w/o grant) against base case 24.25 USD/t CO2
* - cost includes discount in developing countries
Cost Reduction Study for Solar Thermal Power Plants
May 1999 Enermodal Engineering Ltd./Marbek Resource Consultants Ltd. Page 103
Levelised Energy Cost (LEC) Calculations - Base case
Economic analysis: 15 200 MW Tower RankineNet capacity 200 MW Solar field n/a m2
Solar capacity 200 MW Fuel type CoalSummary of base case parametersProject cost w/o tax ('000 USD) * 312,120 Expected lifetime 25 yearsGrant for non-conventional fraction - Annual discount rate 10.0%Carbon credit ('000 USD) - Annual insurance rate 1.0%Fuel price (USD per GJ) 1.14 Fixed charge rate 12.02%Unit cost (USD/kW) 1,561 CO2 credits - USD/tonneEfficienciesHeat collection efficiency 0.0% Annual solar efficiency 20.3%Power cycle efficiency 0.0% Plant capacity 50.0%Parasitic efficiency 0.0% Solar capacity 44.7%Solar-to-electric net efficiency 0.0% Plant efficiency (Back-up Mode) 34.1%Levelised Electricity Cost calculationsNet electricity by solar 782,268 MWhe/yrNet electricity by fuel 93,732 MWhe/yrNet electricity to grid 876,000 MWhe/yrSolar share 89.3%Full load hours - total 4,380 h/yrFull load hours - solar 3,911 h/yrAnnual fuel use 989,546 GJ/yrAnnual fuel cost 1,128.08 '000 USDAnnual O&M cost 4,468 '000 USDLevelised Electricity Cost (entire plant) 49.20 USD/MWh
LEC (solar only component) 49.95 USD/MWhAvoided emissions calculationsElectricity production by fuel over lifetime 2,343,300 MWheElectricity production - total over lifetime 21,900,000 MWheEmissions over lifetime (STPP) 2,125,050 t CO2
Emissions over lifetime (Base case) Coal Rankine 19,687,081 t CO2
Avoided emissions (over lifetime) 17,562,031 t CO2
Avoided emissions (annual) 702,481 t CO2 per yearAvoidance cost (w/o grant) against base case 17.77 USD/t CO2
* - cost includes discount in developing countries