1 Corporate Presentation | March 2017 Corporate Presentation | November 2017 1 Solid Foundation. Building New Platforms. www.parexresources.com | TSX:PXT | Corporate Presentation | November 2017
Transcript
1Corporate Presentation | March 2017Corporate Presentation | November 2017 1
Solid Foundation.
Building New Platforms.
www.parexresources.com | TSX:PXT | Corporate Presentation | November 2017
2Corporate Presentation | March 2017Corporate Presentation | November 2017 2
Operating results 2016 2017E
Production (boe/d) Q4 Average 31,049 38,500
Capital Expenditures(1) (million) US $112 US $225
Exploration Drilling (# prospects) 7 15
Appraisal Drilling (# wells) 4 13-15
Development Drilling (# wells) 6 12
Total (# wells) 17 40-42
Reserves (2016 year end)
2P Reserves (Dec. 31)(2) 112 Mmboe
2P Reserve Life Index (RLI) 10 years
Capital structure
Net Working Capital(3) US $140 MM
US $100 MM Credit Facility(3) Undrawn – No Debt
Market Capitalization(3)(4) ~ CAD $2.6 Billion
Common Shares Basic Outstanding (TSX listed)(3) 154.6MM
CORPORATE SNAPSHOT
(1) Assuming US $50/bbl Brent oil price in 2017(2) Parex’ working interest, as per the independent reserve report
prepared by GLJ Petroleum Consultants effective Dec. 31, 2016(3) As at September 30, 2017(4) Assuming CAD $17 share priceSee “Advisories” at the end of this presentation
3Corporate Presentation | March 2017Corporate Presentation | November 2017 3
REASONS TO OWN PAREX
1. No debt and positive WC of US$140MM (3Q17)
2. High margins: 3Q17 Operating Netback US$28/boe @ Brent $52/bbl
3. Ability to grow within cash flow:
o 2016 Growth: production 8.4% y-y & RLI increases to 10 years from 8 years
o 2017 Growth guidance of ~20% self-funded
4. Exploration Upside:
o Drilled YTD 14 exploration wells with 12 oil discoveries
o Scheduled to drill 1 additional exploration prospects in 2017▪ Llanos
▪ Middle Magdalena & Lower Magdalena
5. Focused management: ability to growth within single country Colombia
4Corporate Presentation | March 2017Corporate Presentation | November 2017 4
6Corporate Presentation | March 2017Corporate Presentation | November 2017 6
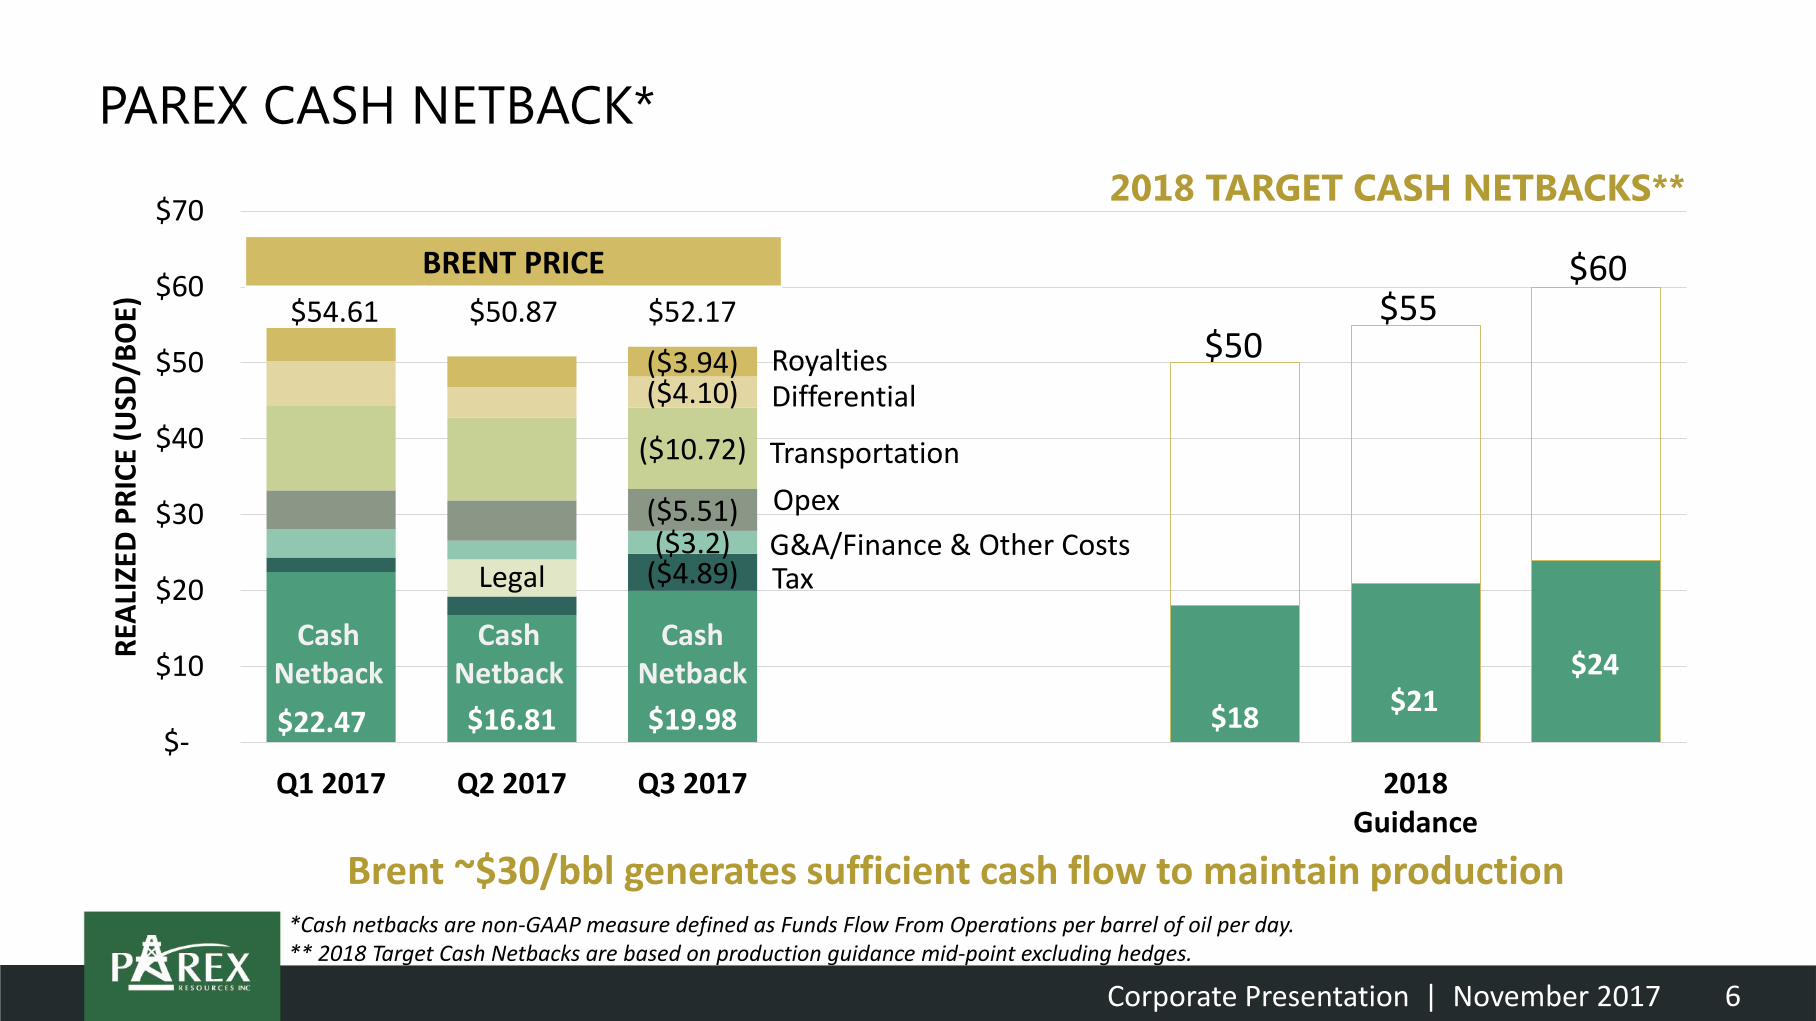
PAREX CASH NETBACK*
$22.47 $16.81 $19.98 $18$21
$24
($4.89)($3.2)
($5.51)
($10.72)
($4.10)($3.94)
$-
$10
$20
$30
$40
$50
$60
$70
Q1 2017 Q2 2017 Q3 2017 2018Guidance
REA
LIZE
D P
RIC
E (U
SD/B
OE)
Axis Title
Legal
2018 TARGET CASH NETBACKS**
Brent ~$30/bbl generates sufficient cash flow to maintain production*Cash netbacks are non-GAAP measure defined as Funds Flow From Operations per barrel of oil per day. ** 2018 Target Cash Netbacks are based on production guidance mid-point excluding hedges.
Cash Netback
Cash Netback
Cash Netback
Royalties Differential
Transportation
Opex
TaxG&A/Finance & Other Costs
BRENT PRICE
$54.61 $50.87 $52.17$50
$55$60
7Corporate Presentation | March 2017Corporate Presentation | November 2017 7
$0
$3
$6
$9
$12
$15
$18
$21Q
1'1
5
Q2
'15
Q3
'15
Q4
'15
Q1
'16
Q2
'16
Q3
'16
Q4
'16
Q1
'17
Q2
'17
Q3
'17
$/B
OE
Transportation Brent Differential (Vasconia)
BARRANQUILLA
CARTAGENA
BARRANCABERMEJA
VASCONIA
MONTERREY
TERMINAL COVENAS
HIDROCASANARE
CUSIANA
MARKETING COSTS TRENDING DOWNWARD
Brent $45/bbl
Brent $56/bbl
Brent ≥$50/bbl
Trucking
Parex Blocks
Pipeline
River
8Corporate Presentation | March 2017Corporate Presentation | November 2017 8
In a $50/bbl environment, our portfolio supports reaching 50,000 bopd during 2019
CONSISTENT & SUSTAINABLE GROWTH: PATH TO 50,000* BOPD
-
5,000
10,000
15,000
20,000
25,000
30,000
35,000
40,000
45,000
-
0.05
0.10
0.15
0.20
0.25
0.30
0.35
0.40
0.45Se
p-1
2
Dec
-12
Mar
-13
Jun
-13
Sep
-13
Dec
-13
Mar
-14
Jun
-14
Sep
-14
Dec
-14
Mar
-15
Jun
-15
Sep
-15
Dec
-15
Mar
-16
Jun
-16
Sep
-16
Dec
-16
Mar
-17
Jun
-17
Sep
-17
Dec
-17
Mar
-18
PR
OD
UC
TIO
N (
BO
E/D
)
BO
E P
ER T
HO
USA
ND
SH
AR
ES
Production Debt Adjusted Production Per Share
RLI 3 yr
RLI 5 yr
RLI 7 yrRLI 8 yr
RLI 10 yr
*Refer to February 6, 2017 Press Release “ Parex announces executive and board of directors appointments”
9Corporate Presentation | March 2017Corporate Presentation | November 2017 9
*Per the independent reserve reports prepared by GLJ Petroleum Consultants Ltd. effective December 31 of the reported year.
TRACK RECORD OF PROGRESSING RESERVES* FROM 3P TO CASH FLOW
SOLID FOUNDATION SUPPORTS GROWTH
169 mmboe ~46,500 boe/d & 10 yr RLI
10Corporate Presentation | March 2017Corporate Presentation | November 2017 10
CONVENTIONAL OIL RESERVES: INDUSTRY LEADING RESULTS
Total Company(1) 2016
PDP 1P 2P
FD&A $/boe $6.47 $6.99 $3.40
Recycle Ratio (FD&A) 2.9x 2.7x 5.5x
(1) Per the independent reserve reports prepared by GLJ Petroleum Consultants Ltd. effective December 31 of thereported year, including Future Development Cost. Recycle Ratio is calculated using Q4 2016 Funds Flow FromOperations per barrel divided by annual F&D or FD&A as applicable, except for 3 Year which uses 3 year averageFunds Flow From Operations.
(2) Finding, development and acquisition costs per barrel of oil equivalent are calculated by dividing capitalexpenditures, acquisition costs and disposition proceeds by reserve additions for the reported period.
22 VMM-11 Operated 100% N/A 116,826 Middle Magdalena1) Exploration properties deemed non-commercial will be relinquished in due course. Accordingly, the gross acres described above may decrease as non-commercial lands are relinquished.2) Working interests are subject to regulatory approval.3) Morpho is subject to a 4% Net Profit Interest.
20Corporate Presentation | March 2017Corporate Presentation | November 2017 20
APPENDIX – SUMMARY OF QUARTERLY RESULTS
• Values have been rounded up or down to the nearest dollar figure. • Net Debt is defined as Bank Debt - Working Capital
(Unaudited Results) 2017 2016 2015
Q3 Q2 Q1 FY Q4 Q3 Q2 Q1 FY Q4 Q3 Q2 Q1
OPERATING
Production (thousands of boe/d) 36.2 34.3 32.6 29.7 31.1 29.8 29.1 28.9 27.4 28.6 27.4 27.0 26.7
21Corporate Presentation | March 2017Corporate Presentation | November 2017 21
COLOMBIA – CURRENT LAND BASE
Source: Divestco, February 2017
22Corporate Presentation | March 2017Corporate Presentation | November 2017 22
ADVISORIES HOW TO REACH USThis presentation is provided for informational purposes only as of November 10, 2017, is not complete,and may not contain certain material information about Parex Resources Inc. ("Parex" or the"Company"), including important disclosures and risk factors associated with an investment in Parex.This presentation does not take into account the particular investment objectives or financialcircumstances of any specific person who may receive it and does not constitute an offer to sell or asolicitation of an offer to buy any security in Canada, the United States or any other jurisdiction. Thecontents of this presentation have not been approved or disapproved by any securities commission orregulatory authority in Canada, the United Sates or any other jurisdiction, and Parex expressly disclaimsany duty on Parex to make disclosure or any filings with any securities commission or regulatoryauthority, beyond that imposed by applicable laws.
Forward-Looking Statements and FOFI
Certain information regarding Parex set forth in this document contains forward-looking statements thatinvolve substantial known and unknown risks and uncertainties. The use of any of the words "plan","expect", “prospective”, "project", "intend", "believe", "should", "anticipate", "estimate" or other similarwords, or statements that certain events or conditions "may" or "will" occur are intended to identifyforward-looking statements. Such statements represent Parex' internal projections, estimates or beliefsconcerning, among other things, future growth, results of operations, production, future capital andother expenditures (including the amount, nature and sources of funding thereof), plans for and resultsof drilling activity, business prospects and opportunities. These statements are only predictions andactual events or results may differ materially. Although the Company’s management believes that theexpectations reflected in the forward-looking statements are reasonable, it cannot guarantee futureresults, levels of activity, performance or achievement since such expectations are inherently subject tosignificant business, economic, competitive, political and social uncertainties and contingencies. Manyfactors could cause Parex' actual results to differ materially from those expressed or implied in anyforward-looking statements made by, or on behalf of, Parex.
In particular, forward-looking statements contained in this document include, but are not limited to,statements with respect to the performance characteristics of the Company's oil properties; theCompany's vision, strategy and values; Parex' estimated 2017 capital budget, including the expectedallocation of such budget to the number of wells and capital expenditures for each ofdevelopment/appraisal in existing fields, exploration, appraisal and maintenance;
Vice President, Capital Markets & Corporate Planning
23Corporate Presentation | March 2017Corporate Presentation | November 2017 23
ADVISORIESthe Company's forecasted 2017 average production range; the Company's estimated average daily production for Q4 2017, full year 2017, full year 2018 & full year 2019; the Company's planned capitalprogram, including anticipated amounts focused on existing discoveries and the appraisal programs and the timing of drilling key exploration prospects, seismic programs and development drilling; anticipatedcash flow, cash flow per share, funds flow from operations netback, capital expenditures, and funds flow from operations for 2017 and 2018; the Company's exploration, development and appraisal programfor 2017 and 2018 including anticipated number and type of wells, drill ready prospects, the focus of development/appraisal drilling and the potential for drilling of additional follow-up appraisal wells andfacilities in 2017 and 2018; exploration prospects; the Company's exploration schedule; the Company's drilling plans and production capability/potential; anticipated drilling locations, including the Company'sdelineation and drilling plans; the Company's plans to target additional growth opportunities; the Company's future plans for its business, including plans to complete further acquisitions and increaseproduction; financial and business prospects and financial outlook; and activities to be undertaken in various areas. Statements relating to "reserves" or "resources" are forward-looking statements, as theyinvolve the implied assessment, based on estimates and assumptions that the reserves and resources described exist in the quantities predicted or estimated and can be profitably produced in the future.
• These forward-looking statements are subject to numerous risks and uncertainties, including but not limited to, the impact of general economic conditions in Canada and Colombia; industry conditionsincluding changes in laws and regulations including adoption of new environmental laws and regulations, and changes in how they are interpreted and enforced, in Canada and Colombia; competition; lack ofavailability of qualified personnel; the results of exploration and development drilling and related activities; risks related to obtaining required approvals of regulatory authorities, in Canada and Colombia andpartner and community approvals in Colombia; risks associated with negotiating with foreign governments as well as country risk associated with conducting international activities; volatility in market pricesfor oil; fluctuations in foreign exchange or interest rates; environmental risks; changes in income tax laws, tax rates and/or incentive programs relating to the oil industry; changes to pipeline capacity; ability toaccess sufficient capital from internal and external sources; risks related to the lawsuit brought in Texas against Parex and certain foreign subsidiaries; failure of counterparties to perform under the terms oftheir contracts; and other factors, many of which are beyond the control of the Company. Readers are cautioned that the foregoing list of factors is not exhaustive. Additional information on these and otherfactors that could effect Parex' operations and financial results are included in reports on file with Canadian securities regulatory authorities and may be accessed through the SEDAR website (www.sedar.com).
• Although the forward-looking statements contained in this document are based upon assumptions which management believes to be reasonable, the Company cannot assure investors that actual results willbe consistent with these forward-looking statements. With respect to forward-looking statements contained in this document, Parex has made assumptions regarding, among other things: current commodityprices and royalty regimes; availability of skilled labour; timing and amount of capital expenditures; future exchange rates; the price of oil, including the anticipated Brent oil price; the impact of increasingcompetition; conditions in general economic and financial markets; availability of drilling and related equipment; effects of regulation by governmental agencies; receipt of partner, regulatory and communityapprovals; royalty rates; future operating costs; effects of regulation by governmental agencies; uninterrupted access to areas of Parex' operations and infrastructure; recoverability of reserves and futureproduction rates; the status of litigation; timing of drilling and completion of wells; on-stream timing of production from successful exploration wells; operational performance of non-operated producingfields; pipeline capacity; that Parex will have sufficient cash flow, debt or equity sources or other financial resources required to fund its capital and operating expenditures and requirements as needed; thatParex' conduct and results of operations will be consistent with its expectations; that Parex will have the ability to develop it's oil and gas properties in the manner currently contemplated; current or, whereapplicable, proposed industry conditions, laws and regulations will continue in effect or as anticipated as described herein; that the estimates of Parex' reserves volumes and the assumptions related thereto(including commodity prices and development costs) are accurate in all material respects; that Parex will be able to obtain contract extensions or fulfill the contractual obligations required to retain its rights toexplore, develop and exploit any of its undeveloped properties; and other matters.
• Management has included the above summary of assumptions and risks related to forward-looking information provided in this document in order to provide shareholders with a more complete perspectiveon Parex' current and future operations and such information may not be appropriate for other purposes. Parex' actual results, performance or achievement could differ materially from those expressed in, orimplied by, these forward-looking statements and, accordingly, no assurance can be given that any of the events anticipated by the forward-looking statements will transpire or occur, or if any of them do, whatbenefits Parex will derive. These forward-looking statements are made as of the date of this document and Parex disclaims any intent or obligation to update publicly any forward-looking statements, whetheras a result of new information, future events or results or otherwise, other than as required by applicable securities laws. The forward-looking statements contained in this presentation are expressly qualifiedby this cautionary statement.
24Corporate Presentation | March 2017Corporate Presentation | November 2017 24
ADVISORIES• This document also contains a financial outlook, in particular the information set forth on slides 3-4 & 6. Such financial outlook has been prepared by Parex' management to provide an outlook of the
Company's activities and results. The financial outlook has been prepared based on a number of assumptions including the assumptions discussed above and assumptions with respect to the costs andexpenditures to be incurred by the Company, capital equipment and operating costs, foreign exchange rates, taxation rates for the Company, general and administrative expenses and the prices to be paid forthe Company's production. Management does not have firm commitments for all of the costs, expenditures, prices or other financial assumptions used to prepare the financial outlook or assurance that suchoperating results will be achieved and, accordingly, the complete financial effects of all of those costs, expenditures, prices and operating results are not objectively determinable. The actual results ofoperations of the Company and the resulting financial results will likely vary from the amounts set forth in the analysis presented in this presentation, and such variation may be material. The Company and itsmanagement believe that the financial outlook has been prepared on a reasonable basis, reflecting the best estimates and judgments, and represent, to the best of management's knowledge and opinion,Parex's expected expenditures and results of operations. However, because this information is highly subjective and subject to numerous risks including the risks discussed above, it should not be relied on asnecessarily indicative of future results. Except as required by applicable securities laws, Parex undertakes no obligation to update such financial outlook.
Oil and Gas Information
• The estimates of Parex' December 31, 2016 reserves set forth in this presentation have been prepared by GLJ Petroleum Consultants Ltd. ("GLJ") as of December 31, 2016 with a preparation date of February6, 2017 (the "GLJ 2016 Report") in accordance with National Instrument 51-101 – Standards of Disclosure for Oil and Gas Activities ("NI 51-101") and the Canadian Oil and Gas Evaluations Handbook (the"COGEH") and using GLJ's forecast prices and costs as at January 1, 2017. The estimates of Parex' December 31, 2015 reserves set forth in this presentation have been prepared by GLJ as of December 31, 2015with a preparation date of February 5, 2016 in accordance with NI 51-101 and the COGEH and using GLJ's forecast prices and costs as at January 1, 2016. The estimates of Parex' December 31, 2014 reservesset forth in this presentation have been prepared by GLJ as of December 31, 2014 with a preparation date of February 13, 2015 in accordance with NI 51-101 and the COGEH and using GLJ's forecast prices andcosts as at January 1, 2015. The estimates of Parex' December 31, 2013 reserves set forth in this presentation have been prepared by GLJ as of December 31, 2013 with a preparation date of February 20, 2014in accordance with NI 51-101 and the COGEH and using GLJ's forecast prices and costs as at January 1, 2014. The estimates of Parex' December 31, 2012 reserves set forth in this presentation have beenprepared by GLJ as of December 31, 2012 with a preparation date of February 28, 2013 in accordance with NI 51-101 and the COGEH and using GLJ's forecast prices and costs as at January 1, 2013. Theestimates of Parex' December 31, 2011 reserves set forth in this presentation have been prepared by GLJ as of December 31, 2011 with a preparation date February 10, 2012 in accordance with NI 51-101 andthe COGEH and using GLJ's forecast prices and costs as at January 1, 2012 . The estimates of Parex' December 31, 2010 reserves set forth in this presentation have been prepared by GLJ as of December 31,2010 with a preparation date of January 11, 2011 in accordance with NI 51-101 and the COGEH and using GLJ's forecast prices and costs as at January 1, 2011.
• Possible reserves are those additional reserves that are less certain to be recovered than probable reserves. There is a 10 percent probability that the quantities actually recovered will equal or exceed the sumof proved plus probable plus possible reserves.
• Estimates of the net present value of the future net revenue from Parex' reserves do not represent the fair market value of Parex' reserves. The estimates of reserves and future net revenue from individualproperties or wells may not reflect the same confidence level as estimates of reserves and future net revenue for all properties and wells, due to the effects of aggregation.
• This presentation contains certain oil and gas metrics, including F&D, FD&A, FD&A/boe, reserves life index (or RLI), operating netbacks, cash netbacks, funds flow from operations netback, and recycle ratios,which do not have standardized meanings or standard methods of calculation and therefore such measures may not be comparable to similar measures used by other companies and should not be used tomake comparisons. Such metrics have been included herein to provide readers with additional measures to evaluate the Company's performance; however, such measures are not reliable indicators of thefuture performance of the Company and future performance may not compare to the performance in previous periods and therefore such metrics should not be unduly relied upon. Management uses theseoil and gas metrics for its own performance measurements and to provide investors with measures to compare the Company's operations over time.
25Corporate Presentation | March 2017Corporate Presentation | November 2017 25
ADVISORIESReaders are cautioned that the information provided by these metrics, or that can be derived from the metrics presented herein, should not be relied upon for investment or other purposes. A summary of thecalculations of such metrics are as follows:
o FD&A costs represent the costs of property acquisition, exploration, and development incurred. The aggregate of the exploration and development costs incurred in the most recent financial year andthe change during that year in estimated future development costs generally will not reflect total finding and development costs related to reserves additions for that year.
o FD&A costs are calculated as capital expenditures plus change in F&D costs. FD&A per boe is calculated as FD&A costs divided by reserves additions for the applicable period.
o Reserves life index is calculated as proved plus probable reserves divided by annualized fourth quarter production.
o Recycle ratio is calculated as cash netback per boe (or Funds Flow From Operations per boe) divided by F&D or FD&A, as applicable.
o Cash netback per boe (or Funds Flow From Operations netback per boe) is calculated as Funds Flow From Operations divided by production for the period.
o Operating netback is calculated as oil & gas revenue less expenses (royalties, production and transportation) divided by production for the period.
• "BOEs" may be misleading, particularly if used in isolation. A BOE conversion ratio of six thousand cubic feet of natural gas to one barrel of oil equivalent (6 mcf: 1 bbl) is based on an energy equivalencyconversion method primarily applicable at the burner tip and does not represent a value equivalency at the wellhead. Given that the value ratio based on the current price of crude oil as compared to naturalgas is significantly different from the energy equivalency of 6:1, utilizing a conversion on a 6:1 basis may be misleading as an indication of value.
• All of Parex’ crude oil reserves disclosed herein are located in Colombia. The Company does have light, medium and heavy crude oil and natural gas liquids. The recovery and reserve estimates of crude oilreserves provided in this document are estimates only, and there is no guarantee that the estimated reserves will be recovered. Actual crude oil reserves may eventually prove to be greater than, or less than,the estimates provided herein. All evaluations and reviews of future net revenue contained in GLJ's reports are stated prior to any provision for interest costs or general and administrative costs and after thededuction of royalties, development costs, production costs, well abandonment costs and estimated future capital expenditures for wells to which reserves have been assigned.
• This presentation discloses drilling locations in three categories: (i) proved locations; (ii) probable locations; and (iii) possible locations. Proved locations, probable locations and possible locations are derivedfrom the GLJ 2016 Report and account for drilling locations that have associated proved and/or probable and/or possible reserves, as applicable. Of the 195 drilling locations identified herein, 74 are provedlocations, 83 are probable locations and 38 are possible locations. The drilling locations on which the Company actually drills wells will ultimately depend upon the availability of capital, regulatory approvals,seasonal restrictions, oil prices, costs, actual drilling results, additional reservoir information that is obtained and other factors.
• Further, this presentation includes estimates of pay thickness, which are considered to be anticipated results or information that indicate the potential value or quantities of resources under NI 51-101. Suchestimates have been prepared internally by Parex by a non-independent qualified reserves evaluator and have not been prepared or reviewed by an independent qualified reserves evaluator or auditor. Therisks associated with these estimates include, but are not limited to, the risk that Parex' exploration and development drilling and related activities may provide different results; the risk that Parex mayencounter unexpected drilling results; the occurrence of unexpected events involved in the exploration for, and the operation and development of, oil and gas; delays in anticipated timing of drilling andcompletion of wells; geological, technical, drilling and processing problems and other difficulties in producing petroleum reserves; and the risk that if any resources are discovered that it will not becommercially viable to produce any portion thereof. There is no certainty that Parex will achieve the estimated results or that any portion of the resources will be discovered. If discovered, there is also nocertainty that it will be commercially viable to produce any portion of the resources.
26Corporate Presentation | March 2017Corporate Presentation | November 2017 26
ADVISORIES
• Further, this presentation includes estimates of pay thickness, which are considered to be anticipated results or information that indicate the potential value or quantities of resources under NI 51-101. Suchestimates have been prepared internally by Parex by a non-independent qualified reserves evaluator and have not been prepared or reviewed by an independent qualified reserves evaluator or auditor. Therisks associated with these estimates include, but are not limited to, the risk that Parex' exploration and development drilling and related activities may provide different results; the risk that Parex mayencounter unexpected drilling results; the occurrence of unexpected events involved in the exploration for, and the operation and development of, oil and gas; delays in anticipated timing of drilling andcompletion of wells; geological, technical, drilling and processing problems and other difficulties in producing petroleum reserves; and the risk that if any resources are discovered that it will not becommercially viable to produce any portion thereof. There is no certainty that Parex will achieve the estimated results or that any portion of the resources will be discovered. If discovered, there is also nocertainty that it will be commercially viable to produce any portion of the resources.
• Certain information in this document may constitute "analogous information" as defined in NI 51-101. Such information includes production estimates, drilling results, test rates, reserves estimates and otherinformation retrieved from other publicly available sources, including but not limited to IHS. Management of Parex believes the information is relevant as it may help to define the reservoir characteristics andproduction profile of lands in which Parex may hold an interest. Parex is unable to confirm that the analogous information was prepared by a qualified reserves evaluator or auditor and is unable to confirmthat the analogous information was prepared in accordance with NI 51-101. Such information is not an estimate of the production, reserves or resources attributable to lands held or to be held by Parex andthere is no certainty that the production, reserves or resources data and economic information for the lands held or to be held by Parex will be similar to the information presented herein. The reader iscautioned that the data relied upon by Parex may be in error and/or may not be analogous to such lands held or to be held by Parex.
• Certain other information contained in this presentation has been prepared by third-party sources, which information has not been independently audited or verified by Parex. No representation or warranty,express or implied, is made by Parex as to the accuracy or completeness of the information contained in this document, and nothing contained in this presentation is, or shall be relied upon as, a promise orrepresentation by Parex.
• This presentation contains references to type well production and economics, which are derived, at least in part, from available information respecting the well economics of other companies and, as such,there is no guarantee that Parex will achieve the stated or similar results, capital costs and return costs representative per well.
• References in this presentation to initial production test rates, initial "flow" rates, initial flow testing, and "peak" rates are useful in confirming the presence of hydrocarbons, however such rates are notdeterminative of the rates at which such wells will commence production and decline thereafter and are not indicative of long term performance or of ultimate recovery. While encouraging, investors arecautioned not to place reliance on such rates in calculating the aggregate production for Parex. Parex has not conducted a pressure transient analysis or well-test interpretation on the wells referenced in thispresentation. As such, all data should be considered to be preliminary until such analysis or interpretation has been done.
Financial Matters
• The Company discloses several financial measures that do not have any standardized meaning prescribed under International Financial Reporting Standards ("IFRS"). These financial measures includeoperating netbacks, cash netbacks, funds flow netbacks and funds flow from operations. Management believes that these financial measures are useful supplemental information to analyze operatingperformance and provide an indication of the results generated by the Company’s principal business activities. Investors should be cautioned that these measures should not be construed as an alternative tonet income or other measures of financial performance as determined in accordance with IFRS. Parex’s method of calculating these measures may differ from other companies, and accordingly, they may notbe comparable to similar measures used by other companies. Please see the Company’s most recent Management’s Discussion and Analysis, which is available at www.sedar.com for additional informationabout these financial measures.
27Corporate Presentation | March 2017Corporate Presentation | November 2017 27