Department of Chemistry, Nuclear Research Center Negev, P.O. Box 9001, 84190 Beer Sheva, IsraelDepartment of Chemical Engineering, Ben-Gurion University of the Negev, 84105 Beer Sheva, Israel
a r t i c l e i n f o
rticle history:eceived 26 January 2013eceived in revised form 5 April 2013ccepted 6 April 2013vailable online 15 April 2013
eywords:ydrogenation
a b s t r a c t
The adsorption kinetics of hydrogen on solid support is accelerated by three orders of magnitude uponadding carbon nanotubes (CNT) to the support. The gas–solid catalytic hydrogenation is studied atambient temperature and sub atmospheric pressure while the support consists of a mixture of nanoPd-on-carbon with unsaturated hydrocarbon H-acceptor. The addition of a small amount of pristine CNTminimizes the required Pd concentration. A similar effect is demonstrated by addition of different oxidesto the composite, but at much higher additive concentrations. The addition of the spillover agent improvesthe transport of the hydrogen atoms in the composite to remote sites with low Pd concentration via a
spillover mechanism. Therefore, it is possible to overcome the decelerating effect of inhomogeneity inthe support. The irreversible gas–solid hydrogenation could serve as a simplified platform to study theslower step of hydrogen spillover, which operates also in hydrogen storage processes.
Solid phase catalyzed hydrogenation of phenyl acetylenesnder low hydrogen pressure and ambient temperature is a fast,
rreversible and quantitative reaction, which could reach highields (>99%) of the hydrogenated product [1,2]. The reaction hasseful applications in avoiding possible explosion or chemicalamages by scavenging hydrogen in closed enclosures such as cell-hone batteries, optical fiber cables or radioactive waste containers3–5].
Catalytic solid–gas hydrogenation mechanism involves hydro-en activation on a metallic surface, followed by atomic hydrogenpillover (SO), a term describing a transport (e.g., via sur-ace diffusion) of activated hydrogen from one solid surfaceo another. Recently, hydrogen SO has been pointed out as
vital step in hydrogen storage processes [6–10] and in thehemistry of fuel cells electrocatalysts [11]. The well knownO phenomenon in liquid phase heterogeneous catalysis haseen extensively studied during the last four decades with car-
on and oxide promoters, and found to be rather complex12,13].
The solvent-free, solid–gas hydrogenation is, however, a sim-pler system, which makes it an ideal platform for the study ofdissociated hydrogen direct interactions with the solid surfaces.
A primary hydrogen SO involves transport of activated hydrogenfrom the metallic catalyst to the catalyst support, while a secondarySO relates to hydrogen transport to a third solid, such as carbonnanotubes (CNTs) [14] or zeolites [15], which “bridges” betweenthe catalyst support and final H-acceptor [16].
The study of secondary SO effect on hydrogen storage has beenperformed by comparing the hydrogen uptake mediated by varioussubstrates, e.g., multi wall CNTs (MWCNT) [17–23] and single wallCNTs (SWCNT) [24,25], graphite [26,27], activated carbon nanofiber[28,29], activated carbon [30–32] and graphene nanoplatelets [33].
Hydrogen SO step is followed either by hydrogen covalent bind-ing (e.g., hydrogenation process) or by reversible physisorption ofhydrogen to a solid support in hydrogen storage process. Therefore,it is important to isolate and to evaluate the contribution of thenet SO step to the kinetics of the overall hydrogenation/adsorptionprocess.
The objective of the present research is to study the kineticeffect originated by adding a SO agent (e.g., pristine CNTs or variousoxides) to the composite to be hydrogenated. We focus on the SO in
a catalytic hydrogenation reaction of an unsaturated hydrocarbon(acceptor) such as diphenyl acetylene (DPA) or di-(phenylethynyl)benzene (DEB). The overall solid phase hydrogenation processincludes both a SO step (slower) and the irreversible covalent
a As specified by the supplier.b As measured by Raman spectroscopy.
onding of the hydrogen to the acceptor (faster). The rate-etermining step is the SO process, which is the focus of this study.
. Experimental
.1. Materials
1,4-Di(phenylethynyl)benzene (DEB) was synthesized accord-ng to [34,35]. Diphenyl acetylene (DPA) was purchased fromldrich and used without further purification.
Multi wall carbon nanotubes were purchased from CheaptubeCT 20–30) and from Nanocyl (NC7000) and were used as received.he properties of the CNT are presented in Table 1.
Palladium on carbon 5%, silica fumed, silica and zirconiaanopowder were obtained from Aldrich, and Alumina nanopow-er was purchased from Strem.
.2. Preparation of a powdered sample for hydrogenation
Spillover agents, e.g. oxides (0–1500 mg) or pristine CNTs0–150 mg) and Pd/C (60–210 mg) were grounded with hydro-en acceptors (DPA or DEB (1000 mg)) in a Pulverisette 6 millingachine (Fritsch) in an agate bowl at 600 rpm for 15 min.
.3. Kinetic measurements of hydrogenation
The rate of hydrogenation was determined by following theecrease of hydrogen pressure during the reaction, using a home-ade computer controlled Volumetric Pressure Measurement (a
ievert type apparatus) system (Fig. 1) [2].A pyrex Reaction Chamber (RC) (Fig. 1) containing a solid mix-
ure of an unsaturated hydrocarbon (DPA or DEB), a catalyst (Pd/C)nd spillover agent (CNTs or oxides), is connected to the vacuum
ine. Following the evacuation, hydrogen is introduced to a cal-brated volume and then transferred into the RC at the desirednitial pressure. The hydrogen pressure is measured at an accuracyf ±0.013 kPa (±0.1 Torr).
Reaction
Chamber
Pressu re Transdu cer
Computer cont rol an d
acquisition syste m
Inert Ga s
H2
Vacuu m
Fig. 1. Schematic description of volumetric pressure measuring apparatus.
lysis A: Chemical 376 (2013) 48– 52 49
A multistage pulse hydrogenation process is then performed.The portion of hydrogen introduced at each pulse is 5% (or 10%)of the sample theoretical hydrogen capacity, as calculated fromthe number of acetylene bonds in the acceptor molecule (underour experimental conditions there is no hydrogenation of aromaticrings of the DPA or DEB, as proved by GC/MS [2]). The sample weightis adjusted to match an initial hydrogen pressure of 13.3 kPa (thetypical sample weight is 150–400 mg). The measurement of thepressure drop for each portion is stopped when 98% of the hydrogenis consumed, unless the reaction rate is too slow, then the experi-ment is stopped after 12 h. The introduction of additional hydrogenportions is finally stopped when the substrate reaches about 50% (or80% in several experiments with DEB) of the theoretical hydrogencapacity, according to the experimental setup.
We measured in situ the temperature in the reaction vessel dur-ing hydrogenation to make sure that a gas–solid reaction takesplace. For both reactions (DEB and DPA) we found that the maximaltemperature was well below the melting points of all the reagents(an example of a temperature profile for DPA is shown in Fig. S1 insupplementary materials). There was no ocular evidence of liquidappearance during the reaction for both systems.
Supplementary data associated with this article can befound, in the online version, at http://dx.doi.org/10.1016/j.molcata.2013.04.007.
A convenient measure of the reaction rate is the time needed tocomplete a given percent of the acceptor saturation. The cumulativetime needed to reach this end point is termed t50 or t80.
Fig. 2a presents a typical time–pressure multistage hydrogena-tion of the DEB acceptor (each portion is 10% of the full capacity),where tx is an accumulative time to reach conversion of X% of hydro-genation. The first hydrogen portion (left curve) has a relativelylonger initial delay due to the initial catalyst activation step. Thelast portion (right curve) is not completely consumed at the timescale of the experiment due to the slow rate of the reaction at thispoint.
The conversion vs. time presentation enables one to comparebetween different samples. Fig. 2b shows the time dependence ofthe conversion of DPA hydrogenation as a function of the concentra-tion of CNTs (here, each portion is 5% of the hydrogen theoreticalcapacity). The effect of MWCNTs addition could be clearly seen.Note that the time scale is logarithmic, thus the reaction rate isincreased by almost three orders of magnitude by addition of 10%of MWCNT.
Henceforth, t50 and t80 are used as the ordinate, while theabscissa will be the SO agent concentration in the sample (wt%).
2.4. Transmission electron microscope (TEM)
TEM micrographs were obtained by FEI Tecnai 12 G2 TWIN TEM,operated at 120 kV. The microscope was operated at 120 kV at alow electron-dose mode (to reduce radiation damage) and at afew micrometers under focus to increase phase contrast. Imageswere recorded on a Gatan 794 CCD camera and analyzed by DigitalMicrograph 3.6 software.
3. Results and discussion
The hydrogen SO phenomenon was followed by tracking thekinetics of irreversible hydrogenation reaction. The influence ofdifferent types of SO agents, e.g. CNTs and oxides, at different con-centrations was examined on the kinetics of two types of organic
unsaturated substrates (DPA and DEB).
The general hydrogenation behavior of DPA and DEB is similarwhile the reaction rate of DEB is faster than that of DPA. We choseto describe the irreversible solid phase hydrogenation without a SO
50 S. Pevzner et al. / Journal of Molecular Catalysis A: Chemical 376 (2013) 48– 52
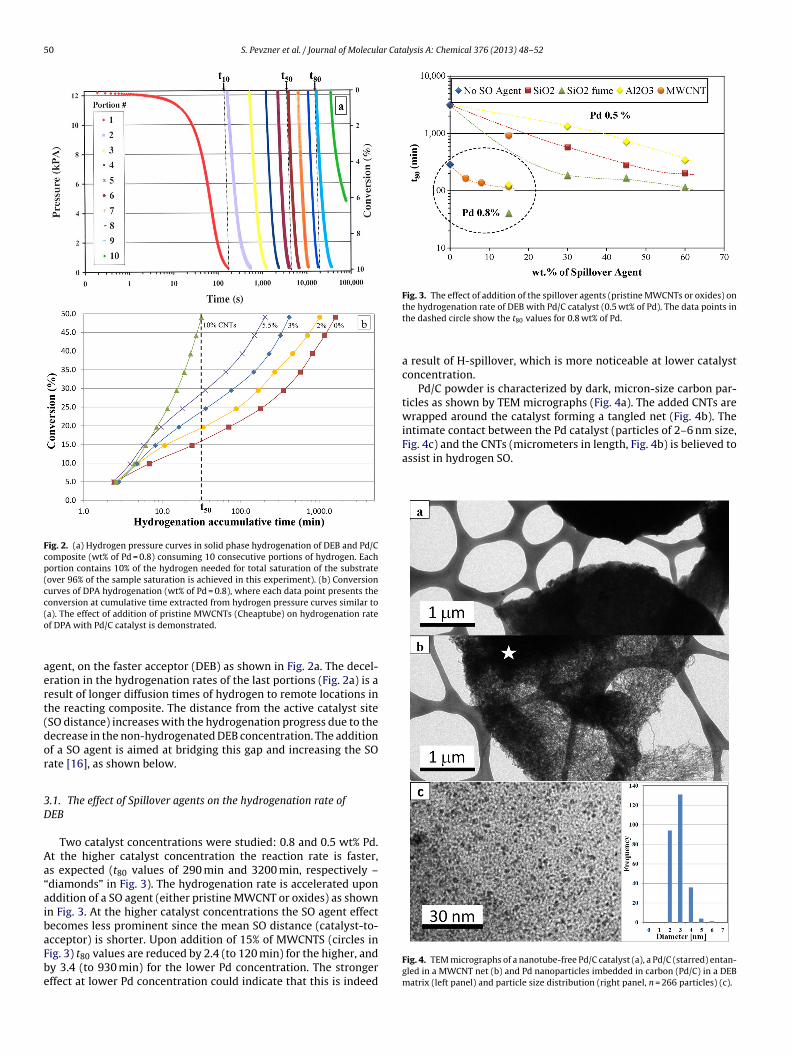
Fig. 2. (a) Hydrogen pressure curves in solid phase hydrogenation of DEB and Pd/Ccomposite (wt% of Pd = 0.8) consuming 10 consecutive portions of hydrogen. Eachportion contains 10% of the hydrogen needed for total saturation of the substrate(over 96% of the sample saturation is achieved in this experiment). (b) Conversioncurves of DPA hydrogenation (wt% of Pd = 0.8), where each data point presents theconversion at cumulative time extracted from hydrogen pressure curves similar to(o
aert(dor
3D
Aa“aibaFbe
Fig. 3. The effect of addition of the spillover agents (pristine MWCNTs or oxides) on
Fig. 4c) and the CNTs (micrometers in length, Fig. 4b) is believed toassist in hydrogen SO.
a). The effect of addition of pristine MWCNTs (Cheaptube) on hydrogenation ratef DPA with Pd/C catalyst is demonstrated.
gent, on the faster acceptor (DEB) as shown in Fig. 2a. The decel-ration in the hydrogenation rates of the last portions (Fig. 2a) is aesult of longer diffusion times of hydrogen to remote locations inhe reacting composite. The distance from the active catalyst siteSO distance) increases with the hydrogenation progress due to theecrease in the non-hydrogenated DEB concentration. The additionf a SO agent is aimed at bridging this gap and increasing the SOate [16], as shown below.
.1. The effect of Spillover agents on the hydrogenation rate ofEB
Two catalyst concentrations were studied: 0.8 and 0.5 wt% Pd.t the higher catalyst concentration the reaction rate is faster,s expected (t80 values of 290 min and 3200 min, respectively –diamonds” in Fig. 3). The hydrogenation rate is accelerated uponddition of a SO agent (either pristine MWCNT or oxides) as shownn Fig. 3. At the higher catalyst concentrations the SO agent effectecomes less prominent since the mean SO distance (catalyst-to-cceptor) is shorter. Upon addition of 15% of MWCNTS (circles in
ig. 3) t80 values are reduced by 2.4 (to 120 min) for the higher, andy 3.4 (to 930 min) for the lower Pd concentration. The strongerffect at lower Pd concentration could indicate that this is indeed
the hydrogenation rate of DEB with Pd/C catalyst (0.5 wt% of Pd). The data points inthe dashed circle show the t80 values for 0.8 wt% of Pd.
a result of H-spillover, which is more noticeable at lower catalystconcentration.
Pd/C powder is characterized by dark, micron-size carbon par-ticles as shown by TEM micrographs (Fig. 4a). The added CNTs arewrapped around the catalyst forming a tangled net (Fig. 4b). Theintimate contact between the Pd catalyst (particles of 2–6 nm size,
Fig. 4. TEM micrographs of a nanotube-free Pd/C catalyst (a), a Pd/C (starred) entan-gled in a MWCNT net (b) and Pd nanoparticles imbedded in carbon (Pd/C) in a DEBmatrix (left panel) and particle size distribution (right panel, n = 266 particles) (c).
S. Pevzner et al. / Journal of Molecular Cata
Fig. 5. The effect of various MWCNTs and various oxides concentration on DPA andD
smosTgwc
3p
gDoD(
omglSsm(5
tAeirb
c2sitdtha
References
EB hydrogenation rate at different catalyst concentrations.
The effect of oxide SO agents on the hydrogenation kinetics wastudied as well, as shown in Fig. 3. The effect of silica fume is theost dramatic one. It could reduce t80 by more than one order
f magnitude. The influence of the silica fume on the kinetics istronger for the low Pd concentration, similar to the MWCNT case.he decreasing order of SO efficiency in the case of DEB hydro-enation is: silica fume > silica, MWCNT CT20-30 > alumina (Fig. 3),hile the reaction rates increase with the increase in the SO agent
oncentrations.
.2. The contribution of the acceptor and SO agent type on the SOhenomenon
The SO phenomenon is further studied by comparing the hydro-enation reactions of two different hydrogen acceptors (DPA vs.EB). The effect of addition of SO agents on the hydrogenation timef both DPA and DEB is shown in Fig. 5. Since the reaction rate ofPA is slower than that of DEB, t50 is measured for both acceptors
instead of t80 used above).Faster hydrogenation rates of DEB in comparison to DPA are an
utcome of the unsaturation degree of the acceptor (one alkyneoiety for DPA and two for DEB) inducing intramolecular hydro-
en SO. Indeed, the t50 for DPA without a SO agent is four timesonger than that of DEB (Fig. 5); in the absence of intramolecularO in DPA the effect of addition of a SO agent is expected to betronger since SO distances are mainly intermolecular. Our experi-ents indeed prove this hypothesis: the addition of 8–10% MWCNT
CT 20–30 nm) accelerates the reaction of DEB and DPA by 2.5 and0 fold, accordingly.
Note that increasing MWCNT concentration has no effect onhe initial hydrogenation rates (the first 5% portions in Fig. 2b).t the initial stage high concentration of unsaturated substratexists in the vicinity of the catalyst and the presence of SO is of lessmportance. The SO agent becomes significant only later, when theeaction continues, and the reaching the unsaturated sites requiresridging.
To assess the effect of the CNT characteristics on the SO wearried out experiments with two types of MWCNT, namely, CT0–30 nm and NC7000 (Table 1). While the hydrogenation ratecales with both SO agents concentration, the effect of Nanocyl NTss clearly more substantial (Fig. 5). The faster kinetics induced byhe NC7000 in comparison with the CT 20–30 nm could stem fromifferent chemical and physical properties (Table 1). Some parame-
ers, which could be in favor of the NC7000 as a better SO agent areigher surface area, smaller diameter, higher defect density [36–39]nd higher metal impurities.
lysis A: Chemical 376 (2013) 48– 52 51
All oxides affect the hydrogenation rate at relatively high load-ing (>20 wt%), while silica-fume is also active at lower loading; theaddition of 8 wt% silica fume results in a rate increase of two ordersof magnitude (Fig. 5). Further increase in silica fume concentrationssucceeded only in compensating a lower catalyst concentration(0.3–0.6 wt% Pd) (Fig. 5, circled areas). Keeping the catalyst concen-trations at high loading would have resulted in shorted t50 values(Fig. 3). The effect of silica fume on the kinetics is significant in allthe range of catalyst concentrations (0.3–0.8 wt%) while for zirco-nia and alumina SO agents there is no effect at low loadings of oxide(<20%) as shown in Fig. 5. On the other hand, the effect of zirconiaand alumina loading at low Pd concentrations range (0.3–0.5%) issignificant only at increased oxide concentration (45–60%). As forsilica fume, high zirconia and alumina concentration compensatesthe low catalyst loading. The significant effect of fumed silica as aSO agent may be attributed to the catalytic activity of the silica itself[40] or to its surface defects [13,32]. In our experiments the catalyticactivity of silica fume (without Pd/C) was relatively minor: only 7%conversion in more than 100 h (see Fig. S2 in supplementary mate-rials). On the other hand, silica fume has more surface defects thanthe other untreated oxides, which could explain a faster hydrogentransfer [13,32].
Supplementary data associated with this article can befound, in the online version, at http://dx.doi.org/10.1016/j.molcata.2013.04.007.
The decreasing order of SO efficiency in the case of DPA hydro-genation is therefore: silica fume> MWCNT NC7000 > MWCNTCT20-30 > alumina > zirconia (Fig. 5), while the reaction rates areenhanced with increasing of the SO agent concentrations in thesolid mixture. The trend corroborates with the SO efficiency forDEB.
4. Conclusions
The hydrogenation of unsaturated hydrogen acceptors assistedby Palladium on carbon catalyst has been accelerated by the addi-tion of either oxides or CNT as SO agents. We found that the reactionrate is proportional to the SO agent concentration. Addition of SOagents does not accelerate the initial rate of hydrogenation but hasa substantial effect on the later steps.
It is possible to minimize the amount of metallic Pd catalystsimply by adding SO agents to the composite, without any chemicaltreatment. The differences in hydrogenation rates for DPA and DEBcould be interpreted in inter- and intra-molecular SO terms. The SOeffect is more substantial when DPA is used as an acceptor.
Silica fumed and CNTs are found as the best SO agents, whiledifferent types of CNT have different effects on the hydrogenationrate.
A 3D net of tangled MWCNT around micron size active carbonparticles is imaged by TEM. The morphology of this structure is inline with the secondary hydrogen SO step, in which hydrogen atomsmigrate from the AC matrix to the conducting 3D net formed by theMWCNT.
Acknowledgements
We would like to acknowledge the Israel Planning and Budget-ing Committee (VATAT) for the financial support of this research.Mr. Dror Cohen is kindly acknowledged for designing and program-ming the Sievert-type apparatus.
[1] G.L. Powell, J. Alloys Compd. 446 (2007) 402.[2] I. Pri-Bar, S. Pevzner, J.E. Koresh, J. Mol. Catal. A: Chem. 247 (2006) 103.[3] A. Decaumont, X. Andrieu, France 2 840 690A1 (2003), to Cit Alcatel France.
[4] L.A. Harrah, K.E. Mead, H.M. Smith, US 4 405 487 A (1983).[5] T.J. Shepodd, J.W.R. Even, US Patent 6 110 397 A (2000).[6] C.I. Contescu, V.V. Bhat, N.C. Gallego, Hydrogen spillover: its “diffusion” from
catalysis to hydrogen storage community, Abstr. of Pap., 237th ACS Natl. Meet.,Salt Lake City, UT, 22–26 March 2009, Am. Chem. Soc., Washington, DC, 2009p. FUEL-186.
[7] H. Cheng, L. Chen, A.C. Cooper, X. Sha, G.P. Pez, Energy Environ. Sci. 1 (2008)338.
[8] L. Wang, R.T. Yang, Energy Environ. Sci. 1 (2008) 268.[9] L. Wang, R.T. Yang, Catal. Rev.: Sci. Eng. 52 (2010) 411.10] G.M. Psofogiannakis, G.E. Froudakis, Chem. Commun. (Cambridge U. K.) 47
(2011) 7933.11] P.C.H. Mitchell, A.J. Ramirez-Cuesta, S.F. Parker, J. Tomkinson, D. Thompsett, J.
Phys. Chem. B 107 (2003) 6838.12] W.C. Conner Jr., J.L. Falconer, Chem. Rev. (Washington, DC, U. S.) 95 (1995) 759.13] R. Prins, Chem. Rev. (Washington DC, U. S.) 112 (2012) 2714.14] W.J. Liu, B.L. Wu, C.S. Cha, J. Electroanal. Chem. 476 (1999) 101.15] H.L. Chen, H. Yang, O. Omotoso, L.H. Ding, Y. Briker, Y. Zheng, Z. Ring, Appl.
Catal. A 358 (2009) 103.16] A.J. Lachawiec Jr., G. Qi, R.T. Yang, Langmuir 21 (2005) 11418.
17] L.Z. Gao, E. Yoo, J. Nakamura, W.K. Zhang, H.T. Chua, Carbon 48 (2010)
3250.18] K.Y. Lin, W.T. Tsai, J.K. Chang, Int. J. Hydrogen Energy 35 (2010) 7555.19] R. Orinakova, A. Orinak, Fuel 90 (2011) 3123.20] S.Y. Lee, S.J. Park, Adv. Mater. Res. 123–125 (2010) 695.
[[[[
alysis A: Chemical 376 (2013) 48– 52
21] S.Y. Lee, S.J. Park, Int. J. Hydrogen Energy 35 (2010) 6757.22] A. Reyhani, S.Z. Mortazavi, S. Mirershadi, A.Z. Moshfegh, P. Parvin, A.N. Golikand,
J. Phys. Chem. C 115 (2011) 6994.23] J.S. Im, J. Yun, S.C. Kang, S.K. Lee, Y.-S. Lee, Appl. Surf. Sci. 258 (2012) 2749.24] S. Kocabas, T. Kopac, G. Dogu, T. Dogu, Int. J. Hydrogen Energy 33 (2008) 1693.25] A.M. Rashidi, A. Nouralishahi, A.A. Khodadadi, Y. Mortazavi, A. Karimi, K.
Kashefi, Int. J. Hydrogen Energy 35 (2010) 9489.26] G.M. Psofogiannakis, G.E. Froudakis, J. Am. Chem. Soc. 131 (2009) 15133.27] B.J. Kim, S.J. Park, Int. J. Hydrogen Energy 36 (2011) 648.28] C.I. Contescu, C.M. Brown, Y. Liu, V.V. Bhat, N.C. Gallego, J. Phys. Chem. C 113
(2009) 5886.29] Y. Yurum, A. Taralp, T.N. Veziroglu, Int. J. Hydrogen Energy 34 (2009) 3784.30] B.D. Adams, C.K. Ostrom, S.A. Chen, A.C. Chen, J. Phys. Chem. C 114 (2010) 19875.31] A.C. Chien, S.S.C. Chuang, Int. J. Hydrogen Energy 36 (2011) 6022.32] Q. Li, A.D. Lueking, J. Phys. Chem. C 115 (2011) 4273.33] B.P. Vinayan, K. Sethupathi, S. Ramaprabhu, Trans. Indian Inst. Met. 64 (2011)
169.34] I. Pri-Bar, J.E. Koresh, J. Mol. Catal. A: Chem. 156 (2000) 173.35] I. Pri-Bar, J.E. Koresh, J. Mol. Catal. A: Chem. 206 (2003) 313.36] P.J. Tsai, C.H. Yang, W.C. Hsu, W.T. Tsai, J.K. Chang, Int. J. Hydrogen Energy 37