1 SOLID STATE SYNTHESIS OF NICKEL BORIDES AS CATALYSTS FOR HYDROGEN EVOLUTION By FABRIZIO GUZZETTA A THESIS PRESENTED TO THE GRADUATE SCHOOL OF THE UNIVERSITY OF FLORIDA IN PARTIAL FULFILLMENT OF THE REQUIREMENTS FOR THE DEGREE OF MASTER IN SCIENCE UNIVERSITY OF FLORIDA 2013
Transcript
1
SOLID STATE SYNTHESIS OF NICKEL BORIDES AS CATALYSTS FOR HYDROGEN EVOLUTION
By
FABRIZIO GUZZETTA
A THESIS PRESENTED TO THE GRADUATE SCHOOL OF THE UNIVERSITY OF FLORIDA IN PARTIAL FULFILLMENT
OF THE REQUIREMENTS FOR THE DEGREE OF MASTER IN SCIENCE
2.3.4.1 Powders as Synthesized (Under Normal Laboratory Conditions) .. 70 2.3.4.2 Annealing the Powders under Ar(g) ............................................... 70 2.3.4.3 γ-Irradiation of the Powders. .......................................................... 75
2.3.5 Quantitative Elemental Analysis: ICP-AES .............................................. 76 2.3.5.1 Determination of the Nickel Amount in the Unknown ..................... 77
2.3.5.2 Determination of the Boron Amount in the Unknown ..................... 79 2.3.6 Quantitative Analysis: XRD Refinement .................................................. 81
2.3.7 XPS ......................................................................................................... 82 2.3.7.1 Determination of Nickel through XPS ............................................. 85 2.3.7.2 Determination of Boron through XPS ............................................. 86
2.3.8 Morphology of NiBx .................................................................................. 88 2.3.8.1 TEM and EDXS .............................................................................. 88 2.3.8.2 SEM Microscopy and EDS ............................................................. 91
7
2.4 Discussion of the Results .................................................................................. 94 2.4.1 Thermal Analysis .............................................................................. 94 2.4.2 FTIR .................................................................................................. 96
3 CATALYSIS OF NICKEL BORIDES ..................................................................... 111
3.1 Experimental Results ...................................................................................... 111 3.2 Energetics of the Reactions ............................................................................ 117
3.3 Identification of Reaction Products.................................................................. 124 3.4 Discussion of the Results ................................................................................ 131
4 CONCLUSIONS AND FUTURE WORK ............................................................... 134
4.1 Conclusion and Remarks ................................................................................ 134
4.2 Outlook ........................................................................................................... 135
APPENDIX MAGNETIC TECHNIQUES ...................................................................... 137
1-2 Hydrogen storage properties of selected high capacity hydrides ....................... 24
2-1 Atom site occupancies for the monoclinic and orthorhombic NiB3 structures.. ... 44
2-2 Calculated Thermodynamic and Structural Data of the Compounds. ................. 47
2-3 Calculated energies, zero point energies and entropic contributions of the o - NiB and the o – and m – NiB3 ............................................................................. 49
2-4 Calculated molecular weights, molar volumes and for different nickel borides. .. 50
2-5 Literature reported XPS B 1s and Ni 2p3/2 line positions .................................. 103
3-1 %-yield of hydrogen evolution from catalyzed hydrolysis of sodium borohydride: NC stands for Non-Catalyzed, UP stands for Unsupported Powder and SC stands for Supported Powder (mediated reactions). ............... 113
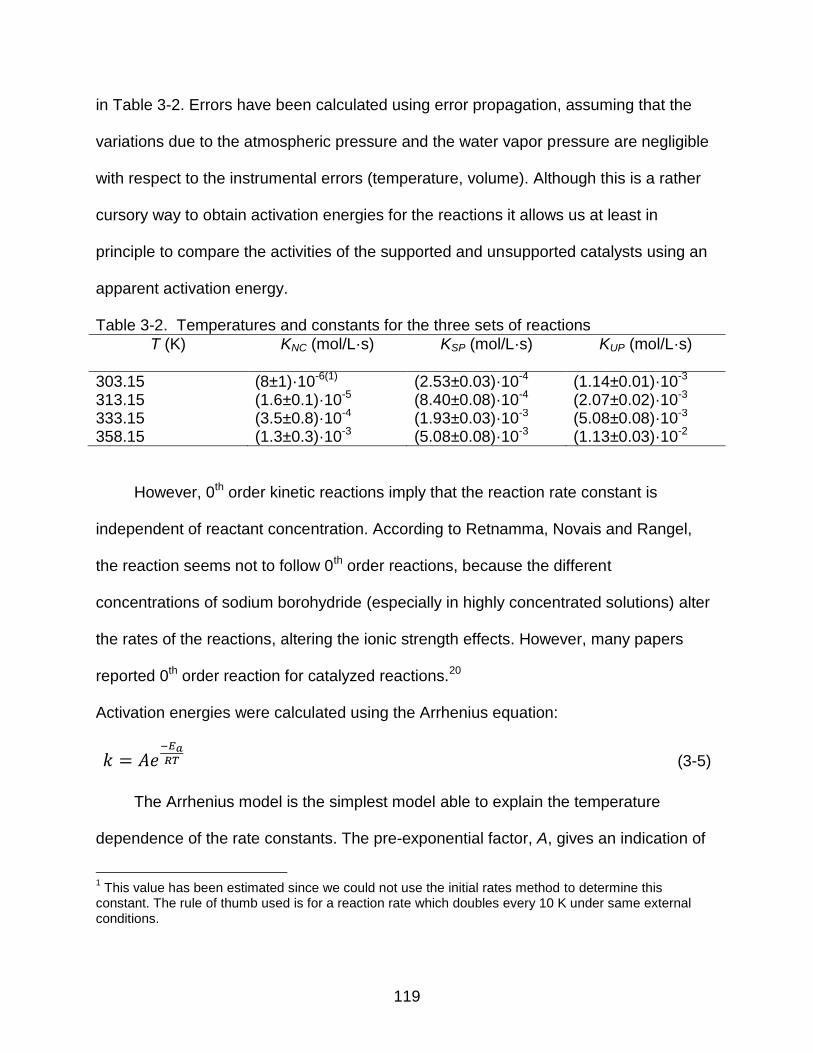
3-2 Temperatures and constants for the three sets of reactions ............................. 119
9
LIST OF FIGURES
Figure page 1-1 Device for compressed hydrogen gas storage from Quantum Technologies. .... 19
1-2 Liquid H2 (LH2) tank system. ............................................................................... 20
1-3 Activated complexes in acidic hydrolysis of sodium borohydride........................ 26
1-4 Log(k) versus pH plot for the hydrolysis of sodium borohydride. ........................ 27
1-5 Comparison of the catalytic activity of amorphous Ni2B and Raney nickel in the hydrogenation of acetonitrile. ........................................................................ 35
1-6 Hydrogen evolution kinetics as a function of the wt-% of sodium hydroxide. ...... 36
2-1 Schematic of the gas collection system. ............................................................. 40
2-2 𝑃𝑛𝑚𝑎 crystal structure of NiB3 ............................................................................ 45
2-3 P21/c monoclinic crystal structure of NiB3. .......................................................... 46
2-4 TGA/DSC graph of the 5 mol-% Nickel Bromide in NaBH4 after hydrolysis 1) Water loss; 2) the broad peak position and 3) unexplained feature .................... 53
2-5 SiO2 gel thermogram: 1) water loss peak. 2) and 3) unassigned transformation(s). ............................................................................................... 54
2-7 Calculated FT-IR spectra of the most stable NiB3 structures. In blue the
orthorhombic 𝑃𝑛𝑚𝑎 structure, in black the P21/c structure. ................................ 56
2-8 FT-IR spectra of the non-hydrolyzed powders. ................................................... 58
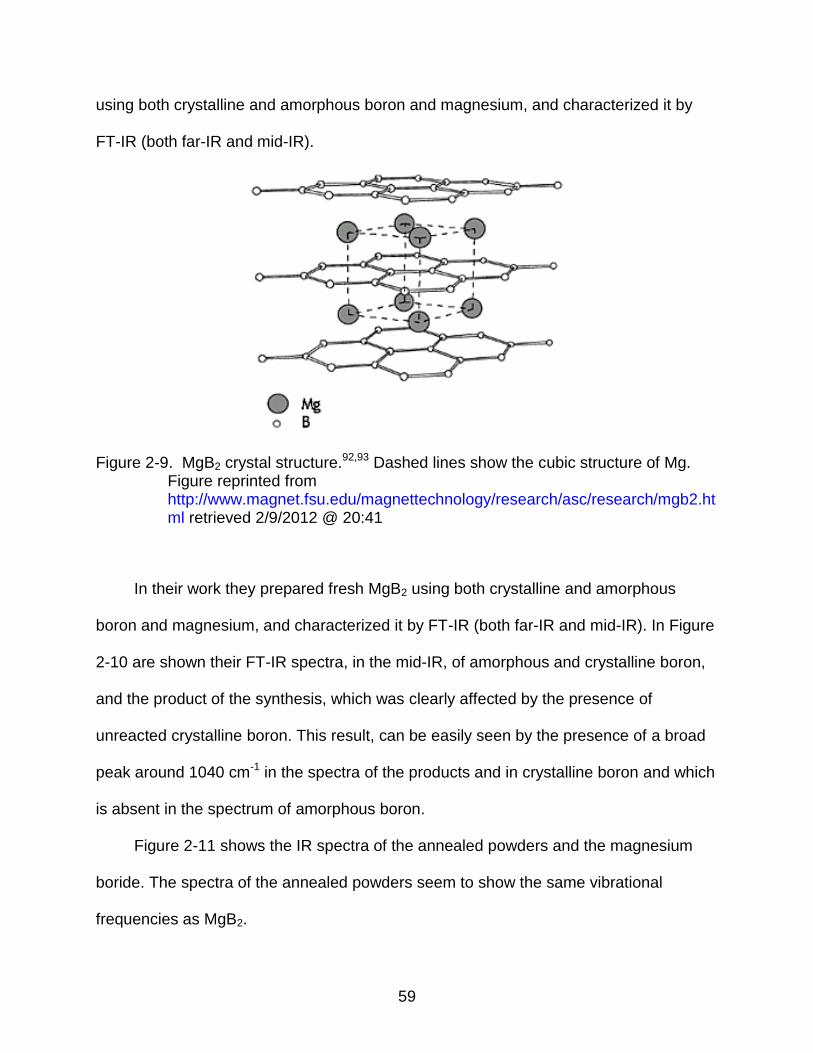
2-9 MgB2 crystal structure.91,92 Dashed lines show the cubic structure of Mg. ......... 59
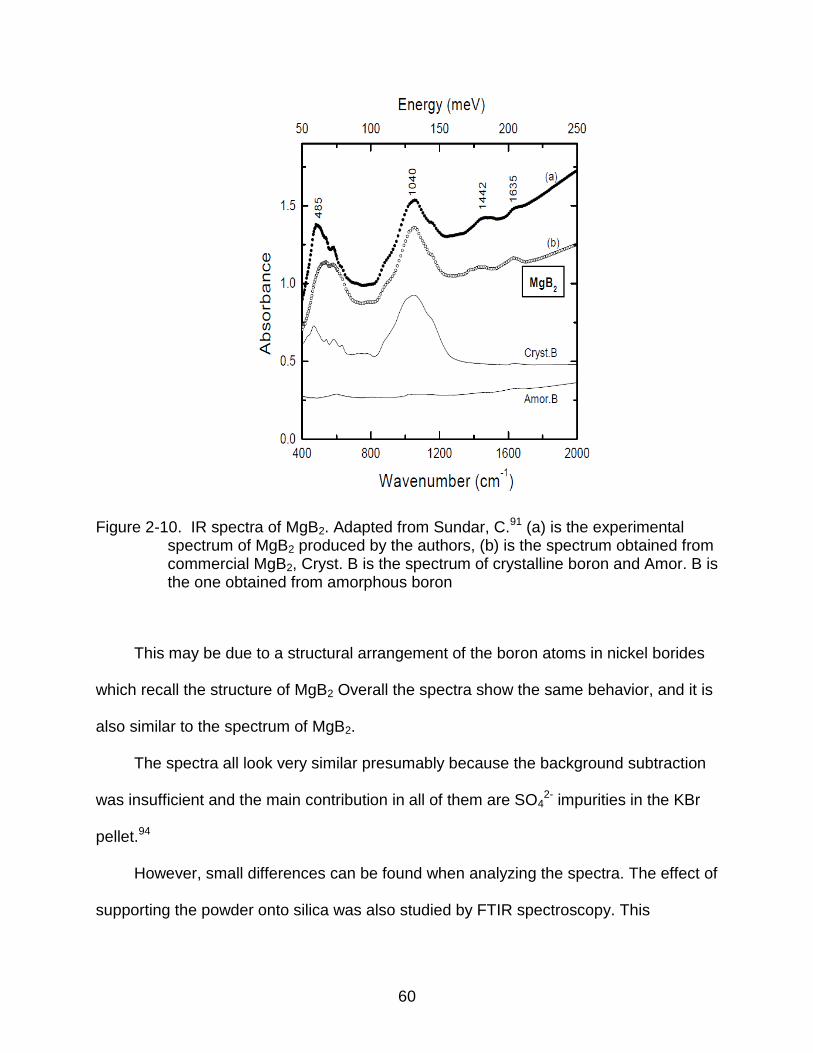
2-10 IR spectra of MgB2. ............................................................................................ 60
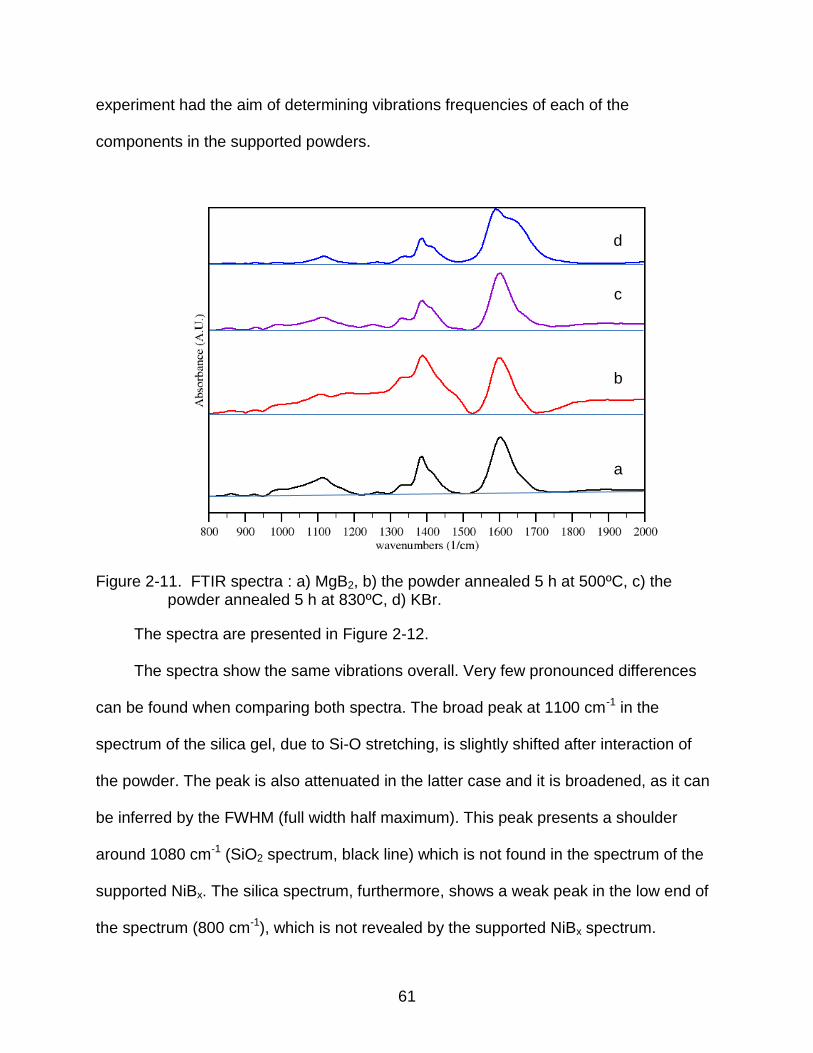
2-11 FTIR spectra : a) MgB2, b) the powder annealed 5 h at 500ºC, c) the powder annealed 5 h at 830ºC, d) KBr. ........................................................................... 61
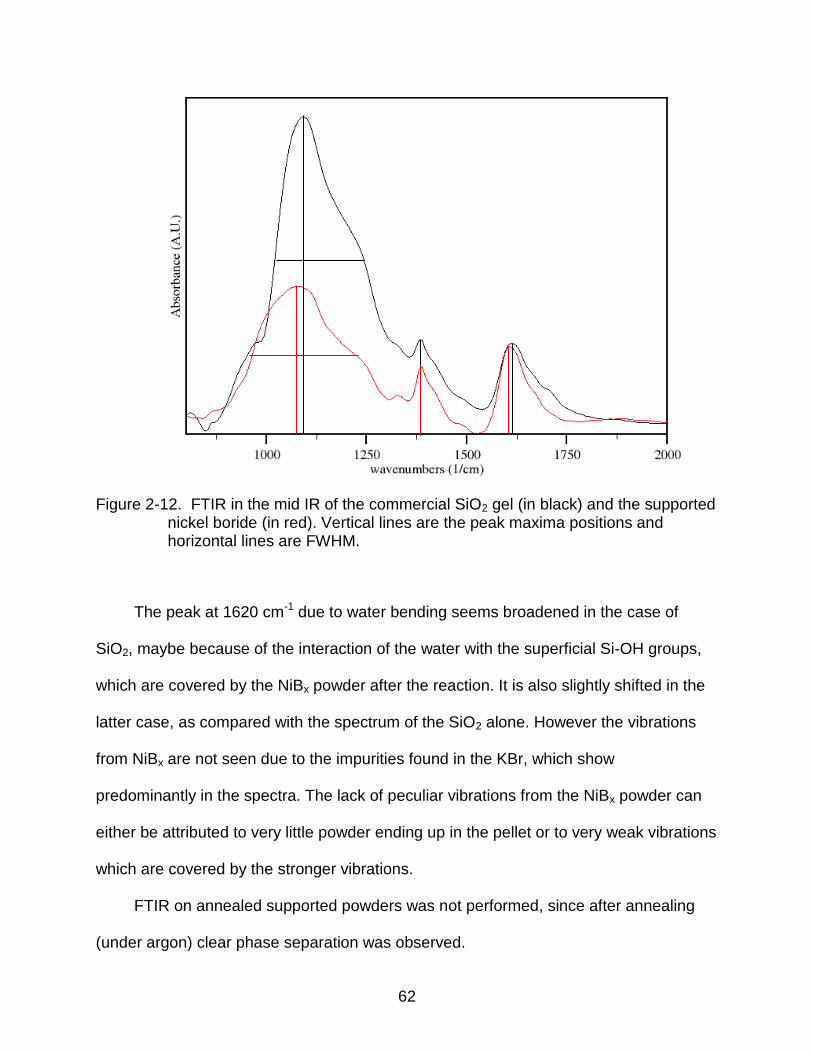
2-12 FTIR in the mid IR of the commercial SiO2 gel (in black) and the supported nickel boride (in red). .......................................................................................... 62
2-13 Schematic used in the derivation of Bragg’s Law for X-ray diffraction. ............... 65
2-14 Miller planes and indexing in a simple unit cell. .................................................. 66
10
2-15 XRD pattern of the freshly prepared powders. Blue: Experimental pattern. Red: NaBr. Green: NaBH4. Grey:Residuals. ....................................................... 71
2-16 XRD pattern obtained on the hydrolyzed powders. ............................................ 71
2-18 Blue: RTP hydrolyzed powder pattern. Green: Annealed for 1 h under Ar(g) at 1100 K. Red: Annealed for 5 h under Ar(g) at 1100. ...................................... 73
2-19 XRD patterns obtained at the 11BM beamline of the APS in Argonne. .............. 74
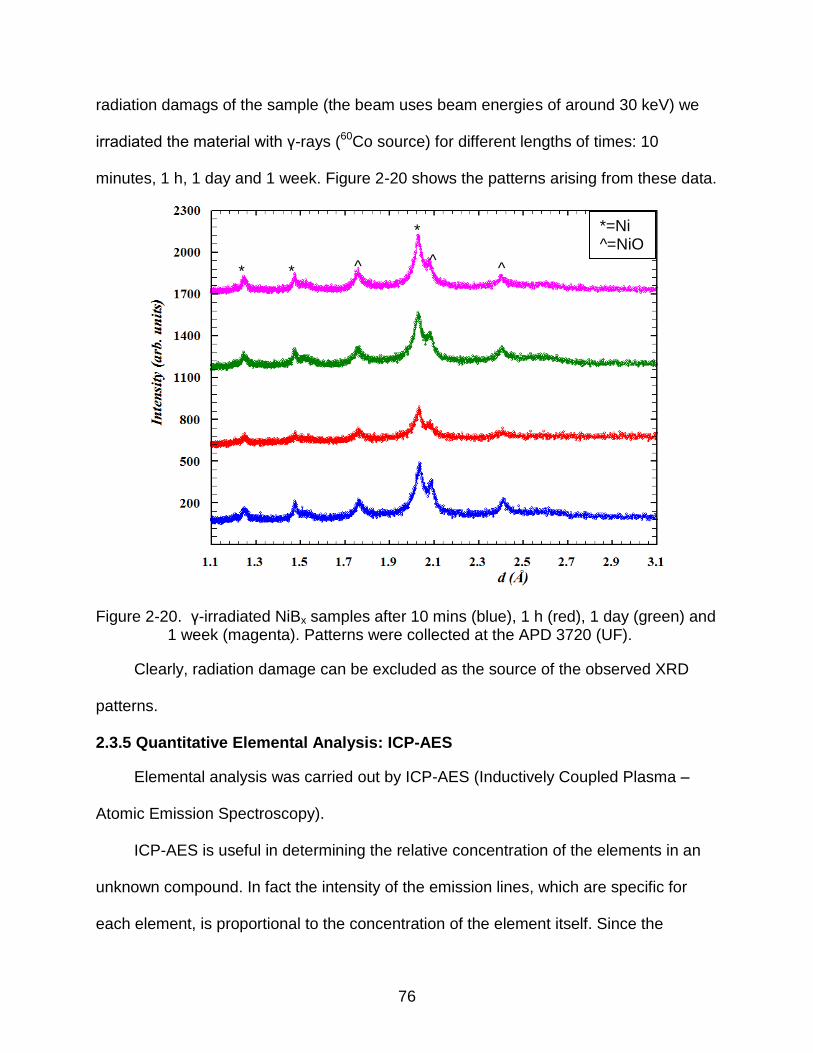
2-20 γ-irradiated NiBx samples after 10 mins (blue), 1 h (red), 1 day (green) and 1 week (magenta). Patterns were collected at the APD 3720 (UF). ...................... 76
2-21 Correlation plots for the nickel standard observed at 231.604 nm, and at 232.138 nm......................................................................................................... 79
2-22 Correlation plots for the boron standard observed at 249.678 nm and at 249.772 nm......................................................................................................... 80
2-23 Quantitative results from the XRD refinement shown in figure 2-15. .................. 82
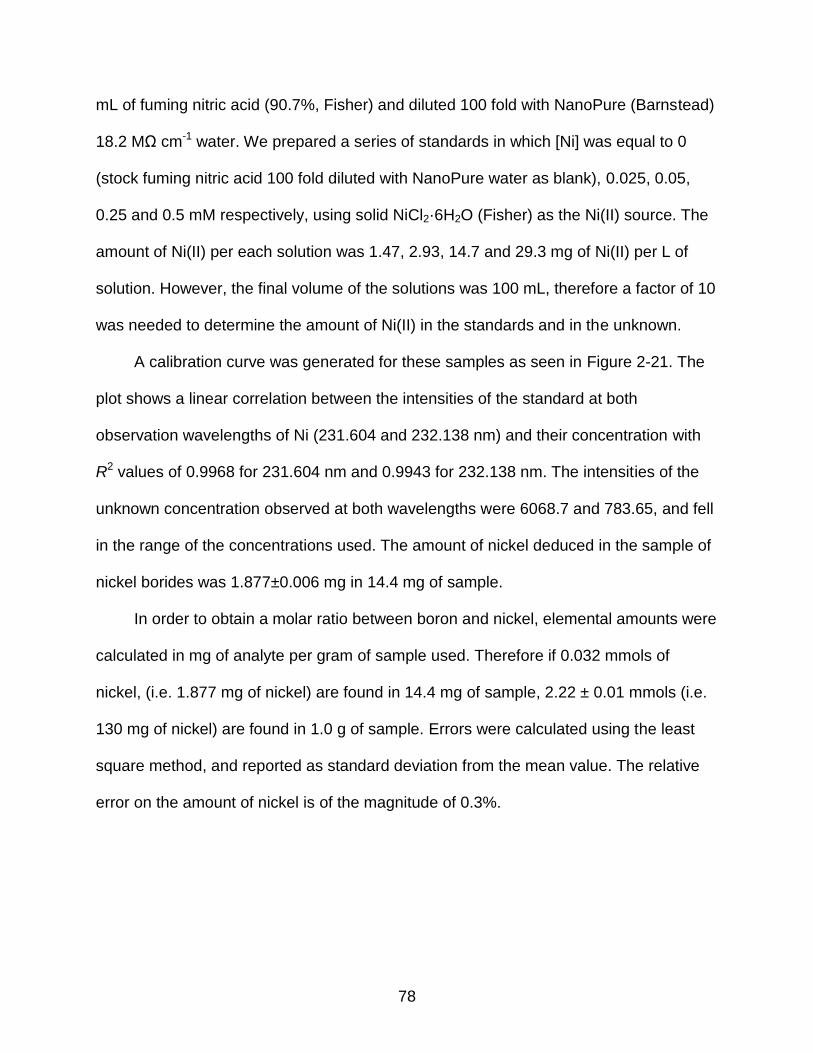
2-24 Room temperature C 1s peak. The black line represents the as-determined peak, the red one is the peak as expected for the default C 1s position. ............ 84
2-25 Ni XPS spectra. .................................................................................................. 85
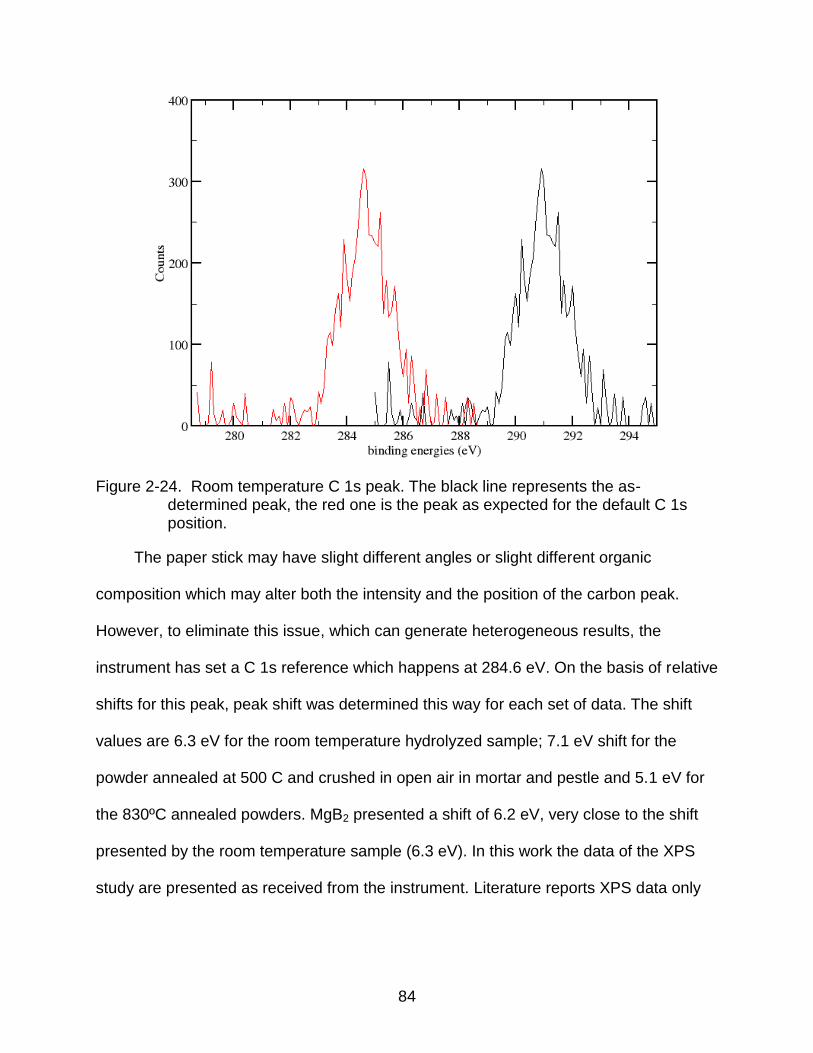
2-26 High resolution spectrum of commercial MgB2. .................................................. 86
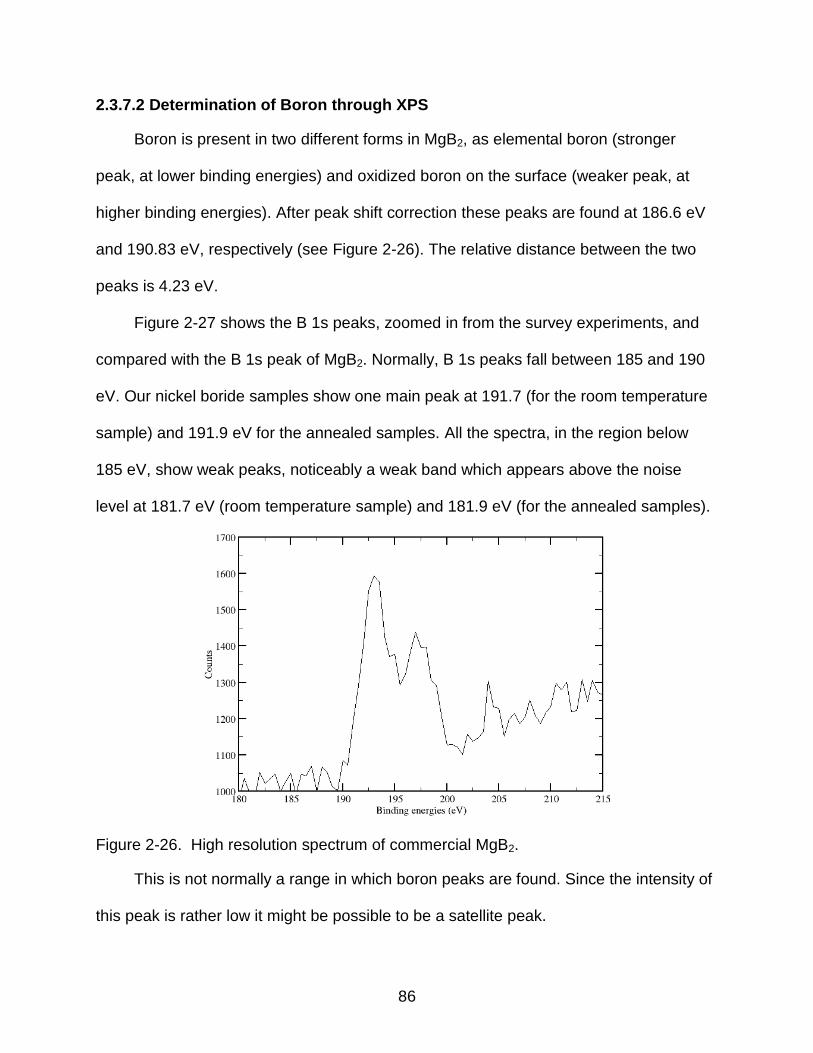
2-27 Comparison of the B 1s peaks. ........................................................................... 87
2-28 XPS HR spectra of the B 1s peak. Intensities ratio are 3:1 for oxidized boron. Al anode in black; Mg anode in red .................................................................... 88
2-29 From a) to d), respectively: a STEM image and increasingly resolved TEM images of the powders. ...................................................................................... 89
2-30 TEM images of a grain of material. a) and b) show images of the same grain of powder with the magnification doubled. .......................................................... 90
2-31 EDXS of NiBx unsupported sample showing a boron peak which is more intense than the carbon peak. Nickel peaks are also clearly visible. .................. 91
2-32 EDXS of the supported powders. The low energy peaks containing contributions from C and B are framed in red and zoomed in. ........................... 91
2-33 SEM images of the various powders. ................................................................. 93
11
2-34 EDS spectroscopy of SiO2 supported NiBx.. ....................................................... 93
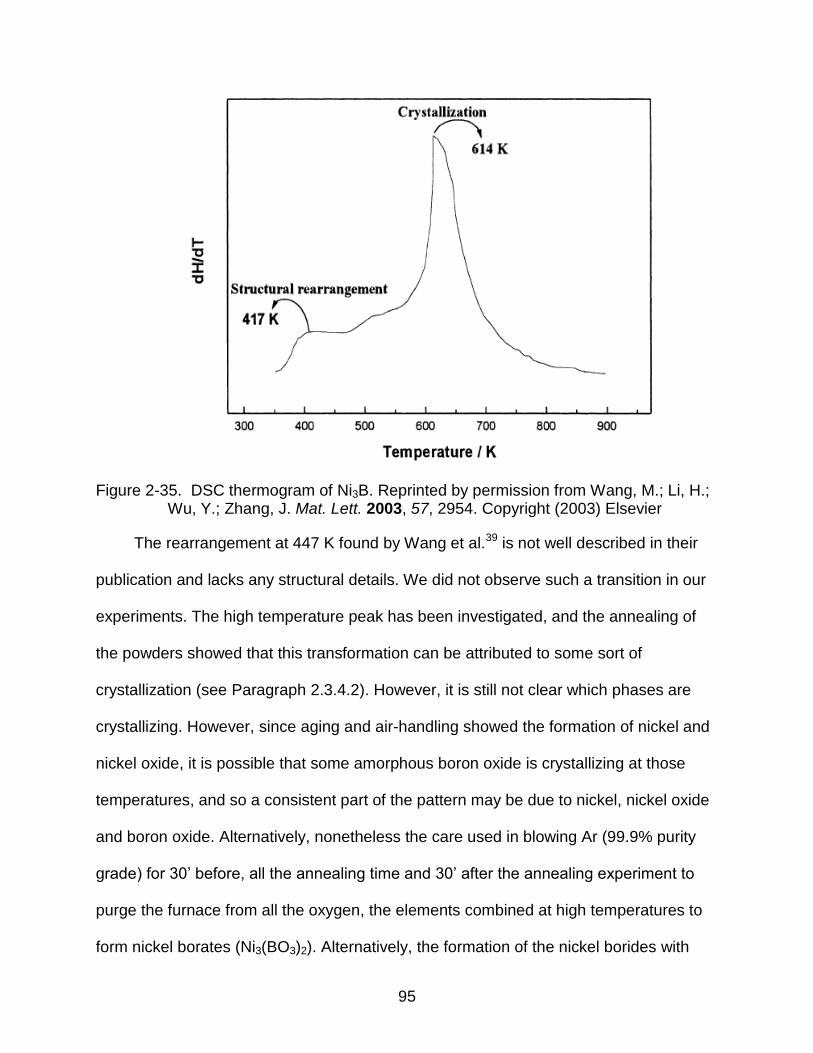
2-35 Literature reported DSC thermogram of Ni3B ..................................................... 95
2-36 IR spectra of NbB2 and CaB6 microcrystalline borides.. ..................................... 97
2-37 Experimental IR from Molvinger et al. ................................................................. 97
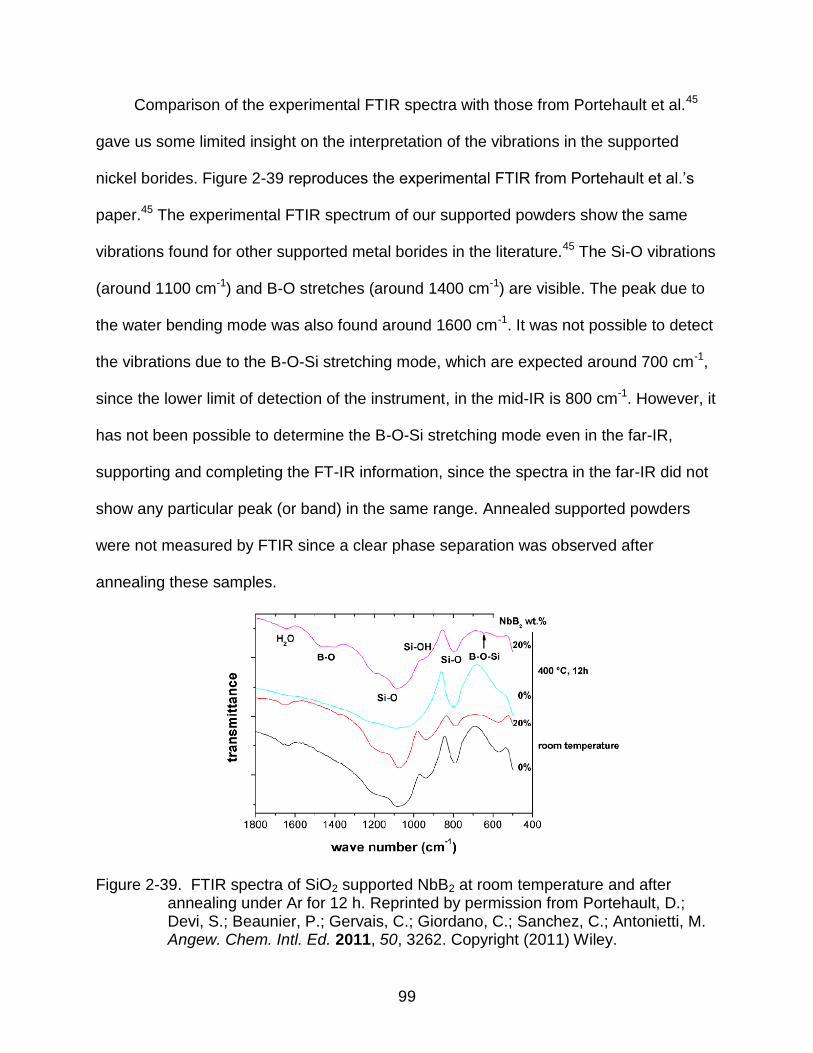
2-39 FTIR spectra of SiO2 supported NbB2 at room temperature and after annealing under Ar for 12 h.. .............................................................................. 99
2-40 XRD patterns of nickel borides ......................................................................... 100
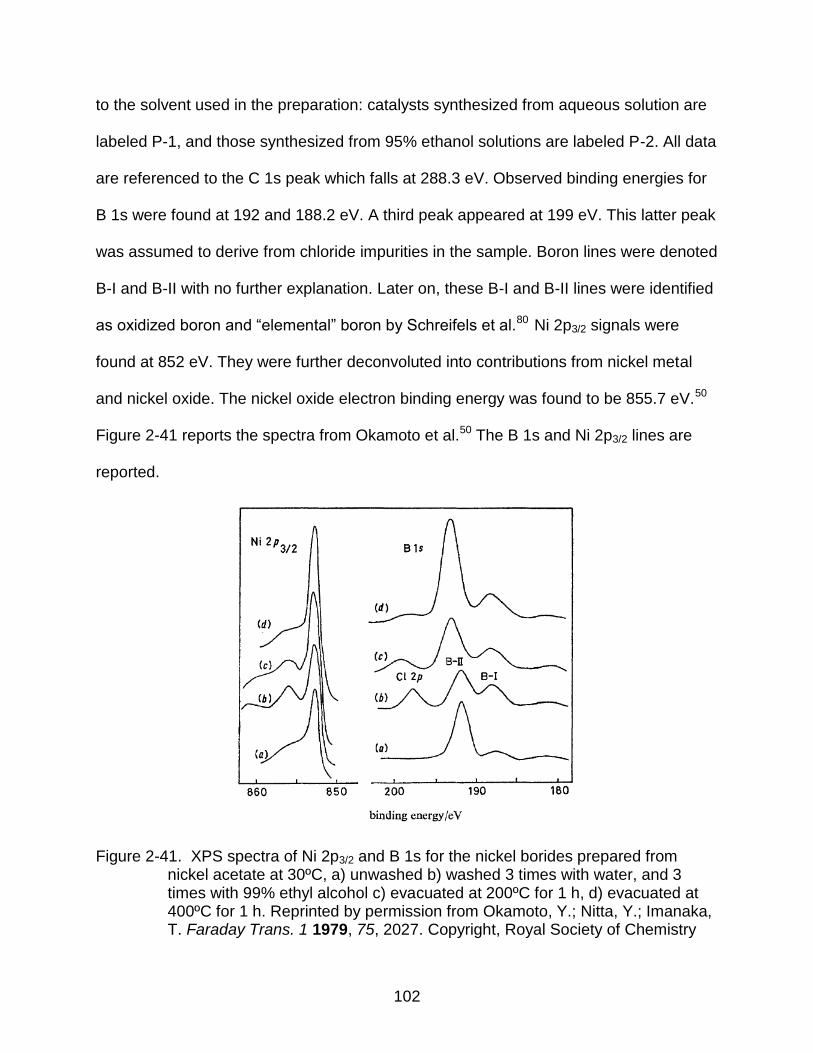
2-41 XPS spectra of Ni 2p3/2 and B 1s for the nickel borides .................................... 102
2-42 Literature reported XPS spectra ....................................................................... 104
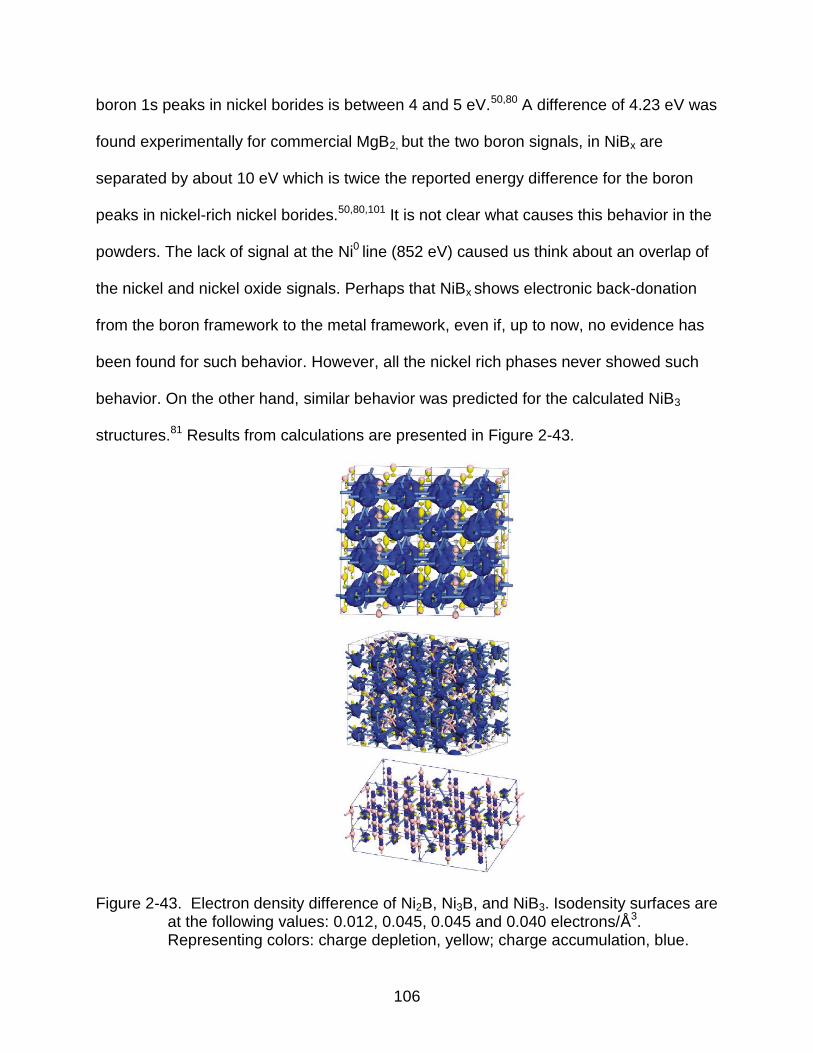
2-43 Electron density difference of Ni2B, Ni3B, and NiB3.. ........................................ 106
2-44 SEM image and relative EDXS for MgB2. ......................................................... 109
2-45 Literature reported EDXS spectra ..................................................................... 109
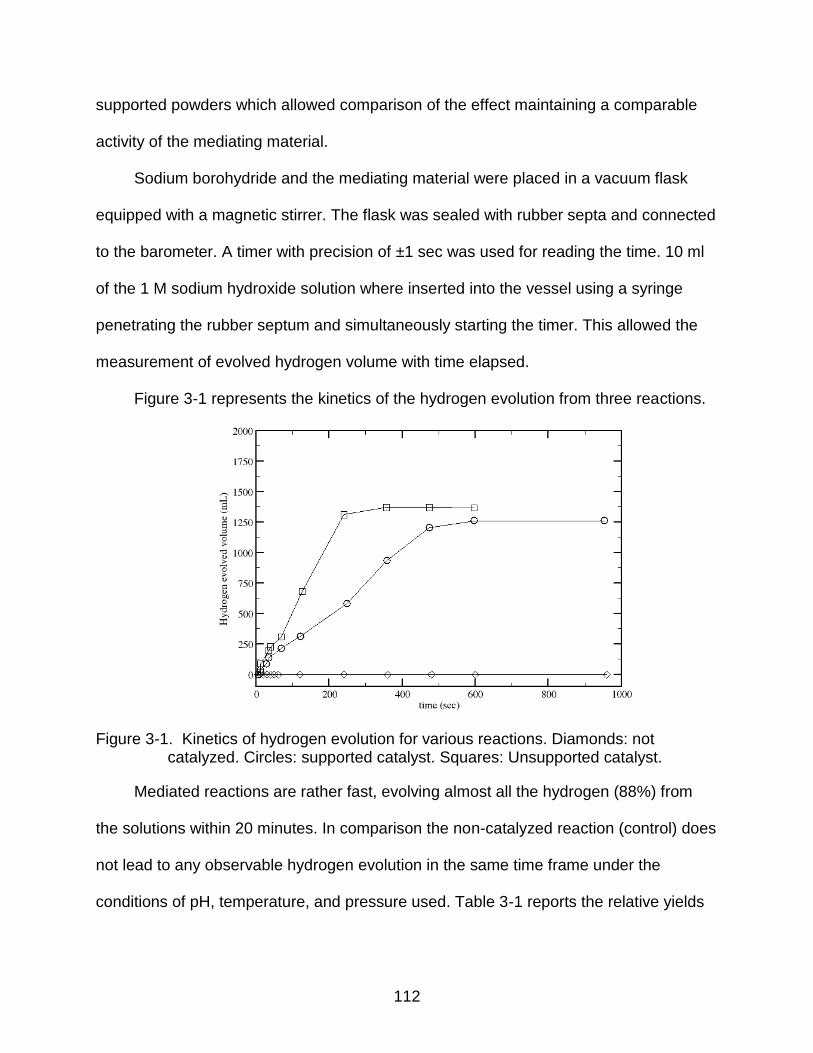
3-1 Kinetics of hydrogen evolution for various reactions.. ....................................... 112
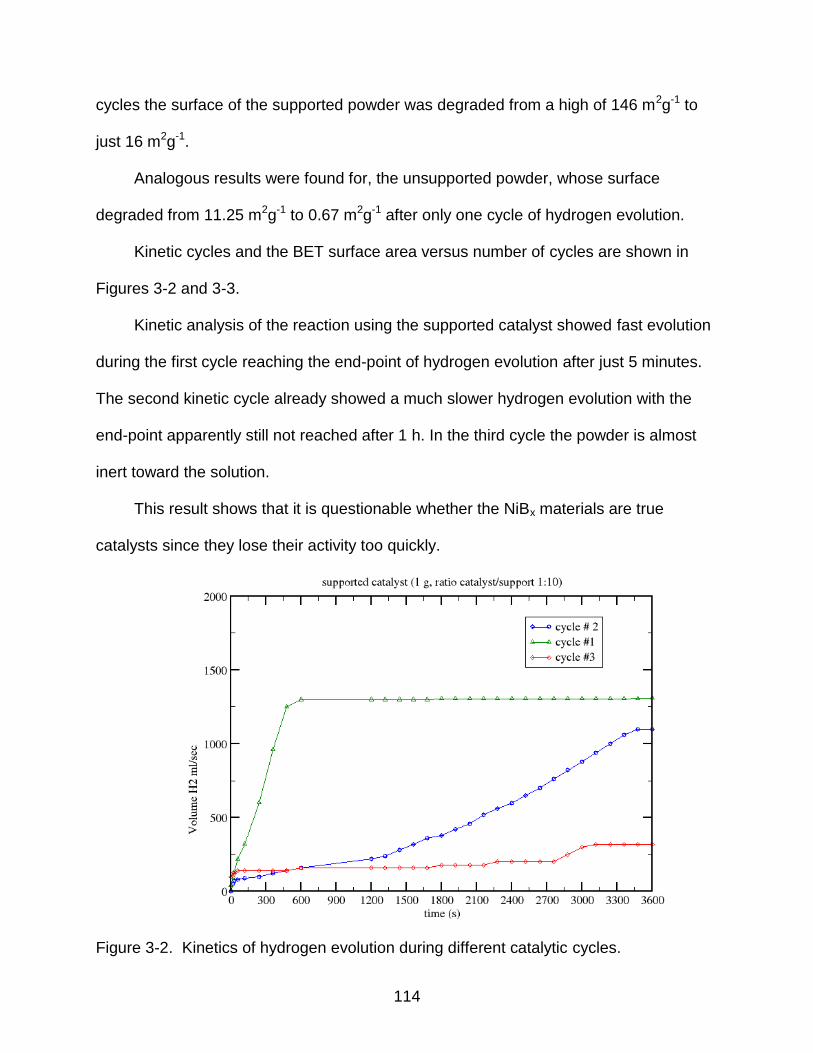
3-2 Kinetics of hydrogen evolution during different catalytic cycles. ....................... 114
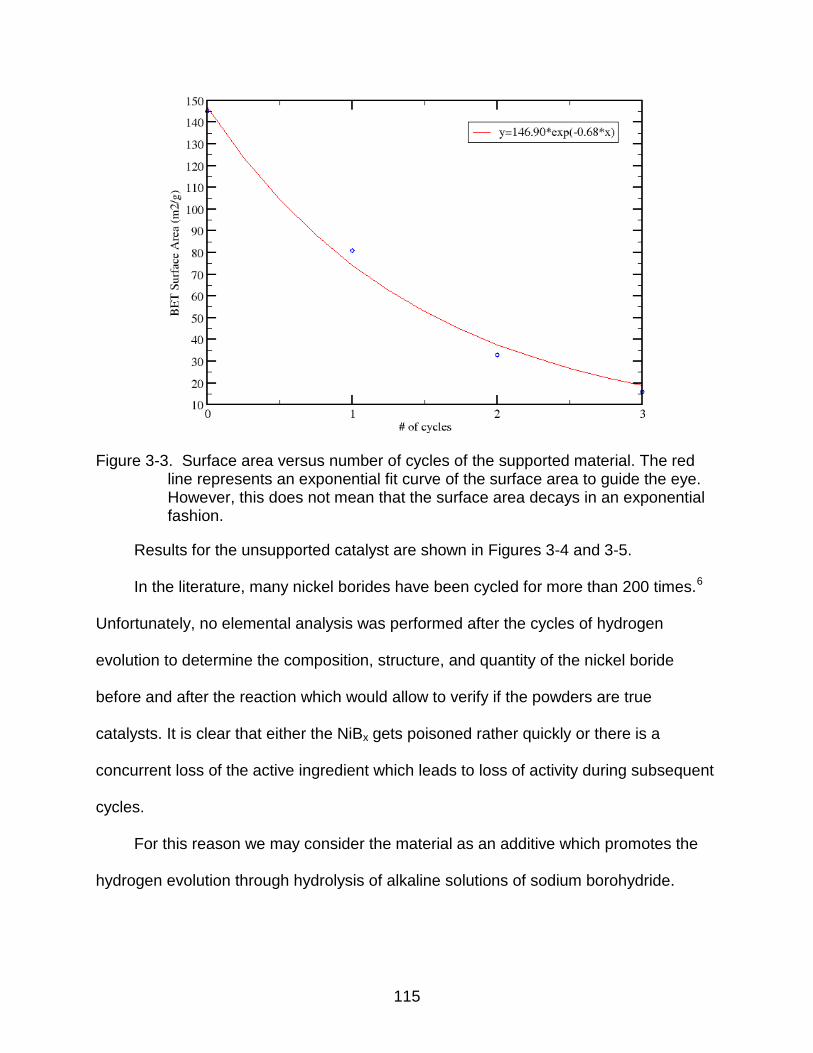
3-3 Surface area versus number of cycles of the supported material. .................... 115
3-4 Kinetics of the unsupported catalyst during successive cycles. ........................ 116
3-5 Decay of the surface area for the unsupported catalyst after successive cycles. .............................................................................................................. 116
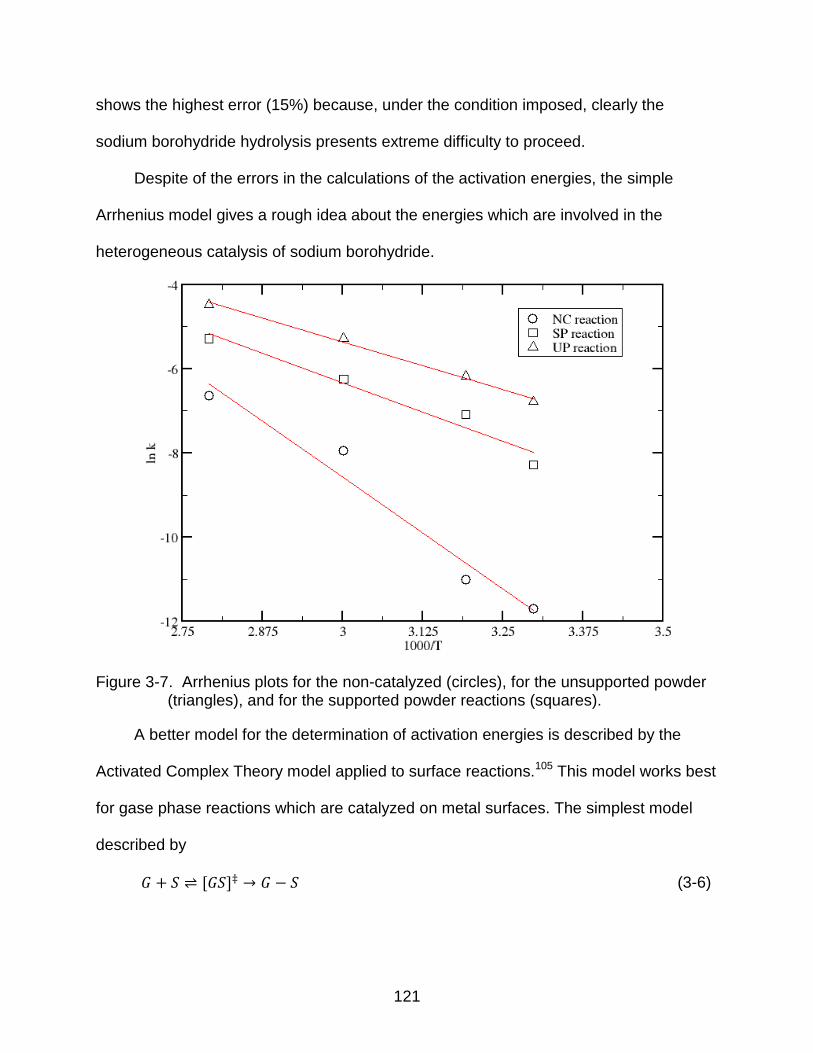
3-6 Kinetics of the reactions at 30ºC, 40ºC, 60ºC, and 85ºC. ................................. 118
3-7 Arrhenius plots for the non-catalyzed (circles), for the unsupported powder (triangles), and for the supported powder reactions (squares). ........................ 121
3-8 FTIR spectrum of the reaction products using the unsupported catalyst. ......... 125
3-9 FTIR spectrum of the reaction products using the supported catalyst. ............. 126
3-10 XRD patterns of the products from the catalyzed reactions.. ............................ 126
3-11 Predicted composition of the reaction products from the reaction conducted with unsupported catalyst. Results are given in wt-%. ...................................... 128
12
3-12 Predicted composition of the reaction products from the reaction conducted with supported catalyst. Results are given in wt-%. .......................................... 128
3-13 Rietveld refinement of the products of the reaction performed with unsupported catalyst. ....................................................................................... 129
3-14 Rietveld refinement of the powders from the reaction performed with the supported catalyst. ........................................................................................... 130
A-2 Nickel boron metallic glasses with cubic symmetries. ...................................... 139
A-3 Calculated isotropic shielding for the orthorhombic structure of NiB3 ............... 141
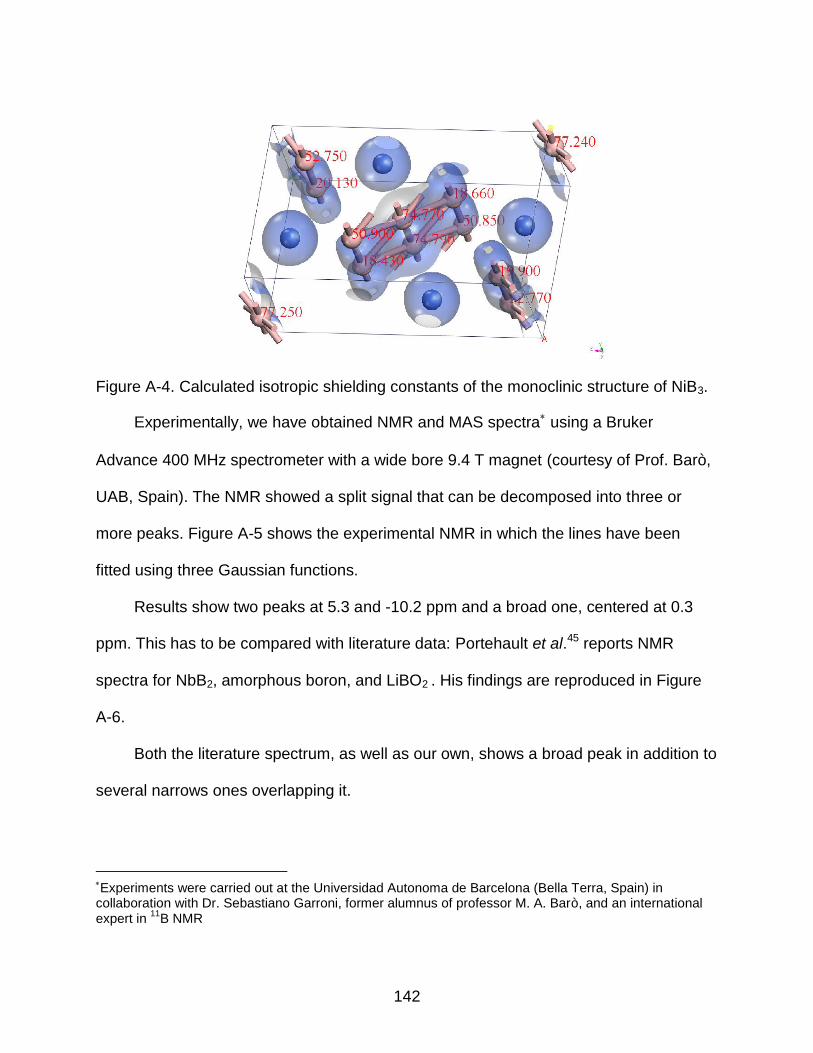
A-4 Calculated isotropic shielding constants of the monoclinic structure of NiB3. ... 142
A-5 Experimental NMR spectrum of hydrolyzed (room temperature) NiBx (black) and simulation (red). ......................................................................................... 143
A-6 Literature reported 11B NMR spectra: a) NbB2, b) amorphous boron, and c) LiBO2. ............................................................................................................... 143
A-7 The TPPM pulse sequence. ............................................................................. 144
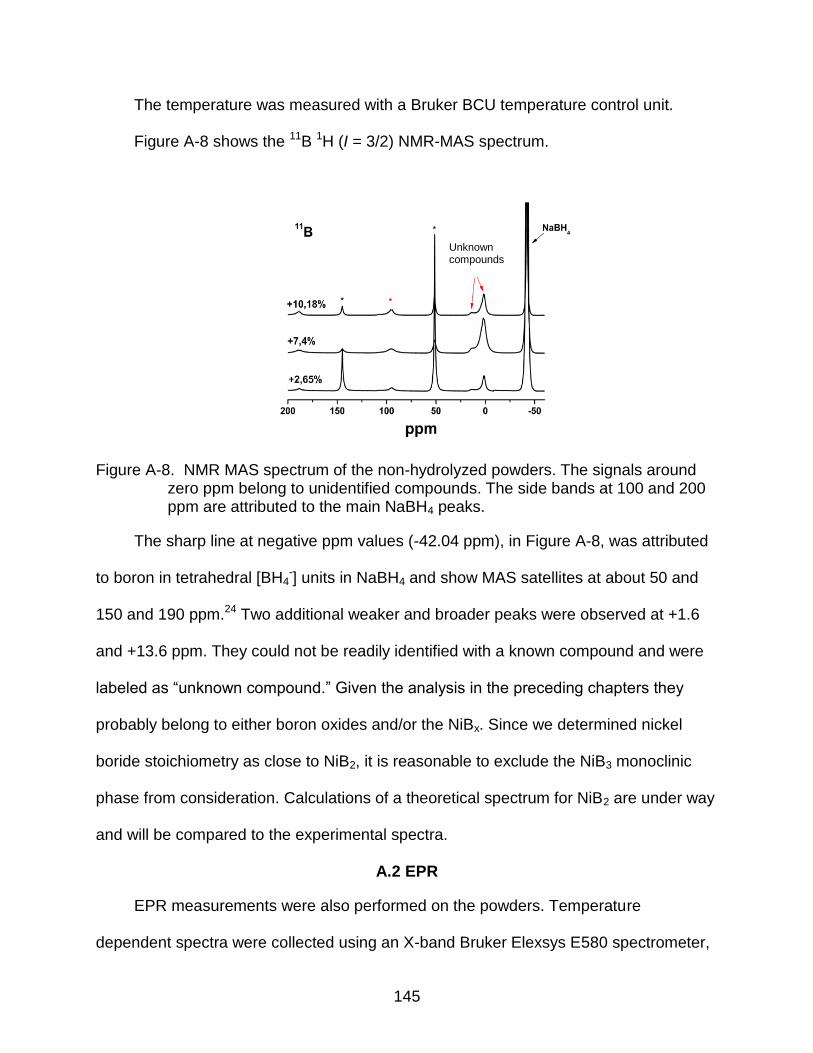
A-8 NMR MAS spectrum of the non-hydrolyzed powders. ...................................... 145
A-9 Temperature dependent EPR spectra of the non-hydrolyzed powders. ........... 147
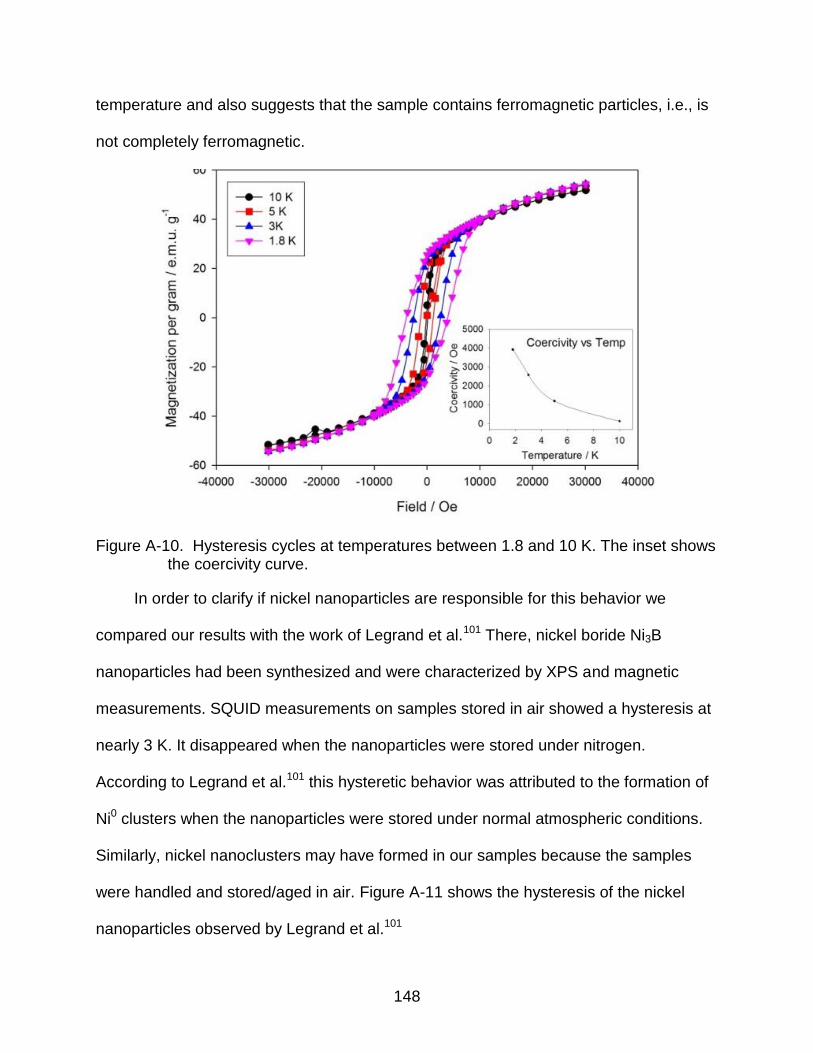
A-10 Hysteresis cycles at temperatures between 1.8 and 10 K. The inset shows the coercivity curve. .......................................................................................... 148
A-11 Hysteresis of nanoparticles stored in open air (A) and under nitrogen (B). ...... 149
13
LIST OF ABBREVIATIONS
APS Advanced Photon Source, Argonne, IL
BET Brunauer-Emmett-Teller isotherm analysis for surface area determination
𝑚 𝑚 Centered – orthorhombic cell
δiso calculated isotropic chemical shift based on the average
α-boron shielding
Molar enthalpy of formation, calculated at 0 K
DoE Department of Energy
Ea Activation Energy-Energy barrier that the system has to overcome for the chemical reaction to occur
EDXS Energy dispersion x-ray spectroscopy
EFG Electric field gradient
FCC Face centered cubic lattice
FFT Fast Fourier Transform
FT-IR Infra – Red Spectroscopy with Fourier Transform
Abstract of Thesis Presented to the Graduate School of the University of Florida in Partial Fulfillment of the
Requirements for the Degree of Master in Science
SOLID STATE SYNTHESIS OF NICKEL BORIDES AS CATALYSTS FOR HYDROGEN EVOLUTION
By
Fabrizio Guzzetta
August 2013
Chair: Alexander Angerhofer Major: Chemistry
Nickel borides have recently drawn attention for the mild conditions needed in
catalyzing the hydrolysis of alkaline solutions, with consequent hydrogen evolution.
We report a new solid state procedure, under normal laboratory conditions, which
produces amorphous nickel borides. Silica supported catalysts were also prepared,
through slight variation of such method, in an attempt to increase catalyst surface area.
Experimental techniques and theoretical predictions were performed to
characterize the products. Theoretical calculations were based on NiB3 stoichiometry.
However, to date, no experimental results confirmed the calculated structures. Thermal
analysis revealed no evidence for crystallization of the powders in the range of
temperatures surveyed (298 – 1300 K). IR spectra on the non-hydrolyzed powders
revealed few extra vibrations not seen in neat borohydride. Annealed powders exhibited
spectra that were similar to those of neat MgB2 and KBr, making assignment of
vibrational frequencies difficult.
XRD on the as-prepared powders confirmed NaBH4 and NaBr as main phases. A
crystalline pattern has been observed after annealing at 1100 K. The formation of
16
metallic Ni and NiO was also revealed, because of aging and air-exposure of the
powder.
XPS showed two B 1s peaks at ~182 and ~192 eV. The B 1s peak with a binding
energy of 182 eV and the 10 eV difference between the two peaks have not been
reported before. Nickel 2p3/2 peaks fall in the range of NiO peaks. However, XRD
revealed a predominance of Ni over NiO, complicating the explanation of the XPS
results.
Elemental analysis (ICP-AES) resulted in molar B:Ni ratio of 2.1, confirming a
boron-rich phase of these nickel borides.
TEM images revealed a regular patterning in terms of linear ridges in the material,
which may be due to residual crystallinity of the material, despite of the appearance of
an amorphous overall structure.
Catalyzed hydrolysis of sodium borohydride in alkaline solutions (pH ~14) were
performed at 30º, 40º, 60º, and 85º C. Cycling of the active materials, surface analysis
and chemical composition of the hydrolysis products were also studied. Analysis of
kinetic data yielded 88% and 77% hydrogen evolution for non-supported and supported
materials, respectively, within 20 minutes.
17
CHAPTER 1 TRANSITION METAL BORIDES AS HYDROGENATION CATALYSTS
1.1 Introduction
One of the biggest challenges encountered today in researching feasible solutions
to use hydrogen as an energy carrier is its efficient storage and release. Grochala and
Edwards pointed this out in the following terms:
The hydrogen storage and hydrogen energy challenge meets all the characteristics of the demanding 21st century: a stressfully short deadline, an incredible acceleration (there is an exponential shortening line between yesterday, today, and tomorrow), globalization: from the fuel crisis to the emergence of hydrogen consortia, and – nowadays – so much funding is provided by national research funds and private investments.
Presumably, those who do not attempt to solve the hydrogen storage problem right away will not even have chance to do it “tomorrow”. 1
In the future Hydrogen energy may have a much larger impact on society
compared to other renewable energies: differently from other sources of energy,
hydrogen, the most abundant element in the entire Universe (88.6 wt%),1 is an energy
carrier. Therefore it can be stored, distributed and used when and where it is necessary.
Energy production, by its combustion, is clean and eco–friendly because the only
product is water.
Production of hydrogen2 relies on several processes: 1) the natural gas reforming
process which uses high temperature steam to burn natural gas, which has the
disadvantage of producing non-negligible quantities of greenhouse gases. 95% of
hydrogen produced in USA is still produced by this method. 2) Renewable electrolysis
which takes advantage of electricity produced by other renewable energies such as
solar, wind, hydroelectric, tidal, etc. to split water into its components hydrogen and
oxygen. 3) Gasification of coals which involves burning of coal to produce hydrogen.
18
This is more efficient than burning coal to produce electricity, but at the same time,
produces large quantities of CO2. 4) Renewable liquid reforming processes which starts
with biomass after its conversion into bio-diesel or bio-ethanol, and uses high
temperature steam. 5) High temperature electrolysis useing nuclear plants to split water
into its components. This still remains a costly and dangerous process for the
production of hydrogen. 6) High temperature thermochemical water splitting which still is
expensive, and 7) photoelectrochemical and photobiological water splitting which with
the promise of clean H2 production and greatly diminished cost.
In the near future, the main goal is to use hydrogen as a fuel in the transportation
industry. In spite of the economic and ecological advantages offered by hydrogen use
for transportation, there are several bottlenecks that hinder its widespread use.
Compressed hydrogen gas, and liquid hydrogen (LH2) devices are currently under
study,3 but the production of highly pure hydrogen is really expensive and not practical
from an economical point of view.
The safety of these devices3 has been improved over the years. Yet, issues still
remain which need to be addressed soon to facilitate the use of gaseous or liquid
hydrogen for use in transportation.
1.1.1 Compressed Hydrogen
Compressed hydrogen gas storage devices have been recently developed by
Quantum Technologies (Figure 1-1).3
These devices are reinforced with carbon fiber to eliminate structural safety issues
such as hydrogen leaking out from the device through microscopic cracks. Some of
these devices have already been placed into service in hydrogen fueled vehicles.3
However, other issues need to be resolved. Since hydrogen is very reactive storage
19
under high pressures raises important safety concerns. Moreover, the weight of the
storage device limits its use in the automotive industry because of the need for
increased engine performance. Conformability and size of the device is another issue.
In fact, due to the stiffness of the materials used and the need for sufficient storage
capacity which increases size there are few possibilities of placing the device inside
vehicles which in turn limits the realization of prototypes. The cost of production of these
devices is also still prohibitive.3
Figure 1-1. Device for compressed hydrogen gas storage from Quantum Technologies. Reprinted from http://www1.eere.energy.gov/hydrogenandfuelcells/storage/hydrogen_storage.html
The cost of production depends mainly on the structural reinforcement carbon fiber
used in the manufacture of such light–weight devices. To overcome these issues, the
E.E.R.E. agency of the D.O.E. reports:
Two approaches are being pursued to increase the gravimetric and volumetric storage capacities of compressed gas tanks from their current levels. The first approach involves cryo-compressed tanks. This is based on the fact that, at fixed pressure and volume, gas tank volumetric capacity increases as the tank temperature decreases. Thus, by cooling a tank from room temperature to liquid nitrogen temperature (77°K), its volumetric capacity will increase by a factor of four, although system volumetric capacity will be less than this due to the increased volume required for the cooling system.
The second approach involves the development of conformable tanks. Present liquid gasoline tanks in vehicles are highly conformable in order to take maximum advantage of available vehicle space. Concepts for conformable tank structures are based on the location of structural supporting walls. Internal cellular-type load bearing structures may also be a possibility for greater degrees of conformability.3
1.1.2 Liquid Hydrogen
Due to the difficulties in overcoming the issues related to gaseous hydrogen
storage, alternatively liquid hydrogen storage (LH2) devices are also studied. Stora of
hydrogen in liquid form enhances the energy density of hydrogen. However, issues with
LH2 include the energy used for liquefaction of hydrogen; volume, weight and tank cost,
and the tendency of the fuel to boil off.3 Cryogenic temperatures required for
liquefaction of hydrogen, are an important issue in the use of LH2 devices (Figure 1-2)
since 30% of the heating value of hydrogen is required to liquefy it.
Figure 1-2. Liquid H2 (LH2) tank system. Reprinted from http://www1.eere.energy.gov/hydrogenandfuelcells/storage/hydrogen_storage.html
LH2 devices can store more hydrogen per volume than gaseous compressed
hydrogen tanks.3 Currently compressed hydrogen tanks are used in certain types of
vehicles. Hybrid tanks which couple compressed and liquid H2 are also being studied.3
However, the cryogenic temperatures needed are still a limiting factor. For this reason,
new approaches for the liquefaction of the gas with lower energy requirements are
needed.
All these difficulties combine to limit the use of gaseous and liquid hydrogen as of
now. Yet, a third and more viable way to store hydrogen is through the solid state.
1.1.3 Solid Hydrogen storage
Solid state storage is currently safer and appears technologically more
achievable.1 In this case hydrogen atoms are chemically bound in solid materials.
These materials, in principle, should reversibly desorb and absorb hydrogen gas. The
exhaust solid (i.e., the fully dehydrogenated material) must be capable of absorbing
relatively high quantities of H2 gas, in order to fully (or nearly fully) restore the original
material. Unfortunately, the lack of a universal storage/release material currently hinders
the technological development of solid hydrogen storage/release presenting a challenge
to the research community. Guidelines for solid hydrogen storage materials (HSM) have
been delineated by the Department of Energy of the US government.1 An ideal HSM
candidate must achieve the following requirements listed below:
1. High storage capacity: minimum 6.5% wt% of hydrogen abundance is required from the material.
2. Temperature of decomposition (H2 gas release) of Tdec = 60º – 120º C.
3. Reversibility of thermal adsorption/desorption cycles: low temperature of hydrogen desorption and low pressure of hydrogen adsorption are required.
4. Low cost.
5. Low toxicity and if possible a non-explosive storage medium.
22
Modern research in Chemistry and Chemical Engineering has helped push the
material limits through the synthesis of new materials4 and through the improvement of
existing ones.5 These new materials are starting to approach the minimum requirements
established by DOE, although no single material tested up to now fulfills all required
minimum limits specified by DOE. Figure 1-3 lists some of the most common hydrogen
storage materials studied and their limitations. The limits set by DOE are listed as well.
Table 1-1. Comparison of the key properties of the main (condensed–phase) hydrogen storage materials. Adapted by permission from Edwards and Grochala, Chem. Rev., 2004, 104, 1281 – 1305. Copyright (2004) ACS Journals.
Material Practical H wt%
Kinetic reversibility
Tdec/◦C Notes Criteria
met
PdH0.6 0.6 Excellent Ambient 1000$/oz 2, 3, 4 Mg2NiH4 3.6 Very good Ambient Fails to
meet criterion 1
2, 3, 4, 5
NaAlH4:TiO2 5.5 Very good 125 Fails to meet criterion 1
MeOH 12.5 Irreversible Thermal activation is difficult
Toxic liquid 1, 4
CH4 25 Irreversible Thermal activation is difficult
Gas difficult to liquefy
1, 4
DoE limit ≥6.5 Excellent Max 120 Safe, handy material
All
The main class of chemicals studied in this field is the hydride family. They are
further subdivided into two main categories: The first category comprises the materials
that are too stable, for which the adsorption of hydrogen is facile (requiring low or
moderate hydrogen pressures), but desorption is difficult (requiring higher energies).
23
The second class comprises hydrides which are too unstable and in which desorption
happens even at room (or below room) temperature and requires very high H2 gas
pressures to restore the parent hydride.1
Reversibility of hydrogenation/dehydrogenation cycles and extending the time of
turnover of such materials are the key for the development of suitable hydrogen storage
materials.1
Unfortunately, direct hydrogenation usually does not fully restore the parent HSM,
therefore the reaction products have to be “recycled.” 1
A new direction in solid hydrogen storage research addresses two important
targets: 1) to lower the energy barrier of hydrogen absorption and desorption, and 2) to
extend the lifetime of the parent hydride. Today, research is focused on heterogeneous
catalysis and trying to individuate catalyzed reactions for hydrogen evolution,6-10 or,
alternatively, catalyzing the hydrogenation of inorganic materials which can either
absorb or chemically react with intake hydrogen and to form the parent hydride to be
used as hydrogen storage material.11,12
Metal-doped sodium and lithium alanates (Na/LiALH4) were first identified by
Bogdanovic and Schwickardi as promising hydrogen storage materials.5 However, they
have lost some of their appeal in favor of borohydrides which appear to have more
potential to attain the DoE limits.6,7,10,13-20
In fact, metal borohydrides are very well known chemicals with an important role in
the chemicals market and in industry.21 The first metal borohydride to be synthesized
was LiBH4 from the reaction of ethyllithium with diborane.22
24
The most widely synthetic route to metal borohydrides is the direct combination of
the elements under high hydrogen pressure. Metal borohydrides such as LiBH4, NaBH4,
Mg(BH4)2 and Ba(BH4)2 were synthesized this way and reported in a patent by
Goerrig.23 Alternatively, metathesis reactions between lithium or sodium borohydrides
and metal salts are also widely used, especially in the synthesis of complex
borohydrides, according to the following schemes:
𝑛 ( ) 𝑛 (1-1)
𝑛 𝑎 ( ) 𝑛 𝑎 (1-2)
The attractiveness of metal borohydrides as hydrogen storage materials stems
from their high hydrogen content as seen in Table 1-2.21
Table 1-2 Hydrogen storage properties of selected high capacity hydrides, adapted from R. A. Varin, T. Czujko, Z. S. Wronski, “Nanomaterials for Solid State Hydrogen Storage,” Springer 2008. Copyright Springer (2008)
Metal Hydride Theoretical maximum gravimetric H2 capacity (wt%)
Theoretical reversible gravimetric capacity (wt%)
Approx. desorption temperature range (◦C)
Li LiBH4 18.4 ~13.8 ~470 Mg Mg(BH4)2 14.9 ~11.2 ~300 Fe Fe(BH4)3 12.1 Unknown Unknown Ca Ca(BH4)2 11.6 Unknown ~320 (?) Na NaBH4 10.6 10.6 400 – 600 Zn Zn(BH4)2 8.5 8.5 (?) 85 – 140
As a category, metal borohydrides constitute the storage materials with the highest
gravimetric hydrogen content.
Unfortunately, one of the main issues for engineering devices which use them as
hydrogen storage solids, arise from the difficulty of recovering the parent hydride once
the hydrogen has fully desorbed. In fact, reversible thermal
hydrogenation/dehydrogenation cycling in solid state metal borohydrides is not feasible
25
due to the formation of stable structures with the general formula M2B12H12 (M = Li, Na,
K).24,25 In fact, due to the formation of these stable compounds, the process will not
regenerate the initial reactants, blocking the reversibility of hydrogen cycling.
Chemical manipulation or modification of the metal borohydrides (in order to
achieve suitable implementation for hydrogen storage, as required by DOE) is complex.
Inert atmospheres are sometimes required for suitable chemical manipulation, due to
their reactivity towards oxygen and due to their hygroscopic nature.
As a result of these difficulties the hydrolysis of sodium borohydride for hydrogen
generation is currently seen as more technologically achievable,6-8,10,15,17-20,26 because
that the reaction happens in solution which makes the system easier to handle, 2) the
reaction products are non-toxic (the literature implies that the only product from the
reaction of hydrolysis is just sodium metaborate), and 3) the mild conditions used for the
reaction (generally room temperature and pressure). These benefits have led
researchers to focus on optimization of the reaction conditions for hydrogen production.
Generally, the reactions between the parent hydrides and water are exothermic, and
release very pure hydrogen gas.1 However, return of the “products” into “reactants” is
difficult and requires high energies, potentially canceling out the economic advantage of
using hydrogen as a fuel.1 Nonetheless, much research is focused on this area due to
the low cost of the starting materials, the mild reaction conditions, and the lack of toxic
byproducts.
1.1.4 Hydrolysis of Sodium Borohydride
The reaction of the hydrolysis of sodium borohydride is very well known in the
literature.
It proceeds according to Eqn. 1-3:
26
𝑎 𝑎 (1-3)
The reaction mechanism is pH sensitive, and the whole reaction is acid–catalyzed,
as demonstrated by Davis and coworkers:27,28
(1-4 a)
(1-4 b)
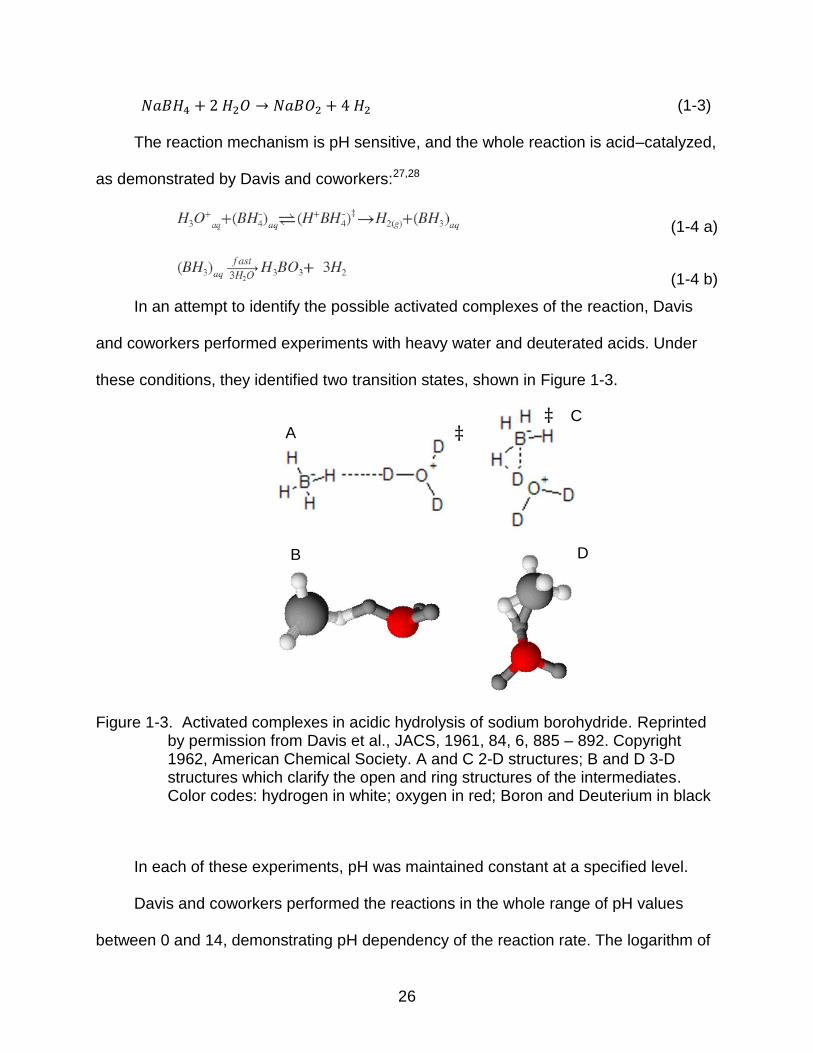
In an attempt to identify the possible activated complexes of the reaction, Davis
and coworkers performed experiments with heavy water and deuterated acids. Under
these conditions, they identified two transition states, shown in Figure 1-3.
Figure 1-3. Activated complexes in acidic hydrolysis of sodium borohydride. Reprinted by permission from Davis et al., JACS, 1961, 84, 6, 885 – 892. Copyright 1962, American Chemical Society. A and C 2-D structures; B and D 3-D structures which clarify the open and ring structures of the intermediates. Color codes: hydrogen in white; oxygen in red; Boron and Deuterium in black
In each of these experiments, pH was maintained constant at a specified level.
Davis and coworkers performed the reactions in the whole range of pH values
between 0 and 14, demonstrating pH dependency of the reaction rate. The logarithm of
A
B
C
D
27
k versus pH is linear for a large pH range between 7.5 and 12 but becomes non-linear
for very high values of pH above 12, with k showing very small values. This relationship
is presented in figure 1-4.
However, in 2009 Liu and coworkers published an extensive review in which they
pointed out the advantages and limitations of this reaction in producing hydrogen.8 The
work was intended to emphasize the engineering challenges encountered when
designing fuel cell devices based on this reaction.
In recent years most studies have focused on facilitating improvements in
hydrogen evolution.15,16,18,20,29
Figure 1-4. Log(k) versus pH plot for the hydrolysis of sodium borohydride, reprinted by permission from Davis, R. E., Kibby, C. L, and Swain, C. G., JACS Communications to the Editor, 82 (1960) 5949 – 5950. Copyright JACS (1960).
Recently, Demirci et al. summarized the state-of-the-art in this area in an
extensive review.18 Churikov et al. investigated the effect of temperature and solution
alkalinity on the rates of sodium borohydride hydrolysis.15 Matthews and Yu studied the
reaction of hydrolysis in concentrated aqueous solutions.17 Retnamma, Novais and
28
Rangel conducted a review of all available kinetic data collected for this reaction under
different reaction conditions.20 Sahin et al. studied the reaction of hydrogen production
from sodium borohydride in the presence of electric fields.16
Catalyzed reactions (in the hydrolysis of stabilized solutions of metal borohydrides)
for hydrogen evolution have also attracted interest in lowering the energy barrier for
hydrogen evolution. However, Retnamma, Novais, and Rangel pointed out that in order
to engineer suitable systems based on this reactions the catalyzed hydrolysis of sodium
borohydride is highly exothermic and therefore heat needs to be removed through an
efficient control system.20
The synthesis of the catalysts may require refluxed reaction30 (long reaction time
and many steps) before their isolation and characterization. Sometimes the synthesis
requires an inert atmosphere.31 For this reason, transition metal borides are currently
drawing more attention, since they do not require complicated, long synthetic steps.
Numerous papers6-10,26,32-41 have shown them to be efficient in the hydrogenation of
various organic molecules,9,32-36 or the dehydrogenation of sodium borohydride at very
alkaline pH (pH≥13.00).6-8,10,26,37,39-44 Nickel and cobalt, in particular, seem to show the
highest catalytic power.6,10,26,39-41
Catalyzed sodium borohydride hydrolyses have been widely studied from a kinetic
point of view. The main factors affecting the rate of the reaction are: 1) the amount of
catalyst, 2) the concentration of the sodium borohydride and ionic strength effects, 3)
the acid-base equilibrium between borate and boric acid, and 4) pH.
However, the metal catalyzed reactions are independent of the pH.20 As reported
by Retnamma, Novais, and Rangel the kinetics of this reaction has been described
29
using zero, first, and second order rate laws, other power laws, and the Langmuir-
Hinshelwood and Michaelis-Menten mechanisms as well as semi-empirical models
have been invoked to explain the behavior of the metal catalyzed sodium borohydride
hydrolysis.20
To date there is little agreement in the literature on the kinetic model for this
reaction. It is therefore difficult to determine the activation energies of the catalyzed
reactions since theoretical energies differ depending on the model used to simulate the
kinetic constants.
1.2 History of TMB and their Classification.
Metal borides have been employed in several technological applications due to
their covalent boron framework which provides them higher chemical, thermal, and
mechanical stability.45 A tentative classification of the various structures was given in
1987 by Ganem and Osby,36 which used, as classification parameters, boron content
and the presence of a boron–boron bonding framework:
Historically, borides were first produced by the combination of boron with metallic or metalloidal elements less electronegative than itself. For the most part, borides are very hard, high-melting, refractory substances whose structures and stoichiometries do not conform to the ordinary concepts of valence. Borides with low boron-to-metal ratios (M4B, M3B, M2B) contain isolated boron atoms, however as the proportion of boron increases (M3B2, M4B3, M3B4), borides with single and double chains of borons appear. Borides with formulae like MB4, MB6, and MB12 exist in three-dimensional arrays with open networks of boron atoms interpenetrating a regular metal atom lattice.
The history of metal borides is quite long since they were discovered more than a
century ago.46,47 The first experiments were performed to understand boron solubility in
metals or alloys. Clearly, at that time the goal was to obtain information for metallurgical
applications in hardening of alloys or making them more rust–resistant.
30
Nickel borides exist in a variety of stoichiometries and molar ratios such as NixB,
where x =1, 2, 3.48-50 Ni4B3, shows boron–boron chains.51,52 Species with a higher
content of boron versus metal are not known to form under mild external conditions, and
very few are reported under any condition. The only ones reported are NiB2,46,47 but
only at 1590ºC,53,54 and Ni2B3, as reported by Rundqvist.52 NiB12 is reported as nickel
intercalation into a boron lattice (Portnoi et al.55,56) and NiB~24 has also been reported
using thermal high temperature annealing of nickel and boron as nickel intercalation in a
boron lattice which remains very close to the boron lattice.57
Clearly, the stoichiometry as well as the properties of the nickel borides depends
on the synthetic method used.58
There is still a vigorous debate about the existence of NiB2 with numerous
proposed phase diagrams.53-56,59-65 However, there is no definitive proof for this
stoichiometry.
Early syntheses were performed by annealing metal salts (or oxides or simply the
element) in furnaces, with boron, above 1000ºC.46,47,51,52,66,67 Often during the synthesis
a carrier gas was used to remove gaseous byproducts or prevent oxidation in air.
Rundqvist writes about this process:
However, the composition of the boron–rich alloys did not correspond to the weighed amounts of the starting materials since varying amounts of boron were unavoidably lost during the reactions.52
In 1933 Alfred Stock from Cornell University was the first to report a wet
chemistry synthesis through the reaction of sodium borohydride and metal salts in
solution. He found a black precipitate generally called metal boride combined with the
evolution of hydrogen.13 This synthetic procedure is still the most commonly used
process in the preparation of nickel and cobalt borides. In 1953 H. Schlesinger and
31
coworkers noticed that embedding 5 wt% of Co(II) salt in a matrix of borohydride and
pressing the mixture into a pellet facilitated the evolution of hydrogen under application
of an external electric field.14 In the 1990s an Italian group at the University of Cagliari
discovered that the milling of elemental nickel and boron formed big clusters of nickel
borides whose stoichiometry was determined in atom-% as Ni80B20 or Ni60B40.68 In 2011
an Iranian group followed up on this study, establishing milling time–dependent phase
transitions and discovering that annealing these clusters to a predetermined
temperature transformed them into Ni3B (at 350ºC) or Ni2B (at 700ºC).69 Portehault et
al. recently reported a synthesis under moderate conditions in a crucible heated
between 500º and 900ºC using an eutectic molten LiCl:KCl mixture as the solvent.
Calcium and niobium salts were co-dissolved with sodium borohydride and reduced to
form nanocrystalline high–boron content metal borides.45 The main disadvantage of this
method is the isolation of the powders, because an excess of sodium borohydride, after
hydrolysis, form a coating composed of amorphous boron oxide which makes difficult
the isolation of the nickel borides alone. Chemical characterization has been
complicated by the fact that mild synthetic conditions coupled with a wet chemistry
approach normally give amorphous products that are difficult to characterize. However,
Albert and coworkers were able to form crystalline Ni2B using wet chemistry.49 In many
cases a deeper understanding of these structures is only possible when referenced to
similar crystalline materials, or through calculations.70-73 High temperature synthetic
approaches normally form crystalline compounds aiding structure determination.
Kiessling synthesized a massive number of crystalline metal borides and used X-ray
crystallography to characterize the products;66,67 Rundqvist focused on the synthesis
32
and X-ray characterization of orthorhombic and monoclinic Ni4B3.51,52 However, these
syntheses usually produce nickel-rich phases, even though NiB2 has been reported.
(ref. Howe). Physico-chemical properties of many of these crystalline materials have
also been determined.63,74 Molvinger and coworkers, instead, reported the synthesis of
NiB2 from dry THF solutions and its use as hydrogenation catalyst of organic
molecules.75-77 In 2001, they reported the synthesis of various metal boride catalysts
with a 1:2 metal to boron composition, except for Fe/B which resulted in a 1:1.8
stoichiometry. The synthesis of boron–rich phases, with boron to nickel ratio >2, under
mild to medium external conditions is still untested territory.
1.3 Metal Borides as Hydrogenation Catalysts
Research on the catalytic properties of metal borides has matured in the last 60
years. Buisson, Paul, and Joseph were among the first to report kinetic studies of
hydrogen evolution from nickel boride, i.e., catalyzed reactions from stabilized sodium
borohydride solutions.34 They compared the results coming from these compounds to
various other nickel–based catalysts. The results showed that nickel borides presented
almost the same activation energies as Raney nickel.34
In 1970, Brown33 reported the activity of nickel boride catalysts prepared with wet
chemistry procedures, called P–1 and P–2. P–1 refers to the product coming from the
reaction performed in water solutions, while P–2 refers to the same product coming
from the reaction performed in ethanol solutions. Generally speaking, the notation P–1
(water) and P–2 (ethanol) has been maintained for all the reaction performed under wet
chemistry. Sometimes non-integer numbers were used to index mixtures of water and
ethanol (with different compositions) that were used as solvents. 50Reaction products
looked very different depending on the procedure used. Water-based reactions gave a
33
finely grained black precipitate, while ethanol solutions yielded colloidal black
suspensions. These compounds, once isolated and properly characterized, were used
to hydrogenate unsaturated organic molecules. The ethanol-prepared catalyst turned
out to be more sensitive to double bonds than the one prepared in water. In 1982,
Collins and coworkers described the hydrogenation of nitrobenzene over a nickel boride
catalyst, claiming that the reaction “does not produce appreciable concentration of
reaction intermediates during the liquid phase hydrogenation of nitrobenzene.” 35
Ganem and Osby extensively studied several metal borides and aluminides, as
catalysts for a variety of organic hydrogenations. They described various syntheses of
TMB and transition metal aluminides, which were used successively as catalysts for
hydrogenation of organic compounds, namely unsaturated compounds.36
Skrabalak and coworkers, in 2006, explored the possibility of metal boride
intervention in catalyzing contemporarily hydrogenation and desulphurization reactions,
using thiophene as substrate, comparing the final products with standard polysulfides of
nickel and cobalt and proving the formation of organic residues with four carbon
atoms.38
Li and coworkers used nickel borides to hydrogenate acetonitrile to ethylamine.
Nickel borides led to the formation of several polyamines with a predominant formation
of primary amines. However, due to poor selectivity of the catalysts, the formation of
secondary amines could not be avoided.39,40
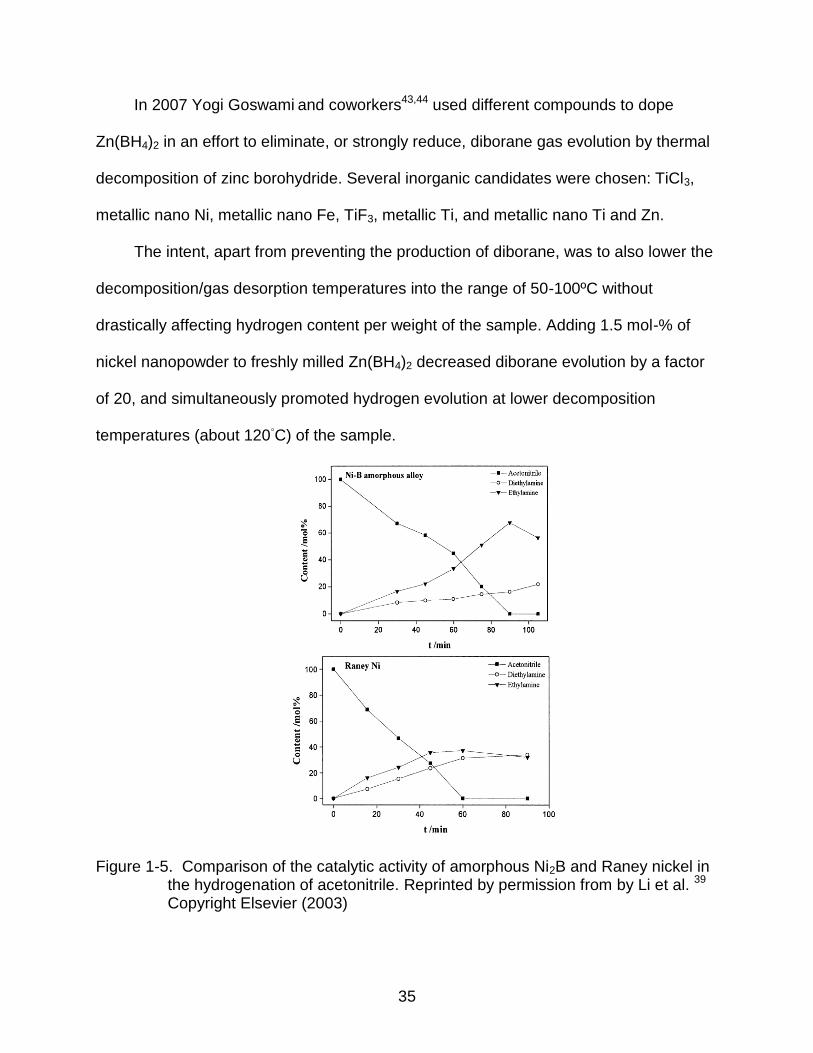
The reactivity and selectivity of the nickel boride yields primarily diethylamine,
while the Raney nickel shows comparable quantities of both of the ethylamine and
diethylamine, as shown in figure 1-5.
34
The catalytic activity of nickel borides with higher boron content has not been
reported yet. However, in 2002 Hanxi6 described the use of a NixB catalyst that was
formed when nickel salts were mixed with an alkaline solution of sodium borohydride.
The content of nickel was 4 to 5 times that of boron. Hydrogen evolution kinetics were
measured under various conditions, and the effect of sodium hydroxide concentration
was examined.
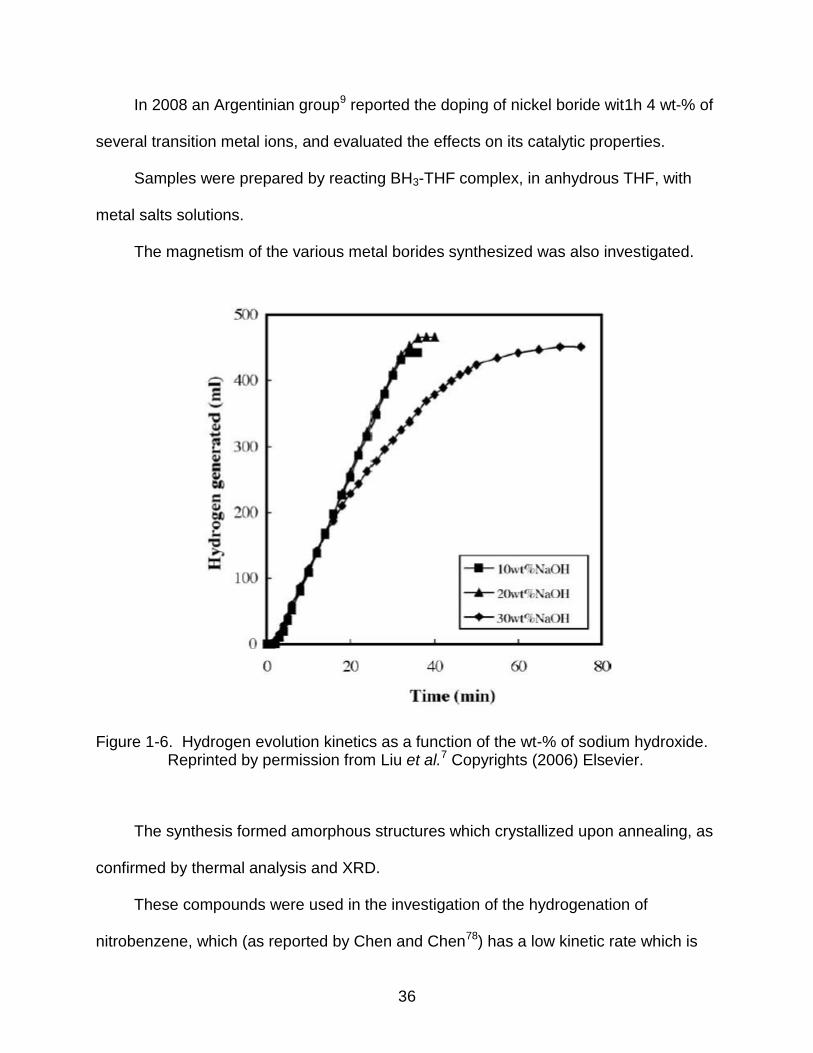
Liu7 studied the kinetics of hydrogen evolution from alkaline solutions of sodium
borohydride in the presence of metallic salts, namely Ni2+ and Co2+ ions, at various
temperatures. The investigation included the role of the salts as well as Ni2B and Co2B,
Raney Ni and Co, and a Raney mixtures of Ni and Co. Kinetic experiments showed the
rates depended among other factors on catalyst performance, the concentration of
NaBH4, (which slightly affected the hydrogen generation rate), and the concentration of
NaOH. Increasing the concentration of NaOH beyond a threshold of 20 wt% decreased
the production of hydrogen.
In Figure 1-6 the kinetics of hydrogen evolution as a function of NaOH wt-% is
shown.
Studies showed nickel nanopowder is able to strongly diminish diborane evolution
and to promote hydrogen evolution from Zn(BH4)2.43,44 In 2006, a Korean group was
able to synthesize Zn(BH4)2 through ball milling and used thermal analysis to
decompose the compound.42 The study revealed high quantities of B2H6 in the
decomposition products, making them unsuitable for HSM.42 Since Zn2+ is a closed shell
d10 ion, and BH4‾ a reductant, upon thermal decomposition, the system responded by
producing diborane gas rather than hydrogen, and failed to reduce the metal centers.
35
In 2007 Yogi Goswami and coworkers43,44 used different compounds to dope
Zn(BH4)2 in an effort to eliminate, or strongly reduce, diborane gas evolution by thermal
decomposition of zinc borohydride. Several inorganic candidates were chosen: TiCl3,
metallic nano Ni, metallic nano Fe, TiF3, metallic Ti, and metallic nano Ti and Zn.
The intent, apart from preventing the production of diborane, was to also lower the
decomposition/gas desorption temperatures into the range of 50-100ºC without
drastically affecting hydrogen content per weight of the sample. Adding 1.5 mol-% of
nickel nanopowder to freshly milled Zn(BH4)2 decreased diborane evolution by a factor
of 20, and simultaneously promoted hydrogen evolution at lower decomposition
temperatures (about 120◦C) of the sample.
Figure 1-5. Comparison of the catalytic activity of amorphous Ni2B and Raney nickel in the hydrogenation of acetonitrile. Reprinted by permission from by Li et al. 39 Copyright Elsevier (2003)
36
In 2008 an Argentinian group9 reported the doping of nickel boride wit1h 4 wt-% of
several transition metal ions, and evaluated the effects on its catalytic properties.
Samples were prepared by reacting BH3-THF complex, in anhydrous THF, with
metal salts solutions.
The magnetism of the various metal borides synthesized was also investigated.
Figure 1-6. Hydrogen evolution kinetics as a function of the wt-% of sodium hydroxide. Reprinted by permission from Liu et al.7 Copyrights (2006) Elsevier.
The synthesis formed amorphous structures which crystallized upon annealing, as
confirmed by thermal analysis and XRD.
These compounds were used in the investigation of the hydrogenation of
nitrobenzene, which (as reported by Chen and Chen78) has a low kinetic rate which is
37
1st order in nickel boride and 0th order in nitrobenzene. Acosta et al described that “the
metal dopants act as ions which improve the polarization of the group that needs to be
reduced” (which in this case was the nitro group in nitrobenzene).9
In 2005, Liaw et al.37 used polymer stabilized nickel boride as a catalyst. Hung et
al.10 used Ru-based catalysts and investigated the kinetics of hydrogen evolution from
sodium borohydride.
In view of these reports, there are several questions that need to be addressed:
1. Are nickel borides true catalysts? This does not seem to be the case. In fact, alkaline solutions of sodium borohydride will not release hydrogen without reacting with the ion salts in solution, reducing the metals, and forming nickel borides. Nickel borides as catalysts are not usually analyzed after the reaction to determine if the molar ratio of the elements is unchanged. Li and coworkers39 also showed that the catalyst, upon thermal annealing, crystallizes out metallic nickel clusters, showing that boron was oxidized even in inert N2 atmosphere.
2. What are the reaction products from the hydrolysis? The literature is silent on the analysis of the products from catalyzed reactions: it implies that the products of reaction are NaBO2 and H2. However, a rigorous chemical and elemental analysis still has to be performed.
3. What is the mechanism of the reaction? A mechanism for the reaction still has to be described.
4. How much does the surface of the supported catalysts change upon cycling? Surface degradation is one of the issues that need to be solved especially since the shock provoked by the hydrogen evolution may degrade the surface so quickly that the recovery of the whole catalyst is impossible (Li et al.40)
The aim of this thesis, besides the synthesis of boron-rich metal borides under
mild conditions, is to address some of the open questions.
However, independently from the synthetic method chosen for these materials, it is
very difficult to obtain nickel borides with high purity. In fact, the most common methods
of synthesis form products which are completely covered by an amorphous boron oxide
layer. The literature is silent on the effects that sodium borates or boron oxides might
38
have on hydrogen evolution from alkaline sodium borohydride solutions. Therefore, the
role of the boron oxide matrix in such reactions is still uncertain. However, despite all of
this, kinetic tests have already been performed using various catalysts in catalyzing
hydrogen evolution from highly alkaline solution of sodium borohydride.6,10,20,79 A
reaction mechanism for the catalyzed hydrogen evolution from sodium borohydride has
not yet been proposed and goes beyond the scope of this work. However, catalytic
cycles and kinetic studies are still missing on boron-rich nickel borides. They are
needed in order to understand the reactivity and/or catalytic activity of the synthesized
compounds, to establish reaction rates and to determine activation energies. In fact, the
literature reports only on nickel-rich phases for the nickel borides used in catalysis.6,33-
35,39,40,50,80 There are a few reports on the use of NiB2 as a hydrogenation catalyst.75-77
However, it is important to understand if nickel borides with boron rich phases are
equally capable to catalyze the hydrogenation of reducible organic groups, or,
alternatively, when alkaline solutions of sodium borohydride are used for hydrogen
evolution.
39
CHAPTER 2 SYNTHESIS AND CHARACTERIZATION OF NIBX
2.1 Synthesis of NiBx
Sample preparation was performed with solid state reactions between NiBr2 and
NaBH4 under laboratory conditions.
The chemical equation governing these reaction is:81
𝑎 𝑎 (2-1)
According to this equation the stoichiometric content of boron versus nickel must
be B/Ni 2 in order to obtain boron-rich nickel borides.
According to Varin, et al. the milling of ions such as Mg(II) or Zn(II) with sodium
borohydride leads to the formation of complex borohydrides through a metathesis
reaction, since the reducing BH4 units are not strong enough to reduce Mg(II) and Zn(II)
to the respective metal (or metal borides) forms:21
𝑛 𝑎 ( ) 𝑛 𝑎 (2-2)
We assume that the formation of NiBx passes through an initial, relatively slow
formation of complex borohydrides, such as Ni(BH4)x, which successively decays into
NiBx and H2, according to the general chemical equation:
( ) (2-3)
Since Ni is often found in its +2 oxidation state, our initial hypothesis was that the
reaction would proceed as follows yielding a 2:1 ratio of B:Ni in the final product:
( ) (2-4)
We chose this synthetic procedure because: 1) it is inexpensive, 2) we expect
higher boron content at room or slightly elevated temperatures (due to higher local
availability of boron than in solution) and 3) ease of handling (it does not require
40
manipulation of the reactants, a lot of time, and/or sophisticated equipment for the
synthesis or synthetic skills because the powders are used as received). This procedure
involves only a few simple steps: milling of the reactants and isolation of the product
through washing out the water-soluble by–products and hydrolysis of excess NaBH4.
Initially we tested the reaction by varying the relative nickel concentration. 2.5, 5,
7.5 and 10 mol-% nickel in the form of NiBr2 was added to a constant amount of NaBH4
(10 mmol). The reactants come in powdered form and were purchased from Acros
Organics and used as received. The powders were quickly –weighed on a micro-g scale
under normal atmospheric conditions and put in a clean 25 mL 3-neck round bottom
flask and a magnetic stir bar added. The experimental apparatus is shown in figure 2-1.
Figure 2-1. Schematic of the gas collection system. A neck of the flask is connected with the gas collecting system, which is immersed in water. The other two necks (even if in the figure there are only 2 shown) are closed up after the reactants were inserted in the flask. Lastly the water can wash the product.
In our experimental work we could not find evidence for the release of diborane
(B2H6) from the reaction mixture. It was therefore assumed that only molecular
hydrogen was released as a gas from the reaction.81
Gas colle
Water bath
41
The flask and the stirrer dimensions were carefully chosen to ensure efficient
milling on the spherical wall of the glass vessel. After the powders were placed into the
vessel, two necks were sealed with rubber septa and a third one was connected to a
home–made water–filled Torricellian barometer to observe the expected H2 gas
evolution.
Anhydrous pentane or tetrahydrofuran was added to the flask as a dispersing
medium in the early syntheses. Neither of these solvents is able to dissolve reactants or
products.
The latter syntheses were performed without any organic dispersing medium,
since the instrumental analyses performed on the products, prepared in presence or
absence of a dispersing medium, did not show any appreciable difference on the
structure and composition. However, Molvinger et al. reported a similar synthesis of
nickel borides, under wet conditions and in non-aqueous media. 77 The composition of
the products was determined to be one mole of nickel for two moles of boron, in
agreement with the foreseen composition of our products.
Furthermore, the presence of organic residues could have altered the composition
of the compounds, and therefore the instrumental results. The powders were mixed with
the magnetic stirrer set at high speed and allowed to react for approximately 1 to 2
minutes, except for the reaction that contained 10 mol-% nickel bromide which never
reached completion even after waiting for 10 minutes. During the reaction, the
reactants’ color gradually changed from initially orange and white into brown, then grey,
deep gray, and finally black. Isolation of the reaction products was done by filtration.
Removal of residual organic solvent adsorbed on the powders was performed by
42
washing three times with ethyl ether. Finally, the powders were dried under partial
vacuum.
Successive attempts to improve the initial synthesis were performed as follows:
1. Solvent–less reaction
2. A constant value of 5 mol-% of NiBr2 was added to a constant value of 10 mmol NaBH4, thus ensuring complete mixing and optimal nickel content.
Reaction products were freed from the matrix through dissolution of the by–
product NaBr and hydrolysis of excess NaBH4 upon water injection.
Isolation of the products was performed through centrifugation on COSTAR spin –
X filters, and drying in an oven at 150º C for several hours.
After hydrolysis and isolation at room temperature the powders were found to be
amorphous. They were also found to be insoluble in anhydrous THF and pentane.
Therefore, crystallization by reprecipitation methods could not be performed. An attempt
to crystallize the material was performed by annealing it at higher temperatures of 500
and 830ºC for 1 and 5 h under argon (99.9% purity) flow. The inert argon atmosphere
was maintained throughout the whole annealing cycle starting half an hour before the
powders were heated and stopping half an hour after cool-down. Annealing experiments
were performed on powders generated from a 5 mol-% starting nickel value only to
ensure an optimal nickel and boron mixing. In fact, 7.5 mol-% was not always mixing
properly, and no reasons were found for this behavior and the 10 mol-% was not
completely mixing at all under the condition provided.
In order to increase the catalyst surface area, SiO2 was chosen as a solid support
for the catalyst since it is a cheap and inert oxide and also because it is used
extensively in the literature to increase the surface area of many catalysts.32,37,41,45 For
43
example, Acosta et al reported that the in situ prepared Ni3B:SiO2 supported catalyst
presented a surface area of 243 m2g-1.32 To prepare supported nickel borides we used
SiO2 gel according to the following procedure. The silica was introduced to the reaction
mixture just before adding the water used to perform the hydrolysis of the sodium
borohydride matrix. The system was maintained under high speed stirring until the
hydrogen evolution ceased.
Reaction products were characterized using several techniques in order to
determine the composition and structure: FT–IR; XRD, both in-house and at the
Advanced Photon Source (APS) at Argonne National Laboratory, Argonne/IL, using the
beamline 11-BM; TGA/DSC up to 1300 K, XPS, TEM and EDXS, SEM and EDS. The
experimental studies were augmented by DFT calculations performed by Dr. Caputo
initially at the EMPA in Dübendorf, Switzerland and later at the ETH in Zürich,
Switzerland.
2.2 Theoretical calculations
DFT calculations were performed with two goals in mind: 1) to simulate and
optimize chemical structures of nickel borides for which no crystal structures had been
observed before which was necessary to compare to the observed XRD spectra, and 2)
to obtain their phonon dispersion curves allowing the simulation of IR spectra.
Moreover, all possible nickel-rich structures such as Ni3B, Ni2B, and NiB were both
calculated and compared with experimental results from literature to validate the
calculations results, i.e. compare output from the calculations with data that were
already published, analyze theoretical results and quantify discrepancies between the
experimental and theoretical data and operate the same routine to the NiB3
system.55,56,60,62-64,74 Calculated structures of boron-rich nickel borides could not be
44
found in the literature. Our efforts initially focused on NiB3 which was chosen due to
analogies with the NiAl3 orthorhombic (𝑃𝑛𝑚𝑎) system.72,82,83
To reduce the number of possible structures that needed to be calculated we
eliminated all ternary alloys (Ni, B, H), and binary alloys (Ni, H), (B, H), (Na, H) that may
form under normal laboratory conditions due to lack of our experimental evidence.81
The monoclinic 𝑃 and 𝑃 structures and the orthorhombic structure lattices
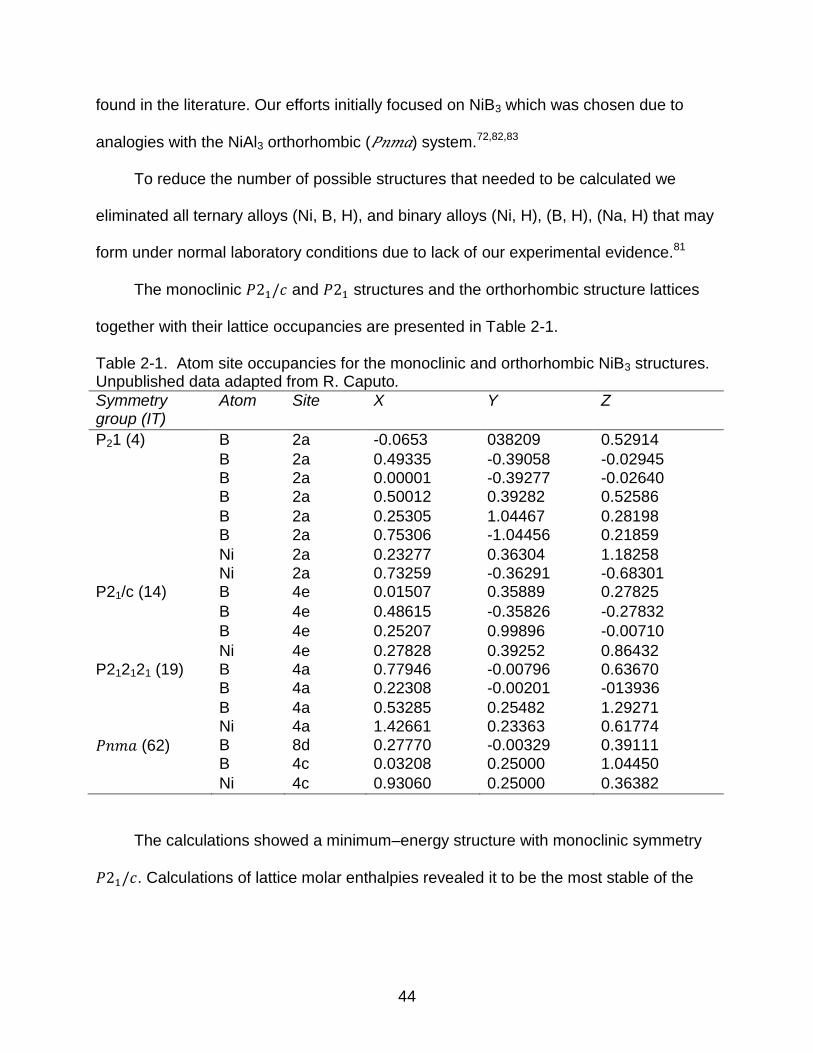
together with their lattice occupancies are presented in Table 2-1.
Table 2-1. Atom site occupancies for the monoclinic and orthorhombic NiB3 structures. Unpublished data adapted from R. Caputo.
Symmetry group (IT)
Atom Site X Y Z
P21 (4) B 2a -0.0653 038209 0.52914
B 2a 0.49335 -0.39058 -0.02945 B 2a 0.00001 -0.39277 -0.02640 B 2a 0.50012 0.39282 0.52586
B 2a 0.25305 1.04467 0.28198 B 2a 0.75306 -1.04456 0.21859
Ni 2a 0.23277 0.36304 1.18258 Ni 2a 0.73259 -0.36291 -0.68301 P21/c (14) B 4e 0.01507 0.35889 0.27825
B 4e 0.48615 -0.35826 -0.27832
B 4e 0.25207 0.99896 -0.00710
Ni 4e 0.27828 0.39252 0.86432 P212121 (19) B 4a 0.77946 -0.00796 0.63670 B 4a 0.22308 -0.00201 -013936
B 4a 0.53285 0.25482 1.29271 Ni 4a 1.42661 0.23363 0.61774
𝑃𝑛𝑚𝑎 (62) B 8d 0.27770 -0.00329 0.39111 B 4c 0.03208 0.25000 1.04450
Ni 4c 0.93060 0.25000 0.36382
The calculations showed a minimum–energy structure with monoclinic symmetry
𝑃 . Calculations of lattice molar enthalpies revealed it to be the most stable of the
45
calculated structures. Other geometries were also calculated: a monoclinic 𝑃 and two
orthorhombic structures with space groups 𝑃 and 𝑃𝑛𝑚𝑎.
The main difference between these structures relies on the out–of–plane and in–
plane bonding of the boron atoms, respectively. Moreover, the orthorhombic 𝑃𝑛𝑚𝑎
space group shows slight analogies with th NiAl3 alloy of the same symmetry.72,82,83 In
this structure, the boron atoms arrange to form contiguous heptagons in which the
central atom is shifted out of the plane (Figure 2-2 a and b).
The calculated orthorhombic structures are very similar to each other. The 𝑃𝑛𝑚𝑎
space group showed the lowest calculated enthalpy making it the most stable one.
However, the 𝑃 symmetry is only 1.32 meV per formula unit higher in energy and
the calculated lattice constants differed by less than 1 mÅ which was the convergence
limit of the calculation.
Figure 2-2. 𝑃𝑛𝑚𝑎 crystal structure of NiB3 a) one of the boron clusters is depicted in violet, the nickel atoms in blue, and the other boron clusters in pink; b) structure with the Bragg planes. Inset: simple orthorhombic unit cell from http://it.wikipedia.org/wiki/File:Orthorhombic.png
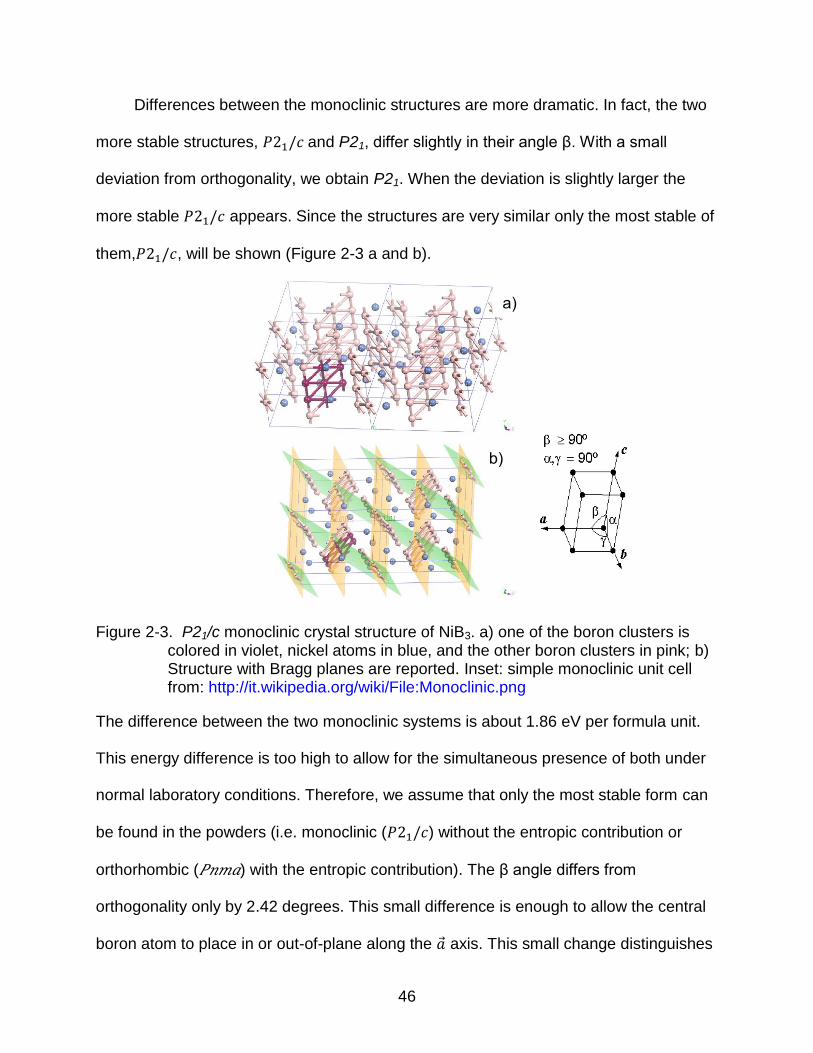
Differences between the monoclinic structures are more dramatic. In fact, the two
more stable structures, 𝑃 and P21, differ slightly in their angle β. With a small
deviation from orthogonality, we obtain P21. When the deviation is slightly larger the
more stable 𝑃 appears. Since the structures are very similar only the most stable of
them,𝑃 , will be shown (Figure 2-3 a and b).
Figure 2-3. P21/c monoclinic crystal structure of NiB3. a) one of the boron clusters is colored in violet, nickel atoms in blue, and the other boron clusters in pink; b) Structure with Bragg planes are reported. Inset: simple monoclinic unit cell from: http://it.wikipedia.org/wiki/File:Monoclinic.png
The difference between the two monoclinic systems is about 1.86 eV per formula unit.
This energy difference is too high to allow for the simultaneous presence of both under
normal laboratory conditions. Therefore, we assume that only the most stable form can
be found in the powders (i.e. monoclinic (𝑃 ) without the entropic contribution or
orthorhombic (𝑃𝑛𝑚𝑎) with the entropic contribution). The β angle differs from
orthogonality only by 2.42 degrees. This small difference is enough to allow the central
boron atom to place in or out-of-plane along the �� axis. This small change distinguishes
The space groups for the various structures given in the Table 2-2 are the most stable
for the given compounds. The calculated values can be compared with published
reports.55,56,60,62-64,74 An enthalpic correction factor must be calculated to account for the
difference in temperature between synthetic conditions (normal laboratory conditions)
and calculations (0 K).
( ) ( ) ∫
(2-3)
The most stable monoclinic and orthorhombic structures differ in the displacement
of just one atom. However this small difference in structure causes a big difference in
the calculated heats of formation. For the orthorhombic 𝑃𝑛𝑚𝑎 space group, the heat of
48
formation is +46.156 KJ/mol, at P = 0 atm and T = 0 K. Therefore, its formation is
possible only if driven by an entropic contribution.
To determine the entropic contribution to the lattice stability we calculated the
entropies of the two lattices to temperatures up to 1000 K, using the standard definition:
( ) ∫
(2-4)
The Gibbs free energy of the orthorhombic (𝑃𝑛𝑚𝑎) structure yielded slightly more
negative results than the corresponding value of the monoclinic (𝑃 ) structure while
increasing the temperature, indicating that temperature and entropy substantially
contribute to the stabilization of the orthorhombic structure. To validate the calculation
on the boron-rich NiB3 structures, the known nickel boride NiB structure was chosen.
Since NiB structure has already been published, experimental values on heats of
formation and on the entropic contribution, as well as the phase diagram of the NiB can
be found.74,84 These experimental data can be used as benchmark with our theoretical
calculations. The validation of the method comes from the agreement between
calculated and experimental values. Once the method is validated, we are sure that our
calculations on the boron-rich phases NiB3 are accurate, and therefore, if experimentally
found, these theoretical data can be used to compare experimental findings.
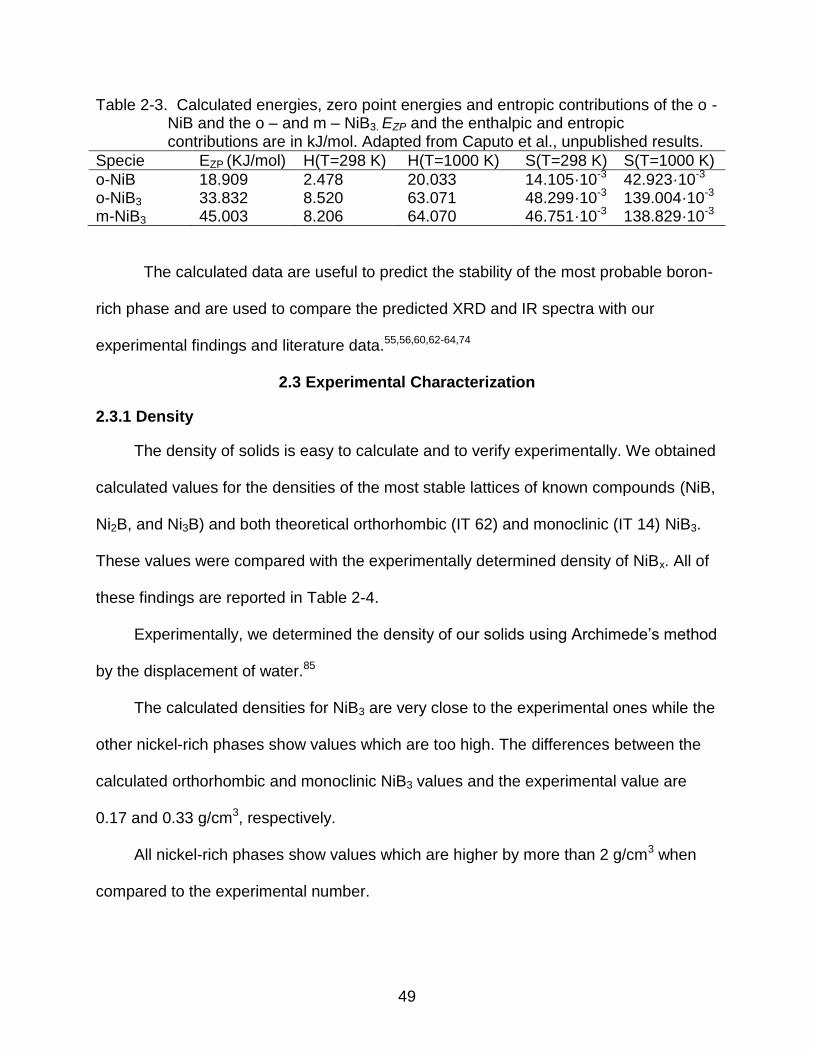
The comparison between the monoclinic (𝑃 ) and orthorhombic (𝑃𝑛𝑚𝑎)
structures is shown in Table 2-3. The Table 2-3 lists the total electronic energy E, the
zero-point energy EZP and the enthalpic and entropic contributions to the Gibbs energy.
The lattice contribution to Cp is calculated by numerical integration over the
wavenumbers of the phonon dispersion curve.
49
Table 2-3. Calculated energies, zero point energies and entropic contributions of the o - NiB and the o – and m – NiB3. EZP and the enthalpic and entropic contributions are in kJ/mol. Adapted from Caputo et al., unpublished results.
The calculated data are useful to predict the stability of the most probable boron-
rich phase and are used to compare the predicted XRD and IR spectra with our
experimental findings and literature data.55,56,60,62-64,74
2.3 Experimental Characterization
2.3.1 Density
The density of solids is easy to calculate and to verify experimentally. We obtained
calculated values for the densities of the most stable lattices of known compounds (NiB,
Ni2B, and Ni3B) and both theoretical orthorhombic (IT 62) and monoclinic (IT 14) NiB3.
These values were compared with the experimentally determined density of NiBx. All of
these findings are reported in Table 2-4.
Experimentally, we determined the density of our solids using Archimede’s method
by the displacement of water.85
The calculated densities for NiB3 are very close to the experimental ones while the
other nickel-rich phases show values which are too high. The differences between the
calculated orthorhombic and monoclinic NiB3 values and the experimental value are
0.17 and 0.33 g/cm3, respectively.
All nickel-rich phases show values which are higher by more than 2 g/cm3 when
compared to the experimental number.
50
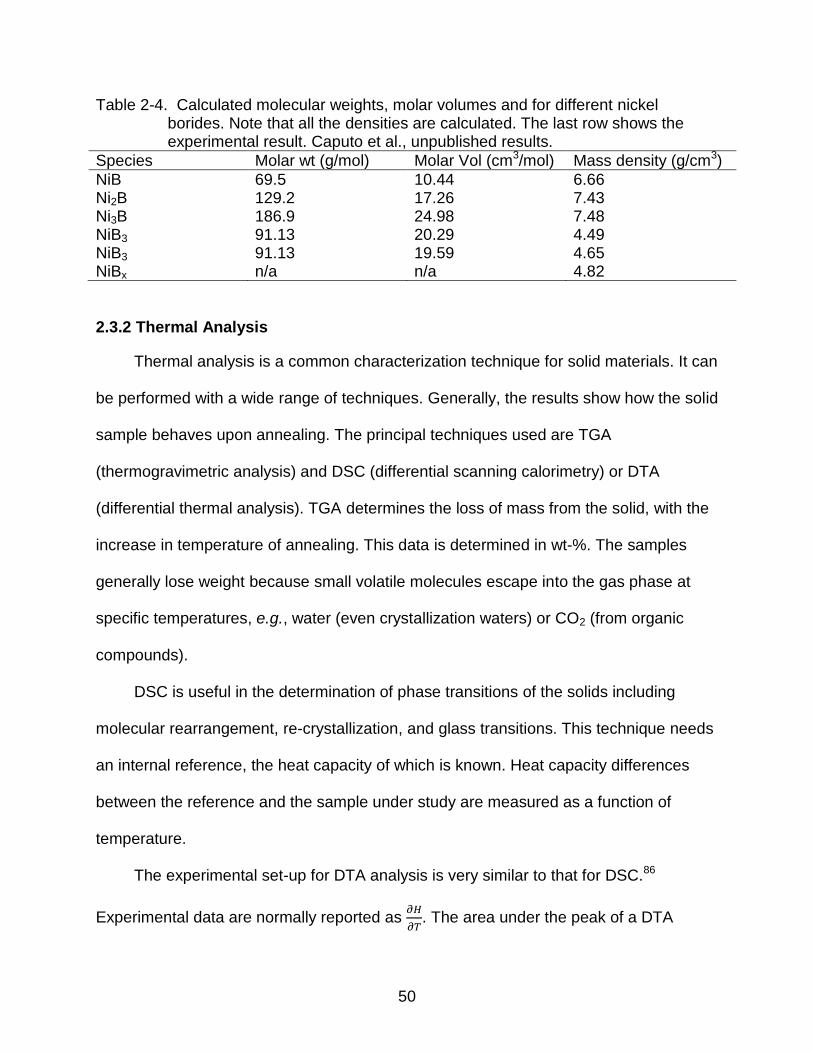
Table 2-4. Calculated molecular weights, molar volumes and for different nickel borides. Note that all the densities are calculated. The last row shows the experimental result. Caputo et al., unpublished results.
Species Molar wt (g/mol) Molar Vol (cm3/mol) Mass density (g/cm3)
Thermal analysis is a common characterization technique for solid materials. It can
be performed with a wide range of techniques. Generally, the results show how the solid
sample behaves upon annealing. The principal techniques used are TGA
(thermogravimetric analysis) and DSC (differential scanning calorimetry) or DTA
(differential thermal analysis). TGA determines the loss of mass from the solid, with the
increase in temperature of annealing. This data is determined in wt-%. The samples
generally lose weight because small volatile molecules escape into the gas phase at
specific temperatures, e.g., water (even crystallization waters) or CO2 (from organic
compounds).
DSC is useful in the determination of phase transitions of the solids including
molecular rearrangement, re-crystallization, and glass transitions. This technique needs
an internal reference, the heat capacity of which is known. Heat capacity differences
between the reference and the sample under study are measured as a function of
temperature.
The experimental set-up for DTA analysis is very similar to that for DSC.86
Experimental data are normally reported as
. The area under the peak of a DTA
51
thermogram represents the ΔH for a particular transition.87 Reporting experimental DSC
data in derivative form is generally accepted because it helps in determining the heats
of crystallization or the ΔH of the transition.39
Interpretation of the data obtained through thermal analyses alone is not
straightforward without prior knowledge about the material or the availability of
reference data to similar related compounds. However, these experiments are
extremely important because they show at which temperatures certain transformations
occur. Thermal analyses, furthermore, can reveal if a particular transition is exothermic
or endothermic, which can be seen by the sign of the DSC or DTA peak.
The following describes experimental thermal analysis of our NiBx samples.
NiBx is insoluble in water or any other organic solvent (anhydrous THF and
pentane) and therefore cannot be crystallized by re-precipitation methods. Thermal
analysis can detect physical changes and structural rearrangements upon annealing of
the solid compound, if they fall in the range of temperatures surveyed by the instrument.
Thermal analysis was performed using a TA SDT Q600, dual DSC and TGA,
Version 20.5, Build 15 from the series instrument (courtesy of Dr. Miller at the Dept. of
Chemistry, University of Florida).
This instrument allowed us to simultaneously perform both DSC and TGA
experiments in which the instrument is equipped with a microbalance and a furnace that
ramps up to 1300ºC. DSC curves are referenced to dry (99.9%) N2 gas. The results are
presented in Figures 2-4, 2-5, and 2-6, in differential form,
for easier comparison with
literature data.39
52
The thermograms (Figures 2-4, 2-5, and 2-6, and see end Paragraph 2.3.2) show
two regions of interest: The DSC profile shows a broad transition (around 650 K) and
another one around 1100 K. Other features are also visible, but due to the small change
in energy these features are difficult to interpret or analyze experimentally. Water loss is
shown at 323 K or slightly below or above, depending on the system under study.
Analogous results were found for 1:10 (wt) silica-supported powders. Both NiBx
thermograms were compared to silica alone, to understand the thermal effect(s) of
supporting the NiBx material.
The thermogram of silica gel alone (Figure 2-5) shows only a few regions of
interest. Feature #1 is common to all thermograms and is clearly due to water loss
somewhere around 323 – 373 K. Feature #3 is a slow transformation over a wide range
of temperatures between 800 and 1200 K. The basis for this transformation is not clear.
Undoubtedly, this thermal behavior reflects a change in the supported powders.
Feature #2, a broad peak seen around 650 K in the unsupported powders in fig. 2-4,
appears shifted to higher temperatures (around 900 K) in the silica-supported material.
In a similar way feature #3 around 1000 K in Figure 2-4 is shifted to somewhat higher
temperature (around 1100 K) as well. Additional features in the supported materials
appear at 650 and 1150 K. They are not seen in the unsupported catalyst either
because they may be hidden by other features there, or simply don’t exist. They are
difficult to interpret because of the limited intensity (energy change) at various
temperatures which are closer to each other, and therefore they change accordingly to
the temperature chosen.
53
Figure 2-4. TGA/DSC graph of the 5 mol-% Nickel Bromide in NaBH4 after hydrolysis 1) Water loss; 2) the broad peak position and 3) unexplained feature
1
2
3
1
2
3
54
Figure 2-5. SiO2 gel thermogram: 1) water loss peak. 2) and 3) unassigned transformation(s).
1
2
3
1
2
3
55
Figure 2-6. NiBx:SiO2 (1:10 wt) supported catalyst thermogram. 1) Water loss; 2) the broad peak is found above 800 K; 3) the rearrangement at 1100 K shows larger energy variation; 4) very weak feature due to SiO2 (compare with figure 2-6); 5) and 6) unassigned transformations.
1
2
3
4
5
6
1
4
5 6
3 2
56
No literature data were found for those transitions in all documents studied. For
those reasons, therefore, only the main features will be further considered.
Experimental DSC results have been described in the literature39 and will be
compared and their relevance to our results discussed in the discussion section.
2.3.3 FTIR
Infra-red radiation is used to probe vibrational frequencies in molecules. Different
regions of the spectrum will show characteristic vibrations that can be considered
fingerprints for a compound (for example B-B stretch frequencies).
Since there are no experimental IR spectra for NiB3 with which to compare our
experimental spectra, we turned to calculated spectra as the only possibility to give
some indication where these vibrations might appear in the spectrum. For NiB3 they are
expected at 1265 cm-1 (B1u), and 1296 cm-1 (B3u). In the far–IR region, a strong
absorption is calculated near 230 cm-1. Figure 2-7 shows the calculated IR for both the
monoclinic (P21/c) and the orthorhombic (𝑃𝑛𝑚𝑎) NiB3 systems. Similar calculations are
still under way for the predicted NiB2 structure. Calculated intensities are reported in
km/mol, which is commonly used as the unit for the intensity of calculated IR spectra.88
Figure 2-7. Calculated FT-IR spectra of the most stable NiB3 structures. In blue the orthorhombic 𝑃𝑛𝑚𝑎 structure, in black the P21/c structure.
57
In our study we used the mid-IR range between 4000 and 800 cm-1.
Raman and FT-Raman spectra were attempted but couldn’t be collected because
of the strong absorption of the laser light by the sample.
Experimental FT-IR was performed in the solid state using KBr pellets as the
matrix with a Bruker Vertex v80 spectrometer, courtesy of Dr. Murray at the Dept. of
Chemistry, University of Florida.
Our data are presented after subtraction of the background (KBr) and
normalization of the peak at 1126 cm-1, which could be one of the B-H bending
vibrations.89,90 The spectra of the unhydrolyzed powders with varying nickel content are
shown in figure 2-8 and are compared to those of pure reactants, sodium borohydride
and the matrix, potassium bromide. In all cases, residual B-H stretches visible by the
triplet around 2300 cm-1 and the B-H bends at 1126 cm-1.89,90
Figure 2-8 mainly shows the spectra of sodium borohydride. This is not
unexpected since this reactant will remain in the reacted powders to some extent.
However, additional bands appear in the region below 1000 cm-1 and between 1300
and 1800 cm-1 and must be due to the reaction products. The intensity of all of these
peaks does not seem to be related to the amount of nickel used in the reaction
indicating that other reaction products, perhaps nickel borides with different
compositions, may have appeared as well and are masking the expected effect. The
region between 1300 and 1875 cm-1 shows several broad bands that are difficult to
interpret. The B-H stretch region between 2200 and 2350 cm-1seems to show another
vibration around 2325 cm-1 which becomes more resolved with increasing nickel
content.
58
Figure 2-8. FT-IR spectra of the non-hydrolyzed powders. a: Sodium borohydride; b: the 2.5 mol-% Ni containing powder. c: the 5 mol-% Ni containing powder; d: the 7.5 mol-% Ni containing powder; e: the 10 mol-% Ni containing powder; f: the KBr spectrum.
FTIR in the mid-IR range was also performed on the annealed powders, and
compared to the spectrum of MgB2 to determine boron vibrations.
Magnesium diboride crystallizes in a hcp lattice, with the P6/mmm space group.
The IR spectrum of MgB2 has been reported by Sundar et al and is reproduced in
Figure 2-10.91
In the mid-IR MgB2 shows two broad but weak absorption bands at 1442 and 1635
cm-1. The strong and broad peak at 1040 cm-1 is most probably due to unreacted
crystalline boron, as reported by Sundar et al.91 In their work they prepared fresh MgB2
a
b
c
d
e
f
59
using both crystalline and amorphous boron and magnesium, and characterized it by
FT-IR (both far-IR and mid-IR).
Figure 2-9. MgB2 crystal structure.92,93 Dashed lines show the cubic structure of Mg. Figure reprinted from http://www.magnet.fsu.edu/magnettechnology/research/asc/research/mgb2.html retrieved 2/9/2012 @ 20:41
In their work they prepared fresh MgB2 using both crystalline and amorphous
boron and magnesium, and characterized it by FT-IR (both far-IR and mid-IR). In Figure
2-10 are shown their FT-IR spectra, in the mid-IR, of amorphous and crystalline boron,
and the product of the synthesis, which was clearly affected by the presence of
unreacted crystalline boron. This result, can be easily seen by the presence of a broad
peak around 1040 cm-1 in the spectra of the products and in crystalline boron and which
is absent in the spectrum of amorphous boron.
Figure 2-11 shows the IR spectra of the annealed powders and the magnesium
boride. The spectra of the annealed powders seem to show the same vibrational
Figure 2-10. IR spectra of MgB2. Adapted from Sundar, C.91 (a) is the experimental spectrum of MgB2 produced by the authors, (b) is the spectrum obtained from commercial MgB2, Cryst. B is the spectrum of crystalline boron and Amor. B is the one obtained from amorphous boron
This may be due to a structural arrangement of the boron atoms in nickel borides
which recall the structure of MgB2 Overall the spectra show the same behavior, and it is
also similar to the spectrum of MgB2.
The spectra all look very similar presumably because the background subtraction
was insufficient and the main contribution in all of them are SO42- impurities in the KBr
pellet.94
However, small differences can be found when analyzing the spectra. The effect of
supporting the powder onto silica was also studied by FTIR spectroscopy. This
61
experiment had the aim of determining vibrations frequencies of each of the
components in the supported powders.
Figure 2-11. FTIR spectra : a) MgB2, b) the powder annealed 5 h at 500ºC, c) the powder annealed 5 h at 830ºC, d) KBr.
The spectra are presented in Figure 2-12.
The spectra show the same vibrations overall. Very few pronounced differences
can be found when comparing both spectra. The broad peak at 1100 cm-1 in the
spectrum of the silica gel, due to Si-O stretching, is slightly shifted after interaction of
the powder. The peak is also attenuated in the latter case and it is broadened, as it can
be inferred by the FWHM (full width half maximum). This peak presents a shoulder
around 1080 cm-1 (SiO2 spectrum, black line) which is not found in the spectrum of the
supported NiBx. The silica spectrum, furthermore, shows a weak peak in the low end of
the spectrum (800 cm-1), which is not revealed by the supported NiBx spectrum.
a
b
c
d
62
Figure 2-12. FTIR in the mid IR of the commercial SiO2 gel (in black) and the supported nickel boride (in red). Vertical lines are the peak maxima positions and horizontal lines are FWHM.
The peak at 1620 cm-1 due to water bending seems broadened in the case of
SiO2, maybe because of the interaction of the water with the superficial Si-OH groups,
which are covered by the NiBx powder after the reaction. It is also slightly shifted in the
latter case, as compared with the spectrum of the SiO2 alone. However the vibrations
from NiBx are not seen due to the impurities found in the KBr, which show
predominantly in the spectra. The lack of peculiar vibrations from the NiBx powder can
either be attributed to very little powder ending up in the pellet or to very weak vibrations
which are covered by the stronger vibrations.
FTIR on annealed supported powders was not performed, since after annealing
(under argon) clear phase separation was observed.
63
2.3.4 Powder XRD
As explained by West,95 powder XRD diffraction is a powerful technique used on
micro-crystalline samples to reveal structural information.
Diffraction techniques rely on the interference between radiation paths transmitted
through or reflected from a sample with internal periodic structure such as crystal planes
in microscopic crystallites. The Bragg equation relates the reflection angle θ to the
wavelength of the radiation, λ, and the spacing between crystal planes d
𝑛 (2-6)
where n = 1, 2, … is the so called diffraction order.
The Bragg theory, which explains the diffraction process in crystals, considers
crystal layers or planes as semi-transparent mirrors. Beams are reflected from these
planes with an angle of reflection equal to the angle of incidence. Reflection occurs
when the path lengths of reflected beams from neighboring planes fulfill the Bragg
condition (equation 2-6) which leads to constructive interference (see Figure 2-14).95
Two X- ray beams are reflected from consecutive planes (red lines in Figure 2-14),
separated by a d spacing between successive crystal planes. The difference in optical
path lengths between beams 1 and 2 are given by the length XYZ . In order for 1’ and
2’ to be in phase this path length must be an integer multiple of the wavelength. The
perpendicular distance between two consecutive planes is called the d-spacing (see
Figure 2-13).
The angle between the incident beam and the lattice is called the Bragg angle, θ.
The relationship between the path length difference and the Bragg angle as well as the
d-spacing is given by the trigonometric relationship:
64
(2-7)
Thus
(2-8)
In order to have constructive interference, the following condition must be
satisfied:
𝑛 (2-9)
and consequently,
𝑛 (2-10)
This condition is required for the reflected beam to be in phase, and to interfere
constructively. At angles different than the Bragg angle, the interference is more or less
destructive and cancellation of the beam occurs. Complete cancellation happens within
a few tenths of a degree of the determined angle due to the large number of planes
within the crystal on which the beam is reflected. These lattice planes are defined by the
crystal symmetry and the lattice parameters of the unit cell. They are parallel throughout
the crystal and are labeled using three numbers known as Miller indices for each set of
planes.
Derivation of the Miller indices of the various planes cutting the crystal structure
depends on the geometric construction of the unit cell. Taking one edge as the origin of
the cell, there will be planes which will pass parallel to one or more faces or obliquely
through the unit cell (see Figure 2-14).
In figure 2-14 various Miller planes for cubic structures are shown. In the first
figure (top left) the red colored area cuts the x, y and z axis at 1a, ∞b and 1c, where a, b
65
and c are the lattice constants, i.e. the minimal distances between adjacent atoms in a
unit cell.
Figure 2-13. Schematic used in the derivation of Bragg’s Law for X-ray diffraction. d represents the distance between neighboring crystal planes. The angle θ is the angle of incidence or reflection of the X-ray beam. The path length
between beams reflected from neighboring planes is given by XYZ .
To Miller index that plane we need to take the reciprocals of 1, ∞ and 1, i.e.
naming it the (101) plane. The Miller index of 0 indicates that the plane will be parallel to
a particular axis. Generally the Miller indices are expressed in the order x, y, and z
within parentheses, the so-called (hkl) formalism. It is used for equivalent sets of planes.
Overlined indices indicate that its direction is opposite or negative for the corresponding
axis.
The d-spacing for a given set of (hkl) planes can be calculated with the following
formula:
(2-11)
66
By definition the unit cell must contain at least one formula unit per compound. In
centered cells and in some primitive cells the unit cell can contain more than one
formula unit.
Loss of information is inherent to the XRD experiment because a 3D object is
projected onto a 1D detector plane. To overcome this issue, the experimental patterns
are fitted with known structures through the so called Rietveld refinement.96
Rietveld refinement works best for multi-phasic powder patterns, which contain
more than one crystal structures.96
Figure 2-14. Miller planes and indexing in a simple unit cell. (http://www.doitpoms.ac.uk/tlplib/miller_indices/printall.php, retrieved 3/5/2012 at 1:09 p.m.)
The process of refinement uses calculated or published structures as a starting
point to simulate experimental XRD patterns. Many software programs are
downloadable free of charge. For our refinements we used the BRASS software
(Bremen Rietveld Analysis Structure Suite).97 Using Rietveld refinement it is possible to
predict a number of useful parameters such as quantitative content of different crystal
phases (form multiphasic systems), stress/strain of the crystal structure, and refined
lattice parameters for all the structures present in a given sample among others. The
refinement utilizes the least squares method of error analysis when comparing the
predicted to the experimental XRD spectrum in order to optimize the lattice parameters.
After the refinement step the software graphically plots the background function(s),
the identified peaks and phases, the fitted patterns, and the so-called residuals. The
residual curve gives an indication of the goodness of the fit. It should show a flat line
with only experimental noise superimposed in the case of perfect agreement between
the predicted and experimental spectrum.
Structural data for a crystalline system is reported as atomic coordinates which
can be used to derive bond distances and angles. This information is used in the
Rietveld refinement in two ways. It allows to increase the number of geometric
“observations” and/or diminishing the number of simulation parameters for the
calculation. The set of “observations” is treated as a secondary data-set and the
function which is minimized is given by:98
(2-12)
Sy is the weighed difference between the observed and calculated intensities
[y(calc)] and [y(obs)]:98
∑ ( ) ( 𝑎 ) (2-13)
and represents the error function which is minimized by the software. SG is the
difference between the observed and calculated geometric constraints, weighted by the
parameter cw.
∑ ( ) ( 𝑎 ) (2-14)
68
cw changes with the improvement of the model. It is usually large at the beginning
of the refinement since the initial guess of the model is approximate (bond distances
might be too short or too large, angles are too narrow or too wide) and will be reduced
while the optimization improves the predicted structure within the given constraints.
The goodness of the fit is determined by the χ2 value, which assumes the form of:
(2-15)
where:
{∑
∑
}
⁄
(2-16)
is the R value for the weighted profile and
{
∑
}
⁄
(2-17)
is the statistically expected R value, with N being the number of observations and
P the number of parameters refined.98
Ideally, the final Rwp value should be close to Rexp (χ2 = 1). Experimentally, a χ2 = 1
or near one is very difficult to obtain. Generally χ2 is greater or smaller than 1. If the data
are acquiered too quickly, and the parameters for the refinement needed are too many,
(this means a very small Rexp), the χ2 value will be much greater than one. On the other
hand, if the experimental data has been collected too fast (allowing little time per angle
to collect the diffracted X-rays), the intensity of the experimental peaks (yobs) tends to be
very small since the detector collects very few X-ray photons. This causes Rwp to be too
small and consequently the Rexp value will be very big resulting in a χ2 much less than
one.98
69
XRD patterns were measured with a Phillips APD 3720 diffractometer, courtesy of
MAIC at the University of Florida. For comparison we obtained data from the Advanced
Photon Source (APS) in Argonne, Illinois, with the help of Dr. Jacob Jones in the Dept.
of Materials Science & Engineering (MSE) who has an active collaboration with the
APS. In the APD3720 the samples were mounted and glued on diffraction slides with an
acrylic spray which was also used for a blank background to be able to subtract any
background signal peaks.
The background pattern of the acrylic spray itself is flat with very little noise and
the spray is suitable to use for our powders. Samples were placed on the slide holder
and inserted into the diffractometer. All patterns were collected using the following
parameters: 0.5 seconds per degree, a range of 10 – 90 degrees, 0.02 degrees
increment per second, 20 mA, 40 kV, on a source of Cu Kα1 (1.5408 Å wavelength)
without filter.
The samples prepared for the APS were inserted in Kapton capillaries and fixed
mainly at the center of the capillary. The capillary ends were sealed using Cha-seal®
from Kimble Chase which is used in our lab for sealing EPR capillaries to avoid sample
loss during transport or during experiments. The Kapton capillaries were placed into a
sample holder and shipped to Argonne. The radiation wavelength at the 11 BM
(bending magnet) at the APS facility was calibrated at 0.413068 Å.
The goal of Paragraph 2.3.4 is to describe the experimental results which have
provided insights into structural changes upon annealing of the powders. We started
with the initial hypothesis that our powders were mainly composed of amorphous NiB3
and a theoretical XRD pattern was obtained using the predicted structure described in
70
Paragraph 2.2. In particular, we are interested in the peaks at low angles arising from
the (101) and (002) diffraction planes. For pure monoclinic 𝑃 NiB3 the peaks fall at
20.17 and 21.60 degrees while they show up at 19.83 and 24.62 degrees for the
orthorhombic 𝑃𝑛𝑚𝑎 case. These low-angle peaks are absent in all nickel-rich nickel
boride structures surveyed in the literature.49,51,52,72,99 Similar calculations are currently
underway in the lab of our collaborator in Switzerland (Dr. R. Caputo) for the NiB2
system.
2.3.4.1 Powders as Synthesized (Under Normal Laboratory Conditions)
The XRD pattern of the as-prepared powders was dominated by the crystal peaks
of unreacted sodium borohydride and sodium bromide (Figure 2-15). The background
was fitted with a power function. The residual curve is found below the refinement (grey
line).
The increasing intensity of the background towards lower angles is due to the
amorphous nickel borides. Generally, nickel borides synthesized in aqueous solution
under normal laboratory conditions yield an amorphous XRD pattern similar to the one
we have detected (see Figure 2-16).39 Rietveld refinement of an unstructured pattern
observed from a sample with amorphous structure is not possible and would not give
useful results.
2.3.4.2 Annealing the Powders under Ar(g)
We performed annealing experiments on the powders under inert argon
atmosphere at 773 K and at 1100 K for 1 and 5 h each. The resulting XRD patterns
after 1h annealing time at 773 and 1100 K are compared to the as-synthesized sample
in Figure 2-17.
As it is easy to see the 1h annealed powders patterns are similar to each other.
71
Figure 2-15. XRD pattern of the freshly prepared powders. Blue: Experimental pattern. Red: NaBr. Green: NaBH4. Grey:Residuals.
Figure 2-16. XRD pattern obtained on the hydrolyzed powders.
The pattern all look broad and no reasonable crystalline pattern is observed. For
this reason no conclusion could be taken from the spectra annealed for one hour, and
no refinement was possible since there were no crystalline patterns to refine. For these
reasons we decided to extend the annealing time in attempt to observe a crystalline
72
pattern that could be refined, and so giving us semi-quantitative data or, alternatively, a
full refinement of a NiB2 crystal structure.
Figure 2-17. Annealing patterns. Blue: Hydrolyzed powder not annealed (298 K). Red: Annealed at 773 K for 1 h. Green: Annealed at 1100 K for 1 h. All patterns were taken with the APD3720 instrument (UF Dept. of Material Science & Engineering).
As can be seen from Figure 2-17, there is not much change when the powders are
annealed for 1 h both at 773 and 1100 K. Therefore, we explored longer annealing
times. Figure 2-18 shows the powders at room temperature, 1100 K annealed for 1 h
powder and 1100 K annealed for 5 hours. The longer annealing time resulted in a
crystalline XRD pattern. Attempts at using refining this pattern and assigning a structure
to it have so far failed. None of the available nickel-rich nickel borides nor the theoretical
NiB3 structure are able to fit the experimental pattern.
73
Figure 2-18. Blue: RTP hydrolyzed powder pattern. Green: Annealed for 1 h under Ar(g) at 1100 K. Red: Annealed for 5 h under Ar(g) at 1100. Experimental patterns were taken at the APD3720 (UF).
Samples were sent to the APS at the Argonne National Laboratory in Argonne,
Illinois, to improve resolution and eliminate instrumental broadening. The samples sent
to the facility were prepared with 5 mol-% Ni in sodium borohydride as non-hydrolyzed,
hydrolyzed (normal lab conditions), annealed at 773 K for 5 h under Ar(g), and annealed
at 1100 K for 5 h under Ar(g).
XRD scans were taken at the 11-BM, with a wavelength of 0.413068 Å. Figure 2-
19 shows the patterns obtained at the APS in Argonne.
74
Figure 2-19. XRD patterns obtained at the 11BM beamline of the APS in Argonne. Plots are presented in d-spacing. The y-axis reports the square root of the intensity. Red: Un-hydrolyzed powder. Green: Fresh hydrolyzed powder. Magenta: Powder annealed at 773 K under Ar(g) for 5 h. Blue: Powder annealed at 1100 K under Ar(g) for 5 h.
Air handling of the powders and the time difference between the in – house
measurements and the Argonne ones (aging), may also have altered the composition of
the powder due to oxidation of the samples resulting in nickel, and nickel oxide patterns.
It is easily seen that the patterns are different, even though the freshly hydrolyzed
and the 773 K annealed powders are dominated by the nickel and nickel oxide. The
peaks, however, of these two patterns are wide, sign that the nickel and nickel oxide
crystals are very small, maybe nanoscopic scale. Furthermore, the intensity of the nickel
oxide peak versus the intensity of the nickel peaks is slightly weaker, sign that nickel
* * ^
* ^
*=Ni ^=NiO
* ^
75
oxide crystallites quantity is comparable to nickel metal crystallites. However, the width
of the peaks seems not to change up to 773 K. The un-hydrolyzed powder pattern (red),
as in the in-house instrument, seems to be dominated by the NaBH4 matrix which is
dominating. The last pattern, coming from the powder annealed under argon at 1100 K
for 5 h, seems to be quite different from the others: the lines narrow down (this means
bigger crystals) and also peaks from other crystal phases appear, which may be due to
the unknown nickel boride. However, since the NiB3 crystal structures hypothesized
were never found, and thanks to the absence of reliable NiB2 structures, it is difficult to
understand if some peaks can be attributed to NiB2 or if other phases are crystallizing.
One possibility is that some boron oxide is crystallizing, as nickel oxide and metallic
nickel, inside the powders; however, the formation of some nickel borate
(Ni3(BO3)2)cannot be excluded, nevertheless the care used in maintaining the whole
experiment under argon flow.
The APS instrument allows reflected radiation to be observed at lower angles than
in the in-house instruments which means that larger d-spacings can be observed. The
conversion between spacing and angles comes directly from Bragg’s law. d-spacing
plots are useful because they reflect the distances between planes, in a crystalline
material and should be independent of the instrument used. We present all XRD spectra
as a d-spacing plot as this allows for easy comparison between the different instruments
used. Since the planes in a crystal are defined by the crystal lattice, it is possible to
determine the crystal lattice constants.
2.3.4.3 γ-Irradiation of the Powders.
Concerns were raised about radiation damage due to the high flux rates under which
the experiments were done. To ensure that the peaks arising at 1100 K are not due to
76
radiation damags of the sample (the beam uses beam energies of around 30 keV) we
irradiated the material with γ-rays (60Co source) for different lengths of times: 10
minutes, 1 h, 1 day and 1 week. Figure 2-20 shows the patterns arising from these data.
Figure 2-20. γ-irradiated NiBx samples after 10 mins (blue), 1 h (red), 1 day (green) and 1 week (magenta). Patterns were collected at the APD 3720 (UF).
Clearly, radiation damage can be excluded as the source of the observed XRD
patterns.
2.3.5 Quantitative Elemental Analysis: ICP-AES
Elemental analysis was carried out by ICP-AES (Inductively Coupled Plasma –
Atomic Emission Spectroscopy).
ICP-AES is useful in determining the relative concentration of the elements in an
unknown compound. In fact the intensity of the emission lines, which are specific for
each element, is proportional to the concentration of the element itself. Since the
* * ^
*
^ ^
*=Ni ^=NiO
77
sample under study has an unknown composition, it is practical to use methods of
calibration of the emission intensity. There are several methods available for standard
calibration in which a standard of known composition and purity is used and compared
to the unknown. In the standard addition method a standard for a certain element is
added to the analyte in solution (analyte and standard must contain the same element).
Subsequent addition followed by linear extrapolation back to the abscissa, yields the
elemental concentration in the analyte. The calibration curve method uses a series of
known increasing concentrations of the element under analysis. Again, the intensity of
the emission lines is plotted against the total concentration giving a linear correlation
between the intensity/concentration. The unknown concentration must be in the range
of the concentrations used and its value is obtained by localizing the intensity of the
analyte on the calibration curve.
Generally, a solid sample is solubilized in a suitable solvent and then diluted with
water to test for linearity of the detector response. The solution is injected into an
ionizing flame using Ar gas as the carrier. It is good practice to test whether the solvent
or acid used to dissolve the solid sample interferes with the analysis. Therefore blanks
are used to record a zero point, i.e., the point for which the chosen wavelength(s) will
have zero or minimal intensity because of the negligible quantity of the analyte in
question.
A Varian Vista CCD Simultaneous ICP-AES, which allows for the determination of
multiple elements simultaneously, was used in these experiments.
2.3.5.1 Determination of the Nickel Amount in the Unknown
The following lists the protocol for the example of a sample of room temperature-
hydrolyzed powders. The sample was weighed in at 14.4 mg and was dissolved in 1.0
78
mL of fuming nitric acid (90.7%, Fisher) and diluted 100 fold with NanoPure (Barnstead)
18.2 MΩ cm-1 water. We prepared a series of standards in which [Ni] was equal to 0
(stock fuming nitric acid 100 fold diluted with NanoPure water as blank), 0.025, 0.05,
0.25 and 0.5 mM respectively, using solid NiCl2·6H2O (Fisher) as the Ni(II) source. The
amount of Ni(II) per each solution was 1.47, 2.93, 14.7 and 29.3 mg of Ni(II) per L of
solution. However, the final volume of the solutions was 100 mL, therefore a factor of 10
was needed to determine the amount of Ni(II) in the standards and in the unknown.
A calibration curve was generated for these samples as seen in Figure 2-21. The
plot shows a linear correlation between the intensities of the standard at both
observation wavelengths of Ni (231.604 and 232.138 nm) and their concentration with
R2 values of 0.9968 for 231.604 nm and 0.9943 for 232.138 nm. The intensities of the
unknown concentration observed at both wavelengths were 6068.7 and 783.65, and fell
in the range of the concentrations used. The amount of nickel deduced in the sample of
nickel borides was 1.877±0.006 mg in 14.4 mg of sample.
In order to obtain a molar ratio between boron and nickel, elemental amounts were
calculated in mg of analyte per gram of sample used. Therefore if 0.032 mmols of
nickel, (i.e. 1.877 mg of nickel) are found in 14.4 mg of sample, 2.22 ± 0.01 mmols (i.e.
130 mg of nickel) are found in 1.0 g of sample. Errors were calculated using the least
square method, and reported as standard deviation from the mean value. The relative
error on the amount of nickel is of the magnitude of 0.3%.
79
Figure 2-21. Correlation plots for the nickel standard observed at 231.604 nm (blue diamonds), and at 232.138 nm (red squares). The green triangles represent the unknown concentrations at both wavelengths.
2.3.5.2 Determination of the Boron Amount in the Unknown
Attempts to measure boron amounts through ICP-AES were met with initial
difficulty. 14.2 mg of the unknown sample and 3.1, 5.0, 6.7, 11.8, 17.2 and 23.5 mg of
MgB2 (i.e. 1.5, 2.4, 3.2, 5.6, 8.1, 11.1 mg of B) (our standard) , were placed in quartz
tubes and dissolved using 3.0 mL fuming nitric acid for the NiBx and 5.0% commercial
(Fisher) nitric acid for the MgB2. The vigorous reaction between the MgB2 and the
concentrated acid forced the use of dilute nitric acid in order to obtain a clear solution
without any solid spill. One mL of each solution was further diluted 50-fold. Data were
collected in a similar way as for nickel using two known emission lines for boron at
249.678 and 249.772 nm.
0
2000
4000
6000
8000
10000
12000
0 0.5 1 1.5 2 2.5 3 3.5
Inte
nsi
ty (
Co
un
ts)
Ni mg/L
80
The standard calibration curves for boron are presented in Figure 2-22 together with the
intensities observed from the unknown.
Figure 2-22. Correlation plots for the boron standard observed at 249.678 nm (blue diamonds) and at 249.772 nm (red squares). The green triangles represent the unknown concentrations at both wavelengths.
The plots showed a linear correlation between intensity and concentration with R2
values of 0.9961 (for the line at 249.772 nm) and 0.9929 (for the line at 249.678 nm).
Intensities are reported in thousands of counts. The intensities of the two B lines for the
unknowns averaged 3116.73 and 6216.41counts yielding 0.00421± 0.00001 mg B per
mL of solution. The relative error on the amount of nickel is of the magnitude of 0.2%.
Results were converted into mmol of Ni or B per g of compound. The amount of
nickel was 2.22±0.01 mmol per gram of compound and that for boron was 4.11±0.01
mmol per gram of compound. The molar ratio
was 1.851:1. The relative error on
the moles is 0.004 moles, which is the 0.2% from the average value. This result,
however, confirms our second guess, in which the structures should have shown a
stoichiometry of 2 mols of boron per mole of nickel, as discussed in the Paragraph 2.1.
0
20
40
60
80
100
120
0 0.02 0.04 0.06 0.08
Inte
nsi
ty (
Co
un
ts)
Tho
usa
nd
s
[B] mg/mL
81
2.3.6 Quantitative Analysis: XRD Refinement
Whenever a pattern is retrieved from a multi-crystalline phase, it is possible to
determine the relative quantity of each of the phases from a Rietveld refinement.
In fact, all the software, including BRASS (the one used in our work), use the same
equation to determine the relative quantity for each of the phases composing a multi-
crystalline powder, as described by Hill and Howard: 100
( )
∑ ( ) (2-18)
where: wp is the weight fraction (or mass fraction, they are still called weight fraction but
with the same meaning), S are the scale factors of the phases, Z is the number of unit
formula in the unit cell, M is the molecular weight of the formula unit, (therefore Z∙M is
the molecular mass of the unit cell) and V is the unit cell volume.
The total quantities of nickel and boron which reacted in a typical experiment were
determined through the analysis of quantitative data calculated from the refinement
shown in Figure 2-15. Results are presented in Figure 2-23 and reported in mol-%. After
the reaction, the unreacted NaBH4 was 83±5% of the initial. This value corresponded to
8.40 mmols. The amount of NaBH4 initially used for the reaction was 10.07 mmols. This
suggests that 1.67 mmols of sodium borohydride had reacted with 0.52 mmols of nickel
bromide. According to this analysis the ratio
was estimated to be 3.2:1.
82
Figure 2-23. Quantitative results from the XRD refinement shown in Figure 2-15.
2.3.7 XPS
XPS (x-ray photoelectron spectroscopy) is a surface technique which relies on
core-ionization potentials and detects kinetic (or binding) energies of the emitted
electrons. Spectra are collected under high vacuum to avoid ionization of air and
scattering of the released electrons at gas molecules. This technique can determine
quantitative information of the elements on the surface of the sample. However, care
has to be taken when trying to extend the interpretation of the results to the bulk
sample.
The main advantage of this technique is the possibility to discern between different
oxidation states of a particular element depending on the peak position and shape. In
this work, an extensive XPS study has been performed on the nickel borides to
determine their surface composition and to reveal oxidation states of both Ni and B.
XPS has been widely used to study the surface composition of nickel borides50,80
as well as nickel boride nanoparticles.101 However, these earlier studies only deal with
nickel-rich nickel borides.
83
The instrument used to perform XPS on the samples prepared was a Perkin Elmer
5100 XPS System, courtesy of MAIC at UF. As a reference for the Boron 1s peak
commercial crystalline MgB2 was used. All peak positions and relative shifts shown by
the instrument must be referenced to the C 1s peak that is set at 284.6 eV by default.
Survey experiments were performed under the following experimental parameters:
300 kV, 15 mA, 0.5 eV step, 0 – 1320 eV for MgB2 and 0 – 1100 eV for the unknown
powders.
HR (high resolution) spectra were acquired for boron, magnesium, carbon
(reference), oxygen, and nickel (the latter measured only in the samples).
HR spectra were acquired 40 times, with a step of 0.1 eV, and range of ΔE of ~10
– 30 eV from the center of the peak. This ΔE was chosen based on the width of the
peak (or the multiplet) assigned to a particular element. The shifts of the peaks were
determined by the difference in binding energies between the default position of the
carbon peak and the experimental value. Both the experimental and the projected
unshifted C 1s peaks are shown in Figure 2-24.
The difference in binding energies between both peak positions is the shift that
needs to be subtracted from each of the other peaks to correct for instrumental shifts in
a particular experimental setup.
Peak shifts, which are sample-dependent, are calculated on the basis of the shift
of the C 1s peak coming from impurities (anion of the nickel) of the sample (as in
Okamoto et al.50) or, as in our case, from the position of the sample inside the sample
holder, since the sample was placed in a paper – stick slide with organic glue on it.
84
Figure 2-24. Room temperature C 1s peak. The black line represents the as-determined peak, the red one is the peak as expected for the default C 1s position.
The paper stick may have slight different angles or slight different organic
composition which may alter both the intensity and the position of the carbon peak.
However, to eliminate this issue, which can generate heterogeneous results, the
instrument has set a C 1s reference which happens at 284.6 eV. On the basis of relative
shifts for this peak, peak shift was determined this way for each set of data. The shift
values are 6.3 eV for the room temperature hydrolyzed sample; 7.1 eV shift for the
powder annealed at 500 C and crushed in open air in mortar and pestle and 5.1 eV for
the 830ºC annealed powders. MgB2 presented a shift of 6.2 eV, very close to the shift
presented by the room temperature sample (6.3 eV). In this work the data of the XPS
study are presented as received from the instrument. Literature reports XPS data only
85
for nickel-rich nickel borides which will be compared to our NiBx here. In particular, B 1s
peaks are assigned to elemental boron and oxidized boron.50,80,101
2.3.7.1 Determination of Nickel through XPS
Three nickel boride samples were measured after the following treatments a) after
hydrolysis of the sodium borohydride matrix at RTP (room temperature and pressure),
b) after annealing at 500ºC for 5 h under Ar(g) and c) after annealing at 830ºC for 5 h
under Ar(g). The Ni 2p peaks are shown in Figure 2-25.
Nickel in the 0 oxidation state is generally found at ~852 eV.50,80 Samples
investigated in this work show in all cases nickel peaks in the range between 854.9 and
855.6 eV after correction for peak shifts. A value for nickel at 852 eV is not observed
excluding metallic Ni at the surface of the sample. The difference in energy between
the theoretical value for nickel metal and the experimental values ranges between 2.9
and 3.6 eV.
Figure 2-25. Ni XPS spectra under the following sample conditions: rtp (in red), sample was annealed at 773 K for 5 h, sample was annealed at 1100 K for 5 h (green).
86
2.3.7.2 Determination of Boron through XPS
Boron is present in two different forms in MgB2, as elemental boron (stronger
peak, at lower binding energies) and oxidized boron on the surface (weaker peak, at
higher binding energies). After peak shift correction these peaks are found at 186.6 eV
and 190.83 eV, respectively (see Figure 2-26). The relative distance between the two
peaks is 4.23 eV.
Figure 2-27 shows the B 1s peaks, zoomed in from the survey experiments, and
compared with the B 1s peak of MgB2. Normally, B 1s peaks fall between 185 and 190
eV. Our nickel boride samples show one main peak at 191.7 (for the room temperature
sample) and 191.9 eV for the annealed samples. All the spectra, in the region below
185 eV, show weak peaks, noticeably a weak band which appears above the noise
level at 181.7 eV (room temperature sample) and 181.9 eV (for the annealed samples).
Figure 2-26. High resolution spectrum of commercial MgB2.
This is not normally a range in which boron peaks are found. Since the intensity of
this peak is rather low it might be possible to be a satellite peak.
87
To solve this question high resolution spectra were acquired in this energy range.
Figure 2-27. Comparison of the B 1s peaks: commercial MgB2 (red); powder hydrolyzed at RTP ( violet); powder annealed at 773 K for 5 h under Ar (black); powder annealed at 1100 K for 5 h under Ar (blue).
High resolution spectra were acquired using two anodic materials: Mg and Al,
which operate at different X-ray wavelengths. If the weak peaks are satellites of the
main peak, a corresponding shift is expected in the two measurements. Moreover, the
intensity of the satellite peak area should not be more than 6-8% of the main peak,
depending on the anode used. Only one sample was analyzed in this way. The sample
was the powder annealed at 500ºC and quickly ground with mortar and pestle in air.
The results are shown in Figure 2-28. The spectrum shows two peaks for boron with a
relative intensity of approx. 1:3 for both lines. The energy difference between both
peaks remained constant at ~10 eV for both X-ray sources.
This result is significant because it means that the peak arising at ~182 eV is not a
satellite. It is also unprecedented, since all the nickel-rich nickel boride phases show
boron peaks which appear at about 186 eV.50,80,101 Furthermore, it is interesting that the
88
difference in energies between the two peaks is 10 eV, which is about 2.5 times the
difference in energy of the B 1s peaks for MgB2.
The energy difference between the (reduced) boron peak positions found in MgB2
and in our nickel borides ranges from 4.7 to 4.8 eV.
Figure 2-28. XPS HR spectra of the B 1s peak. Intensities ratio are 3:1 for oxidized boron. Al anode in black; Mg anode in red
2.3.8 Morphology of NiBx
2.3.8.1 TEM and EDXS
Microscopic studies are needed to determine the morphology of these powders.
Since no crystal structure could be determined, yet, the aim of microscopy experiments
is to resolve structural features which have not been revealed in other experiments.
T.E.M. (transmission electron microscopy), ED (electron diffraction) pictures of the
powders, and semi-quantitative EDXS data (EDXS – Energy dispersive X-ray
spectroscopy) have been collected at the ETH Zürich, Switzerland, in the group of Prof.
Nesper.
89
Thanks to this technique periodic ridges, on the surface of the NiBx grains were
discovered. These ridges are spaced approx. 65 Å apart in an almost periodic
arrangement. Results are shown in Figure 2-29.
Figure 2-29. From a) to d), respectively: a STEM image and increasingly resolved TEM images of the powders.
Figure 2-29 shows a field emission Scanning Transmission Electron micrograph
(a) and three TEM images with increased magnification. TEM images, taken at the
same spot, with doubled magnification are shown in Figure 2-30. Higher magnification
clearly shows the ridges which appear in ordered arrays, parallel to each other and
separated by a constant distance of about 65 Å. These experiments yield important
information about the morphology of the particles in the NiBx powders. In fact, the
a) b)
c) d)
90
discovery of these ordered arrays or ridges is reminiscent of the structures seen for
MgB2 (see Figure 2-9).
Figure 2-30. TEM images of a grain of material. a) and b) show images of the same grain of powder with the magnification doubled. The ridges can be readily seen on the surface of the grain.
Moreover, the TEM experiments allow to perform qualitative elemental analysis of
the sample using the EDXS technique. The spectra of the unsupported amorphous NiBx
and SiO2-supported NiBx are shown in Figures 2-31 and 2-32. In the low energy range
of the spectrum, boron and carbon peak positions are found within 0.2 eV of each
other.45,102 In the unsupported powder the spectrum reveals two peaks with only the
carbon one labeled. However, the most intense peak can be attributed to boron, since it
shows up at an energy lower than carbon.
The results for the supported amorphous NiBx are not as clear-cut as those for the
unsupported powders. However, even in this experiment it is possible to see that the
position of the carbon label does not intercept the maximum of the peak.
Figures 2-31 and 2-32 show EDXS spectra of the non-supported NiBx powders and the
supported NiB2x powders, respectively.
a b
91
Figure 2-31. EDXS of NiBx unsupported sample showing a boron peak which is more intense than the carbon peak. Nickel peaks are also clearly visible.
Figure 2-32. EDXS of the supported powders. The low energy peaks containing contributions from C and B are framed in red and zoomed in.
2.3.8.2 SEM Microscopy and EDS
SEM microscopy was employed to ensure the efficiency of supporting the material.
Experiments have been performed by Dr. Wayne Acree at the MAIC, UF. The
instrument used was a JEOL SEM 6400.
SEM is a technique which allows the investigation of surfaces of solid materials.
Energy (keV)
Co
un
ts
108642
60
40
20
0
O
C
Ni
Ni
Ni
Ni
Ni
Cu
Cu
Cu
CuCu
16.22.57 Acquire EDX Acquire HAADF Area 2
0 0
C
92
To ensure the best resolution, samples must be conductive or must be coated with
a conductive material.
Analytes are placed on metallic or graphitic sample holders and then coated with
gold or graphite.The surface of the material is revealed by contrast.
SEM images are shown in Figure 2-33. The length scales for the images are
indicated by bars as 200 μm (1-4) and 50 μm (5-6).
The pictures indicate that, after the reaction with the nickel salt sodium
borohydride loses its crystallinity to form a potentially amorphous material (Figures 2-33,
a–b). In fact, the image in Figure 2-33 a) shows that the the smooth surface of the
sodium borohydride is evidently roughened after it reacted with nickel bromide. The
borohydride grains, in fact, are not smooth as in the as-measured sample (which is
shown by crystalline materials), but, instead, shows a roughened surface which may be
due to the interaction with nickel bromide (and consequent liberation of hydrogen). The
powders maintain an overall disordered amorphous-looking structure after hydrolyzation
(Figure 2-33 b). Some elongated cylindrical structures (encirciled by red ovals) can be
observed (Figure 2-33 c), d). Amorphous NiBx upon contact with silica covers the
smooth surface of the hosting materials (Figure 2-33 e),f).
SiO2 has been demonstrated to be a stable support for many nickel-rich nickel
borides.32,37,41,45 To determine whether SiO2 is also a stable support for boron-rich nickel
borides, EDS analysis was performed during the experiment choosing a spot on a grain
of the composite material.
This experiment can ensure if silica can be used as stable support for the powders
produced according to the reaction we are proposing.
93
Figure 2-33. SEM images of the various powders: a) Sodium borohydride; b) Sodium borohydride + 5% NiBr2 non hydrolyzed; c) and d) Overview of the hydrolyzed powders (in red ovals the elongated structures) and a single rod. e) Commercial silica gel mesh (80 – 100 mesh) and f) Supported NiBx on the silica gel surface.
The spectrum is shown in Figure 2-34 (without phase separation between NiBx
and SiO2) and shows Ni, Si, and O peaks.
Figure 2-34. EDS spectroscopy of SiO2 supported NiBx. The peaks of Ni (1) Si (2), and O (3) are clearly visible. The boron peak is usually difficult to see, and may also be hidden by the carbon peak which is enhanced because of the graphitic coating.
a) b)
c)
d)
e) f)
1
2
3
200 μm 200 μm
200 μm 200 μm
50 μm 50 μm
94
A carbon peak is found because of the graphitic coating used to make the samples
conductive and because the sample holder was graphitic, too. A potential boron signal
may therefore be hidden below the carbon peak.
2.4 Discussion of the Results
2.4.1 Thermal Analysis
The experimental results presented in preceding chapter were compared with
those from the literature that refer to nickel borides prepared in aqueous solution and
investigated by DSC.39 Thermal analysis was used to investigate potential crystallization
processes of the amorphous nickel boride powders. The composition of the nickel
borides investigated by Wang et al.39 was assumed to be 3:1 (Ni3B stoichiometry). The
DSC results revealed a rather exothermic crystallization peak at 614 K preceded by a
structural rearrangement at 447 K (see Figure 2-37 for a reproduction of Wang et al.’s
results).
This work was used as a benchmark to compare with our own results which turned
out to show some similarities but also important differences.
Our DSC results on NiBx revealed a peak around 650 K similar to that seen in
Ni3B39 albeit broader and much less. However, several other features were observed in
our experimental results that were not reported in the Wang et al.’s paper.39
The temperature range surveyed by Wang et al. ranged from room temperature
(298K) to 900 K. Our data was collected up to 1300 K and revealed another relatively
intense transition at 1000 K which would have escaped Wang et al.39 When NiBx was
supported on silica, the transitions shifted to higher temperatures with the 1000 K
transition demonstrating the larger shift when comparing the supported with the
unsupported powders.
95
Figure 2-35. DSC thermogram of Ni3B. Reprinted by permission from Wang, M.; Li, H.; Wu, Y.; Zhang, J. Mat. Lett. 2003, 57, 2954. Copyright (2003) Elsevier
The rearrangement at 447 K found by Wang et al.39 is not well described in their
publication and lacks any structural details. We did not observe such a transition in our
experiments. The high temperature peak has been investigated, and the annealing of
the powders showed that this transformation can be attributed to some sort of
crystallization (see Paragraph 2.3.4.2). However, it is still not clear which phases are
crystallizing. However, since aging and air-handling showed the formation of nickel and
nickel oxide, it is possible that some amorphous boron oxide is crystallizing at those
temperatures, and so a consistent part of the pattern may be due to nickel, nickel oxide
and boron oxide. Alternatively, nonetheless the care used in blowing Ar (99.9% purity
grade) for 30’ before, all the annealing time and 30’ after the annealing experiment to
purge the furnace from all the oxygen, the elements combined at high temperatures to
form nickel borates (Ni3(BO3)2). Alternatively, the formation of the nickel borides with
96
NiB2 stoichiometry might be proven through calculated structures which can be used as
models for the refinement of the pattern.
However, the existence of these boron-rich content nickel boride phases is very
difficult to achieve due to the ease of oxidation of these materials which in very little time
can form other phases which are difficult to crystallize.
2.4.2 FTIR
Our FTIR data was compared with the results of Molvinger77 and Portehault.45
Results from Portehault and coworkers45 are presented in Figure 2-36.
Experimental IR spectra were compared with several boron-based materials:
amorphous boron (bulk), B2O3, and bulk B(OH)3, and the metal borides produced.
This paper was used as a benchmark to determine the vibrations due to the boron
oxide and water present in the isolated powders. By comparison it becomes clear that
after hydrolysis of the borohydride matrix our powders contain non-negligible quantities
of boron oxide. This amorphous material may cover the actual active material which is
consistent with our XPS and may explain part of our XRD results.
The experimental IR spectra for the nickel borides synthesized by Molvinger et al.
are shown in Figure 2-37.77
The spectra show a peak at 1630 cm-1 which is assigned by the authors to be due
to water bending. The same peak is also found in the FTIR of Portehault45 and in our
own experimental data for NiBx. Two other bands are clearly visible at 1030 cm-1 and at
1350 cm-1.
The 1030 cm-1 band is very close to the one found in MgB2 (due to unreacted
crystalline boron) and crystalline boron at 1040 cm-1.91 However this band is reported to
97
disappears upon rigorous elimination of crystallization waters from the precursor nickel
salt by Molvinger et al., and therefore the band assignment is in doubt.77
Figure 2-36. IR spectra of NbB2 and CaB6 microcrystalline borides. Reprinted by permission from Portehault, D.; Devi, S.; Beaunier, P.; Gervais, C.; Giordano, C.; Sanchez, C.; Antonietti, M. Angew. Chem. Intl. Ed. 2011, 50, 3262. Copyright (2011) Elsevier.
Figure 2-37. Experimental IR from Molvinger, K.; Lopez, M.; Court, J.; Chavant, P. Y. Appl. Catal. A: Gen. 2001, 231, 91. Reprinted by permission. Copyright (2001) Elsevier.
The 1350 cm-1 band is assigned by the authors to a bidentate mononuclear M-BH4
complex (see Figure 2-38), but this assignment is questionable since B-H bands are
98
typically expected at 1120 cm-1 and may be hidden under the broad band at 1030 cm-1.
The B-H stretches, which for sodium borohydride fall in the range between 2200 and
2400 cm-1 are not seen in fig. 2-37 because the cut-off limit of the spectra that are
presented between 500 and 2000 cm-1.77
Figure 2-38. Mononuclear bidentate M-BH4 complex. Reprinted by permission from Molvinger, K.; Lopez, M.; Court, J.; Chavant, P. Y. Appl. Catal. A: Gen. 2001, 231, 91.
Experimental FTIR spectra of our powders are not conclusive, since the powders,
upon annealing, show exactly the same peak positions as MgB2 and KBr suggesting an
impurity such as SO42- in the KBr matrix. It is not possible to distinguish between the
vibration of the unknown powders and the impurities in the KBr matrix. This result
makes it impossible to give a clear assignment of the absorption bands of the nickel
borides in Figure 2-8. However, possible assignments can be predicted from calculated
structures. The purpose of the calculated NiB3 intensities served to understand if the
powders might contain this particular compound, and as a benchmark in assigning
boron-related vibrations. However, there was no experimental evidence for the
presence or absence of NiB3 in the FTIR spectra. The literature is also silent on the
assignment of specific boron-boron stretch vibrations for NiB2 compounds. The problem
is compounded by the fact that these vibrational bands are quite broad and weak for
other nickel borides.45,77
99
Comparison of the experimental FTIR spectra with those from Portehault et al.45
gave us some limited insight on the interpretation of the vibrations in the supported
nickel borides. Figure 2-39 reproduces the experimental FTIR from Portehault et al.’s
paper.45 The experimental FTIR spectrum of our supported powders show the same
vibrations found for other supported metal borides in the literature.45 The Si-O vibrations
(around 1100 cm-1) and B-O stretches (around 1400 cm-1) are visible. The peak due to
the water bending mode was also found around 1600 cm-1. It was not possible to detect
the vibrations due to the B-O-Si stretching mode, which are expected around 700 cm-1,
since the lower limit of detection of the instrument, in the mid-IR is 800 cm-1. However, it
has not been possible to determine the B-O-Si stretching mode even in the far-IR,
supporting and completing the FT-IR information, since the spectra in the far-IR did not
show any particular peak (or band) in the same range. Annealed supported powders
were not measured by FTIR since a clear phase separation was observed after
annealing these samples.
Figure 2-39. FTIR spectra of SiO2 supported NbB2 at room temperature and after annealing under Ar for 12 h. Reprinted by permission from Portehault, D.; Devi, S.; Beaunier, P.; Gervais, C.; Giordano, C.; Sanchez, C.; Antonietti, M. Angew. Chem. Intl. Ed. 2011, 50, 3262. Copyright (2011) Wiley.
100
2.4.3 XRD
XRD experimental data were compared with the data published by Wang et al.39
Their study followed up on their thermal analysis by collecting XRD patterns at each
step increasing the temperature by 20 K every 0.5 h under dry nitrogen atmosphere.
Figure 2-40 reports their XRD patterns of the nickel borides from room temperature up
to 633 K. The amorphous broad band which is seen at low temperatures in Figure 2-40
(a), is giving space to a more crystalline pattern which starts to show peaks at 553 K
(Figure 2-40 c). In Figure 2-40 (d) the system is showing a large number of peaks, most
of them at very low intensity which were attributed to a mixture of nickel borides of Ni3B
and Ni2B stoichiometries. However, further annealing of the powders temperatures,
higher than 573 K, demonstrated the formation of metallic nickel. To determine the fate
of the boron, XPS experiment were performed, revealing oxidized boron in the
powders.39
Figure 2-40. XRD patterns of nickel borides reprinted by permission from Wang, M.; Li, H.; Wu, Y.; Zhang, J. Mat. Lett. 2003, 57, 2954. Copyright Elsevier (2003). (a) to (g): XRD patterns for powders annealed at 513, 533, 553, 573, 593, 613, and 633 K under dry N2 flow for 0.5 h per spectrum.
101
Our materials did not show this behavior which may be peculiar to Ni2B and Ni3B
phases. However, a clear crystalline patterning upon heating the powder at 1100 K for 5
hours under Ar(g) was observed. At this point in time it is not possible to distinguish
which of these peaks are due to nickel borides, since we don’t have any structural file,
even though we are looking for calculated ones. However, other phases which can also
be present (nickel metal, boron oxide, nickel oxide) can be seen in a refinement. In this
case, however, the refinement will be rather poor since some of the peaks cannot be
revealed due to an incomplete model of the phases contained in the powders. In any
case, even though the amorphous matrix was still present after annealing at 1100 K for
5 h under argon, it was much less pronounced. Aging of the samples and air-handling of
the powders may have contributed to the formation of nickel and nickel oxide This result
may be comparable to those observed by Wang et al.39 who noticed the formation of
metallic nickel upon annealing under dry nitrogen atmosphere. However, even if the
formation of nickel oxide can be more evident, thanks to the reaction of the powders
with the air, it is still not clear how it is possible the formation of metallic nickel.
2.4.4 XPS
The XPS results were compared with literature data.50,80,101,103 In these studies,
nickel borides prepared from aqueous solutions were investigated with XPS. Both bulk
material and nanoparticles were investigated. To determine the oxidation state of the
nickel, experimental data were compared with Vedrine et al.103
The oldest XPS study on nickel borides was described by Okamoto et al.50 They
prepared a variety of metal borides and tested their surface composition by means of
XPS. In this work, particular relevance is given to nickel borides which have been
prepared from a number of nickel salts. Reaction products were distinguished according
102
to the solvent used in the preparation: catalysts synthesized from aqueous solution are
labeled P-1, and those synthesized from 95% ethanol solutions are labeled P-2. All data
are referenced to the C 1s peak which falls at 288.3 eV. Observed binding energies for
B 1s were found at 192 and 188.2 eV. A third peak appeared at 199 eV. This latter peak
was assumed to derive from chloride impurities in the sample. Boron lines were denoted
B-I and B-II with no further explanation. Later on, these B-I and B-II lines were identified
as oxidized boron and “elemental” boron by Schreifels et al.80 Ni 2p3/2 signals were
found at 852 eV. They were further deconvoluted into contributions from nickel metal
and nickel oxide. The nickel oxide electron binding energy was found to be 855.7 eV.50
Figure 2-41 reports the spectra from Okamoto et al.50 The B 1s and Ni 2p3/2 lines are
reported.
Figure 2-41. XPS spectra of Ni 2p3/2 and B 1s for the nickel borides prepared from nickel acetate at 30ºC, a) unwashed b) washed 3 times with water, and 3 times with 99% ethyl alcohol c) evacuated at 200ºC for 1 h, d) evacuated at 400ºC for 1 h. Reprinted by permission from Okamoto, Y.; Nitta, Y.; Imanaka, T. Faraday Trans. 1 1979, 75, 2027. Copyright, Royal Society of Chemistry
103
The second work that has been used as a reference was carried out by Schreifels
and coworkers80 in an attempt to determine the surface composition of nickel borides
with a Ni2B composition before and after the hydrogenation of organic compounds.
The main aim of this work was to understand surface modifications in terms of
composition and area before and after hydrogenation of acrylonitrile.
Results of this work are again referenced to the C 1s peak at 285 eV.
Experimental lines of nickel and boron are reported in Table 2-5. Metallic nickel
and nickel oxide was measured as the nickel references, and boron, sodium
borohydride, boric acid, and borax were measured as the boron references.
Experimental results were also compared with commercial Ni2B and Ni3B. Metallic
nickel and nickel boride lines were found between 852.6 and 853.2 eV. Nickel oxide
was observed at 852.6 eV. Boron lines ranged from 186.7 to 193.3eV.
Table 2-5. XPS B 1s and Ni 2p3/2 line positions, as reported by Schreifels et al.80 Adapted with permission. Copyright Elsevier (1980)
a Initially weak, intensifies with X-ray exposure; b Atmospheric exposure followed by H2 reduction at 400◦C; c no atmospheric exposures.
The authors state:
“The relative intensity of the lines is also a measure of the thoroughness of the grinding process which leads to smaller particles, averaging the composition between bulk and surface. Lower binding energies are attributed to the boride species, while higher binding energy was attributed to superficial boron oxide species.”80
The bulk stoichiometry of the samples under study, in this work, was determined to
be Ni:B = 2:1. Experimental XPS spectra from this work are shown in Figure 2-42.
Figure 2-42. XPS spectra showing the Ni 2p3/2 and B 1s lines observed by Schreifels, J. A.; Maybury, P. C.; Swartz, W. E. J. Catalysis 1980, 65, 195. Copyright Elsevier (1980). a) no atmospheric exposure b) after atmospheric exposure and followed by reduction with hydrogen at 400ºC. Reprinted by permission.
The XPS technique is an inherently surface-sensitive method and scans only the
first few atomic layers (approx. 5 to 10 Å deep). The cited publications assume a
105
homogeneous composition of the samples with very little differences between surface
and bulk which may be questionable under normal atmospheric conditions.
No references were found for XPS studies on boron-rich nickel borides and we will
use the published spectra to compare and distinguish our own experimental results.
Experimental spectra of the NiBx powders show nickel peaks only in the region of
855 eV. This particular energy value corresponds to Ni(II) and is normally found for
NiO.50,80,103 X-ray diffraction indicated (see Paragraph 2.3.4.2) the presence of some
nickel oxide in the powders. However, the nickel oxide phase was not the principal
phase of the nickel borides samples, even after extended exposure to air. Of course,
the grinding process using mortar and pestle in the presence of oxygen may have
increased the amount of nickel oxide. While nickel oxide is clearly visible on the surface
through the XPS spectra the X-ray diffraction data actually showed comparably larger
amounts of nickel metal (see the Paragraph 2.3.4.3) in the samples. However, the only
XPS peaks observed for nickel were the ones found in the nickel oxide range (855 eV).
No signals where observed at 852 eV where the Ni0 lines are expected. This indicates a
heterogeneous composition of nickel oxides on the surface with deposits of nickel metal
(perhaps in the form of nanoparticulate metal deposits) in the bulk of the powder.
Evidence for metallic nickel also comes from EPR spectra which demonstrate
ferromagnetic resonance (see appendix Figure A-9).
The XPS experiments showed B 1s peaks at ~182 eV and 192 eV. The 182 eV
value is anomalously low and has not been reported before in the literature. Comparing
this result with those of the MgB2 B 1s lines, the peak position for the nickel borides
appears shifted to lower binding energies by about 5 eV. The normal energy range, for
106
boron 1s peaks in nickel borides is between 4 and 5 eV.50,80 A difference of 4.23 eV was
found experimentally for commercial MgB2, but the two boron signals, in NiBx are
separated by about 10 eV which is twice the reported energy difference for the boron
peaks in nickel-rich nickel borides.50,80,101 It is not clear what causes this behavior in the
powders. The lack of signal at the Ni0 line (852 eV) caused us think about an overlap of
the nickel and nickel oxide signals. Perhaps that NiBx shows electronic back-donation
from the boron framework to the metal framework, even if, up to now, no evidence has
been found for such behavior. However, all the nickel rich phases never showed such
behavior. On the other hand, similar behavior was predicted for the calculated NiB3
structures.81 Results from calculations are presented in Figure 2-43.
Figure 2-43. Electron density difference of Ni2B, Ni3B, and NiB3. Isodensity surfaces are at the following values: 0.012, 0.045, 0.045 and 0.040 electrons/Å3. Representing colors: charge depletion, yellow; charge accumulation, blue.
107
According to this hypothesis, the Ni0 lines are shifted to 855 eV, i.e., about 3 eV
higher compared to its usual position. Thus we would interpret the observed Ni lines not
as due to nickel oxides but rather as a nickel compound bound to B atoms, potentially
with a similar oxidation number of +2. On the other hand, the boron (B0) signal is found
at lower energy of about 5 eV, compared to the usual B0 line positions. The shift in
energy for both elements is not the same, and therefore the hypothesis of electronic
backdonation from boron framework to nickel framework still needs to be verified with
additional experiments.
2.4.5 Quantitative Elemental Analysis
The elemental analysis of boron and nickel outlined in chapter 2-3 revealed an
atomic ratio of B:Ni of approximately 2. This is expected if the formation of these nickel
borides is passing through an initially slow formation of metastable metal borohydrides
followed by a decay path to the metal borides (see Paragraph 2.1). Since no diboranes
were observed in our experiments all the boron should be found in the solid material
either in the form of nickel boride or unreacted borohydrides. The ICP-AES elemental
analysis allowed us to confirm a specific ratio of B:Ni of 2.1.
The XRD patterns of the as-prepared powders and careful quantitative analysis of
the left-over borohydride reactant suggested a 3.2 B:Ni ratio. It should be noted that this
analysis is somewhat vague as it depends on the difficult quantitation of XRD patterns
and the subtraction of relatively large numbers which necessarily incurs relative large
errors. Nevertheless, it also confirms the fact that our powders contain a boron-rich
nickel boride material. Further quantification of the metallic Ni in our samples may be
appropriate since this may reveal yet a different stoichiometry of NiBx with x > 2
depending on how much nickel is bound in the metallic state.
108
However, the relative amount of boron and nickel, clearly, is not necessarily giving
the stoichiometry of the NiBx molecule, since the powders may be affected by foreigner
contaminants such as Na+ and Br- which can still be present even after the hydrolysis
performed to remove all the water-soluble contaminants (NaBH4 and NaBr).
2.4.6 Morphology of NiBx
Data from the microscopy studies were compared with earlier work by Birajdar et
al.102 and Portehault et al.45 In particular the experimental EDXS spectra were
compared with the reported ones.
The first study was intended to quantitatively reveal boron content using
microscopy (TEM and SEM) on crystalline MgB2. The aim of this paper was to analyze
the response of boron atoms when performing energy dispersive spectroscopy, which is
based on X-ray fluorescence.102 The principal goal of Birajdar’s paper was to obtain
spectroscopic information from the response of the boron atoms, even though this
element is a poor X-ray scatterer. The TEM and the B-related EDXS spectrum from
Birajdar et al.102 are presented in Figure 2-44.
It has been found that the X-ray fluorescence of boron atoms is very sensitive to
the observation angle relative to the source.102 Relatively accurate elemental quantities
can be deduced using energy dispersive spectroscopy only for those surfaces normal to
the electron beam.
Therefore, when the sample contains light elements of interest, such as boron,
care needs to be taken in analyzing the spectra. The main problem is that techniques
like EDXS are not quantitative in the determination of the atomic composition, even
though a rough estimate might be obtained.
109
Figure 2-44. TEM image and relative EDXS for MgB2 reprinted by permission from B. Birajdar, N. Peranio, O. Eibl, Microsc. Microanal, 2007 Vol.13 (Suppl. 3), 290 - 291. Copyright (2007) Cambridge Journals.
In another study, Portehault et al.45 reported the EDXS spectrum obtained from
their samples (NbB2) which is presented in Figure 2–45.
The spectrum showed an intense peak in the low energy range, which was
Both references helped in the determination and assignment of the boron peak in
our experimental spectra. In fact, comparing Figure 2-44 and Figure 2-45 with Figure 2-
30, it appears clear that the boron content in our powders is higher than those in the
literature. However, it should be noted that these intensities do not allow for a
quantitative analysis. In fact, when analyzing the supported powders shown in Figure 2-
31 the carbon and boron peaks are comparable. This means that in doing this
experiment, the powder could have been contaminated by some carbon left from the
solvent used to deposit it on the sample holder which was not completely evaporated.
However, literature data show that EDXS performed on light elements such as B is
rather poor when it is time to obtain quantitative data.
While it is not clear whether our sample contains a homogeneous NiB2 phase and
the possibility is still open that higher B:Ni ratios may be present within the actual nickel
boride contained in our powders, our results confirm the initial hypothesis that milling of
the solid reactants nickel bromide and sodium borohydride will form and opens up a
facile route to boron-rich nickel borides. However, elemental boron could not be directly
detected nonetheless the extensive efforts, and the various analytical techniques used.
It is mainly due to intrinsic difficulty to find elemental boron. In fact 1) the ICP-AES has
given the total amount of boron per gram of substance versus the total amount of nickel
per gram of substance. However it does not specify the oxidation state of the element;
2) IR did not reveal any particular boron vibration; 3) XPS revealed an anomalous peak
which is found at energies that are too low as compared with data regarding elemental
boron.50,80
111
CHAPTER 3 CATALYSIS OF NICKEL BORIDES
3.1 Experimental Results
It should be noted that experiments described in this chapter showed that the
nickel borides are not catalysts in the narrow sense since they participate in the reaction
and may not be fully recovered after a cycle. Their mode of action is more in line with
calling them reaction promoters. Nevertheless, the term “catalyst” will be used in this
chapter repeatedly and is meant in a wider sense that includes “promoters.”
Hydrolysis of highly alkaline solutions of sodium borohydride was performed using
both supported and non-supported amorphous NiBx. The active material is assumed to
be a nickel boride with a stoichiometry of NiB2 based on elemental analysis described in
chapter 2. of the kinetics of hydrogen evolution from borohydride at pH ~14.00 was
studied in the presence and absence of the nickel boride material. Both the supported
and unsupported nickel boride were used. Reactions were conducted at room
temperature and pressure. The volumes of the evolved hydrogen were determined by a
Torricellian barometer described in Figure 2-1.
Experiments were performed at room temperature as well as at elevated
temperatures in order to obtain information about the activation energy for the reaction.
The temperature of the reaction vessel was controlled by a mineral oil bath and a
thermometer to measure the temperature to ±0.1ºC.
Reactions were performed using about 1.5 mmol of sodium borohydride for each
trial. Fresh 1 M NaOH solutions were prepared for each trial, dissolving 4.0 grams of
NaOH pellets (Fisher) in 100 mL of Nano Pure Water (Barnstead, 18.2 MΩ·cm-1). The
amounts of nickel borides used were 0.10 grams of the unsupported and 1.0 g of the
112
supported powders which allowed comparison of the effect maintaining a comparable
activity of the mediating material.
Sodium borohydride and the mediating material were placed in a vacuum flask
equipped with a magnetic stirrer. The flask was sealed with rubber septa and connected
to the barometer. A timer with precision of ±1 sec was used for reading the time. 10 ml
of the 1 M sodium hydroxide solution where inserted into the vessel using a syringe
penetrating the rubber septum and simultaneously starting the timer. This allowed the
measurement of evolved hydrogen volume with time elapsed.
Figure 3-1 represents the kinetics of the hydrogen evolution from three reactions.
Figure 3-1. Kinetics of hydrogen evolution for various reactions. Diamonds: not catalyzed. Circles: supported catalyst. Squares: Unsupported catalyst.
Mediated reactions are rather fast, evolving almost all the hydrogen (88%) from
the solutions within 20 minutes. In comparison the non-catalyzed reaction (control) does
not lead to any observable hydrogen evolution in the same time frame under the
conditions of pH, temperature, and pressure used. Table 3-1 reports the relative yields
113
of hydrogen evolution. The fundamental reaction taking place consumes sodium
borohydride according to Equation 3-1:
𝑎 𝑎 (3-1)
Table 3-1. %-yield of hydrogen evolution from catalyzed hydrolysis of sodium borohydride: NC stands for Non-Catalyzed, UP stands for Unsupported Powder and SC stands for Supported Powder (mediated reactions).
Additional studies were performed to determine the stability of the powders after
successive cycles of hydrogen evolution.
The surface area of the catalytic materials was determined through BET
(Brunauer-Emmett-Teller) adsorption isotherm experiments. This technique uses the
adsorption and desorption of N2 on solid materials at 77 K and its theory is well
described in the literature.104 BET analysis showed a high surface area of 146 m2/g for
the 1:10 supported powders. However, the surface area degrades rapidly upon
repeated catalytic cycles. In Figure 3-2 the surface areas of both the supported and
unsupported powders are plotted against catalytic cycles. In fact, after only 3 catalytic
114
cycles the surface of the supported powder was degraded from a high of 146 m2g-1 to
just 16 m2g-1.
Analogous results were found for, the unsupported powder, whose surface
degraded from 11.25 m2g-1 to 0.67 m2g-1 after only one cycle of hydrogen evolution.
Kinetic cycles and the BET surface area versus number of cycles are shown in
Figures 3-2 and 3-3.
Kinetic analysis of the reaction using the supported catalyst showed fast evolution
during the first cycle reaching the end-point of hydrogen evolution after just 5 minutes.
The second kinetic cycle already showed a much slower hydrogen evolution with the
end-point apparently still not reached after 1 h. In the third cycle the powder is almost
inert toward the solution.
This result shows that it is questionable whether the NiBx materials are true
catalysts since they lose their activity too quickly.
Figure 3-2. Kinetics of hydrogen evolution during different catalytic cycles.
115
Figure 3-3. Surface area versus number of cycles of the supported material. The red line represents an exponential fit curve of the surface area to guide the eye. However, this does not mean that the surface area decays in an exponential fashion.
Results for the unsupported catalyst are shown in Figures 3-4 and 3-5.
In the literature, many nickel borides have been cycled for more than 200 times.6
Unfortunately, no elemental analysis was performed after the cycles of hydrogen
evolution to determine the composition, structure, and quantity of the nickel boride
before and after the reaction which would allow to verify if the powders are true
catalysts. It is clear that either the NiBx gets poisoned rather quickly or there is a
concurrent loss of the active ingredient which leads to loss of activity during subsequent
cycles.
For this reason we may consider the material as an additive which promotes the
hydrogen evolution through hydrolysis of alkaline solutions of sodium borohydride.
116
Figure 3-4. Kinetics of the unsupported catalyst during successive cycles.
Figure 3-5. Decay of the surface area for the unsupported catalyst after successive cycles.
117
The observed fast breakdown of the sample activity suggests the presence of side
reactions during catalysis. One can test this by analyzing the products. With regards to
this question the literature simply implies that all catalyzed reactions of this type yield
NaBO2 as the only product.6-8,39,40 However, no experimental analysis has been
published on the structure/composition of the products of reaction. Analysis of the
products is not only important for the determination of their composition which can prove
if the material used is a true catalyst or just a promoter of the reaction, but also in the
formulation of a reaction mechanism.
In Paragraph 3.2 we will explore the energetics of the reactions, both the
supported and unsupported nickel boride-mediated reactions and the non-mediated
reactions.
3.2 Energetics of the Reactions
The apparent activation energies of the reactions are described in this chapter.
Temperature-dependent hydrogen evolution was carried out at 30ºC, 40ºC, 60ºC,
and 85ºC.
The results are summarized in Figure 3-6.
The simplest model that can describe the linear increase of hydrogen evolution is
a 0th order reaction. In this case the increment of the hydrogen concentration with time
(
) is equal to the rate constant, since the initial concentration of gas is [P]0 = 0.
(3-2)
The reaction constant, obtained through the initial velocities method, i.e., through
linear regression of the hydrogen evolution curve, has the dimension of mL/s. This has
118
to be converted to concentration units assuming the hydrogen gas to behave as an
ideal gas:
Figure 3-6. Kinetics of the reactions at 30ºC, 40ºC, 60ºC, and 85ºC for uncatalyzed reactions and reactions catalyzed with the supported and unsupported catalyst.
𝑃 𝑛 (3-3)
Where P* is the external pressure corrected by the vapor pressure at room
temperature. T is the temperature of the hydrogen evolution reaction, and V is the
observed volume. Rearranging the equation yields:
𝑛
(3-4)
The kinetic constants were, then converted, with units of mol/L·s, (dividing the
moles of hydrogen so obtained, by the volume of water used for the hydrolysis, which
was held constant at 10 mL for each trial, and neglecting the amount reacted) which
were needed for 0th order reaction. The kinetic constants and relative errors are shown
119
in Table 3-2. Errors have been calculated using error propagation, assuming that the
variations due to the atmospheric pressure and the water vapor pressure are negligible
with respect to the instrumental errors (temperature, volume). Although this is a rather
cursory way to obtain activation energies for the reactions it allows us at least in
principle to compare the activities of the supported and unsupported catalysts using an
apparent activation energy.
Table 3-2. Temperatures and constants for the three sets of reactions
However, 0th order kinetic reactions imply that the reaction rate constant is
independent of reactant concentration. According to Retnamma, Novais and Rangel,
the reaction seems not to follow 0th order reactions, because the different
concentrations of sodium borohydride (especially in highly concentrated solutions) alter
the rates of the reactions, altering the ionic strength effects. However, many papers
reported 0th order reaction for catalyzed reactions.20
Activation energies were calculated using the Arrhenius equation:
(3-5)
The Arrhenius model is the simplest model able to explain the temperature
dependence of the rate constants. The pre-exponential factor, A, gives an indication of
1 This value has been estimated since we could not use the initial rates method to determine this
constant. The rule of thumb used is for a reaction rate which doubles every 10 K under same external conditions.
120
the frequency of favorable collisions between the atoms (or molecules) forming
products. Ea represents the energy barrier that the reactants have to overcome to form
products. Generally, experimental values are plotted as the natural logarithm of k versus
the inverse temperature, 1/T (temperature units is K), the so-called Arrhenius plot. The
activation energy can be obtained through a linear regression of the experimental points
in this representation. The experimental results are shown in Figure 3-8 and give the
following activation energies: 88±12 kJ/mol for the non-catalyzed reaction; 46±7 kJ/mol
for the reaction conducted in the presence of the supported powder and 38±2 kJ/mol for
the reaction conducted in the presence of the unsupported powder.
However, due to the limited amount of experimental points which can be collected,
through this experiment, the assumption that the points can be linearly fitted may not be
real, since errors can be very high, as it seems to be the case for the nickel borides
mediated – reactions. The errors related to the calculation of activation energies, seem
to be high: absolute errors, (calculated assuming Arrhenius behavior of the reaction) are
between 5 and 15%. This may be due to the simplicity of the model used to fit the
kinetic curves or to the fact that the calculus of the energy was not averaged across a
sufficient number of experiments. One hypothesis that can be drawn is that the
reactions are not catalyzed by nickel borides. In fact, it may be that these compounds
react releasing gradually all the boron, until they remain as amorphous nickel, in which
case the curves may be fit assuming heterogeneous catalysis over a rough surface.
However, it seems that the error from the reaction mediated by the unsupported
powders (5%) is smaller as compared with the one calculated for the same reaction
mediated by the supported powders (13%). The non-catalyzed reaction, however,
121
shows the highest error (15%) because, under the condition imposed, clearly the
sodium borohydride hydrolysis presents extreme difficulty to proceed.
Despite of the errors in the calculations of the activation energies, the simple
Arrhenius model gives a rough idea about the energies which are involved in the
heterogeneous catalysis of sodium borohydride.
Figure 3-7. Arrhenius plots for the non-catalyzed (circles), for the unsupported powder (triangles), and for the supported powder reactions (squares).
A better model for the determination of activation energies is described by the
Activated Complex Theory model applied to surface reactions.105 This model works best
for gase phase reactions which are catalyzed on metal surfaces. The simplest model
described by
(3-6)
122
is valid for a gas-solid reaction. The Activated Complex Theory describes the
kinetics on the basis of the partition functions for the reactants and the activated
complex. This model, which is more complex, gives a clearer picture at each stage of
the reaction. This is achieved using the partition function for each of the reactants and
for the transition state. Therefore, for the use of this theory, is necessary to start from a
model reaction. In literature, for this particular type of reaction, the bare non-catalyzed
hydrolysis of sodium borohydride is reported.7,8,15-20,79
For a generic reaction:
(3-7)
with kinetic constants k1 for the equilibrium forward reaction, k-1 for the equilibrium
reverse reaction and k2 for the decay of the transition state, the overall rate of reaction
will be given by:
(3-8)
Since the ratio k1/k-1 is equal to the equilibrium constant, and the equilibrium
constant can be written in terms of the partition functions of reactants and the transition
state, the rate of the reaction becomes:
(3-9)
The Activated Complex Theory can also be applied to heterogeneous catalysis.
However, the partition functions for species on the surface of the catalyst needs to be
given per unit surface area instead of unit volume. The equation for the gaseous-solid
catalyzed reaction constants then becomes:
(3-10)
123
In this equation, only qg, which is the partition function of the gas, is given per unit
volume of gas. The other partition functions are given per unit surface area. This model
is effective in describing the thermal behavior of the kinetic constants. However, this
model, in order to work properly, needs a well-known mechanism of the reaction.
According to Retnamma, Novais, and Rangel,20 several mechanisms based on different
models have been proposed. However, no agreement on the reaction mechanism has
been established to date. Furthermore, all the reactions are based on the basic
hydrolysis of sodium borohydride, which is very well known.20 Therefore, a rigorous
calculation of the activation energies needs an improved model of catalyzed (or
promoted) hydrolysis by nickel borides. In literature it is implied that nickel borides are
assumed to be catalyst. However there is not a definite proof of this assumption. In fact,
the determination of an unambiguously accepted reaction mechanism responding to
well-defined rate law is still missing. Many authors have used several kinetic laws to fit
experimental data: it seems that, in dependence of the model chosen, there is always
good agreement between the fitting equation and experimental data. 20 However, this
ambiguous result implies that the kinetic constants values will be strongly dependent
from the rate law and the model used to calculate them. A chemical analysis of the
products of reaction is very important in that the main products may not be NaBO2 and
H2.
The reactions we tested seem to show significant improvement over the non-
catalyzed reaction of hydrolysis of sodium borohydride. The apparent activation
energies showed by the Arrhenius analysis for the catalyzed reactions are 40 and 50
kJ/mol lower, respectively for the supported and unsupported nickel borides, and the
124
relative change between catalyzed reactions in activation energies between the
supported nickel borides versus the non-supported nickel boride seems not to be very
big (about 8 kJ/mol difference). However, it seems that the supported nickel boride
breaks down in a slower pace than the unsupported, as the plots of surface area versus
the hydrogen evolution cycles show. In fact the activity of the non-supported nickel
boride in the hydrogen evolution was lost after the first use, while the activity of the
supported nickel borides was lost after 3 cycles. (3 times more use of the supported
versus the unsupported nickel borides).
3.3 Identification of Reaction Products
In order to identify the reaction products they first have to be precipitated from the
solution. The following procedure was therefore implemented: 1) centrifugation at 14800
rpm for 5 minutes of the suspension after the reaction has completed; 2) solution pH
was adjusted to between 8 and 9 using a few drops of concentrated HCl; 3) water was
removed using a rotating evaporator leaving the solid salts as a microcrystalline white
residue behind. This powder contained borates and NaCl as the main reaction products.
However, the surnatant was not analyzed because of the tiny amount left after the
reaction. In fact, BET results showed that, after few tries, an accurate result could not
have been reached, since the powder left over from the reaction was so little that an
accurate result could not be achieved. The dried powder was further characterized
using FTIR spectroscopy, XRD diffraction patterns together with Rietveld refinement.
The FTIR of the powders revealed a well-defined set of vibrational bands for the
reaction products with the unsupported and supported catalyst as shown in Figures 3-8
and 3-9.
125
There is a remarkable difference between the vibrations in the lower frequency
region of the spectra between the products of the two reactions. They don’t appear to
be the same. This might be due to there being more than one possible borate
compound produced.
In order to further investigate the difference in the two reaction products we
performed XRD and Rietveld refinement.
Figure 3-8. FTIR spectrum of the reaction products using the unsupported catalyst.
Figure 3-10 shows the XRD patterns of the reaction products. For comparison the
pattern of commercial NaCl shown as well since it is one of the expected products.
These spectra, obtained from a Thermo Nicolet FT-IR spectrometer, courtesy of
Dr. Christou, University of Florida, show several differences, which lead to different
composition of the powder. However, the spectrum of the supported powders seem
slightly more resolved than the one obtained from unsupported powders and showing
also several vibrations in the range 900-1300 cm-1.
126
The patterns are again shown in d-spacing in order to directly show the observed
distances between crystal planes.
For quantitative data and in an attempt to determine the composition of the
products, we performed Rietveld refinement on the XRD patterns.
Figure 3-9. FTIR spectrum of the reaction products using the supported catalyst.
Figure 3-10. XRD patterns of the products from the catalyzed reactions. Blue: Crystalline NaCl. Red: Reaction products using the supported catalyst. Green: Reaction products using the unsupported catalyst.
127
The results are shown in Figures 3-13 and 3-14.
While the refinement was not perfect the results indicate that the relative
compositions of the two powders are different. In fact, in the case of the reaction using
the supported catalyst NaBO2 was the major boron containing crystalline compound. In
the other case it was Na3BO3. The peaks in the residuals show that other unknown
crystalline compounds are present, too.
In literature, kinetic data have been analyzed hypothesizing the reaction
mechanisms (and products) of the hydrolysis of sodium borohydride alone. However,
these data have been fitted using different kinetic laws.20
However, this clearly shows that the bare hydrolysis of sodium borohydride is a
poor model for the analysis of kinetic data, for the determination of transition states and
identification of reaction products.
In fact, the heterogeneity of the activation energies values calculated, which is
strongly dependent from the rate law chosen in analyzing the data, proves the
inconsistency of the model itself.
Furthermore, it is very difficult to establish a relationship between the activation
energies for reactions catalyzed by nickel borides, or catalyzed by other catalysts and
non-catalyzed reactions, since activation energies values are sometimes dependent
from the concentration of the catalyst itself. In fact, to accurately calculate the activation
energies of catalyzed reactions, sometimes, the concentration of the catalyst needs to
be taken into account.10,20
A more complete elemental analysis of the “catalyst”, coupled with surface area
analyses, before and after cycling the catalytic (promoting) material, need to be done.
128
Furthermore, these results prove undoubtedly that the initial model needs to be
improved, determining the reaction products and, in parallel, proposing reaction
mechanisms to hypothesize (and verify) transition state(s) of the “catalyzed” reactions,
otherwise will be very difficult to accurately and univocally determine activation energies
for this process, and compare the values using different models or rate laws.
Figure 3-11. Predicted composition of the reaction products from the reaction conducted with unsupported catalyst. Results are given in wt-%.
Figure 3-12. Predicted composition of the reaction products from the reaction conducted with supported catalyst. Results are given in wt-%.
129
Figure 3-13. Rietveld refinement of the products of the reaction performed with unsupported catalyst.
130
Figure 3-14. Rietveld refinement of the powders from the reaction performed with the supported catalyst.
131
3.4 Discussion of the Results
Hydrolysis of highly alkaline sodium borohydride mediated by NiBx is fast and
almost quantitative. In fact, we have obtained high yields of hydrogen evolution from
aqueous solutions of sodium borohydride within 20 minutes. The calculated yields
showed 95% at 303 K for unsupported promoting material and 80 % at 303 K for
supported promoting material hydrogen evolution (estimated under the assumption that
hydrogen behaves as an ideal gas). The non-catalyzed reaction did not show any
hydrogen evolution at room temperature and only small yields at higher T (see Table 3-
1). Activation energies were in the range of 42±5 kJ/mol for the NiBx–mediated reaction
with unsupported catalyst and 50±10 kJ/mol with supported catalyst. The uncatalyzed
reaction showed the widest range of energies for its activation energy from 76 to 100
kJ/mol.
Although the apparent activation energies were calculated on a single – point
basis, the experiment reached the goal of prove that the nickel borides which have been
synthesized this way are not really catalytic, but rather promoters of hydrogen evolution.
Experimental kinetic data of the reactions of hydrolysis of sodium borohydride
solutions in highly alkaline media, mediated by supported and non-supported NiB2,
showed almost 90% yield of hydrogen evolution for the unsupported powder and almost
80% yield for the supported powder, as compared to 5% from non-mediated reactions.
The mediated reaction kinetics were all fast and all the hydrogen was collected within
20 minutes from the beginning of the reaction. Activation energies are strongly affected
by the relatively small scale of temperatures experimentally used, however these
experiments gave us a rough idea of the comparative amounts of energy for the
mediated and non-mediated reactions.
132
In fact, it appears that NiBx promotes the reaction rather than catalyzing it: the
steep drop in surface area after cycling the catalyst through subsequent reactions
demonstrated that it either gets poisoned very quickly under our conditions or it actually
participates in the reaction. After 1 cycle, the unsupported material was hardly evolving
any hydrogen reaching a maximum yield of about 30%. The supported catalyst lasted
somewhat longer, but after 3 cycles its yield of hydrogen evolution had decayed to 42%.
As mentioned before, the literature implies that the only product formed after the
reaction is NaBO2 which is not correct, and a more thorough analysis of the reaction
products was missing.6,10,15-20 In our experiments using XRD and IR we find proof that
the both the supported and un-supported catalyst yield reaction products with somewhat
different compositions.
NaBO2 appears to be the main product for the reaction mediated by the supported
material. In the case of the unsupported material only a poor fit to the XRD patterns was
obtained when NaCl, NaBH4 (which should be left-over reactant), NaBO2 and Na3BO3
were considered. Clearly, other possible compounds need to be considered as well and
should be done in future work coupled with elemental analysis. In the reaction with the
supported catalyst non-negligible quantities of NaB(OH)4 were formed which are clearly
absent in the refinement of the reaction products with unsupported catalyst.
One possibility for obtaining Na3BO3 is through the formation of hydrated NaBO2
which can further react with the excess NaOH through the following scheme:
(3-11)
For the formation of NaB(OH)4, it is possible that some boron from the catalyst
reacted with the excess of sodium hydroxide, according to:
133
( ) (𝑎 ) ( ) ( ) (3-12)
Where elemental boron is oxidized to B(III).
However, it has been difficult to determine a complete reaction mechanism
because intermediates of reactions have not been found yet, and therefore further
studies need to take into account that the nickel borides may not be catalytically active
but rather promoting for hydrogen evolution from hydrolysis of alkali solutions of sodium
borohydride. Next studies need to focus on the mechanisms of action of nickel borides
and identification of transition states. In fact, the model which is usually studied, the
bare hydrolysis of sodium borohydride, is not accurate enough to determine activation
energies. Values reported by different authors, due to the variety of rate laws used fit
experimental data, are difficult to compare between them and with our results. 20 A more
complex (and more reliable) model, therefore, must make use of a well-accepted rate
law to describe the kinetic of heterogeneous catalyzed sodium borohydride hydrolyses
and a mechanism of action. Up to now, the reaction mechanisms and rate law proposed
are based on the basic hydrolysis of sodium borohdyride.20
134
CHAPTER 4 CONCLUSIONS AND FUTURE WORK
4.1 Conclusion and Remarks
Work in this thesis shows a new synthetic pathway to boron-rich nickel borides.
The nickel borides could not be completely purified which hampered the determination
of an exact stoichiometry. Based on elemental analysis the material should mainly
contain NiB2. However, higher stoichiometric boron content of B:Ni > 2 cannot be
excluded since metallic Ni was also found in these materials. It is also not possible to
exclude the possibility of a heterogeneous mixture of nickel borides of different boron-
rich stoichiometries. This work presents an important contribution to a vigorous and
sometimes contradictory debate in the literature about the existence of NiB2.46,47,53-56,59-
65,77 Microscopy revealed characteristic ridges on the surface of the grains of the
material. The spacing between these ridges was found to be 65 Å. It is known that some
metal borides, such as MgB2, show extended lattice structures, which are composed of
alternated domains of boron (elemental) and magnesium (see fig 2-9); and it is quite
possible that these ridges give evidence for intercalated Ni and B layers. EDXS spectra
confirmed high boron content in the samples.
The surface area of the catalyst decays rather fast for both the supported and
unsupported catalyst suggesting that the number of catalytic sites per unit surface area
changes over time and limits the utility of NiBx to a promoter rather than a classical
catalyst of hydrogen evolution. The rapid decay of the surface area might indicate the
presence of side reactions that involve different types of boron oxides and hydroxides.
Identification of the reaction products was performed and it was established that apart
from NaBO2 other boron oxides were formed. Na3BO3 (23 wt-%) was observed as the
135
main product in the reactions using unsupported catalyst, while for the supported
catalyst NaBO2 (49.2 wt-%) was the main product. Non-negligible quantities of
NaB(OH)4 (7.9 wt-%) were also observed in this case but was not found in the reaction
products using unsupported nickel borides.
4.2 Outlook
In order to get better and more meaningful data, higher milling power (ball or
planetary mills) connected with a vent to a device for hydrogen collection/analysis,
(such as GC/MS) is needed. This will help to determine the composition and purity of
the gas phase(s).
A crucial step in any synthetic route is purification. Unfortunately, it was not
possible to come up with a solution for the NiBx material in this contribution despite
many attempts. A more rigorous way of excluding the various boron oxides from the
catalyst is needed. The FTIR experiments would have to be repeated with higher
concentrations of the material and higher purity matrices. XPS, on our samples did not
directly detect Ni0. Next experiments may take into account Ar sputtering with
consequent XPS signals detection. Ar sputtering experiments will eliminate superficial
layers of material, possibly eliminating the oxides of nickel and boron, using laminar
argon flow; removal of the surface layers containing amorphous boron oxides may also
help to enhance or decrease the anomalous boron peak at 182 eV and allow it to be
better identified. Argon sputtering experiment, may also be useful in observing
elemental Ni0 signals.106 Once Ni0 signals have been detected, the peak positions of the
relative elements needs to be compared with literature data.
Since there is no published NiB2 crystal structure theoretical models will have to
be developed to predict its structure and serve as a basis for Rietveld refinement of the
136
experimental XRD patterns. This is especially urgent given that the predicted
stoichiometry is B:Ni = 2. If one can find structural evidence of the presence of NiB2
these theoretical models may be expanded to include spectroscopic data and even
explain the observed kinetics and lead to a reasonable mechanism for the reaction. In
fact, the fast surface degradation of the powders implies that part of the nickel boride is
reacting, most probably with NaOH.
So far, the literature assumes that the simple hydrolysis reaction of sodium
borohydride is all that there is. However, this may not be sufficient to model the nickel
boride-catalyzed reactions, at least in the case of our NiBx.6-8,10,78 The accurate
modeling of this reaction is therefore a valid future goal which will give benefits to
applying this reaction in hydrogen storage and fuel cell systems in a future hydrogen
economy.
137
APPENDIX MAGNETIC TECHNIQUES
Solid state NMR is a powerful technique that can give structural information on
solids.107 It is characterized by anisotropic, direction dependent interactions inside
solids. These interactions affect the magnetic resonance conditions and are observed
as splittings and broadening effects of nuclear resonance under study. High resolution
can be achieved using a variety of techniques, of which the most popular is magic
angle spinning (MAS).107 This technique averages out the anisotropic spin-spin
interactions using ultrafast sample rotation. The sample is placed inside a rotor which
serves as the sample holder and is allowed to spin at frequencies between 1 and 70
kHz at the magic angle of θ = 54.74º with respect to the external magnetic field.107,108
This method achieves the strong reduction or even elimination of the broadening effects
hampering conventional solid state NMR and helps facilitate spectral analysis and
assignment of NMR peaks.
Boron is found in natural abundance of two different isotopes, 11B (I = 3/2) (81.2%
isotopic abundance) and 10B (I = 3) (18.8%), both with a non-zero nuclear spin. Both
nuclei are quadrupolar which leads to additional broadening of their solid-state NMR
spectra. The 11B nuclei are more sensitive than 10B since they are more abundant and
show higher magnetic moment (3.47μN for 11B and 2.08 μN for 10B) and also show
smaller quadrupole moment (40.59 millibarn for 11B and 84.59 millibarn for 10B),
therefore are the ones that are usually studied.109 Solid state NMR on metal borides
received particular attention between the mid 1970s to the mid 1980s. Experiments
were focused on their structural characterization. The studies of Panissod et al.110,111
and Kuentzler and Lemius112 focused on boron signals in nickel boride glasses and
Co2-xMxB crystalline materials, respectively (where M stands for several foreign metals
138
used as dopants). These reports also tried to justify the magnetism of these alloys
monitoring experimental NMR signals of the of Co2-xMxB alloys.112
Panissod et al. used quadrupolar interactions to obtain information on the local
environment of boron in various nickel borides.110,111 In their work the samples were
composed of several metallic nickel-boron glasses, with higher content in nickel and
variable mole percent of boron. 11B NMR spectra constantly change with the increasing
mole fraction of boron. In order to structurally determine the local environment of boron
in the glasses, the spectra were simulated, optimizing the following parameters: 1) the
quadrupolar frequency νQ (proportional to the electric field gradient, and results from
non-cubic symmetries); 2) the asymmetry parameter η that characterize the deviations
from cylindrical geometry, and 3) σ the root mean square half width of a Gaussian
distribution2 function for amorphous samples. Figure A-1 shows the experimental
spectra of the metallic glasses of nickel borides at various mole fractions of boron.
Figure A-2 shows the spectra and the corresponding simulations of the cubic
structures of nickel borides.
Calculations together with some solid-state NMR experiments were performed on
our NiBx samples and compared with literature data.45,110,111
Magnetic studies were performed using solid-state NMR, EPR, and SQUID
measurements.
Here we present initial preliminary results which are not complete. In the future this
line of work should be continued.
2 Experimental NMR data were not simulated. The spectra were deconvoluted using three Gaussians.
The MAS technique was used in the identification of boron peaks and determination of structural data.
139
Figure A-1. Nickel boron metallic glasses, from Panissod et al., 1983, J. Magnetism and Mag. Mat., 31 – 34, 1523-1524. Reprinted by permission from Elsevier. Copyright Elsevier (1983).
Figure A-2. Nickel boron metallic glasses with cubic symmetries NMR spectra. Reprinted by permission from Panissod, et al. J. Magnetism and Mag. Mat. 1983, 31, 1523. Copyright Elsevier (1983).
140
A.1 NMR
We performed NMR on the 11B (I = 3/2) nuclei in the powders in order to determine
the environment of the boron nuclei and compare them with the literature and
theoretical calculations using NiB3. 24,113-117.
DFT calculations were performed to predict the NMR chemical shielding factors for
the orthorhombic and monoclinic structures of NiB3. This calculated isotropic shielding
parameter (σiso) is absolute and not related to a standard. In order to calculate the
chemical shifts we therefore needed to calculate the chemical shielding constant of α-
phase in crystalline boron114 and NaBH4.
Values were determined for the tetragonal (𝑃 𝑛𝑚 ) and cubic ( 𝑚) structures
of sodium borohydride. The calculated values for the αboron with a hexagonal space
group of 𝑚 were 89.52 and 91.95 ppm.
For the crystalline α-phase of boron and NaBH4, the σiso (B) values were 139.4
and 144.0 ppm, respectively. If we consider an average between the two calculated
values of the α-boron, we can obtain a calculated relative shielding constant for sodium
borohydride. This average δiso (isotropic chemical shift) for the α- boron was 90.75 ppm.
Therefore, the chemical shifts for the sodium borohydride structures were -48.6 and -
53.3 ppm, respective to the calculated shielding. In the orthorhombic structure of NiB3,
there are two distinct sets of borons whose calculated isotropic shielding were 135.09
and 171.19 ppm, respectively, for the outermost and the inner chain. Figure A-3 shows
the calculated isotropic shielding for the orthorombic structure.
141
Figure A-3. Calculated isotropic shielding for the orthorhombic structure of NiB3
These values, when referred to the calculated α- boron presented chemical shifts of
-44.4 and -80.4 ppm, respectively for the 135.090 and 171.190 ppm.
The optimized lowest energy structure for NiB3was triclinic (see Paragraph 2.2).
Since two fo the angles differed from 90º only by fractions of a degree we used a
monoclinic 𝑃 system which was easier to calculate. This fixes these angles at
exactly 90.00º.
Three different boron atoms can be distinguished in the latter structure by
theirsymmetry. The inner boron atoms have a shielding constant of 77.25 ppm, while
the lateral boron chains are more exposed to the magnetic field, and showed a shielding
constant of 50.85 ppm and 18.43 ppm, respective to the calculated average shielding
for boron atoms. Therefore, the chemical shifts are 13.49, 50.85, and 72.31 ppm. Figure
A-4 shows the structure for the latter calculated NMR parameters.
142
Figure A-4. Calculated isotropic shielding constants of the monoclinic structure of NiB3.
Experimentally, we have obtained NMR and MAS spectra using a Bruker
Advance 400 MHz spectrometer with a wide bore 9.4 T magnet (courtesy of Prof. Barò,
UAB, Spain). The NMR showed a split signal that can be decomposed into three or
more peaks. Figure A-5 shows the experimental NMR in which the lines have been
fitted using three Gaussian functions.
Results show two peaks at 5.3 and -10.2 ppm and a broad one, centered at 0.3
ppm. This has to be compared with literature data: Portehault et al.45 reports NMR
spectra for NbB2, amorphous boron, and LiBO2 . His findings are reproduced in Figure
A-6.
Both the literature spectrum, as well as our own, shows a broad peak in addition to
several narrows ones overlapping it.
Experiments were carried out at the Universidad Autonoma de Barcelona (Bella Terra, Spain) in collaboration with Dr. Sebastiano Garroni, former alumnus of professor M. A. Barò, and an international expert in
11B NMR
143
The broad signal was identified as B-B bonds since analogous broad signal was
seen in amorphous boron.45
Figure A-5. Experimental NMR spectrum of hydrolyzed (room temperature) NiBx (black) and simulation (red).The individual lines deriving from the deconvoluted fitting line are reported as well: a) line centered at -10.2 ppm; b) line centered at 5.3 ppm and c) line centered at -0.3 ppm.
Figure A-6. 11B NMR spectra reprinted by permission from Portehault et al.:45 a) NbB2, b) amorphous boron, and c) LiBO2.
c
b
a
144
However, it is difficult to arrive at a consistent structural hypothesis based on the
NMR results alone. To further understand the boron signals in our samples, MAS-NMR
experiments were performed.
The MAS spectra were acquired using a boron-free Bruker 4mm CPMAS probe
(see footnote pag.148). The frequency used to tune the probe based on the Larmor
frequency of boron was 128.33 MHz. The spectra were collected using the non-
hydrolyzed powders and used a BF3-Au complex as the standard.
The powders were packed in ZrO2 rotors in an Ar- filled glovebox and sealed with
tight fitting Kel-F caps. Sample spinning was done using dry nitrogen gas. MAS spectra
were collected at room temperature using rotation frequencies of 12 kHz, and the 1–D
MAS spectra were acquired using a 2.7 μs single π/2 pulse (corresponding to a RF
pulse of 92.6 kHz). The acquisition of the spectra was performed applying a strong
proton decoupling sequence by using the two-pulse phase modulation (TPPM) scheme.
This sequence consists of a windowless train of two pulses of length p with
opposite alternating phases (+and118
Figure A-7 shows the pulse sequence for a general TPPM.
Figure A-7. The TPPM pulse sequence. Reprinted by permission from Vinod Chandran, C.; Madhu, P. K.; Kurur, N. C.; Brauniger, T. Magn. Reson. Chem. 2008, 46, 943. Copyright (2008) Elsevier
Recovery was set at 10 seconds. The spectra were acquired at 20ºC.
145
The temperature was measured with a Bruker BCU temperature control unit.
Figure A-8 shows the 11B 1H (I = 3/2) NMR-MAS spectrum.
Figure A-8. NMR MAS spectrum of the non-hydrolyzed powders. The signals around zero ppm belong to unidentified compounds. The side bands at 100 and 200 ppm are attributed to the main NaBH4 peaks.
The sharp line at negative ppm values (-42.04 ppm), in Figure A-8, was attributed
to boron in tetrahedral [BH4-] units in NaBH4 and show MAS satellites at about 50 and
150 and 190 ppm.24 Two additional weaker and broader peaks were observed at +1.6
and +13.6 ppm. They could not be readily identified with a known compound and were
labeled as “unknown compound.” Given the analysis in the preceding chapters they
probably belong to either boron oxides and/or the NiBx. Since we determined nickel
boride stoichiometry as close to NiB2, it is reasonable to exclude the NiB3 monoclinic
phase from consideration. Calculations of a theoretical spectrum for NiB2 are under way
and will be compared to the experimental spectra.
A.2 EPR
EPR measurements were also performed on the powders. Temperature
dependent spectra were collected using an X-band Bruker Elexsys E580 spectrometer,
Unknown compounds
146
using the instrumental following parameters: magnetic field range of 7550±7500 G,
4096 data points per spectrum, 20 dB power attenuation, 60 dB receiver gain, 20.48 ms
time constant, and 81.92 ms sampling time. Spectra were acquired at temperatures
from 5 K to room temperature (291 K). The results are summarized in Figure A-9.
The signals collected covered almost 7000 G (nearly half of the full width of the
magnetic field intensity range of this instrument). Such broad signals are often a
signature of ferromagnetic compounds. In this case they are probably due to the
formation of nickel nanoparticles inside the powders which was also confirmed by XRD
where reflections due to metallic Ni were observed. The line positions in the spectra are
somewhat temperature dependent and the linewidths decrease with increasing
temperatures. The broadest spectrum, taken at the lowest temperature, feels the initial
application of the magnetic field, which aligns the spin domains in the ferromagnetic
sample. However, after the first spectrum, the spin remains aligned, and therefore,
subsequent spectra look very different from the first one because of the different
orientation of the sample spin domains. Lefondeur et al. 119demonstrated that the
electronic g-factor and the EPR peak-to-peak linewidth in nickel nanoparticles is
dependent on temperature, since the spin-spin and the spin-lattice relaxation times
depend strongly from the temperature, according to the Curie- Weiss law, which
describes the magnetic susceptibility in function of a ferromagnet under the application
of an external magnetic field, above a certain critical temperature, called Curie
temperature. The equation used to describe this behavior is the following:
A-1
147
Where C is a specific Curie constant which depends from the material studied and
TC is the Curie temperature expressed in K as the temperature.120
Nickel-rich nickel borides usually show diamagnetic or slightly paramagnetic
properties.63,101,110,111 I
Figure A-9. Temperature dependent EPR spectra of the non-hydrolyzed powders.
A.3 SQUID
In order to confirm the ferromagnetic behavior of the nickel borides, SQUID
measurement were performed. Hysteresis curves were collected between 1.8 and 10 K.
Figurs A-10 summarizes the results from the SQUID measurements. Experimental data
are then compared with the work from Legrand et al.,101 whose data are presented in
Figure A-11.
As can be seen in Figure A-10, the samples show only little ferromagnetic
hysteresis and the maximum is reached at 1.8 K (lowest instrumental temperature) and
almost disappears at 10 K. This result confirms the ferromagnetic nature at low
148
temperature and also suggests that the sample contains ferromagnetic particles, i.e., is
not completely ferromagnetic.
Figure A-10. Hysteresis cycles at temperatures between 1.8 and 10 K. The inset shows the coercivity curve.
In order to clarify if nickel nanoparticles are responsible for this behavior we
compared our results with the work of Legrand et al.101 There, nickel boride Ni3B
nanoparticles had been synthesized and were characterized by XPS and magnetic
measurements. SQUID measurements on samples stored in air showed a hysteresis at
nearly 3 K. It disappeared when the nanoparticles were stored under nitrogen.
According to Legrand et al.101 this hysteretic behavior was attributed to the formation of
Ni0 clusters when the nanoparticles were stored under normal atmospheric conditions.
Similarly, nickel nanoclusters may have formed in our samples because the samples
were handled and stored/aged in air. Figure A-11 shows the hysteresis of the nickel
nanoparticles observed by Legrand et al.101
149
Figure A-11. Hysteresis of nanoparticles stored in open air (A) and under nitrogen (B). Reprinted by permission from Legrand, J.; Taleb, A.; Gota, S.; Guittet, M.-J.; Petit, C. Langmuir 2002, 18, 4131. Copyright (2002) American Chemical Society.
150
LIST OF REFERENCES
(1) Grochala, W.; Edwards, P. Chem. Rev. 2004, 104, 1283 (2) D.O.E., Ed. www.hydrogen.energy.gov, 2006. (3) U.S. Department of Energy - Energy Efficiency and Renewable Energy: http://www1.eere.energy.gov/hydrogenandfuelcells/storage/hydrogen_storage.htm, 2012. (4) Gosalawit-Utke, R.; Bellosta von Colbe, J. M.; Dornheim, M.; Jense, T. R.; Cerenius, Y.; C., B. M.; Peschke, M.; Bormann, R. J. Phys. Chem. C 2010, 114, 10921. (5) Bogdanovic, B.; Schwickardi, M. J. Alloys and Compounds 1997, 253-254, 1. (6) Hua, D.; Hanxi, Y.; Xinping, A.; Cha, C. Intl J. of Hydrogen Energy 2003, 28, 1095. (7) Liu, B. H.; Li, Z. P.; Suda, S. J. All. Cpds. 2006, 415, 288 (8) Liu, B. H.; Li, Z. P. J. Power Sources 2009, 187, 527 (9) Acosta, D.; Ramirez, N.; Erdmann, E.; Destefanis, H.; Gonzo, E. Catalysis Today 2008, 133, 49 (10) Hung, A. J.; Tsai, S. F.; Hsu, Y. Y.; Ku, J. R.; Chen, Y. H.; Yu, C. C. Intl J. of Hydrogen Energy 2008, 33, 6205 (11) Pistidda, C.; Garroni, S.; Bonatto Minella, C.; Dolci, F.; Jensen, T. R.; Nolis, P.; Bosenberg, U.; Cerenius, Y.; Lohstroh, W.; Fichtner, M.; Baro, M. D. J. Phys. C: Solid State Phys. 2010, 114, 21816 (12) Pistidda, C.; Garroni, S.; Dolci, F.; Bardaji, E. G.; Khandelwal, A.; Nolis, P.; Dornheim, M.; Gosalawit, R.; Jensen, T.; Cerenius, Y.; Surinach, S.; Baro, M. D.; Lohstroh, W.; Fichtner, M. J. All. Cpds. 2010, 508, 212 (13) Stock, A. Hydrides of boron and silicon; Cornell University Press: Ithaca, N.Y., 1933. (14) Schlesinger, H. I.; Brown, H. C.; Finholt, A. E.; Gilbreath, J. R.; Hoekstra, H. R.; Hyde, E. K. J. Am. Chem. Soc. 1953, 75, 215 (15) Churikov, A. V.; Gamayunova I.M.; Zapsis, K. V.; Churikov, M. A.; Ivanischev, A. V. Intl. J. Hydrogen Energy 2012, 37, 335.
(16) Sahin, O.; Dolas, H.; Kaya, M.; Sait Izgi, M.; Demir, H. Intl. J. Energy Res. 2010, 34, 557. (17) L., Y.; Matthews, M. A. Intl. J. Hydrogen Energy 2011, 36, 7416. (18) Demirci, U. B.; Akdim, O.; Andrieux, J.; Chamoun, R.; Miele, P. Fuel Cells 2010, 3, 335. (19) Akdim, O.; Demirci, U.; Muller, D.; Miele, P. Intl. Journal of Hydrogen Energy 2009, 34, 2631. (20) Retnamma, R.; Novais, A. Q.; Rangel, C. M. Intl. J. Hydrogen Energy 2011, 36, 9772. (21) Varin, R. A.; Czujko, T.; Wronski, Z. S. Nanomaterials for Solid State Hydrogen Storage; Springer, 2008. (22) Schlesinger, H. C.; Brown, H. R. J. Am. Chem. Soc. 1940, 62, 3429 (23) Goerrig, D. In Verfahren zur Herstellung von Boranaten Germany, 1958; Vol. GE 1 077644. (24) Garroni, S.; Milanese, C.; Pottmaier, D.; Mulas, G.; Nolis, P.; Girella, A.; Caputo, R.; Olid, D.; Teixdor, F.; Baricco, M.; Marini, A.; Surinach, S.; Baro, M. D. J. Phys. C: Solid State Phys. 2011, 115, 16664. (25) Hwang, S.-J.; Bowman, R. C.; Reiter, J. W.; Rijssenbeek; Soloveichik, G. L.; Zhao, J.-C.; Kabbour, H.; Ahn, C. C. J. Phys. C: Solid State Phys. 2009, 112, 3164. (26) Wu, C.; Wu, F.; Bai, Y.; Yi, B.; Zhang, H. Mater. Lett. 2005, 59, 1748. (27) Davis, R. E.; Bromels, E.; Kibby, C. L. JACS 1962, 84, 885. (28) Davis, R. E.; Kibby, C. L.; Swain, C. G. JACS communication to the editor 1960, 82, 5950. (29) Yu L.; Mattews, M. A. Intl. J. Hydrogen Energy 2011, 36, 7416. (30) Fan, W.; Li, W.; Ma, X.; Tao, X.; Li, X.; Yao, Y.; Xie, X.; Zhang, Z. J. Org. Chem. 2011, 76, 9444 (31) Kasparian, A. J.; Savarin, C.; Allegeier, A. M.; Walker, S. D. J. Org. Chem. 2011, 2011, 9841 (32) Acosta, D.; Martinez, J.; Carrera, C.; Erdmann, E.; E., G.; Destefanis, H. L.A.A.R. 2006, 36, 317.
152
(33) Brown, C. A. J. Org. Chem. 1970, 35, 1900. (34) Buisson, P.; Paul, R.; Joseph, N. Ind. & Eng. Chem. 1952, 44, 1006 (35) Collins, D. J.; Smith, A. D.; Davis, B. H. Ind. Eng. Chem. Prod. Dev. 1982, 21, 279 (36) Ganem, B.; Osby, J. O. Chem. Rev. 1986, 86, 763 (37) Liaw, B. J.; Chiang, S. J.; Tsai, C. H.; Chen, Y. Z. Appl. Catal. A: Gen. 2005, 284, 239 (38) Skrabalak, S. E.; Suslick, K. S. Chem. Mater. 2006, 18, 3103. (39) Wang, M.; Li, H.; Wu, Y.; Zhang, J. Mat. Lett. 2003, 57, 2954 (40) Wang, M.; Li, H.; Wu, Y.; Zhang, J. J. Catalysis 2003, 214, 15 (41) Wong, S. T.; Lee, J. F.; Chen, J. M.; Mou, C. Y. J. Mol. Cat. A.: Chemical 2001, 165, 159 (42) Jeon, E.; Cho, Y. W. J. All. Cpds. 2006, 422, 273. (43) Srnivasan, S.; Escobar, D.; Goswami, Y. Y.; Stefanakos, E. Intl J. of Hydrogen Energy 2008, 33, 2268 (44) Srnivasan, S.; Escobar, D.; Jurczyk, M.; Goswami, Y. Y.; Stefanakos, E. J. All. Cpds. 2008, 462, 294. (45) Portehault, D.; Devi, S.; Beaunier, P.; Gervais, C.; Giordano, C.; Sanchez, C.; Antonietti, M. Angew. Chem. Intl. Ed. 2011, 50, 3262 (46) Howe, J. L. Inorganic Chemistry Review 1908, 618 (47) Howe, J. L. Inorganic Chemistry Review 1909, 1284 48) Finch, C. B.; Cavin, O. B.; Becker, P. F. J. Cryst. Growth 1984, 67, 556 (49) Kapfemberger, C.; Hofmann, K.; Albert, B. Solid St. Sci 2003, 5, 925 (50) Okamoto, Y.; Nitta, Y.; Imanaka, T. Faraday Trans. 1 1979, 75, 2027 (51) Rundqvist, S. Acta Chemica Scandinavica 1959, 13, 1193 (52) Rundqvist, S.; Pramatus, S. Acta Chemica Scandinavica 1967, 21, 191
153
(53) Sobolev, A. S.; Fedorov, T. F. Inorg. Mat. 1967, 3, 643. (54) Sobolev, A. S.; Fedorov, T. F. Inorg. Mater. 1967, 3, 723. (55) Portnoi, K. I. Transl. from Dokl. Akad. Nauk SSSR 1966, 169, 1104 (56) Portnoi, K. I.; Romashov, V. M.; Chubarov, V. M.; Levinskaya, M. K.; Salibekov, S. E. Transl. from Phoroskovaya Metallurgiya 1966, 2, 15 (57) Decker, B. F.; S., K. J. Acta Cryst. 1960, 13. (58) Rakovich E.; Sviridov, V.; Gaevskaya, T. Inorg. Mater. 2000, 576 (59) Ajao, J. J. Mat. Sci. 1988, 23, 1112. (60) Battezzati, L.; Antonione, C.; Baricco, M. J. All. Cpds. 1997, 247, 164. (61) Kaufman, L. J. Thermochem. 1984, 8, 25 (62) Kolomytsev, P. T. Izv. Akad. Nauk. SSSR, Otd. Tekh. Nauk. Metall. Topl. 1960, 83 (63) Kostetskiy, I. I.; L'vov, S. N. Fiz. Metal. Metalloved. (English translation) 1972, 33, 773 (64) Romashov, V. M.; Timofeeva, N. I.; Frolova, K. I.; Romanovich, I. V. Poroshkovaya Metallurgiya (Eng. Transl.) 1970, 9, 80 (65) Smirnyagina, N. N.; Sizov, I. G.; Semenov, A. P. Inorg. Mater. 2002, 38, 39 (66) Andersson, L. H.; Kiessling, R. Acta Chemica Scandinavica 1950, 4, 160 (67) Kiessling, R. Acta Chemica Scandinavica 1950, 4, 209 (68) Corrias, A.; Ennas, G.; Marongiu, G.; Musinu, A.; Paschina, G.; Zedda, D. Mat. Sci. and Eng.:A 1995, 204, 211 (69) Nazarian - Samani, M.; Reza Kamali, A.; Mobarra, R.; Nazarian - Samani, M. Mat. Lett. 2010, 64, 309 (70) Kolmogorov, A.; Curtarolo, S. Phys. Rev. B. 2006, 74, 1. (71) Lassoued, S.; Gautier, R.; Boutarfaia, A.; Halet, J. F. Organomet. Chem 2010, 695, 987
154
(72) Mansour, A. Phys. Rev. B. 1997, 55. (73) Mohn, P.; Pettifor, D. G. J. Phys. C: Solid State Phys. 1988, 21, 2829 (74) Witusiewicz, V. T. Thermochimica Acta 1995, 264, 41 (75) Molvinger, K.; Lopez, M.; Court, J. J. Mol. Cat. A.: Chemical 1999, 150, 267 (76) Molvinger, K.; Lopez, M.; Court, J. Tetrahedron: Asymmetry 2000, 11, 2263 (77) Molvinger, K.; Lopez, M.; Court, J.; Chavant, P. Y. Appl. Catal. A: Gen. 2001, 231, 91 (78) Chen, Y. Z.; Chen, Y. C. Appl. Catal. A: Gen. 1994, 115, 45 (79) Pinto, A. M. F. R.; Falcao, D. S.; Silva, R. A.; Rangel, C. M. Intl. J. Hydrogen Energy 2006, 31, 1341. (80) Schreifels, J. A.; Maybury, P. C.; Swartz, W. E. J. Catalysis 1980, 65, 195. (81) Caputo, R.; Guzzetta, F.; Angerhofer, A. J. Inorg. Chem. 2010, 49, 8756 (82) Bradley, A.; Taylor, A. Phylos. Mag. 1937, serie 7, 1049 (83) Saniz, R.; Ye, L. H.; Shihidou, T.; Freeman, A. Phys. Rev. B. 2006, 74. (84) Sato, S.; Kleppa, O. Metall. Trans. B. 1982, 13B, 251. (85) Roman, P.; Gutierrez-Zorrilla, J. M. J. Chem. Ed., 1985, 62, 167. (86) Klancnik, G.; Medved, J.; Mrvar, P. J. Materials and Geoenvironment 2010, 57, 127. (87) Badeshia, H. K. D. H. In University of Cambridge, Material Science and Metallurgy. (88) Andes Hess, B., Jr.; Schaad, L.; Carsky, P.; Zahradnik, R. Chem. Rev. 1986, 86, 709. (89) Harvey, K. B.; McQuacker, N. R. Can. J. Chem. 1971, 49, 3272. (90) Filinchuk, Y.; Hagemann, H. European J. Inorg. Chem. 2008, 3127.
155
(91) Sundar, C. S.; Bharathi, A.; Premila, M.; Sairam, T. N.; Kalavathi, S.; Reddy, G. L. N.; Sastry, V. S.; Hariharan, Y.; Radhakrishnan, T. S.; Material Science Division, Indira Gandhi Centre for Atomic Research: Kalpakkam, India, 2001, p 1. (92) Akimitsu, J. In Symposium on Transition Metal Oxide 2001. (93) Nagamatsu, J.; Nakagawa, N.; Muranaka, T.; Zenitani, Y. 2001. (94) Goriletsky, V. I.; Mitichkin, A. I.; Belenko, L. E.; Rebrova, T. P. Semiconductors, Physics, Quantum electronics and Optoelectronics 2001, 4, 139. (95) West, A. Solid State Chemistry; John Wiley and Sons: Norwich, 1984. (96) Rietveld, H. M. J. Appl. Cryst. 1969, 2, 65. (97) Birkenstock, J.; Fischer, R.; Messner, T. Ber. DMG, Beih. z. Eur J. Mineral. 2003, 15. (98) McCusker, L. B.; Von Dreele, R. B.; Cox, D. E.; Louer, D.; Scardi, P. J. Appl. Cryst. 1999, 32, 36 (99) Blum, P. J. Phys. Radium 1952, 13, 430. (100) Hill, R. J.; Howard, C. J. J. Appl. Cryst. 1987, 20, 464. (101) Legrand, J.; Taleb, A.; Gota, S.; Guittet, M.-J.; Petit, C. Langmuir 2002, 18, 4131 (102) Birajdar, B.; Peranio, N.; Eibl, O. Microsc. Microan. 2007, 13, 290 (103) Vendrine, J. C.; Hollinger, G.; Duc, T. M. J. Phys. Chem. 1978, 82, 1515. (104) Brunhauer, S.; Emmett, P. H.; Teller, E. J. Am. Chem. Soc. 1938, 60, 309. (105) Houston, P. L. In Chemical Kinetics and Reaction Dynamics; McGraw-Hill: New York, 2001, p 181. (106) Barr, T. L. J. Phys. Chem. 1978, 82, 1801. (107) Schurko, R. http://mutuslab.cs.uwindsor.ca/schurko/ssnmr_schurko.pdf, 2009. (108) Hennel, J.; Klinowski, J. Topics in Current Chemistry 2005, 246, 1. (109) Hoffman, R.; Ozery, Y. http://chem.ch.huji.ac.il/nmr/techniques/1d/row2/b.html, 2011-02-24; Vol. 2012.