Solid Waste Management in Vietnam An Industrial Ecology Study by Thao Nguyen School of International and Public Affairs, Columbia University Adviser: Prof. Nickolas J. Themelis, Earth and Environmental Engineering Abstract In the past decade, strong economic growth and uncontrolled urbanization have greatly magnified the problems with Vietnam’s solid waste management system, pushing waste management to the forefront of environmental challenges with which it must contend. Not only has there been an increase in the amounts of waste generated, the composition of the waste has changed as well. The current system is already overtaxed due to lack of institutional capacity and insufficient human and capital resources as can be evidenced by low collection rates and inadequate waste facilities. Given socio-economic trends, the issue of how to deal with its solid waste will only become more critical as Vietnam industrializes. Table of Contents 1. Introduction ...................................................................................................................................... 2 2. Overview of Vietnam 2.1 Geography ................................................................................................................................ 2 2.2 Demographics .......................................................................................................................... 2 2.3 Economy .................................................................................................................................. 3 3. Solid Waste Management in Vietnam 3.1 Generation and Components .................................................................................................... 3 3.2 Collection System .................................................................................................................... 4 3.3 Solid Waste Disposal ............................................................................................................... 6 3.4 Recycling and Reuse ................................................................................................................ 7 4. Conclusion........................................................................................................................................ 7 5. Figures .............................................................................................................................................. 8 6. Tables ............................................................................................................................................. 16 7. References ...................................................................................................................................... 19
Transcript
Solid Waste Management in Vietnam
An Industrial Ecology Study by Thao Nguyen School of International and Public Affairs, Columbia University
Adviser: Prof. Nickolas J. Themelis, Earth and Environmental Engineering Abstract In the past decade, strong economic growth and uncontrolled urbanization have greatly magnified the problems with Vietnam’s solid waste management system, pushing waste management to the forefront of environmental challenges with which it must contend. Not only has there been an increase in the amounts of waste generated, the composition of the waste has changed as well. The current system is already overtaxed due to lack of institutional capacity and insufficient human and capital resources as can be evidenced by low collection rates and inadequate waste facilities. Given socio-economic trends, the issue of how to deal with its solid waste will only become more critical as Vietnam industrializes. Table of Contents
1. Introduction Given the rapid rates of urbanization occurring around the world, the importance of an efficient and effective solid waste management system is more critical than ever before. Nowhere is this truer than in the developing world, where unprecedented urban growth has resulted in greater amounts of municipal solid waste (MSW) being generated. By 2015, in just another ten years, the number of urban residents will have doubled since 1987; a disproportionately large amount – nearly 90% – of this increase will take place in the developing world (Medina 2000). Not only will these city dwellers produce more waste, the composition of their waste will change as well. Within the developing world, Asia accounts for much of the urban growth. In 2000, almost one-third of the Asian populace lived in cities; moreover, this region has more cities than any other part of the world (World Bank 2003). This urbanization, not to mention increasing population growth rates, has been accompanied by dynamic economic growth, the impacts of which have put even greater strain on municipal solid waste management systems (MSWM). In 1998, cities in Asia generated approximately 0.76 million tons (2.7 million m3) per day of MSW, a number that will jump to 1.8 million tons (5.2 meter3) per day by 2025 (World Bank 1999). Vietnam is no exception to these figures. If anything, the solid waste problem is even more acute for this Southeast Asian country that is limited by weak institutional capacity and insufficient human and capital resources in addressing the crisis. This paper presents an analysis of current solid waste management practices in Vietnam and future challenges. In doing so, it will provide an audit and characterization of solid waste at the national level, information that is the cornerstone of an effective waste management system.
2. Overview of Vietnam
2.1 Geography Shaped like a long ‘S’, the Socialist Republic of Vietnam is located on the eastern part of the Indochinese peninsula. It extends 1,650 km from north to south at longitudes 8º 02' - 23º 23' north; its latitudes cover 102º 08' - 109º 28' east, the narrowest point covering a mere 50 km. China borders it to the north, Laos and Cambodia to the west, the East Sea to the east and the Pacific Ocean to the east and south. Its total land area is approximately 331,900 sq km, a size slightly larger than the state of New Mexico. Its climate can be characterized as tropical in the southern part and monsoonal in the north with high rates of humidity (CIA Factbook, 2004).
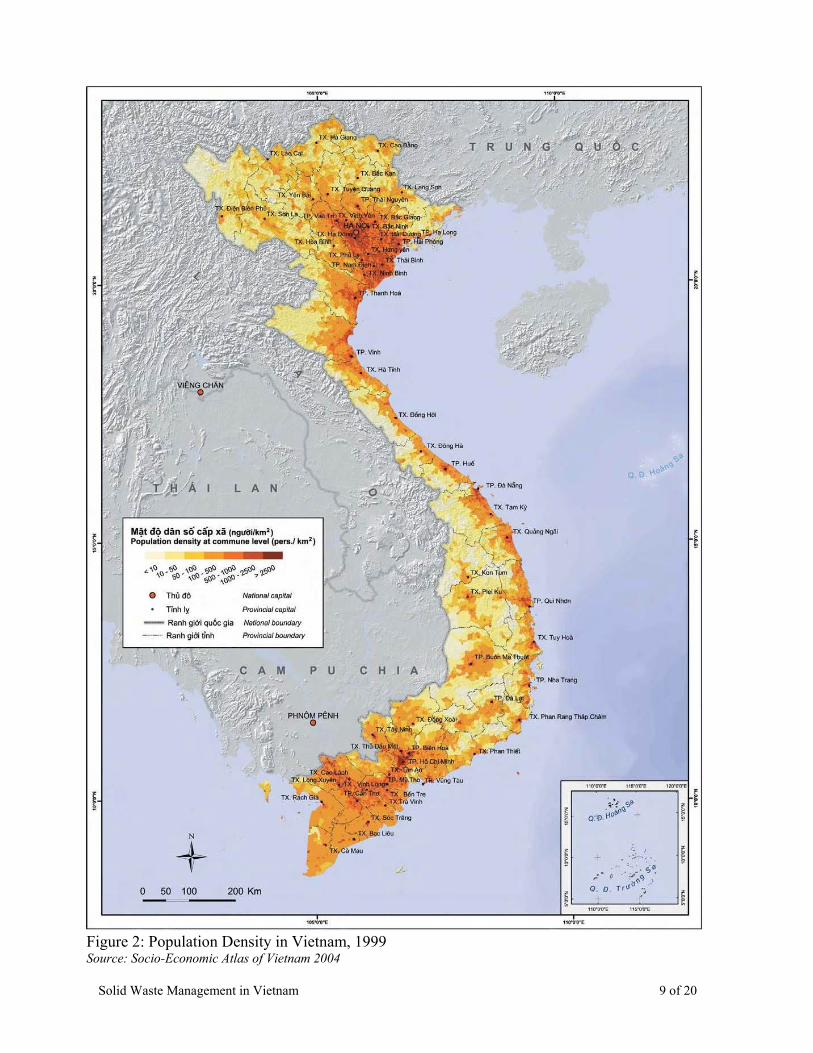
2.2 Demographics Vietnam is the second most populous country in Southeast Asia (after Indonesia). In 2005, its population was estimated to be approximately 83.5 million; a population density of 248 residents per square kilometer made it one of the most densely populated in the world; and its population growth rate was 1.04%. In contrast to that, its urban growth rate was much higher at 2.94% (CIA Factbook). Approximately 25% of the country’s residents currently live in the cities but by 2010, the percentage is projected to be 33%, resulting in an additional 10 million urban dwellers. The
Solid Waste Management in Vietnam 2 of 20
largest city is Ho Chi Minh City (HCMC), located at the mouth of the Mekong River, with almost 7 million residents. The second most populous city is the capital city of Hanoi, which lies at the heart of the Red River Delta and has over 3 million inhabitants.
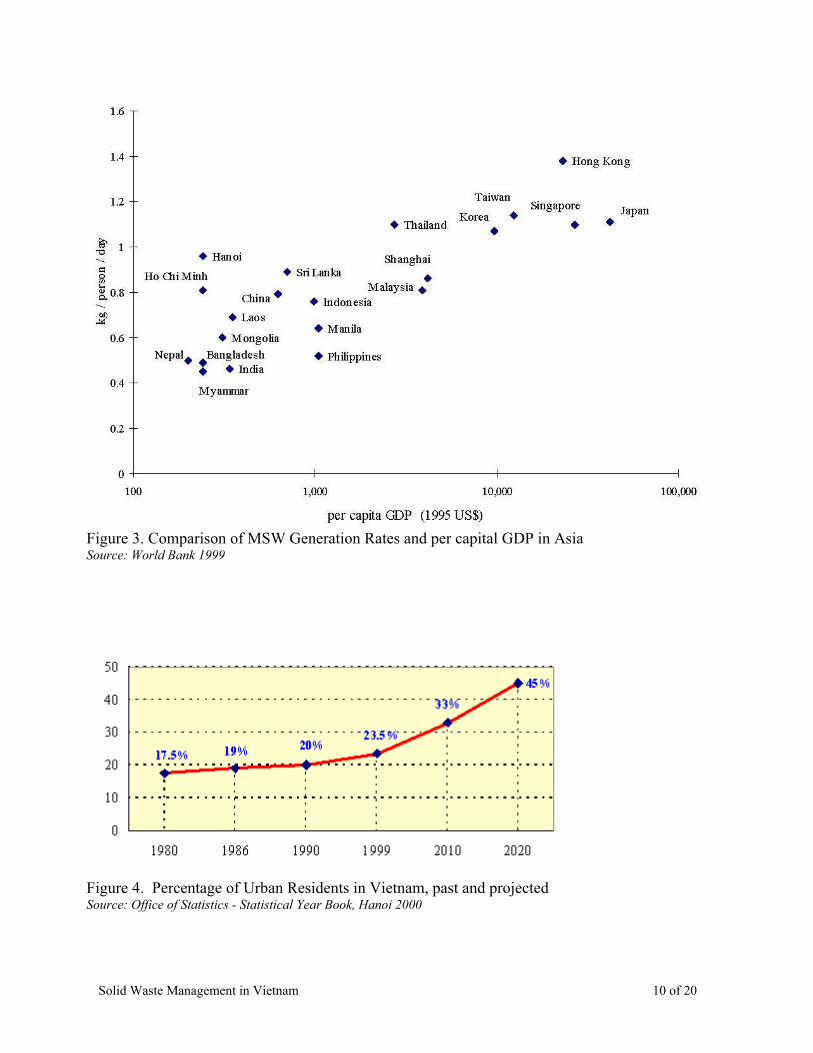
2.3 Economy In 1986, the government launched the đổi mới (renovation) policy, implementing economic liberalization measures which moved the centrally planned economy towards a market-based one. Since then, the country has seen robust economic growth and high levels of foreign direct investment. In 2003, its GDP was an estimated $39 billion with a growth rate of 7.2%, one of the highest in the region (VEM 2004). With the last decade, despite average incomes having doubled, it is still one of the poorest countries in the world; per capita GDP in 2004 was just a mere $2,700 US (CIA Factbook).
3. Solid Waste Management in Vietnam
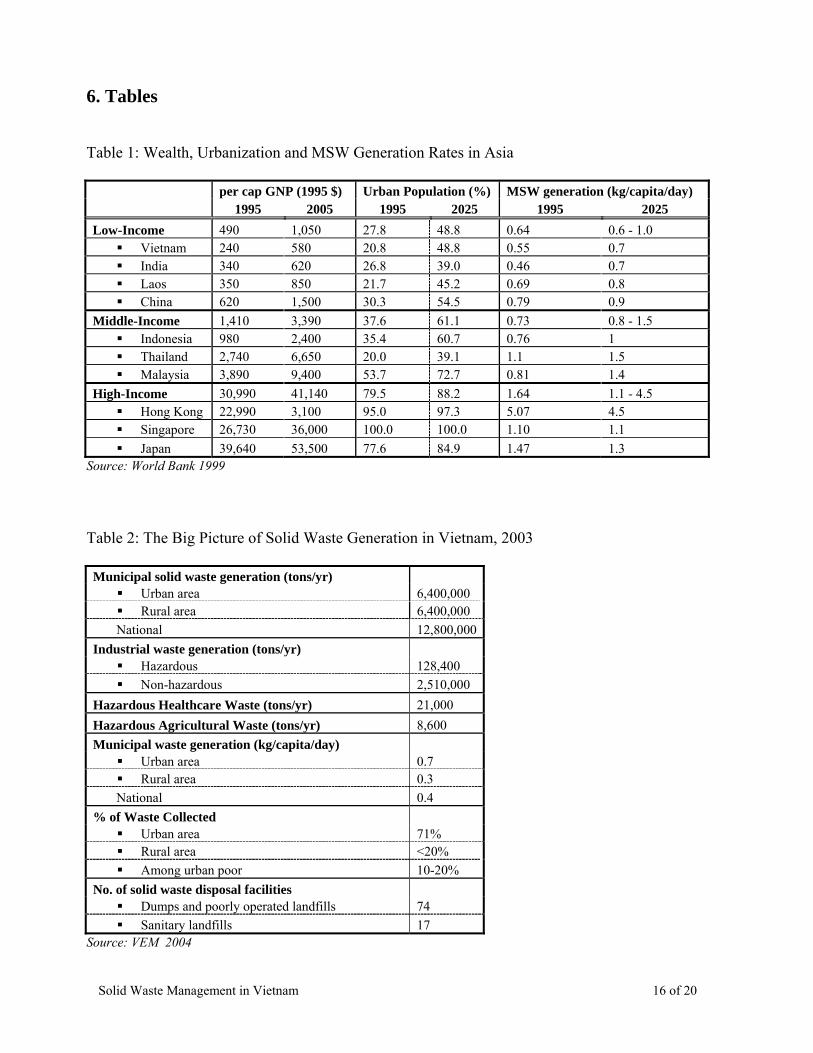
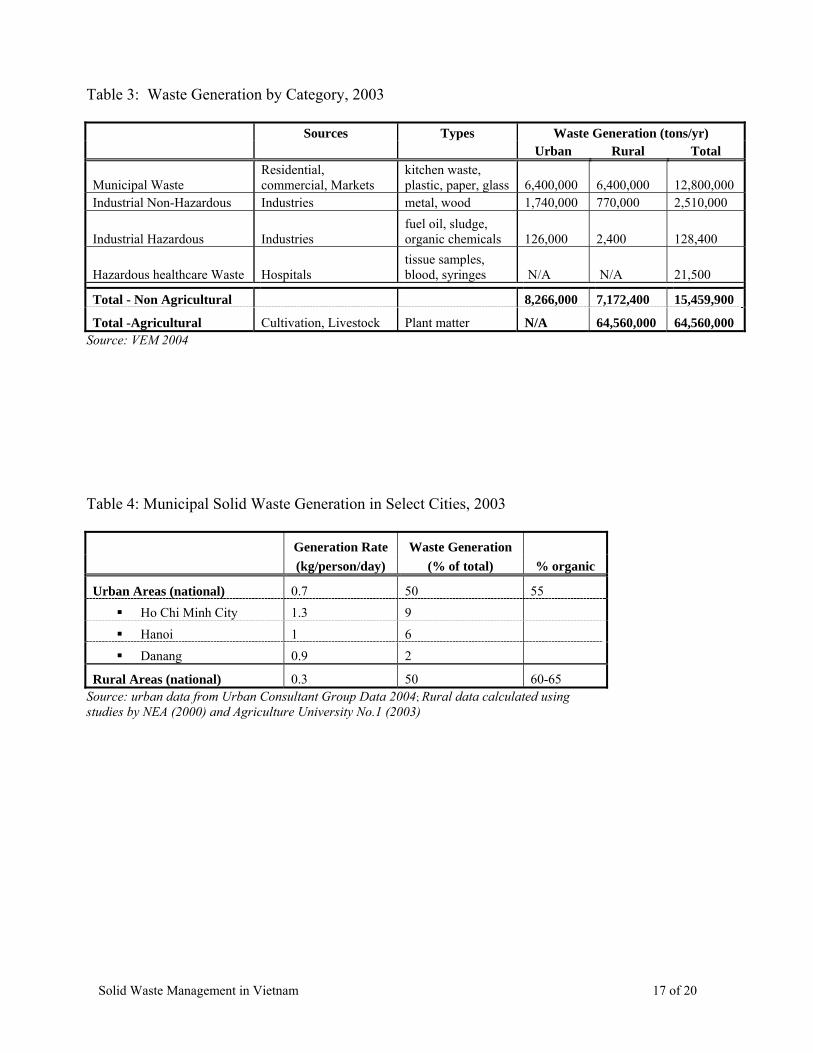
3.1 Generation and Components The amount of solid waste generated in Vietnam has been increasing steadily over the last decade. In 1996, the average amount of waste produced per year was 5.9 million tons/yr (Nguyen 2005). A mere eight years later, average rates of municipal waste were 12.8 million tons per year with industrial and agricultural waste contributing another 2.2 million tons annually (Vietnam Environmental Monitor 2004). Those numbers are predicted to increase by over 60% before 2010 (VEM 2004). Presently, the amount of domestic solid waste produced by each person on a daily basis is relatively low compared to other cities in the region but not for long – the 10 to 15 year forecast indicates that the amount of domestic solid waste produced will be 1.2 per capita/day, a rate which will put Vietnam on par with other large Asian cities. Solid waste in Vietnam can be grouped broadly into three categories:
Municipal Waste – comprised of residential, commercial and market wastes;
Industrial Waste – includes hazardous waste from the processing activities of factories and other manufacturing units; clinical wastes from hospitals and clinics; sewage and sludge from municipal sewer systems; construction and demolition waste;
Agricultural Waste – comprised of animal (pigs, cows and buffaloes) manure from the
farmers' houses, crop residues (mainly from coffee, rubber, tobacco and coconut) and residues of agro-chemicals.
Solid Waste Management in Vietnam 3 of 20
The composition of municipal waste (considered to be both municipal and industrial waste) fluctuates according a few factors:
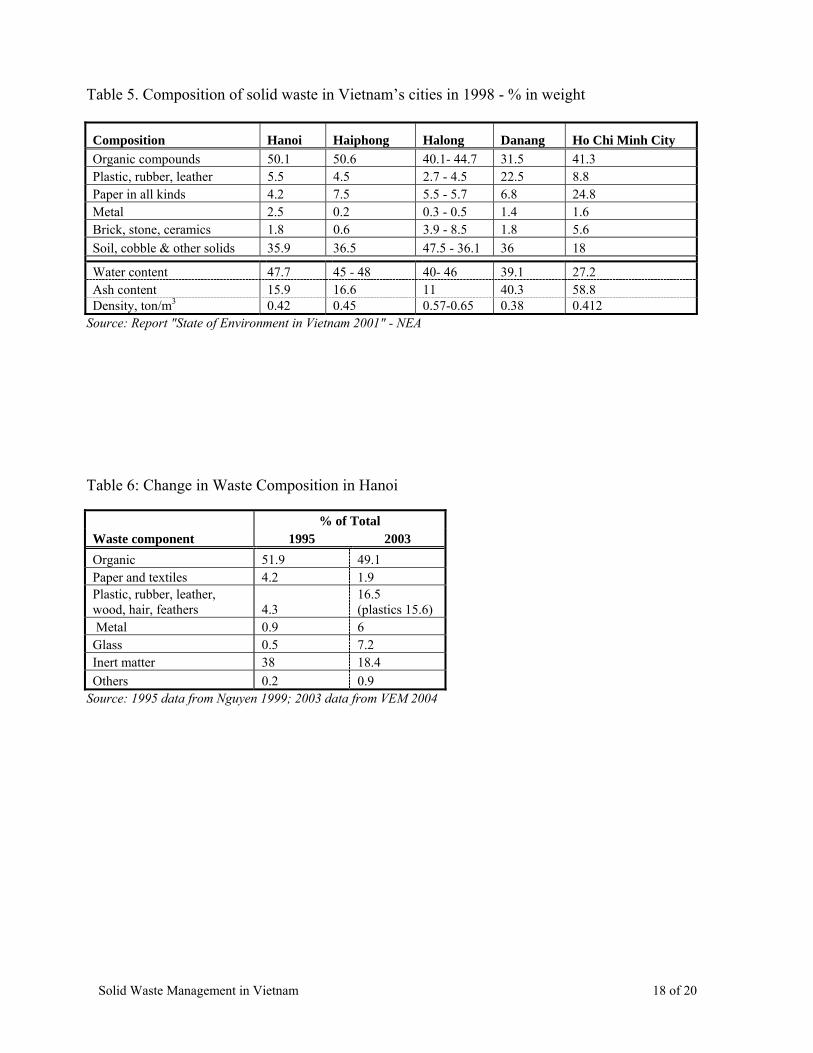
Affluence – As is the case in many parts of the developing world, solid waste from rural areas, where people are poorer, has a higher proportion of organic matter, approximately 60 to 75% (VEM 2004). In urban areas, where people are affluent, the waste has only 50% organic matter with an increase in non-degradable materials such as plastic, metals and glass (VEM 2004). (While waste composition data could not be found for the country as a whole, data on the composition of Hanoi’s waste (Table 6) in 1995 and 2003 can be extrapolated to represent the rest of the country.)
Season – In the summertime, there is a higher amount of fruit and vegetable waste and thus,
waste has a higher organic content.
Cultural Activities – Cultural festivities such as Tểt (the Vietnamese New Year) or Woman’s Day result in more organic waste produced due to the amount of orange trees and flowers bought for the occasions.
Location – Market streets generate more organic waste than business districts.
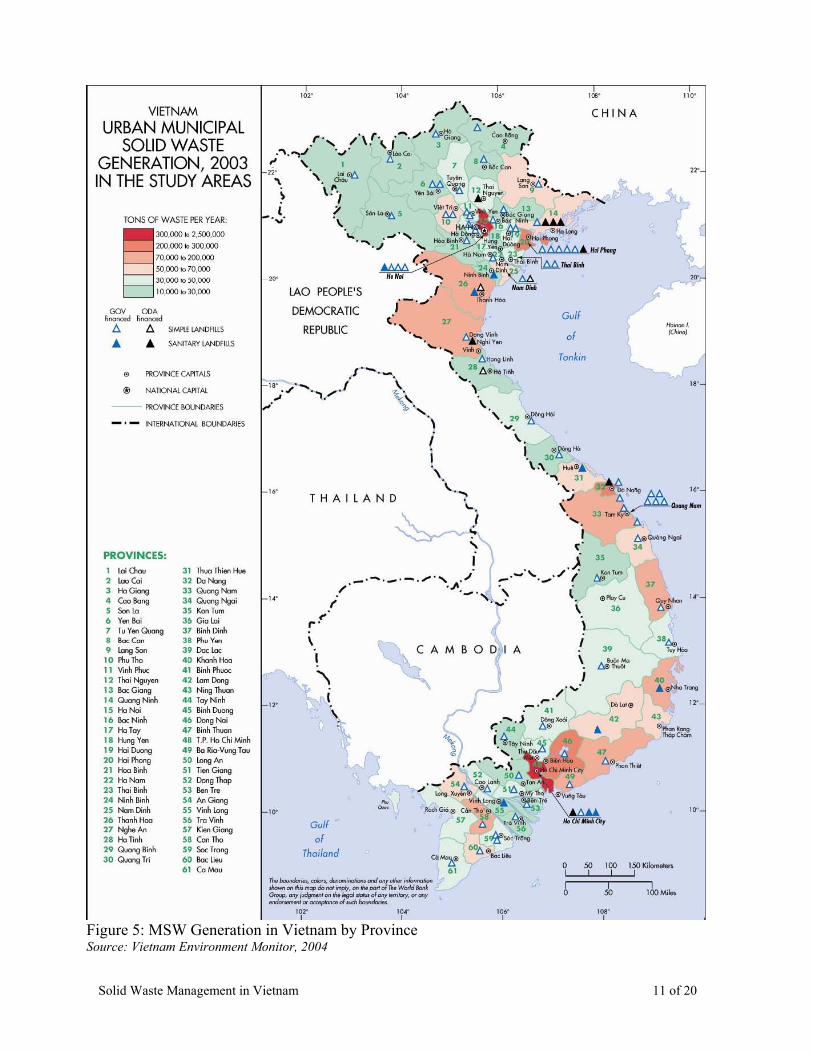
Not only has the composition of waste changed, the amount of waste generated also differs. Urban residents make up only one-quarter of the population yet produce half of the solid waste. Data from Table 3 shows that the average city resident produces over two-thirds of a kg of waste daily, a rate that is twice as high as rural residents. Industrial waste in Vietnam comprises approximately 25% of MSW but varies depending on the size of the province/area and its degree of industrialization. Given that the Mekong Delta has more industrial parks and manufacturing industries than anywhere else in the country, it is no surprise that this part of the country is the majority contributor to industrial waste. Within this region, the economic powerhouse of HCMC produces 31% of industrial garbage (VEM 2004). In contrast, the bulk of industrial waste produced in the north comes from the rural areas, which have a high number of craft villages. Across this region, there are 1450 craft villages spread out over 56 provinces; collectively, they produce 774,000 tons of waste annually, over half of which comes from three provinces – Bac Ninh, Ha Tay and Hanoi (VEM 2004). In 2003, total hazardous waste amounted to 160,000 tons per year; of this, 130,000 tons came from industrial sources, 64% percent of which came from southern Vietnam (VEM 2004). The remainder was generated by healthcare (21,000 tons/yr) and agriculture (8,600 tons/yr) (VEM 2004). Pesticides and pesticide containers were the most significant source of agricultural hazardous waste.
3.2 Collection System The waste management system is plagued by a number of problems, some of which include inadequate management, lack of technology and human resources, a shortage of transportation vehicles and insufficient funding. In 2000, there were only 95 organizations – only 2 of which were privately-owned – working in the waste management industry and together, they served 82 cities and/or towns (Nguyen 2005).
Solid Waste Management in Vietnam 4 of 20
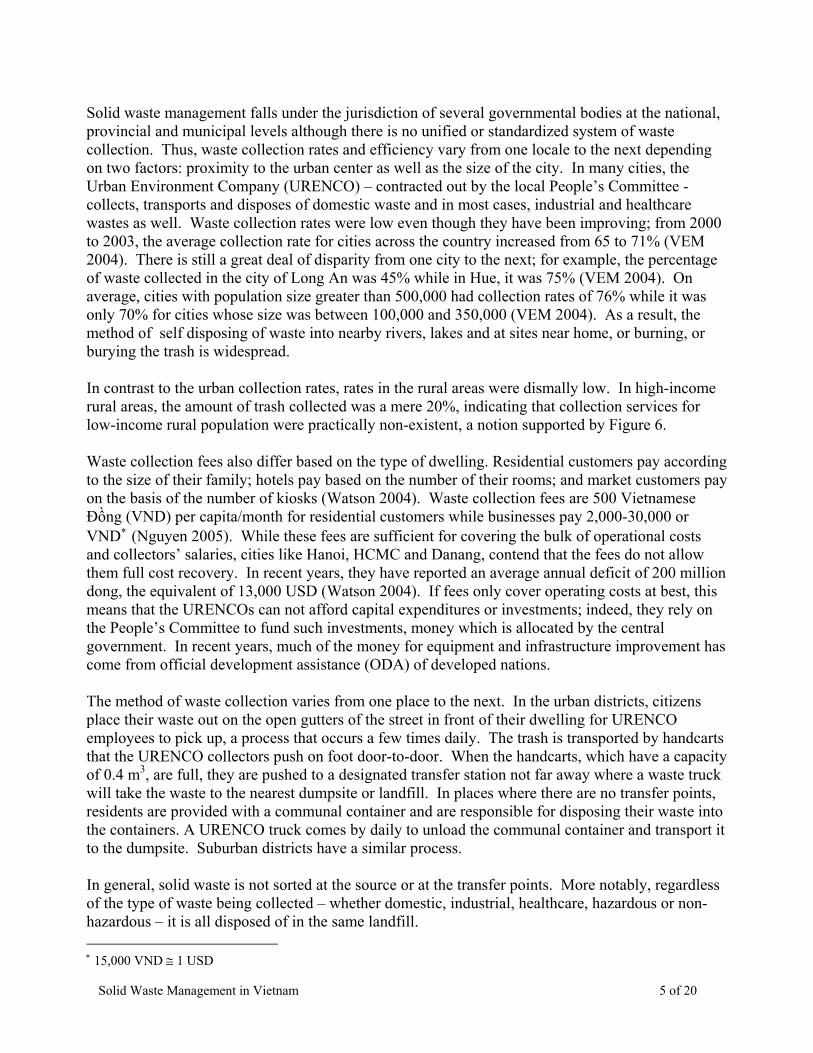
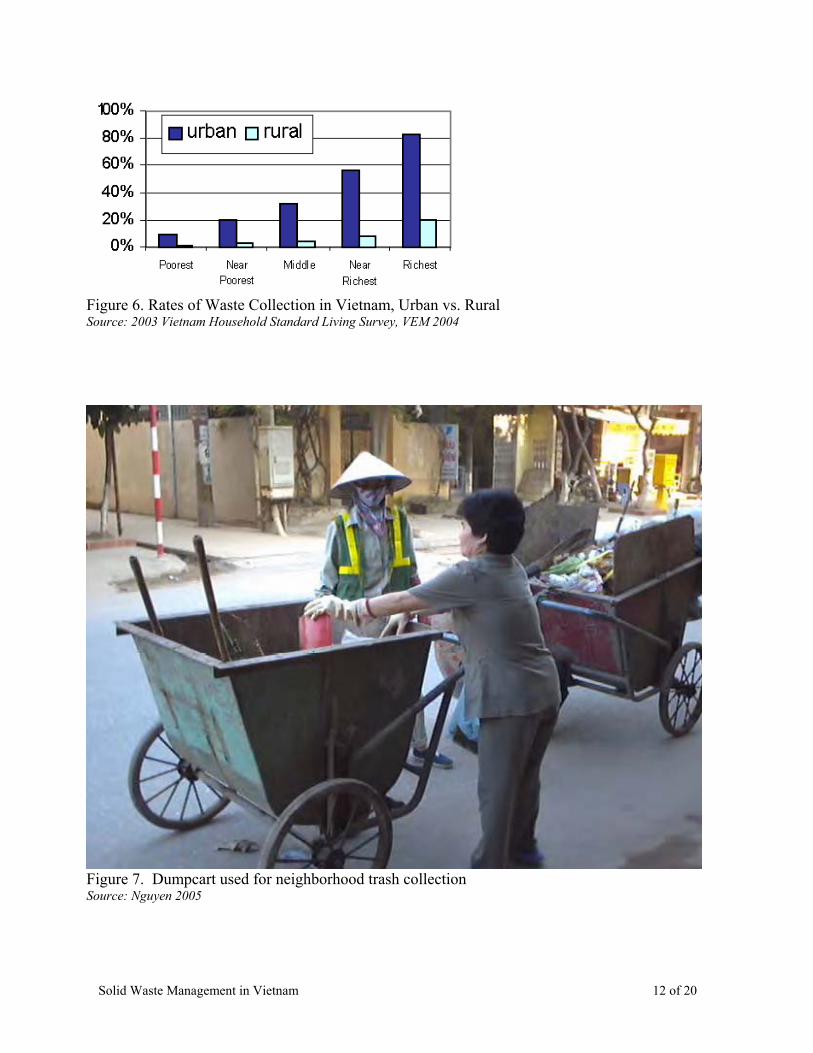
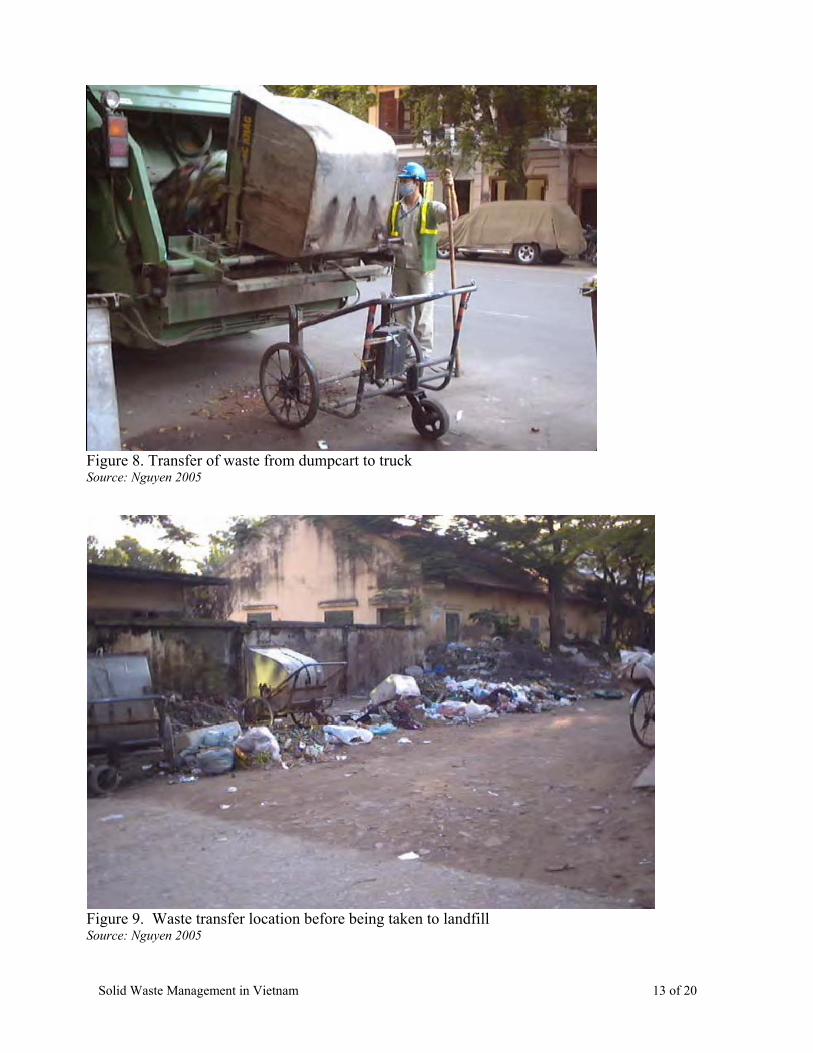
Solid waste management falls under the jurisdiction of several governmental bodies at the national, provincial and municipal levels although there is no unified or standardized system of waste collection. Thus, waste collection rates and efficiency vary from one locale to the next depending on two factors: proximity to the urban center as well as the size of the city. In many cities, the Urban Environment Company (URENCO) – contracted out by the local People’s Committee - collects, transports and disposes of domestic waste and in most cases, industrial and healthcare wastes as well. Waste collection rates were low even though they have been improving; from 2000 to 2003, the average collection rate for cities across the country increased from 65 to 71% (VEM 2004). There is still a great deal of disparity from one city to the next; for example, the percentage of waste collected in the city of Long An was 45% while in Hue, it was 75% (VEM 2004). On average, cities with population size greater than 500,000 had collection rates of 76% while it was only 70% for cities whose size was between 100,000 and 350,000 (VEM 2004). As a result, the method of self disposing of waste into nearby rivers, lakes and at sites near home, or burning, or burying the trash is widespread. In contrast to the urban collection rates, rates in the rural areas were dismally low. In high-income rural areas, the amount of trash collected was a mere 20%, indicating that collection services for low-income rural population were practically non-existent, a notion supported by Figure 6. Waste collection fees also differ based on the type of dwelling. Residential customers pay according to the size of their family; hotels pay based on the number of their rooms; and market customers pay on the basis of the number of kiosks (Watson 2004). Waste collection fees are 500 Vietnamese Đồng (VND) per capita/month for residential customers while businesses pay 2,000-30,000 or VND∗ (Nguyen 2005). While these fees are sufficient for covering the bulk of operational costs and collectors’ salaries, cities like Hanoi, HCMC and Danang, contend that the fees do not allow them full cost recovery. In recent years, they have reported an average annual deficit of 200 million dong, the equivalent of 13,000 USD (Watson 2004). If fees only cover operating costs at best, this means that the URENCOs can not afford capital expenditures or investments; indeed, they rely on the People’s Committee to fund such investments, money which is allocated by the central government. In recent years, much of the money for equipment and infrastructure improvement has come from official development assistance (ODA) of developed nations. The method of waste collection varies from one place to the next. In the urban districts, citizens place their waste out on the open gutters of the street in front of their dwelling for URENCO employees to pick up, a process that occurs a few times daily. The trash is transported by handcarts that the URENCO collectors push on foot door-to-door. When the handcarts, which have a capacity of 0.4 m3, are full, they are pushed to a designated transfer station not far away where a waste truck will take the waste to the nearest dumpsite or landfill. In places where there are no transfer points, residents are provided with a communal container and are responsible for disposing their waste into the containers. A URENCO truck comes by daily to unload the communal container and transport it to the dumpsite. Suburban districts have a similar process. In general, solid waste is not sorted at the source or at the transfer points. More notably, regardless of the type of waste being collected – whether domestic, industrial, healthcare, hazardous or non-hazardous – it is all disposed of in the same landfill. ∗ 15,000 VND ≅ 1 USD
Solid Waste Management in Vietnam 5 of 20
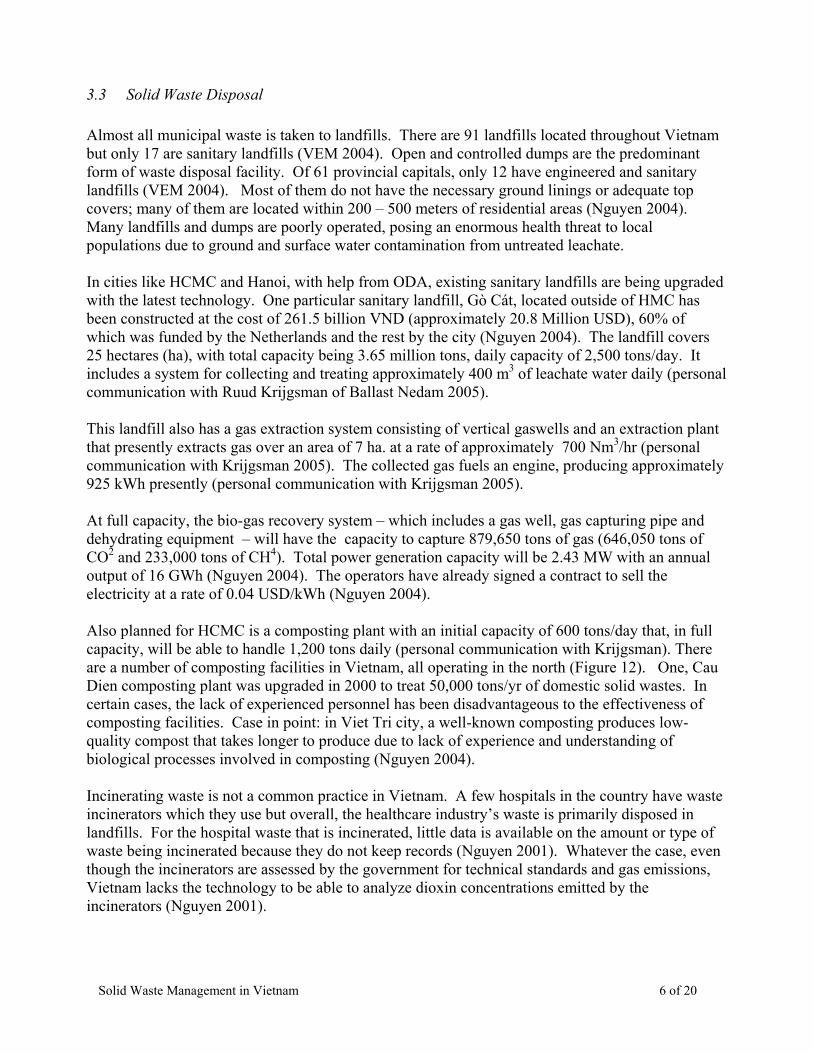
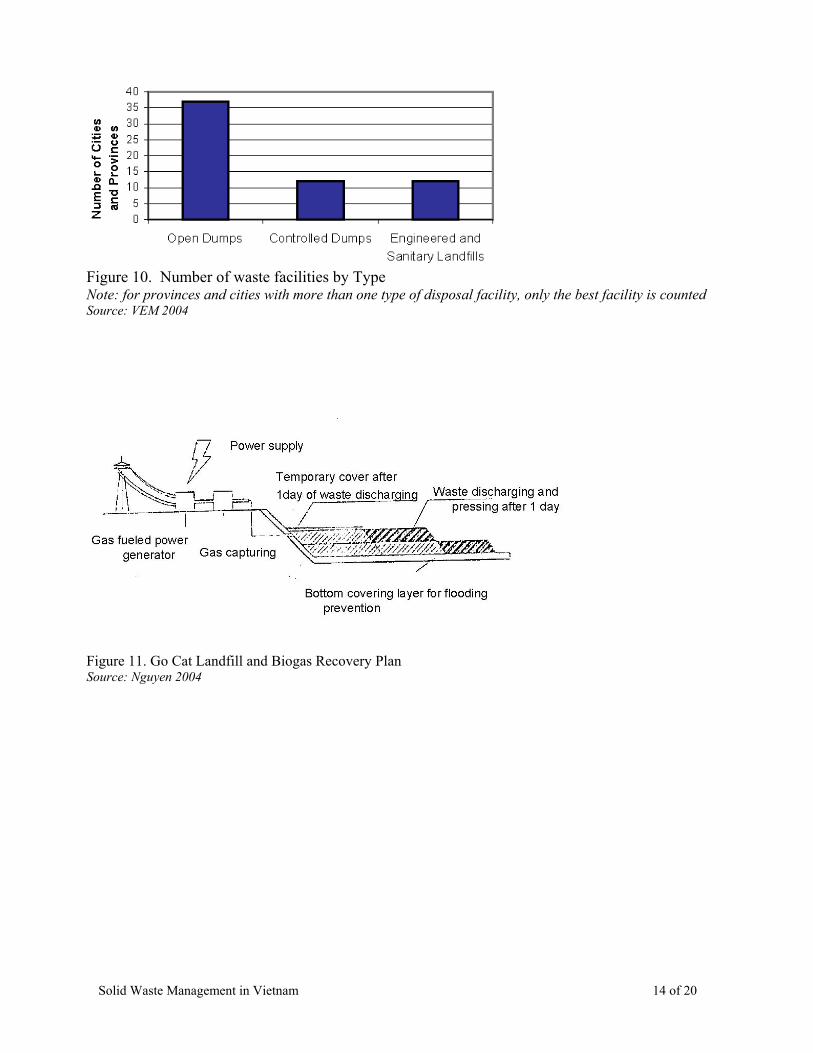
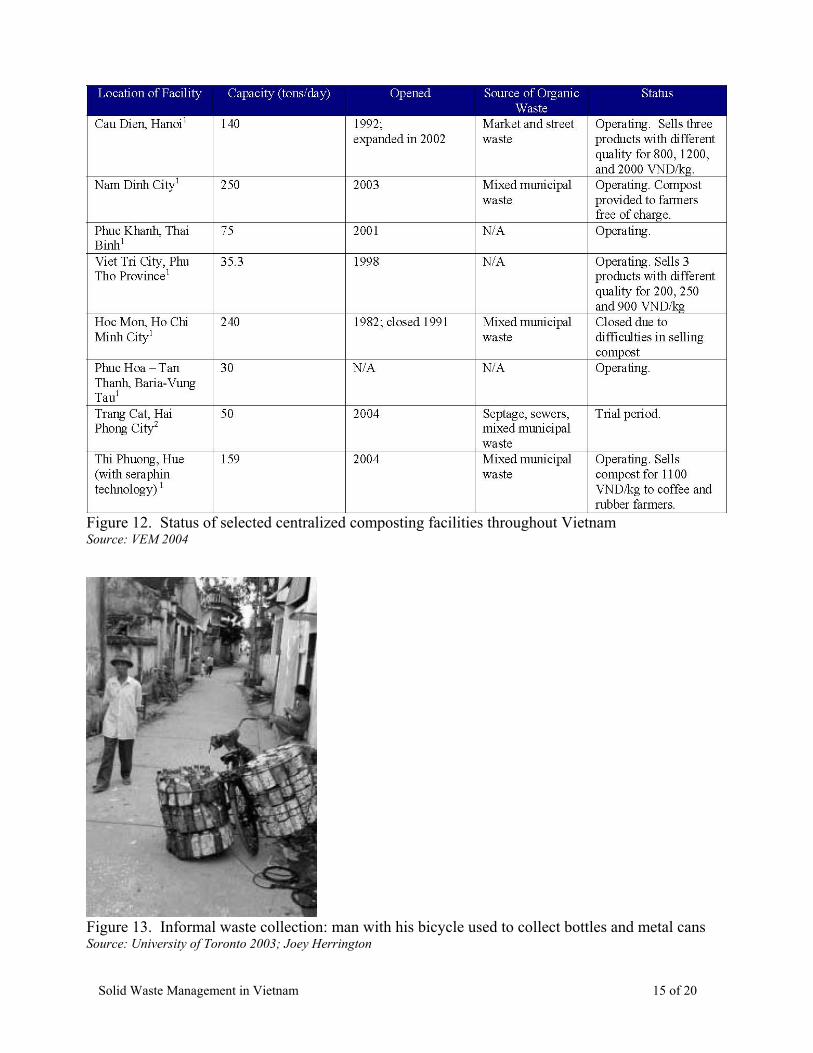
3.3 Solid Waste Disposal Almost all municipal waste is taken to landfills. There are 91 landfills located throughout Vietnam but only 17 are sanitary landfills (VEM 2004). Open and controlled dumps are the predominant form of waste disposal facility. Of 61 provincial capitals, only 12 have engineered and sanitary landfills (VEM 2004). Most of them do not have the necessary ground linings or adequate top covers; many of them are located within 200 – 500 meters of residential areas (Nguyen 2004). Many landfills and dumps are poorly operated, posing an enormous health threat to local populations due to ground and surface water contamination from untreated leachate. In cities like HCMC and Hanoi, with help from ODA, existing sanitary landfills are being upgraded with the latest technology. One particular sanitary landfill, Gò Cát, located outside of HMC has been constructed at the cost of 261.5 billion VND (approximately 20.8 Million USD), 60% of which was funded by the Netherlands and the rest by the city (Nguyen 2004). The landfill covers 25 hectares (ha), with total capacity being 3.65 million tons, daily capacity of 2,500 tons/day. It includes a system for collecting and treating approximately 400 m3 of leachate water daily (personal communication with Ruud Krijgsman of Ballast Nedam 2005). This landfill also has a gas extraction system consisting of vertical gaswells and an extraction plant that presently extracts gas over an area of 7 ha. at a rate of approximately 700 Nm3/hr (personal communication with Krijgsman 2005). The collected gas fuels an engine, producing approximately 925 kWh presently (personal communication with Krijgsman 2005). At full capacity, the bio-gas recovery system – which includes a gas well, gas capturing pipe and dehydrating equipment – will have the capacity to capture 879,650 tons of gas (646,050 tons of CO2 and 233,000 tons of CH4). Total power generation capacity will be 2.43 MW with an annual output of 16 GWh (Nguyen 2004). The operators have already signed a contract to sell the electricity at a rate of 0.04 USD/kWh (Nguyen 2004). Also planned for HCMC is a composting plant with an initial capacity of 600 tons/day that, in full capacity, will be able to handle 1,200 tons daily (personal communication with Krijgsman). There are a number of composting facilities in Vietnam, all operating in the north (Figure 12). One, Cau Dien composting plant was upgraded in 2000 to treat 50,000 tons/yr of domestic solid wastes. In certain cases, the lack of experienced personnel has been disadvantageous to the effectiveness of composting facilities. Case in point: in Viet Tri city, a well-known composting produces low-quality compost that takes longer to produce due to lack of experience and understanding of biological processes involved in composting (Nguyen 2004). Incinerating waste is not a common practice in Vietnam. A few hospitals in the country have waste incinerators which they use but overall, the healthcare industry’s waste is primarily disposed in landfills. For the hospital waste that is incinerated, little data is available on the amount or type of waste being incinerated because they do not keep records (Nguyen 2001). Whatever the case, even though the incinerators are assessed by the government for technical standards and gas emissions, Vietnam lacks the technology to be able to analyze dioxin concentrations emitted by the incinerators (Nguyen 2001).
Solid Waste Management in Vietnam 6 of 20
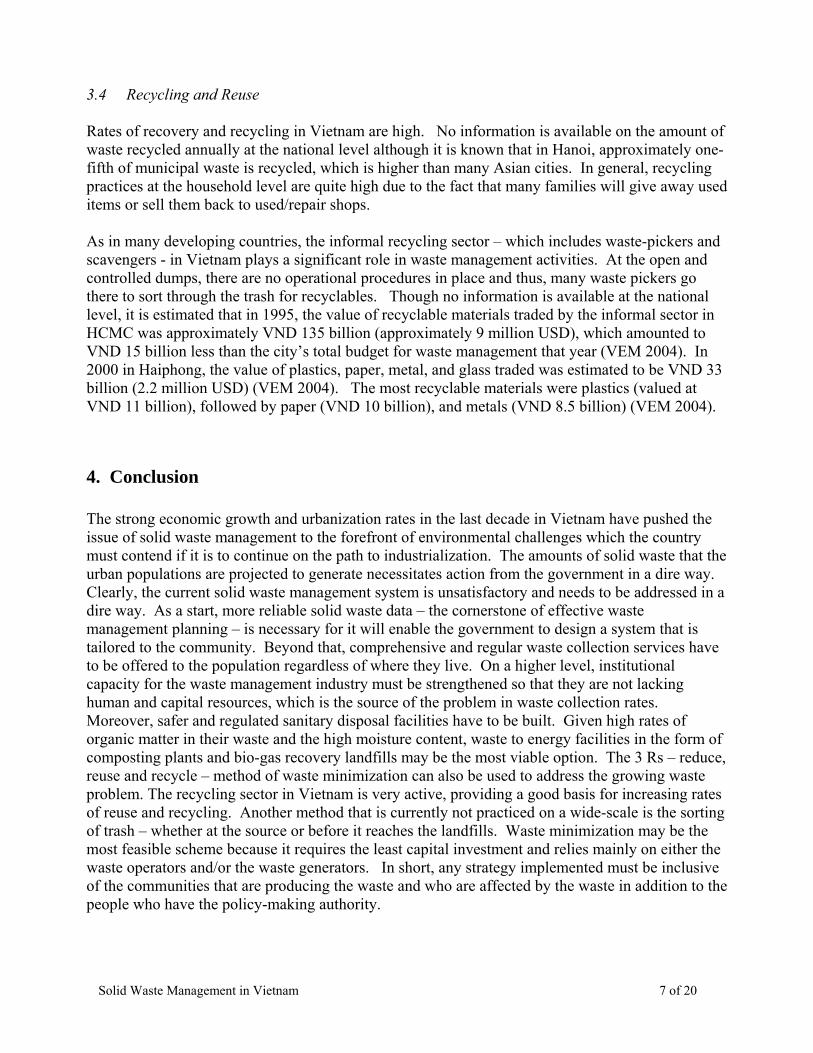
3.4 Recycling and Reuse Rates of recovery and recycling in Vietnam are high. No information is available on the amount of waste recycled annually at the national level although it is known that in Hanoi, approximately one-fifth of municipal waste is recycled, which is higher than many Asian cities. In general, recycling practices at the household level are quite high due to the fact that many families will give away used items or sell them back to used/repair shops. As in many developing countries, the informal recycling sector – which includes waste-pickers and scavengers - in Vietnam plays a significant role in waste management activities. At the open and controlled dumps, there are no operational procedures in place and thus, many waste pickers go there to sort through the trash for recyclables. Though no information is available at the national level, it is estimated that in 1995, the value of recyclable materials traded by the informal sector in HCMC was approximately VND 135 billion (approximately 9 million USD), which amounted to VND 15 billion less than the city’s total budget for waste management that year (VEM 2004). In 2000 in Haiphong, the value of plastics, paper, metal, and glass traded was estimated to be VND 33 billion (2.2 million USD) (VEM 2004). The most recyclable materials were plastics (valued at VND 11 billion), followed by paper (VND 10 billion), and metals (VND 8.5 billion) (VEM 2004).
4. Conclusion The strong economic growth and urbanization rates in the last decade in Vietnam have pushed the issue of solid waste management to the forefront of environmental challenges which the country must contend if it is to continue on the path to industrialization. The amounts of solid waste that the urban populations are projected to generate necessitates action from the government in a dire way. Clearly, the current solid waste management system is unsatisfactory and needs to be addressed in a dire way. As a start, more reliable solid waste data – the cornerstone of effective waste management planning – is necessary for it will enable the government to design a system that is tailored to the community. Beyond that, comprehensive and regular waste collection services have to be offered to the population regardless of where they live. On a higher level, institutional capacity for the waste management industry must be strengthened so that they are not lacking human and capital resources, which is the source of the problem in waste collection rates. Moreover, safer and regulated sanitary disposal facilities have to be built. Given high rates of organic matter in their waste and the high moisture content, waste to energy facilities in the form of composting plants and bio-gas recovery landfills may be the most viable option. The 3 Rs – reduce, reuse and recycle – method of waste minimization can also be used to address the growing waste problem. The recycling sector in Vietnam is very active, providing a good basis for increasing rates of reuse and recycling. Another method that is currently not practiced on a wide-scale is the sorting of trash – whether at the source or before it reaches the landfills. Waste minimization may be the most feasible scheme because it requires the least capital investment and relies mainly on either the waste operators and/or the waste generators. In short, any strategy implemented must be inclusive of the communities that are producing the waste and who are affected by the waste in addition to the people who have the policy-making authority.
Solid Waste Management in Vietnam 7 of 20
5. Figures
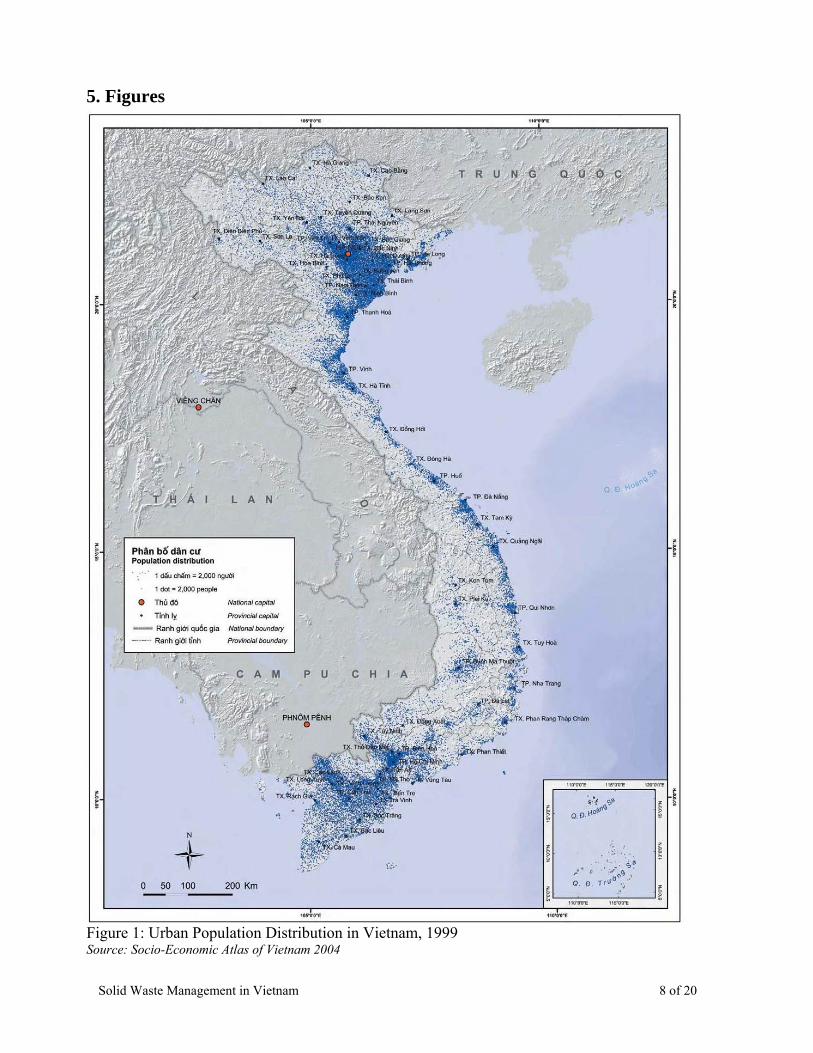
Figure 1: Urban Population Distribution in Vietnam, 1999 Source: Socio-Economic Atlas of Vietnam 2004
Solid Waste Management in Vietnam 8 of 20
Figure 2: Population Density in Vietnam, 1999 Source: Socio-Economic Atlas of Vietnam 2004
Solid Waste Management in Vietnam 9 of 20
Figure 3. Comparison of MSW Generation Rates and per capital GDP in Asia Source: World Bank 1999
Figure 4. Percentage of Urban Residents in Vietnam, past and projected Source: Office of Statistics - Statistical Year Book, Hanoi 2000
Solid Waste Management in Vietnam 10 of 20
Figure 5: MSW Generation in Vietnam by Province Source: Vietnam Environment Monitor, 2004
Solid Waste Management in Vietnam 11 of 20
Figure 6. Rates of Waste Collection in Vietnam, Urban vs. Rural Source: 2003 Vietnam Household Standard Living Survey, VEM 2004
Figure 7. Dumpcart used for neighborhood trash collection Source: Nguyen 2005
Solid Waste Management in Vietnam 12 of 20
Figure 8. Transfer of waste from dumpcart to truck Source: Nguyen 2005
Figure 9. Waste transfer location before being taken to landfill Source: Nguyen 2005
Solid Waste Management in Vietnam 13 of 20
Figure 10. Number of waste facilities by Type Note: for provinces and cities with more than one type of disposal facility, only the best facility is counted Source: VEM 2004
Figure 11. Go Cat Landfill and Biogas Recovery Plan Source: Nguyen 2004
Solid Waste Management in Vietnam 14 of 20
Figure 12. Status of selected centralized composting facilities throughout Vietnam Source: VEM 2004
Figure 13. Informal waste collection: man with his bicycle used to collect bottles and metal cans Source: University of Toronto 2003; Joey Herrington
Solid Waste Management in Vietnam 15 of 20
6. Tables Table 1: Wealth, Urbanization and MSW Generation Rates in Asia per cap GNP (1995 $) Urban Population (%) MSW generation (kg/capita/day) 1995 2005 1995 2025 1995 2025 Low-Income 490 1,050 27.8 48.8 0.64 0.6 - 1.0
Total - Non Agricultural 8,266,000 7,172,400 15,459,900
Total -Agricultural Cultivation, Livestock Plant matter N/A 64,560,000 64,560,000 Source: VEM 2004 Table 4: Municipal Solid Waste Generation in Select Cities, 2003
Generation Rate Waste Generation (kg/person/day) (% of total) % organic
Urban Areas (national) 0.7 50 55 Ho Chi Minh City 1.3 9 Hanoi 1 6 Danang 0.9 2
Rural Areas (national) 0.3 50 60-65 Source: urban data from Urban Consultant Group Data 2004; Rural data calculated using studies by NEA (2000) and Agriculture University No.1 (2003)
Solid Waste Management in Vietnam 17 of 20
Table 5. Composition of solid waste in Vietnam’s cities in 1998 - % in weight
Composition Hanoi Haiphong Halong Danang Ho Chi Minh City Organic compounds 50.1 50.6 40.1- 44.7 31.5 41.3 Plastic, rubber, leather 5.5 4.5 2.7 - 4.5 22.5 8.8 Paper in all kinds 4.2 7.5 5.5 - 5.7 6.8 24.8 Metal 2.5 0.2 0.3 - 0.5 1.4 1.6 Brick, stone, ceramics 1.8 0.6 3.9 - 8.5 1.8 5.6 Soil, cobble & other solids 35.9 36.5 47.5 - 36.1 36 18
Source: Report "State of Environment in Vietnam 2001" - NEA Table 6: Change in Waste Composition in Hanoi % of Total Waste component 1995 2003 Organic 51.9 49.1 Paper and textiles 4.2 1.9 Plastic, rubber, leather, wood, hair, feathers 4.3
Source: 1995 data from Nguyen 1999; 2003 data from VEM 2004
Solid Waste Management in Vietnam 18 of 20
7. References CIA World Factbook, 2004. www.cia.gov/cia/publications/factbook/geos/vm.html Epprecht M, Heinimann A, editors. 2004. Socioeconomic Atlas of Vietnam. A Depiction of the
1999 Population and Housing Census. Swiss National Centre of Competence in Research (NCCR) North-South, University of Berne. Berne. pp. 47 & 49.
General Statistics Office of Vietnam website, 2005:
http://www.gso.gov.vn/default.aspx?tabid=387&idmid=3&ItemID=971 Idris, Azni, Bulent Inanc and Mohd Nassir Hassan (2004). Overview of Waste Disposal and
Landfills/Dumps in Asian Countries. Journal of Material Cycles and Waste Management. Vol 6. pp. 105 – 106.
Imura, H., Yedla, S., Shirakawa, H., and Memon, M.A. (2005). Urban Environmental Issues and Trends in Asia- An Overview. International Review for Environmental Strategies, Vol.5, No 2,
pp.357-382. Krijgsman, Ruud. General Manager of Ballast Nedam. Personal communications, November 2005. Medina, Martin. Globalization, Development, and Municipal Solid Waste Management in Third
World Cities (2002). Mexico. 38 pp. Nguyen, Bao Quoc (2004). Go Cat Landfill Quality Improving Project. Energy Conservation
Research and Development Center. 14 pp. Nguyen, Hoan Thi (2001). Vietnam Country Report for conference. Waste Not Asia 2001, Taipei.
3 pp. Nguyen, Loan Thi (1999). Solid Waste Recovery and Recycling in Hanoi, Vietnam and Its Social
Nguyen, Thanh Yen (2004). Bio-waste Reuse Program: The contribution of a positioning campaign: The Case of Hanoi, Vietnam. University of Wageningen. 187 pp.
Nguyen, Thuy Thuc Thi (2005). Audit and Separation of Compostable Solid Wastes at Households
in Danang, Vietnam. University of Toronto. pp.103 Richardson, David (2003). Community-Based Solid Waste Management Systems in Hanoi,
Vietnam. University of Toronto. 103 pp. Solid Waste State and Impact. State of the Environment in Vietnam, 2001. Vietnam National
U.S. Department of State – U.S. Commercial Service (2004). Doing Business in Vietnam: A
Country Commercial Guide for U.S. Companies. pp. 45 – 46. Vietnam Environment Monitor 2004. World Bank, MoNRE and CIDA. 65 pp. Watson, Adam D (2004). An Examination of Vietnam’s Urban Waste Management Capacity.
University of Toronto. 83 pp. World Bank (1999). What a Waste: Solid Waste Management in Asia. Urban and Local
Government Working Paper Series number 1. Washington, DC: World Bank. World Bank. (1999). World Development Indicators. Washington, DC: World Bank. Zurbrugg, Christian (2002). Urban Solid Waste Management in Low-Income Countries of Asia:
How to Cope with the Garbage Crisis. South Africa. 13 pp.