Aeta mater. Vol. 44, No. 5, pp. 1955-1965, 1996 Elsetier ScienceLtd Copyright 0 1996 Acta MetallurgicaInc. Printed in Great Britain. All rights reserved 1359-6454/96 $15.00 + 0.00 Pergamon 0956-7151(!)5)00313-4 SOLIDIFICATION CURVES OF Al-h, Al-Mg AND Al-Cu-Mg ALLOYS S.-W. CHEN and C.-C. HUANG Department of Chemical Engineering, National Tsing-Hua University, Kuang-Fu Road, Hsin-Chu, Taiwan 30043, R.O. China (Received 10 April 1995; in revised form 11 July 1995) Abstract-Three different methods have been utilized to determine the solidification curves of the Al-rich Al-Q AI-MO and Al-Cu-Mg alloys. These three methods, i.e. a conventional quenching and image analysis method, calculations using two simplistic solidification models, and a proposed DTA coupled with mathematical modeling method, have been illustrated. Obtained by the three different methods, the solid fractions versus solidification temperatures of the solidifying samples are compared with one another, and the three different methods are discussed. Advantages of using the proposed DTA coupled with mathematical modeling method to determine the solidification curves are demonstrated. A -20°C undercooling of these Al-rich alloys during solidification has been observed by using DTA. The primary solidification phases are a-Al phase for all seven alloys. The secondary solidification phases have also been identified by using metallography, SEM (Scanning Electron Microscopy) and EPMA (Electron Probe Microanalysis). 1. INTRODUCTION Casting processes are the most important methods in the manufacturing of aluminum alloys [l-4]. Due to the good fluidity and low melting point of most aluminum alloys, they are adaptable to many of the most commonly used casting processes. Viscosity of alloys is enormously reduced whilst melting, thus much less shear stress is required when using casting than when using the solid-state forming processes. This has made casting an economically preferable process in most occasions. The microstructures and microsegregations of the cast developed during solidification greatly affect the products’ properties [l-7]. This is obvious if the casting process is the product’s last forming process. Even through many after-cast treatments, the aluminum alloys still retain the cast structures in most cases. Controlling solidifi- cation process is no doubt very important. Under- standing of the solidification curves of aluminum alloys, i.e. the solidification sequences and solid fractions versus temperatures during solidification, are crucial for the control of solidification processes [5-lo]. The solidification curves are also believed to be related to the castability of alloys [g-lo]. AI-&, Al-Mg and Al-&-Mg alloys are the base alloys of many important cast alloys and many high strength commercial wrought alloys, such as 2090, 6061 and 7075, which are of importance in aerospace appli- cations. In this study, different methods have been used to determine the solidification curves of the Al-rich Al-Cu, Al-Mg and Al-Cu-Mg alloys. 2. METHODS OF DETERMINING THF SOLIDIFICATION CURVFS Solidification curves can be experimentally deter- mined [g-11]. The quenching method is commonly used, and usually right after quenching quantitative metallography is carried out to determine the phase fractions. Solidification curves can also be obtained by calculation with various available solidification models [6, 1 l-191. The models used in this study are the equilibrium solidification model and Scheil model (non-equilibrium solidification model), which are the two most fundamental models and are most widely used in industry. Details of the two models will be given later. Efforts have also been made in combining experimental work and mathematical modeling together to determine the solidification curves. A method has been developed by using DTA (Differential Thermal Analysis) to determine the cooling curves of aluminum alloys, and the solidification curves of the alloys can thus be deter- mined by simulating the cooling curves. 2.1. Calculation of the solidiJication curves For the equilibrium solidification model, it is assumed that the solidifying alloys are in equilibrium during the solidification processes. The fractions of solid versus temperatures are thus only related to the distribution coefficient k = xnjxL, i.e. the ratio of the compositions between that of the solid phase, x~, and that of the liquid phase, xL. The distribution coefficients can be calculated from the assessed 1955
Copyright 0 1996 Acta Metallurgica Inc. Printed in Great Britain. All rights reserved
1359-6454/96 $15.00 + 0.00
Pergamon 0956-7151(!)5)00313-4
SOLIDIFICATION CURVES OF Al-h, Al-Mg AND Al-Cu-Mg ALLOYS
S.-W. CHEN and C.-C. HUANG Department of Chemical Engineering, National Tsing-Hua University, Kuang-Fu Road,
Hsin-Chu, Taiwan 30043, R.O. China
(Received 10 April 1995; in revised form 11 July 1995)
Abstract-Three different methods have been utilized to determine the solidification curves of the Al-rich Al-Q AI-MO and Al-Cu-Mg alloys. These three methods, i.e. a conventional quenching and image analysis method, calculations using two simplistic solidification models, and a proposed DTA coupled with mathematical modeling method, have been illustrated. Obtained by the three different methods, the solid fractions versus solidification temperatures of the solidifying samples are compared with one another, and the three different methods are discussed. Advantages of using the proposed DTA coupled with mathematical modeling method to determine the solidification curves are demonstrated. A -20°C undercooling of these Al-rich alloys during solidification has been observed by using DTA. The primary solidification phases are a-Al phase for all seven alloys. The secondary solidification phases have also been identified by using metallography, SEM (Scanning Electron Microscopy) and EPMA (Electron Probe Microanalysis).
1. INTRODUCTION
Casting processes are the most important methods in the manufacturing of aluminum alloys [l-4]. Due to the good fluidity and low melting point of most aluminum alloys, they are adaptable to many of the most commonly used casting processes. Viscosity of alloys is enormously reduced whilst melting, thus much less shear stress is required when using casting than when using the solid-state forming processes. This has made casting an economically preferable process in most occasions. The microstructures and microsegregations of the cast developed during solidification greatly affect the products’ properties [l-7]. This is obvious if the casting process is the product’s last forming process. Even through many after-cast treatments, the aluminum alloys still retain the cast structures in most cases. Controlling solidifi- cation process is no doubt very important. Under- standing of the solidification curves of aluminum alloys, i.e. the solidification sequences and solid fractions versus temperatures during solidification, are crucial for the control of solidification processes [5-lo]. The solidification curves are also believed to be related to the castability of alloys [g-lo]. AI-&, Al-Mg and Al-&-Mg alloys are the base alloys of many important cast alloys and many high strength commercial wrought alloys, such as 2090, 6061 and 7075, which are of importance in aerospace appli- cations. In this study, different methods have been used to determine the solidification curves of the Al-rich Al-Cu, Al-Mg and Al-Cu-Mg alloys.
2. METHODS OF DETERMINING THF SOLIDIFICATION CURVFS
Solidification curves can be experimentally deter- mined [g-11]. The quenching method is commonly used, and usually right after quenching quantitative metallography is carried out to determine the phase fractions. Solidification curves can also be obtained by calculation with various available solidification models [6, 1 l-191. The models used in this study are the equilibrium solidification model and Scheil model (non-equilibrium solidification model), which are the two most fundamental models and are most widely used in industry. Details of the two models will be given later. Efforts have also been made in combining experimental work and mathematical modeling together to determine the solidification curves. A method has been developed by using DTA (Differential Thermal Analysis) to determine the cooling curves of aluminum alloys, and the solidification curves of the alloys can thus be deter- mined by simulating the cooling curves.
2.1. Calculation of the solidiJication curves
For the equilibrium solidification model, it is assumed that the solidifying alloys are in equilibrium during the solidification processes. The fractions of solid versus temperatures are thus only related to the distribution coefficient k = xnjxL, i.e. the ratio of the compositions between that of the solid phase, x~, and that of the liquid phase, xL. The distribution coefficients can be calculated from the assessed
1955
1956 CHEN and HUANG: SOLIDIFICATION CURVES
thermodynamic models. The authors have studied the aluminum-rich end of the Al-&-Mg ternary system previously [20], and the assessed parameters for the thermodynamic models have been adopted in this study and are listed in Table 1. The thermodynamic parameters used in this study for the three binary constituent systems, Al-Cu, AI-Mg and Cu-Mg systems are based on Chen’s [6], Murray’s [21] and Zuo’s [22] assessments, respectively, and are also shown in Table 1. A solution model has been used to describe the u-Al and liquid phases. The excess Gibbs energy is represented by the following equation:
- 4UijXiXj]XiXj + w,23x1xzxj. (1)
The two intermetallic phases at the Al-rich corner, f3 -Al,Cu and S-Al,CuMg phases, reveal only small ranges of homogeneity and are treated as line compounds. Their integral Gibbs energies of formations are represented by a three-term and two- term equation, respectively:
AG,=A+BT+CTlnT, (2a)
AG,=A+BT. W)
The Scheil model [12] has four basic assumptions: (1) the interfaces are in equilibrium; (2) there is no diffusion in the solid phase; (3) the compositions are homogeneous through the entire liquid phase; and (4) the densities are equal for the solid and liquid phases. Based on the above four assumptions, mass balance equations can be derived for the solidification pro- cesses. The derived mass balance equations and the numerical solving procedures have been described previously [6]. The distribution coefficients of the Al--&, Al-Mg and Al-Cu-Mg systems are obtained from the thermodynamic models mentioned above [20-221.
Table 1. Parameters of thermodvnamic models for the Al-&. AI-Mg and Al&-Mg systems
Lattice stabilities:
AG$‘L= 10795.0- 11.564 x T AG$? = 6531.2 - 10.983 x T AG,;‘L = 13054.0 - 9.615 x T
Solution parameters for the liquid phase (L) and fee phase (a). (l-Al, 2-Cu, 3-Mg):
AG; = 22893.2 - 423.07 x T + 56.453 x T x In(T) AC;= -24500+ 11.315 x T
[Standard states: Al(L). Cu(Lk ME(
2.2. Quenching and image analysis
The binary alloys were prepared with elements of 99.99% purity. For the preparation of Al-Cu alloys, the BN (boron nitride) coated stainless steel crucible, which contained the weighed elements was kept inside a furnace at 800°C for 1 h, taken out of the furnace, and then the molten alloys were cast in a pre-warmed graphite mold to produce rods of 8 mm in diameter and 120 mm in length. For the preparation of AI-Mg alloys, aluminum was melted first and poured on top of magnesium. The aluminum-covered magnesium with aluminum was then transferred to a furnace at 800°C and kept inside for 15 min, then the same procedures as used for preparing AI-Cu alloys were followed. Ternary alloys were prepared with 99.99% purity aluminum, 99.99% purity copper and Al-Mg master alloys. The same methods as used to prepare Al--& alloys were applied. Pieces of Al-Q, Al-Mg and AlKu-Mg rods were cut and analyzed for compositions by using ICP (Inductively Coupled Plasma). Losses of the magnesium during the alloy preparation were observed. Compositions of the alloys investigated in this study are listed in Table 2.
Conventional quenching experiments were carried out. Each sample was loaded in a boron nitride crucible and encapsulated in a quartz tube. The encapsulated sample cells were held inside a heated vertical tube furnace at 700°C for 30 min. During the prolonged holding, the aluminum alloys became molten. The furnace was than cooled at a controlled cooling rate. The selected cooling rates were 1 and S”C/min. The samples remained inside the furnace until the furnace reached a pre-determined tempera- ture, then they were quenched into water. The soli- dified aluminum alloys were cut in half. One half of the sample was analyzed for the formation phases by using XRD (X-ray diffraction) and the other half was mounted and prepared for metallography and image analysis. Microstructures of the solid and liquid phases prior to quenching can be discerned owing to the differences of the cooling rates between furnace cooling and quenching. The fractions of the solid phases prior to quenching were counted by using a Leco image analyzer [23]. SEM (Scanning Electron Microscopy) and EPMA were also used to identify the primary and secondary solidification phases. The solidification curves were thus determined.
Table 2. Compositions of alloys investigated in this study
DTA is one type of TA (thermal analysis). There are two cells inside a DTA furnace. One of the cells is for holding the sample and the other is for the reference. The differences in the temperatures between the two cells are recorded, and are resulted mainly from phase transformations in the sample during the heating or cooling scan. In most cases, references are chosen so that there are no phase transformations of the standard in the working temperature range. DTA is a well-developed tech- nology. Theories and applications of DTA have been widely investigated [24-351. Most often, DTA are used for the determinations of phase transformation temperatures, heat capacities of materials and com- positions of alloys. Gray [30] proposed a simplistic mathematical model describing the heat transfer of DTA. Simulations of the determined cooling curves of DTA have been carried out in this study by using Gray’s model. The models can then be used to calculate the solidification curves of samples. Backerud [3] used a traditional TA method with mathematical models to determine the solidification curves of many commercial aluminum alloys. How- ever, TA does not have a reference cell and the results are not as sensitive as those determined using DTA.
Tb DTA samples were 1 mm in diameter and 8 mm in length, and were loaded inside BN crucibles and encapsulated in 3 mm ID quartz tubes. Both experiments of heating and cooling scanning modes were carried out. The heating rates were at 10, 4 and l”C/min, while the cooling rates were at 10 and 4”C/min. Microstructures of the samples from DTA experiments were then examined by using optical microscopy. SEM and EPMA were also used for the identification of the phases.
Gray’s model was used to simulate the DTA curves determined experimentally [35]. A schematic diagram of the DTA cell as shown in Fig. 1, consisting of a sample cell at a temperature T,, a reference cell at a temperature T,, a source of thermal energy at Tp, and a path having a thermal resistance, R, through which
of energy
Fig. 1. Gray’s [30] description of the DTA cell.
the thermal energy runs to or from the sample and the reference. By assuming that the sample temperature Ts and the reference temperature T, were uniform and equal to those of their containers, Gray gave the thermal balance equations for the DTA cells [30]. The temperature differences of the two cells were derived from the thermal balance equations for the DTA cells and are given in the following:
+RC d(T,-Ts) s dt . (34
It is assumed that the term R(C,- C,) dT,/dt is negligible. The validity of this assumption is verified by the fact that the DTA is adjusted so that the base line is flat in the usual practice. The term dh/dt is directly related to the rate of the phase transform- ation, i.e. dfh/dt in this solidification case. For simplicity, the heat of solidification is assumed to be constant. Equation (3a) can thus be rewritten as
(Ts - T,) = RH$= + RC, d(T,d; “). Pb)
The temperature differences (T, - T,) are determined from the DTA cooling curves, and R, H and Cs are parameters of the DTA instrument and samples. However, direct measurements of R, H and C, are difficult. In this study, RH and RC, were determined from the cooling curves as the two system parameters by the following procedures. According to Gray’s model, the cooling curves of the after-reaction part depend only on RC, because there is no longer any reaction heat input or output in the sample cell [35]. Equation (4) can be derived from equation (3b) with the boundary condition, at the end of the reaction t = &ad, the temperature difference AT = AT,,,,
AT = AT,,, exp[ -(i-$nd)]. (4)
Once RC, has been determined by simulating the after-reaction curve with equation (4), RH can be obtained by integrating over the entire reaction range by using equation (3b).
3. RESULTS AND DISCUSSION
Two binary Al-01 alloys and two binary Al-Mg alloys were examined. As listed in Table 1, the compositions were Al-IO.0 wt% Cu, Al-4.5 wt% Cu, Al-6.5 wt% Mg and Al-4.25 wt% Mg for samples # 1, # 2, # 3 and # 4, respectively. The phase solidifi- cation sequences can be determined very easily by judging from the equilibrium Al-0 and Al-Mg phase diagrams. For samples # l-#4, the primary solidification phases are the a-Al phase while the secondary phases are the binary eutectics, if there are any secondary phases. As described in the previous
1958 CHEN and HUANG: SOLIDIFICATION CURVES
Fig. 2. The microstructure of an Al-10.0 wt% Cu alloy solidified at aeooling rate of lO”C/min and quenched at 630°C.
section, the samples were melted at 7OO”C, cooled inside the furnace at a controlled cooling rate, and then quenched at a pre-determined temperature. The microstructure of an Al-IO.0 wt% Cu alloy is shown in Fig. 2. It was solidified at a cooling rate of lO”C/min and then quenched at 630°C. The regions with fine structures were liquid phase prior to quenching, while the bright and large cc-Al phase was the region that was already solidified prior to quenching. The fraction of the bright and large a-Al phase was counted using a Leco image analyzer.
Owing to the possible deviations of the solid fractions caused by segregations, more than 30 sections were examined for every specimen in order to obtain a statistical accuracy. The solid fractions thus obtained are in comparison with the results determined by other methods and are shown in Figs 3-6 for binary alloys # l- # 4, respectively. There are no data in the regions of high liquid fractions, because the samples quenched at higher temperatures with higher liquid fractions were exploded during quenching and their fraction solid could not be analyzed.
Al-l Owt%C c
Quenching
DTA
Lever Rule
------ Scheil Model
520 I I I I I t I I
0.20 0.40 0.60 0.60 1.00 Fraction Solid
Fig. 3. Solid fraction vs temperature for sample # 1 during solidification.
CHEN and HUANG: SOLIDIFICATION CURVES 1959
I AI-4.5wt%C1
640
DTA
Lever Rule
-- - Scheil Model
520 / 0.00 0.20 0.40 0.60 0.80
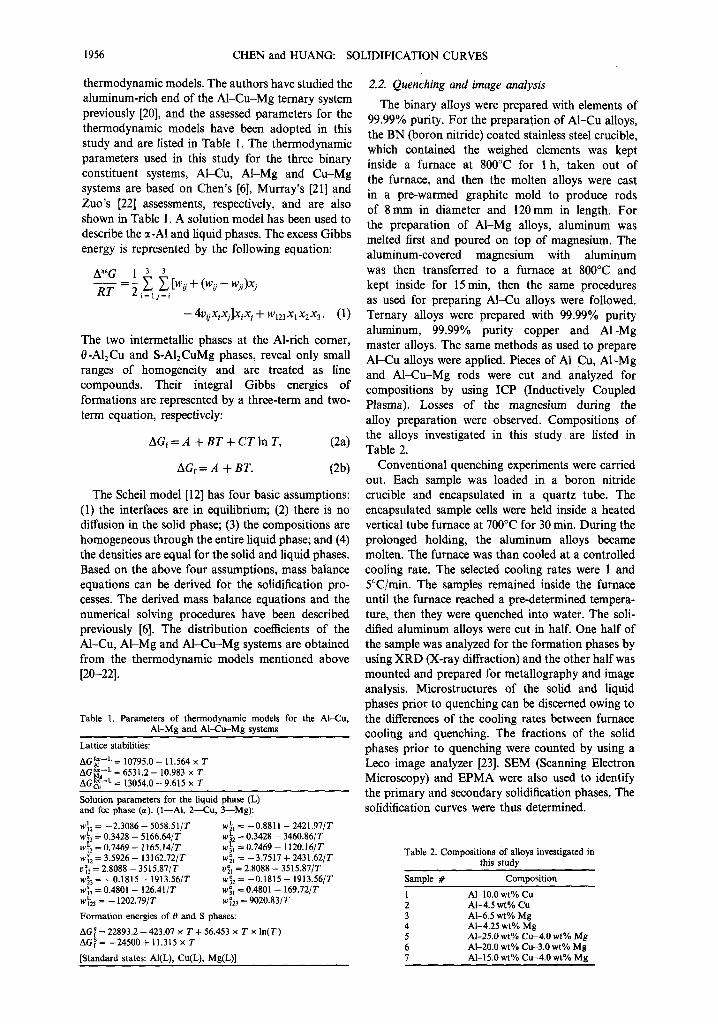
Fraction Solid Fig. 4. Solid fraction vs temperature for sample #2 during solidification.
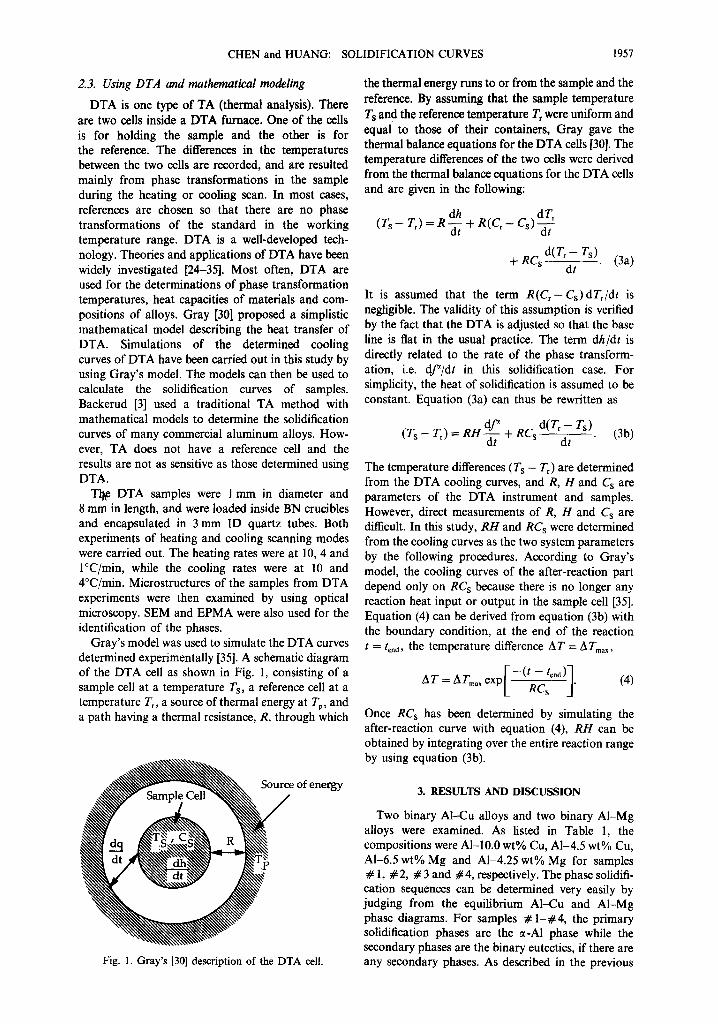
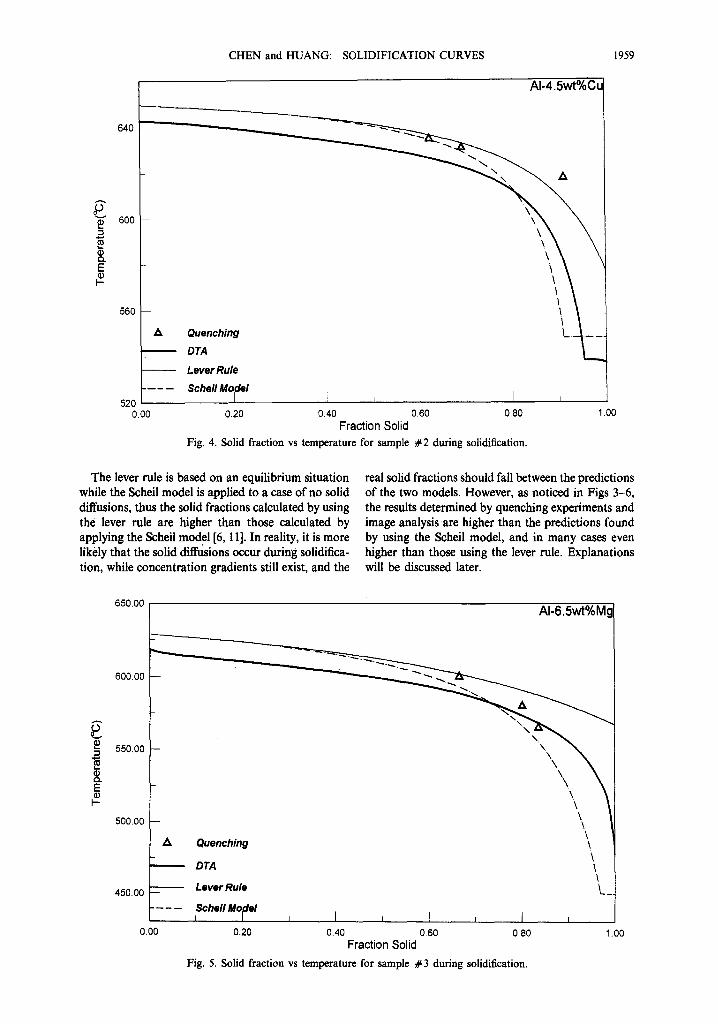
The lever rule is based on an equilibrium situation real solid fractions should fall between the predictions while the Scheil model is applied to a case of no solid of the two models. However, as noticed in Figs 3-6, diffusions, thus the solid fractions calculated by using the results determined by quenching experiments and the lever rule are higher than those calculated by image analysis are higher than the predictions found applying the Scheil model [6, 111. In reality, it is more by using the Scheil model, and in many cases even likely that the solid diffusions occur during solidifica- higher than those using the lever rule. Explanations tion, while concentration gradients still exist, and the will be discussed later.
650.00 AI-6.5wt%F
g 3 550.00
H
E E
500.00
600.00 -
\ \ \ \
A Quenching \ \
DTA \ \ \
450.00 - Lever Rule j
I I I I 0.00 0.20 0.40 0.60 0.80 1.00
Fraction Solid
Fig. 5. Solid fraction vs temperature for sample #3 during solidification.
1960 CHEN and HUANG: SOLIDIFICATION CURVES
650.00
600.00
A Quenching \ \
DTA \ I
Lever Rule I 450.00 - I
---- -- Scheil Model I I I
0.00 0.20 0.40 0.60 0.60 1.00 Fraction Solid
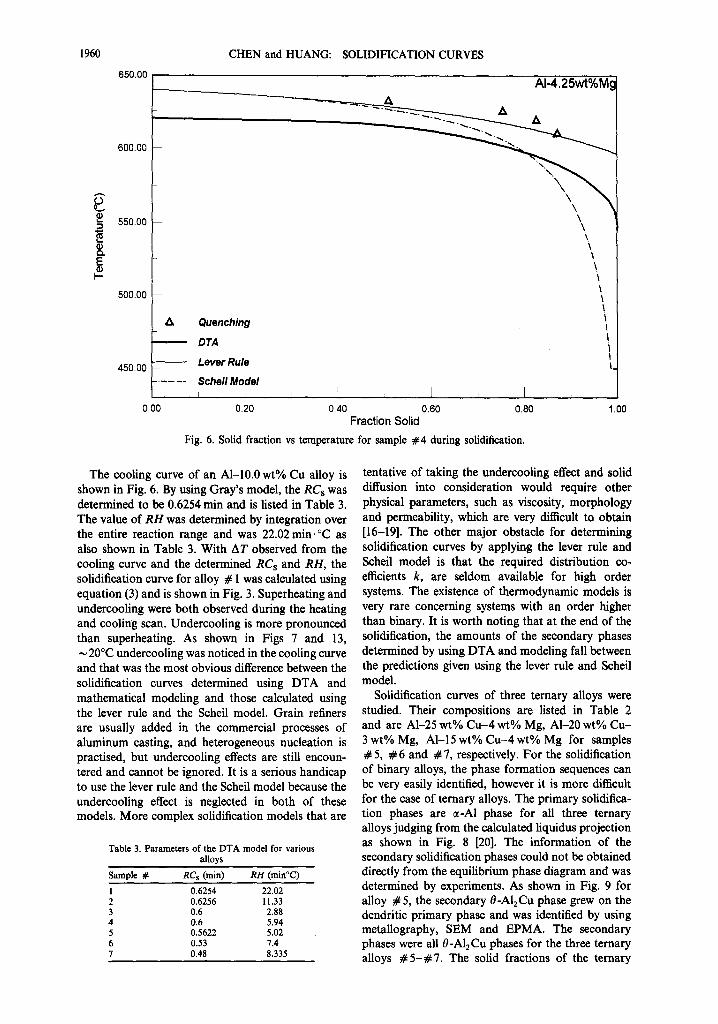
Fig. 6. Solid fraction vs temperature for sample #4 during solidification.
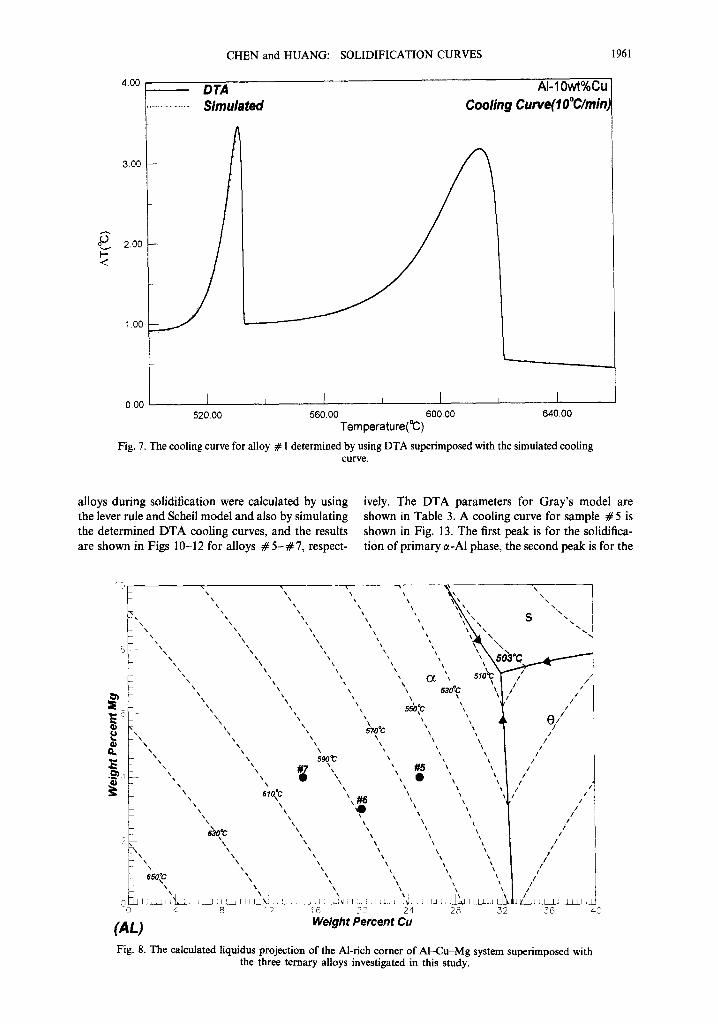
The cooling curve of an Al-lo.0 wt% Cu alloy is shown in Fig. 6. By using Gray’s model, the RC, was determined to be 0.6254 min and is listed in Table 3. The value of RH was determined by integration over the entire reaction range and was 22.02min.C as also shown in Table 3. With AT observed from the cooling curve and the determined RC, and RH, the solidification curve for alloy # 1 was calculated using equation (3) and is shown in Fig. 3. Superheating and undercooling were both observed during the heating and cooling scan. Undercooling is more pronounced than superheating. As shown in Figs 7 and 13, N 20°C undercooling was noticed in the cooling curve and that was the most obvious difference between the solidification curves determined using DTA and mathematical modeling and those calculated using the lever rule and the Scheil model. Grain refiners are usually added in the commercial processes of aluminum casting, and heterogeneous nucleation is practised, but undercooling effects are still encoun- tered and cannot be ignored. It is a serious handicap to use the lever rule and the Scheil model because the undercooling effect is neglected in both of these models. More complex solidification models that are
Table 3. Parameters of the DTA model for various alloys
tentative of taking the undercooling effect and solid diffusion into consideration would require other physical parameters, such as viscosity, morphology and permeability, which are very difficult to obtain [16-191. The other major obstacle for determining solidification curves by applying the lever rule and Scheil model is that the required distribution co- efficients k, are seldom available for high order systems. The existence of thermodynamic models is very rare concerning systems with an order higher than binary. It is worth noting that at the end of the solidification, the amounts of the secondary phases determined by using DTA and modeling fall between the predictions given using the lever rule and Scheil model.
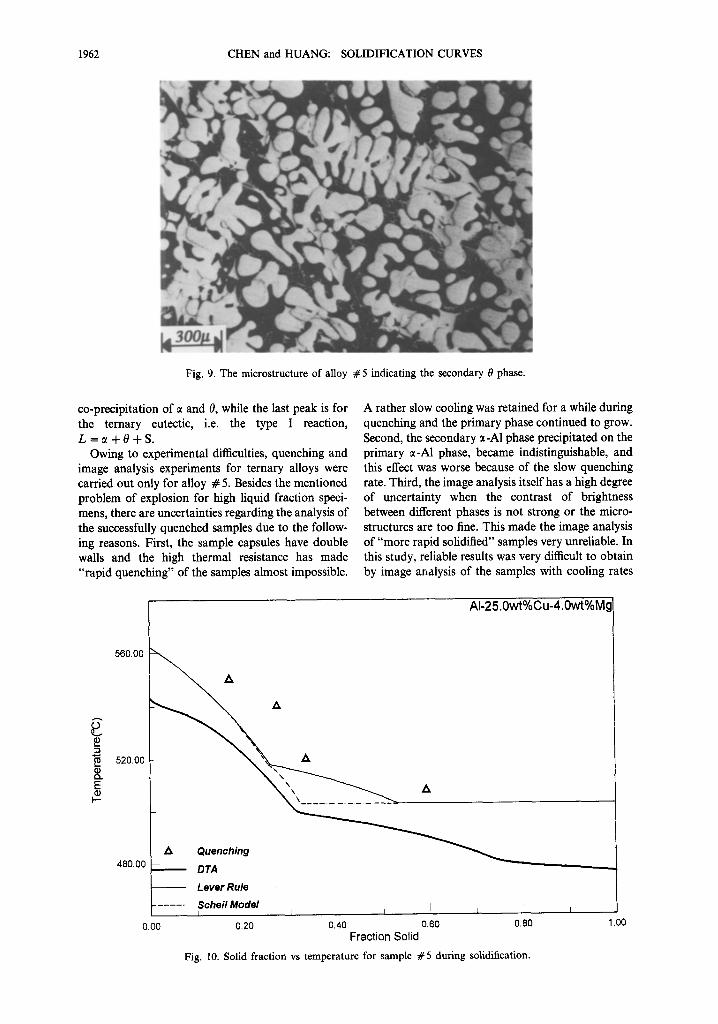
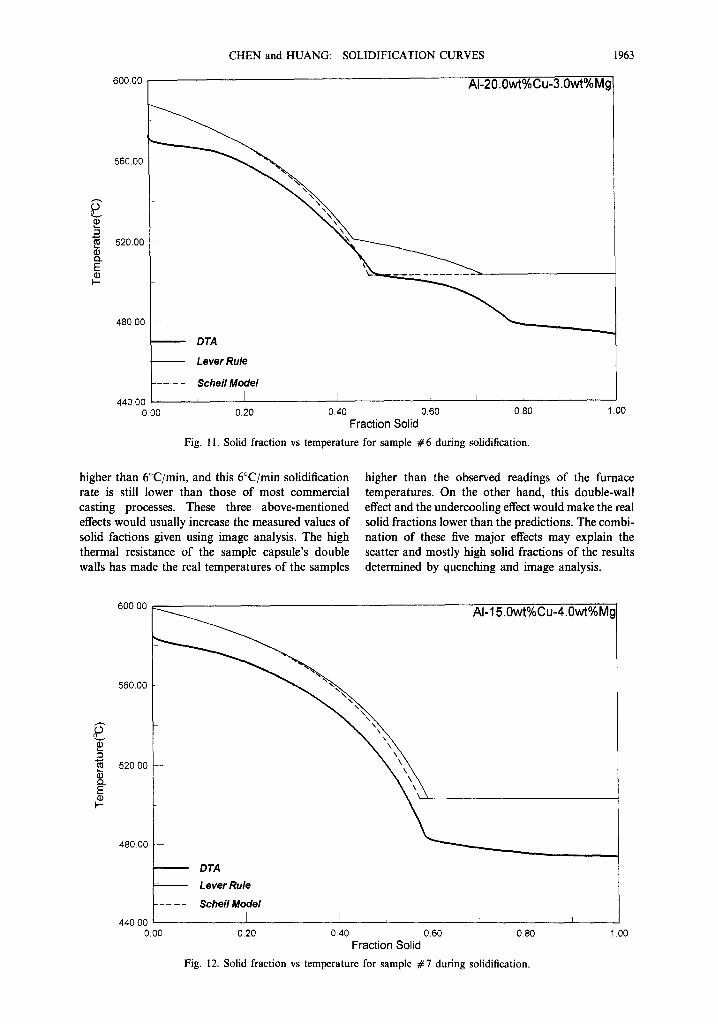
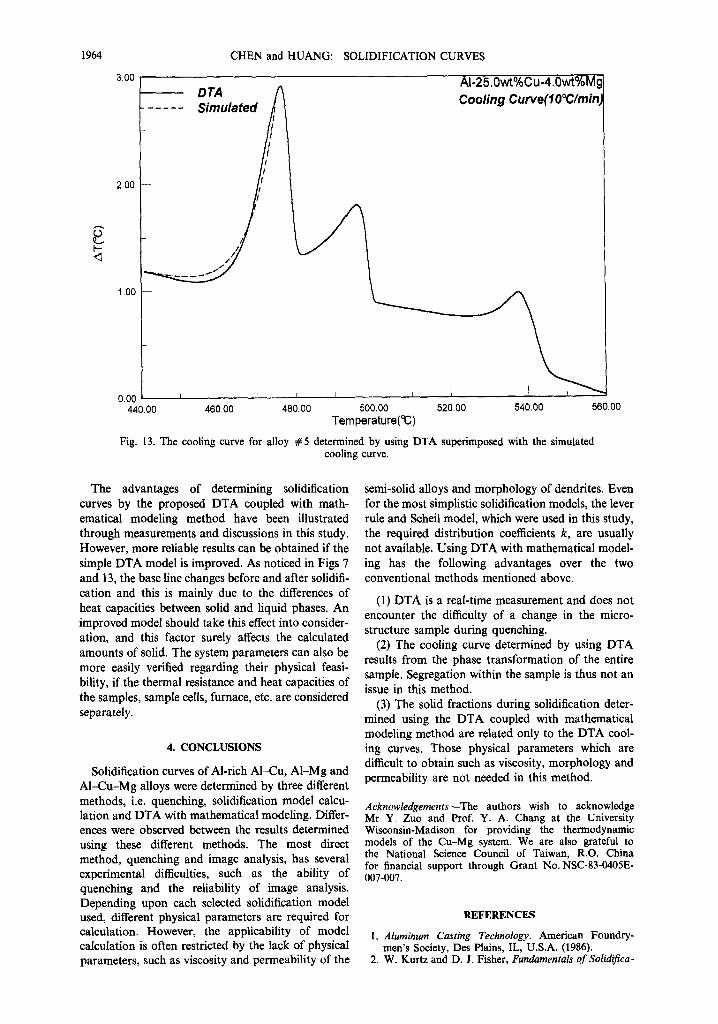
Solidification curves of three ternary alloys were studied. Their compositions are listed in Table 2 and are Al-25 wt% Cu-4 wt% Mg, Al-20 wt% Cu- 3 wt% Mg, Al-15 wt% Cu-4 wt% Mg for samples # 5, # 6 and # 7, respectively. For the solidification of binary alloys, the phase formation sequences can be very easily identified, however it is more difficult for the case of ternary alloys. The primary solidifica- tion phases are cl-Al phase for all three ternary alloys judging from the calculated liquidus projection as shown in Fig. 8 [20]. The information of the secondary solidification phases could not be obtained directly from the equilibrium phase diagram and was determined by experiments. As shown in Fig. 9 for alloy #5, the secondary B-Al,Cu phase grew on the dendritic primary phase and was identified by using metallography, SEM and EPMA. The secondary phases were all 0-Al,Cu phases for the three ternary alloys # 5-#7. The solid fractions of the ternary
CHEN and HUANG: SOLIDIFICATION CURVES 1961
4.00
3.00
B
F
2.00
1 oc
0 ot
. - DTA Al-l Owt%Cu
‘. Simulated Cooling Cufuef I 0 Wmin,
520.00
1
560.00 600.00 640.00 Temperahire
Fig. 7. The cooling curve for alloy # 1 determined by using DTA superimposed with the simulated cooling curve.
alloys during solidification were calculated by using ively. The DTA parameters for Gray’s model are the lever rule and Scheil model and also by simulating shown in Table 3. A cooling curve for sample # 5 is the determined DTA cooling curves, and the results shown in Fig. 13. The first peak is for the solidifica- are shown in Figs lo-12 for alloys #5-#7, respect- tion of primary a-Al phase, the second peak is for the
8 28 32 36 40
Fig. 8. The calculated liquidus projection of the Al-rich corner of Al-Cu-Mg system superimposed with the three ternary alloys investigated in this study.
1962 CHEN and HUANG: SOLIDIFICATION CURVES
Fig. 9. The microstructure of alloy #5 indicating the secondary 0 phase.
co-precipitation of tl and 0, while the last peak is for the ternary eutectic, i.e. the type I reaction, L.=a+e+s.
Owing to experimental difficulties, quenching and image analysis experiments for ternary alloys were carried out only for alloy # 5. Besides the mentioned problem of explosion for high liquid fraction speci- mens, there are uncertainties regarding the analysis of the successfully quenched samples due to the follow- ing reasons. First, the sample capsules have double walls and the high thermal resistance has made “rapid quenching” of the samples almost impossible.
A rather slow cooling was retained for a while during quenching and the primary phase continued to grow. Second, the secondary a-Al phase precipitated on the primary CI -Al phase, became indistinguishable, and this effect was worse because of the slow quenching rate. Third, the image analysis itself has a high degree of uncertainty when the contrast of brightness between different phases is not strong or the micro- structures are too fine. This made the image analysis of “more rapid solidified” samples very unreliable. In this study, reliable results was very difficult to obtain by image analysis of the samples with cooling rates
Lever Rule
----- +heilMopel 1 I i 0.20 0.40 0.60 0.80 1.00
Fraction Solid
Fig. 10. Solid fraction vs temperature for sample #5 during solidification.
CHEN and HUANG: SOLIDIFICATION CURVES 1963
600.00 AI-20.0wt%Cu-3.0wt%Mg
F DTA
Lever Rule
-- - - Scheil Model
44000 1 1 1
_ _^ .I 0 00 0.20 0.40 0.60 0.W 1.00
Fraction Solid
Fig. 11. Solid fraction vs temperature for sample # 6 during solidification.
higher than 6”C/min, and this 6”C/min solidification higher than the observed readings of the furnace rate is still lower than those of most commercial temperatures. On the other hand, this double-wall casting processes. These three above-mentioned effect and the undercooling effect would make the real effects would usually increase the measured values of solid fractions lower than the predictions. The combi- solid factions given using image analysis. The high nation of these five major effects may explain the thermal resistance of the sample capsule’s double scatter and mostly high solid fractions of the results walls has made the real temperatures of the samples determined by quenching and image analysis.
600.00
560.00
48000
Al-l 50wt%Cu-4.0wt%M:
44000
DTA
Lever Rule
---~- - Scheil Model
0.00 0.20 040 0.60 0.80 1.00 Fraction Solid
Fig. 12. Solid fraction vs temperature for sample #7 during solidification
CHEN and HUANG: SOLIDIFICATION CURVES
AI-25Owt%Cu-4.0wt%M{ Cooling Cufve(~O”C/min,
460.00 460.00 500.00 Temperature(V)
560.00
Fig. 13. The cooling curve for alloy #5 determined by using DTA superimposed cooling curve.
with the simulated
The advantages of determining solidification curves by the proposed DTA coupled with math- ematical modeling method have been illustrated through measurements and discussions in this study. However, more reliable results can be obtained if the simple DTA model is improved. As noticed in Figs 7 and 13, the base line changes before and after solidifi- cation and this is mainly due to the differences of heat capacities between solid and liquid phases. An improved model should take this effect into consider- ation, and this factor surely affects the calculated amounts of solid. The system parameters can also be more easily verified regarding their physical feasi- bility, if the thermal resistance and heat capacities of the samples, sample cells, furnace, etc. are considered separately.
4. CONCLUSIONS
Solidification curves of Al-rich Al-Q, Al-Mg and Al-Cu-Mg alloys were determined by three different methods, i.e. quenching, solidification model calcu- lation and DTA with mathematical modeling. Differ- ences were observed between the results determined using these different methods. The most direct method, quenching and image analysis, has several experimental difficulties, such as the ability of quenching and the reliability of image analysis. Depending upon each selected solidification model used, different physical parameters are required for calculation. However, the applicability of model calculation is often restricted by the lack of physical parameters, such as viscosity and permeability of the
semi-solid alloys and morphology of dendrites. Even for the most simplistic solidification models, the lever rule and Scheil model, which were used in this study, the required distribution coefficients k, are usually not available. Using DTA with mathematical model- ing has the following advantages over the two conventional methods mentioned above.
(1) DTA is a real-time measurement and does not encounter the difficulty of a change in the micro- structure sample during quenching.
(2) The cooling curve determined by using DTA results from the phase transformation of the entire sample. Segregation within the sample is thus not an issue in this method.
(3) The solid fractions during solidification deter- mined using the DTA coupled with mathematical modeling method are related only to the DTA cool- ing curves. Those physical parameters which are difficult to obtain such as viscosity, morphology and permeability are not needed in this method.
Acknowledgements-The authors wish to acknowledge Mr Y. Zuo and Prof. Y. A. Chang at the University Wisconsin-Madison for providing the thermodynamic models of the Cu-Mg system. We are also grateful to the National Science Council of Taiwan, R.O. China for financial support through Grant No. NSC-83-0405E- 007-007.
REFERENCES
1. Aluminum Casting Technology. American Foundry- men’s Society, Des Plains, IL, U.S.A. (1986).
2. W. Kurtz and D. J. Fisher, Fundamentals of Solidifica-
CHEN and HUANG: SOLIDIFICATION CURVES 1965
3.
4.
5.
6.
I. 8. 9.
10.
11.
12.
13.
14.
15.
16.
17. 18.
tion, Tram Tech Publications, Aedemannsdorf, Switzer- land (1989). L. Backerud, E. Krol and J. Tamminen, Solid@ztion Characteristics of Aluminum Alloys, Vol. 1: Wrought Alloys. Skan Aluminium, Oslo, Norway (1986). L. Backerud, Solidification Characteristics of Aluminum Alloys, Vol. 2: Cast Alloys. American Foundrymen’s Society, Des Plains, IL, U.S.A. I. Minkoff, SolidiJcation and Cast Structure. John Wiley & Sons, Chichester, U.K. (1986). S.-W. Chen, Y.-Y. Chuang, Y. A. Chang and M. G. Chu, Metall. Trans. A 22A, 2837 (1991). Kamio, J. Japan Inst. Light Mefals 31(2), 110 (1981). R. J. Claxton, J. Metals 27(2), 14 (1975). J. E. Jacoby, private communication, Alcoa (1991). S. A. Metz and M. C. Flemings, AFS Trans. 77, 329 (1969). S-W. Chen and Y. A. Chang, Metall. Trans. A 2QA, 267 (1991). M. C. Flemings, Solidification Processing. McGraw- Hill, New York, U.S.A: (1977). H. D. Brodv and M. C. Flemines. Trans. TMS-AIME 236, 615 (1966).
Y
T. W. Clyne and W. Kurz, Metall. Trans. A 12A, 965 (1981). Y. Ueshima, S. Mizoguchi, T. Matsumiya and H. Kajioka, MeraN. Trans. B 17B, 845 (1986). S. P. Marsh, M. E. Glicksman, L. Meloro and 31.
J. Campbell, Muter. Sci. Technol. 7, 885 (1991). C.-C. Huang and S-W. Chen, Metall. mater. Trans. A 26A, 1007 (1995). J.-L. Murray, B. Alloy Phase Diagrams 3, 60 (1982). Y. Zuo, private communications, Univ. of Wisconsin- Madison (1994). Metals Handbook, Vol. 9, pp. 123-134. American Society for Metals, Metals Park, OH, U.S.A. (1985). R. C. Mackenzie, Differential Thermal Analysis. Academic Press, New York, U.S.A. (1970). M. I. Poue and M. D. Judd. Differential Thermal Analysis. Heyden and Son, London,England (1977). W. W. Wendlandt, Thermal Analysis, 3rd ed. John Wiley, New York, U.S.A. (1986). M. E. Brown, Introduction to Thermal Analysis, Techniques and Applications. Chapman and Hall, New York, U.S.A. (1988). W. L. Fink, F. Keller, W. E. Sicha, J. A. Neck, Jr and E. H. Dix, Jr, Physical Metallurgy of Aluminum Alloys. American Society for Metals, Cleveland, OH, U.S.A. (1949). F. N. Rhines, Phase Diagrams in Metallurgy, Their Development and Application. McGraw-Hill, New York, U.S.A. (1956). A. P. Gray, Analytical Calorimetry (edited by R. S. Porter and J. F. Johnson), pp. 209-218. Plenum Press, New York, U.S.A. (1968). H. Frederiksson and B. Rogberg, Metals Sci. 685
K. Tsutumi, Modeling of Casting and Welding Process (1979). IV (edited by A. F. Giamei and G. J. Abbaschian), 32. G. Bruzzone, Thermochimica Acta 96, 239 (1985). pp. 15523. The Minerals, Metals & Materials Society, 33. Y. T. Zhu and J. H. Devletian, Metall. Trans. A 22A, Warrendale, PA, U.S.A. (1988). 1993 (1991). M. Rappaz, Int. Mater. Rev. 194, 93 (1989). 34. R. F. Speyer, J. Muter. Res. 8(3), 675 (1993). A. Roosz and H. E. Exner, Acta metall. mater. 38(2), 35. S.-W. Chen, C-C. Huang and J.-C. Lin, Chem. Engng 375 (1990). Sci. 50, 417 (1995).