LAPPEENRANTA UNIVERSITY OF TECHNOLOGY Faculty of Technology LUT Energy Degree Program of Environmental Technology Juho Innanen SOLIDS REMOVAL IN PYROLYSIS Examiners: Professor, Ph.D. Mika Horttanainen M.Sc. (Tech.) Joakim Autio
Transcript
LAPPEENRANTA UNIVERSITY OF TECHNOLOGY
Faculty of Technology
LUT Energy
Degree Program of Environmental Technology
Juho Innanen
SOLIDS REMOVAL IN PYROLYSIS
Examiners: Professor, Ph.D. Mika Horttanainen
M.Sc. (Tech.) Joakim Autio
ABSTRACT
Lappeenranta University of Technology Faculty of Technology LUT Energy Degree Program of Environmental Technology Juho Innanen Solids removal in pyrolysis Master’s thesis 2013 73 pages, 32 figures, 5 tables and 1 appendix Examiners: Professor Mika Horttanainen M.Sc. (Tech.) Joakim Autio Keywords: bioenergy, pyrolysis, cyclones, hot vapor filtration Pyrolysis is a process for turning biomass into liquid fuel. The process consists of heating the biomass in inert conditions and quenching the resulting vapors into oil. The oil has many potential uses, such as heating fuel in peak heating plants. In order to broaden the application base and improve the quality of the oil, solids removal has to be addressed. The solids may also increase the probability of plugging in downstream equipment. The purpose of this research was to gain an understanding of the formation of solids in the pyrolysis process and to assess options for reducing the solid content of the oil. From literature it is known that the solids can be removed either by hot vapor filtration, liquid treatment or multiple cyclones. Hot vapor filtration decreases yield, but improves the stability of the oil while simultaneously removing solids and ash. Liquid treatment techniques are good for removing large particles but involve losses of pyrolysis liquid. Cyclones are a traditional robust technique used regularly in pyrolysis. In the experimental part of this thesis, a 2 MWfuel pyrolysis setup with 2 cyclones in series was operated and monitored. Solid and liquid samples were collected from various parts of the process for further examination. Sampling and sample treatment techniques were developed. The chemical properties of the pyrolysis char were also analyzed and assessed as a function of reactor temperature and fluidizing velocity. By measuring the particle size distributions it was noticed that there were much smaller particles collected from the second cyclone than fed into pyrolysis. The solids in the pyrolysis oil were even smaller. This was most likely caused by attrition and shrinkage. Due to better separation efficiency of the cyclones in large particles, excess attrition should be avoided.
TIIVISTELMÄ Lappeenrannan teknillinen yliopisto Teknillinen tiedekunta LUT Energia Ympäristötekniikan koulutusohjelma Juho Innanen Kiintoaine-erotus pyrolyysissa Diplomityö 2013 73 sivua, 32 kuvaa, 5 taulukkoa ja 1 liite Tarkastajat: Professori Mika Horttanainen DI Joakim Autio Hakusanat: bioenergia, pyrolyysi, syklonit, kuumakaasusuodatus Pyrolyysi on termokemiallinen prosessi biomassan konvertoimiseksi nestemäiseksi polttoaineeksi. Siinä biomassa kuumannetaan nopeasti hapettomissa olosuhteissa n. 500 °C lämpötilaan. Näin muodostetulla nestemäisellä polttoaineella voidaan korvata mm. raskasta polttoöljyä kaukolämpökeskuksissa. Jotta pyrolyysiöljyn sovelluspohjaa voitaisiin laajentaa ja öljyn laatua parantaa, täytyy öljyn kiintoaineen poistoa tutkia ja kehittää. Tämän tutkimuksen tarkoituksena on lisätä ymmärtämystä öljyn kiintoaineen alkuperästä ja sen poistamiseen käytettävistä yksikköprosesseista. Kirjallisuudesta tiedetään että kiintoaineen poistamiseen voidaan käyttää nestepuolella suodatusta ja sentrifugeja. Kaasupuolen kiintoaine-erotuksessa voidaan käyttää joko sykloneja tai kuumakaasusuodattimia. Kuumakaasusuodattimien huonoina puolina on vaikea puhdistettavuus ja saannon aleneminen, kun taas etuuksina on öljyn kiintoaine- ja tuhkapitoisuuden tehokas aleneminen ja stabilisuuden koheneminen. Suodattimia ja sentrifugeja voidaan käyttää tehokkaasti suurille partikkeleille. Syklonien käyttö on perinteinen kiintoaineen erotusmenetelmä leijupeti-pyrolyysissa, ja niitä voidaan laittaa useampia peräkkäin tai rinnakkain. Tutkimuksen kokeellisessa osuudessa pyrolyysilaitteistoa ajettiin ja monitoroitiin 2 MWpa
pilotointimittakaavassa. Kiintoaineen erotukseen käytettiin kahta peräkkäistä syklonia. Partikkeleja kerättiin useasta vaiheesta prosessia jatkoanalyysejä varten. Näytteenotto- ja näytteen esikäsittelymenetelmiä kehitettiin. Myös hiiltojäännöksen kemiallisia ominaisuuksia analysoitiin ja evaluoitiin lämpötilan ja leijutusnopeuden funktiona. Toisen syklonin alitteesta analysoidut partikkelikokojakaumat olivat huomattavasti pienempiä kuin prosessin lähtöaineista löydetyt. Prosessin lähtöaineissa ei myöskään ollut juuri lainkaan niin pieniä partikkeleita kuin valmistetussa pyrolyysiöljyssä. Todennäköisimmin tämä johtui partikkeleiden hankautumisesta ja kutistumisesta reaktorissa. Koska sykloneiden erotustehokkuus paranee partikkelikoon kasvaessa, ylimääräistä hankautumista täytyisikin pyrkiä vähentämään.
ACKNOWLEDGEMENTS
I would like to express gratitude to my supervisor Joakim Autio for this opportunity and the
topic of the thesis. Gratitude goes also to my professor Mika Horttanainen for freedom on
the thesis and valuable advice during the whole process.
I would also like thank all the people at Metso that made working my master’s thesis easier.
Especially Teuvo Ruuska for numerous insights on the automation system, Matti Rautanen
for supporting and lifting attitude, Antti Kaura for answers to any question regarding pyrolysis,
Lauri Kokko for the scientific coffee table conversations and Teppo Riihimäki for working
companion. The gasification team also deserves thanks for exhilarating the working
atmosphere and for organizing the field trip to Vaskiluoto gasification plant.
I would also like to say thanks to all my friends that aided in my journey through my university
years. Then of course I would like to say thanks to my supporting and loving family.
Tampere, 26th June 2013
Juho Innanen
5
CONTENTS
SYMBOLS AND ABBREVIATIONS 8
1 INTRODUCTION 10
1.1 Background 10
1.2 Structure 11
1.3 Objectives 11
2 INTEGRATED PYROLYSIS PROCESS 12
2.1 Reactor 12
2.2 Main process equipment 13
2.2.1 Pyrolysis feedstock and oil cycle 13
2.2.2 Sand cycle 13
2.2.3 Gas cycle 14
3 PYROLYSIS OIL PROPERTIES, PROCESSING AND USE 14
3.1 Basic properties and applications 14
3.2 Process yield 15
3.3 Solid content 16
3.4 Ash content 17
3.5 Water content 18
3.6 Reactions in oil during storage 18
3.7 Pyrolysis oil combustion 18
4 PROPERTIES OF PYROLYSIS GAS 20
4.1 Basic properties and volume 20
4.2 Density and molecular weight 20
4.3 Thermal cracking 21
4.4 Intraparticle reactions 21
4.5 Condensation and coking 22
4.6 Condensible compounds in pyrolysis gas 22
4.7 Size distribution of particles in pyrolysis gas 23
4.8 Secondary chars 24
5 HOT VAPOR FILTRATION 25
5.1 Barrier filters 25
5.2 Operating temperature 27
5.3 Filter regeneration 28
6
5.3.1 Nitrogen backpulsing 28
5.3.2 Controlled oxidation 28
5.3.3 Mechanical rings 29
5.3.4 Dissolution 29
5.4 Dimensioning considerations 29
5.5 Pyrolysis hot vapor filtration experiments 30
5.5.1 University of Twente 30
5.5.2 Mahasarakham University 33
5.5.3 Shanghai Jiao Tong University 33
5.5.4 University of Seoul 34
5.5.5 UOP & NREL 34
5.5.6 Aston University 35
5.5.7 NREL first experiments 36
5.6 Summary of HVF literature 37
6 PYROLYSIS LIQUID FILTRATION 38
6.1 Filtration in the liquid cycle 38
6.2 Filtration with centrifugation 39
7 CYCLONES 40
7.1 Operating principle and parts of the cyclone 40
7.1.1 Inlet duct configuration 41
7.1.2 Outlet/vortex finder configurations 41
7.2 Vortex length 42
7.3 Pressure drop 42
7.4 Separation efficiency 43
7.5 Cut-size diameter 44
7.6 Solids loading 45
7.7 Dust properties: Uniformness of feedstock 46
7.8 Dimensional analysis: Buckingham π-Theorem 46
7.8.1 Selection of dimensions 47
7.8.2 Dimensionless groups 47
7.8.3 Scaling from hot to cold model 49
8 PILOT PLANT TEST RUNS 50
8.1 Process overview 51
8.2 Test runs 52
8.3 Starting 52
7
8.4 Yield 52
8.5 Sampling: Loop seal 53
8.6 Char analyses 55
8.6.1 Sample preparation and analysis matrix 55
8.6.2 Results of the chemical composition analyses 56
8.7 Particle size distributions and sources of inaccuracy 57
8.7.1 Sand 58
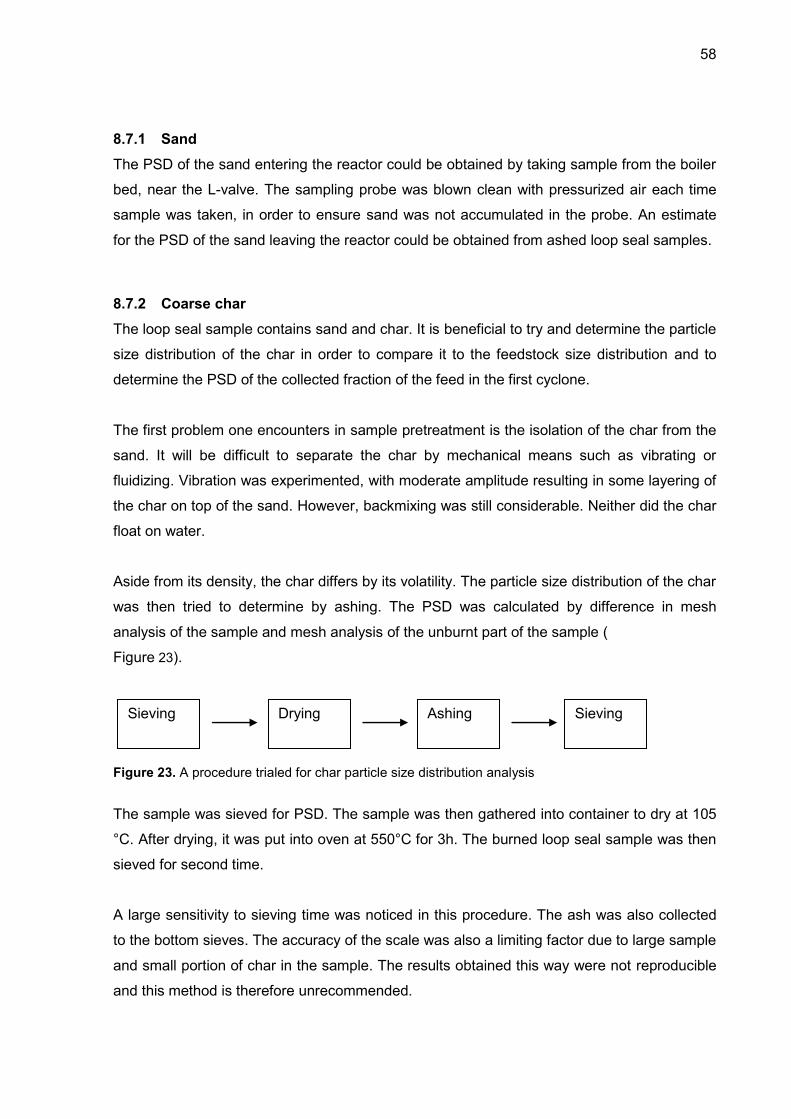
8.7.2 Coarse char 58
8.7.3 Secondary cyclone char 60
8.7.4 Pyrolysis oil 62
8.7.5 Feedstock 63
8.8 Results: Coarse material 63
8.9 Results: Fine material 64
8.10 Cyclone characteristics 66
8.11 Grade efficiency curve 66
9 SUMMARY AND CONCLUSIONS 67
REFERENCES 69
8
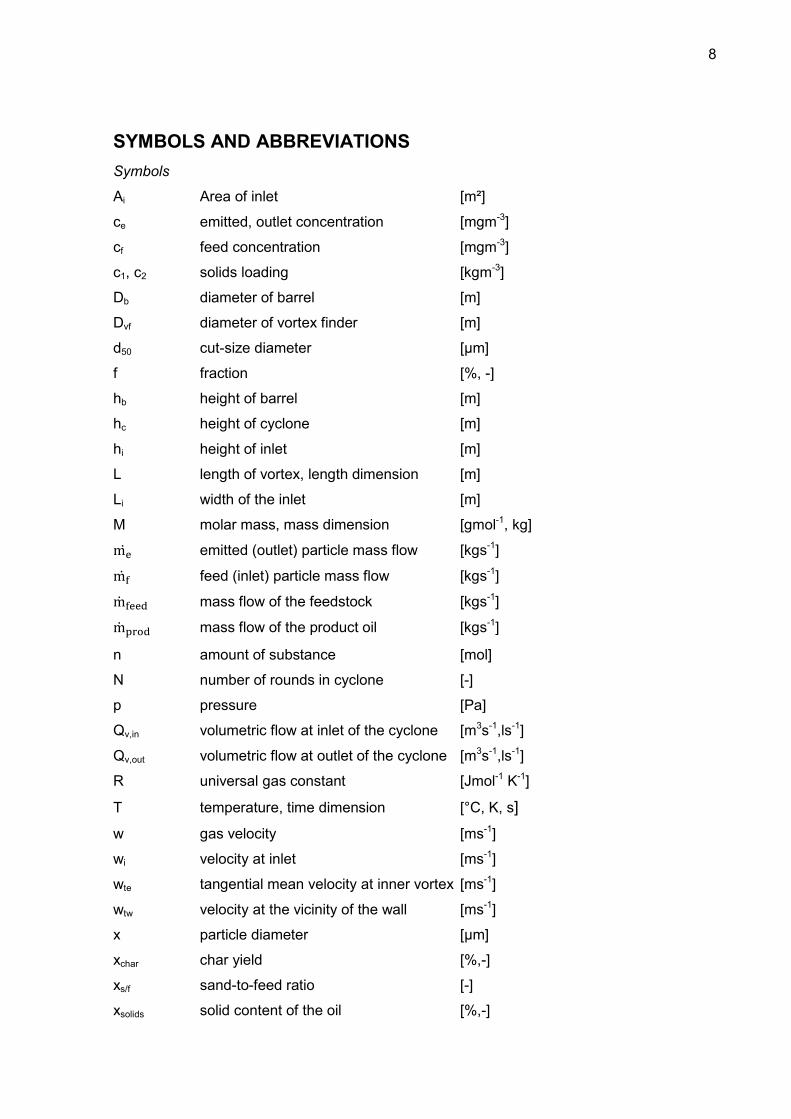
SYMBOLS AND ABBREVIATIONS
Symbols
Ai Area of inlet [m²]
ce emitted, outlet concentration [mgm-3]
cf feed concentration [mgm-3]
c1, c2 solids loading [kgm-3]
Db diameter of barrel [m]
Dvf diameter of vortex finder [m]
d50 cut-size diameter [µm]
f fraction [%, -]
hb height of barrel [m]
hc height of cyclone [m]
hi height of inlet [m]
L length of vortex, length dimension [m]
Li width of the inlet [m]
M molar mass, mass dimension [gmol-1, kg]
emitted (outlet) particle mass flow [kgs-1]
feed (inlet) particle mass flow [kgs-1]
mass flow of the feedstock [kgs-1]
mass flow of the product oil [kgs-1]
n amount of substance [mol]
N number of rounds in cyclone [-]
p pressure [Pa]
Qv,in volumetric flow at inlet of the cyclone [m3s-1,ls-1]
Qv,out volumetric flow at outlet of the cyclone [m3s-1,ls-1]
R universal gas constant [Jmol-1 K-1]
T temperature, time dimension [°C, K, s]
w gas velocity [ms-1]
wi velocity at inlet [ms-1]
wte tangential mean velocity at inner vortex [ms-1]
wtw velocity at the vicinity of the wall [ms-1]
x particle diameter [µm]
xchar char yield [%,-]
xs/f sand-to-feed ratio [-]
xsolids solid content of the oil [%,-]
9
xyield mass yield of the product oil [%,-]
η separation efficiency [%, -]
μ, μg kinematic viscosity [cSt, mm2s-1]
ρ density [kgm-3, tm-3]
ρp density of particles [kgm-3, gl-3]
Abbreviations
BTL Biomass to liquids
BFB Bubbling fluidized bed
CFB Circulating fluidized bed
CHP Combined heat and power
DCS Distributed control system
HVF Hot vapor filtration
IGCC Integrated gasification combined cycle
IPA Isopropylalcohol
KIT Karlsruhe institute of Technology
LHV Lower heating value
LHVar Lower heating value on an as received basis
NREL National renewable energy laboratory
PFBC Pressurized fluidized bed combustion
PSD Particle size distribution
SEM Scanning electron microscope
VTT Technical research centre of Finland
10
1 INTRODUCTION
1.1 Background
Increasing biomass use is one of the options to mitigate to climate change. Biomass is
renewable, meaning it has a closed carbon cycle, compared to fossil fuels which will
eventually deplete. It has been said that the role of bio-economy, meaning efficient use of
natural resources and flexible utilization of renewable energy, will strengthen. With the new
objectives in mind, biomass utilization will be renewed and new technologies appear and
evolve.
Fast pyrolysis is a process for converting solid biomass into liquid, energy dense fuel. The
end product of this thermochemical process is bio-oil, often called pyrolysis oil. Pyrolysis oil
has low viscosity and preserves good through winter, and is therefore a good fuel for peak
heating plants. Pyrolysis oil can also replace heavy fuel oil or natural gas in lime kilns, which
are the main fossil fuel consumption points in a pulp mill. Major benefit is that old
infrastructure can be used with minor retrofits. Pyrolysis product chain can also be used in
rural areas to overcome long transport distances of fuels.
This master’s thesis was made to Metso in co-operation with Lappeenranta University of
Technology, LUT. The integrated pyrolysis process has been developed and piloted since
2008 in Metso’s pilot plant. The pyrolysis system can be integrated into an existing fluidized
bed boiler. All the byproducts can be combusted in the boiler to recover heat and electricity,
therefore requiring no additional sub-optimal furnace (Solantausta et al. 2012). System
efficiency is benefited from the presence of the large steam cycle of a CHP plant.
Pyrolysis oil has a great potential as a cost-efficient energy carrier but it can also be used as
a feedstock for the manufacture of green chemicals. Previous work has demonstrated that it
can be used as a clean fuel to power district heating boilers (Sahimaa 2012).
However, the oil has some peculiar properties compared to fossil liquid fuels. Pyrolysis oil
contains solids. Development needs to be done, since solids in the oil may have detrimental
effects on the end use and handling of the oil, such as plugging of filters and erosion of
nozzles. The ash in the solids can also lead to increase in dust emissions. High solid content
is also known to catalyze aging reactions (Chen et al 2008)
11
1.2 Structure
The first part of the thesis covers the literature on pyrolysis oil and process: the properties of
the oil are reviewed. Metso’s integrated concept of pyrolysis is also presented.
In the fifth chapter, an extensive outlook is given on promising option for solid separation: hot
vapor filtration of pyrolysis vapors. The chapter covers hot gas filtration in general and hot
vapor filtration literature particularly associated with pyrolysis equipment. Much attention is
paid on hot gas filtrations’ effect on pyrolysis oil properties, and oil analyses from literature
are reviewed against general claims done on hot gas filtration of pyrolysis vapors.
Some of the more traditional techniques for solids removal are then revised in the following
chapters, where attention is paid on liquid filtration and cyclones. Cyclone parts, performance
criteria and load situations are reviewed from the literature. Dimensional analysis is also
demonstrated in order to account for the changes occurring in scaling of flows from hot
cyclone to cold model.
In the experimental section, pyrolysis equipment was run on pilot scale. The data recorded
from the pilot plant’s distributed control system was studied further along the oil quality
analyses. Analyses from solids collected in the process are reported. Combined methods
were used to get a grip on the vast amount of data produced during the test run week.
1.3 Objectives
The main objective is to increase knowledge and gain an understanding of the origin of solids
in pyrolysis process and on options to reduce it. Objective for the experimental part is
ultimately to find good practices to minimize solid entrainment in to circulating pyrolysis
liquid. Also the aim for test runs is to examine the particle size distributions of the solids in
different parts of the process and to assess the performance of the solid separation system.
12
2 INTEGRATED PYROLYSIS PROCESS
Integration of pyrolysis reactor into an existing fluidized bed boiler can be beneficial in many
ways. Easy operation is provided along with access to convenient heat carrier. Outside the
core process, integration also means that existing logistics and infrastructure can be utilized.
Synergies can be created by using waste heat from the plant for drying the feedstock. This
can lead to even greater utilization potential of existing infrastructure, since the full load
period of a typical CHP-plant can be extended in many cases. The reliability of the boiler is
not compromised, since it can be easily shifted to operation in stand-alone mode.
2.1 Reactor
The reactor consists of a vertical riser tube. It can be characterized either as a transport bed,
an entrained flow - or a circulating fluidized bed (CFB) reactor. In Metso’s integrated
pyrolysis process, the temperature for pyrolysis event is maintained using the hot sand from
the boiler. Both CFB- and BFB-boiler can be integrated with the system. The reactor is
depicted on the right side of the furnace in figure 1.
Figure 1. Schematic of the pyrolysis system.
Particles are separated by a set of cyclones on the reactor exit. Most of the particles are
sand used as a heat transfer medium. Other particles are char from the pyrolyzing biomass.
Particle separation by cyclones is further covered in chapter 7.
13
2.2 Main process equipment
The main process equipment of the integrated pyrolysis process can be seen in Figure 1.
The equipment consists of feedstock pretreatment, reactor and the recovery system. They
are interlaced within the power plant’s boiler and automation system. Notice the ability to use
district heat to dry the feedstock. The process comprises of three closed cycles: the sand
cycle, feedstock-oil cycle and the gas cycle. They are explained in the next sections.
2.2.1 Pyrolysis feedstock and oil cycle
The pretreatment process consists of drying and crushing of feedstock. The feedstock is then
conveyed to the boiler room. The oxygen and air entering the system with the biomass is
replaced by inert gas in a lock hopper. The biomass, now in inert atmosphere, is then fed to
the bottom of the reactor, from where it’s fluidized upwards and thermally decomposed with
the aid of hot sand. The remaining solids are then separated by the preceding cyclones.
Then, the formed gases and vapors travel with the carrier gas to the recovery system, where
the pyrolysis vapors are condensed into pyrolysis liquid. The oil is quenched in a two-stage
recovery system. The vapor stream is first sprayed with droplets of pyrolysis oil from the roof
and sides of a carefully designed scrubber vessel. Most of the oil is quenched in the scrubber
vessel. After the scrubber, the oil and rest of the gases travel to the condenser, where they
are cooled and condensed in a shell and tube - type heat exchanger. Some of the cooled
pyrolysis oil is used as a scrubbing liquid. When the rest of the vapors condense they are
mixed with the product oil and pumped into containers.
2.2.2 Sand cycle
The sand is borrowed from the fluidized bed of the boiler and transported to the reactor by an
L-valve-type sand seal. The L-valve is an L-shaped pipe, where the sand is flowing down by
gravity. The sand is kept in a fluidized state by fluidizing inert gas in the ankle of the tube.
Sand flow to the reactor is adjusted by controlling the gas flow to the fluidizing nozzles, which
jolt the sand to the reactor. Consequently, the reactor temperature is adjusted. After the
reactor, the sand and most of the char is captured in the first cyclone. Fine particles are
captured in the second cyclone. The sand and solids then travel from the underflow of the
cyclones back to the boiler via another type of sand seal (loop seal). The loop seal is used in
order to maintain the process pressure level and inert conditions. More information on the
loop seal can be found in the experimental section. The sand is then fed to the boiler,
carrying residual heat and solid combustible matter from the thermochemical process.
14
2.2.3 Gas cycle
The circulating gas flows upwards from the reactor bottom where it is mixed with biomass
and boiler sand. The carrier gas then travels with the generated noncondensible gases,
vapors and aerosols through the reactor and cyclones. From there it continues to the
scrubber and condenser. As surplus noncondensible gases are formed in the reactor (10-30
% of the mass of biomass), the corresponding gas stream is directed to the boiler. This side
stream is removed from the carrier gas stream by a pressure regulated valve. The rest of the
gas stream is recirculated back to the process as carrier and fluidizing gas, making the gas
cycle closed.
3 PYROLYSIS OIL PROPERTIES, PROCESSING AND USE
3.1 Basic properties and applications
Biomass-derived fast pyrolysis oil is forest brown, runny liquid. It has a distinctive, tarry odor
which comes from aromatic compounds. Due to its peculiar odor, processed and distilled
pyrolysis oil is used in smoke flavorings (Red Arrow 2013). Since pyrolysis oil is a mix of over
200 different chemical components, all of its utilization potential might not yet even be
realized. It contains sugars, aromatic compounds, phenols, organic acids and other
potentially valuable chemicals. It has been tested for applications in glues (phenols), organic
acids (acetic acid) and as a feed for oil refineries. (Biocoup 2011.)
Fast pyrolysis oils can be characterized in many ways. The fuel can be analyzed by methods
developed at the Finnish technology research centre, VTT. VTT has released numerous
“cookbooks” to analyze bio-oils (e.g. Oasmaa & Peacocke 2001 and Oasmaa & Peacocke
2010).
The bio-oil has some fundamentally different properties when comparing to fossil heating
fuels. The lower heating value of bio-oil is 14-16 MJ/kg on an as received basis. The density
of pyrolysis oil makes it a good energy carrier. Since the density is 1150 - 1300 kg/m³, the
energy density can be almost as high as that of liquid natural gas (LNG). This is more than
five times as high as that of the feedstock, forest residue. See Table 1 for energy density
calculation.
15
Table 1. An example calculation on the energy densities of pyrolysis oil comparing to the feedstock and liquid natural gas. (Alakangas 2000, Gasum 2013)
Property Forest residue Pyrolysis oil LNG
Heating value, LHVar 7,5 MJ/kg 15 MJ/kg 49 MJ/kg
Density 0,425 kg/l 1,2 kg/l 0,42 kg/l
Energy density 3,2 MJ/l 18 MJ/l 20,7 MJ/l
Pyrolysis oil is acidic, so piping and end use equipment needs to be designed to meet the
specifications required. The pH value of pyrolysis oil is typically 2-3. It is however virtually
sulfur-free and when combusted its flue gases are non-corrosive. In end use, the flue gas
exit temperature can even be lowered when comparing to firing with heavy fuel oil, therefore
enhancing efficiency.
Pyrolysis is estimated to be the most economical technology to convert biomass
(Chiaramonti et al 2007, 1058), especially lignocellulosic residues, to liquids. Other
comparable routes for Biomass-to-liquids, BTL, would be gasification with Fischer Tropsch
synthesis or microbial fermentation. It has been shown in theory and practice that the
pyrolysis process is also energy - self sufficient with a conversion of 65% of the feedstock
energy to oil and the rest can be used to generate heat for drying and electricity required to
produce the oil (Venderbosch 2010).
The biomass fast pyrolysis chain doesn’t compete with food chain, unlike first generation
biofuels. Nowadays most of the research is done on lignocellulosic material. Several
residues, such as bark or forest residue can be used as a feedstock.
The oil also exhibits a peculiar effect called aging, which means changes in oil composition
due to polymerization reactions. Its viscosity increases when stored. The solids and acidity
combined are known to contribute to aging. Despite the aging reactions, over 10 years old oil
could still be combusted in an experiment done earlier (Kytö 2012).
3.2 Process yield
In chemical engineering, yield is a required measure to estimate mass balances. It is also a
criterion of evaluation for the completeness of the reaction and performance of the process.
There are two types of yield defined in pyrolysis normally. The mass yield is defined as the
ratio of weighed oil versus biomass fed. The organic yield is normally defined as waterless oil
against waterless feedstock.
16
The organic yield, dry oil against dry feedstock, corresponds better to the amount of energy
one can recover from the dry feedstock to the end product. It is generally lower than mass
yield. Since the feedstock is relatively dry and fine, the water content of the feedstock can be
measured with a heating lamp. The most reliable method for analyzing the water content of
the oil is Karl Fischer titration (Oasmaa & Peacocke 2001, Oasmaa 2013). The water content
can also be measured online with this method.
There is also discussion whether the organic, or mass yield should be defined on dry-ash-
free basis, at least if the feed contains lots of inert material, such as soil or stones.
Contamination with this kind of inert material can happen in a logistic terminal or a power
plant, where the feedstock is stored outside on soil or sand.
The yield is known to be related to properties of the feedstock, such as ash - and volatile
content (Chiaramonti et al 2007). It is theorized that the ash in biomass is responsible for
secondary cracking reactions in the gas phase, whereas the volatile content represents the
maximum amount of vapor one can theoretically obtain by heating in inert conditions.
3.3 Solid content
Pyrolysis oil contains more solids than heavy fuel oil. The solids are originating from the rapid
thermochemical conversion of solid biomass and transportation of the vapors formed (Scahill
et al 1996). Since char is a byproduct of fast pyrolysis and the particle size has to be small
for rapid conversion, the solids are inevitably present in all types of pyrolysis processes.
The pyrolysis oil displays a continuous water soluble phase and a discontinuous droplet
phase, which contains most of the particles present in oils. The solid particles are mostly
attached to the discontinuous oily phase. The solids can be observed in the oil by a regular
microscope (Figure 2).
The solid is derived from
1) The residual fixed carbon, char, left in pyrolysis reaction
2) The sand and solid particles used to transfer heat in the CFB reactor
3) From vapor phase reactions ( Hoekstra et al 2009)
4) From sedimentation of ash compounds (Moilanen 2012)
17
The mechanism to ash sedimentation can be due to changes in pH, water content or excess
ions in the circulating process. The ash compounds are crystalline in character, much
resembling calcium oxalate or calcium carbonate crystals. The origin of char and sand
particles is self-evident, but the origin of these crystalline particles is unclear. In the
experiments of Moilanen (2012) the crystalline particles contained calcium, on average 25%
of mass. The share of crystalline ash particles in the total solids is however estimated to be
very small (Oasmaa 2013).
Figure 2. The solid particles can be seen with a microscope of 50x magnification. NREL white oak pellet oil. (Javaid et al 2010)
Char and ash particles also contribute to aging (Butler et al 2011, 4181). Kang et al (2006)
theorize that the instability results from metal ions that catalyze condensation and
polymerization reactions.
Furthermore, char and ash particles increase the risk for plugging of filters and nozzles in
combustion applications. Nozzle pressures may also fluctuate in pyrolysis oil recovery
scrubber.
3.4 Ash content
The ash in pyrolysis oil is originating mostly from the ash of the feedstock. It can be reduced
by efficient solids separation, but the alkali metals are in gaseous state in product gas
temperatures and ultimately reside to the oil. The ash content of pyrolysis oil compared to its
energy content is significantly lower than the pyrolyzed feed since the ash enriches in the
18
char. Alkali metals (sodium, potassium) are more soluble than for example silica, iron and
calcium (Oasmaa 2013).
3.5 Water content
Bio-oil contains water originating from the feedstock moisture and dehydration reactions.
About 80 % of the bio-oil is water soluble. The rest of the oil (20%) consists of lignin derived
high molecular weight oily pyrolytic lignin and extractives (Oasmaa et al 2012). Fast pyrolysis
oils are a dispersion of these oily droplets in a continuous liquid phase/matrix. Bio-oils from
forest residue contain typically 25-30% water, which is challenging to separate by
mechanical means, such as centrifugation.
3.6 Reactions in oil during storage
Aging reactions can be classified and divided as condensation, polymerization and
dehydration reactions. Aging is related to bio-oils chemical instability that limits the storage
times and temperatures. In layman’s terms, when stored in warm conditions for a long time,
the bio-oil forms gums, water and long molecules.
Stability index is the measure of the relative viscosity change after thermal treatment of the
oil in 80 °C for 24 h. It is measured by accelerated aging test defined by Oasmaa &
Peacocke (2010). It is an approximation of relative viscosity increase in one year in room
temperature.
3.7 Pyrolysis oil combustion
Pyrolysis oil can be readily combusted in fire tube boilers (Lehto et al 2013). The combustion
equipment doesn’t drastically differ from heavy fuel oil combustion equipment. One of the
plants where combustion of bio-oil has been trialed is Fortum’s Masala heating plant. In
Masala, the oil is stored in a stainless steel container. A circulating oil system is utilized,
where part of the oil is lead to combustion and the rest is pumped back to top of the oil
surface in the container.
The oil flows through a heat exchanger and a pump to the combustion system. The nominal
capacity of the boiler (1,5 MW) after the retrofit could be maintained. The retrofit could also
be done with reasonable changes to the combustion and auxiliary systems. The flue gas
19
emissions were generally lower or comparable to heavy fuel combustion, except for
particulate matter emissions, which were higher.
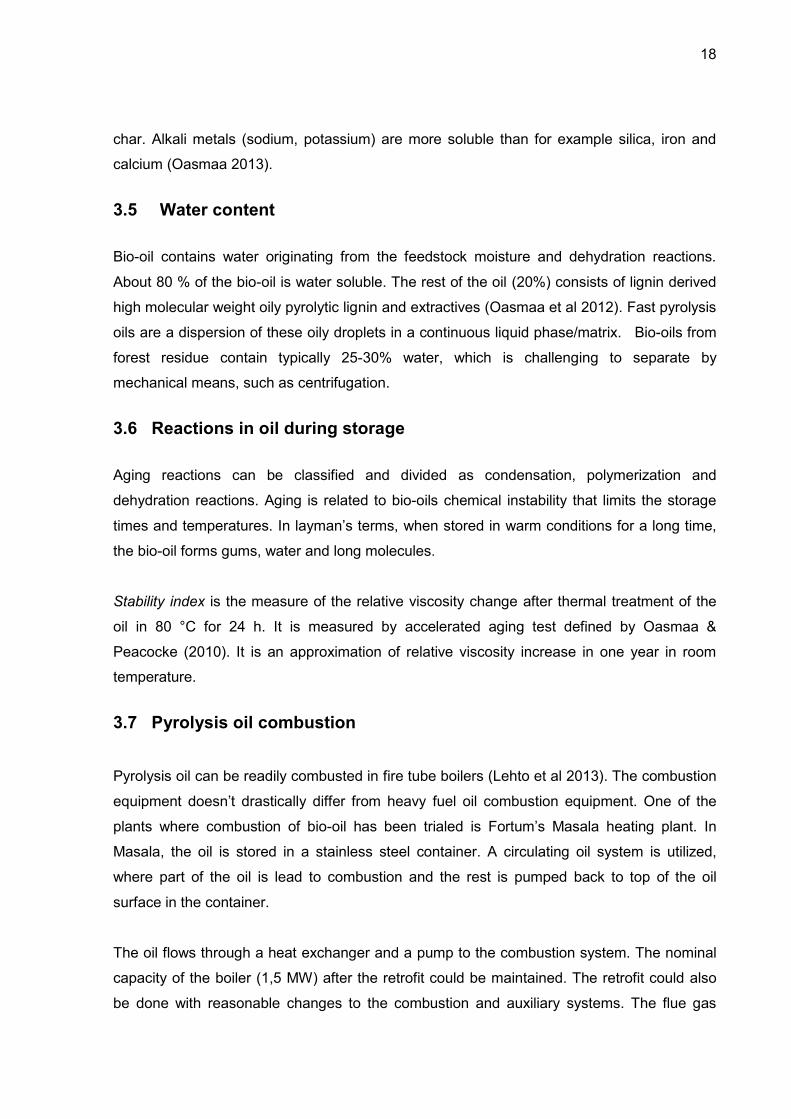
The oil in the combustion system is kept at atomizing temperatures and pressures (70-90 °C,
6 bars). The oil is mixed in the tip of the lance with compressed air to atomize it in the flame.
In figure 3, a pyrolysis oil combustion experiment is in progress. The oil burned with a hot,
red flame.
Figure 3. Pyrolysis oil flame.
20
4 PROPERTIES OF PYROLYSIS GAS
In this chapter, pyrolysis gas means the gas formed in pyrolysis reactor – both condensible
and noncondensible dry distillation gases and vapors of biomass. Pyrolysis gas is
challenging to examine in-situ, since it’s very short lived.
There have been though some vacuum reactor experiments involving extremely short vapor
residence times. It was shown that the initial biomass decomposition route will yield heavy
compounds and sugars. It is postulated that the vapors, composed mainly of sugars and
heavy compounds, undergo various thermal cracking paths after this. Extensive vapor
cracking can be seen as an increase in CO/CO2 ratio (Hoekstra 2012).
4.1 Basic properties and volume
The basic properties of pyrolysis gases, such as viscosity, density and heat capacity depend
mainly on the fluidizing gas involved. Since gas is typically circulated in CFB reactors, it
consists mainly of noncondensible gases and the properties of the gases can be evaluated
as a gas mixture accordingly. The volume of the condensible pyrolysis vapor is small
compared to the real volume of the fluidizing gas. Therefore the properties of pyrolysis gases
can be evaluated as a mixture of noncondensible gases to a reasonable extent of accuracy.
4.2 Density and molecular weight
If the average mole mass of pyrolysis gas is known, density can be calculated with the aid of
ideal gas law, formalization of density and average molecular mass of the pyrolysis gas
(equation 1).
(1)
The average molecular mass can be approximated by flowsheeting a composition for the
pyrolysis gas. Most of the pyrolysis gas is nitrogen or noncondensible gas (CO, CO2, CH4,
higher hydrocarbons etc.), on a volumetric basis. For more accurate estimations, model
compounds can be used to model the composition of the condensible part of the pyrolysis
gas. As nitrogen is used to inertize the feedstock, to supply sand in the reactor and to purge
pressure meters in this process, it is also a major compound in the gas.
21
4.3 Thermal cracking
It is widely known and reported in the pyrolysis literature that pyrolysis gases undergo
thermal cracking reactions in vapor phase (Bridgwater 2012, 80 ; Hoekstra et al 2009, 4745).
Dehydration reactions are different. Hoekstra states that the dehydration mechanisms are
largely unknown, but are formed by both condensation and cracking (Hoekstra et al 2009,
4752).
Secondary vapor cracking is enhanced by:
1) The presence of catalytic alkali metals, sodium and potassium being the most active
(Bridgwater 2012, 80) or the accumulation of minerals (Westerhof et al 2011)
2) Residence (reaction) time, that in a given process boils down to reactor and recovery
system geometry and hydrodynamics
3) Process severity such as temperature and time for gas in elevated temperatures
4) The presence of chars
Westerhof and others (2011) experimented with elevated residence times in a carefully
designed tube reactor. They noticed that the vapor phase reactions could be assumed
meaningless with low reaction severities. Low severity here means vapor phase temperature
of 400°C with a residence time of 14 s. The experimental study contradicted to the common
assumption that the vapors need to be rapidly quenched.
It was also observed that the pyrolysis vapor content of the carrier gas could be tripled
without deteriorations in oil organic yield, if the vapors were in mineral-free environment. Still,
the vapor phase reactions occurred within the tube even when there was no char or ash
present at temperatures of 500/500 °C ( reactor / vapor phase) .
4.4 Intraparticle reactions
The tar decomposition inside large biomass particles has been investigated by Pattanotai et
al (2012). They show that it is possible to shift the mass distribution from oil to char and
gases by increasing particle size of the pyrolyzing biomass particle. The authors call the
findings “intraparticle secondary reactions of tar”. This might be a beneficial property in
gasification, but usually regarded detrimental in pyrolysis.
22
This is also an important observation when modeling reaction kinetics. In pyrolysis
conditions, char permeability is of different order than other forces affecting pyrolysis vapor.
The resistance from the hollow char particle in practical particle sizes can be ignored in vapor
entrainment through the particle (Kokko 2012).
4.5 Condensation and coking
Coking is here defined as polymerization reactions forming irreversible mass of black gummy
or glass-like substance on the downstream of reactor. Coking is common on the downstream
of reactor, in the inlet of the recovery condensers. This happens since the vapors start to
cool down and form a condensed film, which traps some of the char particles like a fly paper.
4.6 Condensible compounds in pyrolysis gas
Compounds and bonds in pyrolysis gas can be analyzed using MBMS - Molecular beam
mass spectrometry. MBMS-technique was originally developed at NREL laboratories to study
prompt thermochemical phenomena. It can be used to study the variations in bonds and
compounds. The quantization of compounds is quite cumbersome; it requires careful
injection of liquid standard for each species of interest and good measurement of wet
volumetric flow. It is therefore seen as mainly a qualitative method to analyze pyrolysis
product gas composition. (Carpenter 2011.)
From results, it can be noticed that the diversity of compounds increases with decreasing
temperature. Earlier studies showed that when pine wood was pyrolyzed, the first
compounds to vaporize and show up in the gas phase were extractives. These are the
compounds from the sticky resin of wood, that in excess form a top phase in the pyrolysis oil.
The second peak was a part of the lignin – a compound found in cell walls that binds the
wood together. The majority of hemicelluloses and cellulose pyrolyze in a rather wide time
profile after these compounds, as can be seen from figure 4 (Evans & Milne 1987).
23
Figure 4. Evolution of batch pyrolysis products of pine as a function of time: Extractives (m/z 226), lignin (m/z 180 and 138), hemicelluloses (m/z 114 and part of m/s 43) and cellulose (m/z 43) (Evans & Milne 1987)
4.7 Size distribution of particles in pyrolysis gas
In a small scale pyrolysis experiment (Kang et al 2006), particles from different parts of the
biomass pyrolysis process were collected. The experimental setup consisted of a reactor, a
cyclone and a hot vapor impact filter. Their results show that the large particles were
separated in the cyclone with a unimodal size distribution. The particles separated by the
impact filter consisted of multiple peaks. The collected particle size depends on the feedstock
particle size. Most of the particles left in the oil were in the size range of 5-15 microns. The
following plots (figure 5) were analyzed from the solid material taken from the cyclone and
the impact filter. (Kang et al 2006.)
24
Figure 5. Particle size distributions of pyrolysis vapor. The upper chart is analyzed from particles collected from a
cyclone and the lower chart is from the particles collected from a hot vapor filter. (Kang et al 2006)
4.8 Secondary chars
There are indications that char is produced in the vapor itself. In one experiment some char
was found from a hot gas filter after a prefilter (Hoekstra et al 2009). The filters had a pore
size of 1 µm but the remaining particles after the filter were of 10 µm, shown in the SEM
images of the inert filters. Also some particles were inside the filter trains in a set of second
experiments, indicating that char particulates can be formed from particle-free vapors
25
(Hoekstra et al 2009). In literature, this is called charring or polymerization reactions.
Polymerization reactions are also accompanied with excess reaction water formation and an
increased level of water insoluble pyrolytic lignin in the resulting pyrolysis oil (Westerhof et al
2011).
Evans & Milne(1987) name the secondary char as soot and coke. They formalize the
reaction mechanism of oxygenates to light hydrocarbons, aromatics and oxygenates to
olefins, aromatics and noncondensible gases, where the formation of noncondensible gases
CO, H2,CO2 and H2O and soot/coke is seen as an irreversible process. Autoformation of
chars is analogous to the Boudoard reaction: the formation of elemental carbon C from CO2
and CO in a reducing atmosphere.
5 HOT VAPOR FILTRATION
There are multiple ways on reducing the solid content of the oil. The solid reduction can be
done in the process or after the process. In pyrolysis literature, hot vapor filtration has been
used to filter the pyrolysis product gas prior to condensation. Hot vapor filtration is more
effective than multiple cyclones in terms of separation efficiency, and widening the
application base of pyrolysis oil would require similar properties for the oil than those
obtained by hot vapor filtration.
Previous work in hot gas filtering has been conducted mainly in the mid-90's for utilization of
hot gas filtration in IGCC, PFBC and biomass gasification processes. Hot vapor filtration in
pyrolysis is limited to laboratory scale setups.
5.1 Barrier filters
In barrier filters, the particle separation is based on gas flowing through hollow, porous
medium. It is commonplace to use rigid surface made of ceramic material as the filter
medium. The main criterion to use ceramic materials is to withstand high operating
temperatures. In course of time, the particles form a so called cake on the surface of the
filter. Against common misconception, the filtration is manifested in the cake, not the filter
media. During normal operation, cake formation and growth is essential for successful
filtration of the smallest particles to occur. Filter cake grows as more particles from the gas
stream attach to the cake surface. Extra dust can even be added to the gas stream to
improve cake formation and sponginess. This mechanism could also be used to incorporate
catalysts into the gas stream.
26
A common setup for impact filtering is candle filter elements in a baghouse casing, such as
one seen in Figure 6. The filter cleaning is usually handled by applying inert blowback pulses
from a gas tank. The blow back pulses are used to halt unnecessary pressure loss.
Figure 6. Candle filter casing and the backpulsing system (Heidenreich et al 2013)
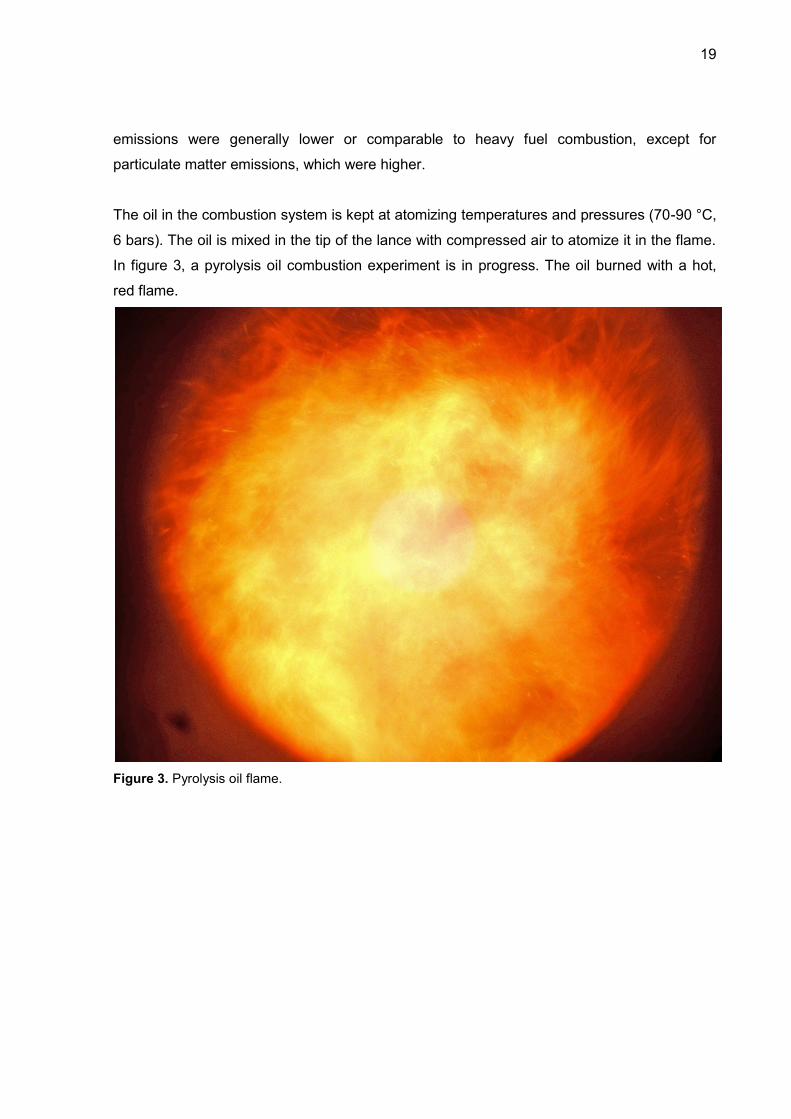
Tier-type filter casings (Figure 7) have also been used in the industry. In this type, the gas
flows downward and the outlet is in a middle channel flowing upward. It is ideal for
decreasing required floor space and increasing filter vessel utilization in large scale units
(Mitchell 1997.)
27
Figure 7. Tier filter design and related increase in vessel area utilization (Mitchell 1997)
5.2 Operating temperature
The operating temperature is crucial in pyrolysis hot vapor filtration (HVF). The upper limit is
set by thermal cracking and lower limit set by condensing of the vapors. This is where
pyrolysis differs from gasification of biomass or coal – in these processes the upper limit for
temperature is only limited by material temperature restrictions. For pyrolysis, the
temperature limits are generally in the range of 370-520 °C (Scahill et al 1996, Hoekstra et al
2009). If the gas composition is known, its dew point can be calculated (ECN 2012). The dew
point is also a function of the carrier gas content. In an early experiment done on pyrolysis
hot vapor filtration, the filter plugged after condensation of the pyrolysis vapors to the
surfaces when the gas temperature dropped below 300 °C (Scahill et al 1996).
The temperature can be quickly lowered by adding cooling nitrogen to the inlet of the filter.
The authors state that even with a mixing inlet control like this, the temperature inside the
baghouse can vary as much as 10-15 °C, the top zone being constantly hotter (Scahill et al
1996). As an example, the temperature contours from an IGCC hot gas filter model can be
seen from the next figure, fig 8. In this model, thermally insulated boundary condition for the
vessel wall was used.
28
Figure 8. Isotherms in simulated IGCC hot vapor filter, displaying gas inlet and one candle (Ahmadi
& Smith 2002)
5.3 Filter regeneration
Filters will eventually fill with particles, so adequate regeneration of filter surface and cake
removal is necessary. Filters are normally filled within hours, so constant regeneration is
necessary. Aside from regeneration, dust handling is also needed.
5.3.1 Nitrogen backpulsing
The most common and most utilized way to clean the filters is via nitrogen backpulsing. The
nitrogen can be pre-heated or sourced directly. Nitrogen backpulsing is usually done via a
setup consisting of fast valves and pressure containers, opening 6-7 bar(g) nitrogen pipe for
100 ms, sending a shockwave down the tube. Researchers at Karlsruhe institute of
Technology (KIT) suggest that the HVF must be operated at the same temperature as the
pyrolysis reactor and the nitrogen used for backpulsing must be preheated in order to avoid
condensation of the tar-laden vapors (Mai 2012). In addition, the pressure spike has to be
distributed evenly. In Figure 6, a configuration for pressure distributing venturi ejectors are
seen on top of the filter candles.
5.3.2 Controlled oxidation
Controlled oxidation was used in combination with nitrogen backpulsing at National
renewable energy laboratory of the United States, NREL for pyrolysis hot vapor filter
regeneration. This procedure was done by controlling the temperature near the filter candles
and letting oxygen into the system. The procedure took 6-9 hours since the temperature was
Gas inlet
Gas outlet
29
limited to 600 °C at the nearest thermocouple. Further investigation of this cleaning method
showed that it would lead to faster blinding rate of the filter. Filter blinding is the long term
fouling of the filter pores. The authors state “Although it is possible to oxidatively regenerate
the baghouse filter to recover the initial pressure drop, this technique also leaves residual
ash on the surface of the filter cloth fibers that appears to exacerbate the rate of filter
blinding. Given these observations and the known reactivity of biomass ash, oxidatively
removing char from any type of hot gas filter is not recommended.”(Scahill et al 1996)
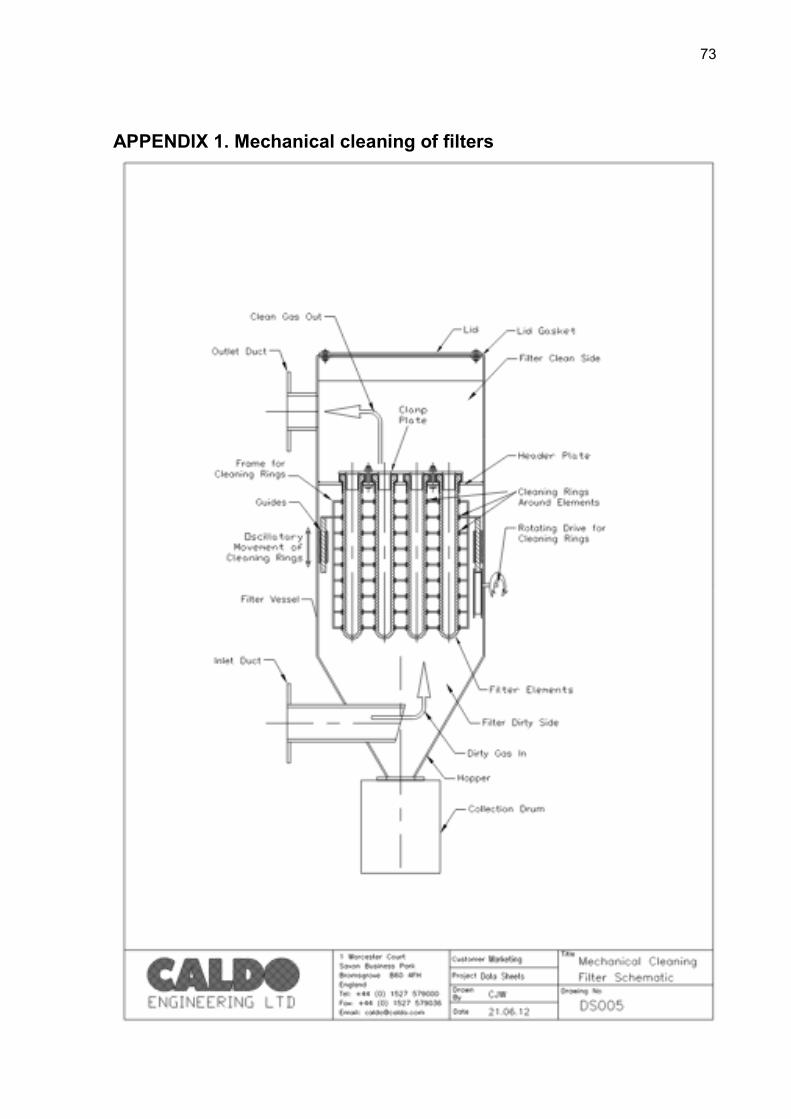
5.3.3 Mechanical rings
Certain types of mechanical rings are also used for filter cleaning in hot gas filters
manufactured by Caldo. The 1 meter long filter pack can be supplied with mechanical rings
that operate in a way that they scrape the accumulated solids away from the surface. The
mechanism consists of a frame with several rings attached to it and a mechanism that moves
up and down (Caldo 2012). There is no indication that these types of rings have ever been
tested in pyrolysis HVF. Detailed drawing of this type of cleaning mechanism can be seen in
appendix 1.
5.3.4 Dissolution
It is evident that most of the particles left in the filter surface are black char particles. Char is
composed mostly of charcoal, solid carbon, which is not soluble in known solvents. There are
however some indications from earlier research done on liquefaction of coal, that char could
be soluble in NaOH and some other solvents (Ouchi et al 1981). Coal is not however the
same as char and covalent C-C or C-O bonds are hard to break.
5.4 Dimensioning considerations
The dimensioning basis for hot gas filters is filter face velocity. The physical size of the hot
vapor filter is dictated by required casing dimensions and selected filter face velocity. Face -
or filtration velocity is determined as the velocity perpendicular to the filter surface area.
Earlier, maximum values of 5,6 cm/s have been used in IEA hot gas filter project (1997).
Different face velocities are listed in Table 2. The filter pressure drop is also a function of the
dust properties. In general: as gas volumetric flow increases, the size and dimensions of
filters increase. As the design face velocity increases, the filter approaches the condition of
being clogged, since the force driving the small particles through the filter increases. High
face velocity can stick particles to filter pores and also cause slipping of particles past the
filter. The face velocities for pyrolysis hot vapor filtration were reported in two papers.
30
Another thing to consider is serviceability: how to replace the tubes when maintenance is
needed. The space between filters should be selected so that the candles can be easily
replaced. Another limiting factor in minimizing the casing volume might be arching between
clogged candles. The candles are supplied in various heights: from 1000 mm to 2500 mm.
(Mitchell 1997.)
Table 2. Face velocities in different processes utilizing hot gas filtration.
Authors Type Face velocity
Burnard et al 1993 PFBC, Grimethorpe 1 - 7 cm/s
Sitzmann 2006 Pyrolysis bench scale 2 - 3,5 cm/s
Mai et al 2007 Pyrolysis bench scale 2 cm/s
5.5 Pyrolysis hot vapor filtration experiments
Hot vapor filtration midst of pyrolysis process is a rather new concept; the first reported
experiments were done in 1994 in the United States at NREL by Scahill and others. The
filtering of pyrolysis vapors is in principle the same as filtering of gasification vapors but the
gases contain higher amounts of condensible compounds. In here they are called
condensible pyrolysis vapors but in gasification they are called tars.
5.5.1 University of Twente
Different materials can be used as a filtering media. Hoekstra et al (2009) used filter made of
fibrous glass by Schlecher & Schuell as an external filter in a BFB pyrolysis reactor setup.
The filter had four consecutive glass fiber filter discs. It was noticed that it is possible for
particles to spontaneously form from the char-free vapor, after the first filter discs. A small
amount of char was found inside the filter set that wasn’t likely to have been blown through
the preceding 1µm filters. The size of the char particles was above 10 µm on the back of the
first filters, seen in the figure (9) below. This shows high intrinsic reactivity of pyrolysis
vapors. (Hoekstra et al. 2009.)
31
Figure 9. SEM photos of the filters, front view on the upper row and back view on the lower row. Notice the small round char particles, even in the fourth glass filter (Hoekstra et al. 2009)
In another experiment setup, hot vapor filter consisted of one filter inside the fluidized bed
reactor and a secondary filter at the reactor outlet. The idea behind the hot gas filter in the
bubbling fluidized bed is that the sand continually flushes the filter surface from particles and
deposit formation is prevented.
A parallel recovery train included a knock-out vessel and two cyclones as solid separation
system (figure 10). This type of equipment can be used to evaluate the differences of oils
produced by hot vapor filtration and cyclone separation. (Hoekstra et al. 2009.)
32
Figure 10. Schematic of experimental setup featuring two separate recovery trains: one with hot vapor
filtration on top right and one with cyclone separation below it (Hoekstra et al. 2009.)
The oils from these experiments bear similarities in all the major properties typically used to
characterize pyrolysis oils, except solid- alkali- and ash content. The advantage for this kind
of setup was that the residence time could be lowered when comparing to cyclone train: the
residence time of vapors, τ was 0,8 s against 2,5 s for cyclones. Solid content was low in
both of the runs. With cyclone train, solids were 0,07 to 1% and with hot vapor filters the
solids were below detection limit, 0,0001 %.
33
From alkali metal analyses it was apparent that only potassium was entrained in to the
filtered oil in considerable quantities. Reason for this can be that potassium exists as vapor in
reactor and product gas temperatures, due to low vapor pressure of potassium compounds.
This was verified with thermodynamic calculations, indicating that the majority of salts are in
solid state in selected temperatures. However, potassium chlorides and small amount of
sodium chloride may be present in vapor phase in pyrolysis conditions. (Hoekstra et al 2009.)
5.5.2 Mahasarakham University
Pattaya & Suttibak (2012 a & b) used a glass-wool fixed bed hot vapor filter with a double-
cyclone pre-separation. The filter consists of loosely packed glass wool in a container. The
experiments were done in 1 hour running cycles. The feedstock was cassava residue and
paddy residues. It was observed that the yield of oil decreased by 6-7% on dry weight basis,
while the yield of gas increased. The authors attribute this to secondary cracking of pyrolysis
vapors and longer residence time when comparing to cyclone separation. The resulting oil
had a LHV of 20,6MJ/kg, while the unfiltered oil had a LHV of 23,3 MJ/kg.
The stability index, defined earlier, improved from 27,3 to 1,8. This phenomenon is caused
by a significant decrease in polymerization reactions in the oil, which are catalyzed by char
particles. As anticipated, the solid content decreased substantially from 3,9 w-% to 0,8 w-%.
Solids were defined as ethanol insolubles in a 3 µm filter paper, dried at 105 °C. At the same
time the ash content decreased by more than 20-fold. It was 0,3 w-% with cyclones and
0,003 w-% to 0,01 w-% with the hot vapor filter.
5.5.3 Shanghai Jiao Tong University
Chen et al (2011) used a ceramic candle hot vapor filter. The results were in line with Pattaya
& Suttibak (2012 a&b). They had a setup with a possibility to recover two streams of oil: bio-
oil and watery oil.
The authors summarize the findings as follows : “It was found that the total bio-oil yield
decreased and that the bio-oil has a higher water content, higher pH value, and lower alkali
metal content when a HVF is used in the system. Analysis of the bio-oil with GC–MS showed
that the molecular weight of the chemical compounds decreased after HVF. The content of
C2–C4’s gases from gas products was decreased after HVF. The bio-char has many
chemical bonds and its alkali metal content is higher compared to the bio-oils.” (Chen et al
2011, 6184).
34
5.5.4 University of Seoul
Kang et al. (2006) ran a pyrolysis reactor equipped with a hot vapor filter. They evaluated the
influence of feedstock particle size and reaction temperature to the production of bio-oil and
the collection efficiency of the hot gas filter. The fluidizing bed material had a mean diameter
of 0,4 mm. Cyclone was used as a pre-separation step, designed to remove particles larger
than 10 µm. The hot filter consisted of three cylindrical ceramic filters in a stainless container.
It was expected to capture fine particles of as small as 1 µm in size. The char separating
equipment was kept at a temperature of 400 °C.
It was found that low reaction temperature and small particle size had a positive influence on
the product yield. Most of the particles left in the oil concentrated in the range of 5- 15 µm.
The cyclone collected particles of around 10-450 µm and hot gas filter PSD concentrated
near 10 µm. Radiata pine sawdust of 1-2mm and less than 1mm was used as feedstock.
5.5.5 UOP & NREL
Different materials were tested by a research and industrial consortium of UOP, NREL
(National Renewable Energy Laboratory) & PALL. Pall Dia-Schumalith (Al2O3/SiC ceramic)
was one of the materials tested (depicted in figure 11). Other filter materials were sintered
powder metal 310 SS and fibermetal HR160 Hastealloy. (Brandvold 2011.)
Filtering with the porous sintered stainless steel increased the iron content of the resulting
bio-oil, indicating that this was not suitable material for the application. The authors claim that
the periodic blowback was effective in maintaining the filter element pressure drop within
acceptable limits and filter plugging was never experienced (Baldwin 2012).
35
Figure 11. Hot vapor filter candles before and after experiment of 1700 regeneration cycles. (Brandvold 2011)
Filter was run 29 hours at NREL entrained flow reactor. The filter and casing were specially
furnished for the purpose. The vessel was surrounded by heating elements. The filter system
operated on a slip stream, in order to compare the cases with and without filter more easily.
Best availability and oil quality was obtained with Dia-Schumalith™ filter candles. (Baldwin
2012.)
5.5.6 Aston University
Sitzmann(2006) experimented with hot gas filters in Aston University. The 1kg/h pyrolysis
setup operated with inclusion or exclusion of pre-separation with cyclone. Different candle
and coating materials were evaluated. The quality of oil was improved by same means as
other tests. The author attributes decreasing of yield to cracking of high molecular weight
lignin derivatives in the cake surface by the help of mineral-laden char.
The pressure drop across the filter was increased during the test run. The surface of the
candles was “patchy” after the tests, displaying craters of various depths. Authors suggest
further investigations on the filter cake to improve detachability.
36
Authors also report face velocities. The filter was run with two different face velocities,
resulting in different particle size distribution on the surface of the filter cake (figure 12). At
low face velocities (2cm/s) the larger particles are separated by gravity, therefore creating a
more dense cake with higher resistance to flow. At high face velocities (3,5 cm/s) the filter
cake also contained the large particles creating a more porous cake with less specific
resistance to flow.
Figure 12. SEM picture of the cake produced at two face velocities: 2,0 cm/s and 3,5 cm/s, respectively (Sitzmann 2008)
5.5.7 NREL first experiments
A hot gas filter was used downstream of fast pyrolysis vortex reactor. A conventional
baghouse filter with ceramic cloth filter bags was employed for this purpose (Scahill et al
1996). Controlled oxidation was used to clean the filters, since the char formed sticky
precipitates on the surface of the cloth that was hard to remove. Some secondary vapor
cracking is attributed to the ash left in the filters. It is commented that it is commonplace for
the hot vapor filter to form this kind of sticky precipitate when the particle size distribution is
driven towards the low range.
The residence time in the baghouse filter was 5-6 seconds. A noticeable increase (36% to
49% dry w-basis) in organic liquid yield was obtained, when the filter temperature was
reduced from 410-450 °C to 370-390 °C. The temperature was controlled with chilled carrier
gas added to the inlet stream.(Scahill et al 1996.)
37
5.6 Summary of HVF literature
As a summary for pyrolysis hot vapor filtration literature study, different assumptions were
tested from the literature. Some of them were mentioned widely in literature. These
assumptions relate to the pros and cons of pyrolysis hot vapor filtration and its effect on
pyrolysis oil quality. They were as follows:
Plus
1. Less solids
2. Less ash
3. Lower viscosity
4. More stable, less aging
5. <0,01 ash
Minus
1. Decreased LHVar
2. Higher water content
3. Lower yield
The results are in the following table(3). Study proceeded as looking at the measured results
in experiments and checking whether the results of the authors supported assumptions.(x =
supported, - contradicted, empty = no info)
Table 3. Hot vapor filtration effect on bio-oil properties and yield
Author & Article Less solids
Less ash
More stability
Lower viscosity
<0.01 ash
Decreased LHVar
Higher water-%
Less yield
Pattaya & Suttibak 2012a x x x x x x x x
Pattiya & Suttibak 2012b x x x x x x x x
Chen et al 2011
-
- - x
Kang et al 2006
x Suttibak et al 2012
x
Hoekstra et al 2009 x x - x x
- x
Sitzmann 2008 x
x x
- x
Sitzmann 2007 x
x x
x
Lee et al 2005 x x
- Jung et al 2008 x x
Park et al 2008 x x
x Abglevor & Besler 1996 x x
x
Baldwin 2012 x x x
x
38
It was apparent that hot gas filtration produced pyrolysis oils with lower solids and low ash
content. It was however not clear whether HVF had detrimental effect on heating value or
water content. Comparison was hard since the operating parameters of the recovery
condenser(s) also affect the result.
The yields (organic and/or mass) were somewhat lower than without impact filters. This is
usually attributed to higher residence time and intimate contact in filter with catalyzing char
and ash. Lower viscosity was supported in all but one study, and stability was improved in all
but one experiment. Lower viscosity and better stability can be caused by the cracking of
lignin derivates or removal of the catalyzing fines in the oil.
In most of the experiments, a very good oil with negligible amount of ash was produced. Ash
content of 0,01 w-% corresponds to dust emission values of less than 25 mg/m³n (reduced to
3% O2) when calculating the concentration from combustion calculations and flue gas mass
balances. (Innanen 2011, Sahimaa 2012.)
6 PYROLYSIS LIQUID FILTRATION
Liquid filtration has been used for example in water treatment, bunker oil combustion
equipment and various chemical industries. Liquids can be filtered with either deep filters,
requiring replacement of the used filter, or surface filters, which require some kind of
regeneration maneuver. Liquid filter media can be manufactured from different kinds of
fabrics, meshes or steel plates. Various combinations have been deployed in pyrolysis oil
filtration experiments.
Centrifugation is also a method for solid-liquid separation. It is basically accelerated settling
of the liquid in a rotating chamber. Centrifugation has been experimented for different types
of pyrolysis liquids. (Källi 2012.)
6.1 Filtration in the liquid cycle
Good experience is available from VTT’s Process development unit’s (PDU) oil cycle using
500 micron rotary filter. The filter has two drum filters in parallel. If there is a blockage on
either of the filters, the lever can be turned to direct the flow to the other filter drum (Källi
2012.) The filter is depicted below (fig 13), along with streamlines of the oil. This type of filter
is good for catching the largest particles, if a process disturbance occurs.
39
Figure 13. Airpel rotary filter (Källi 2012)
6.2 Filtration with centrifugation
A centrifuge is routinely used in ships as a separation device for solids out of bunker oil. In
an experiment done at VTT, bio-oil was filtered in different temperatures and different
percentages of addition of IPA (isopropylalcohol). Filtration was successful. The mass loss
was 2,2 - 2,9% and separation efficiency ranged from 65-90%. Centrifugation was also tried
on-line from the liquid. It succeeded with lower separation efficiencies, since there was
probably some classifying of the phase-separated oil in the scrubber and only the bottom
phase (lower in solids) ended up in the centrifuge. The filtration result was better when
filtering fresh pyrolysis liquid, comparing to stored oil. Warming of the liquid is challenging
and necessary for successful filtration. Direct heating with electrical coils can’t be used due
to chemical instability of the oil. (Källi 2012.)
40
7 CYCLONES
Cyclones are dynamic separators used in various industrial applications. The first cyclone
theories that gained wide acceptance, were uncovered by Lapple in 1950. However,
cyclones have been used in numerous places for at least a century. The cyclonic separators
can be used to recover valuable materials in food- and farm industries or to segregate
harmful substances from effluent streams, such as ash in flue gas dedusting. The cyclones in
pyrolysis represent current technology to reduce the solids to a desired level. Cyclones have
been researched to great extent in the petroleum, chemical, power and mineral industries.
Thorough reviews have been made by many authors of this relatively simple and robust
equipment. Various patents have been claimed for auxiliary additions to cyclones such as
properly proportioned cyclone designs with tangential inlet still exhibit the highest
efficiencies.
To complicate things a bit, there is no single definite optimum design when one considers
separation efficiency, space requirement, cost, serviceability, pressure drop and performance
as a whole. Cyclone design for a determined application is governed by certain degrees of
freedom and the use of empirical correlations is common. The information needed for a
cyclone design is typically: gas viscosities, gas densities, particle size distribution of the feed
material, space available in plant layout, particle densities and maximum allowable pressure
drop.
7.1 Operating principle and parts of the cyclone
There is an established system for naming cyclone parts in the literature, which is used by
Hoffman & Stein(2007), Zenz (1989) and various other authors. Cyclone consists of an inlet
duct, a barrel, a cone and a vortex finder, as seen in Figure 14. The gas is typically fed
tangentially at the upper part of the barrel and exits through the vortex finder. The particles in
the gas move axially downward and radially either towards the wall or inward towards the
center. Separation in cyclones is a game of two opposing forces: the drag force of viscous
gas and centrifugal force due to spinning. The dusty particles are collected on the inner
surface of the cyclone and attracted towards the apex by gravity. The gas, on the other hand,
tends to resist this movement. It has been noticed experimentally that the dust agglomerates
and flows towards the tip of the cone, spiraling downwards in strands like “a pearl necklace”
(Karvinen & Kauramäki 1986, Jussila 1983.)
41
Figure 14. Cyclone parts
7.1.1 Inlet duct configuration
The inlet should be rectangular duct since the maximum possible amount of the particles are
then already near the wall of the cyclone. If the inlet duct is not perpendicular to the wall, its
function will be far from optimal. If the inlet is circular, it is tangent to the barrel at only one
point. Volute and axial configurations have been experimentally found to be less efficient
than the tangential duct inlet, in comparable conditions. (Zenz 1989.)
7.1.2 Outlet/vortex finder configurations
The vortex finder can either be a straight tube or a cone. The diameter of the vortex finder is
based on design rules. Classical concepts employ vortex finder sizes that are in proportion to
inlet and barrel dimensions. In hydrocyclones, a cone shaped vortex finder is preferred and
numerous lip configurations for vortex finders exist. According to Jussila (1983), the pressure
drop is smaller in conical vortex finders.
The height of the vortex finder down from the roof of the cyclone should exceed the height of
the inlet duct, since otherwise the particles won’t have the initial axial velocity required for
42
agglomeration as they pass the suction of the vortex finder. If the vortex finder penetrates too
deep in the cyclone, it will however reduce the maximum allowable limit for effective cyclone
height, increase material costs and height requirements. (Zenz 1989.)
7.2 Vortex length
Vortex is the conical swirling gas stream inside the cyclone. From research done on small
cyclones, Alexander (1945) deduced the following equation (2) for vortex length:
(2)
Where
Lv length of vortex [m]
Dvf diameter of vortex finder [m]
Db diameter of barrel [m]
Ai area of inlet [m2]
The equation is in well agreement with the empirical data obtained from various
investigations. The ratio of outlet to inlet area is related to this measure. It can be said that
the higher the ratio, the higher the vortex. If there is erosion at the apex of the cyclone, then
the vortex is hitting the cone of the cyclone, and the (calculated) vortex then exceeds the
length of the barrel. In practice this means that by decreasing vortex finder diameter, one can
decrease vortex length if it’s hitting the apex of the cone (Zenz 1989). Hoffman & Stein take a
slightly different position. They state that the vortex is beneficial for preventing dust
accumulation. The cyclones where the vortex ends in separation space (barrel) are more
prone to clogging and fouling since the vortex isn’t there to sweep the surface of the cone.
Although they state that in high abrasive particles the wear can be so severe that walls of the
cone will completely fail (Hoffman & Stein 2007, 200).
7.3 Pressure drop
The pressure drop in cyclones is proportional to the square of the volumetric flow rate, as it is
in all processing equipment operating in a turbulent flow regime. A stringent laboratory
definition uses the mean axial velocity inside the cyclone, but it is more common to use mean
velocity in the vortex finder or inlet of the cyclone in engineering practice (Hoffman & Stein
2007). The pressure drop can be derived from the Bernoulli equation, assuming
hydrodynamic heights negligible. Common form is to report in dimensionless form known as
the “Euler number” (equation 3).
43
(3)
It is known that the pressure drop in a given cyclone is interrelated to the separation
efficiency: the higher the pressure drop, the higher the separation efficiency. In theoretical
means this can be expressed as the relation of Euler and Stokes number, plotted in Figure
15.
Figure 15. Relation of Euler and Stokes number (Hoffman & Stein 2007)
In practical sense this means that when more pressure drop is allowed, more separation
efficiency can be achieved. Then again more pressure drop means more fan or compressor
power consumption.
7.4 Separation efficiency
Separation efficiency of the cyclone can be defined as the ratio of collected mass to fed
mass or by using emitted and feed concentration as in equation 4 (Hoffman & Stein 2007,
51). The concentrations can be replaced with mass flows since the flow rate is roughly
equivalent at the inlet and outlet.
44
(4)
Here the peculiarities of the pyrolysis process come into the picture. Following equation (5) is
suggested for convenient, quick calculations for the efficiency. The emitted mass flow is
calculated as a product of the solid content and production rate. The feed mass flow is
calculated using the feeding rate, an estimate for char yield and sand-to-feedstock-ratio(xs/f)
obtained from the overall reactor energy balance.
(5)
Where
cf feed concentration [kgm-3]
ce emitted, outlet concentration [kgm-3]
emitted (outlet) particle mass flow [kgs-1]
feed (inlet) particle mass flow [kgs-1]
mass flow of the feedstock [kgs-1]
mass flow of the product oil [kgs-1]
Qv,out volumetric flow of gas at outlet of the cyclone [m3s-1]
Qv,in volumetric flow of gas at inlet of the cyclone [m3s-1]
xs/f sand-to-feed ratio [-]
xchar char yield [-]
xsolids solid content of the oil [-]
xyield mass yield of the product oil [-]
This is valid if we assume no deposition of solids in the product gas channel, oil circulation
system, reactor coarse removal system and so forth. By removing the xs/f from the
denominator, we can calculate the efficiency for char only. For this definition, one underlying
assumption is also that no solid formation happens after the cyclone, i.e. secondary char
formation in the product gas channel is minimal.
7.5 Cut-size diameter
The cut size diameter is normally defined as the particle size with a collection efficiency of
50%. All particles below this diameter are separated with lower efficiencies and all particles
above this size are separated with higher efficiencies (Karvinen & Kauramäki 1986, Dewil et
al. 2008). It can be also seen as the probability for separating a particle of a given size.
45
The following classic estimators for cut size by Lapple (equation 6 & 7) and Barth (equation
8) assume that particles are falling in laminar or Stokes law flow and are derived accordingly.
Lapple
(6)
(7)
Barth
(8)
In Lapple’s classic definition for cut-size, the number of rounds the particle travels (N) is
calculated separately. For meaning of other symbols, please refer to symbols and
abbreviations.
7.6 Solids loading
In principle, a high solid loading is known to improve the separation efficiency of the cyclone
in question. The pressure drop also decreases (Hoffman & Stein 2007, Zenz 1984) Mothes
and Löffler attribute the effect to particle agglomeration. They propose a model based on
calculating 1) the impaction probability and 2) sticking probability. They found that the
product of the two probabilities is at maximum for particles of 2 µm if the large particle is 15
µm. Empirical relations have also been proposed. Smolik proposes the following empirical
equation (9) for the effect of solids loading on the separation efficiency:
(9)
Where c1 and c2 denote two different solids loading expressed in any concentration unit.
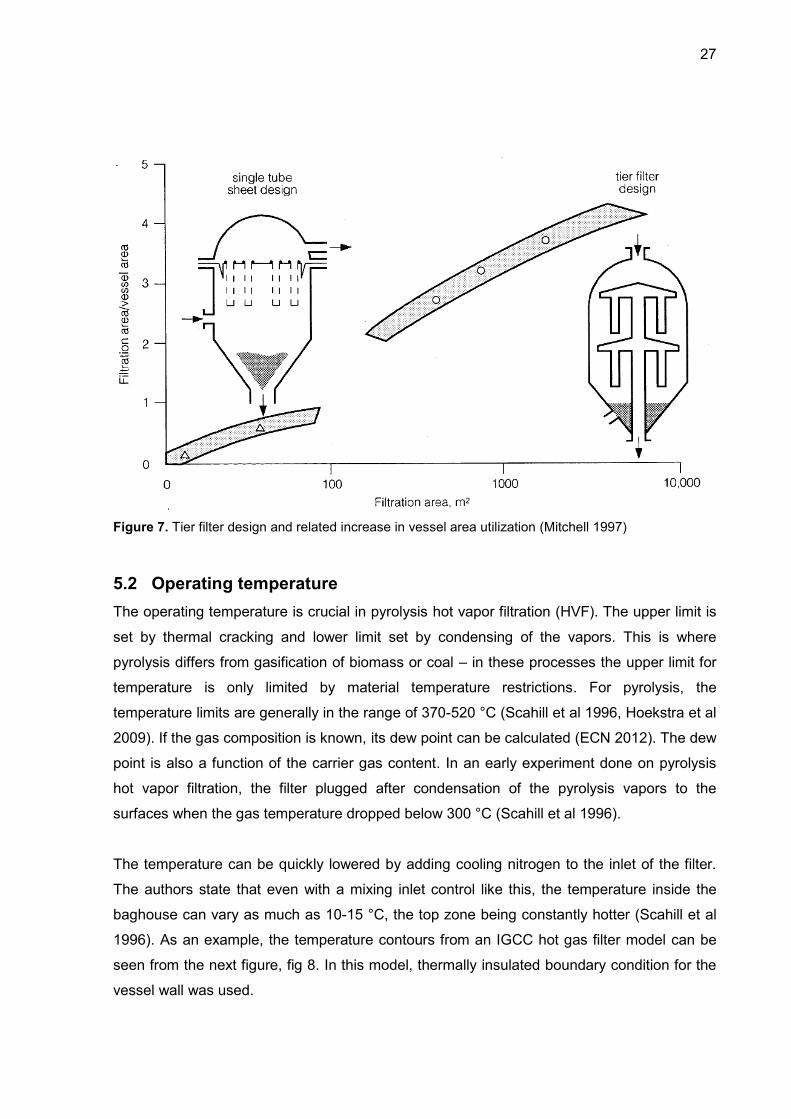
Zenz presents a graph (figure 16) for estimating the solid loading effect on the separation
efficiency, put together by years of accumulated empirical experience.
46
Figure 16. The effect of solids loading on the fractional efficiency. The dots are measured values and the curves by the authors, accordingly. (Hoffman & Stein 2007, p 207)
Jussila (1983) noticed a clear, dust-free inner vortex at the end of the vortex finder. The
diameter of the clear inner vortex was dependant on the dust loading: it ranged from 15-25
mm in the small cyclone used in the experiments.
7.7 Dust properties: Uniformness of feedstock
Increasing the uniformness of the feedstock particle distribution is also a way of reducing
pyrolysis oil solid content. In engineering practice, the fine particles could be separated in a
set of specialized grinders and sieves. In design, the narrower the particle size distribution,
the easier it is to predict the needed thermal flux and the reactor size needed to fully pyrolyze
the feedstock. The less there is fine matter, the less there will be small particles to separate
in the cyclones. Also the sand particle size distribution may play a role (Oasmaa et al 2003).
7.8 Dimensional analysis: Buckingham π-Theorem
Dimensional analysis can be used to mentally visualize a given flow problem. It is a structure
arising from dimensions of the problem. In this particular case, it can be used to find suitable
scaling laws to scale the flow conditions from hot cyclone to cold model. Buckingham pi-
theorem is used as a tool and language to do this. Buckingham pi-theorem is mathematically
rigor method for walking through dimensional analysis. It is described in detail in White
(1991), for instance.
47
7.8.1 Selection of dimensions
The dimensional analysis was started by collecting the variables in cyclone dimensioning
equations and cyclone scaling laws. Some indications were found from dimensionless
numbers to be used in scaling. Froude number, Reynolds number and Archimedes number
were mentioned. The main difference mentioned between hot and cold fluid is the difference
in viscosity. As the gas has more drag in higher temperatures, the collection efficiency is
reduced when other variables are held constant. (Chen & Shi 2003)
Other properties affecting cyclone operation and design are: particle size distribution, particle
density, cyclone diameter and inlet velocity. As characteristic dimension we use the barrel
diameter and as characteristic velocity the velocity at inlet (Table 4). Other lengths are scaled
accordingly.
Table 4. Selected dimensions for dimensional analysis
Symbol Meaning SI-dimension MLTθ-dimension
ρp Particle density kg/m3 ML-3
µg Gas viscosity kg/ms ML-1T-1
Dp Particle diameter m L
ρg Gas density kg/m3 ML-3
D Diameter of cyclone m L
wi Velocity at inlet m/s LT-1
7.8.2 Dimensionless groups
Since L is in all of the groups, and none of the groups contain θ, we can estimate that
number of π-groups is less than, or equal to 3 (White 1991). We now pick three variables in
the system and form the dimensionless groups. We pick these variables so that they are
linearly independent.
Similarly for π2 and π3, continuing with the next variable on the list.
48
As stated in the pi-theorem, we can make any multiplication of these so formed pi groups.
This is the Reynolds number. By combining all the pi-groups, we obtain
Since the gas density is of different order than the particle density (ρg < 0,01ρp) we can make
the following substitution
(10)
This is the Stokes number. In pi-theorem the obtained result is so called similarity condition.
Same kinds of results have been stated in the literature (Karvinen & Kauramäki 1986, Dewil
et al 2008). There are also indications in literature that cyclones can be compared for their
similarity by the Stokes number in a wide range of operation also experimentally (Hoffman &
Stein 2007). This is a classical approach to dimensioning effects of cyclones. This approach
doesn’t take into account the effect of solids loading.
49
7.8.3 Scaling from hot to cold model
For similarity condition the Stokes numbers of the cyclones have to be the same
(11)
We can then substitute the particle and gas properties, diameter and flow in the real
industrial process into the right side of (11). Then ambient and room temperature gas
properties and required diameter in the cold model are substituted in the right side of the
equation. According to our analysis, the left side of the equation (product of velocity, particle
density and square of particle diameter) should then match the right side of the equation for
the cold and hot cyclone to be similar. This result can be used to either shift the obtained
grade efficiency curves or to select appropriate conditions and materials to obtain similarity.
50
8 PILOT PLANT TEST RUNS
Figure 17. Part of the pyrolysis pilot plant. The fuel feeder is on the foreground, leading to the lockhopper. On the right side of the lockhopper, the gas duct from the scrubber to the condenser is seen and below it is the condenser. Next to the condenser, the product oil container is seen. The large vessel on the right is the bag house filter of the boiler.
51
8.1 Process overview
The pyrolysis pilot plant, situated in Tampere Finland, is used to study the overall
functionality of the integrated process. It is integrated in to a pilot scale boiler, which can be
modified to operate in either CFB- or BFB-mode. Just like in an authentic CHP-plant, the
boiler is connected to the district heating grid. Simplified flow diagram can be found below
(Figure 18). The boiler is on the left side (CFB-Pilot), attached to the pyrolysis reactor shown
in green.
Figure 18. Schematic flow diagram of the pilot plant’s integrated pyrolysis process.
The nominal capacity of the pyrolysis system is 2 MW fuel. With this capacity, over 7 tons of
bio-oil can be produced a day. The fuel is conveyed via the lock hopper and feed screws to
the pyrolysis reactor. In the reactor, the fuel is mixed with hot sand from the boiler, and
pyrolyzed into vapors. The vapors then travel through two cyclones into the recovery system,
from where the bio-oil is collected into the product oil container. The noncondensible gas is
circulated as an inert fluidization gas. It is compressed in the gas circulation unit. After the
reactor, the sand is returned to the boiler along with the char via a loop seal (seen in Figure
19).
52
8.2 Test runs
At first, a test plan was made. Different reactor, feed, and recovery system parameter
combinations, test points, were chosen for validation. Order of the test points was also
planned. One of the main objectives was to test the functionality of the added second
cyclone and its effect on the solid content. Yield was also calculated at different test points.
The process was first ramped up in a hot test to ensure everything worked as planned. The
test runs then lasted for a week and were operated night and day in three shifts. Samples
from the oil were taken on a regular basis. Samples were also taken from various locations
from the running boiler and pyrolysis equipment.
The distributed control system (DCS) records all the data from the process monitors and
controls. Useful data such as pressure and temperature levels were gathered and then
analyzed after the experiment. DCS was also used for monitoring and troubleshooting during
the test runs.
Some method development and principles are provided in the following sections. The results
in this chapter are not disclosed in quantitative form due to the ongoing nature of the
research. The results are given in a separate internal document.
8.3 Starting
The starting sequence of the pyrolysis system in a nutshell is as follows: The boiler is first
started and sand heated. The oil cycle pumps are then switched on to be able to recover the
oil. The gas circulation is then switched on in order to fluidize the reactor. The hot sand can
then be let to the reactor from the L-valve. And finally, biomass can be fed to pyrolyze in the
hot sand.
8.4 Yield
The mass yield, explained earlier on p. 15, can be calculated from several types of data: The
pyrolysis oil weigh is obtained by weighing the containers filled with pyrolysis oil or by
calculating from the level indicator of the product oil container and multiplying with the
density of the oil. A reasonable estimate for the amount of feedstock can be estimated by
calibrating the feed screw feeders beforehand and then setting the corresponding value for
each screw rotation input.
53
The biomass fed is weighed batchwise in the lockhopper, used to inertize the feed. The
biomass enters the pyrolysis process in 50 kg batches, and the lockhopper is tared each time
the biomass is weighed. A reliable estimate for the fed biomass is therefore possible by
summing the weight of the batches during a given period of time. For organic yield, the water
content is measured online and manually using Karl Fischer titration.
Some process conditions are known to influence the yield. The most common reactor
parameter reported in literature is the temperature. The optimal yield is achieved on a reactor
geometry- and feedstock-dependant, proper reactor temperature. If the feedstock is well
dried, the parameters affecting yield are mainly feedstock mass flow (feed rate), fluidization
velocity and temperature.
8.5 Sampling: Loop seal
For information on the composition of the reactor fluidized bed and state of the char particles,
samples were taken from the loop seal. The loop seal is the pressure seal between the boiler
and the pyrolysis reactor, and apart from maintaining reactor pressure levels and inertization,
it functions also as a transport for the char for combustion in the boiler. It is situated below
the cyclones and during pyrolysis it is full of flowing bed material, mainly sand. The following
sketch shows the cyclones and the position of the sampling probe used to take the samples
from the loop seal (Fig. 19).
54
The sample from the loop seal was administered using two ball valves (seen in Figure 20) at
the first level and one at the floor level. The samples are normally rested in the end of the
sampling pipe and cooled in a water cooled heat exchanger for about 30 minutes.
Figure 20. On the left: The valves for taking the sample. On the right: the sample in the bucket.
Objective was to investigate the amount of volatiles in the char. Due to the extensive
residence time needed for cooling the sample, a new method was experimented for cooling.
In the method, the sample is rapidly submerged in a sampling bucket filled with water, cooled
in a water bath. The heat energy content of the falling sample was calculated to be
approximately 0,5 MJ, so adequate amount of water in sampling bucket was needed.
Figure 19. Sketch of the sampling equipment in the loop seal in position with the cyclones
55
8.6 Char analyses
The chars were separated from sand and analyzed for their chemical composition. Also
microscopic observation was done. Microscopic photograph of the prepared char can be
seen below (Figure 21).
Figure 21. Char sample. Notice the chamfers running diagonally.
8.6.1 Sample preparation and analysis matrix
The loop seal samples obtained with the water exhaustion method were kept three days in
oven at 105 °C to evaporate all the excess water. The samples were then sieved and the
char separated from the sand. The char particles of over 1,6mm were separated manually
using sieves and pan. This fraction corresponds roughly to 80 % of the char.
The char samples were sent for further analyses to evaluate the amount of volatiles and
ultimate chemical composition. Thermogravimetric analyses were also done to some of the
samples. The reactor conditions and selected analyses for different char samples are
presented in the next page (Table 5).
56
Table 5. Test point matrix for different char samples. The feed rate [g/s] and fluidizing velocity [m/s]
are normalized.
Temperature [°C]
Fluidizing velocity Feed rate
Water exhausted CHNOS Volatiles Ash TGA
480 1,00 1 no x x x 480 0,88 1 no x x x 520 1,00 0,667 yes x x x 520 1,00 0,667 no x x x x
460 0,99 0,667 no x x
x
460 1,00 0,667 yes x x
x
555 0,98 0,667 no x x
x
8.6.2 Results of the chemical composition analyses
It can be deduced from the results obtained in the analyses that
1.The water exhaustion method yielded a systematically lower amount of volatiles than the
cooling method.
2.The nitrogen content in water exhausted samples was lower than in the reference samples.
3.The volatiles displayed a decrease with reactor temperature.
4.The volatiles displayed a decrease with fluidizing velocity.
5.The oxygen content decreases with volatiles.
6.The nitrogen content was relatively stable as a function of temperature, however variation
was large.
A response surface of the char volatiles as a function of temperature and fluidizing velocity
can be seen in figure 22. There was a period during the experiment, where decreasing the
fluidization velocity lead to decrease of water content of the oil, while simultaneously the char
obtained from the loop seal was lower in volatiles. This indicates that fluidizing velocity could
also have an effect for yield. The pyrolysis reaction proceeds first by drying and then
progressively by devolatilization, so if the reaction time for large particles isn’t adequate in
the reactor, parts of the volatiles are left in the char.
Although the residence time is considerable in the loop seal, the sampling procedure
succeeded in producing consistent results that were in line with literature (Amutio et al. 2012,
Beis et al 2002). Amutio et al (2012) noticed a decrease in char yield when temperature was
57
increased. Their results also show that nitrogen content remains unchanged in char, while
volatiles ran down and oxygen depleted as temperature was increased.
From DCS data it can be seen that the sand temperature in the loop seal generally follows
the reactor temperature. This should be taken into account when planning similar sampling
procedures. However, water exhausting the sample didn’t generally give a better picture of
the amount of volatile fraction left in the char after pyrolysis. This might have been caused by
the fact that some of the volatiles are soluble in water (Martin 2000).
From solids removal point of view, the chemical properties of char were in quite a narrow
range to have an effect on the blocking of cyclones or any other negative effects. Also the
amount of sand is far greater than the amount of char. It is however important to have the
cyclones operate in a designed inlet velocity and flow rate, which are in direct relation to the
8.7 Particle size distributions and sources of inaccuracy
Besides loop seal, solid samples were collected from various parts of the process. The
particle size distribution (PSD) determinations from the samples collected are discussed in
this part. The product, pyrolysis oil, was also sampled for particle size.
Figure 22. Surface fit for normalized volatiles (vol) residing in the char as a function of temperature (T) and fluidizing velocity (Wf). The red and violet areas correspond to high devolatilization of the feedstock, whereas the yellow and green areas correspond to more pyrolyzable matter left in the feedstock.
58
8.7.1 Sand
The PSD of the sand entering the reactor could be obtained by taking sample from the boiler
bed, near the L-valve. The sampling probe was blown clean with pressurized air each time
sample was taken, in order to ensure sand was not accumulated in the probe. An estimate
for the PSD of the sand leaving the reactor could be obtained from ashed loop seal samples.
8.7.2 Coarse char
The loop seal sample contains sand and char. It is beneficial to try and determine the particle
size distribution of the char in order to compare it to the feedstock size distribution and to
determine the PSD of the collected fraction of the feed in the first cyclone.
The first problem one encounters in sample pretreatment is the isolation of the char from the
sand. It will be difficult to separate the char by mechanical means such as vibrating or
fluidizing. Vibration was experimented, with moderate amplitude resulting in some layering of
the char on top of the sand. However, backmixing was still considerable. Neither did the char
float on water.
Aside from its density, the char differs by its volatility. The particle size distribution of the char
was then tried to determine by ashing. The PSD was calculated by difference in mesh
analysis of the sample and mesh analysis of the unburnt part of the sample (
Figure 23).
Figure 23. A procedure trialed for char particle size distribution analysis
The sample was sieved for PSD. The sample was then gathered into container to dry at 105
°C. After drying, it was put into oven at 550°C for 3h. The burned loop seal sample was then
sieved for second time.
A large sensitivity to sieving time was noticed in this procedure. The ash was also collected
to the bottom sieves. The accuracy of the scale was also a limiting factor due to large sample
and small portion of char in the sample. The results obtained this way were not reproducible
and this method is therefore unrecommended.
Sieving Ashing Drying Sieving
59
A different procedure was trialed, now handling the particle size fractions as separate
samples (
Figure 24). The largest samples, comprising of over 100 grams of material, were put into
large metal container specially made for this purpose. The samples were ashed in oven at
550 °C. The ashing time was 3 h. The smallest 4 sieve fractions were ashed in crucibles.
Figure 24. Second procedure used for char particle size distribution analysis
The combustible fraction was then calculated by mass differences as of before and after
oven. Char particle size was finally obtained by taking the wood ash in char into account.
Char ash content was assumed to be constant across the fractions, calculated by a value
from proximate analysis of the char. The undersize PSD is plotted in Figure 25.
Figure 25. Collected char undersize distribution
A source of inaccuracy can be unrepresantability of the char entering into the sampling probe
when sampling – i.e. uneven composition of the loop seal bed and chance of classifying
inside the fluidizing riser section. More tests should be done in order to gain confidence.
Visual observation showed that there were only a few coarse particles in the loop seal
0
10
20
30
40
50
60
Cu
mu
lati
ve v
olu
me (
%)
Particle diameter (µm)
Ashing
Sieving Ashing
Ashing
60
sample, whereas for example when sampling the feedstock the representability of the
sample was better due to larger sample size.
8.7.3 Secondary cyclone char
The underflow from the second cyclone was collected in barrels for further examination. The
sampling procedure was handled by filling barrels from the underflow dipleg and changing as
the barrels filled up. The barrel with the most stable process conditions was sampled. The
visual appearance of the second cyclone underflow was black and dusty – indicating it to be
mostly composed of fine char (Figure 26).
The particle size distribution of this fine char was analyzed with laser diffraction. The same
sample was also analyzed using a higher dispersing pressure (2 bars) and liquid dispersant
(IPA), due to poor dispersibility of the sample. The results from different types of methods
can be seen in Figure 27. In one set of runs with 1 bar, there is large bump at the upper end
of the spectrum. The increase in dispersing pressure partly eliminates this bump. The use of
Figure 26. Second cyclone fine char, the sample in question.
61
isopropylalcohol as a dispersant also partly eliminates this bump. Some of the compounds in
the bio-oil are known to be well soluble in IPA and there can be some sticky volatiles still
attached to the carbonaceous char. Increasing dispersing pressure also moves the particle
size distribution towards the smaller end.
Figure 27. Particle size determinations of the fine char sample, using different dispersing pressures (1 bar and
one set for 2 bar) and one using liquid dispersing medium (isopropanol). The lower chart is an enlargement starting from the origin.
0
0,5
1
1,5
2
2,5
3
3,5
4
4,5
Vo
lum
e(%
)
Particle diameter (µm)
Isopropanol
p= 1 bar, 1
p= 1 bar, 2
p = 2 bar
0
0,5
1
1,5
2
2,5
3
3,5
4
4,5
Vo
lum
e(%
)
Particle diameter (µm)
Isopropanol
p= 1 bar, 1
p= 1 bar, 2
p = 2 bar
62
8.7.4 Pyrolysis oil
Optical microscopy was used to retrieve particle size distribution of the pyrolysis oil. Sample
needs to be diluted for the measurement. Dilution with isopropyl alcohol of 1:20 was
necessary for homogenized sample. The diluted sample was put in a sampling vessel and
pumped through an optical unit to film it. This equipment can be seen in Figure 28. The
resulting images were analyzed on a computer. The image analyzer determines the particle
size distribution by side profile of the particles, assuming a fully round particle. The machine
has various applications in different industries and all sorts of fluids and particles can be
analyzed. A complete description of the equipment and application to bio-oil can be found
from earlier research (Moilanen 2012).
From the particle size distribution (Figure 30 and Figure 31) one can see that most of the
particles are in the lower end, and only a few individual large particles are present. Similar
size ranges are reported in the literature (Lehto et al. 2013, p 23). The resolution of the
image analyzer was 2 microns with this optics, implying an inherent decreased accuracy at
the very low end of the spectrum.
Figure 28. The sampling vessel (1) and the optical unit (2) of the image analyzer.
2
1
63
8.7.5 Feedstock
Mesh analysis was done to the feedstock. In addition, the fine matter in the feedstock was
analyzed using laser diffraction. One source of inaccuracy for the device is the unevenness
of the particles. The particles are long sticks in the upper end of the distribution and dusty in
the lower end. The device assumes the particles as round and calculates the volumetric
distribution. This inaccuracy was minimized by increasing the number of measurements and
averaging the results. The particle size distribution average from 29 runs can be seen in
Figure 30 and Figure 31.
8.8 Results: Coarse material
The information from the particle size distributions of the different coarse particles is put
together in the next plot (Figure 29). Notice how the undersize distribution of the char has
shifted towards the lower end, when comparing to the feedstock. This is most likely a sign of
attrition. It is caused by abrasing forces in the walls of the reactor and cyclones and also
particle collisions. The char can also shrink of up to 50% in volume in the devolatilization
process (Guillain et al 2009). The effect in terms of particle diameter is not that large, since
volume is in proportion to the third power of diameter.
The sand can also be seen to shift a bit to the coarser side in the process. There was some
supporting evidence of this phenomenon when determining the ash content of the secondary
cyclone underflow and in the cold model tests performed later – not all of the fine sand is
separated in the first cyclone.
64
Figure 29. Particle size distributions of the coarse material from different phases of the process. The feed sand is collected from the boiler, the collected sand and char from the loop seal between cyclones. Notice the shrinking / attrition of the fed biomass into smaller particle sizes when approaching char.
8.9 Results: Fine material
The particle size distributions from the feedstock, secondary cyclone char and pyrolysis oil
are gathered in the following charts (Figure 30 & Figure 31). The first chart is an overview of
the obtained PSD’s and the second chart is a magnification of the lower end of the spectrum.
It should be noted that the fine char sample doesn’t correspond to the entirety of the char
formed, however it can be seen that there are no particles this fine in the feedstock.
Figure 30. The particle size distribution of the fine material: feedstock, secondary cyclone fine char and pyrolysis
oil
0
10
20
30
40
50
60
70
80
90
100 C
um
ula
tiv
e v
olu
me (
%)
Particle diameter (µm)
Feed biomass
Feed sand
Collected char
Collected sand
Feed biomass
0
1
2
3
4
5
6
7
8
9
10
Vo
lum
e (
%)
Particle diameter (µm)
Pyrolysis oil
Feedstock
Fine char
65
Figure 31. The particle size distribution of the fine material: feedstock, secondary cyclone fine char and pyrolysis
oil, zoomed to the lower end of the spectrum of Figure 30.
From the feedstock particle size distribution we can notice that there is no substantial amount
of particles in the region dominating in the bio-oil. Consequently, the feedstock undergoes
some changes or fine particles are formed by other mechanisms, such as the boudoard
mechanism discussed earlier in theory. Again, it can be tentatively assumed that particle
attrition and/or shrinkage are considerable in the reactor and the cyclones.
There are some possibilities to reduce attrition. In pyrolysis literature Guillain et al ( 2009)
used a completely different reactor, in fact solely to address the topic. They used an
externally heated reactor to produce bio-oil without high external heat coefficients. They state
that the oil yield was comparable to conventional high heat-transfer-coefficient reactors and
solid content low. On their experiments with sand in spout bed, Fernandez-Akarregui et
al.(2012) noticed that attrition depends on excess air above minimum fluidizing velocity.
From different types of sand particles, the ones with rough edges were more prone to
attrition. Also other particle properties such as particle density, size, porosity, hardness, etc.
are known to have an effect on attrition. In light of these properties, it could be beneficial to
reconsider the type of sand to use in the process. The inlet shapes in cyclones can also have
an effect on collision probability in particles and the smoothness of the particle trajectories.
0
1
2
3
4
5
6
Vo
lum
e (
%)
Particle diameter (µm)
Pyrolysis oil
Feedstock
Fine char
66
8.10 Cyclone characteristics
Pressure drop in both of the cyclones was obtained from the distributed control system
(DCS) of the pilot plant. The pressure is monitored before, after and between the cyclones.
The separation efficiency was calculated using the equation suggested earlier. The cut-size
diameter was also calculated and compared to values rising from equations in literature,
such as those presented in Dewil et al (2008).
8.11 Grade efficiency curve
Grade efficiency curves are used to point to the separation characteristics of a given particle
size. The particle sizes from the fine char distribution using IPA as the dispersing media was
used since the same solvent was employed in the oil particle size characterization.
The particle size distribution data for the char below 100 µm was first calculated for the same
data points than the oil using linear interpolation and checked for consistency. It was also
normalized for the range. Equation 12, derived from Hoffman & Stein (2007), was then used
in each data point to calculate the size-dependant separation efficiency, which is plotted in
Figure 32.
(12)
Where
x particle diameter
η separation efficiency
f fraction
c captured
e emitted
f feed
67
It can be seen that the shape of the grade efficiency curve is typical. The dark vertical lines in
the upper end are the result of random large particles and discretization error.
9 SUMMARY AND CONCLUSIONS
Solids removal plays an essential role in biomass fast pyrolysis. It is needed to improve the
quality of the oil, to broaden application base of the end product, and to avoid plugging and
erosion of downstream equipment. The objectives of this research were to gain an
understanding of the origin of solids in pyrolysis process and options to reduce it.
Solids from the pyrolysis process can be separated by means of three different separators:
cyclones, hot vapor filters or pyrolysis liquid filters/centrifuges. Process conditions and
feedstock properties such as particle size uniformness, feed quality control and avoidance of
process disturbances also play a role.
Cyclones are a traditional and robust solid separation technique in circulating fluidized bed
pyrolysis. Cyclone theory and performance criteria were studied and reviewed from the
literature. From dimension analysis Stokes number was uncovered as the main similarity
condition determining e.g. the difference between a hot and a cold cyclone and scaling up of
cyclones.
Hot vapor filters were studied to gain insights on the advantages and disadvantages of the
technology. Hot vapor filtration is an emerging technique, but not yet demonstrated for
0
10
20
30
40
50
60
70
80
90
100 S
ep
ara
tio
n e
ffic
ien
cy (
%)
Particle diameter (µm)
Grade efficiency (logarithmic)
Figure 32. Grade efficiency curve for the separation equipment
68
biomass pyrolysis vapors on an industrial scale. It is effective in removing ash and solids,
and stabilizing bio-oil, but it slightly decreases yield and is prone to plugging.
Liquid filters were briefly reviewed from the literature. Liquid filters and centrifuges can be
used either in-line or offline with reasonable efficiencies and losses. The separation
efficiency for the smallest particles in the oil is still a challenge to be overcome.
In the experimental section, pyrolysis pilot equipment with two cyclones in series was
operated and monitored. Sampling and sample handling methods were developed and
tested. Data and samples were gathered and further analyzed.
Particle size distribution of the char separated in the first cyclone can be determined by
combined mesh analysis and ashing. Pyrolysis oil particle size distribution can be determined
by optical microscopy. It seems that the solids are mainly ultra fine char during normal
operation, but process disturbances can lead some sand in the oil cycle. In the future,
indications to the abrasive properties of the solids (such as ash content) could be monitored
along the solid content in order to keep track of the harmfulness of solids and possible
causes for it.
The particle size distributions and microscopic observations suggest that the source of the
ultra fine particles is likely attrition and shrinkage of the char formed in the reactor and
cyclones. From the grade-efficiency curve, it can be observed that the separation efficiency
for the cyclone system is of typical shape and improves as the particle size grows. In order to
improve the quality of the oil, options for reducing attrition, such as reshaping the reactor
outlet, reducing fluidization velocity or changing the variety of the sand should be considered.
The char properties obtained in different temperatures and fluidizing velocities could be
compared when the char was separated from the loop seal sand. The char was lower in
volatiles in higher temperatures and lower fluidizing velocities. If the temperature is able to be
kept low and the inlet velocity of the cyclones maintained sufficient, this is another reason to
lower the fluidization velocity. Increasing the particle size of the feedstock within the limits for
adequate devolatilization would also improve the separation efficiency, especially when
scaling up the process in commercial scale.
69
REFERENCES Alakangas, Eija. 2000. Suomessa käytettävien polttoaineiden ominaisuuksia. VTT tiedotteita 2045. Alexander, R. 1945. Proc Australian inst. Min. & Met. New Series No’s 152-153, vol 203. Amutio et al. 2012. Influence of temperature on biomass pyrolysis in a conical spouted bed reactor. Resources, conservation and recycling, vol. 59, pp. 23-31. Baldwin, Robert. 2012. Pyrolysis oil stabilization: Hot-Gas Filtration. NREL CRADA report. Beis et al. 2002. Fixed-bed pyrolysis of safflower seed: influence of pyrolysis parameters on product yields and compositions. Renewable energy, vol. 26, pp. 21-32. Biocoup. 2011. Publishable final activity report. Co-processing of upgraded bio-liquids in standard refinery units [e-document]. [retrieved 28.05.2013]. Available: http://www.biocoup.com/uploads/media/BIOCOUP_Publishable_final_activity_report_01.pdf Brandvold, Timothy. 2011. Stabilization of Fast Pyrolysis Oils [e-document]. Presentation given at DOE, April 16-18, 2011. Thermochemical Portfolio Alignment and Peer Review. [retrieved: 3.12.2012]. Available: http://www.obpreview2011.govtools.us/presenters/public/InsecureDownload.aspx?filename=UOP.PyOilStabilization.DOE2011PeerReview.Final.pdf Burnard et al. 1993. Operation and performance of the EPRI hot gas filter at Grimethorpe PFBC establishment : 1987 – 1992. In: Gas cleaning at high temperatures, second international symposium, Guildford UK. pp. 88 -110. Butler, Eoin et al. 2011. A review of recent laboratory research and commercial developments in fast pyrolysis and upgrading. Renewable and Sustainable Energy Reviews, vol. 15, pp. 4171–4186. Caldo. 2012. Mechanical cleaning [e-document]. [retrieved: 27.11.2012]. Available: http://www.caldo.com/pdf_files/DS005%20Mechanical%20Cleaning.pdf . Carpenter, Daniel 2011. Molecular Beam Mass Spectrometry for Analysis of Condensable Gas Components [e-document] Tar analysis workshop, 19th EU biomass conference, June 8th, Berlin. [retrieved 9.1.2013]. Available: http://www.evur.tu-berlin.de/fileadmin/fg45/Workshops/Tar_Workshop/16_Carpenter_tar_workshop-EU_biomass_2011_____MBMS_analysis.pdf Chen & Shi. 2003. Analysis on cyclone collection efficiencies at high temperatures. China particuology, vol. 1, pp. 20-26. Chen, Tianju. 2011. Effect of hot vapor filtration on the characterization of bio-oil from rice husks with fast pyrolysis in a fluidized-bed reactor. Bioresource Technology, vol. 102, pp. 6178–6185. Chiaramonti et al. 2007. Power generation using fast pyrolysis liquids from biomass. Renewable and Sustainable Energy Reviews, vol. 11, pp. 1056-1086.
70
Dewil et al. 2008. CFB cyclones at high temperature: operational results and design assessment. Particuology, vol. 6, pp. 149-156. ECN. 2012. Tar dew point [e-document]. The complete model. [retrieved: 2.4.2013]. Available: http://www.thersites.nl/completemodel.aspx. Evans & Milne. 1987. Molecular characterization of the pyrolysis of biomass. 2. Applications. Energy & Fuels, vol. 1, pp. 311-319. Fernandez-Akarregui et al. 2012. Sand attrition in conical spouted beds. Particuology, vol. 10, pp. 592-599. Gasum. 2013. LNG reduces emissions and burns more efficiently in engines [e-document]. [retrieved: 2.5.2013]. Available: http://www.gasum.com/products/lng/Pages/Properties.aspx. Ahmadi, G. & Smith, D. 2002. Analysis of Steady-State Filtration and Backpulse Process in a Hot-Gas Filter Vessel. Aerosol Science and Technology, vol. 36, pp. 665-677. Guillain et al. 2009. Attrition-free pyrolysis to produce bio-oil and char. Bioresource technology, vol. 100, pp. 6069-6075. Hoekstra et al. 2009. Fast Pyrolysis of Biomass in a Fluidized Bed Reactor: In Situ Filtering of the Vapors. Ind. Eng. Chem. Res. 2009, vol. 48, pp. 4744–4756. Hoffman & Stein. 2007. Gas cyclones and swirl tubes – Principles, Design and Operation. Second edition. Springer. Javaid et al. 2010. Removal of char particles from fast pyrolysis bio-oil by microfiltration. Journal of Membrane Science, vol. 363, pp. 120–127. Jussila, Matti. 1986. Syklonin erotuskykyyn vaikuttavat tekijät. Master’s thesis. Tampere University of Technology. Department of mechanical engineering. Källi, Anssi. 2012. Pyrolyysiöljyn kiintoaineen poisto linkouksella. Master’s thesis. Aalto-University. School of engineering. Department of Energy Technology. Kang et al. 2006. Fast pyrolysis of radiata pine in a bench scale plant with a fluidized bed: Influence of a char separation system and reaction conditions on the production of bio-oil. Journal of analytical and applied pyrolysis, vol. 76, pp. 32–37. Karvinen, Reijo & Kauramäki, Tuomo. 1986 Uuden syklonityypin erotusasteen analyyttinen malli. Tampere University of Technology. Department of mechanical engineering. Report 53. Kokko, Lauri. 2012 Personal communication. 4.12.2012. Lehto, J et al. 2013. Fuel oil quality and combustion of fast pyrolysis bio-oils. VTT technology 87. Mai, Robert. 2012. E-mail. 11.11.2012. Mitchell, Stuart. 1997. Hot gas particulate filtration. IEA Coal research. Moilanen, Sari. 2012. Characterization of particles in bio-oil. Master’s thesis. University of Oulu. Department of process and Environmental Engineering.
71
Oasmaa & Peacocke. 2001. A guide to physical property characterization of pyrolysis liquids. VTT publications. 450. Oasmaa & Peacocke. 2010. Properties and fuel use of biomass-derived fast pyrolysis liquids: A guide. VTT publications 731. Oasmaa & Kuoppala. 2003. Fast pyrolysis of forestry residue. 3. Storage stability of liquid fuel. Energy & Fuels, 2003: 17. s. 1075-1084. Oasmaa, Anja et al. 2009. Quality control in fast pyrolysis bio-oil production and use. Environmental progress & Sustainable energy, vol. 28, pp. 404 – 409. Oasmaa, Anja et al. 1997. Physical characterization of biomass-based pyrolysis liquids. Application of standard fuel oil analyses. VTT publications 306. Oasmaa, Anja et al. 2003. Fast pyrolysis of forestry residue. 2. Physiochemical composition of product liquid. Energy & Fuels, vol. 17, pp. 433-443. Oasmaa, Anja et al. 2010. Fast Pyrolysis Bio-Oils from Wood and Agricultural Residues. Energy & Fuels, vol. 24, pp. 1380–1388. Oasmaa, Anja et al. 2012. Bio-oil ≠ Bio-oil – Major differences in properties and use of fast pyrolysis bio-oil compared to fossil fuels and other bio-oils. IEA Bioenergy conference 2012. Oasmaa, Anja. 2013. Personal communication. 14.5. 2013. Ouchi et al. 1981. Dissolution of coal with NaOH-alcohol: Effect of alcohol species. Fuel, vol. 60, pp. 474-476. Pattanotai et al. 2012. Experimental investigation of intraparticle secondary reactions of tar during wood pyrolysis. Fuel, vol. 104, pp. 468-475. Pattiya, Adisak & Suttibak, Suntorn. 2012 a. Production of bio-oil via fast pyrolysis of agricultural residues from cassava plantations in a fluidised-bed reactor with a hot vapour filtration unit. Journal of Analytical and Applied Pyrolysis, vol. 95, pp. 227–235. Pattiya, Adisak & Suttibak, Suntorn. 2012 b. Influence of a glass wool hot vapour filter on yields and properties of bio-oil derived from rapid pyrolysis of paddy residues. Bioresource Technology, vol. 116, pp. 107–113. Red Arrow [Vendor web site]. 2013. [retrieved: 2.4.2013]. Available: http://www.redarrowinternational.com/ Sahimaa, Rauno. 2012. Selvitys pyrolyysiöljyn polton hiukkaspäästöjen vähentämiseen vaikuttavista tekijöistä. Master’s thesis. Tampere University of Technology. Mechanical engineering. Scahill J. et al. 1996. Removal of residual char fines from pyrolysis vapors by hot gas filtration. National renewable Energy Laboratory. Colorado, Usa.
72
Sitzmann, Jürgen. 2008. Hot Filtration of fast pyrolysis vapors [e-document]. In: PyNe newsletter issue 24. [retrieved: 2.4.2013]. Available : http://pyne.co.uk/Resources/user/PyNe%2024.pdf Solantausta et al. 2001. Bio Fuel Oil - Upgrading by Hot Filtration and Novel Physical Methods. VTT Energy. Martin, Pasi. 2000. Pyrolyysiöljyn poltto. Master’s thesis. Lappeenranta University of Technology. Department of Energy Technology. Solantausta et al. 2012. Bio-oil Production from Biomass: Steps toward Demonstration. Energy & Fuels, vol. 26, pp. 233–240. Venderbosch, Robbie & Prins, Wolter. 2010. Fast pyrolysis technology development. Biofuels, Bioproducts and biorefining, vol. 4, pp. 178-208. Westerhof et al. 2011. Heterogeneous and homogeneous reactions of pyrolysis vapors from pine wood [e-document]. Biocoup project. [retrieved: 2.4.2013]. Available : http://www.biocoup.com/fileadmin/user/december/Update_December_2011/107_UT_May11.pdf Zenz, Frederick. 1989. Fluidization and fluid-particle systems. Vol 11. Pemm-Corp.