1248 Biochemistry 1995,34, 1248- 1260 Solution Structure of a Green Mamba Toxin That Activates Muscarinic Acetylcholine Receptors, As Studied by Nuclear Magnetic Resonance and Molecular Modeling$ Isabelle SCgalas,s Christian Roumestand, Sophie Zinn-Justin, Bernard Gilquin, RenCe MCnez, AndrC MCnez, and Flavio Toma* CEA, Dkpartement d’lngtnierie et d’Etude des Protkines, C.E. Saclay, 91 191 Gif-Sur-Yvette Cedex, France Received August 15, 1994; Revised Manuscript Received November 2, I994@ ABSTRACT: The three-dimensional solution structure of the MTX2 toxin (65 amino acids and 4 disulfides) from the green mamba venom (Dendroaspis angusticeps), a toxin that activates the pharmacological M 1 muscarinic acetylcholine receptors, has been determined by nuclear magnetic resonance and molecular modeling. Seventeen structures were calculated from 810 distance and 68 dihedral angle restraints using DIANA and X-PLOR. The average rms deviation between the 17 refined structures and the energy- minimized average structure is 0.95 8, for the backbone atoms. The overall folding of MTX2 consists of three loops stabilized by the four disulfides and forming a two- and a three-stranded P-sheet. This structure appears to be very similar to that of other snake toxins, such as neurotoxins, fasciculins, and cardiotoxins, that also possess the same three-finger fold. For instance, the RMSd for the backbone atoms between MTX2 and the curaremimetic toxin a (from Naja nigricollis), the acetylcholinesterase inhibitor fasciculin 1 (from Dendroaspis angusticeps), and the cardiotoxic toxin y (from Naja nigricollis) are 1.86, 1.87, and 2.04 A, respectively. Local differences are observed between this toxin and the other structurally related toxins. Some of these differences could be relevant for the functional specificity of MTX2. In particular, this toxin presents a large twist at the tip of loop I1 due to a bulge (V31, T32; N35) that accommodates an inserted amino acid in the loop. This spatial arrangement brings the side chain of K34 in the p-turn of the loop to be aligned with the /3-sheet. Hypotheses about a possible functional role of this lysine are described. Other characteristics in the side-chain distribution that could be related to the MTX2 function are presented. Muscarinic acetylcholine receptors (mAChRs)’ mediate many actions of the neurotransmitter acetylcholine in the autonomic peripheral and central nervous system [for reviews, see Nathanson (1987), Brown (1989), and Hulme et al. (1990)l. In the autonomic peripheral nervous system, mAChRs are associated with the regulation of smooth muscle tone, heart rate, and several secretions (Nathanson, 1987). In the central nervous system, mAChRs are implicated in normal learning and memory (Drachman, 1977; Bartus et al., 1985; Gitelman & Prohovnick, 1992), arousal (McCor- mick, 1989, 1992; Metherate et al., 1993), and motor and sensory modulation (McConnick, 1989, 1992) as well as in normal aging, schizophrenia, depression, and Parkinson’s and Alzheimer’s diseases (Mash et al., 1985; Dilsaver, 1986; Vannucchi & Goldman-Rakic, 1991). In contrast to the nicotinic acetylcholine receptors, which form an ion channel, * Atomic coordinates of toxin a and fasciculin 1 are from Protein Data Bank, Brookhaven National Laboratory, reference lNEA and lFAS, respectively. The atomic coordinates of the solution structure of toxin y are available in our laboratory. * To whom correspondence should be addressed. *Permanent address: Laboratoire de RMN, URA-464 CNRS, @ Abstract published in Advance ACS Abstracts, December 15, 1994. I Abbreviations: mAChR, muscarinic acetylcholine receptor; NMR, nuclear magnetic resonance; 2D, two dimensional; COSY; correlated spectroscopy; DQF-COSY, double-quantum filtered correlated spec- troscopy; TOCSY, total correlated spectroscopy; NOE, nuclear Over- hauser effect; NOESY, NOE spectroscopy; RMSd, root-mean-square deviation. UniversitC de Rouen, 76821 Mont-Saint-Aignan Cedex, France. 0006-2960/95/0434- 1248$09.00/0 0 the muscarinic receptors, like many other cell surface receptors, act through GTP-binding proteins (G proteins) to stimulate or inhibit intracellular effector systems (Nathanson, 1987). Two pharmacologically distinct classes of mAChRs, M1 and M2, have been identified on the basis of their capacity to bind to the antagonist pirenzepine with high and low affinity, respectively (Hammer et al., 1980). However, a variety of mAChR properties have not been well correlated with this classification, suggesting the existence of receptor subclasses (Hammer et al., 1986). In fact, at least five genes, termed m l -m5, code for the mAChRs (Bonner, 1989). More detailed studies of these different subtypes of mAChRs have been hampered by the lack of specific agonists and antago- nists for each receptor (Buckley et al., 1989). Muscarinic toxins from mamba venoms are the only known proteins that bind to the muscarinic acetylcholine receptors. Adem et al. (1988) have isolated two muscarinic toxins (MTX1 and MTX2) from the venom of the green mamba Dendroaspis angusticeps. These toxins only partially inhibit the binding of quinuclidinyl benzilate and were therefore suggested to be selective for one pharmacological subtype of mAChRs. Jerusalinsky et al. (1992) have shown that both MTXl and MTX2 are selective for the M1 pharmacological subtype in the cortex. More recently, another toxin of the D . angusticeps venom has been purified and sequenced (Max et al., 1993). It has specific antagonist properties for the cloned ml mAChR and was thus named “m 1 -toxin”. 1995 American Chemical Society
Transcript
1248 Biochemistry 1995,34, 1248- 1260
Solution Structure of a Green Mamba Toxin That Activates Muscarinic Acetylcholine Receptors, As Studied by Nuclear Magnetic Resonance and
Molecular Modeling$
Isabelle SCgalas,s Christian Roumestand, Sophie Zinn-Justin, Bernard Gilquin, RenCe MCnez, AndrC MCnez, and Flavio Toma*
CEA, Dkpartement d’lngtnierie et d’Etude des Protkines, C.E. Saclay, 91 191 Gif-Sur-Yvette Cedex, France
Received August 15, 1994; Revised Manuscript Received November 2, I994@
ABSTRACT: The three-dimensional solution structure of the MTX2 toxin (65 amino acids and 4 disulfides) from the green mamba venom (Dendroaspis angusticeps), a toxin that activates the pharmacological M 1 muscarinic acetylcholine receptors, has been determined by nuclear magnetic resonance and molecular modeling. Seventeen structures were calculated from 810 distance and 68 dihedral angle restraints using DIANA and X-PLOR. The average rms deviation between the 17 refined structures and the energy- minimized average structure is 0.95 8, for the backbone atoms. The overall folding of MTX2 consists of three loops stabilized by the four disulfides and forming a two- and a three-stranded P-sheet. This structure appears to be very similar to that of other snake toxins, such as neurotoxins, fasciculins, and cardiotoxins, that also possess the same three-finger fold. For instance, the RMSd for the backbone atoms between MTX2 and the curaremimetic toxin a (from Naja nigricollis), the acetylcholinesterase inhibitor fasciculin 1 (from Dendroaspis angusticeps), and the cardiotoxic toxin y (from Naja nigricollis) are 1.86, 1.87, and 2.04 A, respectively. Local differences are observed between this toxin and the other structurally related toxins. Some of these differences could be relevant for the functional specificity of MTX2. In particular, this toxin presents a large twist at the tip of loop I1 due to a bulge (V31, T32; N35) that accommodates an inserted amino acid in the loop. This spatial arrangement brings the side chain of K34 in the p-turn of the loop to be aligned with the /3-sheet. Hypotheses about a possible functional role of this lysine are described. Other characteristics in the side-chain distribution that could be related to the MTX2 function are presented.
Muscarinic acetylcholine receptors (mAChRs)’ mediate many actions of the neurotransmitter acetylcholine in the autonomic peripheral and central nervous system [for reviews, see Nathanson (1987), Brown (1989), and Hulme et al. (1990)l. In the autonomic peripheral nervous system, mAChRs are associated with the regulation of smooth muscle tone, heart rate, and several secretions (Nathanson, 1987). In the central nervous system, mAChRs are implicated in normal learning and memory (Drachman, 1977; Bartus et al., 1985; Gitelman & Prohovnick, 1992), arousal (McCor- mick, 1989, 1992; Metherate et al., 1993), and motor and sensory modulation (McConnick, 1989, 1992) as well as in normal aging, schizophrenia, depression, and Parkinson’s and Alzheimer’s diseases (Mash et al., 1985; Dilsaver, 1986; Vannucchi & Goldman-Rakic, 1991). In contrast to the nicotinic acetylcholine receptors, which form an ion channel,
* Atomic coordinates of toxin a and fasciculin 1 are from Protein Data Bank, Brookhaven National Laboratory, reference lNEA and lFAS, respectively. The atomic coordinates of the solution structure of toxin y are available in our laboratory.
* To whom correspondence should be addressed. *Permanent address: Laboratoire de RMN, URA-464 CNRS,
@ Abstract published in Advance ACS Abstracts, December 15, 1994. I Abbreviations: mAChR, muscarinic acetylcholine receptor; NMR,
nuclear magnetic resonance; 2D, two dimensional; COSY; correlated spectroscopy; DQF-COSY, double-quantum filtered correlated spec- troscopy; TOCSY, total correlated spectroscopy; NOE, nuclear Over- hauser effect; NOESY, NOE spectroscopy; RMSd, root-mean-square deviation.
UniversitC de Rouen, 76821 Mont-Saint-Aignan Cedex, France.
0006-2960/95/0434- 1248$09.00/0 0
the muscarinic receptors, like many other cell surface receptors, act through GTP-binding proteins (G proteins) to stimulate or inhibit intracellular effector systems (Nathanson, 1987). Two pharmacologically distinct classes of mAChRs, M1 and M2, have been identified on the basis of their capacity to bind to the antagonist pirenzepine with high and low affinity, respectively (Hammer et al., 1980). However, a variety of mAChR properties have not been well correlated with this classification, suggesting the existence of receptor subclasses (Hammer et al., 1986). In fact, at least five genes, termed ml -m5, code for the mAChRs (Bonner, 1989). More detailed studies of these different subtypes of mAChRs have been hampered by the lack of specific agonists and antago- nists for each receptor (Buckley et al., 1989).
Muscarinic toxins from mamba venoms are the only known proteins that bind to the muscarinic acetylcholine receptors. Adem et al. (1988) have isolated two muscarinic toxins (MTX1 and MTX2) from the venom of the green mamba Dendroaspis angusticeps. These toxins only partially inhibit the binding of quinuclidinyl benzilate and were therefore suggested to be selective for one pharmacological subtype of mAChRs. Jerusalinsky et al. (1992) have shown that both MTXl and MTX2 are selective for the M1 pharmacological subtype in the cortex. More recently, another toxin of the D . angusticeps venom has been purified and sequenced (Max et al., 1993). It has specific antagonist properties for the cloned ml mAChR and was thus named “m 1 -toxin”.
spectral width of 7812.5 Hz. Data processing was performed on a Sun Sparc Station 1 using the FELIX software (Biosym Technologies, San Diego). Prior to Fourier transformation, the time domain data were weighted with a shifted (n/2 for NOESY and n/lO for TOCSY and COSY-DQF data) sine bell window function and were zero-filled to yield real 1K x 1K (4K x 1K for DQF-COSY) matrices after reduction. Baseplane distortions were corrected in both dimensions from the frequency time domain data with a third-order polynomial function.
NH-CaH and CaH-CpH coupling constants were mea- sured in the DQF-COSY spectra from cross-peaks multiplets parallel to the w2 axis where the digital resolution after zero- filling was 2 Hz.
Proton-deuterium exchange of the amide protons was studied on the sample of MTX2 lyophilized from Hz0 and redissolved in pure D20. The residual NH signal was followed with time at 298 K by absolute value COSY experiments consisting of 256 increments of eight scans, each scan being composed of 1024 time-domain data points. One experiment was completed in 20 min. Spectra were recorded every 30 min during 24 h. Exchange rates were determined by a least-squares fit of a single-exponential decay using the peak volume of nonoverlapping COSY cross-peaks.
Experimental Restraints. Interproton distance restraints, torsional angle restraints, and hydrogen bond restraints were derived from the NMR data.
Each NOE was converted into an interproton distance using the usual relationship:
MTX2 is the most abundant muscarinic toxin in the green mamba venom (Jerusalinsky et al., 1992). It has been recently shown that this toxin has an agonist-like action in an inhibitory learning task on rats (Jemsalinsky et al., 1993). MTX2 is a single-chain polypeptide consisting of 65 amino acids (MI = 7040) whose sequence has been determined independently by two groups and two different methods (Ducancel et al., 1991; Karlsson et al., 1991). Its amino acid sequence can be aligned with that of a large number of other snake toxins such as short-chain neurotoxins, fasciculins, and cardiotoxins. The structure of several of these toxins has been solved by X-ray crystallography andfor by NMR spectroscopy [reviewed in MCnez et al. (1992), Read and Stein (1993), and Rees and Bilwes (1993)l. They all present a similar global folding with three adjacent loops rich in /I-sheets, connected to a core containing four disulfide bridges. The similarities between MTX2 and the other snake toxins, more specifically the position of the eight invariant cysteines in the sequence and the circular dichroism spectra, have suggested for MTX2 the same positioning of the four disulfide pairing (Karlsson et al., 1991) as well as a similar global folding (Ducancel et al., 1991). To c o n f m this proposal and also to progress in our understanding of the molecular action of MTX2, we investigated its solution structure by 2D NMR spectroscopy and molecular modeling. Comparison of the backbone folding and side-chain orga- nization of MTX2 with those of a representative member of short neurotoxins, cardiotoxins and fasciculins is presented. Hypotheses are made for a possible functional binding-site to mAcm. MATERIALS AND METHODS
Sample Preparation. The muscarinic toxin MTX2 was purified from D. angusticeps venom (LATOXAN, France) as previously described (Adem et al., 1988). For the NMR measurements, 9.5 mg of toxin were dissolved in 0.4 mL of solvent (final concentration 3 mM). The solvents used were either a mixture of 95% (v/v) HzO and 5% (v/v) Dz0 or 100% DzO after complete exchange of all labile protons. The pH was chosen equal to 5.2 in order to prevent protein degradation (manuscript in preparation). Chemicals shifts were measured relative to 3-t1imethylsilyl-[2,2,3,3-~H& propionate (TSP-d4) used as internal reference. NMR Experiments. All NMR experiments were performed
at 600 MHz on a Bruker AMX600 spectrometer. DQF- COSY spectra (Rance et al., 1983) at 45 "C and TOCSY (Davis & Bax, 1985) and NOESY (Kumar et al., 1980) spectra at 15, 35, and 45 "C were recorded both in HzO and D20 for complete assignment. TOCSY spectra were re- corded with a 80-ms isotropic mixing period using a WALTZ-16 composite sequence (Shaka et al., 1983) and a pair of 2-filters with a delay of 3 ms on either end of the mixing time pulse to overcome phase anomalies (Rance, 1987). NOESY spectra were recorded with a 150-ms mixing time.
The experiments were collected using the States method (States et al., 1986) in the tl dimension and using simulta- neous mode acquisition in the t2 dimension. The water signal was suppressed by low-power irradiation of the solvent resonance at all times excepted during t l and t 2 .
The spectra were recorded with 512 ( t l ) x 2048 ( t 2 ) data points (1024 x 4096 points for DQF-COSY) and with a
di, and dref are the distance between protons i and j and between the reference protons, respectively. The NOE between Hd and HE in the phenylalanine ring corresponding to a distance of 2.48 A was used for the calibration. Zv and Zxf are the signal intensities of the NOE cross peaks between protons i and j and between the reference protons, respec- tively, integrated in the 150-ms mixing time NOESY spectra. This resulted in reasonable distances (2.4 f 0.1 A) for the Ha-Ha pairs in the regular part of the antiparallel /3-sheet of MTX2. A range of f 2 0 % of the distance values was used in defining the upper and lower bounds of the constraints. For protons that could not be stereospecifically assigned, the lower bound was the sum of the van der Waals radii (1.8 A). For these protons, pseudoatoms were con- structed during preliminary structure construction using appropriate corrections (Wiithrich et al., 1983), and a r-6 averaging was used for the refinement.
A total of 35 restraints on the Cp dihedral angles were obtained from the coupling constants 3 J ~ - ~ a using the empirically calibrated Karplus relation (Karplus, 1963; Par& et al., 1984). Twenty-six angles corresponding to coupling constants greater or equal to 9.5 zk 2 Hz were restrained to -120" f 25". Three angles corresponding to coupling constants smaller than 6 Hz were restrained in the -60" f 30" interval. For coupling constants in the 6-9.5 Hz range, where more than a single Cp value is possible, additional secondary structure information from the NOE data was used to reduce the number of solutions. Thus, four Cp angles corresponding to coupling constants equal to 7.5 Hz and belonging to residues in a P-sheet structure (V4, D16, T32, and G41) were restrained at -120" f 50". Structure
1250 Biochemistry, Vol. 34, No. 4, 199.5 Segalas et al.
FIGURE 1: NMR data derived from NOESY (t, = 150 ms) and COSY-DQF spectra at pH 5.2, used for the sequence-specific assignment and the secondary structure identification. 3&N, vicinal coupling constants; solid squares, 3 J a 2 8 Hz; hatched squares, 3JaN % 7.5 HI.; open squares, 'Jw 5 6 Hz. ~ N H , exchange rates of the amide protons; solid circles, ~ N H > 0.01 mn-I at 20 "C; open circles, k N H < 0.01 mn-l at 20 "C.
calculations without these constraints were also carried out. This did not produce any structural modification, and only a slight change of the RMSd values (0.1-0.2 A) was observed for the backbone atoms around the concerned residues. This indicates that the use of these four 4 angle constraints does not represent an overinterpretation of the data. Moreover, analysis of the NOE data and coupling constants allowed the unambiguous characterization of some p-turns (Wuthrich, 1986) and on this basis, the introduction of additional 4 angles. Thus, the 4 3 4 (3JNH-Ha = 7.7 f 2 Hz) in a type I p-turn was set to -90" f 30". The Ha protons of G20 could be stereospecifically assigned, and the $20 angle (3JNH-Ha2 = 3.8 f 2 Hz) in a type I1 P-turn was set to 90" f 30".
Thirty-three X I angle restraints were obtained from the analysis of the ' J H ~ - H ~ coupling constants and intraresidue NOEs (Hyberts et al., 1987). The limits of the intervals were set to f45".
Distance restraints were explicitly used for the hydrogen bonds expected in the P-sheet and consistent with the observed exchange rates and NOEs (Wagner et al., 1987). For each hydrogen bond, two restraints were used: 1.7-2.0 A between the hydrogen and the oxygen acceptor atom and 2.7-3.0 A between the nitrogen atom of the donor and the oxygen acceptor atom (Baker & Hubbard, 1984).
Additional restraints were included in the distance geom- etry calculations to define the four disulfide bridges, Le., ranges of 2.0-2.1 A for d(S)', S)') and 3.0-3.1 A for d(Cp, SY).
The complete list of experimental restraints is available upon request from the authors.
3 0 Structure Calculations. 3 D structures were deduced from the experimental distance and angle restraints by a combination of distance geometry and simulated annealing calculations. Distanct geometry calculations were performed using the variable target function program DIANA (Guntert et al., 1991). Fifty structures were generated from a preliminary set of distance and angle restraints. The analysis of the structures allowed the resolution of ambiguities in the assignment of NOE cross-peaks arising from chemical shift degeneracy and thus the derivation of additional interproton and/or angle restraints. This procedure was iterated several
times by calculating at each step a new set of structures with an improved list of restraints. A final set of 100 structures was generated with the final list of restraints. This list includes 768 upper and lower distance restraints (355 intraresidue, 175 sequential, 238 long-range restraints) and 12 distance restraints for the 4 disulfide bridges (mean number, 18 restraintslresidue). Thirty distance restraints for the 15 hydrogen bonds were introduced, as well as 35 4 and 33 X I dihedral angle restraints.
Among the last 100 structures generated by DIANA, 17 structures present a value of the target function smaller than 5 and no distance violation larger than 0.6 A. The 4 and X I
angles show no violation greater than 10". The low value of the target function obtained from a high number of constraints indicates the consistency of the data set and corresponds to structures of good quality. These structures were further refined by simulated annealing calculations using X-PLOR (Briinger et al., 1987; Briinger, 1992).
The simulated annealing protocol employed was derived from the one described previously (Gippert et al., 1990) and implemented in our laboratory (Zinn-Justin et al., 1992; Gilquin et al., 1993). The target function was similar to that used by Nilges et al. ( I 988). A force field adapted for NMR structure determination (file parallhdg.pro and topa1lhdg.pro in X-PLOR 3.1) was used. A last restrained minimization was canid out with the force field derived from CHARMM 19 (Brooks et al., 1983) in order to allow a final optimization of the structure. The structures were displayed and analyzed on a Silicon Graphics 4D/25 station using the SYBYL package (Tripos Associates, Inc).
RESULTS
Resonance Assignments
The sequence-specific assignment of MTX2 was achieved according to the standard method developed by Wuthrich (1986). Selected spectra recorded at two different tempera- tures allowed to solve ambiguities in some spin systems due to overlapping of the resonance signals. The sequential connectivities were obtained from NOESY spectra recorded with a 150-ms mixing time in H20. Phenylalanine 25 was
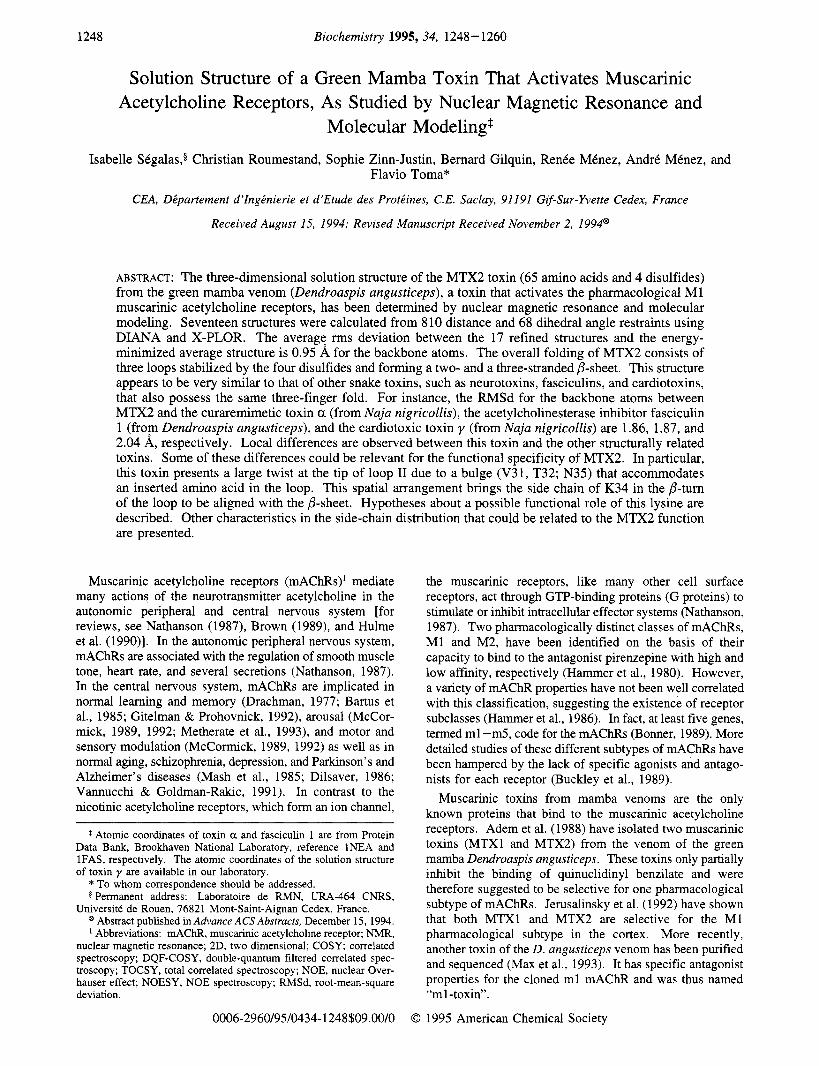
FIGURE 2: NOESY spectrum of MTX2 (600 MHz, 150-ms mixing time) recorded in H20 at pH 5.2 and 35 "C. The labels indicate the position of the NWHa COSY cross peaks. The sequential d a connectivities are shown for different regions (see text).
a convenient starting point for the signal assignments: first, only a single phenylalanine is present in the sequence and can be easily identified by its typical COSYNOESY patterns; second, although phenylalanine is replaced by a tyrosine in most neurotoxins and cardiotoxins, we found similar chemical shifts values for the NH and H a protons as in the assigned spectra of these toxins.
In the NOESY spectra of MTX2, sequential connectivities result essentially in a series of dm effects extending over long peptide stretches (Figure 1). By contrast, the observed sequential d~ effects involve only short segments of two or three residues (Figure 1). On this basis, the sequence- specific assignments could be achieved for the peptide fragments 2-17,19-32,34-46,48-53, and 55-65 (Figure
1252 Biochemistry, Vol. 34, No. 4, 1995 Segalas et al.
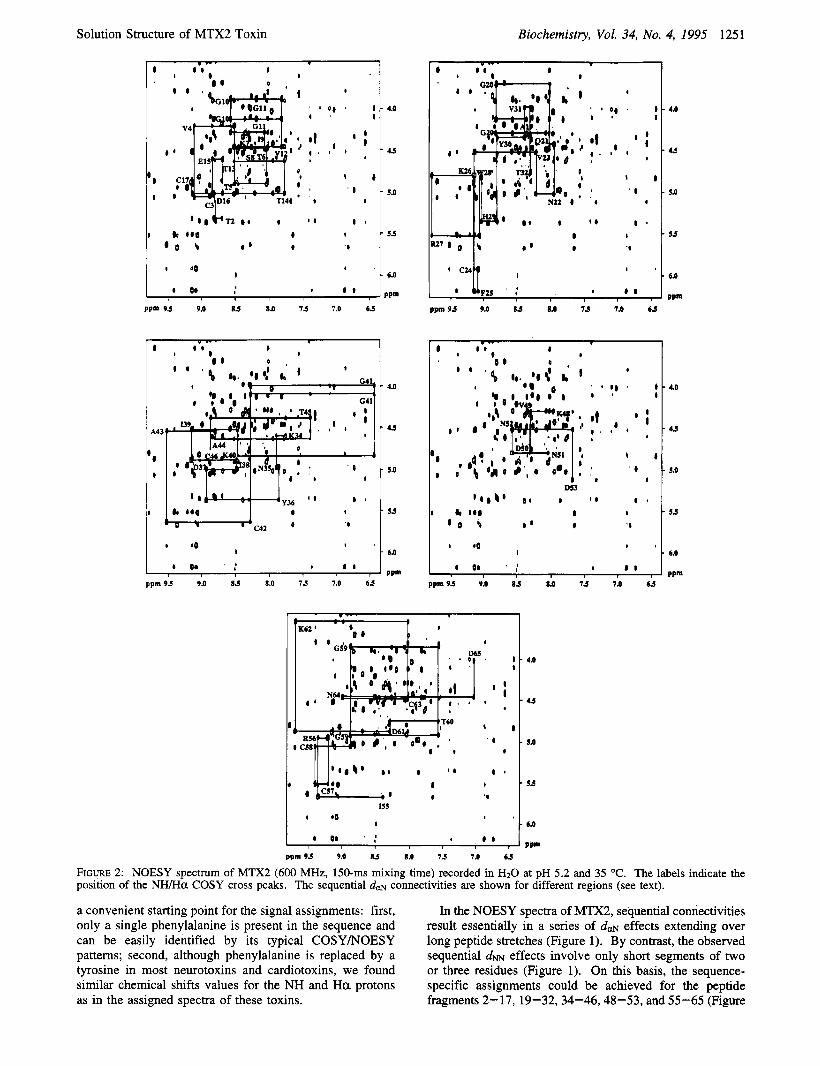
Table 1: Proton Chemical Shifts of MTX2 at 35 "C and pH 5.2" chemical shift (ppm)
a Shifts were measured f0.02 ppm relative to sodium 3-h.imethyl~ilyl-(2,2,3,3-~&)propionate.
2) with breaks due to proline residues at positions 18, 33, 47, and 54. The sequential assignment of these prolines was obtained by the strong NOE cross peaks observed between the &protons of each proline and the a-proton of the
preceding residue, and between the a-proton of the same proline and the backbone amide proton of the next residue. Thus all proton resonances of MTX2 could be assigned. The proton chemical shifts are listed in Table 1.
(€(total)) = -54.2 f 10.1 kcal mol-' (€(bond)) = 10.4 f 0.6 kcal mol-' (€(angle)) = 153.8 f 4.8 kcal mol-' (€(dihe)) = 85.4 f 3.2 kcal mol-' (€(improper) = 2.2 f 0.2 kcal mol-' (E(VdW)) = -332.6 f 5.3 kcal mol-' (€(elec)) = -0.1 f 0.3 kcal mol-'
Deviations from Experimental Restraintsb (E(N0E)) = 24.7 f 4.0 kcal mol-'; maximum violation = 0.4 8, (€(Cdihe)) = 2.0 f 0.6 kcal mol-'; maximum violation = 9.5"
Deviations from Idealized Geometry (RMSd(bond)) = 0.008 8, (RMSd(ang1e)) = 2.475" (RMSd(dihe)) = 21.645" (RMSd(improper)) = 0.227" "All the values are averaged on the 17 X-PLOR structures. The
force field used is parmallh3x, derived from the original CHARMM paraml9 file (Brooks et al., 1983). The van der Waals energy is calculated with a switched Lennard-Jones potential. The electric energy is calculated with a shifted Coulomb potential with a dielectric constant E = 80.0. "The values of the square-well NOE and dihedral angle potentials are calculated with force constants of 20 kcaV(mo1 A2) and 50 kcaV(mo1 rad2), respectively.
180
120
..
-180 -120 -60 0 60 120 180 phi
FIGURE 3: Ramachandran plot for all residues in the 17 X-PLOR structures. Glycine residues are indicated by open triangles.
Three-Dimensional Structure
Quality of the Structures. Table 2 contains all structural statistics of the 17 final structures calculated using 810 distance restraints and 68 angle restraints by the distance geometry and simulated annealing protocols described in Materials and Methods. The calculated structures are consistent with both the experimental data and the standard covalent geometry. The structures have no distance violation larger than 0.4 A and no @ and 21 angle violation larger than 10". Furthermore, the covalent geometry is respected, as shown by the low (RMSd) values for the bond lengths (0.008 A) and the valence angles (2.475"). The van der Waals energy is large and negative (average value, -332.6 kcaV mol), indicating that there is no bad nonbonded contact.
Analysis of the Ramachandran plot (Figure 3) shows that the (@,v) angle values of the calculated structures are in the allowed regions. Most residues are found in the p-strand region of the plot. Some residues have (@,I,!J) values falling
'p IO
Loop I1 Loop I1
FIGURE 4: Superposition of the backbone atoms (N, Ca, C) of the 17 solution structures of MTX2. (a) View showing the three loops and the five-strand /?-sheets; (b) side view, perpendicular to that of panel a. The position of the three loops is shown. N and C indicate the N- and C-terminal residues, respectively.
FIGURE 5: Schematic representation of the energy-minimized average structure of MTX2, showing the five /3-strands and disulfide arrangement (thin lines). The side chains of F25 and W28 residues (bold lines) are also shown, indicating their location on the opposite faces of the three-stranded /?-sheet (see text). The molecule is presented as in Figure 4a. The picture was generated by the MOLSCRIPT program (Kraulis, 1991).
in the a-helix region. These residues are located at the edges of the /3-sheets (V12, T13, V31, A44, D50, N51, and N52) or belong to a type I p-turn (P33, K34). In the 4 > 0 part of the plot is found K62 which is at position i+2 of a type I1 p-turn. The p-turns will be described in detail below. Finally, three of the five glycines (G10, G11, G20) are found in the specific glycine-allowed region. Only G41 and G59 are in a region of the plot allowed for most amino acids.
Description of the Backbone Structure. All the calculated structures of MTX2 possess a very similar backbone folding. The RMSd value for the coordinates of the backbone (N,
180 - I 1 I I I 1 I I I I " I 10 I Q Q -
6 - 8 e o 120 - Q! 60 - '8&*$ 0 - ............................................................................................................................................................................................... -
Ca, C') atoms averaged between the 17 structures, and the energy-minimized average structure is 0.95 A. Superposition of the backbone structures is shown in Figure 4a,b. The structure of MTX2 consists of three loops (I, I1,III) forming a relatively flat shaped (front view, Figure 4a), slightly bent (side view, Figure 4b) oblong disk.
The three loops (I, residues 1-17; 11, residues 24-42; 111, residues 46-58) form two antiparallel /?-sheets, as schemati- cally represented in Figure 5 . Loop I contains a double- stranded antiparallel 0-sheet involving residues T2-V4 @- strand) and residues T14-Dl6 Q2-strand) (see Figure 6 for the distribution of the &11) angles). Loops I1 and 111 contain a triple-stranded antiparallel /?-sheet v3-05 strands). Analy- sis of the (q411)) distribution (Figure 6) shows that the three 0-strands consist of the residues V23-Y30 @3-strand), Y36-A43 @4-strand), and P54-G59 VS-strand). The average values of the 4 and 11) angles for the five 0-strands are -118.9' f 27.0' and 139.5' f 31.1", respectively.
Five reverse turns are found in the MTX2 structure. Four of them, Le., K7-Gl0, P18-Q21, T32-N35, and D50- D53, connect the 01-/?5 strands while the last tum, T60- C63, is in the C-terminal part of the molecule. Table 3 presents the ($,11)) values of the well-Characterized turns. The turn (18-21), connecting loop I to loop 11, and the turn (60- 63) are type I1 /?-turns. The turn (32-35), on the tip of loop 11, is a type I 0-turn. The calculated structures present the i - i+3 hydrogen bond for these /?-turns, even though the WD exchange rate of the corresponding (i+3) amide protons was too fast to be measured, presumably due to the relatively high pH of the sample. The type of the turn could not be defined for the sequences 7-10 and 50-53, at the tips of
Table 3: Solution Structures of MTX2
Conformation of the Reverse Turns in the 17 Refined
turn type residue (d) ( u j )
18-21 II 19 -61.3' f 3.4' 152.9' f 7.0' 20 89.8" f 6.5" -39.5' f 5.5'
32-35 I 33 -65.9"f 2.1" -19.4" f 8.1' 34 -87.9' f 6.8' -25.3' i 6.0"
60-63 I1 61 -63.4' i 31.7' 132.8" f 4.6" 62 42.4" f 5.7" 28.4' f 12.1"
loop I and loop 111, respectively. A bulge is observed in the 03-strand between the sheet
and the turn (32-35): V31 presents (4) = -99.4' f 11.5' and (?$) = -41.4' f 1.1' over the 17 structures. These values are close to those found for a residue at position 1 in a classical bulge (Richardson et al., 1978; Chan et al., 1993). The calculated structures also present a bifurcated hydrogen bond between the carbonyl oxygen of N35 and the amide protons of V31 and T32. Finally, the side chains of V31, T32, and N35 point in the same direction. The bulge introduces a large twist between the turn at the tip of loop I1 and the 0-sheet (Figures 4 and 5). Moreover, the conjugated presence of the bulge and the regular type I 0-turn (32-35) puts the side chain of K34 in the continuation of loop 11.
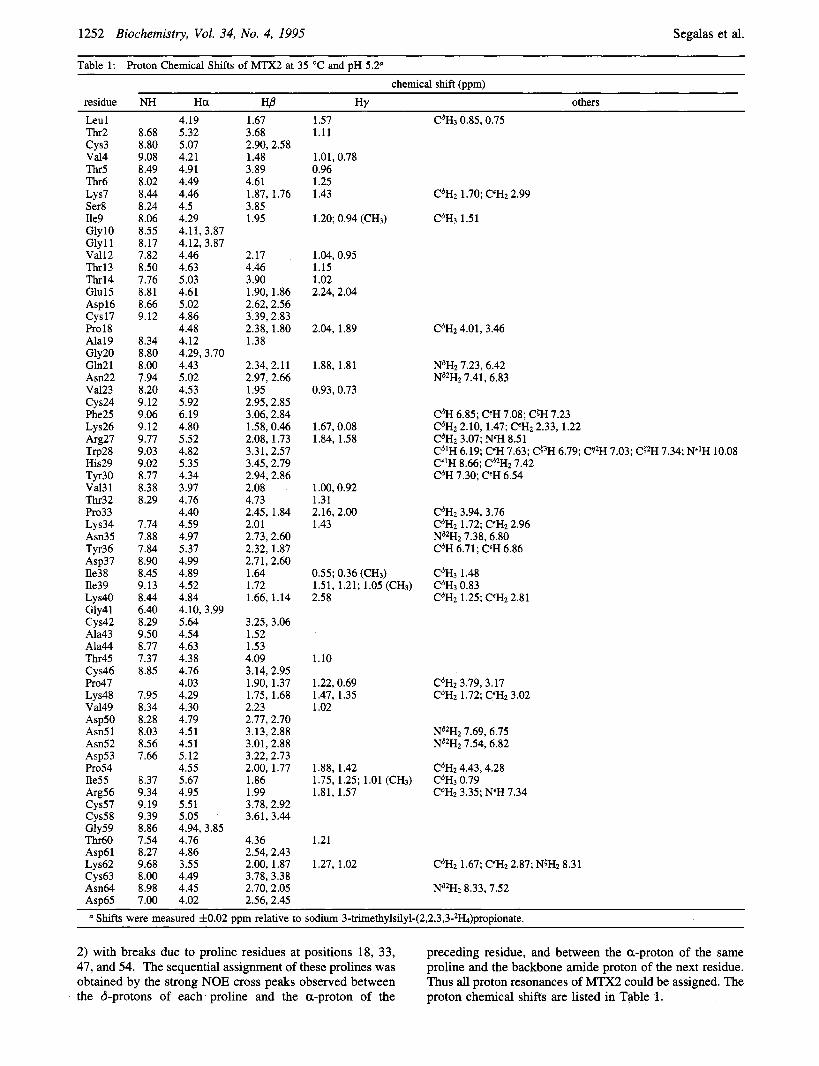
The average atomic RMS deviation for backbone atoms between the 17 calculated structures and the mean structure versus the residue number is shown in Figure 7b. The five 0-strands have the lowest (RMSd) (0.46 A) indicating a good definition of the structure in the corresponding regions: these present the highest number of NOE observed per residue (average number, 25 NOEkesidue) (Figure 7a). In contrast,
good defhtion of their side-chain orientation. These include the eight half-cystines and the residues belonging to the P-strands. The poorly defined side chains, with (RMSd) larger than 2 A, are mostly found in regions characterized also by large values of the backbone (RMSd) (Figure 7b). One exception is observed at the tip of loop I1 for residues K34 and N35, for which the x1 angles adopt different values (Figure 6).
Disulfides. Three of the four disulfides clearly contribute to stabilize the three loops: the disulfides (3, 24) and (17, 42) link loop I to loop 11, and the disulfide (46,57) stabilizes loop 111. The fourth disulfide (58, 63) connects the C-terminal part to loop III (Figures 5 and 8). The conforma- tions of the four disulfides are given by the values of the dihedral angles reported in Table 4. Although the 21 angles could be restrained only for four cysteines (C24, C42, C57, and C63) in the calculations, the disulfides appear t3 have well-defined conformations, due to the presence of numerous NOES (Figure 7a). The bridge (3, 24) has a left-handed conformation, which most frequently occurs in proteins (Richardson, 1981). The conformations of the other disulfide bridges are less common (Srinivasan et al., 1990).
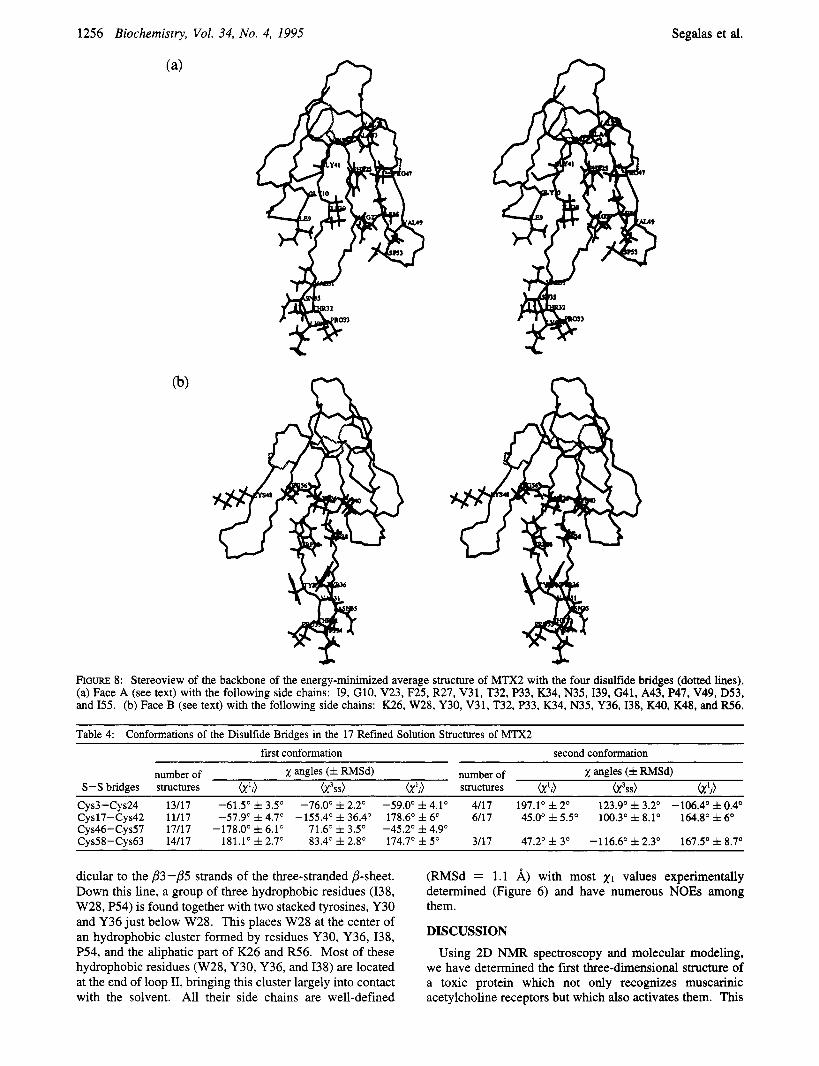
Interestingly, the disulfides (3, 24), (17,42), and (58, 63) are close to each other, being located on the same side of the three-stranded j3-sheet as the side chain of W28 (Figures 5 and 8). This allows to define two sides, i.e., face B for the side containing the three disdfides and W28, and face A for the opposite side, with different characteristics in the organization of the side chains (Figures 8a,b).
Face A . This face contains a large hydrophobic area comprising residues located essentially in the central part of the triple-stranded P-sheet (Figure 8a). These residues are distributed around F25 and include V23,139, G41, C42, A43, P47, 155, and the aliphatic part of R27. F25 presents numerous NOE with V23, R27,139, A43, and I55 side-chain protons, and with G41, C42, C57, and C58 backbone protons. The side chains of all these residues have well-defined orientations, as indicated by their low RMSd values ((RMSd) = 0.70 A, see Figure 7c), with all x1 values detennined experimentally (Figure 6). Such a central hydrophobic cluster has already been observed in the other snake toxins presenting a three-finger structure and is organized around a tyrosine which replaces the phenylalanine in MTX2 at thc top of loop I1 (Low & Corfield, 1986; Le Goas et al., 1992; Zinn-Justin et al., 1992; Gilquin et al., 1993). This cluster has been suggested to play a role in the stability of the upper part of loop I1 and may also be essential for the folding of this part of the molecule.
This hydrophobic cluster is flanked by the outer part of loop I11 (residues 48-53) and by the bottom of loop I (residues 4-9) (Figure 8a). For the first of these two parts, several residues have van der Waals contacts with R27 and I55 of the hydrophobic cluster (NOE between residues 53- 27 and 49-55). The second segment lies close to loop I1 in spite of the large backbone fluctuations (Figure 7b): backbond side-chain NOEs (between residues 5-40, 5-41,6-40, and 9-37) and backbonehackbone NOEs (between residues 5 and 41) bring the tip of loop I close to the j34-strand of loop 11.
Face B. The distribution of the side chains on this face is quite different compared to face A (Figure 8b). Four basic residues, i.e., K40, K26, R56, and K48, are spread across loops I1 and I11 following a line approximatively perpen-
50 1 I I t?
40 P,
30 B 1 20 5
10
0 1 5 10 1 5 20 25 30 35 40 4 5 50 5 5 60 65
residue
1 5 1 0 15 20 2 5 30 35 40 4 5 5 0 55 6 0 65
residue
1 5 10 1 5 20 25 30 35 40 45 50 55 60 65
residue
FIGURE 7: NOE constraints and average RMSd values of the seventeen X-PLOR structures. The structures were superimposed to the mean structure by minimizing the RMSd for the backbone atoms (N, Ca, and C). (a) Number of NOES per residue; all interresidue constraints are counted twice; plain bars, intraresidue NOEs; hatched bars, sequential NOEs; solid bars, long-range NOEs. (b) Average RMSd of the backbone structures (N, Ca, C). (c) Average RMSd of the side-chain atoms.
two segments present large (RMSd) values. (1) The tip of loop I (T6-T13) is the most poorly defined region with a (RMSd) value of 1.67 A. This is correlated with the small number of long-range interresidue NOE in this part of the molecule (average number, 10 NOEhesidue, Figure 7a). Strikingly, the turn of loop I presents two consecutive glycines (G10, G1 1) with very close Ha chemical shifts so that information about sequential (HN-Ha, connectivities (Figure 1) is missing as well as, obviously, side-chain NOEs. Analysis of the structures shows that the tip of loop I presents two different conformations. For 12 structures, the tip of the loop bends over loop I1 whereas it is twisted along loop I1 in the five remaining structures (Figure 4a’. (2) The second region showing a large (RMSd) value is (P47-D53) ((RMSd) = 1.44 A), which comprises the external strand of loop I11 (P47-V49), presenting no regular secondary struc- ture element, and the turn (D50-D53) that could not be characterized. Superposition of the backbone structures over the peptide segments ((1, 5) + (14,46) + (54,65)}, which skips the two poorly defined (6- 13) and (47-53) segments, yields a (RMSd) value of 0.51 A. Thus, except these two regions, the whole structure appears to be well-defined.
Description of the Side Chains. The (RMSd) value for all side chains in the refined structures is 1.27 A. Several residues have an even lower value (Figure 7c), indicating a
1256 Biochemistry, Vol. 34, No. 4, 1995
(4
Segalas et al.
FIGURE 8: Stereoview of the backbone of the energy-minimized average structure of MTX2 with the four disulfide bridges (dotted lines). (a) Face A (see text) with the following side chains: 19, G10, V23, F25, FU7, V31, T32, P33, K34, N35,139, G41, A43, P47, V49, D53, and 155. (b) Face B (see text) with the following side chains: K26, W28, Y30, V31, T32, P33, K34, N35, Y36,138, K40, K48, and R56.
Table 4: Conformations of the Disulfide Bridges in the 17 Refined Solution Structures of MTX2 f h t conformation second conformation
number of x angles (f RMSd) number of x angles (f RMSd) S-S bridges structures OI'O o13ss) W j ) structures &I i ) W S S ) (X'J
Cys3-Cy~24 13/17 -61.5' f 3.5' -76.0' f 2.2" -59.0' f 4.1" 4/17 197.1' f 2' 123.9' f 3.2" -106.4' f 0.4' Cy~17-Cys42 11/17 -57.9" f 4.7" -155.4' f 36.4" 178.6' f 6" 6/17 45.0' f 5.5" 100.3" f 8.1" 164.8' f 6' Cys46-Cys57 17/17 -178.0' f 6.1" 71.6" f 3.5" -45.2' f 4.9" Cy~58-Cy~63 14/17 181.1' f 2.7" 83.4" f 2.8' 174.7' f 5" 3/17 47.2' f 3' -116.6" f 2.3' 167.5' f 8.7"
dicular to the /?3-/?5 strands of the three-stranded /?-sheet. Down this line, a group of three hydrophobic residues (138, W28, P54) is found together with two stacked tyrosines, Y30 and Y36 just below W28. This places W28 at the center of an hydrophobic cluster formed by residues Y30, Y36, 138, P54, and the aliphatic part of K26 and R56. Most of these hydrophobic residues (W28, Y30, Y36, and 138) are located at the end of loop 11, bringing this cluster largely into contact with the solvent. All their side chains are well-defined
(RMSd = 1.1 A) with most x1 values experimentally determined (Figure 6) and have numerous NOES among them.
DISCUSSION Using 2D NMR spectroscopy and molecular modeling,
we have determined the first three-dimensional structure of a toxic protein which not only recognizes muscarinic acetylcholine receptors but which also activates them. This
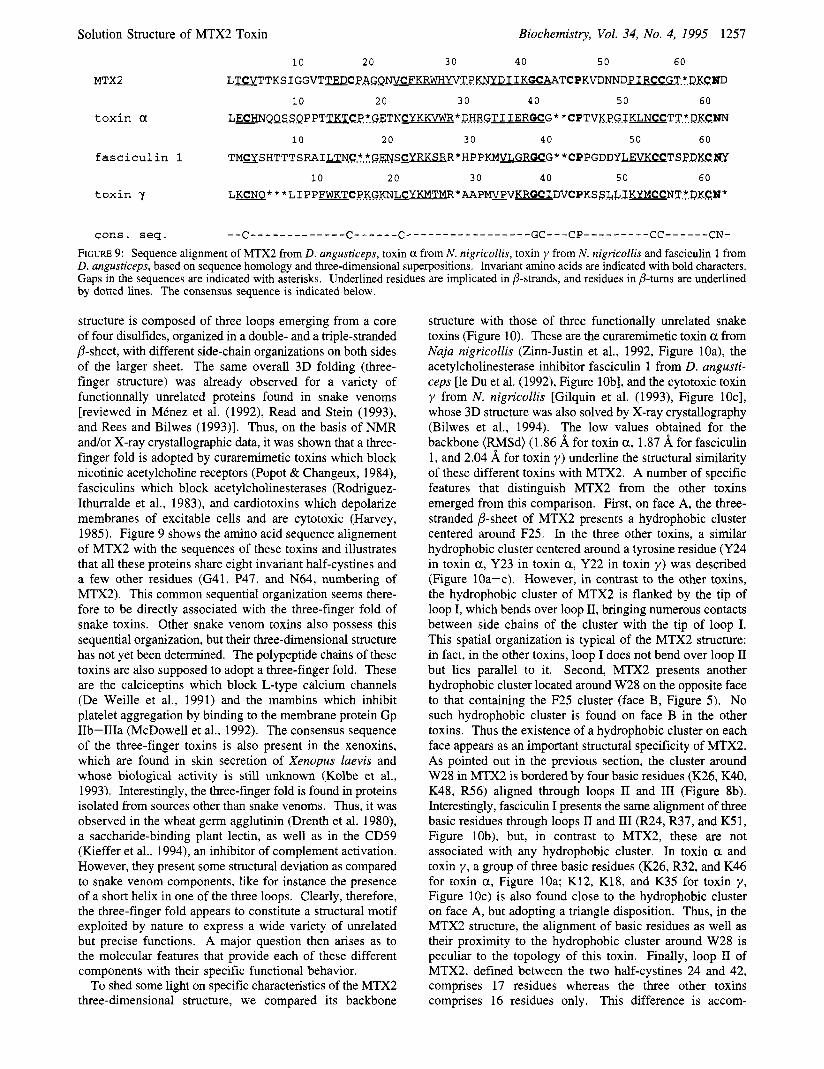
FIGURE 9: Sequence alignment of MTX2 from D. angusticeps, toxin a from N. nigricollis, toxin y from N. nigricollis and fasciculin 1 from D. angusticeps, based on sequence homology and three-dimensional superpositions. Invariant amino acids are indicated with bold characters. Gaps in the sequences are indicated with asterisks. Underlined residues are implicated in P-strands, and residues in /?-turns are underlined by dotted lines. The consensus sequence is indicated below.
structure is composed of three loops emerging from a core of four disulfides, organized in a double- and a triple-stranded @-sheet, with different side-chain organizations on both sides of the larger sheet. The same overall 3D folding (three- finger structure) was already observed for a variety of functionnally unrelated proteins found in snake venoms [reviewed in Mtnez et al. (1992), Read and Stein (1993), and Rees and Bilwes (1993)l. Thus, on the basis of NMR and/or X-ray crystallographic data, it was shown that a three- finger fold is adopted by curaremimetic toxins which block nicotinic acetylcholine receptors (Popot & Changeux, 1984), fasciculins which block acetylcholinesterases (Rodriguez- Ithurralde et al., 1983), and cardiotoxins which depolarize membranes of excitable cells and are cytotoxic (Harvey, 1985). Figure 9 shows the amino acid sequence alignement of MTX2 with the sequences of these toxins and illustrates that all these proteins share eight invariant half-cystines and a few other residues (G41, P47, and N64, numbering of MTX2). This common sequential organization seems there- fore to be directly associated with the three-finger fold of snake toxins. Other snake venom toxins also possess this sequential organization, but their three-dimensional structure has not yet been determined. The polypeptide chains of these toxins are also supposed to adopt a three-finger fold. These are the calciceptins which block L-type calcium channels (De Weille et al., 1991) and the mambins which inhibit platelet aggregation by binding to the membrane protein Gp IIb-IIIa (McDowell et al., 1992). The consensus sequence of the three-finger toxins is also present in the xenoxins, which are found in skin secretion of Xenopus laevis and whose biological activity is still unknown (Kolbe et al., 1993). Interestingly, the three-finger fold is found in proteins isolated from sources other than snake venoms. Thus, it was observed in the wheat germ agglutinin (Drenth et al. 1980), a saccharide-binding plant lectin, as well as in the CD59 (Kieffer et al., 1994), an inhibitor of complement activation. However, they present some structural deviation as compared to snake venom components, like for instance the presence of a short helix in one of the three loops. Clearly, therefore, the three-finger fold appears to constitute a structural motif exploited by nature to express a wide variety of unrelated but precise functions. A major question then arises as to the molecular features that provide each of these different components with their specific functional behavior.
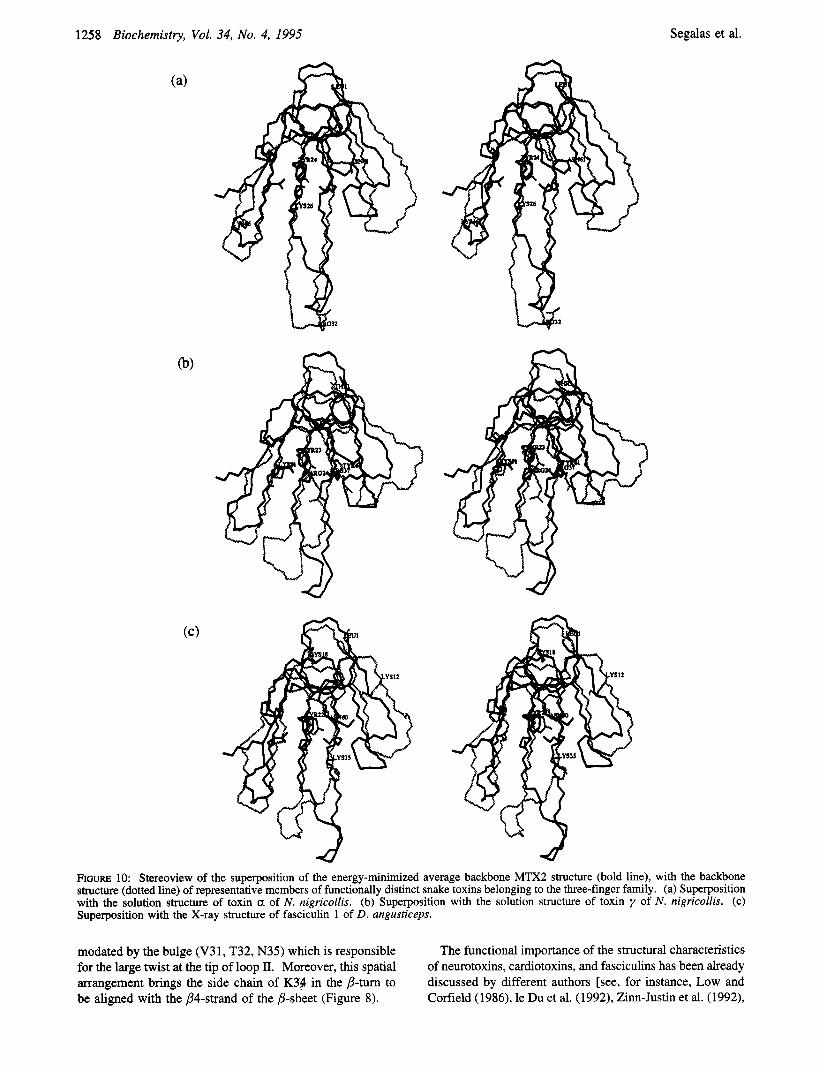
To shed some light on specific characteristics of the MTX2 three-dimensional structure, we compared its backbone
structure with those of three functionally unrelated snake toxins (Figure 10). These are the curaremimetic toxin a from Naja nigricollis (Zinn-Justin et al., 1992, Figure loa), the acetylcholinesterase inhibitor fasciculin 1 from D. angusti- ceps [le Du et al. (1992), Figure lob], and the cytotoxic toxin y from N. nigricollis [Gilquin et al. (1993), Figure lOc], whose 3D structure was also solved by X-ray crystallography (Bilwes et al., 1994). The low values obtained for the backbone (RMSd) (1.86 8, for toxin a, 1.87 8, for fasciculin 1, and 2.04 8, for toxin y ) underline the structural similarity of these different toxins with MTX2. A number of specific features that distinguish MTX2 from the other toxins emerged from this comparison. First, on face A, the three- stranded @-sheet of MTX2 presents a hydrophobic cluster centered around F25. In the three other toxins, a similar hydrophobic cluster centered around a tyrosine residue (Y24 in toxin a, Y23 in toxin a, Y22 in toxin y ) was described (Figure loa-c). However, in contrast to the other toxins, the hydrophobic cluster of MTX2 is flanked by the tip of loop I, which bends over loop 11, bringing numerous contacts between side chains of the cluster with the tip of loop I. This spatial organization is typical of the MTX2 structure: in fact, in the other toxins, loop I does not bend over loop I1 but lies parallel to it. Second, MTX2 presents another hydrophobic cluster located around W28 on the opposite face to that containing the F25 cluster (face B, Figure 5). No such hydrophobic cluster is found on face B in the other toxins. Thus the existence of a hydrophobic cluster on each face appears as an important structural specificity of MTX2. As pointed out in the previous section, the cluster around W28 in MTX2 is bordered by four basic residues (K26, K40, K48, R56) aligned through loops I1 and I11 (Figure 8b). Interestingly, fasciculin I presents the same alignment of three basic residues through loops I1 and I11 (R24, R37, and K51, Figure lob), but, in contrast to MTX2, these are not associated with any hydrophobic cluster. In toxin a and toxin y , a group of three basic residues (K26, R32, and K46 for toxin a, Figure loa; K12, K18, and K35 for toxin y , Figure 1Oc) is also found close to the hydrophobic cluster on face A, but adopting a triangle disposition. Thus, in the MTX2 structure, the alignment of basic residues as well as their proximity to the hydrophobic cluster around W28 is peculiar to the topology of this toxin. Finally, loop I1 of MTX2, defined between the two half-cystines 24 and 42, comprises 17 residues whereas the three other toxins comprises 16 residues only. This difference is accom-
1258 Biochemistry, Vol. 34, No. 4, 1995 Segalas et al.
FIGURE 10: Stereoview of the superposition of the energy-minimized average backbone MTX2 structure (bold line), with the backbone structure (dotted line) of representative members of functionally distinct snake toxins belonging to the three-finger family. (a) Superposition with the solution structure of toxin a of N . nigricollis. (b) Superposition with the solution structure of toxin y of N . nigricollis. (c) Superposition with the X-ray structure of fasciculin 1 of D. nngusticeps.
modated by the bulge (V31, T32, N35) which is responsible for the large twist at the tip of loop II. Moreover, this spatial arrangement brings the side chain of K34 in the &turn to be aligned with the B6strand of the @-sheet (Figure 8).
The functional importance of the structural characteristics of neurotoxins, cardiotoxins, and fasciculins has been already discussed by different authors [see, for instance, Low and Cofield (1986), le Du et al. (1992), Zinn-Justin et al. (1992),
Solution Structure of MTX2 Toxin
Gilquin et al. (1993), and references cited therein]. Is it also possible to relate the above structural features with the specific function of MTX2?
Hypotheses on the Binding Site of M l X 2 on mAChR. Jerusalinsky et al. (1993) have recently shown that MTX2 has an agonist action for the pharmacological M1 mAChRs. Models of two out of the five cloned mAChR subtypes have been published (ml: Nordvall & Hacksell, 1993; m2: Hibert et al., 1991, 1993; Trumpp-Kallmeyer et al., 1992). Both were built on the basis of the putative three-dimensional structural analogy between bacteriorhodopsin and G-protein coupled receptors. According to this model, these receptors include seven tightly packed transmembrane a-helices defin- ing a narrow 20 8, deep cleft. Based on site-directed mutagenesis and chemical modification studies, a binding site for muscarinic agonists located close to the bottom of the cleft has been proposed by the groups working on the models. This agonist-binding site contains an aspartate which should counter the ammonium cation present in most muscarinic agonists. Hibert et al. (1993) indicate that the aspartate is located at about 15 8, from the cleft entry.
Examination of the MTX2 structure suggests that the side chain of K34, at the tip of loop 11, may play the role of the ammonium cation of the agonist ligands. Actually, most basic residues of MTX2 are poorly accessible to the solvent and are located in the middle of the loops. On the opposite, K34 is located at the tip of the most protuding loop and is therefore in a favorable position to interact with the aspartate at the bottom of the cleft. Moreover, the side chain of K34 is oriented in the alignment of the P4-strand of loop 11, which could place the charged amino group of this residue near the bottom of the cleft. With the assumption that loop I1 enters into the narrow cleft, bringing the tips of the adjacent loops I and I11 close to the external borders of the cleft, the measured distance between the backbone nitrogen of D37, which corresponds to the cleft entry, and NC of K34 in the average structure is 14 8,. This value is in agreement with the 15 8, distance described for the agonist binding site in mAChRs.
Interestingly, K34 belongs to loop I1 which carries the hydrophobic cluster organized around W28 and located near the group of four basic residues, an organization typical of MTX2 and differentiating it from the other toxins. The question now arises whether some side chains of these regions of MTX2 establish interactions with residues of the receptor. Further work is now needed to check the possible role of these regions in the binding.
It may be noticed that, among the other three-finger toxins compared above with MTX2, only the curaremimetic toxins present a conserved Arg instead of K34 in MTX2, also located in a regular P-turn at the tip of loop 11. Contrary to K34 of MTX2, this Arg residue is not found in the alignment of the P-strand of the loop. This arginine has been shown to belong to the toxic site of the curaremimetic toxins (Pillet et al., 1993). In contrast, fasciculin 1 and toxin y possess a Pro residue (not conserved in all cardiotoxins) in the same position as K34 of MTX2, in a ill-defined bend at the tip of loop 11. In these toxins, no functional role has been defined until now for this region of the molecule.
In conclusion, a new member of the three-finger motif family with a distinct biological function has been revealed by the determination of the solution structure of MTX2, an agonist of the mAChRs. The structural features of this toxin
Biochemistry, Vol. 34, No. 4, 1995 1259
suggest hypotheses about the localization of the binding site to the muscarinic acetylcholine receptors: further experi- mental data are now needed to c o n f m these hypotheses and to identify the side chains involved in the binding to the receptor.
ACKNOWLEDGMENT
We thank Dr. C. Vita for stability experiments and Dr. P. Cuniasse for helpful and stimulating discussions. The program DIANA was provided by Prof. K. Wiithrich and the program X-PLOR by Dr. A. Briinger.
REFERENCES
Adem, A., Asblom, A., Johansson, G., Mbugua, P. M., & Karlsson, E. (1988) Biochim. Biophys. Acta 968, 340-345.
Baker, E. N., & Hubbard, R. E. (1984) Prog. Biophys. Mol. Biol. 44, 97-179.
Bartus, R. T., Dean, R. L., Pontecorvo, M. J., & Flicker, C. (1985) Ann. N.Y. Acad. Sci. 444, 332-358.
Bilwes, A., Rees, B., Moras, D., MBnez, R., & MBnez, A. (1994) J. Mol. Biol. 239, 122-136.
Bonner, T. I. (1989) Trends Pharmacol. Sci. [Suppl. (Subtype of muscarinic receptors IV)], 11-15.
Brooks, B. R., Bruccoleri, R. E., Olafson, B. D., States, D. J., Swaminathan, S., & Karplus, M. (1983) J . Comput. Chem. 4, 187-217.
Brown, J. H. (1989) The Muscarinic Receptors, The Humana Press, Clifton, NJ.
Briinger, A. T. (1992) X-PLOR version 3.1: A System for X-ray Crystallography and NMR, Yale University Press, New Haven and London.
Briinger, A. T., Kuriyan, K., & Karplus, M. (1987) Science 235, 45 8-460.
Buckley, N. J., Bonner, T. I., Buckley, C. M., & Brann, M. R. (1989) Mol. Pharmacol. 35, 469-476.
Chan, E. A. W., Hutchinson, G. E., Harris, D., & Thornton, J. M. (1993) Protein Sci. 2 , 1574-1590.
Davis, D. G., & Bax, A. (1985) J . Am. Chem. SOC. 107,2820- 2821.
De Weille, J. R., Schweitz, H., Maes, P., Tartar, A., & Lazdunski, M. (1991) Proc. Natl. Acad. Sci. USA. 88,2437- 2440.
Dilsaver, S. C. (1986) Brain Res. Rev. 11, 285-316. Drachman, D. A. (1977) Neurology 27, 783-790. Drenth, J., Low, B. W., Richardson, J. S. , &Wright, C. S. (1980)
Ducancel, F., Rowan, E. G., Cassar, E., Harvey, A. L., MCnez,
Gilquin, B., Roumestand, C., Zinn-Justin, S., MCnez, A., &
Gippert, G. P., Yip, P. F., Wright, P. E., & Case, D. A. (1990)
Gitelman, D. R., & Prohovnik, I. (1992) Neurobiol. Aging 13,
Guntert, P., Braun, W., & Wuthrich, K. (1991) J . Mol. Biol.
Hammer, R., Beme, C. P., Birdsall, N. J. M., Burgen, A. S. V.,
Hammer, R., Giraldo, E., Schiavi, G. B., Montefereni, E., &
Harvey, A. L. (1985) J. Toxicol. Toxin Rev. 4, 41-69. Hibert, M. F., Trumpp-Kallmeyer, S., Bruinvels, A., & Hoflack,
Hibert, M. F., Hoflack, J., Trumpp-Kallmeyer, S., & Bruinvels,
Hulme, E. C., Birdsall, N. J . M., & Buckley, N. J . (1990) Annu.
J . Biol. Chem. 255, 2652-2655.
A., & Boulain, J.-C. (1991) Toxicon 29, 516-520.
Toma, F. (1993) Biopolymers 33, 1659-1675.
Biochem. Pharmacol. 40, 15-22.
313-318.
217, 517-530.
& Hulme, E. C. (1980) Nature 283, 90-92.
Ladinsky, H. (1986) Life Sci. 38, 1653-1662.
J. (1991) Mol. Phamzacol. 40, 8-15.
A. (1993) (in French) MtWSci. 9, 3 1-40.
Rev. Pharmacol. Toxicol. 30, 633-673.
1260 Biochemistry, Vol. 34, No. 4, 1995
Hyberts, S. G., Miirki, W., & Wagner, G. (1987) Eur. J . Biochem. 164, 625-635.
Jerusalinsky, D., Cervenansky, C., Pena, C., Raskovsky, S., & Dajas, F. (1992) Neurochem. Int. 20, 237-246.
Jerusalinsky, D., Cervenansky, C., Walz, R., Bianchin, M., & Izquierdo, I. (1993) Eur. J Pharm. 240, 103-105.
Karplus, M. (1963) J . Am. Chem. SOC. 85, 2870-2871. Karlsson, E., Risinger, C., Jolkkonen, M., Wemstedt, C., &
Adem, A. (1991) Toxicon 29, 521-526. Kieffer, B., Driscoll, P. C., Campbell, I. D., Willis, A. C., van
der Menve, A. P., & Davis, S. J. (1994) Biochemistry 33, 447 1-4482.
Kolbe, H. V. J., Huber, A., Cordier, P., Rasmussen, U. B., Bouchon, B., Jaquinod, M., Vlasak, R., DClot, E. C., & Kreil, G. (1993) J . Biol. Chem. 268, 16458-16464.
Kraulis, P. (1991) J . Appl. Crystallogr. 24, 946-950. Kumar, A., Emst, R. R., & Wiithrich, K. (1980) Biochem.
Biophys. Res. Commun. 64, 2229-2246. le Du, M. H., Marchot, P., Bougis, P. E., & Fontecilla-Camps,
J. C. (1792) J . Biol. Chem. 267, 22122-22130. Le Goas, R., LaPlante, S. R., Mikou, A., Delsuc, M.-A., Guittet,
E., Robin, M., Charpentier, I., & Lallemand, J.-Y. (1992) Biochemistry 31,4867-4875.
Low, B. W., & Corfield, P. W. R. (1986) Eur. J . Biochem. 161, 579-587.
Mash, D. C., Flynn, D. D., & Potter, L. T. (1985) Science 228, 1115-1117.
Max, S. I., Liang, J.-S., & Potter, L. T. (1993) J . Neurosci. 13, 4293-4300.
McCormick, D. A. (1989) Trends Neurosci. 12, 215-221. McCormick, D. A. (1992) Prog. Neurobiol. 39, 337-388. McDowell, R. S., Dennis, M. S., Louie, A., Shuster, M.,
Mulkemn, M. G., & Lazarus, R. A. (1992) Biochemistry 31, 4766-4772.
MCnez, A., Bontems, F., Roumestand, C., Gilquin, B., & Toma, F. (1992) Proc. R. SOC. Edinburgh 99B, 83-103.
Metherate, R., Cox, C. L., & Ashe, J. H. (1993) J. Neurosci. 12,4701-4711.
Nathanson, N. M. (1987) Annu. Rev. Neurosci. 10, 195-236. Nilges, M., Gronenbom, A. M., Briinger, A. T., & Clore, G.
Nordvall, G., & Hacksell, U. (1993) J. Med. Chem. 36, 967- M. (1988) Protein Eng. 2 , 27-38.
976.
Segalas et al.
Pardi, A., Billeter, M., & Wiithrich, K. (1984) J . Mol. Biol. 180, 741-751.
Pillet, L., Trtmeau, O., Ducancel, F., Drevet, P., Zinn-Justin, S., Pinkasfeld, S., Boulain, J. C., & MCnez, A. (1993) J. Biol. Chem. 268, 909-916.