42
5 - 1 Solutions Assessment: Land Use and Offsets Report of Working Group 5 January 2021

5 - 1
Solutions Assessment: Land Use and Offsets
Report of Working Group 5
January 2021

5 - 2
Working Group Membership
Richard Lathrop, Co-Chair, School of Environmental and Biological Sciences, Rutgers-New Brunswick
Frank Wong, Co-Chair, Institutional Planning and Operations
Myla Aronson, School of Environmental and Biological Sciences, Rutgers–New Brunswick Alvin Chin, Bloustein School of Planning and Public Policy, Rutgers–New Brunswick Brian Clemson, Institutional Planning and Operations Julia DeFeo, College of Arts and Sciences, Rutgers -Camden Panos Georgopulos, School of Public Health, Rutgers Biomedical and Health Sciences Paul Gottlieb, School of Environmental and Biological Sciences, Rutgers–New Brunswick Pat Harrity, Institutional Planning and Operations Marjorie Kaplan, Rutgers Climate Institute Karina Schäfer, School of Arts and Sciences, Rutgers–Newark Laura Schneider, School of Arts and Sciences, Rutgers–New Brunswick Fiona Sergeant, School of Environmental and Biological Sciences, Rutgers–New Brunswick
5 - 3
Table of Contents EXECUTIVE SUMMARY ....................................................................................................................... 4 5.1. Rutgers’ current baseline ............................................................................................................. 5 5.1.1. Rutgers’ greenhouse gas emissions due to land use ........................................................................................... 5 5.1.2. Rutgers’ climate vulnerabilities .......................................................................................................................... 10 5.1.3. Ongoing activities to reduce emissions and vulnerabilities............................................................................... 10 5.1.4. Related ongoing educational, research, and service activities .......................................................................... 10 5.2. Overview of potential climate solutions ..................................................................................... 11 5.2.1. Potential solutions ............................................................................................................................................. 11 5.2.2. Stakeholder input ............................................................................................................................................... 12 5.2.3. Opportunities for action in the current academic year ..................................................................................... 12 5.3. Assessments of potential climate solutions ................................................................................ 13 5.3.1 On campus and off campus facilities grounds .................................................................................................... 13 5.3.2. Financial costs and savings................................................................................................................................. 28 5.3.3. Benefits to the University’s educational and research mission and to campus culture ................................... 30 5.3.4. Other Co-Benefits............................................................................................................................................... 31 5.3.5. Implementation Plan and Timescale.................................................................................................................. 32 5.3.6. Needed research and planning .......................................................................................................................... 33 5.3.7. Evaluation plan ................................................................................................................................................... 33 5.3.8. Management roles ............................................................................................................................................. 34 5.3.9. Institutional, Organizational and Cultural Challenges to Implementation ........................................................ 34 5.3.10. Participation and Accountability ...................................................................................................................... 35 5.3.11. Contribution to Climate-Positive, Equitable, Sustainable Economic Development ........................................ 35 5.3.12. Equity Concerns ............................................................................................................................................... 36 APPENDIX A – References ................................................................................................................ 38 A.1. Land Use References ............................................................................................................................................. 38 A.2. Offsets References ................................................................................................................................................ 38 APPENDIX B – Land Use and Offset actions proposed as part of other Big10 and peer institutions plans
42
5 - 4
EXECUTIVE SUMMARY As the State University and as a Land Grant Institution, Rutgers University has facilities spanning the state
that include 91 discrete locations over 6,600 acres. While many of these locations are quite urban in
character (i.e., many of the office buildings and health care facilities associated with Rutgers Biomedical and
Health Sciences), Rutgers manages nearly 1,500 acres of farm land, 2,500 acres of forest land and over 600
acres of wetlands. Within the three main campuses of Camden, Newark and New Brunswick are lawns,
treed areas and landscaped spaces covering over 500 acres. These 5,100 acres (or nearly 8 sq. miles) of
“green space” land should be factored into any plan for the University to reach carbon neutrality by 2050.
Accordingly, we propose possible avenues for the University to reduce greenhouse gas emissions associated
with University land use and maintenance, increase carbon storage and reduce methane emission on
University land, and reduce the University’s energy demand through enhanced design of future land use
development. More specifically, we propose a number of “carbon defense” strategies to maintain the
existing stores of carbon in the soils, above- & below-ground plant biomass, and “carbon offense” strategies
to promote enhanced carbon capture potential (i.e., additional amounts above and beyond baseline
conditions). Our research suggests that there are existing off-site carbon offset policies and programs that
could be adopted as an additional means of achieving carbon neutrality.
The inventory of present on-campus grounds and on-campus New Jersey Agricultural Experiment Station
(NJAES) farm operations and maintenance practices was undertaken. Information about baseline
greenhouse gas emissions were compiled and input to SIMAP to estimate the amount of carbon and
equivalent CO2 emitted. The total annual CO2 equivalent emissions for the NJAES On-Campus Farms
and the University Golf Course (the only component of campus ground maintenance where sufficient
records were kept) is approximately 541 MT/year. These data are incomplete and enhanced record
keeping is vital if we are to establish our baseline and chart our progress in reducing our emissions. To
initiate this campus green space sustainability effort, approximately 25 acres of the New Brunswick-
Piscataway campus lawns were converted to no/eco-mow zones. Replacement of a traditional lawn with
what are termed eco- or low mow zones greatly reduced the frequency of mowing to one annually thereby
reducing gasoline combustion emissions, as well as decreasing the amount of fertilizer, herbicide, and
irrigation expended. Potential afforestation (tree planting) projects on campus and outlying properties were
identified with a sum total CO2 equivalent storage of 14,680 MT.
Current prices for voluntary carbon offsets have been cited to range from <$1 to >$50 per credit for one
metric ton of CO2e. Prices of voluntary offsets vary widely based on the type of project, its location, its co-
benefits, and the year in which the carbon emissions reductions occur. A collaboration of higher
educational institutions has developed the Offset Network to provide educational and research
opportunities that can result in novel offset protocols as well as cost reductions through implementation of a
peer verification pathway. This voluntary approach provides an alternative pathway for institutions of higher
education to realize voluntary offsets for up to 30% of their Scope 3 emissions through peer-verified offset
projects. As a member of the University Climate Change Coalition (UC3), Rutgers is under no obligation to
follow Offset Network protocols or standards or to become a network member; however, Rutgers can
benefit from engagement with the Offset Network.
5 - 5
5.1. Rutgers’ current baseline
5.1.1. Rutgers’ greenhouse gas emissions due to land use Information about baseline greenhouse gas emissions was compiled for several different components
related to Rutgers University Land Use. Where possible we employed the SIMAP analysis to estimate the
amount of carbon and equivalent CO2 emitted.
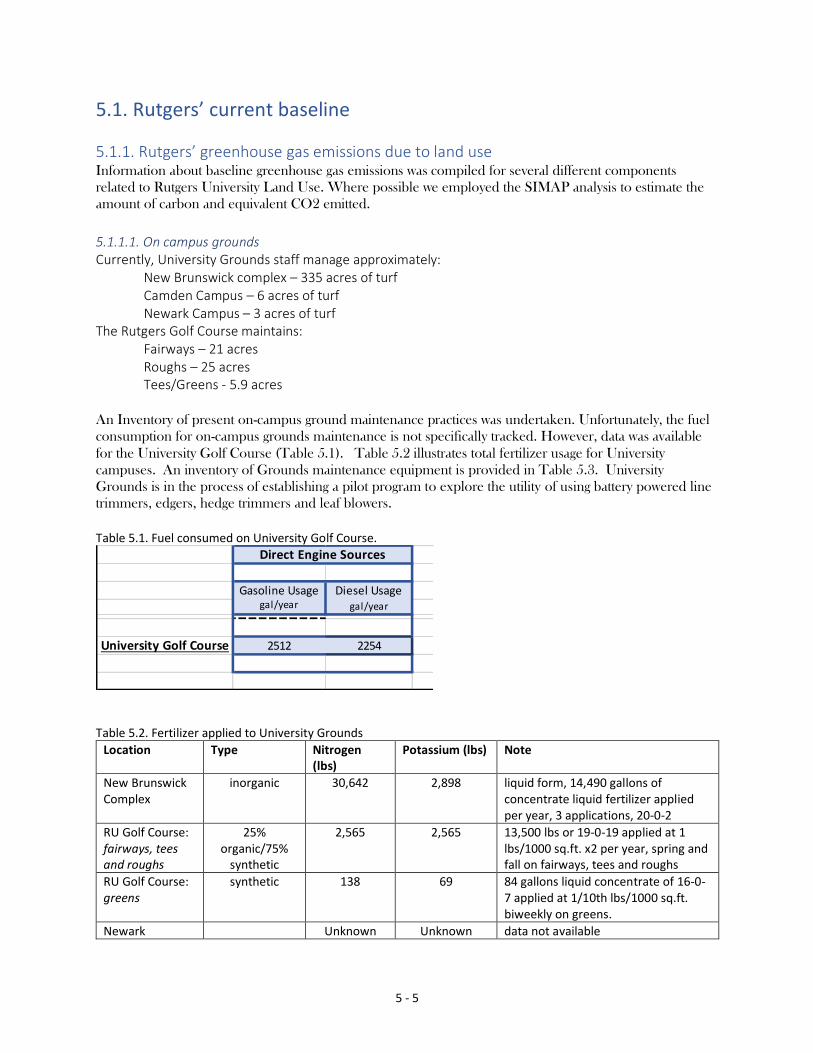
5.1.1.1. On campus grounds Currently, University Grounds staff manage approximately:
New Brunswick complex – 335 acres of turf Camden Campus – 6 acres of turf Newark Campus – 3 acres of turf
The Rutgers Golf Course maintains: Fairways – 21 acres Roughs – 25 acres Tees/Greens - 5.9 acres
An Inventory of present on-campus ground maintenance practices was undertaken. Unfortunately, the fuel
consumption for on-campus grounds maintenance is not specifically tracked. However, data was available
for the University Golf Course (Table 5.1). Table 5.2 illustrates total fertilizer usage for University
campuses. An inventory of Grounds maintenance equipment is provided in Table 5.3. University
Grounds is in the process of establishing a pilot program to explore the utility of using battery powered line
trimmers, edgers, hedge trimmers and leaf blowers.
Table 5.1. Fuel consumed on University Golf Course.
Table 5.2. Fertilizer applied to University Grounds
Location Type Nitrogen (lbs)
Potassium (lbs) Note
New Brunswick Complex
inorganic 30,642 2,898 liquid form, 14,490 gallons of concentrate liquid fertilizer applied per year, 3 applications, 20-0-2
RU Golf Course: fairways, tees and roughs
25% organic/75%
synthetic
2,565 2,565 13,500 lbs or 19-0-19 applied at 1 lbs/1000 sq.ft. x2 per year, spring and fall on fairways, tees and roughs
RU Golf Course: greens
synthetic 138 69 84 gallons liquid concentrate of 16-0-7 applied at 1/10th lbs/1000 sq.ft. biweekly on greens.
Newark Unknown Unknown data not available
Gasoline Usage Diesel Usage N-P-K/Type Synth/Org lb/yr % N lb Ngal/year gal/year
University Golf Course 2512 2254 Hybrid fertilizer - 25% synth synth 3375 19 641.25
75% org org 10125 19 1923.75
Direct Engine Sources Fertilizer Application

5 - 6
Camden synthetic 90 9 Liquid concentrate, 448 gallons, yearly, 20-0-2 20% Slow Release Nitrogen
Table 5.3 Inventory of Grounds Maintenance Equipment and Fuel Type Consumed
Equipment Type Gasoline Diesel Electric 2 Cycle Gasoline New Brunswick
Backpack and hand held blowers 1 96
Line Trimmers 99
Lawn Edger 29
Hedge Trimmers 7 34 Chain Saws 1 14
Riding mowers 73
Push Mowers 30
Snow Plow (dedicated - Bomadier type)
1
Salt Spreaders 27 Skid Steer 2
Tractor/Loader 2
Litter Vacuum (Tennant - small) 1
Leaf Vac 7
Power Washer 9
Utility Vehicle 4 Trucks p/u 6
Camden
Backpack and hand held blowers 10
Line Trimmers 6
Hedge Trimmers 2
Chain Saws 3 Riding mowers 3
Walk behind Large mower 1
Push Mowers 2
De-Thatcher 1
Aerator – walk behind 1
Snow Blowers 4 Skid Steer 1
Tractor/Loader 1
Street Sweeper 1
Litter Vacuum (dedicated - Tennant type)
Leaf Vacuum 1 Kubota Utility Vehicle 5
Trucks p/u 3
Rack/Dump truck 1
Electric Vehicles – Gem Carts 7
Newark
Backpack and hand held blowers 2 11
Line Trimmers 7
Lawn Edger 2
Hedge Trimmers

5 - 7
Chain Saws 3
Walk behind Large mower 3 Push Mowers 4
Aerator – walk behind 1
Snow Blowers 10
Salt Spreaders 17 3
Salt Spreaders (truck mounted) 2
RU Golf Course Backpack and hand held blowers 4
Line Trimmers 5
Chain Saws 2
Riding mowers 6 10
Push Mowers 1
Utility Vehicle 10 Electric Vehicles Carts 3
5.1.1.2. NJ Agricultural Experiment Station Farms and Research Stations An Inventory of present on-campus farm operations and maintenance practices was undertaken. Off-
campus farms or research stations were not inventoried. The Inventory included: o Annual energy consumption from utility bills (Table 5.4);
o Inventory of farm machinery and fuel type consumed (Table 5.5)
o Annual diesel/gasoline consumption in vehicles and equipment (i.e. gallons of fuel
consumed) (Table 5.6);
o Number of head of livestock and manure production (Table 5.7).
Table 5.4 Table of energy use for on-campus NJAS farm facilities.
Table 5.5. Inventory of NJAES farm machinery and fuel type consumed
KWH/year Therms/year
Hort Farms 1 213293 28396.19
Hort Farm 2
Hort Farm 3 84790 17926.78
Cook Campus Farm
Hazelnut + Dogwood
Research Nursery
Energy Usage
unreported
unreported

5 - 8
Table 5.6. NJAES farms’ diesel/gasoline consumption from vehicles and equipment and fertilizer application
Equipment & Vehicles Gasoline Diesel Electric 2 Cycle Gasoline
Hort Farm 2 Tractors 1 2
Truck 1
Mowers 13 7Field Prep Equip. Roto Tilers 3 1
Utility Vehicles & Golf Carts 13 1
Sprayers 1 2
Unique Research Equip. 5Backpack Blower + Turbine 1 1 4
Chainsaw 1
String & Hedge Trimmers 1 1
Generator 1
Irrigation Pumps (Pumphouse) 460 V 1 3
Mechanic Shop EquipmentAir Compressor 220V 1
Parts Cleaner 110V 1
Blade & Reel Grinders 110V 3
Golf Cart Lift 110V 1
Winch 110V 1
Metal Chop Saw 110V 1
Drill Press 110V 1
Bench Grinder 110V 1
Fan 110V 2
Oil Suction Pump 110V 1
Band Saw 220V 1
Water Heater 110V 1
Cook Campus Farm Heavy Duty Diesel Pickup Truck 1
Mid-sized Pickup Truck 1
Station Wagon 1
Van (for dairy farm use) 1
Vans (for student transport) 3
Gator'/Utility Vehicle 1
Electric Golf Cart 1
Skid Steer Loaders (sm, med, lg) 3
90 HP Tractors 2
70 HP Tractor 1
45 HP Tractor 1
18 HP Tractor 1

5 - 9
Table 5.7. Number of head of livestock and manure production.
The total annual consumption for the NJAES On-Campus Farms (which were surveyed) and the University
Golf Course (from section above) combined is approximately 541 eCO2 MT (Table 5.8) (conversion to
equivalent CO2 based on https://www.epa.gov/energy/greenhouse-gases-equivalencies-calculator-
calculations-and-
references#:~:text=To%20convert%20to%20carbon%20dioxide,in%20the%20year%20of%20conversion.).
Note that this does not include N Fertilizer application in the equivalent CO2 estimation.
Table 5.8 Total Energy consumed and CO2 equivalent for NJAES on-Campus farms and Golf Course.
Gasoline Usage Diesel Usage N-P-K/Type Synth/Org lb/yr % N lb Ngal/year gal/year
Hort Farms 1
Hort Farm 2 2457.6 845.2 10-14-0 synth 58.0 10 5.8
26-0-5 synth 1220.4 26 317.3
Turf Grass Research Plots 16-0-8 synth 1205.5 16 192.9
12-24-8 synth 520 12 62.4
synth 12 21 2.52
Scott's Standard Fertilizer 21 synth 21.5 10 2.15
46-0-0 Urea synth 148 46 68.08
Hort Farm 3 46-0-0 Urea synth 500 46 230
Chicken Magic org 2000 5 100
(for trees) 46-0-0 synth 1000 46 460
(for trees) 20-0-0 synth 1400 20 280
non-nitrogen additives:
pelletized lime 19200
potassium 1333
boron 200
sulfur 150
Cook Campus Farm 700 300 Manure Produced by Livestock org 1472620 0.68 10013.816
Hazelnut + Dogwood
Research Nursery
Roughly 14 acres tree
plots, 9 acres field plots
21-22-04 (Scott's TurfBui lder w/
Mesotrione)
Direct Engine Sources
unreported
Fertilizer Application
unreported
unreported
(96000 lb applied every 5 years)
(4000 lb applied every 3 years)
Livestock Adult Juvenille
Beef Cattle 12 8Swine 20 12
Goats 30 10
Sheep 24 10
Horses 25Poultry 25
Animal Headcount:

5 - 10
5.1.2. Rutgers’ climate vulnerabilities Changing climate conditions has manifold implications for Rutgers University’s campus grounds, research
farms and forests. Hotter growing season temperatures, milder winters, extreme precipitation events and
prolonged drought will affect plant health and productivity as well as stormwater runoff.
5.1.3. Ongoing activities to reduce emissions and vulnerabilities Please describe ongoing activities to reduce the emissions and/or vulnerabilities described above.
• Present University policy requires that all capital projects incorporate perennial plantings capable of
significant annual biomass development, and minimize extents of managed lawn, thereby reducing
fertilizer input as well as mowing;
• A sustainability plan for NJ Agricultural Experiment Station (NJAES) research farms is under way.
• A deer management program has been initiated on University owned forests, to reduce deer
population numbers and thereby promote a healthier, more diverse, and fully stocked forest that
can fix and store more carbon.
5.1.4. Related ongoing educational, research, and service activities There has been a concerted push to extend the formal boundaries of the classroom to encompass the
campus grounds, the EcoPreserve and Rutgers Gardens and nearby features such as the Raritan River as a
Living Laboratory.
Gasoline Usage Diesel Usage KWH/year Therms/yeargal/year gal/year
Current Total 5669.6 3399.2 Total (Lb.) 14297.816 298083 46322.97
eCO2 (MT) eCO2(MT) eCO2 (MT) eCO2(MT)
CO2 Equivalent 50.4 34.6 211 245
Energy UsageDirect Engine Sources Fertilizer Application
5 - 11
5.2. Overview of potential climate solutions
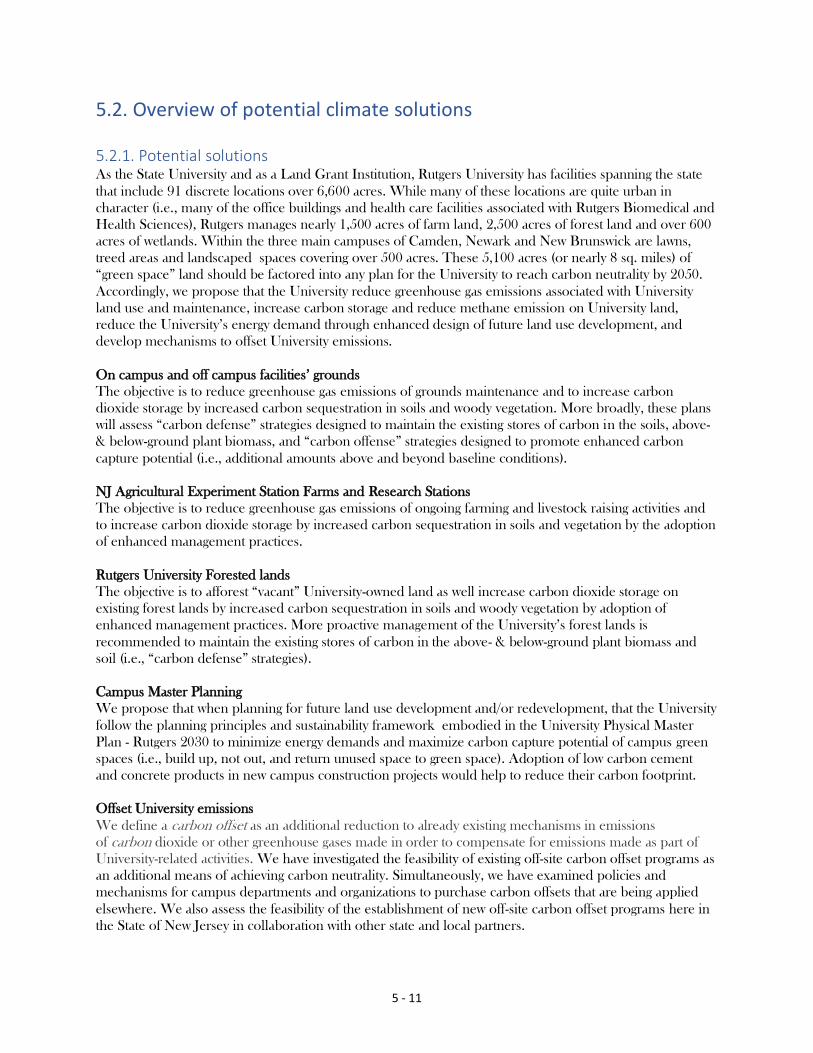
5.2.1. Potential solutions As the State University and as a Land Grant Institution, Rutgers University has facilities spanning the state
that include 91 discrete locations over 6,600 acres. While many of these locations are quite urban in
character (i.e., many of the office buildings and health care facilities associated with Rutgers Biomedical and
Health Sciences), Rutgers manages nearly 1,500 acres of farm land, 2,500 acres of forest land and over 600
acres of wetlands. Within the three main campuses of Camden, Newark and New Brunswick are lawns,
treed areas and landscaped spaces covering over 500 acres. These 5,100 acres (or nearly 8 sq. miles) of
“green space” land should be factored into any plan for the University to reach carbon neutrality by 2050.
Accordingly, we propose that the University reduce greenhouse gas emissions associated with University
land use and maintenance, increase carbon storage and reduce methane emission on University land,
reduce the University’s energy demand through enhanced design of future land use development, and
develop mechanisms to offset University emissions.
On campus and off campus facilities’ grounds
The objective is to reduce greenhouse gas emissions of grounds maintenance and to increase carbon
dioxide storage by increased carbon sequestration in soils and woody vegetation. More broadly, these plans
will assess “carbon defense” strategies designed to maintain the existing stores of carbon in the soils, above-
& below-ground plant biomass, and “carbon offense” strategies designed to promote enhanced carbon
capture potential (i.e., additional amounts above and beyond baseline conditions).
NJ Agricultural Experiment Station Farms and Research Stations
The objective is to reduce greenhouse gas emissions of ongoing farming and livestock raising activities and
to increase carbon dioxide storage by increased carbon sequestration in soils and vegetation by the adoption
of enhanced management practices.
Rutgers University Forested lands
The objective is to afforest “vacant” University-owned land as well increase carbon dioxide storage on
existing forest lands by increased carbon sequestration in soils and woody vegetation by adoption of
enhanced management practices. More proactive management of the University’s forest lands is
recommended to maintain the existing stores of carbon in the above- & below-ground plant biomass and
soil (i.e., “carbon defense” strategies).
Campus Master Planning
We propose that when planning for future land use development and/or redevelopment, that the University
follow the planning principles and sustainability framework embodied in the University Physical Master
Plan - Rutgers 2030 to minimize energy demands and maximize carbon capture potential of campus green
spaces (i.e., build up, not out, and return unused space to green space). Adoption of low carbon cement
and concrete products in new campus construction projects would help to reduce their carbon footprint.
Offset University emissions
We define a carbon offset as an additional reduction to already existing mechanisms in emissions
of carbon dioxide or other greenhouse gases made in order to compensate for emissions made as part of
University-related activities. We have investigated the feasibility of existing off-site carbon offset programs as
an additional means of achieving carbon neutrality. Simultaneously, we have examined policies and
mechanisms for campus departments and organizations to purchase carbon offsets that are being applied
elsewhere. We also assess the feasibility of the establishment of new off-site carbon offset programs here in
the State of New Jersey in collaboration with other state and local partners.

5 - 12
5.2.2. Stakeholder input We participated in the various Campus Roundtables and have incorporated the various comments and
taken the concerns into consideration in the development of this report.
5.2.3. Opportunities for action in the current academic year A review of campus grounds maintenance on the New Brunswick-Piscataway campus was undertaken and
several areas were put under to ecomow practices.

5 - 13
5.3. Assessments of potential climate solutions
5.3.1 On campus and off campus facilities grounds The objective is to reduce greenhouse gas emissions of grounds maintenance and to increase carbon
dioxide storage by increased carbon sequestration in soils and woody vegetation.
5.3.1.1. Emissions reductions and resilience improvements What are the associated emissions reduction and resilience improvements?
Broadly, a campus green space sustainability effort that includes adoption of the following best management
practices:
• Reduce traditional lawn; Increasing low-maintenance turf care (reduced fertilizer/herbicide,
irrigation and mowing) and/or switch to low maintenance turf varieties and/or expand eco/low mow
zones;
• Replant existing eco/low mow zones with perennial meadow species
• Replacing gas engine with lower emitting electrical battery powered machinery, increasing electric
vehicle charging stations;
• Establish management program for the campus urban forest to enhance forest health and vigor;
• Replace annual plantings with perennials/grasses/shrubs and trees;
• Install vertical gardens in area-limited locations;
• Increase on-site management of leaf litter/wood chips (shredding, compositing);
• Develop program to mill campus trees removed because of disease, storm damage or construction
for usable lumber;
• Increase campus tree plantings - within parking lots (wherever feasible) to reduce urban heat island
effect, within campus green spaces and with new projects;
• Increase the use of pervious paving materials with high sun reflectance index and “low carbon”
concrete materials into university projects;
• Establish a campus native tree/shrub nursery as part of the Campus as Living Laboratory teaching
program.
Due to the lack of baseline data on present day emissions of campus grounds maintenance (except for the
Rutgers Golf Course noted above), quantification of potential reductions in ongoing emissions is not
feasible at this point in time. The first task is to begin recording the relevant fuel and fertilizer usage data.
To initiate this campus green space sustainability effort, approximately 25 acres of the New Brunswick-
Piscataway campus lawns have been identified as candidates for conversion no/eco-mow zones (Table
1). Replacement of a traditional lawn with what are termed eco- or low mow zones greatly reduced the
frequency of mowing to one annually thereby reducing gasoline combustion emissions, as well as decreasing
the amount of fertilizer, herbicide, and irrigation expended. Additional 14.3 acres of lawn or disturbed
areas have been identified to replant into trees (Tables 3.1, 3.2; Figures 3.1a, 3.1b). The breakdown is as
follows:
Eco/Low-mow: 24.81 acres
Afforestation: 14.29 acres
Total acres: 39.1 acres.

5 - 14
At the beginning of the program, the recently transitioning eco/low mow areas will be predominantly cool
season grasses (existing turf species). Over time the areas may be transitioned to a combination of cool
season and warm season grasses and wildflowers and forbs to create a meadow ecosystem. Meadows are
becoming increasingly recognized for their ability for carbon capture and soil restoration as well as their
ecological virtues as habitat, especially for songbirds and pollinators, and as hydrologic buffers. They also
provide aesthetic beauty that can help relieve stress in an ever-quickening world. Meadow ecosystems
evolved to withstand, and thus can be invigorated by, disturbances, primarily in the forms of grazing and fire
(USGCRP, 2018). As a result, much of their biomass exists underground as deep and extensive root
systems. Infrequent mowing (i.e., once annually or biennially) can act as a partial replacement for naturally
occurring grazing and limit the growth of woody plants. An ongoing challenge will be noxious weed/plant
management and may require future herbicide treatments.
In order to have the most success in establishing these new meadows, the sites must be primed with a one-
time treatment of herbicide, which, when applied properly, should not leave significant residue. This
treatment is important to help the new seed establish so that it is not out competed by pre-existing and/or
invasive species. Seeding should be done at least two weeks after the pre-treatment, and most native plants
require a two month period of cold in order to germinate. In a meadow creation project a highly diverse seed
mix typically includes 25% wild flowers, a dozen or more species and 75% warm season grasses (Big Blue
Stem, Little Blue Stem, Indian Grass, Virginia Wild Rye, Switch Grass, etc.) (Tallgrass Ontario, 2020). The
selection of plants that promote deep root establishment is critical to the capture of carbon in below ground
biomass and as soil organic carbon. The potential amount of carbon that might be expected to be sequestered
in below ground biomass and soil organic carbon for the proposed meadow creation projects was not
quantified. The approximate cost to establish a meadow is on the order of $1,000 per acre depending on the
amount of wildflower seed that is used (wildflower seed costs more per pound vs. grass seed; personal
communication, Thomas Almendinger, Director of Conservation at Duke Farms, Hillsborough, NJ).
Wildflowers add aesthetic appeal and serve as habitat for pollinators such as butterflies, bees and other insects.
For the proposed afforestation, the goal will be planting new trees at a density of approximately 200 2”-2 ½”
caliper trees per acre. This density is derived from the New Jersey No-Net-Loss Compensatory
Reforestation Program Guidelines. We are using the tree replacement factor for Established Forest
(assumed prior 100% canopy coverage). Afforested and reforested areas will be a combination of large
shade trees and understory trees. The large trees should range in mature height from 45’ to 100’. With a
mature crown diameter that would range from 20’ to 80’. Small/understory trees will have a mature height
range from 15’ to 35’ with a similar crown diameter. Additional trees will be planted along selected streets
and pathways. The potential amount of carbon that might be expected to be sequestered in above and
below ground carbon is estimated later in this document.
Table 5.9. Proposed Eco/Low Mow zones on the New Brunswick-Piscataway Campus.

5 - 15
Table 5.10. Proposed Afforestation projects on the New Brunswick-Piscataway Campus.
Campus Name Building Number Building/Site/Road/Notes
no/eco-
mow
acres
Cook/Douglass
Helyar House / Bioresource
Engineering 6239/6061
wooded area between
Bioresources engineering
office and weather radar
enclosure 1.6
Cook/Douglass Makerspace 8863 edge of parking lot 0.16
Cook/Douglass Env. & Natural Res. Sciences 6330
rear of building against tree
line 0.4
Cook/Douglass Community Garden/Lot 98b
area between Lot 98b, solar
field and community garden 1.15
Cook/Douglass Lot 99/Ryders Lane Buffer
Buffer between Lot 99 and
Ryders Lane 0.61
Cook/Douglass Bld #37 (Newell Apt)
lawn area between back of
building and landscape buffer 0.3
Cook/Douglass Starkey 573-596 6294
lawn area near west of
building adjacent to wooded
area 0.25
Cook/Douglass Douglass Parking Deck 8433
lawn area between deck and
Lipman Drive and behind deck
towards Loree 0.69
Cook/Douglass Gibbons/Univ Inn & Conf Center
lawn area between Gibbons
Res Hall A and Univ. Inn and
Conf Center expand meadow 2.3
Livingston RD#3/Postal Rd northeast corner 1.5
Livingston Rd#3 Picnic Grove
expansion of existing eco-
mow area, under and around
trees, picnic activites to be 3.9
Livingston Lot 112/Livingson Housing lawn area northeast 0.6
Livingston RD#3/Joyce Kilmer Ave
large lawn areas on east and
west sides of RD#3 5.5
Livingston Joyce Kilmer Ave/RD#2 adjacent to solar farm 1.43
Livingston Lot 101/James Dickson Carr Library
lawn area between library
and Tillett Hall 1.25
Busch
Nichols Apartment/Lot 58C/Kindercare
Learning
lawn areas around parking
and behind Learning center
adjacent to woods 0.97
Douglass George St./Hickman Hall
existing lawn areas both sides
of Georges St and bridge 1.5
Busch
Busch Regional Stormwater Basin and
block 9902/lot 12.03 Davidson Rd
existing basin/Davidson Hall,
former residential lot 0.7
total 24.81
No/EcoMow Zones

5 - 16
Figure 5.1. Map showing location of proposed eco/low mow, afforestation, and reforestation zones on Busch/Livingston campus.
Campus Name Building/Site/Road/Notes
total site
sq. ft.
total site
acres
afforesta
tion
acres
Busch
Nichols Apartment/Lot
58C/Kindercare Learning
lawn areas around parking and
behind Learning center adjacent
to woods 23,675 0.54 0.54
Douglass George St./Hickman Hall
existing lawn areas both sides
of Georges St and bridge 17,250 0.40 0.40
Busch
Library of Science and
Medicine/Lot 58
Quad landscape around library
and planting island within Lot 58
- 275 large and small trees 170,000 4.00 4.00
Busch
Hoes Ln E (Rt 18)/Davidson
Road
lawn areas between parking lot
and Hoes Ln E and Davidson
Road 74,000 1.70 1.70
Livingston
Soil Stockpile - behind
track and field, corner of
Metlars Ln and Ave E soil stockpile 158,970 3.65 3.65
Busch
Busch Regional Stormwater
Basin and block 9902/lot
12.03 Davidson Rd
existing basin/Davidson Hall,
former residential lot 118,450 4.70 4.00
total 562,345 15.0 14.29
Re/Afforestation

5 - 17

5 - 18
Figure 5.2. Map showing location of proposed eco/low mow zones on Cook/Douglass campus.

5 - 19
5.3.1.2. NJ Agricultural Experiment Station Farms and Research Stations The objective is to reduce greenhouse gas emissions of ongoing farming and livestock raising activities and
to increase carbon dioxide storage by increased carbon sequestration in soils and vegetation by the adoption
of enhanced management practices.
• Complete a sustainability plan for NJAES research farms. See full description in interim report
of Working Group 7;
• Proposed initiatives to achieve reduction of greenhouse gas emissions will focus on improved
soil and livestock management to reduce greenhouse gas emissions;
• Explore altering guidelines on vehicle fleet to prioritize hybrid vehicles and better understand
the hurdles for using electric equipment in a rural setting (e.g., high vehicle miles travelled and
few commercial charging stations).
• NJAES cannot commit to any change in plantings, including trees, shrubs, or permaculture,
that are inconsistent with its ongoing research projects or with the stewardship plan described in
the WG7 interim report.
5.3.1.3. Rutgers University Forested lands Rutgers manages nearly 3,100 acres of upland and wetland forest across the state of New Jersey. We
propose that the University maintain these forest lands to protect their existing “bank” of carbon storage as
well increase their carbon dioxide storage by increased carbon sequestration in soils and woody vegetation
through the adoption of enhanced management practices.
A forest sustainability planning effort has been undertaken to provide an initial estimate of existing carbon
stocks (i.e., carbon stored in plant biomass and soils), assess the potential for enhanced carbon
sequestration (I.e., additional carbon stored above and beyond the baseline) carbon sequestration goal, and
propose a suite of best management practices. Geospatial data on the type and general canopy cover of
forests was used to map Rutgers University owned lands into the following 4 categories:
• >50% canopy cover for upland or wetland forest --> Focus on Forest Health Defense -
maintaining forest as is and protecting against forest pests/diseases/ invasive plants and deer
overbrowsing;
• the forest canopy is sparse (10-50%) --> Focus on Reforesting to increase forest cover;
• Abandoned AG field or scrub/shrub --> Focus on Afforesting to increase/re-establish
forest cover;
• Existing Agricultural land that is "Vacant" and a possible candidate as a future forestland--
> Focus on Afforesting.
Carbon sequestration benefits from tree planting activities (i.e. afforestation or reforestation) occur when the
net CO2e (CO2e stored minus CO2e emitted) associated with planted trees exceeds baseline tree planting
CO2. In other words, the tree planting should be additional, i.e., above and beyond “business as usual”
practices. In some greenhouse gas inventories carbon sequestration from existing forested lands is
considered a sink and subtracted from the total emissions. However in our assessment, carbon
sequestration rates of existing forested lands were deemed as non-additional (and thereby were not
calculated separately), even if proactive management is undertaken to maintain existing carbon stocks and
sustain future carbon sequestration (i.e., Carbon Health Defense strategies outlined above). The net amount
of carbon sequestered annually could be estimated using a combination of in situ forest measurements
complemented with forest ecosystem process modeling (similar to the approach described below).
Digital maps of Rutgers University owned properties were cross-tabulated with other mapped data sets using
geographic information system (GIS) software to calculate the area of University owned forests and
characterize the forest type and status (Table 5.11). Key data sets were the 2015 New Jersey Land Use/Land
Cover (LU/LC) dataset released by the New Jersey Department of Environmental Protection (NJDEP) in
5 - 20
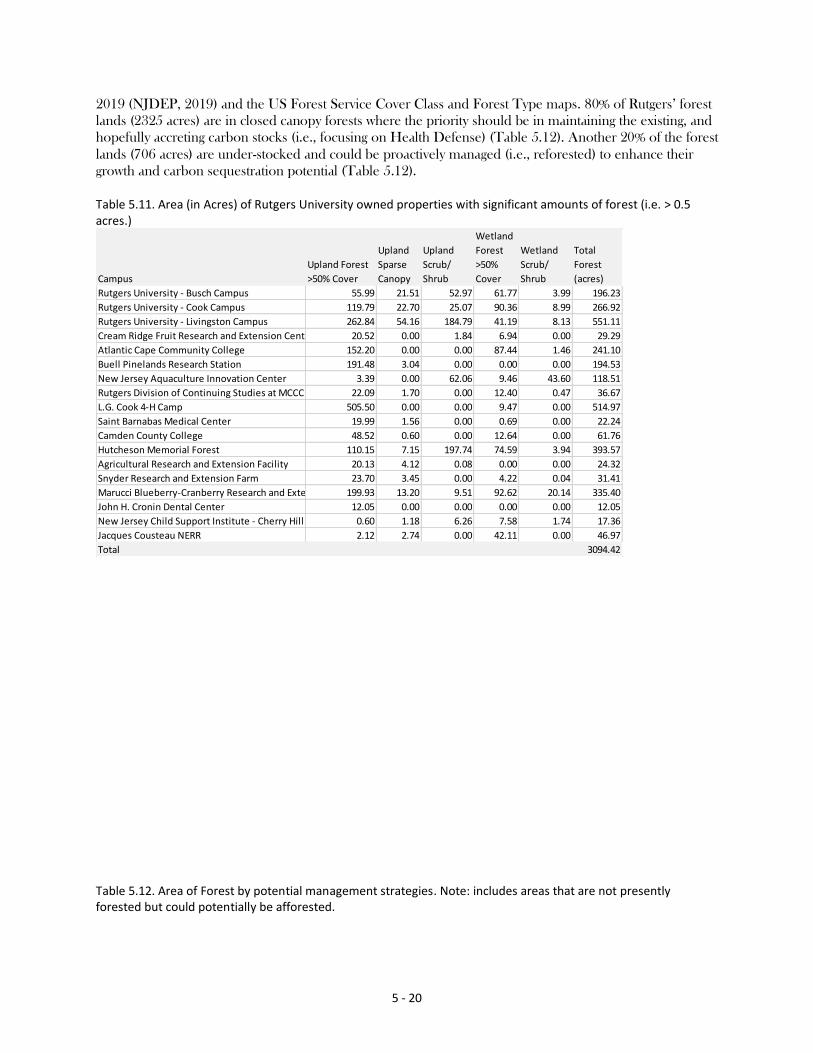
2019 (NJDEP, 2019) and the US Forest Service Cover Class and Forest Type maps. 80% of Rutgers’ forest
lands (2325 acres) are in closed canopy forests where the priority should be in maintaining the existing, and
hopefully accreting carbon stocks (i.e., focusing on Health Defense) (Table 5.12). Another 20% of the forest
lands (706 acres) are under-stocked and could be proactively managed (i.e., reforested) to enhance their
growth and carbon sequestration potential (Table 5.12).
Table 5.11. Area (in Acres) of Rutgers University owned properties with significant amounts of forest (i.e. > 0.5 acres.)
Table 5.12. Area of Forest by potential management strategies. Note: includes areas that are not presently forested but could potentially be afforested.
Campus
Upland Forest
>50% Cover
Upland
Sparse
Canopy
Upland
Scrub/
Shrub
Wetland
Forest
>50%
Cover
Wetland
Scrub/
Shrub
Total
Forest
(acres)
Rutgers University - Busch Campus 55.99 21.51 52.97 61.77 3.99 196.23
Rutgers University - Cook Campus 119.79 22.70 25.07 90.36 8.99 266.92
Rutgers University - Livingston Campus 262.84 54.16 184.79 41.19 8.13 551.11
Cream Ridge Fruit Research and Extension Center 20.52 0.00 1.84 6.94 0.00 29.29
Atlantic Cape Community College 152.20 0.00 0.00 87.44 1.46 241.10
Buell Pinelands Research Station 191.48 3.04 0.00 0.00 0.00 194.53
New Jersey Aquaculture Innovation Center 3.39 0.00 62.06 9.46 43.60 118.51
Rutgers Division of Continuing Studies at MCCC 22.09 1.70 0.00 12.40 0.47 36.67
L.G. Cook 4-H Camp 505.50 0.00 0.00 9.47 0.00 514.97
Saint Barnabas Medical Center 19.99 1.56 0.00 0.69 0.00 22.24
Camden County College 48.52 0.60 0.00 12.64 0.00 61.76
Hutcheson Memorial Forest 110.15 7.15 197.74 74.59 3.94 393.57
Agricultural Research and Extension Facility 20.13 4.12 0.08 0.00 0.00 24.32
Snyder Research and Extension Farm 23.70 3.45 0.00 4.22 0.04 31.41
Marucci Blueberry-Cranberry Research and Extension 199.93 13.20 9.51 92.62 20.14 335.40
John H. Cronin Dental Center 12.05 0.00 0.00 0.00 0.00 12.05
New Jersey Child Support Institute - Cherry Hill 0.60 1.18 6.26 7.58 1.74 17.36
Jacques Cousteau NERR 2.12 2.74 0.00 42.11 0.00 46.97
Total 3094.42

5 - 21
Estimating Carbon Sequestration Potential of Identified Offset Projects
A combination of methods was employed to estimate the amount of carbon that could potentially be stored
for several identified projects on the New Brunswick-Piscataway campuses, the Rutgers Ecological Preserve
and the Hutcheson Memorial Forest HMF) and outlying properties in Franklin Township, New Jersey. At
HMF 80 acres (32 ha) of farmland and 19 acres (8 ha) of gaps in the old growth in HMF were identified
for potential afforestation projects. Another 13 acres (5.3 ha) of gaps in the RU EcoPreserve were identified
and another 10.24 acres (4.1 ha) on campus are suitable for afforestation projects. Afforestation of existing
farmland falls under Approach 4 and reforesting forest gaps falls under Approach 2 outlined in the text
above. A review of the Duke University Urban Tree Protocol’s Additionality Checklist suggests that the
aforementioned projects satisfy the additionality criteria.
Duke University has established an Afforestation protocol that serves as a useful guide for calculating
carbon offset credits. Under this protocol, the crediting period for an Afforestation Project is 40 years.
Projects may be renewed but must calculate an updated baseline before offset generation is continued.
Afforestation/Reforestation projects must yield surplus GHG emission reductions and removals that are
additional to what would have occurred in the absence of intervention. The protocol designates forest
carbon sinks as either required or optional in line with UN Clean Development Mechanism (CDM)
guidance. For the purposes of this protocol, sinks of carbon for estimation include above ground biomass
and below ground biomass. Optional sinks include soil carbon, deadwood, and litter (CDM). We adopted
a more conservative approach and excluded the optional sinks from our calculations. The final
determination of carbon offset credits is determined by the direct estimation of change by re-measurement
of sample plots at baseline and a future date (i.e., 40 years) and the plot-level change in biomass is obtained

5 - 22
by subtracting the plot biomass on the first occasion from the plot biomass on the second occasion.
However, to estimate the potential carbon credits for the afforestation/reforestation projects under
consideration, we have adopted a computer simulation modeling approach.
Forest carbon stocks were simulated using a forest ecosystem carbon process model, IntCarb (Song and
Woodcock, 2003). IntCarb combines components from a forest population dynamics model (ZELIG)
(Urban, 1990) and a terrestrial ecosystem biogeochemical process model (CENTURY) (Parton et al., 1993)
to simulate forest development and heterotrophic respiration, respectively. The IntCarb model, by focusing
on forest ecosystem processes, has overcome the common weakness of other terrestrial ecosystem models
that use a limited number of biomes to represent vast areas and ignore potentially significant variation within
biomes in terms of productivity. IntCarb simulates ecosystem carbon cycling by connecting forest stand level
population dynamics and ecosystem biogeochemical process. In a simulation, first forest stand dynamics are
simulated at a one-year time step. Relevant population dynamic processes such as individual tree
establishment, regeneration, and mortality, and environmental stress such as drought and nutrient limitation
are simulated. Then the growth is distributed to each tree component (leaves, branches, stems, fine and
coarse roots) as driven by ecophysiological characteristics of each tree component and environments. The
annual growth then enters the decomposition process.
IntCarb was parameterized for the five New Jersey physiographic regions to account for broad scale
variations in climatic conditions, soil water capacity, soil fertility, and forest species composition (Lathrop et
al., 2011). A spatially explicit “wall-to-wall” simulation was not undertaken but rather average conditions for
each of the five physiographic regions were used. Parameterizing IntCarb for the other geographic zones
under consideration (e.g., urban vs. rural or public vs. private) was not feasible, thus the carbon flux for
these other geographic jurisdictions were not estimated. A 30-year record of monthly precipitation and
temperature (from 1979 to 2008) downloaded from http://climate.rutgers.edu/stateclim_v1/data/index.html
was used to derive monthly mean and standard deviation of precipitation and temperature. Based on soil
features in each ecoregion, soil field capacity, wilting point and soil fertility were ranked from high to low as
Ridge and Valley > Piedmont > Highlands > Inner Coastal Plain > Outer Coastal Plain (SSURGO, 1995). A
list of dominant species for each physiographic region was developed based on personal familiarity with the
forest species composition. For each simulated forest species, parameter variables incorporated include
maximum age, maximum diameter, maximum height, annual growth rate, minimum degree day limit,
maximum degree day limit, shade tolerance, soil moisture tolerance, nutrient stress tolerance and seeding
ability. The maximum age, maximum diameter, maximum height and annual growth rate are variables
driving tree growth. The minimum degree day limit, maximum degree day limit, shade tolerance, soil
moisture tolerance, nutrient stress tolerance and seeding ability are variables controlling potential seedling
establishment. The values for each parameter variable were taken from literature data (Pastor and Post,
1985).
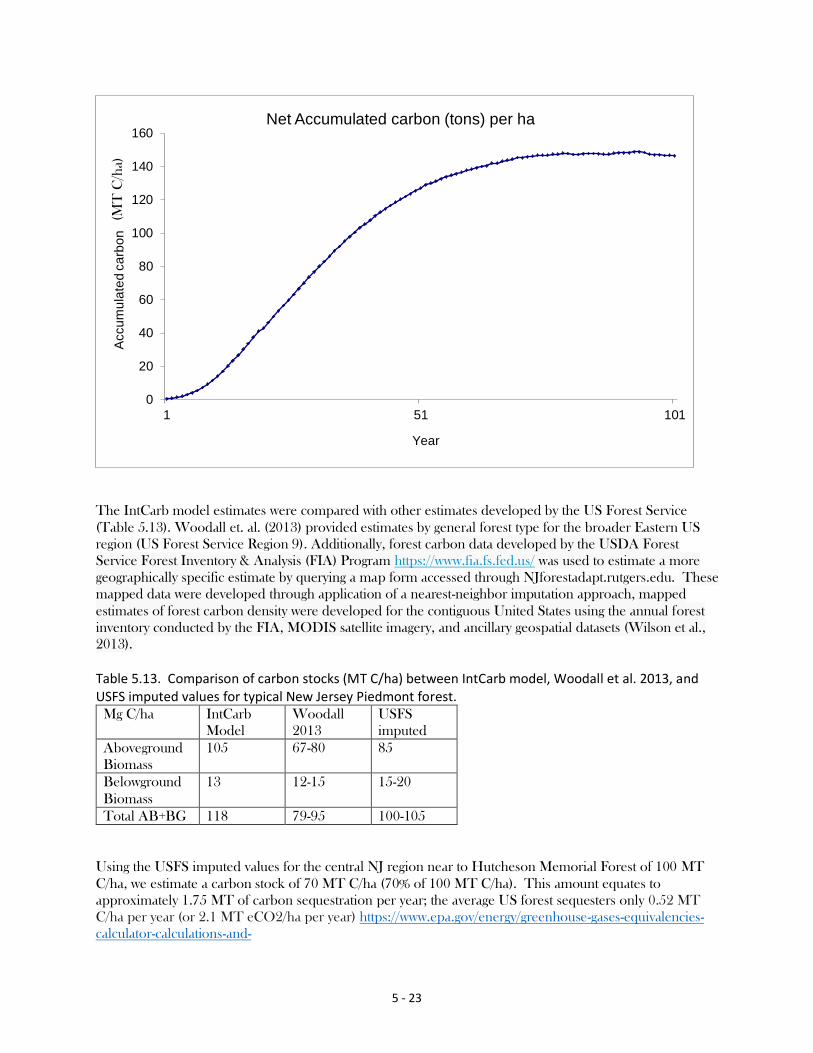
The IntCarb model simulates the growth of a forest on land that has been cleared and allowed to regenerate
back to forest. The model ‘grows’ the forest from Time 0 through maturity (Time 300) and tracks the
carbon accumulation over the 300-year modeling period. Piedmont forests are estimated to reach their
maximum carbon density of 149 MT C/ha reached at age 80 (Figure 5.3). After their peak growth stages,
forest stands tend to mature and thin in tree density thereby declining in overall carbon stock. Examination
of Figure 1 shows that the maximum carbon stock value is predicted to be 149 MTC/ha reached at Year 80.
Based on the Duke University Afforestation protocols, we have selected 40 years as the time frame of
interest. Year 40 is 103 MT C/ha or approximately 70%.
Figure 5.3. Forest accumulated carbon density (including above-ground and below-ground including dead wood and litter) (Mg or MT C/ha) by stand age for New Jersey statewide.
5 - 23
The IntCarb model estimates were compared with other estimates developed by the US Forest Service
(Table 5.13). Woodall et. al. (2013) provided estimates by general forest type for the broader Eastern US
region (US Forest Service Region 9). Additionally, forest carbon data developed by the USDA Forest
Service Forest Inventory & Analysis (FIA) Program https://www.fia.fs.fed.us/ was used to estimate a more
geographically specific estimate by querying a map form accessed through NJforestadapt.rutgers.edu. These
mapped data were developed through application of a nearest-neighbor imputation approach, mapped
estimates of forest carbon density were developed for the contiguous United States using the annual forest
inventory conducted by the FIA, MODIS satellite imagery, and ancillary geospatial datasets (Wilson et al.,
2013).
Table 5.13. Comparison of carbon stocks (MT C/ha) between IntCarb model, Woodall et al. 2013, and USFS imputed values for typical New Jersey Piedmont forest.
Mg C/ha IntCarb
Model
Woodall
2013
USFS
imputed
Aboveground
Biomass
105 67-80 85
Belowground
Biomass
13 12-15 15-20
Total AB+BG 118 79-95 100-105
Using the USFS imputed values for the central NJ region near to Hutcheson Memorial Forest of 100 MT
C/ha, we estimate a carbon stock of 70 MT C/ha (70% of 100 MT C/ha). This amount equates to
approximately 1.75 MT of carbon sequestration per year; the average US forest sequesters only 0.52 MT
C/ha per year (or 2.1 MT eCO2/ha per year) https://www.epa.gov/energy/greenhouse-gases-equivalencies-
calculator-calculations-and-
0
20
40
60
80
100
120
140
160
1 51 101
Accu
mu
late
d c
arb
on
(M
g C
/h
a)
Year
Net Accumulated carbon (tons) per ha(M
T C
/ha)

5 - 24
references#:~:text=To%20convert%20to%20carbon%20dioxide,in%20the%20year%20of%20conversion.
The Clean Development Mechanism (CDM) AR-Tool 14 permits the use of differencing between two
points in time as a means of calculating carbon credits. Assuming a baseline starting value of 0 (i.e., for
farmland with no trees), then the carbon credit would be 70 MT C /ha or 259 MT eCO2 of (1kg of CO2
can be expressed as 0.27kg of carbon, as this is the amount of carbon in the CO2 or conversely 1 kg of
carbon = 3.7 kg of CO2).
The sum total estimated carbon storage (at age 40) for the three identified projects is approximately 14,680
MT eCO2 or 3,977 MT C or 3,977 carbon credits (Table 3.1.3.4).
The proposed afforestation of the 80 acres (32ha) of farmland would provide 8,288 MT eCO2 (2,240 MT
C) at age 40. This equates to 924,196 gallons of gasoline consumed (from
https://www.epa.gov/energy/greenhouse-gas-equivalencies-calculator).
Assuming that the forest gaps, are already starting at a higher level of carbon stock, set the baseline
equivalent to 10 MT C/ha (roughly equivalent to the present estimate of below-ground carbon of mature
forest). The difference in carbon stocks, or carbon credit, would then be 60 MT C/ha. The proposed
reforestation of the 32 acres (17 ha) of forest gaps would provide 3,740 MT eCO2 (1020 MT C) at age 40.
This equates to 420,839 gallons of gasoline consumed (from https://www.epa.gov/energy/greenhouse-gas-
equivalencies-calculator). The proposed afforestation on 10 acres of campus would provide 2,653 MT
eCO2 (717 MT C) at age 40. This equates to 295,825 gallons of gasoline consumed (from
https://www.epa.gov/energy/greenhouse-gas-equivalencies-calculator).
Table 5.14. Proposed Forest Afforestation/Reforestation Plans with Estimated Carbon Sequestration Amounts
Project Area C stock at 40 yr CO2 equivalent Gas consumed
HMF Afforestation
80 acres 2,240 MT C 8,288 MT eCO2 924,196gal
HMF/RUEP Reforestation
32 acres 1,020 MT C 3,740 MT eCO2 420,839 gal
Campus Afforestation
10 acres 717 MT C 2,653 MT eCO2 295,825 gal
122 acres 3,977 MT C 14,680 MT eCO2 1,640,860 gal
5.3.1.4. Campus Master Planning The planning principles and sustainability framework already embodied in the University Physical Master Plan – Rutgers 2030 for future land use development/redevelopment intended to minimize energy
demands and maximize carbon sequestration (i.e., curtail low-rise sprawl development, in favor of
developing higher density, mixed-use buildings around transit hubs & return unused space to green space).
For the University Physical Master Plan – Rutgers 2030 to be successful in these regards, the following will
be critical:
• Ensure that Significant Capital Projects are designed with appropriate landscape plantings,
tree plantings, and site improvements, as well as energy saving building features.

5 - 25
• Monitor the implementation of Significant Capital Projects to ensure that these elements
are not downsized or eliminated from the project scope as part of a “Value Engineering”
process.
o All capital projects are required to be reviewed by University Landscape
Architect (ULA);
o All capital projects are to provide landscaping, including perennials,
shrubs and tree plantings that provide aesthetic and ecological function;
o All capital projects are required to incorporate perennial plantings capable
of significant annual biomass development, and minimize extents of
managed lawn, thereby reducing fertilizer input as well as mowing;
o Plant material is to be selected based upon being non-invasive, hardy for
the climatic and USDA hardiness zone, perennial and resistance to deer
browse;
o Replace trees removed by Grounds because of disease or damage at a 1:3
ratio.
While not included in University Physical Master Plan – Rutgers 2030, the adoption of low-carbon cement
and concrete for new construction projects represents an additional option for reducing the carbon
footprint of campus development/redevelopment. Traditional concrete/cement manufacturing and curing
processes emit tremendous amounts of carbon into the atmosphere. At an estimated 6% of total global
carbon emissions, concrete ranks as the second largest contributor to carbon emission. However, an
alternative known as Solidia CementTM
emits significantly lower amounts of carbon and is sometimes
referred to as low-carbon cement or concrete https://www.solidiatech.com/solutions.html). The cement is
manufactured at lower temperatures, thus lower energy costs and reduces associated carbon emissions by
30 to 40%. Even more importantly, rather than emitting carbon during the curing process, Solidia Cement
consumes carbon from the atmosphere and sequesters that carbon in the concrete matrix. A co-benefit is
that Solidia Cement consumes 80% less water.
Dr Richard Riman, Distinguished Professor of Materials Science and Engineering, co-invented the
technology that makes Solidia Cement possible with Vahit Atakan, chief scientist at Solidia Technologies®
and former Rutgers doctoral student (Rutgers Today February 13, 2017). Riman founded Solidia
Technologies® in Piscataway, New Jersey, in 2008. In 2019, Solidia teamed up with EP Henry, a leading
manufacturer of unit concrete products in North America, to manufacture paving stones and blocks. EP
Henry’s facility in Wrightstown New Jersey is the first US Commercial Venture. As of 2020, EP Henry-
Solidia concrete paving blocks are being installed across the Mid-Atlantic and Northeast US region. Rutgers
University should consider adopting the use of Solidia low carbon cement and concrete paving
stones/blocks in future construction projects as a means of reducing the associated carbon emissions.
5.3.1.5. Offsetting University emissions Carbon offsets serve to reduce or remove carbon dioxide equivalent (CO2e) greenhouse gas emissions made
in a secondary location to compensate or “offset” emissions from other activities. Offsets are measured in
metric tons of (CO2e) and purchase of an offset credit yields the ownership of one metric ton of CO2e,
which is prevented from entering the atmosphere via an emissions-reduction project (Duke Carbon Offsets
Initiative, 2020b).
Carbon offsets may be voluntary or state-mandated. Voluntary offsets are traded via the voluntary carbon
market, while mandated offsets are part of regulated carbon markets, otherwise known as the compliance
carbon market (Hamrick, 2019).
Widely accepted criteria for the legitimacy of carbon offsets are “PAVER” requirements: Permanent,
Additional, Verifiable, Enforceable, and Real (Duke Carbon Offsets Initiative, 2018; Duke Carbon Offsets

5 - 26
Initiative & Offset Network, 2017). Atmospheric carbon reduction generated by an offset project must exist
in perpetuity (permanent) and be beyond business as usual (additional). The reduction must be verifiable
and confirmed to exist via independent third-party verification or peer-review verification. Each carbon
credit generated by the program in question must be counted only once (enforceable); each credit must also
be the result of robust accounting (real) (Duke Carbon Offsets Initiative, 2018).
As noted, offsets can be used by regulated entities to comply with a small portion of their greenhouse gas
emissions reduction requirements. For example under the Regional Greenhouse Gas Initiative 3.3% of the
regulatory requirement can be met by offsets (The Regional Greenhouse Gas Initiative, Inc., 2020), while
under the California Cap and Trade program, compliance entities may use California Air Resources Board
offset credits to meet up to 8% percent of their compliance obligation for emissions through 2020; 4% of
their compliance obligation for emissions from 2021-2025; and 6% percent for emissions from 2026-2030)
(California Air Resources Board & California Environmental Protection Agency, 2020)
Given that Rutgers is not under a regulatory requirement to reduce greenhouse gas emissions, this chapter
focuses primarily on the voluntary offset market. Rutgers can purchase offsets on the voluntary market or
Rutgers can offset its emissions by developing its own offset projects or in collaboration with other groups.
In the voluntary market, an individual, company, government, or other entity (such as a university) can
purchase carbon offsets to mitigate their own greenhouse gas emissions for example, from electricity use,
travel, or other sources.
A collaboration of higher educational institutions has developed the Offset Network to provide educational
and research opportunities that can result in novel offset protocols as well as cost reductions through
implementation of a peer verification pathway. This voluntary approach provides an alternative pathway for
institutions of higher education to realize voluntary offsets for up to 30% of their Scope 3 emissions through
peer-verified offset projects (Offset Network, 2020a). Although the Offset Network currently recommends
that only 30% of Scope 3 emissions be offset via the peer verification pathway, the Offset Network plans to
reconvene a working group to reassess this recommendation, as schools that have utilized the peer
verification pathway have produced projects that demonstrate enough quality to remove the 30% limitation
(R. Woodside, personal communication, 2020). The 30% recommended limit on peer-verified offset
projects does not prohibit purchase of additional credits from the voluntary market. The Offset Network
also generally recommends that carbon offsets be used as a university’s final strategy to achieve carbon
neutrality after reducing emissions in other ways to the greatest extent possible, especially Scope 1 and
Scope 2 emissions (R. Woodside, personal communication, 2020).
Note that the Offset Network is facilitated by Second Nature, a nonprofit that works with colleges
and universities to further sustainability initiatives (Second Nature, 2020b). Rutgers University is a
member of the University Climate Change Coalition (UC3), which is also facilitated by Second
Nature. As a UC3 school, Rutgers is under no obligation to follow Offset Network protocols or
standards or to become a network member; however, Rutgers can benefit from engagement with
the Offset Network. Offsets developed through the Offset Network cannot be sold on the
voluntary market or traded; they must be retired by the university that produced them (M.
Arsenault & E. Fulop, personal communication, 2020).
Offsets are measured in metric tons of carbon dioxide equivalent (CO2e) and purchase of an offset credit
yields the ownership of one metric ton of CO2e, which is prevented from entering the atmosphere via an
emissions-reduction project. As previously stated, the Offset Network currently recommends that only 30%
of Scope 3 emissions be offset by peer-verified offset projects (Ruby Woodside, personal communication
2020). Such projects do not generate offsets until they are developed and verified. New forestry projects

5 - 27
generate future offsets which are typically not available until year 5 when the trees start to sequester carbon
that is able to be monitored, measured, and quantified.
Typically, offset projects are developed according to standards and protocols outlined by
independent registries also referred to as “standards” and verified by independent auditors. The
four main registries recognized internationally include Verra (formerly known a s the Verified
Carbon Standard), Climate Action Reserve, American Carbon Registry and the Gold Standard.
Registries establish standards, oversee independent verifiers, issue credits and track credits and transactions
(American Carbon Registry, 2020b; Climate Action Reserve, 2020; Gold Standard, 2019; Verra, 2020d).
Methodologies for each standard are project specific, and consider multipl e variables including
project goals and the starting condition of the project area, and include guidelines for project
development, assessment, and reassessment (Verra, 2019).
Universities can purchase offsets from the voluntary carbon market that can be used immediately. For
example, Duke University expects to offset approximately 38% of total Duke emissions through carbon
offsets by 2024 (M. Arsenault & E. Fulop, personal communication, 2020). These offsets are a combination
of purchased credits and projects that Duke has developed or been involved in; more than half are credits
purchased through the voluntary market (Duke Carbon Offsets Initiative, 2020a). American University
purchased 30,723 offset credits in 2018-2019; 78.8% of these credits are voluntary market purchases. The
remainder are a bundled offset project purchased through the broker Urban Offsets; 6,500 efficient
transportation credits were purchased and paired with an urban forestry project in Washington, D.C.
(Second Nature, 2019). Universities such as Arizona State University have purchased carbon offsets and
renewable energy certificates to complement their on-campus emissions reduction actions to accelerate their
timelines for achieving neutrality as an interim strategy (Hawkey, 2019). There is no recommended limit on
the number of carbon credits that can be purchased from a voluntary carbon registry; however as previously
noted, purchase of offsets is recommended as the last strategy for emission reductions.
Types of voluntary offset projects include agriculture (livestock methane, no-till/low-till agriculture, etc.),
chemical processes and industrial manufacturing (ozone depleting substances, nitric acid, etc.), energy
efficiency and fuel switching (waste heat recovery, coal mine methane, etc.), forestry and land use (REDD+,
IFM, wetland restoration, etc.), household devices (clean cookstoves, water purification, etc.), renewable
energy (wind, solar, hydro, etc.), transportation (carpooling, mass transit, vehicle electrification, etc.), and
waste disposal (landfill methane, waste water methane) (Hamrick, 2019). Improved energy efficiency or
development of public transportation infrastructure can also reduce greenhouse gas emissions and generate
carbon offset credits (Hamrick, 2019). For example, Duke University’s Loyd Ray Farms project generates
credits via the collection of hog waste in an anaerobic digestor and the burning of resulting biogas; in
addition to reducing methane emissions (a greenhouse gas 25 times stronger than CO2), the project also
reduces negative impacts on soil, air, and groundwater quality in the area. Collection and removal of hog
waste reduces waste run-off in local waterways, reduces odor in the surrounding area and prevents leakage
into soil and groundwater (Duke Carbon Offsets Initiative, 2020e). Waste handling and disposal offsets can
be purchased on the voluntary market: in Lebanon County, Pennsylvania, collection and combustion of
methane produced at the Greater Lebanon Refuse Authority Landfill generates offsets that are registered
on the Verra registry (Verra, 2020b). Truck stop electrification projects reduce emissions from idling trucks
at truck stops (in regions where idling is not regulated) by providing solar-generated electricity to power air
conditioning and power outlets; these credits are available through American Carbon Registry (American
Carbon Registry, 2020a). The provision of low-smoke or clean-burning cookstoves to communities in
underdeveloped communities can also offset carbon and produce carbon credits. The Myanmar Stoves
Campaign provides fuel-efficient stoves to families in Myanmar, which reduces consumption of wood in
order to decrease carbon emissions and deforestation; resulting credits are offered through the Gold
Standard registry (Gold Standard, 2020b).

5 - 28
Renewable energy projects, which include hydroelectric, wind, photovoltaic solar energy, solar hot water,
and biomass power, are voluntary offset project types included in the voluntary market if they meet PAVER
requirements. Some universities account for renewable energy to meet their carbon neutrality goals,
through another mechanism known as Renewable Energy Certificates (RECs); however, RECs should not
be confused with offsets. A single REC represents one megawatt-hour (1MWh) of renewable energy (Green
Mountain Energy, 2015); conversely, an offset represents a unit of CO2e. While offsets are sourced from
projects that reduce or remove atmospheric greenhouse gas emissions, RECs are generated from a
renewable energy generator (EPA Green Power Partnership, 2018). Furthermore, while offsets are required
to pass additionality tests (as part of PAVER requirements) to ensure the project is beyond “business as
usual”, additionality is not a requirement for generation of a REC (EPA Green Power Partnership, 2018).
Offsets are also applied as a net adjustment to an organization’s emissions (Scope 1, 2 or 3), while RECs are
credited toward an organization’s Scope 2 emissions from electricity usage(R. Woodside, personal
communication, 2020).
Afforestation projects on university property is a gray area right now in terms of whether they are considered
carbon offsets as opposed to carbon sinks (C. Hawkey, personal communication, 2020; R. Woodside,
personal communication, 2020). Most universities do not account for biogenic emissions from land use on
their properties in their emissions inventories, including Rutgers (Hayes, 2014; M. Kornitas, personal
communication, September 11, 2020; R. Woodside, personal communication, 2020). Second Nature and
the Offset Network do not currently provide a strong methodology for campus land management
accounting, which would include any land use change emissions. Conventional wisdom is to follow an offset
protocol for any on-campus tree planting and ensure additionality and other PAVER criteria are met (R.
Woodside, personal communication, 2020).
5.3.2. Financial costs and savings
Campus Grounds
Currently Facilities does not track fuel usage at a level of detail to be able to determine fuel cost savings
associate with the proposed reduction in managed turf. Fuel usage can be track at the macro level
associated with individual “fob keys” used to access gas at the university fuel depots. The data associated
with the “fob” usage does not provide enough detail so as to determine the amount of fuel used for mowing,
line trimming, utility cart operation, etc.
Costs associated with the conversion of actively managed lawn to eco/low mow and the installation of
canopy and understory trees have a potentially significant range depending upon the method of conversion
from “mow” to “no/eco mow” and the size and who or how the trees are installed and maintained. With a
reduction in actively managed turf, the university should realize a proportionate reduction in fuel, fertilizer
and herbicide usage.
University Forest Lands
A preliminary analysis of planting and management costs has been undertaken to estimate costs for initial
reforestation plantings and 1 year of management. Working with a student team, Dr. Aronson has
estimated costs to range around $20,000/acre at a stocking density of approximately 400 stems per acre for
#7 (large saplings) trees ($35/individual). Using seedlings (6”-12” height, $1.10/individual), Dr. Aronson’s
estimate is $7500/acre. These estimates include site prep, invasive species management, deer fence/tubing,
planting labor, subsequent management over 3 years post planting, etc (all together estimated as
$2285/acre)Data provided by Eric Olsen from the NJ Chapter of the Nature Conservancy estimates costs of

5 - 29
around $5,000 per acre strictly for the initial planting costs at a stocking density of 220-320 stems per acre
(i.e., does not include the labor costs for site prep, invasive species management, planting or subsequent
deer management). The difference in the costs is largely due to the difference in the size of the container
tree stocks to be planted. For the high estimate, Dr. Aronson used a #7 container while Mr. Olsen used #1-
2 size containers. The #1-gallon is $5-$7, #2-gallon is $9-$12 while the #7-gallon is $35 per individual. The
larger size stock has a higher chance of success but costs more to transport and plant. Cost estimates from
the Natural Resources Conservation Service (NRCS) Best Management Practices manual
(https://efotg.sc.egov.usda.gov/references/public/NJ/FY2019_Scenarios.pdf) are more in line with TNC’s
estimates. NRCS Practice 490 Tree/Shrub Site Preparation using heavy equipment site prep cost is
$270/acre. Practice 612 Tree/Shrub Establishment (planting) estimates costs of $9.46 per plant for
individual plantings, which equates to $3,953 per acre for a high-density hardwood planting (including tree
tubes).
Combining these recommendations, we estimate $3000/acre for plant material ($10/individual with a
stocking density of 300 individuals/acre) and $2300/acre for site prep, labor, and management. Site prep
and management will ensure successful reforestation. Intense deer browse and overabundance of invasive
species, both of which will cause high mortality to tree saplings and seedlings and failed reforestation if not
intensely managed. B Total $5300/acre (this is a low-end estimate). This estimate only includes 1 year of
management. There would need to be at least 5 years of monitoring after the plantings and additional
plantings to address mortality.
Please note that the Carbon emitted as part of the site prep, planting and subsequent management activities
will have to be estimated and subtracted from the previously quoted carbon sequestration credits.
We have undertaken a very simplified “back of the envelope” analysis of the expected costs vs. gains.
Putting this together, we estimate approximately 14,680 carbon credits to be gained from the 80 acre off-
campus afforestation project, the 10 acre on-campus afforestation project, and the 32 acre reforestation
project. If the same amount of credits were purchased on the open market at somewhere between $1 to $10
per credit, we would expect to spend between approximately $15,000 and $150,000. We estimate that it
would cost the University approximately $610,000 to undertake the projects (122 acres x $5,000/acre =
$610,000). These per credit costs are 1 to 2 orders of magnitude higher than relying on the open market to
purchase credit (even if carbon credits double as some expect in 2025 when the Paris Accord kicks in).
Note that we have not incorporated the expected costs for the carbon credit validation or other program
management/administrative costs. Further financial accounting needs to be undertaken to determine the
annualized cost.
Solely on an economic basis, undertaking these projects for their carbon credit value alone may be difficult
to justify. The real value in undertaking these projects, in addition to their other ecosystem service values,
would be for their educational and public relations value. It may be possible to underwrite some of these
per acre planting costs through grants from the NRCS or other government agencies.
Offsets
Prices of voluntary offsets vary widely based on the type of project, its location, its co-benefits, and the year
in which the carbon emissions reductions occurred (Second Nature, 2020a). Current prices ranges have
been cited as <$1 to >$50 per credit (Second Nature, 2020a) while others cite that most of the offsets on
the market are currently in the $1.50 to $12 per credit and that this range would be reasonable for short-
term budgeting purposes (M. Arsenault & E. Fulop, personal communication, 2020; C. Hawkey, personal
communication, 2020). As previously stated, one credit refers to ownership of one metric ton of CO2e.
Estimates for bulk purchases of offsets (>50,000 credits annually) are estimated in the range of $2 to $22
per credit by 2025. In addition to the factors previously noted, these prices also vary due to how the

5 - 30
purchases are made (e.g., long-term contracts, contracts that specify a purchase up to a certain amount vs. a
guaranteed number of credits purchased, etc.).
Under the Offset Network, peer verification is a process that can be applied to projects that use traditional
protocols (from VERRA, CAR, ACR, etc.) or for project protocols that are developed and peer-reviewed
through the Offset Network. Peer verification is the process of releasing the offsets to the school that
developed the project. Peer verified projects are less expensive to verify because instead of outsourcing
verification responsibility to a third-party accredited verification/validation body, a peer university
undertakes tasks associated with project verification (Offset Network, 2020b).
Until scenario analyses are completed in terms of what the costs to the university would be to reduce all
emissions on a per unit ton basis, it may not be possible to estimate the savings in comparing different
approaches to offsetting university emissions.
5.3.3. Benefits to the University’s educational and research mission and to campus culture
Campus Grounds and Forests
With the conversion of actively manage turf to Eco/Low mow, faculty and students will have easy and direct
access to these areas for research and teaching. Establishing eco/low mow areas, completing afforestation
and reforestation projects, and establishing and implementing a proactive urban forest management plan
will provide physical, real-world examples of the application of best management practices that represent
opportunities to influence cultural shifts in ground management.
The proposed “Forest Defense” and “Forest Offense” policies will provide a number of educational,
research, and culture benefits. As part of a broader Campus as Living Laboratory initiative, the proposed
afforestation/reforestation projects provide a number of educational opportunities. As described in the
Offsets section below, students could be incorporated at all stages of the process: design, implementation,
monitoring, validation.
Offsets
The previously mentioned Offset Network provides an educational and research opportunity particularly
through its peer verification process. For the peer institution, this peer verification process presents the
opportunity for students to gain valuable experience evaluating carbon offset projects. Faculty can use the
Offset Network to provide opportunities for developing protocols working with students outside of the
traditional registries through its peer review process whereby experts review new protocols. Qualified
faculty can also participate on the Offset Network Peer Review Committee if they are subject matter
experts in carbon offsets and campus climate goals, or have experience implementing offset
projects. The Offset Network’s Project Development templates request that universities report on the co-
benefits of their projects, particularly any co-benefits relating to student education (R. Woodside, personal
communication, 2020).
Research into new approaches for offsetting carbon emissions can be undertaken independent of
any specific program or standard; however, working through the Offset Network peer review and
verification process can provide a useful path for offset project development.

5 - 31
Academic institutions can also partner with third parties to provide educational and research opportunities
that also benefit local community partnerships. For example, Urban Offsets is a commercial enterprise that
partners with local communities and organizations including universities to implement the bundling of
purchased third-party verified carbon offsets with tree plantings in local communities; these tree plantings
are often in historically disadvantaged neighborhoods and engage university students and community
members (Arizona State University, 2020; C. Hawkey, personal communication, 2020; Urban Offsets,
2018). The bundling concept integrates the long-term benefits of creating future offsets through urban tree
planting with co-benefits of the environmental services provided by the trees along with the immediate
greenhouse gas emissions reduction impact of purchasing verified third-party offsets (M. Arsenault & E.
Fulop, personal communication, 2020; S. Gagné, personal communication, 2020). The local tree
planting urban forestry projects are considered to be cost-effective because they involve peer
verification, and they also provide local co-benefits addressing urban heat island, air quality
benefits, beautifying the community, improving property values, improving stormwater
management and providing a living laboratory for students (Arizona State University, 2020; S. Gagné,
personal communication, 2020).
5.3.4. Other Co-Benefits
Campus Grounds and Forests
The reduction in actively managed turf will allow grounds staff to spend additional time on the maintenance
and improvement of other campus landscape resources.
With the development, adoption and implementation of a campus wide “Urban Forest Management Plan”
the health, vigor and resilience of the forest will be enhanced. In addition to enhanced carbon
sequestration, increased tree cover will serve to cool campus buildings, reduce stormwater runoff, add
wildlife habitat value and provide aesthetic benefits.
Eco/Low mow and increased forest resources will enhance the ecological diversity of the campus and
support a more climate-resilient landscape.
Urban forestry offset projects can increase resilience by improving stormwater management and decreasing
the urban heat island effect. In urban environments, trees can function as “green infrastructure;” root
networks can reduce soil erosion and increase storm preparedness by absorbing excess rainwater (Berland
et al., 2017). The urban heat island effect (UHI) refers to the observed phenomenon of increased heat in
areas with high human population density; reduction in vegetation decreases shade on buildings and
concrete, which absorb and slowly release large amounts of heat (Clements & Casani, 2016). Increasing
trees in urban environments through an urban forestry offset project would serve to decrease the impact of
the UHI. Urban trees and shrubs were found to reduce mean maximum daily soil temperature
(Edmondson et al., 2016), while models have shown that a 50% increase in tree cover coupled with a 10%
decrease in street width would reduce road-surface temperatures by 27.72 °F (Loughner et al., 2012).
Offsets
In addition to improved stormwater management and decreased urban air temperatures, other co-benefits
of urban forestry offset projects include improved real estate values, increased urban wildlife habitat, and
improvements in air quality. The 3.3 million live trees in Houston, Texas inventoried in 2015 sequester
approximately 2.0 million tons of carbon and remove approximately 513,000 million tons of CO2 from the

5 - 32
atmosphere every year (Nowak, 2017) . Common air pollutants include carbon monoxide, nitrogen dioxide,
ozone, sulfur dioxide and particulate matter; trees improve air quality through direct removal of these
chemicals (Nowak et al., 2018) Urban Houston trees remove 2,400 tons of air pollution annually in
addition to increasing storm drainage capacity and reducing runoff by 173 million cubic feet (Nowak, 2017).
Ecosystem services of urban trees can be quantified using i-Tree Eco modeling software; urban trees in the
city of Houston were valued at $16.3 billion in 2015 and also reduced annual residential energy costs by
$59.3 million each year (Nowak, 2017). Furthermore, an inventory of street trees in Lisbon, Portugal found
that for every dollar spent in tree maintenance, residents received $4.48 in benefits from energy savings,
CO2 reduction, air pollutant deposition, stormwater runoff reduction, and increased real estate value
(Soares et al., 2011). Urban forestry projects also serve to engage the community in planting and
management of green spaces throughout the project area.
Offset projects such as wetland restoration also serve as buffers to decrease the likelihood and severity of
coastal flooding events. Coastal marshes and their vegetation have been found to protect coastal
communities from storm surges and flood damage (Barbier et al., 2013). For example, the Pocosin
Wetland Restoration Project at Duke University is intended to provide improved groundwater storage and
flood control to the surrounding area (Duke Carbon Offsets Initiative, 2020d).
In addition to urban forestry, other offset project types can produce co-benefits in addition to carbon
storage or removal. Wood-burning stoves not only produce greenhouse gas emissions, but also produce
particulate matter which can be harmful to human health; replacing wood-burning stoves with more efficient
cookstoves can improve human health through improvement in air quality (Boso et al., 2019; Gold
Standard, 2020b). Household device offset projects can involve the distribution of cleaner-burning stoves to
underdeveloped communities to reduce emissions from wood-burning stoves (Hamrick, 2019). American
University provided efficient wood-burning cookstoves to homes in Kenya as part of an offset program that
also improved the lives of Kenyan women; the more-efficient stoves improved air-quality in homes
(American University, 2017).
Biofuel methane capture offsets, such as the Loyd Ray Farms project at Duke University also generate
electricity in addition to removing methane from the atmosphere. Although carbon dioxide is generated,
methane is still removed, with the added co-benefit of electricity generation and the reduction of agricultural
waste (Offset Guide, 2020). As previously stated, manure can negatively impact water systems, soil, and air
quality (Duke Carbon Offsets Initiative, 2020e). Similarly, landfill methane capture offsets, such as the
methane capture project at the Greater Lebanon Refuse Authority Landfill, also generate electricity in
addition to reducing methane emissions (Verra, 2020b).
Energy efficiency offset projects subsidize the procurement and installation of appliances and construction
materials that are more energy-efficient than cheaper alternatives. Co-benefits include reduced energy costs
and building improvements (Weiss & Vujic, 2014).
5.3.5. Implementation Plan and Timescale
Campus Grounds and Forests
Following identification of grounds that are to be converted from mow to eco/low mow in the early summer
of 2020, Grounds staff were directed to reduce mowing frequency or to stop mowing those areas entirely.
This has allowed the existing cool season grasses and other (some non-desirable) herbaceous plant species
to grow unchecked. A plan is being developed that identifies portions of the grounds that have been taken
out of frequent mowing for conversion to wildflower/forb/warm season grass stands. Due to funding and
staffing constraints the timing for the full implementation of the program should be within a 5- to 10-year
5 - 33
time frame. The reforestation / afforestation of campus should also addressed as an on-going effort.
Prioritization of grounds to be reforested / afforested should be determined based upon factors such as
availability of funding, carbon sequestering potential, ecological and aesthetic benefits.
A forest inventory and stewardship plan for Rutgers owned forest lands (e.g., EcoPreserve, Helyar Woods,
Hutcheson Memorial Forest) should be completed over the next five years. The initial portfolio of potential
afforestation projects that have been identified should likewise be implemented over the next five to ten
years. The carbon credit projects have an initial time span of 40 years. As we are dealing with long-lived
trees, these projects will continue beyond that time frame to have a lifespan of a century or more.
Offsets
The university will have to complete its greenhouse gas emissions inventory and scenario analyses to
determine how much emissions reduction can be achieved through practices other than through the
purchase of offsets on the voluntary carbon market or to create its own offsets or enhance carbon sinks on
its own lands. Further, the university should evaluate whether it wants to embrace the Offset Network
approach for peer verification and be limited to the Network’s current recommendation to limit peer-
verified offsets to 30% of Scope 3 emissions. Note, however, the Offset Network plans to revisit this
recommendation given that the Network’s Peer Verification and Protocol Review processes have resulted
in offset projects that are of high enough quality to remove the limitation (R. Woodside, personal
communication, 2020).
Purchasing offsets on the open market is fairly straightforward and can be completed by working through
brokers who specialize in working with universities and can purchase in bulk on an annual basis. The
university could consider the “bundling” approach, which has been utilized by Duke University and Arizona
State University, among others, in partnership with the organization Urban Offsets, Inc. Projects the
university undertakes itself will take more time; for example, generation of credits from the Duke Urban
Forestry Protocol will not be realized for five years (Duke Carbon Offsets Initiative, 2018).
5.3.6. Needed research and planning
Campus Grounds and Forests
More detailed forest inventory, stewardship planning, an enhanced silvicultural strategies are needed for
each Rutgers University owned property with significant forest acreage. Further economic analysis is needed
to determine financial costs and benefits of on-campus afforestation projects as a strategy to generating
carbon credits as a means to offset campus emissions.
Offsets
It will be important to know the budget available for purchasing of offsets in the marketplace or developing
offset projects and to cost out various types of projects over various timelines. Furthermore, the university
must determine the method and mode by which it plans to purchase offsets from the voluntary marketplace
or develop offset projects. It should also determine if it plans to partner with the Offset Network to develop
protocols or utilize the Peer Verification Pathway.
5.3.7. Evaluation plan
Campus Grounds and Forests
Regular vegetation monitoring in needed on a 5 to 10 year return interval to ascertain the status of the
campus grounds, forest lands and whether plant cover and species composition targets are being met.
5 - 34
Offsets
Progress can be evaluated annually to measure the emissions reductions that Rutgers seeks to achieve in
relation to purchased offsets. Rutgers can also measure and monitor the progress of any type of legitimate
offset project it would develop and could use the peer-verification program established by the Offset
Network to independently audit and verify its findings.
5.3.8. Management roles
Campus Grounds and Forests
Some of the major University-owned forest properties, such as Hutcheson Memorial Forest and the
EcoPreserve, are overseen by Faculty directors. Additional oversight of other properties that have a
significant area of forest is needed.
Offsets
It will be important to understand where an offset program would be housed and managed and what other
resources will be available. For example, Duke University has two full time staff in its Office of
Sustainability, who only work on the Duke Carbon Offset Initiative (M. Arsenault & E. Fulop, personal
communication, 2020). Given that Rutgers University does not currently have an Office of Sustainability or
equivalent, it must be determined if such an office would need to be developed, and, if so, where it would
be housed within the University hierarchy. If an Office of Sustainability (or equivalent) were developed, it
would then need to be determined if the University requires at least one employee dedicated to the
development and management of an offset program.
5.3.9. Institutional, Organizational and Cultural Challenges to Implementation
Campus Grounds and Forests
The single most significant challenge facing the conversion of maintained lawn to eco/low mow are cultural
concerns associated with pest, disease vector insects, and the unkempt negative perception.
Offsets
Critics of carbon offsets argue that marketplace purchases of carbon credits are not a replacement
for emissions reductions: it is not acceptable to “lead a carbon-heavy lifestyle” so long as emissions
are offset (Sauer & Climate Home News, 2019). Furthermore, offset projects must meet
established guidelines, including the PAVER requirements outlined above. When Offsets fail to
meet PAVER requirements and are not paired with legitimate emissions reductions through
changes in practices, they do not effectively mitigate climate change. Although legitimate offset
projects, which are correctly verified, do serve to remove CO2e from the atmosphere, the public is
aware that not all projects are legitimate (Peach, 2019).
The University can address this concern through the purchase of legitimate, third-party verified offsets. The
university can also consider pairing their offset purchases with peer verified urban forestry projects in the
cities of New Brunswick, Newark, and Camden which would provide an additional offset. The university
could also establish a review process to establish criteria for and to vet proposed offset purchases it would
make on the voluntary market to ensure these not only met PAVER requirements, but also met other
concerns of the university community. For example, University of California established a Carbon
Abatement Technical Committee that spans all 9 of its campuses to advise the development of the offset
procurement strategy at University of California (University of California, 2020b). This committee serves to
evaluate the cost effectiveness, quality, and risk of public or environmental harm (University of California,

5 - 35
2020a). The university can also consider prioritizing emissions reductions through other methods, rather
than utilizing offsets as a primary means of achieving carbon neutrality.
5.3.10. Participation and Accountability
Campus Grounds and Forests
Greater integration of our forest properties into the Campus as Living Laboratory will help to ensure the
participation of the broader full university community.
Offsets
Rutgers could consider a partnership with local communities for urban forestry that would also engage
students and faculty, particularly if we became a member of the Offset Network and chose to utilize the
peer verification approach as previously described. This strategy would engage students, faculty, staff, and
communities adjacent to our campus and nearby. For example, the Offset Network Peer Review committee
recommends that projects remain local (i.e., within 100 miles) of the developing i nstitution.
Another strategy could be a program to offset university related travel (students, faculty, staff, athletics)
similar to those employed at other universities where a fund is established to support offset programs by
collecting a flat fee for every round trip airline journey. For example, Arizona State University purchases
sufficient offsets annually in order to offset air travel that is related to university business (faculty and staff
travel, athletic travel, study abroad travel). The purchases are financed through ASU’s carbon fund, which
is supported by a $12 flat fee applied to any round-trip university airline travel (C. Hawkey, personal
communication, 2020).
In another example, an academic institution, Duke University, partnered with the commercial airline, Delta,
to offset Duke business travel (Lucas, 2018). Delta was interested in offsetting its own emissions and
therefore with Duke combined resources to purchase offsets while also bundling that with support for urban
forestry in the Raleigh-Durham area. Approximately half of the urban forest projects were in historically
disadvantaged neighborhoods (S. Gagné, personal communication, 2020; Lucas, 2018). The International
Civil Aviation Organization’s Carbon Offsetting and Reduction Scheme for International Aviation
(CORSIA) required airlines to begin rigorously monitoring emissions in January 2019 and will require
airlines to cap emissions at 2020 levels beginning in 2021 (Gallant, 2018). With a nexus to a major
international airport and seaport, Rutgers could consider offset partnerships with commercial airlines and
potentially shipping companies.
Other strategies could include an idea for addressing campus emissions through natural carbon sinks has
been proposed by the nonprofit organization, Zerofoodprint (Zero Foodprint & Myint, 2020). In this
approach, a local carbon farming project would be conducted to enhance soil health on university land or a
farm that is within the university’s supply chain to offset emissions from campus dining. The annual costs
for the project could be borne voluntarily by student diners and calculated by aligning the cost of each ton
of carbon removal from the carbon farming project with the carbon footprint of a year’s worth of dining per
student per year or by imposing a flat surcharge. Students could opt in on their annual dining plan (A.
Myint, personal communication, 2020).
5.3.11. Contribution to Climate-Positive, Equitable, Sustainable Economic Development
Campus Grounds and Forests
The involvement of the University in carbon sequestration-climate resilient vegetation management activities
will serve to provide hands-on educate students in the process. Designing, implementing and validating

5 - 36
carbon offset credit programs will serve to provide hands-on educate students in the process. With New
Jersey’s membership in the Regional Greenhouse Gas Initiative, there should be a growing job market in
this arena.
Offsets
Any offsets purchased or developed by Rutgers University should be climate-positive if procured
or developed in a transparent framework such as through appropriate peer reviewed protocols and
standards and verified by a third party as noted above. In addition to PAVER requirements,
where appropriate, the University can also include a project buffer pool in its project accounting.
Buffer pools serve as an insurance mechanism, typically in forestry and land use project types, to
protect against a shortfall in predicted offset credits (Duke Carbon Offsets Initiative & Offset
Network, 2017; The Carbon Offset Research and Education Program, 2020) In the event of a
forest fire or severe drought, which could reverse emissions, credits can be supplemented via a
sufficiently-sized buffer pool (The Carbon Offset Research and Education Program, 2020). For
instance, if a given project is expected to yield 100 credits (100 tons CO2e) but yields only 80
credits due to a natural disturbance, a portion of the project buffer credits can be utilized to meet
accounting goals.
Furthermore, if the cost of an offset program at Rutgers University would be distributed evenly across the
university community, no single group of university community members would be expected to bear the
cost of offsetting the university’s emissions. Rutgers can also ensure equitability through co-benefits of urban
forestry offset projects which can be developed as well as implemented through external stakeholder
engagement. As previously stated, urban forestry projects can improve property values in the areas where
street trees are planted (Nowak et al., 2006). Furthermore, urban tree planting projects that have previously
taken place under the leadership of peer universities (Duke, Arizona State) have primarily taken place in
historically disadvantaged communities (M. Arsenault & E. Fulop, personal communication, 2020; S.
Gagné, personal communication, 2020). Forest planting projects that take place in the urban areas
surrounding Rutgers University properties should be of financial benefit to those communities, in addition
to their co-benefits on public health through the resulting decrease in air pollution, temperature reductions.
Urban forestry or coastal wetland restoration projects would, if implemented, contribute to future
sustainability of surrounding communities through increased resilience to storms.
5.3.12. Equity Concerns The equity and social implications of carbon offsets on host communities is an important consideration.
How offsets may result in new or additional constraints on emissions in developing or disadvantaged regions
and communities that would concurrently bear increased responsibility for operating as carbon sinks for
other regions and other unintended negative socio-economic consequences to citizens of these regions
should be evaluated (Wittman & Caron, 2009).
Although climate benefits are the currency of voluntary offsets, societal co-benefits are increasingly being
incorporated into offset standards including aligning co-benefits with the UN Sustainable Development
Goals (Hamrick & Gallant, 2018). Verra’s Sustainable Development Verified Impact Standard (SD Vista)
outlines “rules and criteria for the design, implementation and assessment of projects that aim to deliver
high-impact sustainable development benefits” ((Verra, 2020c). Similarly, Verra’s Climate, Community and
Biodiversity (CCB) Standards identify offset projects that support communities and biodiversity in addition
to addressing climate change (Verra, 2020a). Offsets that have met the standards outlined by these programs
are identified as such on the Verra Registry. Similarly, the Gold Standard considers sustainable
development goals in the development of its protocols (Gold Standard, 2020a).

5 - 37
Although social benefits are taken into account by the Duke Urban Forestry Protocol, the Offset Network
has not explicitly tackled equity (R. Woodside, personal communication, 2020). As previously stated, some
university-based urban forestry and bundling projects are typically run in historically underserved
communities; however these are not the only types of offset projects that are developed or purchased by
universities. Carbon offset projects could and should be undertaken in off-campus neighborhoods in
nearby urban areas such as New Brunswick, Camden and Newark.
As part of its mission, Duke University’s Carbon Offsets Initiative notes prioritization of local, state and
regional offsets that provide significant environmental, economic, and societal co-benefits that are beyond
the benefits of greenhouse gas reduction. Included within the societal co-benefits priorities are projects that
assist local and regional communities with respect to increased social equity; i.e., the offset project helps
increase the well-being of community members with low socio-economic status in order to decrease the
inequality gap and the benefits and costs of the project are shared equally by all project participants
regardless of age, religion, race, ethnicity, gender, socioeconomic level, and education background (Duke
Carbon Offsets Initiative, 2020c).
Rutgers could explore establishment of criteria for offsets that address co-benefits including equity criteria
for evaluation of offset or carbon sink protocols it develops or offsets that it purchases. For example, the
University of California has developed a set of Evaluation Criteria to apply to all voluntary market purchases
as well as peer-verified offsets. Although these criteria also address cost and quality, the offset project must
also have low risk of causing harm to people and ecosystems (University of California, 2020a).
5 - 38
APPENDIX A – References
A.1. Land Use References Clean Development Mechanism (CDM) AR-Tool 14 Methodological tool: Estimation of carbon stocks
and change in carbon stocks of trees and shrubs in A/R CDM project activities Version 04.2 United
Nations Framework Convention on Climate Change.
https://cdm.unfccc.int/methodologies/ARmethodologies/tools/ar-am-tool-14-v4.2.pdf
Duke University Afforestation protocol
https://static1.squarespace.com/static/57d1b5afc534a562b142a538/t/59540b1f2994ca99c1c4bf06/1
498680099890/AfforestationProtocolOption2.pdf
Duke University Urban Forest Protocol
https://static1.squarespace.com/static/57d1b5afc534a562b142a538/t/5ed117ceab1d9162b64bfba7/1
590761437362/Urban+Forestry+Carbon+Offset+Protocol+3.0
Lathrop, R.G. et al. 2011. Assessing the Potential for New Jersey Forests to Sequester Carbon and
Contribute to Greenhouse Gas Emissions Avoidance
http://www.crssa.rutgers.edu/projects/carbon/RU_Forest_Carbon_final.pdf
Minnesota Board of Soil and Water Resource, 2019. Carbon Sequestration in Grasslands.. Retrieved
September 07, 2020, from https://bwsr.state.mn.us/carbon-sequestration-grasslands
Natural Resources Conservation Service (NRCS) Best Management Practices manual. 2019.
https://efotg.sc.egov.usda.gov/references/public/NJ/FY2019_Scenarios.pdf
New Jersey Department of Environmental Protection (NJDEP). (2019). New Jersey Land Use/Land Cover
(LU/LC). Trenton, NJ. Accessed December 2019. 2015 LULC, 2012 LULC (updated)
https://gisdata-njdep.opendata.arcgis.com/datasets/land-use-land-cover-of-new-jersey-2015-download
Rutgers Develops Eco-Friendly Concrete. February 13, 2017. Rutgers Today.
https://www.rutgers.edu/news/rutgers-develops-eco-friendly-concrete
Tallgrass Ontario. 2020. Tallgrass Prairies and Carbon Sequestration. https://tallgrassontario.org/wp-
site/carbon-sequestration/
USGCRP. 2018. Second State of the Carbon Cycle Report. (2018). Available at:
https://carbon2018.globalchange.gov/chapter/10/ (Accessed: 4th September 2020)
Wilson, B.T., Woodall, C.W. & Griffith, D.M. Imputing forest carbon stock estimates from inventory plots
to a nationally continuous coverage. Carbon Balance Manage 8, 1 (2013).
https://doi.org/10.1186/1750-0680-8-1
Woodall, C.W.; Smith, J.; Nichols, M. 2013. Data sources and estimation/modeling procedures for
National Forest System carbon stocks and stock change estimates derived from the US National
Greenhouse Gas Inventory
https://www.fs.fed.us/climatechange/documents/NFSCarbonMethodology.pdf
A.2. Offsets References American Carbon Registry. (2020a). Truck Stop Electrification.
https://americancarbonregistry.org/resources/truck-stop-electrification
American Carbon Registry. (2020b). What We Do. American Carbon Registry: Harnessing the Power of
Markets to Improve the Environment. americancarbonregistry.org/how-it-works/what-we-do
American University. (2017, June 5). AU Invests in Project Offsetting Study Abroad-Related Travel
Emissions. American University. https://www.american.edu/finance/news/sustainability-offset-study-
abroad.cfm
Arizona State University. (2020). Urban Forestry Program Update FY19.
Arsenault, M., & Fulop, E. (2020). Followup to Our Call [Personal communication].
5 - 39
Barbier, E. B., Georgiou, I. Y., Enchelmeyer, B., & Reed, D. J. (2013). The Value of Wetlands in
Protecting Southeast Louisiana from Hurricane Storm Surges. PLoS ONE, 8(3), 1–6.
https://doi.org/10.1371/journal.pone.0058715
Berland, A., Shiflett, S. A., Shuster, W. D., Garmestani, A. S., Goddard, H. C., Herrmann, D. L., &
Hopton, M. E. (2017). The role of trees in urban stormwater management. Landscape and Urban Planning, 162, 167–177. https://doi.org/10.1016/j.landurbplan.2017.02.017
Boso, À., Oltra, C., & Hofflinger, Á. (2019). Participation in a programme for assisted replacement of
wood-burning stoves in Chile: The role of sociodemographic factors, evaluation of air quality and
risk perception. Energy Policy, 129, 1220–1226. https://doi.org/10.1016/j.enpol.2019.03.038
California Air Resources Board, & California Environmental Protection Agency. (2020). Compliance Offset Program: About. California Air Resources Board. https://ww2.arb.ca.gov/our-
work/programs/compliance-offset-program/about
Clements, B. W., & Casani, J. A. P. (2016). 13—Heat Waves. In B. W. Clements & J. A. P. Casani (Eds.),
Disasters and Public Health (Second Edition) (pp. 309–330). Butterworth-Heinemann.
https://doi.org/10.1016/B978-0-12-801980-1.00013-1
Climate Action Reserve. (2020). About Us. Climate Action Reserve. climateactionreserve.org/about-us/
Duke Carbon Offsets Initiative. (2018). Urban Forestry Carbon Offset Protocol 2.2. Duke University.
https://static1.squarespace.com/static/57d1b5afc534a562b142a538/t/5b9288fe0ebbe8aa1b969d1e/1
536329983674/UrbanForestryProtocol_v2.2.pdf
Duke Carbon Offsets Initiative. (2020a). Carbon Offset Portfolio.
https://sustainability.duke.edu/offsets/about/carbon-offset-portfolio
Duke Carbon Offsets Initiative. (2020b). FAQ. Duke Carbon Offsets Initiative.
https://sustainability.duke.edu/offsets/about/faq
Duke Carbon Offsets Initiative. (2020c). Guide to Carbon Offsets and Co-benefits.
https://sustainability.duke.edu/sites/default/files/cobenefitsguide.pdf
Duke Carbon Offsets Initiative. (2020d). Pocosin Wetland Restoration.
https://sustainability.duke.edu/offsets/projects/pocosin-wetland-restoration
Duke Carbon Offsets Initiative. (2020e). Swine Waste-to-Energy (Loyd Ray Farms). https://sustainability.duke.edu/offsets/projects/lrf
Duke Carbon Offsets Initiative, & Offset Network. (2017). Validation-Verification Terms 1.0.
static1.squarespace.com/static/57d1b5afc534a562b142a538/t/5a8c8a29085229adcd9043d9/151915
9850392/Verification_Terms.pdf
Edmondson, J. L., Stott, I., Davies, Z. G., Gaston, K. J., & Leake, J. R. (2016). Soil surface temperatures
reveal moderation of the urban heat island effect by trees and shrubs. Scientific Reports (Nature Publisher Group); London, 6, 33708.
http://dx.doi.org.proxy.libraries.rutgers.edu/10.1038/srep33708
EPA Green Power Partnership. (2018). Offsets and RECs: What’s the Difference?
Gagné, S. (2020). Urban Offsets [Personal communication].
Gallant, M. (2018, November 14). International Airlines Are Shaping Up As Big Force In Carbon
Offsetting. Ecosystem Marketplace. https://www.ecosystemmarketplace.com/articles/international-
airlines-are-shaping-up-as-big-force-in-carbon-offsetting/
Gold Standard. (2019). Certify a Project. Gold Standard for the Global Goals. www.goldstandard.org/take-
action/certify-project
Gold Standard. (2020a). Gold Standard for the Global Goals. https://www.goldstandard.org/articles/gold-
standard-global-goals
Gold Standard. (2020b). Myanmar Stoves Campaign. https://www.goldstandard.org/projects/myanmar-
stoves-campaign
Green Mountain Energy. (2015, March 30). Cheat Sheet: Differences Between Renewable Energy Certificates and Carbon Offsets. Green Mountain Energy Company.
https://www.greenmountainenergy.com/2015/03/cheat-sheet-differences-between-renewable-energy-
certificates-and-carbon-offsets/
5 - 40
Hamrick, K. (2019, April 3). Voluntary Carbon Markets 101, Forest Trends’ Ecosystem Marketplace.
Offset Network Peer Verification Training, Duke University.
https://www.youtube.com/watch?v=wRQ3fs9DopQ&feature=emb_title
Hamrick, K., & Gallant, M. (2018). Voluntary Carbon Markets Outlooks and Trends January to March 2018. Ecosystem Marketplace. https://www.forest-trends.org/publications/voluntary-carbon-
markets/
Hawkey, C. (2019). Carbon Pricing Outlook.
Hawkey, C. (2020). Question about an ASU program [WebEx].
Hayes, K. (2014, December 3). Managing university’s forests is another key piece of carbon-neutrality goal | Colgate University. https://www.colgate.edu/news/stories/managing-universitys-forests-another-key-
piece-carbon-neutrality-goal
Kornitas, M. (2020, September 11). Biogenic Emissions [Personal communication].
Loughner, C. P., Allen, D. J., Zhang, D.-L., Pickering, K. E., Dickerson, R. R., & Landry, L. (2012). Roles
of Urban Tree Canopy and Buildings in Urban Heat Island Effects: Parameterization and
Preliminary Results. Journal of Applied Meteorology and Climatology, 51(10), 1775–1793.
https://doi.org/10.1175/JAMC-D-11-0228.1
Lucas, T. (2018, January 23). Delta, Duke Launch Partnership to Offset Carbon Emissions. Nicholas School of the Environment. https://nicholas.duke.edu/news/delta-duke-launch-partnership-offset-
carbon-emissions
Myint, A. (2020). Zerofoodprint [Personal communication].
Nowak, D. J. (2017). Houston’s Urban Forest, 2015. United States Department of Agriculture, Forest
Service, Southern Research Station.
Nowak, D. J., Hirabayashi, S., Doyle, M., McGovern, M., & Pasher, J. (2018). Air pollution removal by
urban forests in Canada and its effect on air quality and human health. Urban Forestry & Urban
Greening, 29, 40–48. https://doi.org/10.1016/j.ufug.2017.10.019
Nowak, D. J., Hoehn, R. E. I., Crane, D. E., Stevens, J. C., & Walton, J. T. (2006). Assessing urban forest effects and values, Minneapolis’ urban forest (NE-RB-166; p. NE-RB-166). U.S. Department of
Agriculture, Forest Service, Northeastern Research Station. https://doi.org/10.2737/NE-RB-166
Offset Guide. (2020). Methane Capture. Carbon Offset Guide. https://www.offsetguide.org/avoiding-low-
quality-offsets/vetting-offset-projects/methane-capture/
Offset Network. (2020a). About The Offset Network: Frequently Asked Questions. The Offset Network.
offsetnetwork.secondnature.org/faq-1
Offset Network. (2020b). Peer Verification. The Offset Network. offsetnetwork.secondnature.org/peer-
verification
Peach, S. (2019, May 20). Are carbon offsets a scam? Yale Climate Connections.
https://yaleclimatemediaforum.org/2019/05/are-carbon-offsets-a-scam/
Sauer, N., & Climate Home News. (2019, June 12). UN retracts carbon offsetting critique. The Ecologist. https://theecologist.org/2019/jun/12/un-retracts-carbon-offsetting-critique
Second Nature. (2019). Annual Progress Evaluation for American University, 2019.
https://reporting.secondnature.org/ape/ape-public!752
Second Nature. (2020a). Purchasing Carbon Offsets FAQs. https://secondnature.org/climate-action-
guidance/purchasing-carbon-offsets-faqs/
Second Nature. (2020b). University Climate Change Coalition (UC3). https://www.google.com/maps/d/viewer?mid=12aMsR0Wp7uxB6MFINQi3BXAWAPZNHF_K
Soares, A. L., Rego, F. C., McPherson, E. G., Simpson, J. R., Peper, P. J., & Xiao, Q. (2011). Benefits and
costs of street trees in Lisbon, Portugal. Urban Forestry & Urban Greening, 10(2), 69–78.
https://doi.org/10.1016/j.ufug.2010.12.001
Solidia Solutions. https://www.solidiatech.com/solutions.html

5 - 41
The Carbon Offset Research and Education Program. (2020). How Carbon Offset Programs Address Permanence. Offset Guide. https://www.offsetguide.org/high-quality-offsets/permanence/how-
carbon-offset-programs-address-permanence/
The Regional Greenhouse Gas Initiative, Inc. (2020). Offsets. The Regional Greenhouse Gas Initiative: An
Initiative of the New England and Mid-Atlantic States of the US. https://www.rggi.org/allowance-
tracking/offsets#:~:text=The%20RGGI%20states%20cooperatively%20developed,verifiable%2C%2
0enforceable%2C%20and%20permanent.
University of California. (2020a). RFI for UC Offsets—Evaluation Criteria. https://sites.google.com/view/uc-
offsets-rfi/rfi-uc-initiated-offsets/evaluation-criteria
University of California. (2020b). UC’s Carbon Abatement Technical Committee.
https://www.ucop.edu/energy-services//carbon-offsets/contacts/index.html
Urban Offsets. (2018). Frequently Asked Questions. https://urbanoffsets.co/faq/
Verra. (2019). VCS Standard v4.0. https://verra.org/wp-content/uploads/2020/03/VCS-Standard-
v4.0_Updated.pdf
Verra. (2020a). Climate, Community & Biodiversity Standards. Verra. https://verra.org/project/ccb-
program/
Verra. (2020b). Greater Lebanon Refuse Authority Landfill Gas Collection and Combustion Project. https://registry.verra.org/app/projectDetail/VCS/5
Verra. (2020c). Sustainable Development Verified Impact Standard. Verra. https://verra.org/project/sd-
vista/
Verra. (2020d). What We Do. https://verra.org/about-verra/what-we-do/
Weiss, J., & Vujic, T. (2014). Financing Energy Efficiency-Based Carbon Offset Projects at Duke University. 24.
Wittman, H., & Caron, C. (2009). Carbon Offsets and Inequality: Social Costs and Co-Benefits in
Guatemala and Sri Lanka. Society and Natural Resources, 22(8), 710–726.
https://doi.org/10.1080/08941920802046858
Woodside, R. (2020). Offset Qs [Personal communication].
Zero Foodprint, & Myint, A. (2020). Campus Dining. Zero Foodprint.
https://www.zerofoodprint.org/campusdining

5 - 42
APPENDIX B – Land Use and Offset actions proposed as part of other Big10 and peer institutions plans
Actions
Co
rnel
l
Mic
hig
an
Oh
io S
tate
Illin
ois
Mar
y la
nd
Was
hin
gto
n
Ore
gon
St
ate
P
rin
ce t
on
U P
enn
Land Use actions
Develop estimates of carbon-capture potential on University lands
X X X
Afforestation - tree/shrub planting X X X X X X
Active forest/tree management for enhanced carbon sequestration but promote storm resiliency
X X
Enhanced soil organic carbon storage through application of biochar and compost
X X
Determine economic feasibility of management actions to increase carbon capture Actively seek public/private funding X
Monitor regulatory environment and carbon markets
X X
Reduce carbon emissions of landscape management practices Increase eco/low mow zones and low maintenance lawns and sustainable plantings
X X X
Reduce lawn area X X X
Increase sustainable plantings X X
Replace equipment with low emission models
Reduce building energy use by strategic planting of trees and shrubs
Reduce Agricultural land emissions
Perform comprehensive assessment of GHG emissions and plan for reduction
X
Convert some portion of cropland to Ag forestry X X
Change cropland ag practices and animal husbandry practices
X
Integrating Teaching
Campus as Living Laboratory to promote teaching and research on sustainability
X X
Offsets Investigate mission-linked offsets and develop criteria for offset purchases
X X X X X
Allow campus units to voluntarily purchase offsets X
Local or regional linked mission offsets X X


