Page 1
201
1 02
Solutions Manual for Algebra and Trigonometry 4th Edition by Blitzer Link download full: https://testbankservice.com/download/solutions-manual-for-algebra-and-
trigonometry-4th-edition-by-blitzer/
Test Bank for Algebra and Trigonometry 4th Edition by Blitzer Link download full: https://testbankservice.com/download/test-bank-for-algebra-and-
trigonometry-4th-edition-by-blitzer/
Solutions Manual/Chapter 2: Functions And Graphs Section 2.1
Check Point Exercises
1. The domain is the set of all first components: {0, 10, 5.
20, 30, 36}. The range is the set of all second
components: {9.1, 6.7, 10.7, 13.2, 17.4}.
2. a. The relation is not a function since the two
ordered pairs (5, 6) and (5, 8) have the same
first component but different second
components.
b. The relation is a function since no two ordered
pairs have the same first component and
different second components.
3. a. 2x y 6
y 2x 6
For each value of x, there is one and only one
value for y, so the equation defines y as a
function of x.
b. x2 y
2 1
y2 1 x
2
y
Since there are values of x (all values between –
1 and 1 exclusive) that give more than one
value for y (for example, if x = 0, then
y 1 ), the equation does not
4. a.
b.
define y as a function of x.
f (5) (5)2 2(5) 7
25 (10) 7
42
f (x 4) (x 4)2 2(x 4) 7
x2 8x 16 2x 8 7
x2 6x 15
The graph of g is the graph of f shifted down 3
units.
6. The graph (c) fails the vertical line test and is
therefore not a function.
y is a function of x for the graphs in (a) and (b).
c. f (x) (x)
2 2( x) 7
7. a. f (5) 400
x2 (2x) 7
b. x 9 , f (9) 100
x2 2x 7 c. The minimum T cell count in the asymptomatic
stage is approximately 425.
1 x2
x f x 2x x, y
-2 –4 2, 4
-1 –2 1, 2
0 0 0, 0
1 2 1, 2
2 4 2, 4
x g x 2x 3 x, y
-2 g 2 2(2) 3 7 2, 7
-1 g 1 2(1) 3 5 1, 5
0 g 0 2(0) 3 3 0, 3
1 g 1 2(1) 3 1 1, 1
2 g 2 2(2) 3 1 2,1
Page 2
202
Functions and Graphs
8. a. domain: x 2 x 1 or 2,1.
range: y 0 y 3 or 0, 3.
9. The relation is not a function since there are ordered
pairs with the same first component and different
second components. The domain is {1} and the range
is {4, 5, 6}.
b. domain: x 2 x 1 or 2,1.
range: y 1 y 2 or 1, 2.
10. The relation is a function since there are no two
ordered pairs that have the same first component and
different second components. The domain is {4, 5, 6} and the range is {1}.
c. domain: x 3 x 0 or 3, 0.
range: y y 3, 2, 1.
Exercise Set 2.1
1. The relation is a function since no two ordered pairs
have the same first component and different second
components. The domain is {1, 3, 5} and the range is
{2, 4, 5}.
2. The relation is a function because no two ordered
pairs have the same first component and different
second components The domain is {4, 6, 8} and the
range is {5, 7, 8}.
3. The relation is not a function since the two ordered
pairs (3, 4) and (3, 5) have the same first component
but different second components (the same could be
said for the ordered pairs (4, 4) and (4, 5)). The
domain is {3, 4} and the range is {4, 5}.
4. The relation is not a function since the two ordered
pairs (5, 6) and (5, 7) have the same first component
but different second components (the same could be
said for the ordered pairs (6, 6) and (6, 7)). The
domain is {5, 6} and the range is {6, 7}.
5. The relation is a function because no two ordered
pairs have the same first component and different
second components The domain is
{3, 4, 5, 7} and the range is {–2, 1, 9}.
6. The relation is a function because no two ordered
pairs have the same first component and different
second components The domain is
{–2, –1, 5, 10} and the range is {1, 4, 6}.
7. The relation is a function since there are no same first
components with different second components. The
domain is {–3, –2, –1, 0} and the range is {–3, –2, –
1, 0}.
8. The relation is a function since there are no ordered
pairs that have the same first component but different
second components. The domain is {–7, –5, –3, 0}
and the range is {–7, –5, –3, 0}.
11.
12.
13.
14.
15.
16.
17.
x y 16
y 16 x
Since only one value of y can be obtained for each
value of x, y is a function of x.
x y 25
y 25 x
Since only one value of y can be obtained for each
value of x, y is a function of x.
x2 y 16
y 16 x2
Since only one value of y can be obtained for each
value of x, y is a function of x.
x2 y 25
y 25 x2
Since only one value of y can be obtained for each
value of x, y is a function of x.
x2 y
2 16
y2 16 x
2
y
If x = 0, y 4.
Since two values, y = 4 and y = – 4, can be obtained
for one value of x, y is not a function of x.
x2 y
2 25
y2 25 x
2
y
If x 0, y 5.
Since two values, y = 5 and y = –5, can be obtained
for one value of x, y is not a function of x.
x y2
y
If x = 1, y 1.
Since two values, y = 1 and y = –1, can be obtained
for x = 1, y is not a function of x.
16 x2
25 x2
x
Page 3
Algebra and Trigonometry 4E Section 2.1
203
4x
18. 4x y2
y
2
26.
x y 5
y x 5
If x 1, then y 2.
Since two values, y = 2 and y = –2, can be obtained
for x = 1, y is not a function of x.
y x 5
Since only one value of y can be obtained for each
value of x, y is a function of x.
19.
20.
21.
y x 4
Since only one value of y can be obtained for each
value of x, y is a function of x.
y
Since only one value of y can be obtained for each
value of x, y is a function of x.
x y3 8
y3 8 x
27. a. f(6) = 4(6) + 5 = 29
b. f(x + 1) = 4(x + 1) + 5 = 4x + 9
c. f(–x) = 4(–x) + 5 = – 4x + 5
28. a. f(4) = 3(4) + 7 = 19
b. f(x + 1) = 3(x + 1) + 7 = 3x + 10
c. f(–x) = 3(–x) + 7 = –3x + 7
29. a. 2
g(1) (1) 2(1) 3
y
Since only one value of y can be obtained for each
value of x, y is a function of x.
1 2 3
2
b. g(x 5) (x 5)2 2(x 5) 3
22. x y3 27
y3 27 x
y 3 27 x
x2 10x 25 2x 10 3
x2 12x 38
23.
Since only one value of y can be obtained for each
value of x, y is a function of x.
xy 2 y 1
y x 2 1
c.
30. a.
g(x) (x)2 2(x) 3
x2 2x 3
g(1) (1)2 10(1) 3
110 3
y 1
x 2
8
b. g(x 2) (x 2)2 10(8 2) 3
24.
Since only one value of y can be obtained for each
value of x, y is a function of x.
xy 5 y 1
y x 5 1
1
x2 4x 4 10x 20 3
x2 6x 19
c. g ( x) ( x)2 10( x) 3
x2 10x 3
y x 5 31. a. h(2) 2
4 2
2 1
25.
Since only one value of y can be obtained for each
value of x, y is a function of x.
x y 2
y x 2
y x 2
Since only one value of y can be obtained for each
value of x, y is a function of x.
16 4 1
13
b. h(1) (1)4 (1)
2 1
111
1
c. h(x) (x)4 (x)
2 1 x
4 x
2 1
d. h(3a) (3a)4 (3a)
2 1
81a4 9a
2 1
x
x 4
3 8 x
Page 4
204
Functions and Graphs
0
x
9 5 3
x 6
32. a. h(3) 3
3 3 1 25
4(2)
3 1 33
b. h(2) (2)
3 (2) 1
36. a. f (2) 2
3 8
8 2 1 4(2)3 1
31 31
5 b. f (2)
(2)3
8
8
c. h(x) (x)3 (x) 1 x
3 x 1
c. f (x) 4(x)
3 1
(x)3
4x3 1
x3
d. h(3a) (3a)3 (3a) 1
4 3
27a3 3a 1
or x 1
x3
33. a.
b.
f (6)
f (10)
3 3 3
10 6 3
16 3
37. a.
b.
f (6) 6 1
6
f (6) 6
6
1
4 3
7
6 6
c.
34. a.
f (x 6)
f (16)
3 3
6 6 3 6 3
c. f (r 2 )
r r2
r 2
r 2 1
8
b. f (24)
25 (24) 6
38. a. f (5) 1 5 3 8
49 6 b. f (5) 5 3 2
2
1
7 6 1 5 3 2 2
c. f (25 2x)
25 (25 2x) 6
2x 6
9 x 3 c. f (9 x)
9 x 3
1, if x 6
35. a.
4(2)2 1 15
f (2)
x 6 1, if x 6
22
4
4(2)2 1 15
b. f (2) (2)
2
4
4( x)2 1 4x
2 1
c. f (x) (x)
2
x
2
6 6
x 6 6
25 16
2
Page 5
Algebra and Trigonometry 4E Section 2.1
205
39.
40.
x f x x x, y
2 f 2 2 2, 2
1 f 1 1 1, 1
0 f 0 0 0, 0
1 f 1 1 1,1
2 f 2 2 2, 2
x g x x 3 x, y
2 g 2 2 3 1 2,1
1 g 1 1 3 2 1, 2
0 g 0 0 3 3 0, 3
1 g 1 1 3 4 1, 4
2 g 2 2 3 5 2, 5
The graph of g is the graph of f shifted up 3 units.
x f x x x, y
2 f 2 2 2, 2
1 f 1 1 1, 1
0 f 0 0 0, 0
1 f 1 1 1,1
2 f 2 2 2, 2
41.
The graph of g is the graph of f shifted down 4 units.
x f x 2x x, y
–2 f 2 2 2 4 2, 4
–1 f 1 2 1 2 1, 2
0 f 0 2 0 0 0, 0
1 f 1 2 1 2 1, 2
2 f 2 2 2 4 2, 4
x g x 2x 1 x, y
–2 g 2 2 2 1 3 2, 3
–1 g 1 2 1 1 1 1,1
0 g 0 2 0 1 1 0, 1
1 g 1 2 1 1 3 1, 3
2 g 2 22 1 5 2, 5
The graph of g is the graph of f shifted down 1 unit.
x g x x 4 x, y
2 g 2 2 4 6 2, 6
1 g 1 1 4 5 1, 5
0 g 0 0 4 4 0, 4
1 g 1 1 4 3 1, 3
2 g 2 2 4 2 2, 2
Page 6
206
Functions and Graphs
42.
43.
x f x 2x x, y
–2 f 2 2 2 4 2, 4
–1 f 1 2 1 2 1, 2
0 f 0 2 0 0 0, 0
1 f 1 2 1 2 1, 2
2 f 2 2 2 4 2, 4
x g x 2x 3 x, y
–2 g 2 2 2 3 7 2, 7
–1 g 1 2 1 3 5 1, 5
0 g 0 2 0 3 3 0, 3
1 g 1 2 1 3 1 1,1
2 g 2 2 2 3 1 2, 1
The graph of g is the graph of f shifted up 3 units.
x f x x2 x, y
2 f 2 22 4 2, 4
1 f 1 12 1 1,1
0 f 0 02 0 0, 0
1 f 1 12 1 1,1
2 f 2 22 4 2, 4
44.
The graph of g is the graph of f shifted up 1 unit.
x f x x2 x, y
2 f 2 22 4 2, 4
1 f 1 12 1 1,1
0 f 0 02 0 0, 0
1 f 1 12 1 1,1
2 f 2 22 4 2, 4
x g x x2 2 x, y
2 g 2 22 2 2 2, 2
1 g 1 12 2 1 1, 1
0 g 0 02 2 2 0, 2
1 g 1 12 2 1 1, 1
2 g 2 22 2 2 2, 2
The graph of g is the graph of f shifted down 2 units.
x g x x2 1 x, y
2 g 2 22 1 5 2, 5
1 g 1 12
1 2 1, 2
0 g 0 02 1 1 0,1
1 g 1 12 1 2 1, 2
2 g 2 22 1 5 2, 5
Page 7
Algebra and Trigonometry 4E Section 2.1
207
45.
46.
The graph of g is the graph of f shifted down 2 units.
x f x x x, y
2 f 2 2 2 2, 2
1 f 1 1 1 1,1
0 f 0 0 0 0, 0
1 f 1 1 1 1,1
2 f 2 2 2 2, 2
47.
The graph of g is the graph of f shifted up 1 unit.
x f x x3
x, y
2 f 2 2
3 8 2, 8
1 f 1 1
3 1 1, 1
0 f 0 03 0 0, 0
1 f 1 13 1 1,1
2 f 2 23 8 2,8
x g x x3 2 x, y
2 g 2 23 2 6 2, 6
1 g 1 13 2 1 1,1
0 g 0 03 2 2 0, 2
1 g 1 13 2 3 1, 3
2 g 2 23 2 10 2,10
The graph of g is the graph of f shifted up 2 units.
x f x x x, y
2 f 2 2 2 2, 2
1 f 1 1 1 1,1
0 f 0 0 0 0, 0
1 f 1 1 1 1,1
2 f 2 2 2 2, 2
x g x x 2 x, y
2 g 2 2 2 0 2, 0
1 g 1 1 2 1 1, 1
0 g 0 0 2 2 0, 2
1 g 1 1 2 1 1, 1
2 g 2 2 2 0 2, 0
x g x x 1 x, y
2 g 2 2 1 3 2, 3
1 g 1 1 1 2 1, 2
0 g 0 0 1 1 0,1
1 g 1 1 1 2 1, 2
2 g 2 2 1 3 2,3
Page 8
208
Functions and Graphs
48.
49.
x f x x3
x, y
2 f 2 23 8 2, 8
1 f 1 13 1 1, 1
0 f 0 03 0 0, 0
1 f 1 13 1 1,1
2 f 2 23 8 2,8
x g x x3 1 x, y
2 g 2 23 1 9 2, 9
1 g 1 13 1 2 1, 2
0 g 0 03 1 1 0, 1
1 g 1 13 1 0 1, 0
2 g 2 23 1 7 2, 7
The graph of g is the graph of f shifted down 1 unit.
x f x 3 x, y
2 f 2 3 2, 3
1 f 1 3 1,3
0 f 0 3 0, 3
1 f 1 3 1, 3
2 f 2 3 2,3
50.
The graph of g is the graph of f shifted up 2 units.
x f x 1 x, y
2 f 2 1 2, 1
1 f 1 1 1, 1
0 f 0 1 0, 1
1 f 1 1 1, 1
2 f 2 1 2, 1
x g x 4 x, y
2 g 2 4 2, 4
1 g 1 4 1, 4
0 g 0 4 0, 4
1 g 1 4 1, 4
2 g 2 4 2, 4
The graph of g is the graph of f shifted up 5 units. x g x 5 x, y
2 g 2 5 2, 5
1 g 1 5 1,5
0 g 0 5 0, 5
1 g 1 5 1, 5
2 g 2 5 2, 5
Page 9
Algebra and Trigonometry 4E Section 2.1
209
51.
52.
x f x x x, y
0 f 0 0 0 0, 0
1 f 1 1 1 1,1
4 f 4 4 2 4, 2
9 f 9 9 3 9, 3
x g x x 1 x, y
0 g 0 0 1 1 0, 1
1 g 1 1 1 0 1, 0
4 g 4 4 1 1 4,1
9 g 9 9 1 2 9, 2
The graph of g is the graph of f shifted down 1 unit.
x f x x x, y
0 f 0 0 0 0, 0
1 f 1 1 1 1,1
4 f 4 4 2 4, 2
9 f 9 9 3 9, 3
x g x x 2 x, y
0 g 0 0 2 2 0, 2
1 g 1 1 2 3 1, 3
4 g 4 4 2 4 4, 4
9 g 9 9 2 5 9, 5
The graph of g is the graph of f shifted up 2 units.
53.
x f x x x, y
0 f 0 0 0 0, 0
1 f 1 1 1 1,1
4 f 4 4 2 4, 2
9 f 9 9 3 9, 3
x g x x 1 x, y
1 g 1 11 0 1, 0
2 g 2 2 1 1 2,1
5 g 5 5 1 2 5, 2
10 g 10 10 1 3 10,3
The graph of g is the graph of f shifted right 1 unit.
Page 10
Functions and Graphs
210
54.
68.
69.
70.
71.
72.
73.
74.
f (4) 4
f 3 0
f (1) 0
g 4 2
g 2 2
g 10 2
g (10) 2
75. When x 2, g x 1.
76. When x 1, g(x) 1.
77. a. domain: (, )
b. range: [4, )
c. x-intercepts: –3 and 1
d. y-intercept: –3
The graph of g is the graph of f shifted left 2 units. e. f (2) 3 and f (2) 5
55. function 78. a. domain: (–∞, ∞)
56. function b. range: (–∞, 4]
57. function
c. x-intercepts: –3 and 1
58. not a function
d. y-intercept: 3
59. not a function
e. f (2) 3 and f (2) 5
60. not a function 79. a. domain: (, )
61. function
b. range: [1, )
62. not a function
c. x-intercept: none
63. function d. y-intercept: 1
64. function e. f (1) 2 and f (3) 4
65. f 2 4
66. f (2) 4
67. f 4 4
x f x x x, y
0 f 0 0 0 0, 0
1 f 1 1 1 1,1
4 f 4 4 2 4, 2
9 f 9 9 3 9, 3
x g x x 2 x, y
–2 g 2 2 2 0 2, 0
–1 g 1 1 2 1 1,1
2 g 2 2 2 2 2, 2
7 g 7 7 2 3 7,3
Page 11
Algebra and Trigonometry 4E Section 2.1
211
80. a. domain: (–∞, ∞)
b. range: [0, ∞)
c. x-intercept: –1
d. y-intercept: 1
e. f(–4) = 3 and f(3) = 4
81. a. domain: [0, 5)
b. range: [–1, 5)
c. x-intercept: 2
d. y-intercept: –1
e. f(3) = 1
82. a. domain: (–6, 0]
b. range: [–3, 4)
c. x-intercept: –3.75
d. y-intercept: –3
e. f(–5) = 2
83. a. domain: [0, )
b. range: [1, )
c. x-intercept: none
d. y-intercept: 1
e. f(4) = 3
84. a. domain: [–1, ∞)
b. range: [0, ∞)
c. x-intercept: –1
d. y-intercept: 1
e. f(3) = 2
85. a. domain: [–2, 6]
b. range: [–2, 6]
c. x-intercept: 4
d. y-intercept: 4
e. f(–1) = 5
86. a. domain: [–3, 2]
b. range: [–5, 5]
c. x-intercept: 1
2
d. y-intercept: 1
e. f(–2) = –3
87. a. domain: (, )
b. range: (, 2]
c. x-intercept: none
d. y-intercept: –2
e. f(–4) = –5 and f(4) = –2
88. a. domain: (–∞, ∞)
b. range: [0, ∞)
c. x-intercept: x x 0
d. y-intercept: 0
e. f(–2) = 0 and f(2) = 4
89. a. domain: (, )
b. range: (0, )
c. x-intercept: none
d. y-intercept: 1.5
e. f(4) = 6
90. a. domain: (,1) ∪ (1, )
b. range: (, 0) ∪ (0, )
c.
d.
x-intercept: none
y-intercept: 1
e. f(2) = 1
91. a. domain: {–5, –2, 0, 1, 3}
b. range: {2}
c. x-intercept: none
d. y-intercept: 2
e. f (5) f (3) 2 2 4
Page 12
212
Functions and Graphs
3 1
92. a. domain: {–5, –2, 0, 1, 4}
b. range: {–2}
c. x-intercept: none
d. y-intercept: –2
e.
93.
f (5) f (4) 2 (2) 4
g 1 31 5 3 5 2
f g 1 f 2 22 2 4
4 2 4 10
94. g 1 31 5 3 5 8
f g 1 f 8 82 8 4
64 8 4 76
95. 62 6 6 4
3 1 36 6 6 4
4 36 1 4
2 36 4
34 4
38
96. 4 1 32 3 3 6
4 1 9 3 3 6
3 9 16
3 9 6 6 6 0
97. f x f x
x3 x 5 (x
3 x 5)
x3 x 5 x
3 x 5 2x
3 2x
98. f x f x
x2 3x 7 x
2 3x 7
x2 3x 7 x
2 3x 7
6x
99. a. Iceland, 9.7, Finland, 9.6, New Zealand, 9.6, Denmark, 9.5
b. Yes, the relation is a function. Each element in the domain corresponds to only one element in the range.
c. 9.7, Iceland, 9.6, Finland, 9.6, New Zealand, 9.5, Denmark
d. No, the relation is not a function. 9.6 in the domain corresponds to both Finland and New Zealand in the range.
Page 13
Algebra and Trigonometry 4E Section 2.1
213
100. a. Bangladesh, 1.7, Chad, 1.7, Haiti, 1.8, Myanmar, 1.8
b. Yes, the relation is a function. Each element in the domain corresponds to only one element in the range.
c. 1.7, Bangladesh, 1.7, Chad, 1.8, Haiti, 1.8, Myanmar
d. No, the relation is not a function. 1.7 in the domain corresponds to both Bangladesh and Chad in the range.
101. a.
b.
f (70) 83 which means the chance that a 60-year old will survive to age 70 is 83%.
g (70) 76 which means the chance that a 60-year old will survive to age 70 is 76%.
c. Function f is the better model.
102. a.
b.
f (90) 25 which means the chance that a 60-year old will survive to age 90 is 25%.
g(90) 10 which means the chance that a 60-year old will survive to age 90 is 10%.
c. Function f is the better model.
103. a.
b.
T (x) 0.125x2 5.25x 72
T (20) 0.125(20)2 5.25(20) 72 127
Americans ordered an average of 127 takeout meals per person 20 years after 1984, or 2004.
This is represented on the graph by the point (20,127).
R(x) 0.6x 94
R(0) 0.6(0) 94 94
Americans ordered an average of 94 meals in restaurants per person 0 years after 1984, or 1984.
This is represented on the graph by the point (0,94).
c. According to the graphs, the average number of takeout orders approximately equaled the average number of in-
restaurant meals 4 years after 1984, or 1988.
T (x) 0.125x2 5.25x 72
T (4) 0.125(4)2 5.25(4) 72 91
In 1988 Americans ordered an average of 91 takeout meals per person.
R(x) 0.6x 94
R(4) 0.6(4) 94 91.6
In 1988 Americans ordered an average of 91.6 meals in restaurants per person.
104. a.
b.
T (x) 0.125x2 5.25x 72
T (18) 0.125(18)2 5.25(18) 72 126
Americans ordered an average of 126 takeout meals per person 18 years after 1984, or 2002.
This is represented on the graph by the point (18,126).
R(x) 0.6x 94
R(20) 0.6(20) 94 82
Americans ordered an average of 82 meals in restaurants per person 20 years after 1984, or 2004.
This is represented on the graph by the point (20,82).
Page 14
214
Functions and Graphs
105.
C(x) 100, 000 100x
C(90) 100, 000 100(90) $109, 000
125. false; Changes to make the statement true will vary.
A sample change is: f (0) 0.8
It will cost $109,000 to produce 90 bicycles.
106. V (x) 22, 500 3200x
V (3) 22, 500 3200(3) $12, 900
After 3 years, the car will be worth $12,900.
126. f (a h) 3(a h) 7 3a 3h 7
f (a) 3a 7
f (a h) f (a)
h
3a 3h 7 3a 7
107. T x
40
40
x x 30
T 30 40
40
30 30 30
80
40
60 60
h
3a 3h 7 3a 7
3h
3
h h
127. Answers may vary.
An example is {(1,1),(2,1)}
120 128. It is given that f (x y) f (x) f ( y) and f (1) 3 .
108.
60
2
If you travel 30 mph going and 60 mph returning,
your total trip will take 2 hours.
S(x) 0.10x 0.60(50 x)
S (30) 0.10(30) 0.60(50 30) 15
When 30 mL of the 10% mixture is mixed with 20
mL of the 60% mixture, there will be 15 mL of
sodium-iodine in the vaccine.
To find f (2) , rewrite 2 as 1 + 1.
f (2) f (11) f (1) f (1)
3 3 6
Similarly:
f (3) f (2 1) f (2) f (1)
6 3 9
f (4) f (3 1) f (3) f (1)
9 3 12
While f (x y) f (x) f ( y) is true for this function,
109. – 117. Answers may vary.
118. makes sense
119. does not make sense; Explanations will vary.
Sample explanation: The parentheses used in
function notation, such as f (x), do not imply
multiplication.
120. does not make sense; Explanations will vary.
Sample explanation: The domain is the number of
years worked for the company.
121. does not make sense; Explanations will vary.
Sample explanation: This would not be a function
because some elements in the domain would
correspond to more than one age in the range.
122. false; Changes to make the statement true will vary.
A sample change is: The domain is [4, 4].
123. false; Changes to make the statement true will vary.
A sample change is: The range is 2, 2.
124. true
129.
130.
131.
it is not true for all functions. It is not true
for f x x2 , for example.
C(t) 20 0.40(t 60)
C(100) 20 0.40(100 60)
20 0.40(40)
20 16
36
For 100 calling minutes, the monthly cost is $36.
2(x h)2 3(x h) 5 (2x
2 3x 5)
2(x2 2xh h
2 ) 3x 3h 5 2x
2 3x 5
2x2 4xh 2h
2 3x 3h 5 2x
2 3x 5
2x2 2x
2 4xh 2h
2 3x 3x 3h 5 5
4xh 2h2 3h
Page 15
Algebra and Trigonometry 4E Section 2.2
215
20 0.40(t 60) if t 60
Section 2.2
Check Point Exercises
b. f (x h) f (x)
h
2x2 4xh 2h
2 x h 5 2x
2 x 5
1. The function is increasing on the interval (–∞, –1),
h
decreasing on the interval (–1, 1), and increasing on
the interval (1, ∞). 2x
2 4xh 2h
2 x h 5 2x
2 x 5
h
2. a. f (x) (x)2 6 x
2 6 f (x)
The function is even. 4xh 2h
2 h
h h 4x 2h 1
b. g(x) 7(x)3 (x) 7 x
3 x f (x)
h
The function is odd.
c. h(x) (x)5 1 x
5 1
The function is neither even nor odd.
3. C(t) 20 if 0 t 60
4x 2h 1
Exercise Set 2.2
1. a. increasing: (1, )
b. Since 0 40 60 , C(40) 20 b. decreasing: (, 1)
With 40 calling minutes, the cost is $20.
This is represented by 40, 20 .
c. Since 80 60 ,
C(80) 20 0.40(80 60) 28
With 80 calling minutes, the cost is $28.
This is represented by 80, 28 .
c. constant: none
2. a. increasing: (–∞, –1)
b. decreasing: (–1, ∞)
c. constant: none
4.
5. a.
f (x) 2x
2 x 5
f (x h) 2(x h)2 (x h) 5
2(x2 2xh h
2 ) x h 5
2x2 4xh 2h
2 x h 5
3. a. increasing: (0, )
b. decreasing: none
c. constant: none
4. a. increasing: (–1, ∞)
b. decreasing: none
c. constant: none
5. a. increasing: none
b. decreasing: (–2, 6)
c. constant: none
6. a. increasing: (–3, 2)
b. decreasing: none
c. constant: none
Page 16
216
Functions and Graphs
7. a. increasing: (, 1)
b. decreasing: none
c. constant: (1, )
8. a. increasing: (0, ∞)
b. decreasing: none
c. constant: (–∞, 0)
9. a. increasing: (, 0) or (1.5, 3)
b. decreasing: (0,1.5) or (3, )
c. constant: none
10. a. increasing: (5, 4) or (2, 0) or (2, 4)
b. decreasing: (4, 2) or (0, 2) or (4, 5)
c. constant: none
11. a. increasing: (–2, 4)
b. decreasing: none
c. constant: (, 2) or (4, )
12. a. increasing: none
b. decreasing: (–4, 2)
c. constant: (, 4) or (2, )
13. a. x = 0, relative maximum = 4
b. x = −3, 3, relative minimum = 0
14. a. x = 0, relative maximum = 2
b. x = −3, 3, relative minimum = –1
15. a. x = −2, relative maximum = 21
b. x = 1, relative minimum = −6
16. a. x =1, relative maximum = 30
b. x = 4, relative minimum = 3
17.
18.
19.
20.
21.
22.
23.
24.
f (x) x
3 x
f (x) (x)3 ( x)
f (x) x3 x (x
3 x)
f (x) f (x), odd function
f (x) x
3 x
f (x) (x)3 (x)
f (x) x3 x (x
3 x)
f (x) f (x), odd function
g(x) x2 x
g(x) (x)2 (x)
g(x) x2 x, neither
g(x) x
2 x
g(x) (x)2 ( x)
g(x) x2 x, neither
h(x) x2 x
4
h(x) (x)2 (x)
4
h(x) x2 x
4
h(x) h(x), even function
h(x) 2x
2 x
4
h(x) 2(x)2 (x)
4
h(x) 2x2 x
4
h(x) h(x), even function
f (x) x
2 x
4 1
f (x) (x)2 (x)
4 1
f (x) x2 x
4 1
f (x) f (x), even function
f (x) 2x
2 x
4 1
f (x) 2(x)2 (x)
4 1
f (x) 2x2 x
4 1
f (x) f (x), even function
Page 17
Algebra and Trigonometry 4E Section 2.2
217
25. f (x) 1
x6 3x
2
5
f (x) 1
(x)6 3(x)
2
5
f. 0, 4
g. ,0
26.
f (x) 1
x6 3x
2
5
f (x) f (x) , even function
f (x) 2x
3 6x
5
f (x) 2(x)3 6(x)
5 f
(x) 2x3 6x
5
h. x 4
i. y 4
j. f (3) 4
k. f (2) 2 and
f (6) 2
27.
f (x) (2x3 6x
5 )
f (x) f (x), odd function
f (x) x
f (x) x
f (x) x
x 1 x2
f(–x) = – f(x), odd function
l. neither ; f (x) x ,
34. a. domain: ,
b. range: ,4
c. x-intercepts: –4, 4
d. y-intercept: 1
e. , 2 or 0, 3
f (x) x
28. f x x2
1 x2 f. 2, 0 or 3,
f x x2
f x x2
g. , 4 or 4,
f(–x) = f(x), even function h. x 2 and x 3
29. The graph is symmetric with respect to the y-axis.
The function is even.
30. The graph is symmetric with respect to the origin.
i. f (2) 4 and
j. f (2) 4
f (3) 2
The function is odd.
31. The graph is symmetric with respect to the origin.
The function is odd.
32. The graph is not symmetric with respect to the y-axis
or the origin. The function is neither even nor odd.
33. a. domain: ,
b. range: 4,
k. x 4 and x 4
l. neither ; f (x) x ,
35. a. domain: , 3
b. range: ,4
c. x-intercepts: –3, 3
f (x) x
c. x-intercepts: 1, 7
d. y-intercept: 4
e. 4,
d. f (0) 3
e. ,1
f. 1, 3
1 x2
1 (x)2
1 x2
1 x2
1 x2
Page 18
218
Functions and Graphs
g. , 3 41. a.
52 9 25 9 16
h(5) 8 5 3 2 2
h. f (1) 4
i. x 1 b. h(0)
02 9
0 3 9
3
3
j. positive; f (1) 2 c. h(3) = 6
36. a. domain: ,6
b. range: ,1
42. a. 7
2 25 49 25 24
h(7) 12 7 5 2 2
c. zeros of f: –3, 3 b. h(0)
02 25
0 5
25 5
5
d. f (0) 1
e. , 2
f. 2, 6
g. 2, 2
h. 3, 3
c. h(5) = 10
43. a.
i. x 5 and x 5
j. negative;
k. neither
f (4) 1 b. range: 0,
44. a.
l. no; f(2) is not greater than the function values to
the immediate left.
37. a. f(–2) = 3(–2) + 5 = –1
b. f(0) = 4(0) + 7 = 7
c. f(3) = 4(3) + 7 = 19
38. a. f(–3) = 6(–3) – 1 = –19
b. f(0) = 7(0) + 3 = 3
c. f(4) = 7(4) + 3 = 31
39. a. g(0) = 0 + 3 = 3
b. g(–6) = –(–6 + 3) = –(–3) = 3
c. g(–3) = –3 + 3 = 0
40. a. g(0) = 0 + 5 = 5
b. g(–6) = –(–6 + 5) = –(–1) = 1
c. g(–5) = –5 + 5 = 0
b. range: ,0
45. a.
b. range: , 0 {2}
Page 19
Algebra and Trigonometry 4E Section 2.2
219
46. a. 50. a.
b. range: ,0 {3}
47. a.
b. range: (, )
48. a.
b. range: (, )
49. a.
b. range: {3, 3}
b. range: {4, 4}
51. a.
b. range: 0,
52. a.
b. range: , 0 3,
53. a.
b. range: 0,
Page 20
Functions and Graphs
220
54. a.
58.
f (x h) f (x)
h
6(x h) 1 (6x 1)
h
6x 6h 1 6x 1
h
55.
b. range: 1,
f (x h) f (x)
59.
6h
h
6
f (x h) f (x)
h
x h2 x
2
h
4(x h) 4x
h
4x 4h 4x
h
4h
h
x
2 2xh h
2 x
2
h
2xh h
2
h
56.
57.
h
4
f (x h) f (x)
h
7(x h) 7x
h
7x 7h 7x
h
7h
h
7
f (x h) f (x)
h
60.
h 2x h
h
2x h
f (x h) f (x)
h
2(x h)
2 2x
2
h
2(x
2 2xh h
2 ) 2x
2
h
2x
2 4xh 2h
2 2x
2
h
4xh 2h
2
h h 4x 2h
3(x h) 7 (3x 7)
h
h
3x 3h 7 3x 7
h
3h
h
3
61.
4x 2h
f (x h) f (x)
h
(x h)
2 4(x h) 3 (x
2 4x 3)
h
x
2 2xh h
2 4x 4h 3 x
2 4x 3
h
2xh h
2 4h
h
h(2x h 4)
h
2x h 4
Page 21
Algebra and Trigonometry 4E Section 2.2
221
62.
f (x h) f (x)
h
(x h)
2 5(x h) 8 (x
2 5x 8)
65.
f (x h) f (x)
h x h
2 2 x h 4 (x
2 2x 4)
h
x
2 2xh h
2 5x 5h 8 x
2 5x 8
h
2xh h
2 5h
h
h
x
2 2xh h
2 2x 2h 4 x
2 2x 4
h
2xh h
2 2h
h
63.
h 2x h 5
h
2x h 5
f (x h) f (x)
h 2 x h
2 x h 1 (2x
2 x 1)
66.
h 2x h 2
h
2x h 2
f (x h) f (x)
h x h
2 3 x h 1 (x
2 3x 1)
h
h
2x
2 4xh 2h
2 x h 1 2x
2 x 1
h
4xh 2h
2 h
h
x
2 2xh h
2 3x 3h 1 x
2 3x 1
h
2xh h
2 3h
h
64.
h 4x 2h 1
h
4x 2h 1
f (x h) f (x)
h
3 x h2 x h 5 (3x
2 x 5)
67.
h 2x h 3
h
2x h 3
f (x h) f (x)
h 2 x h
2 5 x h 7 (2x
2 5x 7)
h
h
3x
2 6xh 3h
2 x h 5 3x
2 x 5
h
6xh 3h
2 h
h
2x
2 4xh 2h
2 5x 5h 7 2x
2 5x 7
h
4xh 2h
2 5h
h
h 6x 3h 1
h
6x 3h 1
h 4x 2h 5
h
4x 2h 5
Page 22
222
Functions and Graphs
68.
f (x h) f (x)
h
73.
f (x h) f (x)
h 3 x h
2 2 x h 1 (3x
2 2x 1)
1
1
h
3x
2 6xh 3h
2 2x 2h 1 3x
2 2x 1
h
6xh 3h
2 2h
h
h 6x 3h 2
h
x h x
h
x x h
x(x h) x(x h)
h
x x h
x(x h)
69.
6x 3h 2
f (x h) f (x)
h 2 x h
2 x h 3 (2x
2 x 3)
h
h
x(x h)
h
h
1
x(x h) h h 1
2x
2 4xh 2h
2 x h 3 2x
2 x 3
h
x(x h)
70.
4xh 2h
2 h
h
h 4x 2h 1
h
4x 2h 1
f (x h) f (x)
h
3 x h2 x h 1 (3x
2 x 1)
h
3x
2 6xh 3h
2 x h 1 3x
2 x 1
h
74.
f (x h) f (x)
h
1
1
2(x h) 2x
h x
x h
2x(x h) 2x(x h)
h
h
2x(x h)
h
h
1
71.
72.
6xh 3h
2 h
h
h 6x 3h 1
h
6x 3h 1
f (x h) f (x)
6 6
0 0
h h h
f (x h) f (x)
7 7
0 0
h h h
2x(x h) h
1
2x x h
Page 23
Algebra and Trigonometry 4E Section 2.2
223
x
60 0.35(t 450) if t 450
75.
f (x h) f (x)
h
x h
h
79. 30 0.30(t 120) 30 0.3t 36 0.3t 6
x h
x h x
h x h x
x h x
h
h
x h x h
x h x 1
80. 40 0.30(t 200) 40 0.3t 60 0.3t 20
76. f (x h) f (x)
h
x h 1
h
x h 1
x h 1
50 if 0 t 400
h x h 1
x h 1 (x 1)
81. C(t)
50 0.30(t 400) if t 400
h x h 1 x 1
x h 1 x 1
77.
h
h
x h 1
h
x h 1
1
x 1
x 1
f ( )
2 f (3) f (1) f ( )
82.
C(t)
60 if 0 t 450
1 0 42 2 2 3
1 16 1 3
78.
116 3
18
f ( )2 f (3) f (1) f ( )
f (2.5) f (1.9) f ( )2 f (3) f (1) f ( )
2 (2) 32 2 2 4
4 9 14 2 9 4
3
83. increasing: (25, 55); decreasing: (55, 75)
84. increasing: (25, 65); decreasing: (65, 75)
85. The percent body fat in women reaches a maximum
at age 55. This maximum is 38%.
86. The percent body fat in men reaches a maximum at
age 65. This maximum is 26%.
x
x h x
x 1
x 1 x 1
x 1
x h 1 x 1
f (1.5) f (0.9)
f (2.5) f (1.9)
Page 24
224
Functions and Graphs
87. domain: [25, 75]; range: [34, 38]
88. domain: [25, 75]; range: [23, 26]
89. This model describes percent body fat in men.
90. This model describes percent body fat in women.
91.
T (20, 000) 782.50 0.15(20, 000 7825) 2608.75
A single taxpayer with taxable income of $20,000
owes $2608.75.
106.
107.
The number of doctor visits decreases during
childhood and then increases as you get older.
The minimum is (20.29, 3.99), which means that the
minimum number of doctor visits, about 4, occurs at
around age 20.
92.
T (50, 000) 4386.25 0.25(50, 000 31, 850) 8923.75
A single taxpayer with taxable income of $50,000
owes $8923.75.
93. 39,148.75 0.33(x 160, 850)
94. 101, 469.25 0.35(x 349, 700)
108.
Increasing: (, 1) or (3, )
Decreasing: (1, 3)
95.
96.
f (3) 0.76
The cost of mailing a first-class letter weighing 3
ounces is $0.76.
f (3.5) 0.93
The cost of mailing a first-class letter weighing 3.5
ounces is $0.93.
Increasing: (–2, 0) or (2, ∞)
Decreasing: (–∞, –2) or (0, 2)
97. The cost to mail a letter weighing 1.5 ounces is
$0.59.
98. The cost to mail a letter weighing 1.8 ounces is
$0.59.
99.
100. – 105. Answers may vary.
109.
Increasing: (2, )
Decreasing: (, 2)
Constant: (–2, 2)
Page 25
Algebra and Trigonometry 4E Section 2.2
225
110. e.
111.
112.
Increasing: (1, ∞)
Decreasing: (–∞, 1)
Increasing: (0, )
Decreasing: (, 0)
114. does not make sense; Explanations will vary.
Sample explanation: It’s possible the graph is not
defined at a.
115. makes sense
116. makes sense
117. makes sense
118. answers may vary
119. answers may vary
120. a. h is even if both f and g are even or if both f and
g are odd.
f and g are both even:
h(– x) f (– x)
g(– x)
f (x) h(x)
g(x)
f and g are both odd:
Increasing: (–∞, 0)
Decreasing: (0, ∞)
h(– x) f (– x)
– f (x)
g(– x) – g(x)
f (x) h(x)
g(x)
113. a. b. h is odd if f is odd and g is even or if f is even
and g is odd.
f is odd and g is even:
h(– x) f (– x)
– f (x) –
f (x) –h(x)
g(– x) g(x) g(x)
f is even and g is odd:
h(– x) f (– x) f (x) –
f (x) –h(x)
g(– x) – g (x) b.
121. answers may vary
g (x)
122. y2 y1
4 1
3 3
c. Increasing: (0, ∞)
Decreasing: (–∞, 0)
x2 x1 2 (3) 1
d. f x xn
is increasing from (–∞, ∞) when n
is odd.
Page 26
226
Functions and Graphs
2
5
5 Run
123. When y 0: 3. m
6 (1) 5
5 ,
4x 3 y 6 0
4x 3(0) 6 0
4x 6 0
4x 6
x 3
2 The point is
3
1 (2) 1
so the slope is –5. Using the point (–2, –1), we get the
point slope equation:
y y1 m(x x1)
y (1) 5[x (2)]
y 1 5(x 2).Solve theequation for y :
y 1 5x 10
,0 .
When x 0 :
y 5x 11.
4x 3y 6 0 4. The slope m is 3 and the y-intercept is 1, so one
4(0) 3y 6 0
3y 6 0
3y 6
x 2
The point is 0, 2.
124. 3x 2 y 4 0
2 y 3x 4
y 3x 4
2
or
y 3
x 2 2
Section 2.3
Check Point Exercises
point on the line is (1, 0). We can find a second point
on the line by using the slope m 3 Rise : starting at
the point (0, 1), move 3 units up and 5 units to the
right, to obtain the point (5, 4).
5. y 3 is a horizontal line.
1. a. m
2 4 6
6
4 (3) 1 6. All ordered pairs that are solutions of x 3 have a
5 (2) 7 7 value of x that is always –3. Any value can be used
b. m 1 4
5
5 for y.
2. y y1 m(x x1)
y (5) 6(x 2)
y 5 6x 12
y 6x 17
Page 27
Algebra and Trigonometry 4E Section 2.3
227
7. 3x 6 y 12 0
6 y 3x 12
9. First find the slope.
m Change in y
57.64 57.04
0.6
0.016
3 12 Change in x 354 317 37 y x
6 6 1
Use the point-slope form and then find slope-
intercept form. y
2 x 2 y y1 m(x x1)
y 57.04 0.016(x 317)
y 57.04 0.016x 5.072
y 0.016x 51.968
f (x) 0.016x 52.0
Find the temperature at a concentration of 600 parts
per million.
f (x) 0.016x 52.0
f (600) 0.016(600) 52.0
The slope is 1
2 and the y-intercept is 2. 61.6
The temperature at a concentration of 600 parts per
8. Find the x-intercept:
3x 2 y 6 0
3x 2(0) 6 0
3x 6 0
3x 6
million would be 61.6F.
Exercise Set 2.3
x 2
Find the y-intercept: 3x 2 y 6 0
1. m 10 7
3
; rises
8 4 4
3(0) 2 y 6 0
2 y 6 0
2. m 4 1
3 3;
3 2 1 rises
2 y 6
y 3
3. m 2 1
1
; rises
2 (2) 4
4. m 4 3
1
; rises
2 (1) 3
5. m 2 (2)
3 4
0 0;
1
horizontal
6. m 1 (1)
3 4
0 0; horizontal
1
7. m 1 4
5
5; falls
1 (2) 1
8. m 2 (4)
4 6
2 1;
2
falls
9. m 2 3
5
5 5 0
undefined; vertical
Page 28
228
Functions and Graphs
10. m 5 (4)
9
3 3 0
undefined; vertical
20. point-slope form:
y
1 1(x 4);
4
11. m 2, x 3, y 5; m 1, x 4, y 1
;
1 1
point-slope form: y – 5 = 2(x – 3);
1 1
slope-intercept form:
4 y x
17
12.
slope-intercept form: y 5 2x 6
y 2x 1
21.
4
m 1
, x 0, y 0; point-slope form: y – 3 = 4(x – 1); m 4, x1 1, y1 3;
2 1 1
1
slope-intercept form: y = 4x – 1 point-slope form: y 0 (x 0); 2
13. m 6, x 2, y 5; slope-intercept form: y 1
x 1 1
point-slope form: y – 5 = 6(x + 2);
slope-intercept form: y 5 6x 12
y 6x 17
22. point-slope form: y 0
1 (x 0);
3
14. point-slope form: y + 1 = 8(x – 4); m 1
, x 0, y
0;
m 8, x 4, y 1; 3 1 1
15.
1 1
slope-intercept form: y = 8x – 33
m 3, x1 2, y1 3;
slope-intercept form: y 1
x 3
point-slope form: y + 3 = –3(x + 2);
slope-intercept form: y 3 3x 6 23. m
2 , x 6, y
3 1 1 2;
y 3x 9 point-slope form: y 2 2
(x 6); 3
16. point-slope form: y + 2 = –5(x + 4);
m 5, x1 4, y1 2;
slope-intercept form: y = –5x – 22
slope-intercept form: y 2 2
x 4 3
y 2
x 2
17. m 4, x 4, y 0; 3
1 1
point-slope form: y – 0 = –4(x + 4);
slope-intercept form: y 4(x 4)
y 4x 16
24. point-slope form: y 4 3
(x 10); 5
m 3
, x 10, y 4;
18. point-slope form: y + 3 = –2(x – 0)
m 2, x1 0, y1 3;
slope-intercept form: y = –2x – 3
5
slope-intercept form:
y 3
x 2 5
19. m 1, x
1 , y
2;
25. m
10 2
8 2 ;
1 2
1 5 1 4
point-slope form: y 2 1
x 1
; point-slope form: y – 2 = 2(x – 1) using
2 (x1, y1) (1, 2) , or y – 10 = 2(x – 5) using
slope-intercept form:
y 2 x 1
2
y x 5
2
(x1, y1) (5, 10) ;
slope-intercept form:
y 2 2x 2 or
y 10 2x 10,
y 2x
2
1 1
Page 29
Algebra and Trigonometry 4E Section 2.3
229
26. m 15 5
10
2 ;
8 3 5 point-slope form: y – 5 = 2(x – 3) using
31.
m 6 (2)
8
4 ;
3 (3) 6 3 4
x1, y1 3, 5 ,or y – 15 = 2(x – 8) using point-slope form: y 2 (x 3) using 3
27.
x1, y1 8,15 ; slope-intercept form: y = 2x – 1
m 3 0
3 1 ;
(x1, y1) (3, 2) , or
(x1, y1) (3, 6) ;
y 6 4
(x 3) using 3
4
0 (3) 3
point-slope form: y – 0 = 1(x + 3) using
(x1, y1) (3, 0) , or y – 3 = 1(x – 0) using
(x1, y1) (0, 3) ; slope-intercept form: y = x + 3
slope-intercept form: y 2 4 or 3x
y 6 4
x 4, 3 4
28. m 2 0
2 1 ;
0 (2) 2
point-slope form: y – 0 = 1(x + 2) using
x1, y1 2, 0 , or y – 2 = 1(x – 0) using
32.
y
m 2 6
8
4
; 3 (3) 6 3
4
x 2 3
x1, y1 0, 2 ; point-slope form: y 6 (x 3) using
3
29.
slope-intercept form: y = x + 2
m 4 (1)
1 ;
2 (3) 5
point-slope form: y + 1 = 1(x + 3) using
(x1, y1) (3, 1) , or y – 4 = 1(x – 2) using
(x1, y1) (2, 4) ; slope-intercept form:
x1, y1 3, 6 , or
x1, y1 3, 2 ;
slope-intercept form:
1 (1) 0
y 2 4
(x 3) using 3
y 4
x 2 3
y 1 x 3or 33. m 4 (3)
0 ; 7
30.
y 4 x 2
y x 2
m 1 (4)
3 1 ;
1 (2) 3
point-slope form: y + 4 = 1(x + 2) using
point-slope form: y + 1 = 0(x + 3) using
(x1, y1) (3, 1) , or y + 1 = 0(x – 4) using
(x1, y1) (4, 1) ;
slope-intercept form: y 1 0, so
y 1 5 (5) 0
x1, y1 2, 4 , or y + 1 = 1(x – 1) using
x1, y1 1, 1slope-intercept form: y = x – 2
34. m 0 ; 6 (2) 8
point-slope form: y + 5 = 0(x + 2) using
x1, y1 2, 5 , or y + 5 = 0(x – 6) using
x1, y1 6, 5 ;
35.
slope-intercept form:
m
0 4 4
1;
y 5 0, so
y 5
2 2 4 point-slope form: y – 4 = 1(x – 2) using
(x1, y1) (2, 4) , or y – 0 = 1(x + 2) using
(x1, y1) (2, 0) ;
slope-intercept form: y 9 x 2, or
y x 2
Page 30
Functions and Graphs
230
2
2 2
36. m 0 (3)
3
3
41. m = –2; b = 1
11 2 2
point-slope form: y 3 3
(x 1) using 2
x1, y1 1, 3 , or
x1, y1 1, 0 ;
y 0 3
(x 1) 2
using
slope-intercept form: y 3 3
x 3
, or 2 2
y 3
x 3
2 2
42. m = –3; b = 2
37. m 4 0
4 8 ;
0 1 1
2 2
point-slope form: y – 4 = 8(x – 0) using
(x1, y
1) (0, 4) , or y 0 8 x 1 using
(x1, y
1) 1 , 0 ; or y 0 8 x 1
slope-intercept form: y 8x 4
43.
m
3
; b = –2
2 0 2 1 4
38. m ;
0 4 4 2
point-slope form:
x1, y1 4, 0 ,
y 0 1
(x 4) using 2
or y 2 1
(x 0) 2
using x1, y1 0, 2 ;
slope-intercept form:
39. m = 2; b = 1
40. m = 3; b = 2
y 1
x 2 2
44.
m
3 ; b 3
4
Page 31
Algebra and Trigonometry 4E Section 2.3
231
45.
46.
47.
48.
m 3
; b = 7 5
m 2
; b 6 5
m 1
; b 0 2
m 1
; b 0 3
49.
50.
51.
52.
53.
54.
55.
Page 32
232
Functions and Graphs
56. c.
57. 3x 18 0
3x 18
x 6
61. a. 2x 3y 18 0
2x 18 3y
3y 2x 18
y 2
3 x
18
3
y 2
x 6 3
58. 3x 12 0
3x 12
x 4
b. m 2
; b = 6 3
c.
59. a. 3x y 5 0
y 5 3x
y 3x 5
b. m = –3; b = 5
c.
62. a. 4x 6 y 12 0
4x 12 6 y
6 y 4x 12
y 4
x 12
6 6
y 2
x 2 3
60. a. 4x y 6 0
y 6 4x
y 4x 6
b. m 2
; b = –2 3
c.
b. m 4;b 6
Page 33
Algebra and Trigonometry 4E Section 2.3
233
63. a. 8x 4 y 12 0
8x 12 4 y
4 y 8x 12
66. a. 4 y 28 0
4 y 28
y 7
y 8
x 12
4 4
y 2x 3
b. m = 2; b = –3
c.
b. m 0; b 7
c.
64. a. 6x 5 y 20 0
6x 20 5 y
5 y 6x 20 6 20
67. Find the x-intercept:
6x 2 y 12 0
6x 2(0) 12 0
6x 12 0
6x 12
x 2 y x
5 5
y 6
x 4 5
b. m 6
;b 4 5
c.
Find the y-intercept:
6x 2 y 12 0
6(0) 2 y 12 0
2 y 12 0
2 y 12
y 6
65. a. 3y 9 0
3y 9
y 3
b. m 0; b 3
c.
Page 34
234
Functions and Graphs
68. Find the x-intercept:
6x 9 y 18 0 70. Find the x-intercept:
3x 5 y 15 0
6x 9(0) 18 0 3x 5(0) 15 0
6x 18 0 3x 15 0
6x 18 3x 15
x 3
Find the y-intercept:
6x 9 y 18 0
x 5
Find the y-intercept:
3x 5 y 15 0
6(0) 9 y 18 0 3(0) 5 y 15 0
9 y 18 0 5 y 15 0
9 y 18 5 y 15
y 2 y 3
69. Find the x-intercept: 71. Find the x-intercept:
2x 3y 6 0
2x 3(0) 6 0
2x 6 0
8x 2 y 12 0
8x 2(0) 12 0
8x 12 0
2x 6
x 3
Find the y-intercept:
2x 3y 6 0
2(0) 3y 6 0
3y 6 0
3y 6
y 2
8x 12
8x 12
8 8
x 3
2 Find the y-intercept:
8x 2 y 12 0
8(0) 2 y 12 0
2 y 12 0
2 y 12
y 6
Page 35
Algebra and Trigonometry 4E Section 2.3
235
72. Find the x-intercept:
6x 3y 15 0
6x 3(0) 15 0 6x 15 0
77. Ax By C
By Ax C
y A
x C
B B
6x 15
6x 15
6 6
x 5
2 Find the y-intercept:
6x 3y 15 0
The slope is A
B
78. Ax By C Ax
C By
A x
C y
B B
and the y intercept is C
. B
6(0) 3y 15 0 The slope is A
and the y intercept is C
.
3y 15 0
3 y 15
y 5
79.
B B
3 4 y
1 3
3 4 y
2
6 4 y
2 y
2 y
80. 1
4 y
73. 0 a a a 3 4 2
74.
m b 0 b b
Since a and b are both positive, a
is b
negative. Therefore, the line falls.
m b 0
b
b
1 4 y
3 4 2
1 4 y
3 6
6 34 y
6 12 3 y
0 a a a 18 3 y
Since a and b are both positive, b
is a
negative. Therefore, the line falls.
75. b c b c
81.
6 y
3x 4 f x 6
4 f x 3x 6 m
a a
0 f x 3
x 3
The slope is undefined. 4 2
The line is vertical.
76. a c c a m
a a b b
Since a and b are both positive, a
is positive. b
Therefore, the line rises.
Page 36
236
Functions and Graphs
5
2
82. 6x 5 f x 20
5 f x 6x 20
f x 6
x 4
88. a. First, find the slope using 20, 51.7 and
10, 45.2.
m 51.7 45.2
6.5
0.65
20 10 10
Then use the slope and one of the points to
write the equation in point-slope form.
y y1 m x x1
y 45.2 0.65 x 10
or
y 51.7 0.65 x 20
83. Using the slope-intercept form for the equation
of a line:
1 2 3 b
1 6 b
5 b
b. y 45.2 0.65 x 10
y 45.2 0.65x 6.5
y 0.65x 38.7
f x 0.65x 38.7
c. f 35 0.65(35) 38.7 61.45
84.
85.
86.
6 3 2 b
6 3 b
3 b
m1, m3 , m2 , m4
b2 , b1, b4 , b3
The linear function predicts the percentage of
never married American males, ages 25 – 29, to
be 61.45% in 2015.
89. a.
87. a. First, find the slope using 20, 38.9 and
10, 31.1.
m 38.9 31.1
7.8
0.78
20 10 10
Then use the slope and one of the points to
write the equation in point-slope form.
y y1 m x x1
b. m Change in y
74.3 70.0
0.215
y 31.1 0.78 x 10or
Change in x 40 20
y y1 m(x x1)
y 38.9 0.78 x 20
b. y 31.1 0.78 x 10
y 31.1 0.78x 7.8
y 0.78x 23.3
f x 0.78x 23.3
c. f 40 0.78(40) 23.3 54.5
The linear function predicts the percentage of
never married American females, ages 25 – 29,
to be 54.5% in 2020.
y 70.0 0.215(x 20)
y 70.0 0.215x 4.3
y 0.215x 65.7
E(x) 0.215x 65.7
c. E(x) 0.215x 65.7
E(60) 0.215(60) 65.7
78.6
The life expectancy of American men born in
2020 is expected to be 78.6.
Page 37
Algebra and Trigonometry 4E Section 2.3
237
90. a.
101. Two points are (0, 6) and (10, –24).
m 24 6
30
3.
10 0 10
Check: y mx b : y 3x 6 .
b. m
Change in y
79.7 74.7 0.17
102. Two points are (0,–5) and (10,–10).
m 10 (5)
5
1
.
Change in x 40 10
y y1 m(x x1)
10 0 10 2
y 74.7 0.17(x 10)
y 74.7 0.17x 1.7
y 0.17x 73
E(x) 0.17x 73
c. E(x) 0.17x 73
E(60) 0.17(60) 73
83.2
103. Two points are (0, –2) and (10, 5.5).
m 5.5 (2)
7.5
0.75 or 3
.
10 0 10 4
The life expectancy of American women born
in 2020 is expected to be 83.2.
91. (10, 230) (60, 110) Points may vary.
m 110 230
120
2.4 60 10 50
y 230 2.4(x 10)
y 230 2.4x 24
y 2.4x 254
Answers may vary for predictions.
92. – 99. Answers may vary.
100. Two points are (0,4) and (10,24).
m 24 4
20
2.
10 0 10
Check: y mx b : y 3
x 2 . 4
Page 38
238
Functions and Graphs
2
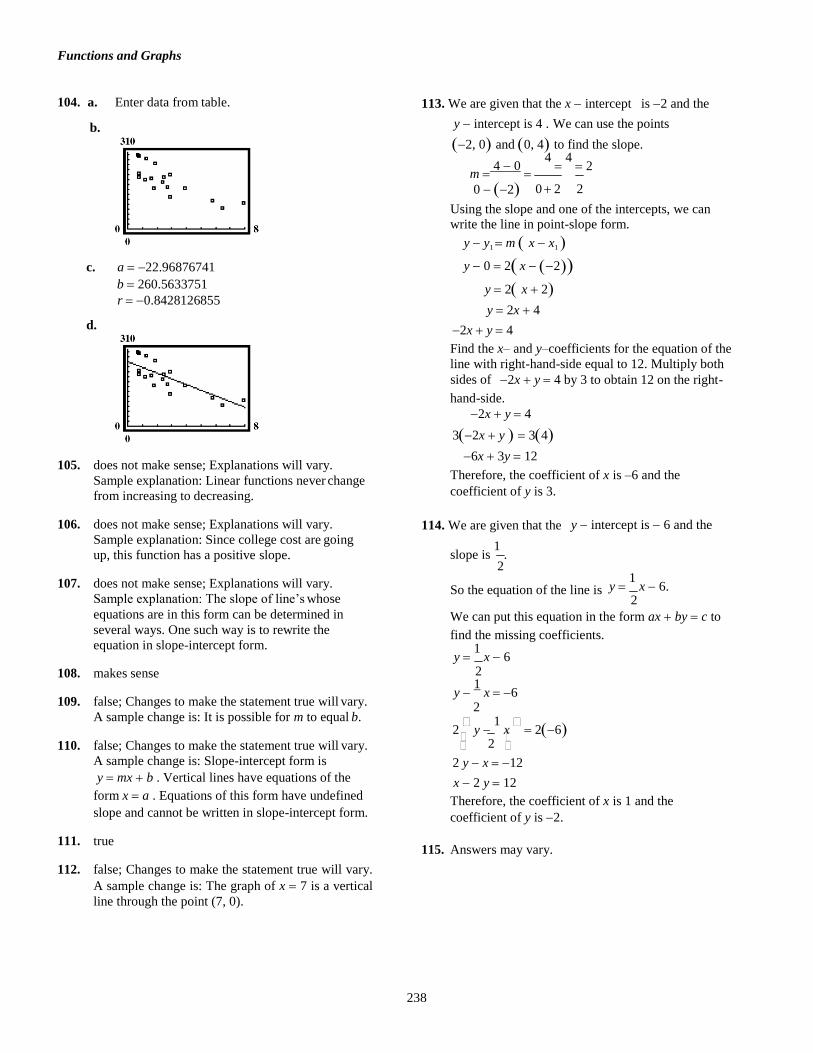
104. a. Enter data from table.
113. We are given that the x intercept
is 2 and the
b. y intercept is 4 . We can use the points
2, 0 and 0, 4 to find the slope.
m 4 0
4
4 2
0 2 0 2 2
c. a 22.96876741
b 260.5633751
r 0.8428126855
d.
Using the slope and one of the intercepts, we can
write the line in point-slope form.
y y1 m x x1
y 0 2 x 2
y 2 x 2
y 2x 4
2x y 4
Find the x– and y–coefficients for the equation of the
line with right-hand-side equal to 12. Multiply both
sides of 2x y 4 by 3 to obtain 12 on the right-
105. does not make sense; Explanations will vary.
Sample explanation: Linear functions never change
from increasing to decreasing.
hand-side.
2x y 4
32x y 34
6x 3y 12
Therefore, the coefficient of x is –6 and the
coefficient of y is 3.
106. does not make sense; Explanations will vary.
Sample explanation: Since college cost are going
up, this function has a positive slope.
114. We are given that the
slope is 1
. 2
y intercept is 6 and the
107. does not make sense; Explanations will vary.
Sample explanation: The slope of line’s whose So the equation of the line is y
1 x 6.
2 equations are in this form can be determined in
several ways. One such way is to rewrite the
equation in slope-intercept form.
108. makes sense
109. false; Changes to make the statement true will vary.
A sample change is: It is possible for m to equal b.
110. false; Changes to make the statement true will vary.
A sample change is: Slope-intercept form is
y mx b . Vertical lines have equations of the
form x a . Equations of this form have undefined
slope and cannot be written in slope-intercept form.
111. true
112. false; Changes to make the statement true will vary.
A sample change is: The graph of x 7 is a vertical
line through the point (7, 0).
We can put this equation in the form ax by c to
find the missing coefficients.
y 1
x 6 2
y 1
x 6 2
2
y 1
x 26
2 y x 12
x 2 y 12
Therefore, the coefficient of x is 1 and the
coefficient of y is 2.
115. Answers may vary.
Page 39
Algebra and Trigonometry 4E Section 2.4
239
116. Let (25, 40) and (125, 280) be ordered pairs
(M, E) where M is degrees Madonna and E is degrees
Elvis. Then
m 280 40
240
2.4 . Using x , y 25, 40 ,
125 25 100 1 1
point-slope form tells us that
E – 40 = 2.4 (M – 25) or
E = 2.4 M – 20.
Section 2.4
Check Point Exercises
1. The slope of the line
y y1 m(x x1 )
y 5 3 x (2)
y 3x 1 is 3.
117. Answers may vary.
118. Since the slope is the same as the slope of
then m 2.
y y1 m x x1
y 1 2 x 3y 1 2 x 3
y 2x 1,
y 5 3(x 2) point-slope
y 5 3x 6
y 3x 11 slope-intercept
2. a. Write the equation in slope-intercept form:
x 3y 12 0
3y x 12 1
y 1 2x 6
y 2x 7
y 3
x 4
1
119. Since the slope is the negative reciprocal of 1
, 4
then m 4.
y y1 m x x1
y (5) 4 x 3
y 5 4x 12
4x y 17 0
4x y 17 0
The slope of this line is thus the slope of 3
any line perpendicular to this line is 3.
b. Use m 3 and the point (–2, –6) to write the
equation.
y y1 m(x x1)
y (6) 3 x (2)
y 6 3(x 2)
y 6 3x 6
3x y 0
120. f (x2 ) f (x1) f (4) f (1)
3x y 0 general form
x2 x1 4 1
4 1 2 2
3. m Change in y
12.7 9.0
3.7
0.25
4 1 Change in x 2005 1990 15
15
3
5
The slope indicates that the number of U.S. men
living alone is projected to increase by 0.25 million
each year.
f (x ) f (x ) 1
3 0
3
4. a. 2 1 1
x2 x1 1 0
f (x ) f (x ) 23 1
3 8 1
b. 2 1 7
x2 x1 2 1 1
f (x ) f (x ) 03 (2)
3 8
c. 2 1 4
x2 x1 0 (2) 2
5. f (x2 ) f (x1)
f (3) f (1)
0.05 0.03 0.01
x2 x1 3 1 3 1
Page 40
Functions and Graphs
240
2
2
2
Exercise Set 2.4
1. Since L is parallel to
y 2x, we know it will have
4. L will have slope m 1
. 2
The line passes through (–
slope m 2. We are given that it passes through 1, 2). Use the slope and point to write the equation in
point-slope form.
4, 2. We use the slope and point to write the
equation in point-slope form.
y y1 m x x1
y 2 2 x 4Solve for y to obtain slope-intercept form.
y 2 2 x 4
y 2 2x 8
y 2x 6
In function notation, the equation of the line is
f x 2x 6.
2. L will have slope m 2 . Using the point and the
slope, we have y 4 2 x 3. Solve for y to
y 2 1 x 1
y 2 1 x 1
Solve for y to obtain slope-intercept form.
y 2 1
x 1
2 2
y 1
x 1 2
2 2
y 1
x 5
2 2
f x 1
x 5
2 2
5. m = –4 since the line is parallel to obtain slope-intercept form.
y 4 2x 6
y 2x 10
f x 2x 10
y 4x 3; x1 8, y1 10;
point-slope form: y + 10 = –4(x + 8)
slope-intercept form: y + 10 = –4x – 32
y = –4x – 42
3. Since L is perpendicular to y 2x, we know it will
have slope m 1
. We are given that it passes
6. m = –5 since the line is parallel to
x1 2, y1 7 ; point-slope form: y + 7 = –5(x + 2)
y 5x 4 ;
2 through (2, 4). We use the slope and point to write the
equation in point-slope form.
slope-intercept form: y 7 5x 10
y 5x 17
y y1 m x x1 7. m = –5 since the line is perpendicular to
y 4 1 x 2 y
1 x 6; x 2, y 3;
2 5 1 1
Solve for y to obtain slope-intercept form.
y 4 1 x 2
y 4 1
x 1
point-slope form: y + 3 = –5(x – 2)
slope-intercept form: y 3 5x 10
y 5x 7
2
y 1
x 5 2
In function notation, the equation of the line is
8. m 3 since the line is perpendicular to
x1 4, y1 2 ;
y 1
x 7 ; 3
1 point-slope form: y 2 3(x 4)
f x x 5. slope-intercept form: y 2 3x 12
y 3x 10 2
Page 41
Algebra and Trigonometry 4E Section 2.4
241
9. 2x 3y 7 0
3y 2x 7
y 2
x 7
13. 15 0
15
3
5 0 5
24 0 24 3 3
The slope of the given line is
lines are parallel. 2
2 , so m
2 since the
3 3
14.
15.
6 4 0 4
5
2 2 5 (3
2 2 3)
25 10 (9 6)
5 3 2
point-slope form: y 2 (x 2) 3
20
general form: 2x 3y 10 0
10. 3x 2 y 0
2
10
62 2 6 (3
2 2 3) 36 12 9 6 21
2 y 3x 5 3 5
16. 7 6 3 3 3
y x 2 2
17. 9 4
3 2
1
The slope of the given line is 3
, so m 3 since the 9 4 5 5
lines are parallel.
point-slope form:
2 2
y 3 3
(x 1) 2
18. 16 9
4 3
1
16 9 7 7
11.
general form: 3x 2 y 9 0
x 2 y 3 0
2 y x 3
y 1
x 3
19. Since the line is perpendicular to x 6 which is a
vertical line, we know the graph of f is a horizontal
line with 0 slope. The graph of f passes through
1, 5 , so the equation of f is f x 5.
2 2
The slope of the given line is 1
, so m = –2 since the 2
20. Since the line is perpendicular to x 4 which is a
vertical line, we know the graph of f is a horizontal
line with 0 slope. The graph of f passes through lines are perpendicular.
point-slope form: y 7 –2 x 4 2, 6 , so the equation of f is f x 6.
12.
general form: 2x y 1 0
x 7 y 12 0
7 y x 12
y 1
x 12
7 7
The slope of the given line is 1
, so m = 7 since the 7
lines are perpendicular.
point-slope form: y + 9 = 7(x – 5)
general form: 7x y 44 0
Page 42
242
Functions and Graphs
2
2
2
3
3
3
21. First we need to find the equation of the line with x intercept of 2 and y intercept of 4.
This
line will pass through 2, 0 and 0, 4.
m 4 0
4
2
We use these points to find the slope.
0 2 2
Since the graph of f is perpendicular to this line, it will have slope m 1
. 2
Use the point 6, 4
y y1 m x x1
and the slope 1
2
to find the equation of the line.
y 4 1 x 6
y 4 1 x 6
y 4 1
x 3 2
y 1
x 1 2
f x 1
x 1
22. First we need to find the equation of the line with x intercept of 3 and y intercept of 9.
This
line will pass through 3, 0 and 0, 9.
m 9 0
9
3
We use these points to find the slope.
0 3 3
Since the graph of f is perpendicular to this line, it will have slope m 1
. 3
Use the point 5, 6 and the slope 1
to find the equation of the line.
y y1 m x x1
y 6 1 x 5
y 6 1 x 5
y 6 1
x 5
3 3
y 1
x 13
3 3
f x 1
x 13
3 3
Page 43
Algebra and Trigonometry 4E Section 2.4
243
3
4
23. First put the equation 3x 2 y 4 0 in slope-intercept form.
3x 2 y 4 0
2 y 3x 4
y 3
x 2 2
The equation of f will have slope 2
3 since it is perpendicular to the line above and the same
y intercept 2.
So the equation of f is f x 2
x 2.
24. First put the equation 4x y 6 0 in slope-intercept form.
4x y 6 0
y 4x 6
y 4x 6
The equation of f will have slope 1
since it is perpendicular to the line above and the same 4
25.
26.
y intercept 6.
So the equation of f is
P(x) 1.2x 47
P(x) 1.3x 23
f x 1
x 6.
27.
28.
m 1163 617
546
137
1998 1994 4
There was an average increase of approximately 137 discharges per year.
m 612 1273
661
132 2006 2001 5
There was an average decrease of approximately 132 discharges per year.
29. a. f (x) 1.1x3 35x
2 264x 557
f (0) 1.1(0)3 35(0)
2 264(0) 557 557
f (4) 1.1(4)3 35(4)
2 264(4) 557 1123.4
m 1123.4 557
142
4 0
b. This overestimates by 5 discharges per year.
30. a. f (x) 1.1x3 35x
2 264x 557
f (0) 1.1(7)3 35(7)
2 264(7) 557 1067.3
f (12) 1.1(12)3 35(12)
2 264(12) 557 585.8
m 585.8 1067.3
96 12 7
b. This underestimates the decrease by 36 discharges per year.
Page 44
244
Functions and Graphs
31. – 36. Answers may vary.
37. y 1
x 1 3
y 3x 2
a. The lines are perpendicular because their slopes are negative reciprocals of each other. This is verified because product of their slopes is –1.
b.
The lines do not appear to be perpendicular.
c.
The lines appear to be perpendicular. The calculator screen is rectangular and does not have the same
width and height. This causes the scale of the x–axis to differ from the scale on the y–axis despite using
the same scale in the window settings. In part (b), this causes the lines not to appear perpendicular when
indeed they are. The zoom square feature compensates for this and in part (c), the lines appear to be
perpendicular.
38. makes sense
39. makes sense
40. does not make sense; Explanations will vary. Sample explanation: Slopes can be used for segments of the graph.
41. makes sense
42. Write Ax By C 0 in slope-intercept form.
Ax By C 0
By Ax C
By Ax
C
B B B
y A
x C
B B
The slope of the given line is A
. B
The slope of any line perpendicular to Ax By C 0 is B
. A
Page 45
Algebra and Trigonometry 4E Mid-Chapter 2 Check Point
245
43. The slope of the line containing 1, 3 and 2, 4 b.
has slope m 4 3
4 3
7
7
2 1 3 3 3
Solve
form.
Ax y 2 0 for y to obtain slope-intercept
Ax y 2 0
y Ax 2
So the slope of this line is A.
This line is perpendicular to the line above so its
c. The graph in part (b) is the graph in part (a)
slope is 3
. 7
Therefore, A 3
so 7
A 3
. 7
46. a.
shifted to the right 2 units.
44. a.
b.
b.
c. The graph in part (b) is the graph in part (a)
shifted down 4 units.
45. a.
c. The graph in part (b) is the graph in part (a)
reflected across the y-axis.
Mid-Chapter 2 Check Point
1. The relation is not a function.
The domain is {1, 2}.
The range is {6, 4, 6}.
2. The relation is a function.
The domain is {0, 2, 3}.
The range is {1, 4}.
3. The relation is a function.
The domain is {x | 2 x 2}.
The range is {y | 0 y 3}.
4. The relation is not a function.
The domain is {x | 3 x 4}.
The range is {y | 1 y 2}.
Page 46
246
Functions and Graphs
5 x
5 4
5. The relation is not a function.
24. f (x2 ) f (x1) f (4) f (4)
5 3
1
The domain is {2, 1, 0,1, 2}.
The range is {2, 1,1, 3}.
6. The relation is a function.
The domain is {x | x 1}.
The range is {y | y 1}.
25.
x2 x1 4 (4) 4 4
7. x2 y 5
y x2 5
For each value of x, there is one and only one value
for y, so the equation defines y as a function of x.
8. x y2 5
y2 5 x
y
Since there are values of x that give more than one value for y (for example, if x = 4, then
26.
27.
y 1 ), the equation does not define y as
a function of x.
9. Each value of x corresponds to exactly one value of y.
10. Domain: ,
11. Range: ,4
12. x-intercepts: –6 and 2
13. y-intercept: 3
14. increasing: (–∞, –2)
15. decreasing: (–2, ∞)
28.
29.
16.
17.
18.
19.
20.
x 2
f (2) 4
f (4) 3
f (7) 2
f (6) 0
and
and
f (3) 2
f (2) 0
30.
21. 6, 2
22. f (100) is negative.
23. neither; f (x) x and f (x) x
Page 47
Algebra and Trigonometry 4E Mid-Chapter 2 Check Point
247
31. 35. 5 y 20
y 4
32.
36.
33.
37. a. f (x) 2(x)2 x 5 2x
2 x 5
neither; f (x) x and f (x) x
34. 5 y 3x
b. f (x h) f (x) h
2(x h)
2 (x h) 5 (2x
2 x 5)
h 2x
2 4xh 2h
2 x h 5 2x
2 x 5
y 3
x 5
h
4xh 2h
2 h
h
h 4x 2h 1
h
4x 2h 1
38. C(x)
30 if 0 t 200
30 0.40(t 200) if
a. C(150) 30
t 200
b. C(250) 30 0.40(250 200) 50
Page 48
248
Functions and Graphs
2
39.
y y1 m(x x1)
43. m Change in y
0 (4)
4
y 3 2 x (4)1
Change in x 7 2 5
y 3 2(x 4) m
Change in y
6 2
4
y 3 2x 8 2 Change in x 1 (4) 5
y 2x 5
f (x) 2x 5
The slope of the lines are equal thus the lines are
parallel.
Change in y
1 (5) 6
44. a. m
Change in y
42 26 16
0.16
40. m 2 Change in x 180 80 100
Change in x
y y1 m(x x1)
y 1 2 x 2y 1 2x 4
2 (1) 3 b. For each minute of brisk walking, the
percentage of patients with depression in
remission increased by 0.16%. The rate of
change is 0.16% per minute of brisk walking.
y 2x 3
f (x) 2x 3
41. 3x y 5 0
y 3x 5
45. f (x2 ) f (x1)
x2 x1
f (2) f (1)
2 (1)
3(2)2 2 3(1)
2 (1)
2 1
y 3x 5 2
The slope of the given line is 3, and the lines are
parallel, so m 3.
y y1 m(x x1)
y (4) 3(x 3)
y 4 3x 9
y 3x 13
f (x) 3x 13
42. 2x 5 y 10 0
5 y 2x 10
5 y 2x
10
5 5 5
y 2
x 2 5
The slope of the given line is 2
5
perpendicular, so m 5
. 2
, and the lines are
y y1 m(x x1)
y (3) 5 x (4)
y 3 5
x 10 2
y 5
x 13 2
f (x) 5
x 13 2