Solutions Manual for Cost Accounting A Managerial Emphasis 14th
edition by Horngren Datar and Rajan
Link download Solutions Manual for Cost Accounting A Managerial Emphasis 14th
edition by Horngren Datar and Rajan:
https://digitalcontentmarket.org/download/solution-manual-for-cost-accounting-a-
managerial-emphasis-14th-edition-by-horngren-datar-and-rajan/
Link download Test Bank for Cost Accounting A Managerial Emphasis 14th edition
by Charles T. Horngren, Srikant M. Datar and Madhav Rajan:
https://digitalcontentmarket.org/download/test-bank-for-cost-accounting-a-
managerial-emphasis-14th-edition-by-horngren-datar-and-rajan/
CHAPTER 2
AN INTRODUCTION TO COST TERMS AND PURPOSES
2-1 A cost object is anything for which a separate measurement of costs is desired. Examples
include a product, a service, a project, a customer, a brand category, an activity, and a
department.
2-2 Direct costs of a cost object are related to the particular cost object and can be traced to that
cost object in an economically feasible (cost-effective) way. Indirect costs of a cost object are related to the particular cost object but cannot be traced
to that cost object in an economically feasible (cost-effective) way.
Cost assignment is a general term that encompasses the assignment of both direct costs
and indirect costs to a cost object. Direct costs are traced to a cost object while indirect costs are
allocated to a cost object.
2-3 Managers believe that direct costs that are traced to a particular cost object are more
accurately assigned to that cost object than are indirect allocated costs. When costs are allocated,
managers are less certain whether the cost allocation base accurately measures the resources
demanded by a cost object. Managers prefer to use more accurate costs in their decisions.
2-4 Factors affecting the classification of a cost as direct or indirect include
• the materiality of the cost in question, • available information-gathering technology, • design of operations
2-5 A variable cost changes in total in proportion to changes in the related level of total activity
or volume. An example is a sales commission that is a percentage of each sales revenue dollar.
A fixed cost remains unchanged in total for a given time period, despite wide changes in
the related level of total activity or volume. An example is the leasing cost of a machine that is
unchanged for a given time period (such as a year) regardless of the number of units of product
produced on the machine.
2-6 A cost driver is a variable, such as the level of activity or volume, that causally affects total
costs over a given time span. A change in the cost driver results in a change in the level of total
costs. For example, the number of vehicles assembled is a driver of the costs of steering wheels
on a motor-vehicle assembly line.
2-7 The relevant range is the band of normal activity level or volume in which there is a specific
relationship between the level of activity or volume and the cost in question. Costs are described
as variable or fixed with respect to a particular relevant range.
2-8 A unit cost is computed by dividing some amount of total costs (the numerator) by the
related number of units (the denominator). In many cases, the numerator will include a fixed cost
that will not change despite changes in the denominator. It is erroneous in those cases to multiply
the unit cost by activity or volume change to predict changes in total costs at different activity or
volume levels.
2-9 Manufacturing-sector companies purchase materials and Ashtonnents and convert them into
various finished goods, for example automotive and textile companies. Merchandising-sector companies purchase and then sell tangible products
without changing their basic form, for example retailing or distribution.
Service-sector companies provide services or intangible products to their customers, for
example, legal advice or audits.
2-10 Manufacturing companies have one or more of the following three types of inventory:
1. Direct materials inventory. Direct materials in stock and awaiting use in the
manufacturing process.
2. Work-in-process inventory. Goods partially worked on but not yet completed. Also
called work in progress.
3. Finished goods inventory. Goods completed but not yet sold.
2-11 Inventoriable costs are all costs of a product that are considered as assets in the balance
sheet when they are incurred and that become cost of goods sold when the product is sold. These
costs are included in work-in-process and finished goods inventory (they are “inventoried”) to
accumulate the costs of creating these assets.
Period costs are all costs in the income statement other than cost of goods sold. These
costs are treated as expenses of the accounting period in which they are incurred because they are
expected not to benefit future periods (because there is not sufficient evidence to conclude that
such benefit exists). Expensing these costs immediately best matches expenses to revenues.
2- 12 Direct material costs are the acquisition costs of all materials that eventually become part
of the cost object (work in process and then finished goods), and can be traced to the cost object
in an economically feasible way. Direct manufacturing labor costs include the compensation of all manufacturing labor
that can be traced to the cost object (work in process and then finished goods) in an economically
feasible way.
Manufacturing overhead costs are all manufacturing costs that are related to the cost
object (work in process and then finished goods), but cannot be traced to that cost object in an
economically feasible way.
Prime costs are all direct manufacturing costs (direct material and direct manufacturing
labor).
Conversion costs are all manufacturing costs other than direct material costs.
2-13 Overtime premium is the wage rate paid to workers (for both direct labor and indirect labor)
in excess of their straight-time wage rates.
Idle time is a subclassification of indirect labor that represents wages paid for
unproductive time caused by lack of orders, machine breakdowns, material shortages, poor
scheduling, and the like.
2-14 A product cost is the sum of the costs assigned to a product for a specific purpose. Purposes
for computing a product cost include • pricing and product mix decisions,
• contracting with government agencies, and
• preparing financial statements for external reporting under generally
accepted accounting principles.
2-15 Three common features of cost accounting and cost management are:
• calculating the costs of products, services, and other cost objects
• obtaining information for planning and control and performance evaluation
• analyzing the relevant information for making decisions
2-16 (15 min.) Computing and interpreting manufacturing unit costs.
1. (in millions)
Supreme Deluxe Regular Total Direct material cost $ 89.00 $ 57.00 $60.00 $206.00 Direct manuf. labor costs 16.00 26.00 8.00 50.00 Manufacturing overhead costs 48.00 78.00 24.00 150.00
Total manuf. costs
153.00 161.00 92.00 406.00 Fixed costs allocated at a rate
of $15M ÷ $50M (direct mfg. labor) equal to $0.30 per dir. manuf. labor dollar
(0.30 × $16; 26; 8) 4.80 7.80 2.40 15.00
Variable costs
$148.20 $153.20 $89.60 $391.00
Units produced (millions)
125 150 140
Cost per unit (Total manuf.
costs ÷ units produced) $1.2240 $1.0733 $0.6571
Variable manuf. cost per unit
(Variable manuf. costs
÷ Units produced) $1.1856 $1.0213 $0.6400
(in millions)
2. Supreme Deluxe Regular Total Based on total manuf. cost
per unit ($1.2240 × 150;
$1.0733 × 190; $0.6571 × 220) $183.60 $203.93 $144.56 $532.09
Correct total manuf. costs based
on variable manuf. costs plus
fixed costs equal
Variable costs ($1.1856 × 150; $177.84 $194.05 $140.80 $512.69 $1.0213 × 190; $0.64 × 220) Fixed costs 15.00
Total costs
$527.69
The total manufacturing cost per unit in requirement 1 includes $15 million of indirect
manufacturing costs that are fixed irrespective of changes in the volume of output per month,
while the remaining variable indirect manufacturing costs change with the production volume.
Given the unit volume changes for August 2011, the use of total manufacturing cost per unit
from the past month at a different unit volume level (both in aggregate and at the individual
product level) will overestimate total costs of $532.09 million in August 2011 relative to the
correct total manufacturing costs of $527.69 million calculated using variable manufacturing cost
per unit times units produced plus the fixed costs of $15 million.
2-17 (15 min.) Direct, indirect, fixed and variable costs.
1. Yeast – direct, variable
Flour- direct, variable
Packaging materials –direct (or could be indirect if small and not traced to each unit), variable
Depreciation on ovens –indirect, fixed (unless “units of output” depreciation, which then would be variable)
Depreciation on mixing machines–indirect, fixed (unless “units of output” depreciation, which
then would be variable)
Rent on factory building – indirect, fixed
Fire Insurance on factory building–indirect, fixed
Factory utilities – indirect, probably some variable and some fixed (e.g. electricity
may be variable but heating costs may be fixed)
Finishing department hourly laborers – direct, variable (or fixed if the laborers are under a
union contract)
Mixing department manager – indirect, fixed Materials handlers –depends on how they are paid. If paid hourly and not under union contract,
then indirect, variable. If salaried or under union contract then indirect, fixed Custodian in factory –indirect, fixed
Night guard in factory –indirect, fixed Machinist (running the mixing machine) –depends on how they are paid. If paid hourly and
not under union contract, then indirect, variable. If salaried or under union contract
then indirect, fixed
Machine maintenance personnel – indirect, probably fixed, if salaried, but may be variable
if paid only for time worked and maintenance increases with increased production
Maintenance supplies – indirect, variable
Cleaning supplies – indirect, most likely fixed since the custodians probably do the
same amount of cleaning every night
2. If the cost object is Mixing Department, then anything directly associated with the
• Depreciation on mixing machines
• Mixing Department manager • Materials handlers (of the Mixing Department) • Machinist (running the mixing machines)
• Machine Maintenance personnel (of the Mixing Department) • Maintenance supplies (if separately identified for the Mixing Department)
Of course the yeast and flour will also be a direct cost of the Mixing Department, but it is
already a direct cost of each kind of bread produced.
2-18 (15–20 min.) Classification of costs, service sector.
Cost object: Each individual focus group
Cost variability: With respect to the number of focus groups
There may be some debate over classifications of individual items, especially with
regard to cost variability.
Cost Item D or I V or F A D V B I F
C I Va
D I F
E D V F I F
G D V
H I Vb
aSome students will note that phone call costs are variable when each call has a separate charge. It may be a fixed
cost if Consumer Focus has a flat monthly charge for a line, irrespective of the amount of usage. bGasoline costs are likely to vary with the number of focus groups. However, vehicles likely serve multiple
purposes, and detailed records may be required to examine how costs vary with changes in one of the many
purposes served.
2-19 (15–20 min.) Classification of costs, merchandising sector.
Cost object: Videos sold in video section of store
Cost variability: With respect to changes in the number of videos sold
There may be some debate over classifications of individual items, especially with
regard to cost variability.
Cost Item D or I V or F A D F B I F
C D V
D D F
E I F
F I V
G I F
H D V
2-5
2-20 (15–20 min.) Classification of costs, manufacturing sector.
Cost object: Type of car assembled (Corolla or Geo Prism)
Cost variability: With respect to changes in the number of cars assembled
There may be some debate over classifications of individual items, especially with
regard to cost variability.
Cost Item D or I V or F A D V B I F
C D F
D D F
E D V
F I V
G D V
H I F
2-21 (20 min.) Variable costs, fixed costs, total costs.
1.
Minutes/month 0 50 100 150 200 240 300 327.5 350 400 450 510 540 600 650 Plan A ($/month) 0 5 10 15 20 24 30 32.75 35 40 45 51 54 60 65
Plan B ($/month) 15 15 15 15 15 15 19.80 22 23.80 27.80 31.80 36.60 39 43.80 47.80
Plan C ($/month) 22 22 22 22 22 22 22 22 22 22 22 22 23.50 26.50 29
60
50 Total 40
Cost
Plan A
30
Plan B
20
Plan C
10
0
0 100 200 300 400 500 600
Number of long-distance minutes
2. In each region, Ashton chooses the plan that has the lowest cost. From the graph (or from
calculations)*, we can see that if Ashton expects to use 0–150 minutes of long-distance each
month, she should buy Plan A; for 150–327.5 minutes, Plan B; and for over 327.5 minutes, Plan
C. If Ashton plans to make 100 minutes of long-distance calls each month, she should choose
Plan A; for 240 minutes, choose Plan B; for 540 minutes, choose Plan C. *Let x be the number of minutes when Plan A and Plan B have equal cost
$0.10x = $15
x = $15 ÷ $0.10 per minute = 150 minutes.
Let y be the number of minutes when Plan B and Plan C have equal
cost $15 + $0.08 (y – 240) = $22
$0.08 (y – 240) = $22 – $15 = $7
y – 240 = $0.08$7
87.5
y = 87.5 + 240 = 327.5 minutes
2-6
2-22 (15–20 min.) Variable costs and fixed costs.
1. Variable cost per ton of beach
sand mined Subcontractor
Government tax Total
Fixed costs per month
0 to 100 tons of capacity per day
101 to 200 tons of capacity per day
201 to 300 tons of capacity per day
2.
ost
sC $975,000
riab
lelV
a
$650,000
$325,000
To
ta
2,500 5,000 7,500
Tons Mine d
$ 80 per ton
50 per ton
$130 per ton
= $150,000 = $300,000
= $450,000
$450,000
ost
s
C
Fix
edl
$300,000
$150,000
To
ta
100 200 300
Tons of Cap acity p er Day
The concept of relevant range is potentially relevant for both graphs. However, the question does
not place restrictions on the unit variable costs. The relevant range for the total fixed costs is
from 0 to 100 tons; 101 to 200 tons; 201 to 300 tons, and so on. Within these ranges, the total
fixed costs do not change in total.
3. Tons Mined Tons Mined Fixed Unit Variable Unit Total Unit
per Day per Month Cost per Ton Cost per Ton Cost per Ton
(1) (2) = (1) × 25 (3) = FC ÷ (2) (4) (5) = (3) + (4)
(a) 180 4,500 $300,000 ÷ 4,500 = $66.67 $130 $196.67
(b) 220 5,500 $450,000 ÷ 5,500 = $81.82 $130 $211.82
The unit cost for 220 tons mined per day is $211.82, while for 180 tons it is only $196.67. This
difference is caused by the fixed cost increment from 101 to 200 tons being spread over an
increment of 80 tons, while the fixed cost increment from 201 to 300 tons is spread over an
increment of only 20 tons.
2-7
2-23 (20 min.) Variable costs, fixed costs, relevant range.
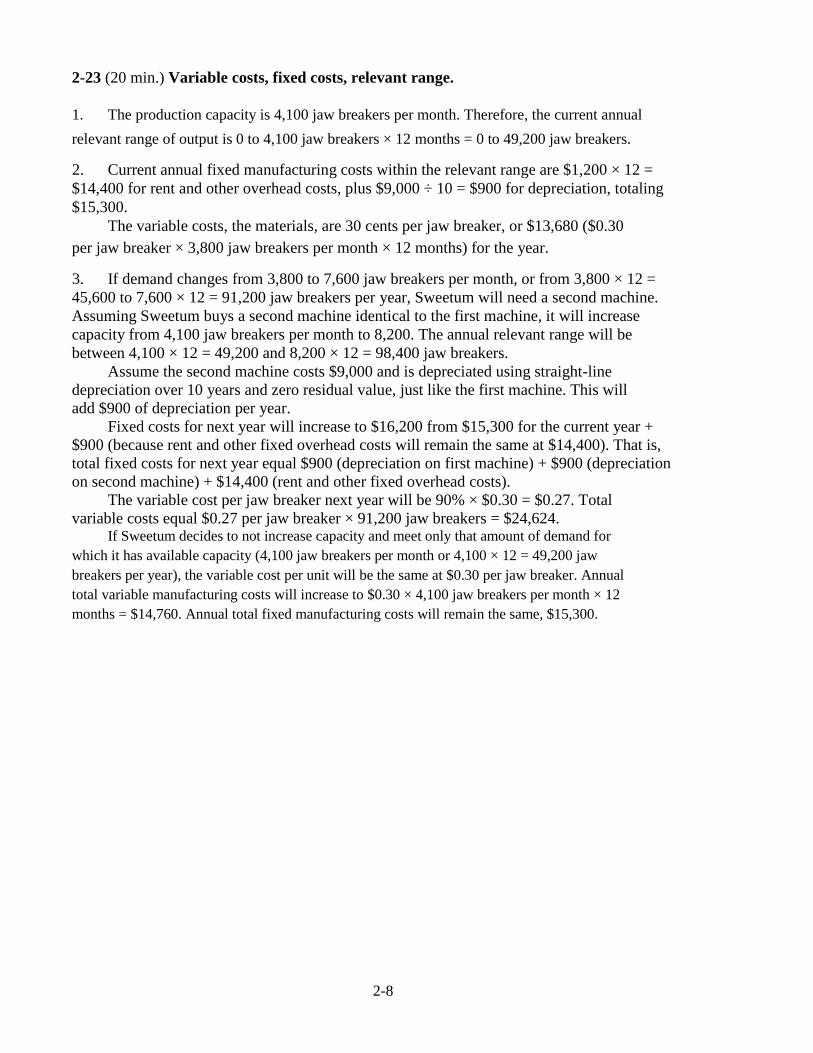
1. The production capacity is 4,100 jaw breakers per month. Therefore, the current annual
relevant range of output is 0 to 4,100 jaw breakers × 12 months = 0 to 49,200 jaw breakers. 2. Current annual fixed manufacturing costs within the relevant range are $1,200 × 12 =
$14,400 for rent and other overhead costs, plus $9,000 ÷ 10 = $900 for depreciation, totaling
$15,300. The variable costs, the materials, are 30 cents per jaw breaker, or $13,680 ($0.30
per jaw breaker × 3,800 jaw breakers per month × 12 months) for the year. 3. If demand changes from 3,800 to 7,600 jaw breakers per month, or from 3,800 × 12 =
45,600 to 7,600 × 12 = 91,200 jaw breakers per year, Sweetum will need a second machine.
Assuming Sweetum buys a second machine identical to the first machine, it will increase
capacity from 4,100 jaw breakers per month to 8,200. The annual relevant range will be
between 4,100 × 12 = 49,200 and 8,200 × 12 = 98,400 jaw breakers. Assume the second machine costs $9,000 and is depreciated using straight-line
depreciation over 10 years and zero residual value, just like the first machine. This will
add $900 of depreciation per year.
Fixed costs for next year will increase to $16,200 from $15,300 for the current year +
$900 (because rent and other fixed overhead costs will remain the same at $14,400). That is,
total fixed costs for next year equal $900 (depreciation on first machine) + $900 (depreciation
on second machine) + $14,400 (rent and other fixed overhead costs).
The variable cost per jaw breaker next year will be 90% × $0.30 = $0.27. Total
variable costs equal $0.27 per jaw breaker × 91,200 jaw breakers = $24,624. If Sweetum decides to not increase capacity and meet only that amount of demand for
which it has available capacity (4,100 jaw breakers per month or 4,100 × 12 = 49,200 jaw
breakers per year), the variable cost per unit will be the same at $0.30 per jaw breaker. Annual
total variable manufacturing costs will increase to $0.30 × 4,100 jaw breakers per month × 12
months = $14,760. Annual total fixed manufacturing costs will remain the same, $15,300.
2-8
2-24 (20 min.) Cost drivers and value chain.
1. Identify customer needs (what do smartphone users want?) — Design of products and
processes Perform market research on competing brands — Design of products and processes
Design a prototype of the HCP smartphone — Design of products and processes
Market the new design to cell phone companies — Marketing Manufacture the
HCP smartphone — Production
Process orders from cell phone companies — Distribution
Package the HCP smartphones — Production
Deliver the HCP smartphones to the cell phone companies — Distribution
Provide online assistance to cell phone users for use of the HCP smartphone —
Customer Service
Make design changes to the HCP smartphone based on customer feedback — Design of products and processes
2.
Value Chain
Category Activity Cost driver Design of Identify customer needs Number of surveys returned and processed
products and from competing smartphone users
processes Perform market research on Hours spent researching competing market
competing brands brands
Number of surveys returned and processed
from competing smartphone users
Design a prototype of the HCP Engineering hours spent on initial product
smartphone design
Make design changes to the Number of design changes
smartphone based on
customer feedback
Production Manufacture the HCP Machine hours required to run the
smartphones production equipment
Package the HCP smartphones Number of smartphones shipped by HCP
Marketing Market the new design to cell Number of cell phone companies purchasing
phone companies the HCP smartphone
Distribution Process orders from cell phone Number of smartphone orders processed
companies Number of deliveries made to cell phone
companies
Deliver the HCP smartphones Number of deliveries made to cell phone
to cell phone companies companies
Customer Provide on-line assistance to Number of smartphones shipped by HCP
Service cell phone users for use of Customer Service hours
the HCP smartphone
2-9
2-25 (10–15 min.) Cost drivers and functions.
1.
Function Representative Cost Driver 1. Accounting Number of transactions processed
2. Human Resources Number of employees
3. Data processing Hours of computer processing unit (CPU)
4. Research and development Number of research scientists
5. Purchasing Number of purchase orders
6. Distribution Number of deliveries made
7. Billing Number of invoices sent
2.
Function Representative Cost Driver 1. Accounting Number of journal entries made
2. Human Resources Salaries and wages of employees
3. Data Processing Number of computer transactions
4. Research and Development Number of new products being developed
5. Purchasing Number of different types of materials purchased
6. Distribution Distance traveled to make deliveries
7. Billing Number of credit sales transactions
2-10
2-26 (20 min.) Total costs and unit costs
1.
Number of attendees 0 100 200 300 400 500 600 Variable cost per person
($9 caterer charge –
$4 $4 $4 $4 $4 $4 $4 $5 student door fee) Fixed Costs
$1,600 $1,600 $1,600 $1,600 $1,600 $1,600 $1,600
Variable costs (number of attendees × variable cost per
person) 0 400 800 1,200 1,600 2,000 2,400 Total costs (fixed + variable)
$1,600 $2,000 $2,400 $2,800 $3,200 $3,600 $4,000
Fixed, Variable and Total Cost of Graduation Party
5000
4000
Costs ($) 3000 Fixed costs
Variable costs
2000 Total cost
1000
0 0 100 200 300 400 500 600
Number of attendees
2.
Number of attendees 0 100 200 300 400 500 600 Total costs
(fixed + variable) $1,600 $2,000 $2,400 $2,800 $ 3,200 $ 3,600 $ 4,000
Costs per attendee (total
costs number of attendees) $20.00 $12.00 $9.33 $ 8.00 $ 7.20 $ 6.67
As shown in the table above, for 100 attendees the total cost will be $2,000 and the cost
per attendee will be $20.
3. As shown in the table in requirement 2, for 500 attendees the total cost will be $3,600
and the cost per attendee will be $7.20.
2-11
4. Using the calculations shown in the table in requirement 2, we can construct the cost-
per-attendee graph shown below: 25
Cost per Attendee 20
($)
15
10
5
0 0 100 200 300 400 500 600 700
Number of Attendees
As president of the student association requesting a grant for the party, you should not use the
per unit calculations to make your case. The person making the grant may assume an attendance
of 500 students and use a low number like $7.20 per attendee to calculate the size of your grant.
Instead, you should emphasize the fixed cost of $ 1,600 that you will incur even if no students or
very few students attend the party, and try to get a grant to cover as much of the fixed costs as
possible as well as a variable portion to cover as much of the $4 variable cost to the student
association for each person attending the party.
2-27 (25 min.) Total and unit cost, decision making.
1.
$70,000
Tota $60,000
Fixed Costs l $50,000 Man
$40,000
Variable Costs ufac
turin $30,000
g $20,000 Total
Cost Manufacturing
$10,000 Costs
s
$0
0 5,000 10,000
Number of Flanges
Note that the production costs include the $28,000 of fixed manufacturing costs but not the
$10,000 of period costs. The variable cost is $1 per flange for materials, and $2.80 per flange
($28 per hour divided by 10 flanges per hour) for direct manufacturing labor for a total of $3.80
per flange.
2-12
2. The inventoriable (manufacturing) cost per unit for 5,000 flanges is
$3.80 × 5,000 + $28,000 = $47,000 Average (unit) cost = $47,000 ÷ 5,000 units = $9.40 per unit.
This is below Flora’s selling price of $10 per flange. However, in order to make a profit,
Gayle’s Glassworks also needs to cover the period (non-manufacturing) costs of
$10,000, or $10,000 ÷ 5,000 = $2 per unit.
Thus total costs, both inventoriable (manufacturing) and period (non-manufacturing), for the
flanges is $9.40 + $2 = $ 11.40. Gayle’s Glassworks cannot sell below Flora’s price of $10 and
still make a profit on the flanges.
Alternatively,
At Flora’s price of $10 per flange:
Revenue $10 × 5,000 = $50,000 Variable costs $3.80 × 5,000 = 19,000 Fixed costs 38,000
Operating loss
$ (7,000)
Gayle’s Glassworks cannot sell below $10 per flange and make a profit. At Flora’s price of $10
per flange, the company has an operating loss of $7,000.
3. If Gayle’s Glassworks produces 10,000 units, then total inventoriable cost will be:
Variable cost ($3.80 × 10,000) + fixed manufacturing costs, $28,000 = total manufacturing
costs, $66,000.
Average (unit) inventoriable (manufacturing) cost will be $66,000 ÷ 10,000 units = $6.60 per flange
Unit total cost including both inventoriable and period costs will be
($66,000 + $10,000) ÷ 10,000 = $7.60 per flange, and Gayle’s Glassworks will be able to sell
the flanges for less than Flora and still make a profit.
Alternatively,
At Flora’s price of $10 per flange:
Revenue $10 × 10,000 = $100,000 Variable costs $3.80 × 10,000 = 38,000 Fixed costs 38,000
Operating income
$
24,000
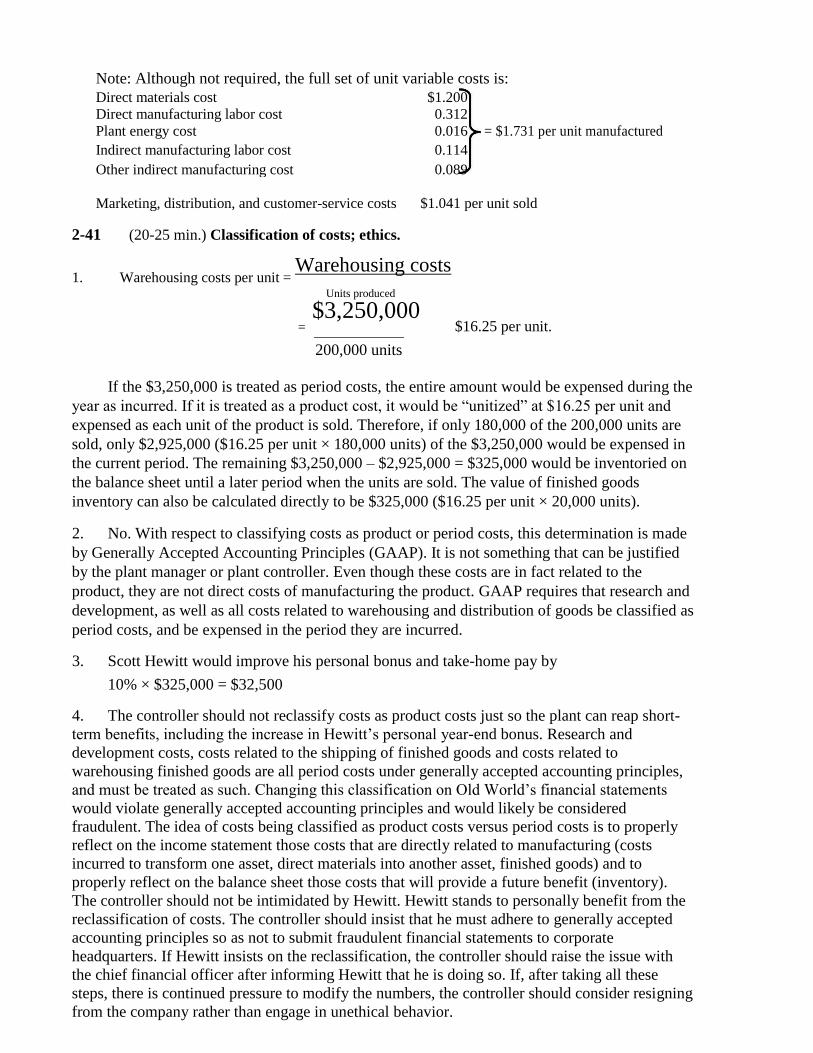
Gayle’s Glassworks can sell at a price below $10 per flange and still make a profit. The
company earns operating income of $24,000 at a price of $10 per flange. The company will
earn operating income as long as the price exceeds $7.60 per flange.
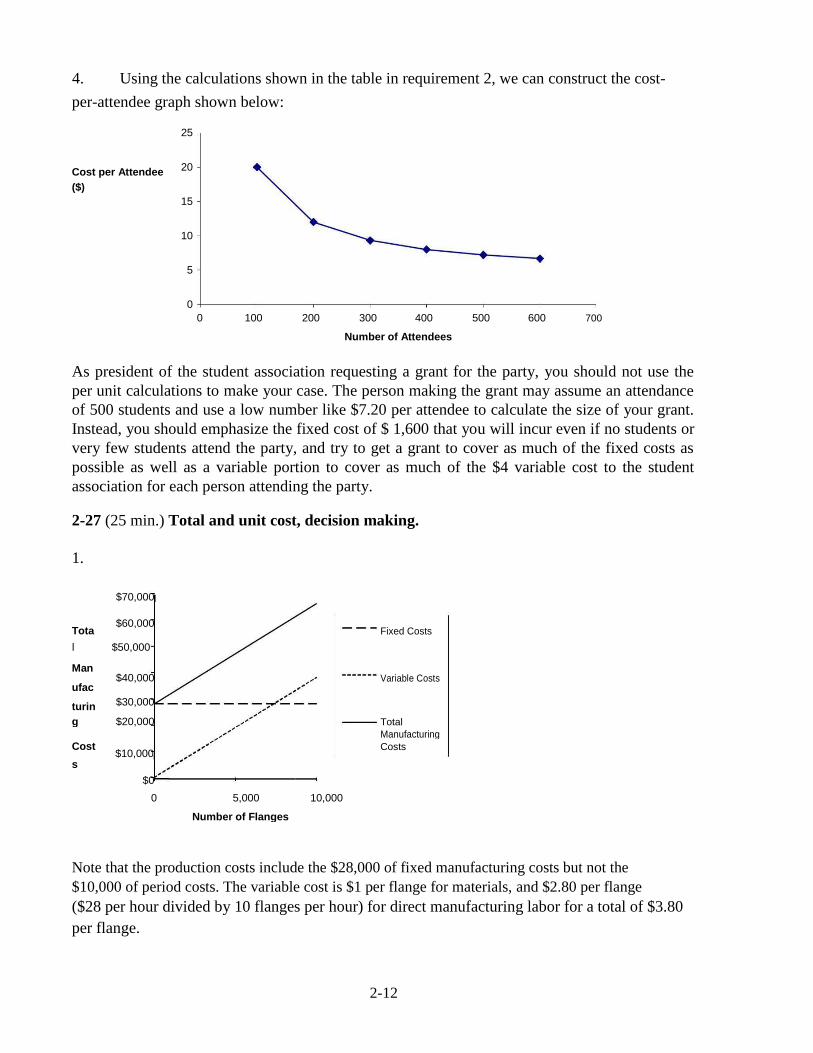
The reason the unit cost decreases significantly is that inventoriable (manufacturing) fixed
costs and fixed period (nonmanufacturing) costs remain the same regardless of the number of
units produced. So, as Gayle’s Glassworks produces more units, fixed costs are spread over
more units, and cost per unit decreases. This means that if you use unit costs to make decisions
about pricing, and which product to produce, you must be aware that the unit cost only applies
to a particular level of output.
2-13
2-28 (20–30 min.) Inventoriable costs versus period costs.
1. Manufacturing-sector companies purchase materials and components and convert them
into different finished goods.
Merchandising-sector companies purchase and then sell tangible products
without changing their basic form.
Service-sector companies provide services or intangible products to their customers—
for example, legal advice or audits.
Only manufacturing and merchandising companies have inventories of goods for sale. 2. Inventoriable costs are all costs of a product that are regarded as an asset when they are
incurred and then become cost of goods sold when the product is sold. These costs for a
manufacturing company are included in work-in-process and finished goods inventory (they are
“inventoried”) to build up the costs of creating these assets. Period costs are all costs in the income statement other than cost of goods sold. These
costs are treated as expenses of the period in which they are incurred because they are presumed
not to benefit future periods (or because there is not sufficient evidence to conclude that such
benefit exists). Expensing these costs immediately best matches expenses to revenues. 3. (a) Perrier mineral water purchased for resale by Safeway—inventoriable cost of a
merchandising company. It becomes part of cost of goods sold when the mineral water is sold.
(b) Electricity used for lighting at GE refrigerator assembly plant—inventoriable cost of
a manufacturing company. It is part of the manufacturing overhead that is included in the
manufacturing cost of a refrigerator finished good. (c) Depreciation on Google’s computer equipment used to update directories of web sites
—period cost of a service company. Google has no inventory of goods for sale and, hence, no
inventoriable cost. (d) Electricity used to provide lighting for Safeway’s store aisles—period cost of a
merchandising company. It is a cost that benefits the current period and it is not traceable to
goods purchased for resale.
(e) Depreciation on GE’s assembly testing equipment—inventoriable cost of a
manufacturing company. It is part of the manufacturing overhead that is included in the
manufacturing cost of a refrigerator finished good.
(f) Salaries of Safeway’s marketing personnel—period cost of a merchandising
company. It is a cost that is not traceable to goods purchased for resale. It is presumed not to
benefit future periods (or at least not to have sufficiently reliable evidence to estimate such future
benefits).
(g) Perrier mineral water consumed by Google’s software engineers—period cost of a
service company. Google has no inventory of goods for sale and, hence, no inventoriable cost.
(h) Salaries of Google’s marketing personnel—period cost of a service company. Google
has no inventory of goods for sale and, hence, no inventoriable cost.
2-14
2-29 (20 min.) Computing cost of goods purchased and cost of goods sold.
1a. Marvin Department Store
Schedule of Cost of Goods Purchased
For the Year Ended December 31, 2011
(in thousands)
Purchases $155,000
Add transportation-in 7,000
Deduct: 162,000
Purchase returns and allowances $4,000
Purchase discounts 6,000 10,000
Cost of goods purchased $152,000
1b. Marvin Department Store
Schedule of Cost of Goods Sold
For the Year Ended December 31, 2011
(in thousands)
$
Beginning merchandise inventory 1/1/2011 27,000
Cost of goods purchased (see above) 152,000 Cost of goods available for sale 179,000 Ending merchandise inventory 12/31/2011 34,000 Cost of goods sold
$145,000
2. Marvin Department Store
Income Statement
Year Ended December 31, 2011
(in thousands)
Revenues $280,000
Cost of goods sold (see above) 145,000 Gross margin 135,000 Operating costs
Marketing, distribution, and customer
service costs $37,000
Utilities 17,000 General and administrative costs 43,000
Miscellaneous costs 4,000
Total operating costs
101,000
Operating income $ 34,000
2-15
2-30 (20 min.) Cost of goods purchased, cost of goods sold, and income statement.
1a. Montgomery Retail Outlet Stores
Schedule of Cost of Goods Purchased
For the Year Ended December 31, 2011
(in thousands)
Purchases $260,000
Add freight—in 10,000
Deduct: 270,000
Purchase returns and allowances $11,000
Purchase discounts 9,000 20,000
Cost of goods purchased $250,000
1b. Montgomery Retail Outlet Stores
Schedule of Cost of Goods Sold
For the Year Ended December 31, 2011
(in thousands)
$
Beginning merchandise inventory 1/1/2011 45,000
Cost of goods purchased (see above) 250,000 Cost of goods available for sale 295,000 Ending merchandise inventory 12/31/2011 52,000 Cost of goods sold
$243,000
2. Montgomery Retail Outlet Stores
Income Statement
Year Ended December 31, 2011
(in thousands)
Revenues $320,000
Cost of goods sold (see above) 243,000 Gross margin 77,000 Operating costs
Marketing and advertising costs $24,000
Building depreciation 4,200 Shipping of merchandise to customers 2,000
General and administrative costs 32,000
Total operating costs
62,200
Operating income $ 14,800
2-16
2-31 (20 min.) Flow of Inventoriable Costs.
(All numbers below are in millions).
1. Direct materials inventory 10/1/2011 $ 105
Direct materials purchased 365 Direct materials available for production 470 Direct materials used (385)
Direct materials inventory 10/31/2011
$ 85
2.
Total manufacturing overhead costs $ 450 Subtract: Variable manufacturing overhead costs (265)
Fixed manufacturing overhead costs for October 2011
$ 185
3.
Total manufacturing costs $ 1,610 Subtract: Direct materials used (from requirement 1) (385) Total manufacturing overhead costs (450)
Direct manufacturing labor costs for October 2011 $
775
4.
Work-in-process inventory 10/1/2011 $ 230
Total manufacturing costs 1,610 Work-in-process available for production 1,840 Subtract: Cost of goods manufactured (moved into FG) (1,660)
Work-in-process inventory 10/31/2011 $
180
5.
Finished goods inventory 10/1/2011 $ 130 Cost of goods manufactured (moved from WIP) 1,660
Cost of finished goods available for sale in October 2011 $
1,790
6.
Finished goods available for sale in October 2011 (from requirement 5) $ 1,790
Subtract: Cost of goods sold (1,770)
Finished goods inventory 10/31/2011
$ 20
2-17
2-32 (30–40 min.) Cost of goods manufactured.
1. Canseco Company Schedule of Cost of Goods Manufactured
Year Ended December 31, 2011
(in thousands) Direct materials cost
Beginning inventory, January 1, 2011 $ 22,000
Purchases of direct materials 75,000 Cost of direct materials available for use 97,000
Ending inventory, December 31, 2011 26,000 Direct materials used $ 71,000
Direct manufacturing labor costs 25,000
Indirect manufacturing costs
Indirect manufacturing labor 15,000
Plant insurance 9,000
Depreciation—plant building & equipment 11,000
Repairs and maintenance—plant 4,000
Total indirect manufacturing costs
39,000
Manufacturing costs incurred during 2011 135,000
Add beginning work-in-process inventory, January 1, 2011 21,000 Total manufacturing costs to account for 156,000 Deduct ending work-in-process inventory, December 31, 2011 20,000
Cost of goods manufactured (to Income Statement)
$136,000
2. Canseco Company
Income Statement
Year Ended December 31, 2011
(in thousands)
Revenues $300,000 Cost of goods sold:
Beginning finished goods, January 1, 2011 $ 18,000
Cost of goods manufactured 136,000 Cost of goods available for sale 154,000
Ending finished goods, December 31, 2011 23,000
Cost of goods sold
131,000
Gross margin 169,000 Operating costs:
Marketing, distribution, and customer-service costs 93,000
General and administrative costs 29,000 Total operating costs
122,000
Operating income
$ 47,000
2-18
2-33 (30–40 min.) Cost of goods manufactured, income statement, manufacturing
company.
Piedmont Corporation Schedule of Cost of Goods Manufactured
Year Ended December 31, 2011
(in thousands)
Direct materials costs
Beginning inventory, January 1, 2011 $ 65,000
Purchases of direct materials 128,000 Cost of direct materials available for use 193,000
Ending inventory, December 31, 2011 34,000 Direct materials used $159,000
Direct manufacturing labor costs 106,000
Indirect manufacturing costs
Indirect manufacturing labor 48,000
Indirect materials 14,000
Plant insurance 2,000
Depreciation—plant building & equipment 21,000
Plant utilities 12,000
Repairs and maintenance—plant 8,000
Equipment lease costs 32,000
Total indirect manufacturing costs
137,000
Manufacturing costs incurred during 2011 402,000
Add beginning work-in-process inventory, January 1, 2011 83,000 Total manufacturing costs to account for 485,000
Deduct ending work-in-process inventory, December 31, 2011 72,000
Cost of goods manufactured (to Income Statement)
$413,000
Piedmont Corporation
Income Statement
Year Ended December 31, 2011
(in thousands)
Revenues $ 600,000
Cost of goods sold:
Beginning finished goods, January 1, 2011 $123,000
Cost of goods manufactured 413,000 Cost of goods available for sale 536,000
Ending finished goods, December 31, 2011 102,000
Cost of goods sold
434,000
Gross margin 166,000
Operating costs:
Marketing, distribution, and customer-service costs 62,000
General and administrative costs 34,000
Total operating costs
96,000
Operating income $
70,000
2-19
2-34 (25–30 min.) Income statement and schedule of cost of goods manufactured.
Howell Corporation
Income Statement for the Year Ended December 31, 2011
(in millions)
Revenues $950
Cost of goods sold Beginning finished goods, Jan. 1, 2011 $ 70
Cost of goods manufactured (below) 645 Cost of goods available for sale 715
Ending finished goods, Dec. 31, 2011 55 660 Gross margin 290 Marketing, distribution, and customer-service costs 240
Operating income
$ 50
Howell Corporation
Schedule of Cost of Goods Manufactured
for the Year Ended December 31, 2011
(in millions)
Direct materials costs Beginning inventory, Jan. 1, 2011 $ 15
Purchases of direct materials 325 Cost of direct materials available for use 340
Ending inventory, Dec. 31, 2011 20 Direct materials used $320
Direct manufacturing labor costs 100
Indirect manufacturing costs
Indirect manufacturing labor 60
Plant supplies used 10
Plant utilities 30
Depreciation––plant and equipment 80 Plant supervisory salaries 5
Miscellaneous plant overhead 35 220 Manufacturing costs incurred during 2011 640
Add beginning work-in-process inventory, Jan. 1, 2011 10 Total manufacturing costs to account for 650 Deduct ending work-in-process, Dec. 31, 2011 5 Cost of goods manufactured
$645
2-20
2-35 (15–20 min.) Interpretation of statements (continuation of 2-32).
1. The schedule in 2-34 can become a Schedule of Cost of Goods Manufactured and Sold
simply by including the beginning and ending finished goods inventory figures in the supporting
schedule, rather than directly in the body of the income statement. Note that the term cost of
goods manufactured refers to the cost of goods brought to completion (finished) during the
accounting period, whether they were started before or during the current accounting period.
Some of the manufacturing costs incurred are held back as costs of the ending work in process;
similarly, the costs of the beginning work in process inventory become a part of the cost of goods
manufactured for 2011.
2. The sales manager’s salary would be charged as a marketing cost as incurred by both
manufacturing and merchandising companies. It is basically an operating cost that appears below
the gross margin line on an income statement. In contrast, an assembler’s wages would be
assigned to the products worked on. Thus, the wages cost would be charged to Work-in-Process
and would not be expensed until the product is transferred through Finished Goods Inventory to
Cost of Goods Sold as the product is sold.
3. The direct-indirect distinction can be resolved only with respect to a particular cost
object. For example, in defense contracting, the cost object may be defined as a contract. Then, a
plant supervisor working only on that contract will have his or her salary charged directly and
wholly to that single contract.
4. Direct materials used = $320,000,000 ÷ 1,000,000 units = $320 per unit
Depreciation on plant equipment = $80,000,000 ÷ 1,000,000 units = $80 per unit
5. Direct materials unit cost would be unchanged at $320 per unit. Depreciation cost per
unit would be $80,000,000 ÷ 1,200,000 = $66.67 per unit. Total direct materials costs would rise
by 20% to $384,000,000 ($320 per unit × 1,200,000 units), whereas total depreciation would be
unaffected at $80,000,000.
6. Unit costs are averages, and they must be interpreted with caution. The $320 direct materials
unit cost is valid for predicting total costs because direct materials is a variable cost; total direct
materials costs indeed change as output levels change. However, fixed costs like depreciation
must be interpreted quite differently from variable costs. A common error in cost analysis is to
regard all unit costs as one—as if all the total costs to which they are related are variable costs.
Changes in output levels (the denominator) will affect total variable costs, but not total fixed
costs. Graphs of the two costs may clarify this point; it is safer to think in terms of total costs
rather than in terms of unit costs.
2-21
2-36 (25–30 min.) Income statement and schedule of cost of goods manufactured.
Calendar Corporation
Income Statement
for the Year Ended December 31, 2011
(in millions)
Revenues $355
Cost of goods sold Beginning finished goods, Jan. 1, 2011 $ 47
Cost of goods manufactured (below) 228 Cost of goods available for sale 275
Ending finished goods, Dec. 31, 2011 11 264 Gross margin 91
Marketing, distribution, and customer-service costs 94
Operating income (loss)
$ (3)
Calendar Corporation
Schedule of Cost of Goods Manufactured
for the Year Ended December 31, 2011
(in millions)
Direct material costs Beginning inventory, Jan. 1, 2011 $ 32
Direct materials purchased 84 Cost of direct materials available for use 116
Ending inventory, Dec. 31, 2011 8 Direct materials used $108
Direct manufacturing labor costs 42
Indirect manufacturing costs
Plant supplies used 4
Property taxes on plant 2
Plant utilities 9
Indirect manufacturing labor costs 27 Depreciation––plant and equipment 6
Miscellaneous manufacturing overhead costs 15 63 Manufacturing costs incurred during 2011 213
Add beginning work-in-process inventory, Jan. 1, 2011 18 Total manufacturing costs to account for 231 Deduct ending work-in-process inventory, Dec. 31, 2011 3 Cost of goods manufactured (to income statement)
$228
2-22
2-37 (15–20 min.)Terminology, interpretation of statements (continuation of 2-34).
1. Direct materials used $108 million Direct manufacturing labor costs 42 million
Prime costs
million $150
Direct manufacturing labor costs $ 42 million Indirect manufacturing costs 63 million
Conversion costs
million $105
2. Inventoriable costs (in millions) for Year 2011
Plant utilities $ 9
Indirect manufacturing labor 27
Depreciation—plant and equipment 6
Miscellaneous manufacturing overhead 15
Direct materials used 108
Direct manufacturing labor 42 Plant supplies used 4 Property tax on plant 2
Total inventoriable costs
$213
Period costs (in millions) for Year 2011
$ 94
Marketing, distribution, and customer-service costs
3. Design costs and R&D costs may be regarded as product costs in case of contracting with
a governmental agency. For example, if the Air Force negotiated to contract with Lockheed to
build a new type of supersonic fighter plane, design costs and R&D costs may be included in the
contract as product costs.
4. Direct materials used = $108,000,000 ÷ 2,000,000 units = $54 per unit Depreciation
on plant and equipment = $6,000,000 ÷ 2,000,000 units = $3 per unit
5. Direct materials unit cost would be unchanged at $108. Depreciation unit cost would be
$6,000,000 ÷ 3,000,000 = $2 per unit. Total direct materials costs would rise by 50% to
$162,000,000 ($54 per unit × 3,000,000 units). Total depreciation cost of $6,000,000 would
remain unchanged.
6. In this case, equipment depreciation is a variable cost in relation to the unit output. The
amount of equipment depreciation will change in direct proportion to the number of units
produced. (a) Depreciation will be $2 million (2 million × $1) when 2 million units are produced.
(b) Depreciation will be $3 million (3 million × $1) when 3 million units are produced.
2-23
2-38 (20 min.) Labor cost, overtime and idle time.
1.(a) Total cost of hours worked at regular rates
44 hours × $20 per hour $ 880
43 hours × $20 per hour 860 48 hours × $20 per hour 960
46 hours × $20 per hour 920
Minus idle time 3,620
(3.5 hours × $20 per hour) 70
(6.4 hours × $20 per hour) 128 (5.8 hours × $20 per hour) 116
(2 hours × $20 per hour) 40
Total idle time
354
Direct manufacturing labor costs $
3,266
(b) Idle time = 17.7 hours × $20 per hour = $ 354 (c) Overtime and holiday premium.
Week 1: Overtime (44 – 40) hours × Premium, $10 per hour $ 40
Week 2: Overtime (43 – 40) hours × Premium, $10 per hour 30
Week 3: Overtime (48 – 40) hours × Premium, $20 per hour 160 Week 4: Overtime (46 – 40) hours × Premium, $10 per hour 60 Week 4: Holiday 8 hours × 2 days × Premium, $20 per hour 320
Total overtime and holiday premium
$ 610
(d) Total earnings in December
Direct manufacturing labor costs $3,266 Idle time 354 Overtime and holiday premium 610
Total earnings $
4,230
2. Idle time caused by regular machine maintenance, slow order periods, or unexpected
mechanical problems is an indirect cost of the product because it is not related to a specific
product. Overtime premium caused by the heavy overall volume of work is also an indirect cost
because it is not related to a particular job that happened to be worked on during the overtime
hours. If, however, the overtime is the result of a demanding “rush job,” the overtime premium is
a direct cost of that job.
2-24
2-39 (30–40 min.) Missing records, computing inventory costs.
1. Finished goods inventory, 3/31/2011 = $210,000 2. Work-in-process inventory, 3/31/2011 = $190,000
3. Direct materials inventory, 3/31/2011 = $85,000
This problem is not as easy as it first appears. These answers are obtained by working from the
known figures to the unknowns in the schedule below. The basic relationships between
categories of costs are:
Manufacturing costs added during the period (given) $840,000
Conversion costs (given) $660,000
Direct materials used = Manufacturing costs added – Conversion costs = $840,000 – $660,000 = $180,000
Cost of goods manufactured = Direct Materials Used × 4 = $180,000 × 4 = $720,000
Schedule of Computations
$ 25,000
Direct materials, 3/1/2011 (given)
Direct materials purchased (given) 240,000 Direct materials available for use 265,000
Direct materials, 3/31/2011 3 = 85,000 Direct materials used 180,000
Conversion costs (given) 660,000 Manufacturing costs added during the period (given) 840,000
Add work in process, 3/1/2011 (given) 70,000 Manufacturing costs to account for 910,000
Deduct work in process, 3/31/2011 2 = 190,000 Cost of goods manufactured (4 × $180,000) 720,000
Add finished goods, 3/1/2011 320,000 Cost of goods available for sale 1,040,000 Deduct finished goods, 3/31/2011 1 = 210,000
Cost of goods sold (80% × $1,037,500)
$830,000
Some instructors may wish to place the key amounts in a Work in Process T-account. This
problem can be used to introduce students to the flow of costs through the general ledger
(amounts in thousands):
Cost of
Direct Materials Work in Process Finished Goods Goods Sold
25
BI BI 70 BI 320
Purch 240 DM DM used COGM 720 720 COGS 830 830
used 180 (840–660) 180
85
Conversion 660
EI
To account Available
for 910 for sale 1,040
EI 190 EI 210
2-25
2-40 (30 min.) Comprehensive problem on unit costs, product costs.
1. If 2 pounds of direct materials are used to make each unit of finished product, 123,000
units × 2 lbs., or 246,000 lbs. were used at $0.60 per pound of direct materials ($147,600 ÷
246,000 lbs.). (The direct material costs of $147,600 are direct materials used, not purchased.)
Therefore, the ending inventory of direct materials is 2,400 lbs. × $0.60 = $1,440.
2.
Direct materials costs
Direct manufacturing labor costs
Plant energy costs
Indirect manufacturing labor costs
Other indirect manufacturing costs
Cost of goods manufactured
Average unit manufacturing cost:
Finished goods inventory in units:
Manufacturing Costs for 123,000 units
Variable Fixed Total
$147,600 $ – $147,600
38,400 – 38,400
2,000 – 2,000 14,000 19,000 33,000
11,000 14,000 25,000 $213,000 $33,000 $246,000
$246,000 ÷ 123,000 units = $2.00 per unit
= $26,000 (given) $2.00 per unit
= 13,000 units
3. Units sold in 2011 = Beginning inventory + Production – Ending inventory
= 0 + 123,000 –13,000 = 110,000 units
Selling price in 2011 = $594,000 ÷ 110,000
= $5.40 per unit
4.
Denver Office Equipment
Income Statement
Year Ended December 31, 2011
(in thousands)
Revenues (110,000 units sold × $5.40) $594,000
Cost of units sold: Beginning finished goods, Jan. 1, 2011 $ 0
Cost of goods manufactured 246,000 Cost of goods available for sale 246,000
Ending finished goods, Dec. 31, 2011 26,000 220,000 Gross margin 374,000 Operating costs:
Marketing, distribution, and customer-service costs 176,000
Administrative costs 56,000 232,000 Operating income
$142,000
2-26
Note: Although not required, the full set of unit variable costs is: Direct materials cost $1.200
Direct manufacturing labor cost 0.312 Plant energy cost 0.016 = $1.731 per unit manufactured
Indirect manufacturing labor cost 0.114
Other indirect manufacturing cost 0.089
Marketing, distribution, and customer-service costs $1.041 per unit sold
2-41 (20-25 min.) Classification of costs; ethics.
1. Warehousing costs per unit = Warehousing costs
Units produced
= $3,250,000
$16.25 per unit.
200,000 units
If the $3,250,000 is treated as period costs, the entire amount would be expensed during the
year as incurred. If it is treated as a product cost, it would be “unitized” at $16.25 per unit and
expensed as each unit of the product is sold. Therefore, if only 180,000 of the 200,000 units are
sold, only $2,925,000 ($16.25 per unit × 180,000 units) of the $3,250,000 would be expensed in
the current period. The remaining $3,250,000 – $2,925,000 = $325,000 would be inventoried on
the balance sheet until a later period when the units are sold. The value of finished goods
inventory can also be calculated directly to be $325,000 ($16.25 per unit × 20,000 units).
2. No. With respect to classifying costs as product or period costs, this determination is made
by Generally Accepted Accounting Principles (GAAP). It is not something that can be justified
by the plant manager or plant controller. Even though these costs are in fact related to the
product, they are not direct costs of manufacturing the product. GAAP requires that research and
development, as well as all costs related to warehousing and distribution of goods be classified as
period costs, and be expensed in the period they are incurred. 3. Scott Hewitt would improve his personal bonus and take-home pay by
10% × $325,000 = $32,500 4. The controller should not reclassify costs as product costs just so the plant can reap short-
term benefits, including the increase in Hewitt’s personal year-end bonus. Research and
development costs, costs related to the shipping of finished goods and costs related to
warehousing finished goods are all period costs under generally accepted accounting principles,
and must be treated as such. Changing this classification on Old World’s financial statements
would violate generally accepted accounting principles and would likely be considered
fraudulent. The idea of costs being classified as product costs versus period costs is to properly
reflect on the income statement those costs that are directly related to manufacturing (costs
incurred to transform one asset, direct materials into another asset, finished goods) and to
properly reflect on the balance sheet those costs that will provide a future benefit (inventory).
The controller should not be intimidated by Hewitt. Hewitt stands to personally benefit from the
reclassification of costs. The controller should insist that he must adhere to generally accepted
accounting principles so as not to submit fraudulent financial statements to corporate
headquarters. If Hewitt insists on the reclassification, the controller should raise the issue with
the chief financial officer after informing Hewitt that he is doing so. If, after taking all these
steps, there is continued pressure to modify the numbers, the controller should consider resigning
from the company rather than engage in unethical behavior.
2-42 (20–25 min.) Finding unknown amounts.
Let G = given, I = inferred
Case 1
Case 2 Step 1: Use gross margin formula
Revenues $
G
G 32,000 $31,800 Cost of goods sold A 20,700 I 20,000G Gross margin
G
I $ 11,300 C $11,800
Step 2: Use schedule of cost of goods manufactured formula
Direct materials used $ 8,000 G $ 12,000 G
Direct manufacturing labor costs 3,000 G 5,000 G
Indirect manufacturing costs 7,000 G D 6,500 I Manufacturing costs incurred
I
I 18,000 23,500
Add beginning work in process, 1/1 0 G 800G Total manufacturing costs to account for 18,000 I 24,300 I Deduct ending work in process, 12/31 0 G 3,000G
Cost of goods manufactured $
I
I 18,000 $ 21,300
Step 3: Use cost of goods sold formula
Beginning finished goods inventory, 1/1 $ 4,000 G $ 4,000 G
Cost of goods manufactured 18,000 I 21,300 I
Cost of goods available for sale
I
I 22,000 25,300 Ending finished goods inventory, 12/31 B1,300 I 5,300G
Cost of goods sold $
I
G 20,700 $ 20,000 For case 1, do steps 1, 2, and 3 in order.
For case 2, do steps 1, 3, and then 2.
2-29