CHAPTER 1 INTRODUCTION TO CORPORATE FINANCE Answers to Concepts Review and Critical Thinking Questions 1. Capital budgeting (deciding on whether to expand a manufacturing plant), capital structure (deciding whether to issue new equity and use the proceeds to retire outstanding debt), and working capital management (modifying the firm’s credit collection policy with its customers). 2. Disadvantages: unlimited liability, limited life, difficulty in transferring ownership, hard to raise capital funds. Some advantages: simpler, less regulation, the owners are also the managers, sometimes personal tax rates are better than corporate tax rates. 3. The primary disadvantage of the corporate form is the double taxation to shareholders of distributed earnings and dividends. Some advantages include: limited liability, ease of transferability, ability to raise capital, and unlimited life. 4. The treasurer’s office and the controller’s office are the two primary organizational groups that report directly to the chief financial officer. The controller’s office handles cost and financial accounting, tax management, and management information systems. The treasurer’s office is responsible for cash and credit management, capital budgeting, and financial planning. Therefore, the study of corporate finance is concentrated within the functions of the treasurer’s office. 5. To maximize the current market value (share price) of the equity of the firm (whether it’s publicly traded or not). 6. In the corporate form of ownership, the shareholders are the owners of the firm. The shareholders elect the directors of the corporation, who in turn appoint the firm’s management. This
Transcript
CHAPTER 1INTRODUCTION TO CORPORATE FINANCEAnswers to Concepts Review and Critical Thinking Questions
1. Capital budgeting (deciding on whether to expand a manufacturing plant), capital structure (deciding whether to issue new equity and use the proceeds to retire outstanding debt), and working capital management (modifying the firm’s credit collection policy with its customers).
2. Disadvantages: unlimited liability, limited life, difficulty in transferring ownership, hard to raise capital funds. Some advantages: simpler, less regulation, the owners are also the managers, sometimes personal tax rates are better than corporate tax rates.
3. The primary disadvantage of the corporate form is the double taxation to shareholders of distributed earnings and dividends. Some advantages include: limited liability, ease of transferability, ability to raise capital, and unlimited life.
4. The treasurer’s office and the controller’s office are the two primary organizational groups that report directly to the chief financial officer. The controller’s office handles cost and financial accounting, tax management, and management information systems. The treasurer’s office is responsible for cash and credit management, capital budgeting, and financial planning. Therefore, the study of corporate finance is concentrated within the functions of the treasurer’s office.
5. To maximize the current market value (share price) of the equity of the firm (whether it’s publicly traded or not).
6. In the corporate form of ownership, the shareholders are the owners of the firm. The shareholders elect the directors of the corporation, who in turn appoint the firm’s management. This separation of ownership from control in the corporate form of organization is what causes agency problems to exist. Management may act in its own or someone else’s best interests, rather than those of the shareholders. If such events occur, they may contradict the goal of maximizing the share price of the equity of the firm.
7. A primary market transaction.
8. In auction markets like the NYSE, brokers and agents meet at a physical location (the exchange) to buy and sell their assets. Dealer markets like Nasdaq represent dealers operating in dispersed locales who buy and sell assets themselves, usually communicating with other dealers electronically or literally over the counter.
9. Since such organizations frequently pursue social or political missions, many different goals are conceivable. One goal that is often cited is revenue minimization; i.e., providing their goods and services to society at the lowest possible cost. Another approach might be to observe that even a not-for-profit business has equity. Thus, an appropriate goal would be to maximize the value of the equity.
B-2 SOLUTIONS
10. An argument can be made either way. At the one extreme, we could argue that in a market economy, all of these things are priced. This implies an optimal level of ethical and/or illegal behavior and the framework of stock valuation explicitly includes these. At the other extreme, we could argue that these are non-economic phenomena and are best handled through the political process. The following is a classic (and highly relevant) thought question that illustrates this debate: “A firm has estimated that the cost of improving the safety of one of its products is $30 million. However, the firm believes that improving the safety of the product will only save $20 million in product liability claims. What should the firm do?”
11. The goal will be the same, but the best course of action toward that goal may require adjustments due different social, political, and economic climates.
12. The goal of management should be to maximize the share price for the current shareholders. If management believes that it can improve the profitability of the firm so that the share price will exceed $35, then they should fight the offer from the outside company. If management believes that this bidder or other unidentified bidders will actually pay more than $35 per share to acquire the company, then they should still fight the offer. However, if the current management cannot increase the value of the firm beyond the bid price, and no other higher bids come in, then management is not acting in the interests of the shareholders by fighting the offer. Since current managers often lose their jobs when the corporation is acquired, poorly monitored managers have an incentive to fight corporate takeovers in situations such as this.
13. We would expect agency problems to be less severe in other countries, primarily due to the relatively small percentage of individual ownership. Fewer individual owners should reduce the number of diverse opinions concerning corporate goals. The high percentage of institutional ownership might lead to a higher degree of agreement between owners and managers on decisions concerning risky projects. In addition, institutions may be better able to implement effective monitoring mechanisms on managers than can individual owners, given an institutions’ deeper resources and experiences with their own management. The increase in institutional ownership of stock in the United States and the growing activism of these large shareholder groups may lead to a reduction in agency problems for U.S. corporations and a more efficient market for corporate control.
14. How much is too much? Who is worth more, Michael Eisner or Tiger Woods? The simplest answer is that there is a market for executives just as there is for all types of labor. Executive compensation is the price that clears the market. The same is true for athletes and performers. Having said that, one aspect of executive compensation deserves comment. A primary reason executive compensation has grown so dramatically is that companies have increasingly moved to stock-based compensation. Such movement is obviously consistent with the attempt to better align stockholder and management interests. In recent years, stock prices have soared, so management has cleaned up. It is sometimes argued that much of this reward is simply due to rising stock prices in general, not managerial performance. Perhaps in the future, executive compensation will be designed to reward only differential performance, i.e., stock price increases in excess of general market increases.
CHAPTER 2FINANCIAL STATEMENTS, TAXES, AND CASH FLOWAnswers to Concepts Review and Critical Thinking Questions
1. Liquidity measures how quickly and easily an asset can be converted to cash without significant loss in value. It’s desirable for firms to have high liquidity so that they can more safely meet short-term creditor demands. However, since liquidity also has an opportunity cost associated with it—namely that higher returns can generally be found by investing the cash into productive assets—low liquidity levels are also desirable to the firm. It’s up to the firm’s financial management staff to find a reasonable compromise between these opposing needs.
2. The recognition and matching principles in financial accounting call for revenues, and the costs associated with producing those revenues, to be “booked” when the revenue process is essentially complete, not necessarily when the cash is collected or bills are paid. Note that this way is not necessarily correct; it’s the way accountants have chosen to do it.
3. Historical costs can be objectively and precisely measured whereas market values can be difficult to estimate, and different analysts would come up with different numbers. Thus, there is a tradeoff between relevance (market values) and objectivity (book values).
4. Depreciation is a non-cash deduction that reflects adjustments made in asset book values in accordance with the matching principle in financial accounting. Interest expense is a cash outlay, but it’s a financing cost, not an operating cost.
5. Market values can never be negative. Imagine a share of stock selling for –$20. This would mean that if you placed an order for 100 shares, you would get the stock along with a check for $2,000. How many shares do you want to buy? More generally, because of corporate and individual bankruptcy laws, net worth for a person or a corporation cannot be negative, implying that liabilities cannot exceed assets in market value.
6. For a successful company that is rapidly expanding, capital outlays would typically be large, possibly leading to negative cash flow from assets. In general, what matters is whether the money is spent wisely, not whether cash flow from assets is positive or negative.
7. It’s probably not a good sign for an established company, but it would be fairly ordinary for a start-up, so it depends.
8. For example, if a company were to become more efficient in inventory management, the amount of inventory needed would decline. The same might be true if it becomes better at collecting its receivables. In general, anything that leads to a decline in ending NWC relative to beginning NWC would have this effect. Negative net capital spending would mean more long-lived assets were liquidated than purchased.
B-4 SOLUTIONS
9. If a company raises more money from selling stock than it pays in dividends in a particular period, its cash flow to stockholders will be negative. If a company borrows more than it pays in interest, its cash flow to creditors will be negative.
10. The adjustments discussed were purely accounting changes; they had no cash flow or market value consequences unless the new accounting information caused stockholders to revalue the oil fields.
2. Income StatementSales $425,000Costs 210,000Depreciation 63,000EBIT $152,000Interest 38,000Taxable income $114,000Taxes 39,900Net income $ 74,100
3. Net income = Divs + Add. to ret. earnings; Add. to ret. earnings = $74,100 – 35,000 = $39,100
4. EPS = NI / shares = $74,100 / 30,000 = $2.47 per shareDPS = Divs / shares = $35,000 / 30,000 = $1.167 per share
5. NWC = CA – CL; CA = $600K + 750K = $1.35MBook value CA = $1.35M Market value CA = $1.25MBook value NFA = $2.10M Market value NFA = $4MBook value assets = $1.35 + 2.10 = $3.45M Market value assets = $1.25 + 4 = $5.25M
Total liabilities $1,706,000Tangible net fixed assets 4,400,000Intangible net fixed assets 798,000 Common stock ??Total assets $6,101,000 Accumulated ret. earnings 3,905,000
= $2.788Mb. Each firm has a marginal tax rate of 34% on the next $10,000 of taxable income, despite
their different average tax rates, so both firms will pay an additional $3,400 in taxes.
19. Income Statementa. Sales $2,400,000 b. OCF = EBIT + D – T
Cost of goods sold 1,440,000 = $120,000 + 480,000 – 0 = $600,000
Other expenses 360,000 c. Net income was negative because of theDepreciation 480,000 tax deductibility of depreciation and int-EBIT $120,000 erest expense. However, the actual cashInterest 180,000 flow from operations was positiveTaxable income ($60,000) because depreciation is a non-cashTaxes (35%) 0 expense and interest is a financing, not Net income ($60,000) an operating, expense.
20. A firm can still pay out dividends if net income is negative; it just has to be sure there is sufficient cash flow to make the dividend payments.
Change in NWC = Net cap. sp. = Net new equity = 0. (Assumed)Cash flow from assets = OCF – Change in NWC – Net cap. sp. = $600K – 0 – 0 = $600KCash flow to stockholders = Dividends – Net new equity = $480K – 0 = $480KCash flow to creditors = Cash flow from assets – Cash flow to stockholders = $600K – 480K =
$120KCash flow to creditors = Interest – Net new LTD;Net new LTD = Interest – Cash flow to creditors = $180K – 120K = $60K
CHAPTER 2 B-7
21. a. Income StatementSales $10,980 b. OCF = EBIT + Dep. – Taxes Cost of goods sold 8,100 = $1,440 + 1,440 – 441 = $2,439Depreciation 1,440 c. Change in NWC = NWCend – NWCbeg
CFA = OCF – Change in NWC – Net cap. sp.= $2,439 – 720 – 1,800 = –$81
The cash flow from assets can be positive or negative, since it represents whether the firm raised funds or distributed funds on a net basis. In this problem, even though net income and OCF are positive, the firm invested heavily in both fixed assets and net working capital; it had to raise a net $81 in funds from its stockholders and creditors to make these investments.
d. Cash flow to creditors = Interest – Net new LTD = $180 – 0 = $180Cash flow to stockholders = Cash flow from assets – Cash flow to creditors
= –$81 – 180 = –$261 = Dividends – Net new equity; Net new equity = $270 + 261 = $531The firm had positive earnings in an accounting sense (NI > 0) and had positive cash flow from operations. The firm invested $720 in new net working capital and $1,800 in new fixed assets. The firm had to raise $81 from its stakeholders to support this new investment. It accomplished this by raising $531 in the form of new equity. After paying out $270 of this in the form of dividends to shareholders and $180 in the form of interest to creditors, $81 was left to just meet the firm’s cash flow needs for investment.
Cash flow to creditors = Interest – Net new LTD = $324 – 600 = –$276Net new borrowing = $600 = Debt issued – Debt retired; Debt retired = $900 – 600 = $300
CHAPTER 3WORKING WITH FINANCIAL STATEMENTSAnswers to Concepts Review and Critical Thinking Questions
1. a. If inventory is purchased with cash, then there is no change in the current ratio. If inventory is purchased on credit, then there is a decrease in the current ratio if it was initially greater than 1.0.
b. Reducing accounts payable with cash increases the current ratio if it was initially greater than 1.0.
c. Reducing short-term debt with cash increases the current ratio if it was initially greater than 1.0.d. As long-term debt approaches maturity, the principal repayment and the remaining interest
expense become current liabilities. Thus, if debt is paid off with cash, the current ratio increases if it was initially greater than 1.0. If the debt has not yet become a current liability, then paying it off will reduce the current ratio since current liabilities are not affected.
e. Reduction of accounts receivables and an increase in cash leaves the current ratio unchanged.f. Inventory sold at cost reduces inventory and raises cash, so the current ratio is unchanged.g. Inventory sold for a profit raises cash in excess of the inventory recorded at cost, so the current
ratio increases.
2. The firm has increased inventory relative to other current assets; therefore, assuming current liability levels remain mostly unchanged, liquidity has potentially decreased.
3. A current ratio of 0.50 means that the firm has twice as much in current liabilities as it does in current assets; the firm potentially has poor liquidity. If pressed by its short-term creditors and suppliers for immediate payment, the firm might have a difficult time meeting its obligations. A current ratio of 1.50 means the firm has 50% more current assets than it does current liabilities. This probably represents an improvement in liquidity; short-term obligations can generally be met com-pletely with a safety factor built in. A current ratio of 15.0, however, might be excessive. Any excess funds sitting in current assets generally earn little or no return. These excess funds might be put to better use by investing in productive long-term assets or distributing the funds to shareholders.
4. a. Quick ratio provides a measure of the short-term liquidity of the firm, after removing the effects of inventory, generally the least liquid of the firm’s current assets.
b. Cash ratio represents the ability of the firm to completely pay off its current liabilities balance with its most liquid asset (cash).
c. The capital intensity ratio tells us the dollar amount investment in assets needed to generate one dollar in sales.
d. Total asset turnover measures how much in sales is generated by each dollar of firm assets.e. Equity multiplier represents the degree of leverage for an equity investor of the firm; it measures
the dollar worth of firm assets each equity dollar has a claim to.f. Long-term debt ratio measures the percentage of total firm capitalization funded by long-term
debt.g. Times interest earned ratio provides a relative measure of how well the firm’s operating earnings
can cover current interest obligations.
CHAPTER 3 B-9
h. Profit margin is the accounting measure of bottom-line profit per dollar of sales.i. Return on assets is a measure of bottom-line profit per dollar of total assets.j. Return on equity is a measure of bottom-line profit per dollar of equity.k. Price-earnings ratio reflects how much value per share the market places on a dollar of
accounting earnings for a firm.
5. Common size financial statements express all balance sheet accounts as a percentage of total assets and all income statement accounts as a percentage of total sales. Using these percentage values rather than nominal dollar values facilitates comparisons between firms of different size or business type.
6. Peer group analysis involves comparing the financial ratios and operating performance of a particular firm to a set of peer group firms in the same industry or line of business. Comparing a firm to its peers allows the financial manager to evaluate whether some aspects of the firm’s operations, finances, or investment activities are out of line with the norm, thereby providing some guidance on appropriate actions to take to adjust these ratios if appropriate. An aspirant group would be a set of firms whose performance the company in question would like to emulate. The financial manager often uses the financial ratios of aspirant groups as the target ratios for his or her firm; some managers are evaluated by how well they match the performance of an identified aspirant group.
7. Return on equity is probably the most important accounting ratio that measures the bottom-line performance of the firm with respect to the equity shareholders. The Du Pont identity emphasizes the role of a firm’s profitability, asset utilization efficiency, and financial leverage in achieving a ROE figure. For example, a firm with ROE of 20% would seem to be doing well, but this figure may be misleading if it were a marginally profitable (low profit margin) and highly levered (high equity multiplier). If the firm’s margins were to erode slightly, the ROE would be heavily impacted.
8. The book-to-bill ratio is intended to measure whether demand is growing or falling. It is closely followed because it is a barometer for the entire high-tech industry where levels of revenues and earnings have been relatively volatile.
9. If a company is growing by opening new stores, then presumably total revenues would be rising. Comparing total sales at two different points in time might misleading. Same-store sales control for this by only looking at revenues of stores open within a specific period.
10. a. For an electric utility such as Con Ed, expressing costs on a per kilowatt hour basis would be a way comparing costs with other utilities of different sizes.
b. For a retailer such as Sears, expressing sales on a per square foot basis would be useful in comparing revenue production against other retailers.
c. For an airline such as Delta, expressing costs on a per passenger mile basis allows for comparisons with other airlines by examining how much it costs to fly one passenger one mile.
d. For an on-line service such as AOL, using a per call basis for costs would allow for comparisons with smaller services. A per subscriber basis would also make sense.
e. For a hospital such as Holy Cross, revenues and costs expressed on a per bed basis would be useful.
f. For a college textbook publisher such as McGraw-Hill/Irwin, the leading publisher of finance textbooks for the college market, the obvious standardization would be per book sold.
B-10 SOLUTIONS
Solutions to Questions and Problems
Basic
1. NWC = $900 = CA – CL; CA = $900 + 4,320 = $5,220Current ratio = CA / CL = $5,220 / $4,320 = 1.21 timesQuick ratio = (CA – Inventory) / CL = ($5,220 – 1,900) / $4,320 = 0.77 times
2. Profit margin = Net income / Sales; Net income = ($41M)(0.12) = $4.92 millionROA = Net income / TA = $4.92M / $32M = 15.38%ROE = Net income / TE = Net income / (TA – TD) = $4.92M / ($32M – 11M) = 23.43%
3. Receivables turnover = Sales / Receivables = $2,131,516 / $308,165 = 6.92 timesDays’ sales in receivables = 365 days / Receivables turnover = 365 / 6.92 = 52.77 daysThe average collection period for an outstanding accounts receivable balance was 52.77 days.
4. Inventory turnover = COGS / Inventory = $1,843,127 / $921,386 = 2.00 timesDays’ sales in inventory = 365 days / Inventory turnover = 365 / 2.00 = 182.46 daysOn average, a unit of inventory sat on the shelf 182.46 days before it was sold.
5. Total debt ratio = 0.45 = TD / TA = TD / (TD + TE); 0.55(TD) = 0.45(TE)Debt-equity ratio = TD / TE = 0.45 / 0.55 = 0.82 Equity multiplier = 1 + D/E = 1.82
6. NI = Addition to retained earnings + Dividends = $300K + 220K = $520KEPS = NI / Shares = $520K / 300K = $1.73 per shareDPS = Dividends / Shares = $220K / 300K = $0.73 per shareBVPS = TE / Shares = $5M / 300K = $16.67 per shareMarket-to-book ratio = Share price / BVPS = $25 / $16.67 = 1.50 timesP/E ratio = Share price / EPS = $25 / $1.73 = 14.42 times
8. ROE = .1720 = (.12)(1.35)(EM); EM = 1.062; D/E = EM – 1 = 0.062
9. Payables turnover = COGS / Payables = $18,364 / $3,105 = 5.91 timesDays’ sales in payables = 365 days / Payables turnover = 365 / 5.91 = 61.71 daysThe company left its bills to suppliers outstanding for 61.71 days on average. A large value for this ratio could imply that either (1) the company is having liquidity problems, making it difficult to pay off its short-term obligations, or (2) that the company has successfully negotiated lenient credit terms from its suppliers.
10. EM = 1 + D/E = 1.80ROE = (ROA)(EM) = .084(1.80) = 15.12%ROE = NI / TE; NI = (.1512)($430,000) = $65,016
CHAPTER 3 B-11
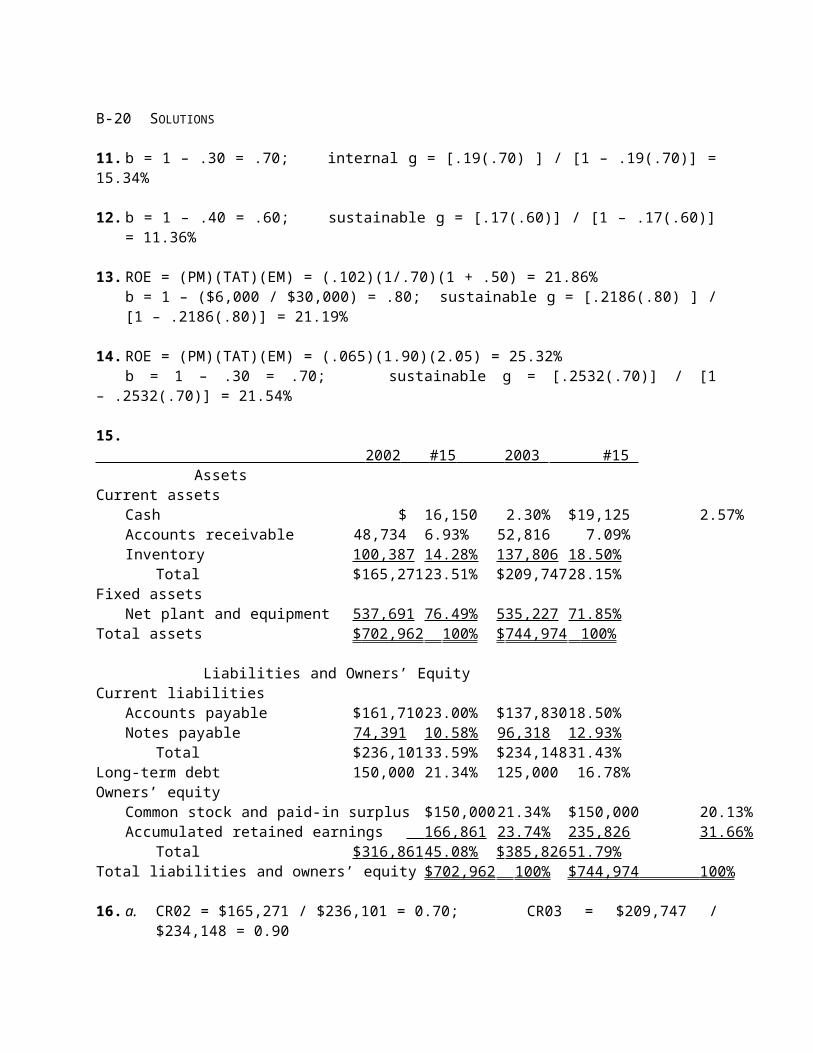
11. b = 1 – .30 = .70; internal g = [.19(.70) ] / [1 – .19(.70)] = 15.34%
12. b = 1 – .40 = .60; sustainable g = [.17(.60)] / [1 – .17(.60)] = 11.36%
19. PM = NI / sales; NI = (.13)($22,000,000) = $2,860,000ROA = NI / TA = $2,860,000 / $22,500,000 = 12.71%
20. ROA = NI / TA = $11,071 / $68,000 = .1628b = 1 – .40 = .60internal g = [(.1628)(.60)] / [1 – (.1628)(.60)] = 10.83%
21. ROE = NI / E = $11,071 / $23,000 = .4814b = 1 – .40 = .60 sustainable g = [(.4814)(.60)] / [1 – (.4814)(.60)] = 40.61%
22. TAT = Sales / TA = $15M / $8M = 1.875 timesSales = TA TAT = $8M 2.25 = $18M
23. Debt ratio = (TA – E) / TA = .70 = $140,000 / TA; TA = $200,000Equity = $200,000 – 140,000 = $60,000ROE = NI / Equity = $14,000 / 60,000 = .2333
24. EPS = NI / Shares = $6,100,000 / 3,400,000 = $1.79PE = Price / EPS = $70 / $1.79 = 39.02Book value per share = Book value of equity / Shares = $31M / 3.4M = $9.12 per shareMarket-to-book = Market value per share / Book value per share = $70 / $9.12 = 7.68
25. TAT = Sales / TA = 2.9 = Sales / $8M; Sales = $23.2MROA = NI / TA = .11 = NI / $8M; NI = $880,000PM = NI / Sales = $880,000 / $23.2M = 3.79%
27. CR = 1.20 = CA / CL; CA = 1.20($750) = $900.00PM = .09 = NI / sales; NI = .09($3,920) = $352.80ROE = .185 = NI / TE; TE = $352.80 / .185 = $1,907.03Long-term debt ratio = 0.65 = LTD / ( LTD + TE ) 1 + TE / LTD = 1.538; LTD = $1,907.03 / .538 = $3,541.62TD = CL + LTD = $750 + $3,541.62 = $4,291.62TA = TD + TE = $4,291.62 + $1,907.03 = $6,198.65NFA = TA – CA = $6,198.65 – 900.00 = $5,298.65
CHAPTER 3 B-13
28. Child: profit = $0.50 / $25 = 2%; store: profit margin = NI / S = $4.5 / $450M = 1%The advertisement is referring to the store’s profit margin, but a more appropriate earnings measure for the firm’s owners is the return on equity.ROE = NI / TE = NI / (TA – TD) = $4.5M / ($105.0M – 67.5M) = 12.00%
29. Days’ sales in receivables = 21.50 days = 365 days / Receivables turnoverReceivables turnover = Sales / Days’ sales in receivablesSales = ($138,600)(365) / 21.50 = $2,352,976.74PM = NI / S = $141,200 / $2,352,976.74 = 6.00%TAT = S / TA = $2,352,976.74 / $960,000 = 2.45 timesEM = 1 + D/E = 2.15ROE = (PM)(TAT)(EM) = (.0600)(2.45)(2.15) = 31.62%
30. Net income = (1 – t)EBT; EBT = $6,820 / 0.66 = $10,333.33EBIT = EBT + Interest paid = $10,333.33 + 1,931 = $12,264.33Cash coverage ratio = (EBIT + Depreciation expense) / InterestCash coverage ratio = ($12,264.33 + 1,380 ) / $1,931 = 7.07 times
32. Total debt ratio = TD / TA = .40 = $300K / TA; TA = $300K / .40 = $750KTA = TD + E = $750K = $300K + E; E = $450KROE = NI / E = .15 = NI / $450K; NI = (.15)($450K) = $67,500ROA = NI / TA = $67,500 / $750K = 9.00%
33. PM = NI / S = – £10,386 / £161,583 = – 6.43%As long as both net income and sales are measured in the same currency, there is no problem; in fact, except for some market value ratios like EPS and BVPS, none of the financial ratios discussed in the text are measured in terms of currency. This is one reason why financial ratio analysis is widely used in international finance to compare the business operations of firms and/or divisions across national economic borders.NI = – 0.0643($362,814) = – $23,320.44
36. EPS = $10,395 / 10,000 shares = $1.0395 per shareP/E ratio = $24 / $1.0395 = 23.09 timesDPS = $8,200 / 10,000 shares = $0.82 per shareBVPS = $22,948 / 10,000 shares = $2.2948 per shareMarket-to-book ratio = $24.00 / $2.2948 = 10.46 times
37. The current ratio appears to be relatively high when compared to the median, however it is below the upper quartile, meaning that at least 25 percent of firms in the industry have a higher current ratio. Overall, it does not appear that the current ratio is out of line with the industry. The total asset turnover is low when compared to the industry. In fact, the total asset turnover is in the lower quartile. This means that the company does not use assets as efficiently overall or that the company has newer assets than the industry. This would mean that the assets have not been depreciated, which would mean a higher book value and a lower total asset turnover. The debt-equity ratio is in line with the industry, between the mean and the upper quartile. The profit margin is approximately three times as large as the industry median and over twice as large as the upper quartile, which is exceptional. The company may be better at controlling costs, or has a better product which enables them to charge a premium price.
42. b = 1 – ($2,100 / $7,000) = .30; ROE = NI / TE = $7,000 / $24,000 = 29.17%sustainable g = [.70(.2917)] / [1 – .70(.2917)] = 25.65%new TA = 1.2565($75,000) = $94,240.84new TD = [D / (D + E)](TA) = (51/75)($94,240.84) = $64,083.77additional borrowing = $64,083.77 – $51,000 = $13,083.77ROA = NI / TA = $7,000 / $75,000 = .0933; internal g = [.0933(.70)] / [1 – .0933(.70)] = 6.99%
43. ROE = (PM)(TAT)(EM) = (.08)(0.95)(1 + 0.3) = 9.88%sustainable g = .13 = [.0988(b)] / [1 – .0988(b)]; b = 1.16; payout ratio = 1 – b = – .16
This is a negative dividend payout ratio of 116%, which is impossible; the growth rate is not consistent with the other constraints. The lowest possible payout rate is 0, which corresponds to b = 1, or total earnings retention.
max sustainable g = .0988 / (1 – .0988) = 10.96%
CHAPTER 4INTRODUCTION TO VALUATION: THE TIME VALUE OF MONEYAnswers to Concepts Review and Critical Thinking Questions
1. The four parts are the present value (PV), the future value (FV), the discount rate (r), and the life of the investment (t).
2. Compounding refers to the growth of a dollar amount through time via reinvestment of interest earned. It is also the process of determining the future value of an investment. Discounting is the process of determining the value today of an amount to be received in the future.
3. Future values grow (assuming a positive rate of return); present values shrink.
4. The future value rises (assuming a positive rate of return); the present value falls.
5. It would appear to be both deceptive and unethical to run such an ad without a disclaimer or explanation.
6. It’s a reflection of the time value of money. GMAC gets to use the $500 immediately. If GMAC uses it wisely, it will be worth more than $10,000 in thirty years.
7. Oddly enough, it actually makes it more desirable since GMAC only has the right to pay the full $10,000 before it is due. This is an example of a “call” feature. Such features are discussed in a later chapter.
8. The key considerations would be: (1) Is the rate of return implicit in the offer attractive relative to other, similar risk investments? and (2) How risky is the investment; i.e., how certain are we that we will actually get the $10,000? Thus, our answer does depend on who is making the promise to repay.
9. The Treasury security would have a somewhat higher price because the Treasury is the strongest of all borrowers, therefore has a lower rate of return.
10. The price would be higher because, as time passes, the price of the security will tend to rise toward $10,000. This rise is just a reflection of the time value of money. As time passes, the time until receipt of the $10,000 grows shorter, and the present value rises. In 2006, the price will probably be higher for the same reason. We cannot be sure, however, because interest rates could be much higher, or GMAC’s financial position could deteriorate. Either event would tend to depress the security’s price.
CHAPTER 5DISCOUNTED CASH FLOW VALUATIONAnswers to Concepts Review and Critical Thinking Questions
1. The four pieces are the present value (PV), the periodic cash flow (C), the discount rate (r), and the number of payments, or the life of the annuity, t.
2. Assuming positive cash flows and a positive interest rate, both the present and the future value will rise.
3. Assuming positive cash flows and a positive interest rate, the present value will fall, and the future value will rise.
4. It’s deceptive, but very common. The deception is particularly irritating given that such lotteries are usually government sponsored!
5. If the total money is fixed, you want as much as possible as soon as possible. The team (or, more accurately, the team owner) wants just the opposite.
6. The better deal is the one with equal instalments.
7. Yes, they should. APRs generally don’t provide the relevant rate. The only advantage is that they are easier to compute, but, with modern computing equipment, that advantage is not very important.
8. A freshman does. The reason is that the freshman gets to use the money for much longer before interest starts to accrue.
9. The subsidy is the present value (on the day the loan is made) of the interest that would have accrued up until the time it actually begins to accrue.
10. The problem is that the subsidy makes it easier to repay the loan, not obtain it. However, ability to repay the loan depends on future employment, not current need. For example, consider a student who is currently needy, but is preparing for a career in a high-paying area (such as corporate finance!). Should this student receive the subsidy? How about a student who is currently not needy, but is preparing for a relatively low-paying job (such as becoming a college professor)?
15. EAR = .16 = [1 + (APR / 365)]365 – 1; APR = 365[(1.16)1/365 – 1] = 14.85%The borrower is actually paying annualized interest of 16% per year, not the 14.85% reported on the loan contract.
16. FV = $1,420[1 + (.10 / 2)]24 = $4,579.64
B-26 SOLUTIONS
17. FV in 5 years = $5,000[1 + (.026/365)]5(365) = $5,694.12FV in 10 years = $5,000[1 + (.026/365)]10(365) = $6,484.59FV in 20 years = $5,000[1 + (.026/365)]20(365) = $8,409.98
38. PVA falls as r increases, and PVA rises as r decreasesFVA rises as r increases, and FVA falls as r decreasesPVA@10% = $4,000{[1 – (1/1.10)10] / .10 } = $24,578.27PVA@5% = $4,000{[1 – (1/1.05)10] / .05 } = $30,886.94PVA@15% = $4,000{[1 – (1/1.15)10] / .15 } = $20,075.07
The PV of Shaq’s contract reveals that Robinson did achieve his goal of being paid more than any other rookie in NBA history. The different contract lengths are an important factor when comparing the present value of the contracts. A better method of comparison would be to express the cost of hiring each player on an annual basis. This type of problem will be investigated in a later chapter.
43. PVA = 0.80($1,450,000) = $9,800 [ {1 – [1 / (1 + r)]360}/ r ];solving on a financial calculator, or by trial and error, gives r = 0.7962% per monthAPR = 12(0.7962%) = 9.55%; EAR = (1.007962)12 – 1 = 9.98%
44. PV = $10,000 / 1.123 = $71,178.02; the firm will make a profitprofit = $71,178.02 – 67,000.00 = $4,178.02$67,000 = $100,000 / ( 1 + r)3; r = (100 / 67)1/3 – 1 = 14.28%
45. $12,000 = $10,800(1 + r); r = 11.11%Because of the discount, you only get the use of $10,800, and the interest you pay on that amount is 11.11%, not 10%.
Solve for $54,648.18Value at t = 5: $40,148.20 + 54,648.18 + 75,000 = $169,796.38
Value at t = 10:
Enter 5 10.2% –$169,796.38N I/Y PV PMT FV
Solve for $275,953.81
CHAPTER 6INTEREST RATES AND BOND VALUATIONAnswers to Concepts Review and Critical Thinking Questions
1. No. As interest rates fluctuate, the value of a Treasury security will fluctuate. Long-term Treasury securities have substantial interest rate risk.
2. All else the same, the Treasury security will have lower coupons because of its lower default risk, so it will have greater interest rate risk.
3. No. If the bid were higher than the ask, the implication would be that a dealer was willing to sell a bond and immediately buy it back at a higher price. How many such transactions would you like to do?
4. Prices and yields move in opposite directions. Since the bid price must be lower, the bid yield must be higher.
5. There are two benefits. First, the company can take advantage of interest rate declines by calling in an issue and replacing it with a lower coupon issue. Second, a company might wish to eliminate a covenant for some reason. Calling the issue does this. The cost to the company is a higher coupon. A put provision is desirable from an investor’s standpoint, so it helps the company by reducing the coupon rate on the bond. The cost to the company is that it may have to buy back the bond at an unattractive price.
6. Bond issuers look at outstanding bonds of similar maturity and risk. The yields on such bonds are used to establish the coupon rate necessary for a particular issue to initially sell for par value. Bond issuers also simply ask potential purchasers what coupon rate would be necessary to attract them. The coupon rate is fixed and simply determines what the bond’s coupon payments will be. The required return is what investors actually demand on the issue, and it will fluctuate through time. The coupon rate and required return are equal only if the bond sells for exactly par.
7. Yes. Some investors have obligations that are denominated in dollars; i.e., they are nominal. Their primary concern is that an investment provide the needed nominal dollar amounts. Pension funds, for example, often must plan for pension payments many years in the future. If those payments are fixed in dollar terms, then it is the nominal return on an investment that is important.
8. Companies pay to have their bonds rated simply because unrated bonds can be difficult to sell; many large investors are prohibited from investing in unrated issues.
9. Treasury bonds have no credit risk, so a rating is not necessary. Junk bonds often are not rated because there would no point in an issuer paying a rating agency to assign its bonds a low rating (it’s like paying someone to kick you!).
B-42 SOLUTIONS
10. The term structure is based on pure discount bonds. The yield curve is based on coupon-bearing issues.
11. Bond ratings have a subjective factor to them. Split ratings reflect a difference of opinion among credit agencies.
12. As a general constitutional principle, the federal government cannot tax the states without their consent if doing so would interfere with state government functions. At one time, this principle was thought to provide for the tax-exempt status of municipal interest payments. However, modern court rulings make it clear that Congress can revoke the municipal exemption, so the only basis now appears to be historical precedent. The fact that the states and the federal government do not tax each other’s securities is referred to as “reciprocal immunity.”
13. Lack of transparency means that a buyer or seller can’t see recent transactions, so it is much harder to determine what the best bid and ask prices are at any point in time.
14. One measure of liquidity is the bid-ask spread. Liquid instruments have relatively small spreads. Looking at Figure 6.4, the bellwether bond has a spread of one tick; it is one of the most liquid of all investments. Generally, liquidity declines after a bond is issued. Some older bonds, including some of the callable issues, have spreads as wide as six ticks.
15. Companies charge that bond rating agencies are pressuring them to pay for bond ratings. When a company pays for a rating, it has the opportunity to make its case for a particular rating. With an unsolicited rating, the company has no input.
16. A 100-year bond looks like a share of preferred stock. In particular, it is a loan with a life that almost certainly exceeds the life of the lender, assuming that the lender is an individual. With a junk bond, the credit risk can be so high that the borrower is almost certain to default, meaning that the creditors are very likely to end up as part owners of the business. In both cases, the “equity in disguise” has a significant tax advantage.
Solutions to Questions and Problems
Basic
1. The yield to maturity is the required rate of return on a bond expressed as a nominal annual interest rate. For noncallable bonds, the yield to maturity and required rate of return are interchangeable terms. Unlike YTM and required return, the coupon rate is not a return used as the interest rate in bond cash flow valuation, but is a fixed percentage of par over the life of the bond used to set the coupon payment amount. For the example given, the coupon rate on the bond is still 10 percent, and the YTM is 8 percent.
2. Price and yield move in opposite directions; if interest rates rise, the price of the bond will fall. This is because the fixed coupon payments determined by the fixed coupon rate are not as valuable when interest rates rise—hence, the price of the bond decreases.
3. P = $90(PVIFA8%,12) + $1000(PVIF8%,12) = $1,075.36
13. This is a note. Coupon rate = 3.50%. Bid price = 96:08 = 96.25% $1,000 = $962.50Previous day’s asked price = today’s asked price – change = 96 09/32 – 08/32 = 96 01/32 or 96:01
= 96.03125%$1,000 = $960.3125
14. This is a premium bond because it sells for more than 100% of face value.Current yield = $61.25/$1,032.1875 = 5.93%; YTM = 5.88%Bid-Ask spread = 103:08 – 103:07 = 1/32
All else held equal, the premium over par value for a premium bond declines as maturity appro-aches, and the discount from par value for a discount bond declines as maturity approaches. In both cases, the largest percentage price changes occur at the shortest maturity lengths.
16. If both bonds sell at par, the initial YTM on both bonds is the coupon rate, 8 percent. If the YTM suddenly rises to 10 percent:
All else the same, the longer the maturity of a bond, the greater is its price sensitivity to changes in interest rates.
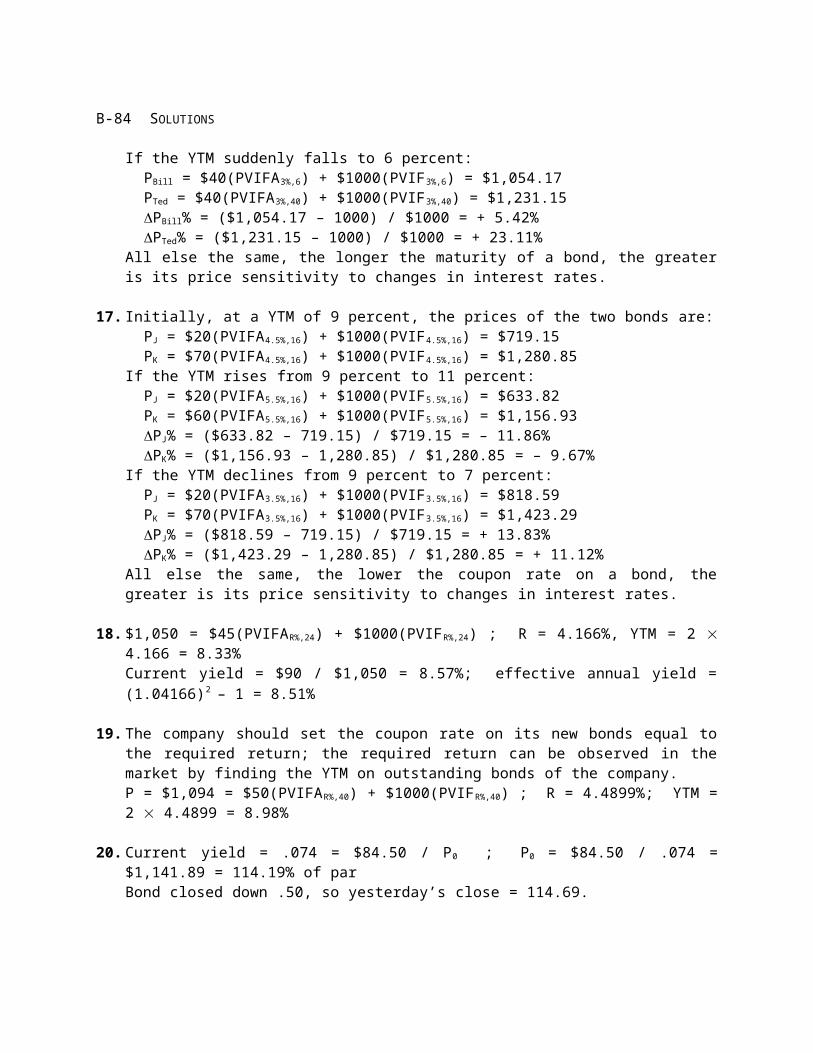
17. Initially, at a YTM of 9 percent, the prices of the two bonds are:PJ = $20(PVIFA4.5%,16) + $1000(PVIF4.5%,16) = $719.15PK = $70(PVIFA4.5%,16) + $1000(PVIF4.5%,16) = $1,280.85
If the YTM rises from 9 percent to 11 percent:PJ = $20(PVIFA5.5%,16) + $1000(PVIF5.5%,16) = $633.82PK = $60(PVIFA5.5%,16) + $1000(PVIF5.5%,16) = $1,156.93PJ% = ($633.82 – 719.15) / $719.15 = – 11.86%PK% = ($1,156.93 – 1,280.85) / $1,280.85 = – 9.67%
If the YTM declines from 9 percent to 7 percent:PJ = $20(PVIFA3.5%,16) + $1000(PVIF3.5%,16) = $818.59PK = $70(PVIFA3.5%,16) + $1000(PVIF3.5%,16) = $1,423.29PJ% = ($818.59 – 719.15) / $719.15 = + 13.83%PK% = ($1,423.29 – 1,280.85) / $1,280.85 = + 11.12%
All else the same, the lower the coupon rate on a bond, the greater is its price sensitivity to changes in interest rates.
19. The company should set the coupon rate on its new bonds equal to the required return; the required return can be observed in the market by finding the YTM on outstanding bonds of the company.P = $1,094 = $50(PVIFAR%,40) + $1000(PVIFR%,40) ; R = 4.4899%; YTM = 2 4.4899 = 8.98%
20. Current yield = .074 = $84.50 / P0 ; P0 = $84.50 / .074 = $1,141.89 = 114.19% of parBond closed down .50, so yesterday’s close = 114.69.
21. a. The bond price is the present value term when valuing the cash flows from a bond; YTM is the interest rate used in discounting the future cash flows (coupon payments and principal) back to their present values.
b. If the coupon rate is higher than the required return on a bond, the bond will sell at a premium, since it provides periodic income in the form of coupon payments in excess of that required by investors on other similar bonds. If the coupon rate is lower than the required return on a bond, the bond will sell at a discount, since it provides insufficient coupon payments compared to that required by investors on other similar bonds. For premium bonds, the coupon rate exceeds the YTM; for discount bonds, the YTM exceeds the coupon rate, and for bonds selling at par, the YTM is equal to the coupon rate.
CHAPTER 6 B-45
c. Current yield is defined as the annual coupon payment divided by the current bond price. For premium bonds, the current yield exceeds the YTM, for discount bonds the current yield is less than the YTM, and for bonds selling at par value, the current yield is equal to the YTM. In all cases, the current yield plus the expected one-period capital gains yield of the bond must be equal to the required return.
Annual interest deduction = $924.63 / 30 = $30.82d. The company will prefer straight-line methods when allowed because the valuable interest
deductions occur earlier in the life of the bond.
23. a. The coupon bonds have a 9% coupon which matches the 9% required return, so they will sell at par; # of bonds = $15M / $1,000 = 15,000.For the zeroes, P0 = $1,000 / 1.0820 = $214.55; $15M / $214.55 = 69,914 bonds will be issued.
c. Coupon bonds: (15,000)($80)(1–.35) = $780,000 cash outflowZeroes: P1 = $1,000 / 1.0819 = $231.71year 1 interest deduction = $231.71 – 214.55 = $17.16(69,914)($17.16)(.35) = $419,903.48 cash inflowDuring the life of the bond, the zero generates cash inflows to the firm in the form of the interest tax shield of debt.
24. The maturity is indeterminate; a bond selling at par can have any length of maturity.
19. The company should set the coupon rate on its new bonds equal to the required return; the required return can be observed in the market by finding the YTM on outstanding bonds of the company.
Enter 20 2 –$1,094 $100 / 2 $1,000N I/Y PV PMT FV
Solve for 4.4899%YTM = 2 4.4899 = 8.98%
22. a.Enter 30 9% $1,000
N I/Y PV PMT FVSolve for –$75.37
b.Enter 29 9% $1,000
N I/Y PV PMT FVSolve for –$82.15
year 1 interest deduction = $82.15 – 75.37 = $6.78
c. Total interest = $1,000 – 75.37 = $924.63Annual interest deduction = $924.63 / 30 = $30.82
d. The company will prefer straight-line methods when allowed because the valuable interest deductions occur earlier in the life of the bond.
23. a. The coupon bonds have a 9% coupon which matches the 9% required return, so they will sell at par; # of bonds = $15M / $1,000 = 15,000.For the zeroes, P0 =
Enter 20 8% $1,000N I/Y PV PMT FV
Solve for –$214.55$15M / $214.55 = 69,914 bonds will be issued.
Solve for –$231.71year 1 interest deduction = $231.71 – 214.55 = $17.16(69,914)($17.16)(.35) = $419,903.48 cash inflowDuring the life of the bond, the zero generates cash inflows to the firm in the form of the interest tax shield of debt.
25.Enter 16 2 –$1,274.69 $98.75 / 2 $1,000
N I/Y PV PMT FVSolve for 3.497%
YTM = 2 3.497 = 6.99%
26.Enter 27 2 7.10% / 2 $52.50 / 2 $1,000
N I/Y PV PMT FVSolve for –$779.05
Bid price = $779.05 – 2(.0625)(10) = $778.42
CHAPTER 6 B-51
27.Enter 3 2 6.62% / 2 –$1,099.38 $1,000
N I/Y PV PMT FVSolve for $51.63
coupon rate = 10.33%
28.Enter 35 2 –$590 $60 / 2 $1,000
N I/Y PV PMT FVSolve for 5.19%
YTM = 2 5.19 = 10.38%
29.Enter 3 2 10.08% / 2 $115 / 2 $1,000
N I/Y PV PMT FVSolve for –$1,035.99
Current yield = $115 / $1,035.99 = 11.10%
30.Enter 6 2 10.74% / 2 –$906.30 $1,000
N I/Y PV PMT FVSolve for $42.90
coupon rate = 8.58%
CHAPTER 7EQUITY MARKETS AND STOCK VALUATIONAnswers to Concepts Review and Critical Thinking Questions
1. The value of any investment depends on its cash flows; i.e., what investors will actually receive. The cash flows from a share of stock are the dividends.
2. Investors believe the company will eventually start paying dividends (or be sold to another company).
3. In general, companies that need the cash will often forgo dividends since dividends are a cash expense. Young, growing companies with profitable investment opportunities are one example; another example is a company in financial distress. This question is examined in depth in a later chapter.
4. The general method for valuing a share of stock is to find the present value of all expected future dividends. The dividend growth model presented in the text is only valid (i) if dividends are expected to occur forever, that is, the stock provides dividends in perpetuity, and (ii) if a constant growth rate of dividends occurs forever. A violation of the first assumption might be a company that is expected to cease operations and dissolve itself some finite number of years from now. The stock of such a company would be valued by the methods of this chapter by applying the general method of valuation. A violation of the second assumption might be a start-up firm that isn’t currently paying any dividends, but is expected to eventually start making dividend payments some number of years from now. This stock would also be valued by the general dividend valuation method of this chapter.
5. The common stock probably has a higher price because the dividend can grow whereas it is fixed on the preferred. However, the preferred is less risky because of the dividend and liquidation preference, so it is possible the preferred could be worth more, depending on the circumstances.
6. The two components are the dividend yield and the capital gains yield. For most companies, the capital gains yield is larger. This is easy to see for companies that pay no dividends. For companies that do pay dividends, the dividend yields are rarely over five percent and are often much less.
7. Yes. If the dividend grows at a steady rate, so does the stock price. In other words, the dividend growth rate and the capital gains yield are the same.
8. In a corporate election, you can buy votes (by buying shares), so money can be used to influence or even determine the outcome. Many would argue the same is true in political elections, but, in principle at least, no one has more than one vote.
9. It wouldn’t seem to be. Investors who don’t like the voting features of a particular class of stock are under no obligation to buy it.
CHAPTER 7 B-53
10. Investors buy such stock because they want it, recognizing that the shares have no voting power. Presumably, investors pay a little less for such shares than they would otherwise.
11. Presumably, the current stock value reflects the risk, timing, and magnitude of all future cash flows, both short-term and long-term. If this is correct, then the statement is false.
12. 15% return: P0 = $4.00 / (.15 – .05) = $40.0010% return: P0 = $4.00 / (.10 – .05) = $80.00All else held constant, a higher required return means that the stock will sell for a lower price.
In all cases, the required return is 20%, but this return is distributed differently between current income and capital gains. High growth stocks have an appreciable capital gains component but a relatively small current income yield; conversely, mature, negative-growth stocks provide a high current income but also price depreciation over time.
21. R = $1.82 / $23.91 = 7.61%Highest R = $1.82 / $23.12 = 7.87%Lowest R = $1.82 / $25.90 = 7.03%
22. R = (D1 / P0) + g = [$0.21(1.06) / $23.14] + .06 = 6.96%The required return depends on the company and the industry. We will discuss historical returns in a later chapter, but this required return seems low. The most basic way to reconcile the answers is that the market may be expecting supernormal growth for Disney.
23. R = (D1 / P0) + g = [$1.10(1.02) / $33.14] + .02 = 5.39%The required return depends on the company and the industry. Since Duke Energy is a regulated utility company, there is little room for growth. This is the reason for the relatively high dividend yield. Since the company has little reason to keep retained earnings for new projects, a majority of net income is paid to shareholders in the form of dividends. This may change in the near future with the de-regulation of the electricity industry. In fact, the de-regulation is probably already affecting the expected growth rate for Duke Energy.
CHAPTER 7 B-55
24. R = (D1 / P0) + g = [$0.50(0.988) / $20.97] – .012 = 1.16%For JC Penney, same store sales had fallen in recent years, while at the same time industry same store sales had increased. Additionally, JC Penney previously owned their own credit subsidiary that had lost money in recent years. Although this number is correct when the quotes were gathered, the required return is obviously too low since it is lower than Treasury bills.
CHAPTER 8NET PRESENT VALUE AND OTHER INVESTMENT CRITERIAAnswers to Concepts Review and Critical Thinking Questions
1. A payback period less than the project’s life means that the NPV is positive for a zero discount rate, but nothing more definitive can be said. For discount rates greater than zero, the payback period will still be less than the project’s life, but the NPV may be positive, zero, or negative, depending on whether the discount rate is less than, equal to, or greater than the IRR.
2. If a project has a positive NPV for a certain discount rate, then it will also have a positive NPV for a zero discount rate; thus the payback period must be less than the project life. If NPV is positive, then the present value of future cash inflows is greater than the initial investment cost; thus PI must be greater than 1. If NPV is positive for a certain discount rate R, then it will be zero for some larger discount rate R*; thus the IRR must be greater than the required return.
3. a. Payback period is simply the break-even point of a series of cash flows. To actually compute the payback period, it is assumed that any cash flow occurring during a given period is realized continuously throughout the period, and not at a single point in time. The payback is then the point in time for the series of cash flows when the initial cash outlays are fully recovered. Given some predetermined cutoff for the payback period, the decision rule is to accept projects that payback before this cutoff, and reject projects that take longer to payback.
b. The worst problem associated with payback period is that it ignores the time value of money. In addition, the selection of a hurdle point for payback period is an arbitrary exercise that lacks any steadfast rule or method. The payback period is biased towards short-term projects; it fully ignores any cash flows that occur after the cutoff point.
c. Despite its shortcomings, payback is often used because (1) the analysis is straightforward and simple and (2) accounting numbers and estimates are readily available. Materiality consider-ations often warrant a payback analysis as sufficient; maintenance projects are another example where the detailed analysis of other methods is often not needed. Since payback is biased towards liquidity, it may be a useful and appropriate analysis method for short-term projects where cash management is most important.
4. a. The average accounting return is interpreted as an average measure of the accounting perfor-mance of a project over time, computed as some average profit measure due to the project divided by some average balance sheet value for the project. This text computes AAR as average net income with respect to average (total) book value. Given some predetermined cutoff for AAR, the decision rule is to accept projects with an AAR in excess of the target measure, and reject all other projects.
b. AAR is not a measure of cash flows and market value, but a measure of financial statement accounts that often bear little semblance to the relevant value of a project. In addition, the selection of a cutoff is arbitrary, and the time value of money is ignored. For a financial manager, both the reliance on accounting numbers rather than relevant market data and the exclusion of time value of money considerations are troubling. Despite these problems, AAR continues to be used in practice because (1) the accounting information is usually available, (2)
CHAPTER 8 B-57
analysts often use accounting ratios to analyze firm performance, and (3) managerial compensation is often tied to the attainment of certain target accounting ratio goals.
5. a. NPV is simply the sum of the present values of a project’s cash flows. NPV specifically measures, after considering the time value of money, the net increase or decrease in firm wealth due to the project. The decision rule is to accept projects that have a positive NPV, and reject projects with a negative NPV.
b. NPV is superior to the other methods of analysis presented in the text because it has no serious flaws. The method unambiguously ranks mutually exclusive projects, and can differentiate between projects of different scale and time horizon. The only drawback to NPV is that it relies on cash flow and discount rate values that are often estimates and not certain, but this is a problem shared by the other performance criteria as well. A project with NPV = $2,500 implies that the total shareholder wealth of the firm will increase by $2,500 if the project is accepted.
6. a. The IRR is the discount rate that causes the NPV of a series of cash flows to be equal to zero. IRR can thus be interpreted as a financial break-even rate of return; at the IRR discount rate, the net value of the project is zero. The IRR decision rule is to accept projects with IRRs greater than the discount rate, and to reject projects with IRRs less than the discount rate.
b. IRR is the interest rate that causes NPV for a series of cash flows to be zero. NPV is preferred in all situations to IRR; IRR can lead to ambiguous results if there are non-conventional cash flows, and also ambiguously ranks some mutually exclusive projects. However, for stand-alone projects with conventional cash flows, IRR and NPV are interchangeable techniques.
c. IRR is frequently used because it is easier for many financial managers and analysts to rate performance in relative terms, such as “12%”, than in absolute terms, such as “$46,000.” IRR may be a preferred method to NPV in situations where an appropriate discount rate is unknown or uncertain; in this situation, IRR would provide more information about the project than would NPV.
7. a. The profitability index is the present value of cash inflows relative to the project cost. As such, it is a benefit/cost ratio, providing a measure of the relative profitability of a project. The profitability index decision rule is to accept projects with a PI greater than one, and to reject projects with a PI less than one.
b. PI = ( NPV + cost ) / cost = 1 + ( NPV / cost ). If a firm has a basket of positive NPV projects and is subject to capital rationing, PI may provide a good ranking measure of the projects, indicating the “bang for the buck” of each particular project.
8. PB = I / C ; – I + C / R = NPV, 0 = – I + C / IRR so IRR = C / I ; thus IRR = 1 / PBFor long-lived projects with relatively constant cash flows, the sooner the project pays back, the greater is the IRR.
9. There are a number of reasons. Two of the most important have to do with transportation costs and exchange rates. Manufacturing in the U.S. places the finished product much closer to the point of sale, resulting in significant savings in transportation costs. It also reduces inventories because goods spend less time in transit. Higher labor costs tend to offset these savings to some degree, at least compared to other possible manufacturing locations. Of great importance is the fact that manufacturing in the U.S. means that a much higher proportion of the costs are paid in dollars. Since sales are in dollars, the net effect is to immunize profits to a large extent against fluctuations in exchange rates. This issue is discussed in greater detail in the chapter on international finance.
B-58 SOLUTIONS
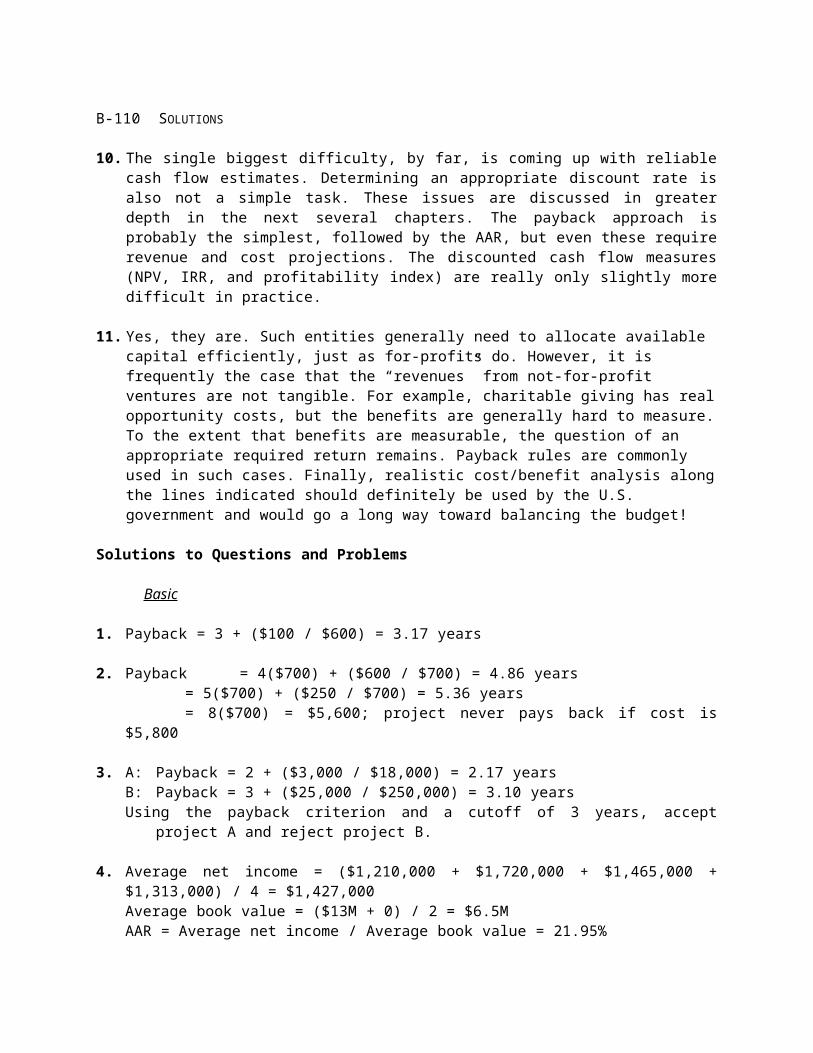
10. The single biggest difficulty, by far, is coming up with reliable cash flow estimates. Determining an appropriate discount rate is also not a simple task. These issues are discussed in greater depth in the next several chapters. The payback approach is probably the simplest, followed by the AAR, but even these require revenue and cost projections. The discounted cash flow measures (NPV, IRR, and profitability index) are really only slightly more difficult in practice.
11. Yes, they are. Such entities generally need to allocate available capital efficiently, just as for-profits do. However, it is frequently the case that the “revenues” from not-for-profit ventures are not tangible. For example, charitable giving has real opportunity costs, but the benefits are generally hard to measure. To the extent that benefits are measurable, the question of an appropriate required return remains. Payback rules are commonly used in such cases. Finally, realistic cost/benefit analysis along the lines indicated should definitely be used by the U.S. government and would go a long way toward balancing the budget!
Solutions to Questions and Problems
Basic
1. Payback = 3 + ($100 / $600) = 3.17 years
2. Payback = 4($700) + ($600 / $700) = 4.86 years= 5($700) + ($250 / $700) = 5.36 years= 8($700) = $5,600; project never pays back if cost is $5,800
3. A: Payback = 2 + ($3,000 / $18,000) = 2.17 yearsB: Payback = 3 + ($25,000 / $250,000) = 3.10 yearsUsing the payback criterion and a cutoff of 3 years, accept project A and reject project B.
4. Average net income = ($1,210,000 + $1,720,000 + $1,465,000 + $1,313,000) / 4 = $1,427,000Average book value = ($13M + 0) / 2 = $6.5MAAR = Average net income / Average book value = 21.95%
IRR = 11.19%IRRA > IRRB, so IRR decision rule implies accept project A. This may not be a correct decision however, because the IRR criterion has a ranking problem for mutually exclusive projects. To see if the IRR decision rule is correct or not, we need to evaluate the project NPVs.
R = 9.52%At discount rates above 9.52% choose project A; for discount rates below 9.52% choose project B; indifferent between A and B at a discount rate of 9.52%.
IRR = 72.75% , – 83.46%When there are multiple IRRs, the IRR decision rule is ambiguous; in this case, if the correct IRR is 72.75%, then we would accept the project, but if the correct IRR is – 83.46%, we would reject the project.
14. a. PII = $13,000(PVIFA9%,3) / $30,000 = 1.097; PIII = $2,600(PVIFA9%,3) / $4,500 = 1.463The profitability index decision rule implies accept project II, since PIII > PII
b. NPVI = – $30,000 + $13,000(PVIFA9%,3) = $2,906.83NPVII = – $4,500 + $2,600(PVIFA9%,3) = $2,081.37NPV decision rule implies accept I, since NPVI > NPVII
c. Using the profitability index to compare mutually exclusive projects can be ambiguous when the magnitude of the cash flows for the two projects are of different scale. In this problem, project I is larger than project II and produces a larger NPV, yet the profitability index criterion implies that project II is more acceptable.
15. a. PBA = 3 + ($133K/$425K) = 3.31 years; PBB = 1 + ($8K/$10.5K) = 1.76 yearsPayback criterion implies accept project B, because it pays back sooner than project A.
NPV criterion implies accept project A, because project A has a higher NPV than project B.c. A: $210K = $15K/(1+IRR) + $30K/(1+IRR)2 + $32K/(1+IRR)3 + $425K/(1+IRR)4
IRR = 38.30%IRR decision rule implies accept project B, because IRR for B is greater than IRR for A.
d. A: PI = [$15K/1.15 + $30K/1.152 + $32K/1.153 + $425K/1.154 ] / $210K = 1.427B: PI = [$12K/1.15 + $10.5K/1.152 + $9.5K/1.153 + $8.2K/1.154 ] / $20K = 1.465
Profitability index criterion implies accept project B, because its PI is greater than project A’s.
e. In this instance, the NPV criterion implies that you should accept project A, while payback period, PI and IRR imply that you should accept project B. The final decision should be based on the NPV since it does not have the ranking problem associated with the other capital budgeting techniques. Therefore, you should accept project A.
N: NPV = –$420K + $180K/1.15 + $200K/1.152 + $170K/1.153 + $110K/1.154 = $62,421.09c. Accept project N since the NPV is higher. IRR cannot be used to rank mutually exclusive
projects.
17. a. Y: PI = $14,000(PVIFA12%,4) / $35,000 = 1.215Z: PI = $27,000(PFIFA12%,4) / $70,000 = 1.172The profitability index implies accept project Y.
b. Y: NPV = –$35,000 + $14,000(PVIFA12%,4) = $7,522.89Z: NPV = –$70,000 + $27,000(PFIFA12%,4) = $12,008.43The NPV for project Z is larger, therefore accept Z since the profitability index cannot be used to rank mutually exclusive projects..
CHAPTER 8 B-61
18. Crossover rate: 0 = $7,000/(1+R) + $1,000/(1+R)2 – $3,000/(1+R)3 – $9,000/(1+R)4; R = 16.75%At a lower interest rate project J is more valuable because of the higher total cash flows. At a higher interest rate, project I becomes more valuable since the differential cash flows received in the first two years are larger than the cash flows for project J.
19. a. K: PI = [$20K/1.13 + $19K/1.132 + $18K/1.133 + $17K/1.134 + $16K/1.135 ] / $40K = 1.604
c. You should accept project S since the NPV is higher. The profitability index has a ranking problem with mutually exclusive investment projects.
20. If the payback period is exactly equal to the project’s life then the IRR must be equal to zero since the project pays back exactly the initial investment. If the project never pays back its initial investment, then the IRR of the project must be < 0%.
N: NPV = – $60K + $40K/1.12 + $25K/1.122 + $20K/1.123 + $15K/1.124 = $19,412.51c. Accept project N since the NPV is higher. IRR cannot be used to rank mutually exclusive
According to the IRR decision rule you should accept D since the IRR is higher than C. In fact, this is one time where the IRR decision rule is valid on mutually exclusive projects. Since the projects have conventional cash flows, we know that project C must be rejected since the IRR is below the required return, therefore we are left with only project D. Of course, these IRRs imply that project C will have a negative NPV and project D will have a positive NPV.
26. IRR: –$45,000 = –$20,000/(1+IRR) – $38,000/(1+IRR)2; IRR = 16.76% @12%: NPV = $45,000 – $20,000/1.122 – $38,000/1.122 = –$3,150.51@ 0%: NPV = $45,000 – $20,000 – $38,000 = –$13,000.00 @25%: NPV = $45,000 – $20,000/1.252 – $38,000/1.252 = +$4,680.00The cash flows for the project are unconventional. Since the initial cash flow is positive and the remaining cash flows are negative, the decision rule for IRR in invalid in this case. The NPV profile is upward sloping, indicating that the project is more valuable when the interest rate increases.
NOTE: This is the only IRR the BA II Plus will calculate. The second IRR of –83.46% must be calculated using another program, by hand, or trial and error.
c. Using the profitability index to compare mutually exclusive projects can be ambiguous when the magnitude of the cash flows for the two projects are of different scale. In this problem, project I is larger than project II and produces a larger NPV, yet the profitability index criterion implies that project II is more acceptable.
I = 15 IRR CPT I = 15NPV CPT 38.30% NPV CPT$9,309.07 $29,309.07
PI = $29,309.07 / $20,000 = 1.465
e. In this instance, the NPV criterion implies that you should accept project A, while payback period, PI and IRR imply that you should accept project B. The final decision should be based on the NPV since it does not have the ranking problem associated with the other capital budgeting techniques. Therefore, you should accept project A.
At a lower interest rate project J is more valuable because of the higher total cash flows. At a higher interest rate, project I becomes more valuable since the differential cash flows received in the first two years are larger than the cash flows for project J.
I = 12 I = 12 I = 12NPV CPT NPV CPT NPV CPT$13,970.98 $41,157.04 $76,461.78
c. Even though project H does not meet the payback period of three years, it does provide the largest increase in shareholder wealth, therefore, choose project H. Payback period generally should be ignored in this situation.
According to the IRR decision rule you should accept D since the IRR is higher than C. In fact, this is one time where the IRR decision rule is valid on mutually exclusive projects. Since the projects have conventional cash flows, we know that project C must be rejected since the IRR is below the required return, therefore we are left with only project D. Of course, these IRRs imply that project C will have a negative NPV and project D will have a positive NPV.
I = 0 I = 12 I = 25NPV CPT NPV CPT NPV CPT–$13,000 –$3,150.51 $4,680.00
The cash flows for the project are unconventional. Since the initial cash flow is positive and the remaining cash flows are negative, the decision rule for IRR in invalid in this case. The NPV profile is upward sloping, indicating that the project is more valuable when the interest rate increases.
The BA II Plus will not solve this problem due to the number of iterations necessary to solve the equation. By hand, another program, or trial and error, you can find IRR = 25%, 33.33%, 42.86%, 66.67%. Take the project when NPV > 0, for required returns between 25% and 33.33% or between 42.86% and 66.67%.
CHAPTER 9MAKING CAPITAL INVESTMENT DECISIONSAnswers to Concepts Review and Critical Thinking Questions
1. In this context, an opportunity cost refers to the value of an asset or other input that will be used in a project. The relevant cost is what the asset or input is actually worth today, not, for example, what it cost to acquire.
2. For tax purposes, a firm would choose MACRS because it provides for larger depreciation deductions earlier. These larger deductions reduce taxes, but have no other cash consequences. Notice that the choice between MACRS and straight-line is purely a time value issue; the total depreciation is the same, only the timing differs.
3. It’s probably only a mild over-simplification. Current liabilities will all be paid presumably. The cash portion of current assets will be retrieved. Some receivables won’t be collected, and some inventory will not be sold, of course. Counterbalancing these losses is the fact that inventory sold above cost (and not replaced at the end of the project’s life) acts to increase working capital. These effects tend to offset.
4. Management’s discretion to set the firm’s capital structure is applicable at the firm level. Since any one particular project could be financed entirely with equity, another project could be financed with debt, and the firm’s overall capital structure remain unchanged, financing costs are not relevant in the analysis of a project’s incremental cash flows according to the stand-alone principle.
5. Depreciation is a non-cash expense, but it is tax-deductible on the income statement. Thus deprecia-tion causes taxes paid, an actual cash outflow, to be reduced by an amount equal to the depreciation tax shield tCD. A reduction in taxes that would otherwise be paid is the same thing as a cash inflow, so the effects of the depreciation tax shield must be added in to get the total incremental aftertax cash flows.
6. There are two particularly important considerations. The first is erosion. Will the essentialized book simply displace copies of the existing book that would have otherwise been sold? This is of special concern given the lower price. The second consideration is competition. Will other publishers step in and produce such a product? If so, then any erosion is much less relevant. A particular concern to book publishers (and producers of a variety of other product types) is that the publisher only makes money from the sale of new books. Thus, it is important to examine whether the new book would displace sales of used books (good from the publisher’s perspective) or new books (not good). The concern arises any time there is an active market for used product.
7. This market was heating up rapidly, and a number of other manufacturers were planning competing products.
B-76 SOLUTIONS
8. One company may be able to produce at lower incremental cost or market better. For example, GM may have been able to retool existing production more cheaply, and GM also has a larger dealer network. Also, of course, one of the two may have made a mistake!
9. GM would recognize that the outsized profits would dwindle as more products come to market and competition becomes more intense.
10. With a sensitivity analysis, one variable is examined over a broad range of values. With a scenario analysis, all variables are examined for a limited range of values.
11. It is true that if average revenue is less than average cost, the firm is losing money. This much of the statement is therefore correct. At the margin, however, accepting a project with a marginal revenue in excess of its marginal cost clearly acts to increase operating cash flow.
12. The implication is that they will face hard capital rationing.
13. Forecasting risk is the risk that a poor decision is made because of errors in projected cash flows. The danger is greatest with a new project because the cash flows are probably harder to predict.
14. The option to abandon reflects our ability to reallocate assets if we find our initial estimates were too optimistic. The option to expand reflects our ability to increase cash flows from a project if we find our initial estimates were too pessimistic. Since the option to expand can increase cash flows and the option to abandon reduces losses, failing to consider these two options will generally lead us to underestimate a project’s NPV.
Solutions to Questions and Problems
Basic
1. The $6 million acquisition cost of the land six years ago is a sunk cost. The $6.8 million current appraisal of the land is an opportunity cost if the land is used rather than sold off, therefore it represents part of the project’s initial investment. The $10 million cash outlay and $500,000 grading expenses are the initial fixed asset investments needed to get the project going. Therefore, the proper year zero cash flow to use in evaluating this project is $6,800,000 + 10,000,000 + 500,000 = $17.3 million.
2. Sales due solely to the new product line are 12,000($15,000) = $180 million. Increased sales of the motor home line occur because of the new product line introduction; thus 2,000($50,000) = $100 million in new sales is relevant. Erosion of luxury motor coach sales is also due to the new mid-size campers; thus 1,000($90,000) = $90 million loss in sales is relevant. The net sales figure to use in evaluating the new line is thus $180 million + 100 million – 90 million = $190 million.
CHAPTER 9 B-77
3. Sales $ 800,000Variable costs 480,000Fixed costs 190,000Depreciation 95,000 EBIT $ 35,000Taxes@35% 12,250 Net income $ 22,750
6. BV5 = $520,000 – 520,000(5/8) = $195,000The asset is sold at a loss to book value, so the depreciation tax shield of the loss is recaptured.Aftertax salvage value = $125,000 + ($195,000 – 125,000)(0.35) = $149,500
7. BV4 = $6.4M – 6.4M(0.2000 + 0.3200 + 0.1920 + 0.1152) = $1,105,920The asset is sold at a gain to book value, so this gain is taxable.Aftertax salvage value = $1,500,000 + ($1,105,920 – 1,500,000)(0.34) = $1,366,012.80
8. A/R fell by $6,720, and inventory increased by $4,484, so net current assets fell by $2,236NWC = (CA – CL) = – $2,236 – 7,720 = – $9,956Net cash flow = S – C – NWC = $116,400 – 45,400 – (– 9,956) = $80,956
B-78 SOLUTIONS
9. Sales $1,920,000Costs 985,000Depreciation 600,000EBIT 335,000Taxes 117,250Net income $ 217,750
OCF = EBIT + D – T = $335,000 + 600,000 – 117,250 = $817,750
12. D1 = $1.8M(0.3333) = $599,940D2 = $1.8M(0.4444) = $799,920D3 = $1.8M(0.1482) = $266,760BV3 = $1.8M – (599,940 + 799,920 + 266,760) = $133,380The asset is sold at a gain to book value, so this gain is taxable.Aftertax salvage value = $300,000 + (133,380 – 300,000)(0.35) = $241,683OCFt = (S – C)(1 – tc) + tcDt , so:
16. Base Case Best Case Worst CaseUnit sales 80,000 92,000 68,000Price/unit $1,380 $1,587 $1,173Variable cost/unit $140 $119 $161Fixed costs $7,000,000 $5,950,000 $8,050,000
17. An estimate for the impact of changes in price on the profitability of the project can be found from the sensitivity of NPV with respect to price; NPV/P. This measure can be calculated by finding the NPV at any two different price levels and forming the ratio of the changes in these parameters. Whenever a sensitivity analysis is performed, all other variables are held constant at their base-case values.
18. a. D = $1,260,000/6 = $210,000 per yearOCFbase = [(P – v)Q – FC](1 – tc) + tcD
= [($35 – 19)(105K) – 950K](0.65) + 0.35($210K) = $548,000NPVbase = –$1,260,000 + $548,000(PVIFA15%,6) = $813,896.52Say Q = 100,000: OCFnew = [($35 – 19)(100K) – 950K](0.65) + 0.35($210K) = $496,000NPVbase = –$1,260,000 + $496,000(PVIFA15%,6) = $617,103.42NPV/S = ($813,896.52 – 617,103.42)/(105,000 – 100,000) = +$39.359If sales were to drop by 500 units then, NPV would drop by $39.359(500) = $19,679
b. Say v = $17: OCFnew = [($35 – 18)(105K) – 950K](0.65) + 0.35($210K) = $616,5250OCF/v = ($548,000 – 616,250)/($19 – 18) = – $68,250If variable costs fell by $1 then, OCF would rise by $68,250
b. Say FC are $150K: OCF = [($18,000 – 13,500)(150) – $150,000](0.65) + 0.35($820K/4) = $413,000NPV = –$820,000 + $413,000(PVIFA15%,4) = $359,106.06NPV/FC = ($340,548.70 – 359,106.06)/($160,000 – $150,000) = –$1.856For every dollar FC increase, NPV falls by $1.86.
24. The marketing study and the research and development are both sunk costs and should be ignored.
CHAPTER 10SOME LESSONS FROM CAPITAL MARKET HISTORYAnswers to Concepts Review and Critical Thinking Questions
1. They all wish they had! Since they didn’t, it must have been the case that the stellar performance was not foreseeable, at least not by most.
2. As in the previous question, it’s easy to see after the fact that the investment was terrible, but it probably wasn’t so easy ahead of time.
3. No, stocks are riskier. Some investors are highly risk averse, and the extra possible return doesn’t attract them relative to the extra risk.
4. On average, the only return that is earned is the required return—investors buy assets with returns in excess of the required return (positive NPV), bidding up the price and thus causing the return to fall to the required return (zero NPV); investors sell assets with returns less than the required return (negative NPV), driving the price lower and thus the causing the return to rise to the required return (zero NPV).
5. The market is not weak form efficient.
6. Yes, historical information is also public information; weak form efficiency is a subset of semi-strong form efficiency.
7. Ignoring trading costs, on average, such investors merely earn what the market offers; the trades all have zero NPV. If trading costs exist, then these investors lose by the amount of the costs.
8. Unlike gambling, the stock market is a positive sum game; everybody can win. Also, speculators provide liquidity to markets and thus help to promote efficiency.
9. The EMH only says, within the bounds of increasingly strong assumptions about the information processing of investors, that assets are fairly priced. An implication of this is that, on average, the typical market participant cannot earn excessive profits from a particular trading strategy. However, that does not mean that a few particular investors cannot outperform the market over a particular investment horizon. Certain investors who do well for a period of time get a lot of attention from the financial press, but the scores of investors who do not do well over the same period of time generally get considerably less attention.
10. a. If the market is not weak form efficient, then this information could be acted on and a profit earned from following the price trend. Under (2), (3), and (4), this information is fully impounded in the current price and no abnormal profit opportunity exists.
B-84 SOLUTIONS
b. Under (2), if the market is not semi-strong form efficient, then this information could be used to buy the stock “cheap” before the rest of the market discovers the financial statement anomaly. Since (2) is stronger than (1), both imply that a profit opportunity exists; under (3) and (4), this information is fully impounded in the current price and no profit opportunity exists.
c. Under (3), if the market is not strong form efficient, then this information could be used as a profitable trading strategy, by noting the buying activity of the insiders as a signal that the stock is underpriced or that good news is imminent. Since (1) and (2) are weaker than (3), all three imply that a profit opportunity exists. Under (4), this information does not signal any profit opportunity for traders; any pertinent information the manager-insiders may have is fully reflected in the current share price.
d. Before the fact, for most assets the risk premium will be positive; investors demand compen-sation over and above the risk-free return to invest their money in the risky asset. After the fact, the observed risk premium can be negative if the asset’s nominal return is unexpectedly low, the risk-free return is unexpectedly high, or if some combination of these two events occurs.
d. The statement that T-bills have no risk refers to the fact that there is only an extremely small chance of the government defaulting, so there is little default risk. Since T-bills are short term, there is also very limited interest rate risk. However, as this example shows, there is inflation risk, i.e. the purchasing power of the investment can actually decline over time even if the investor is earning a positive return.
26. Pr( R<–3.7 or R>15.1 ) 1/3, but we are only interested in one tail here; Pr( R<–3.7) 1/695% level: R± 2 = 5.7 ± 2(9.4) = –13.1% to 24.5%99% level: R± 3 = 5.7 ± 3(9.4) = –22.5% to 33.9%
B-88 SOLUTIONS
27. = 17.3%; = 33.2%. Doubling your money is a 100% return, so if the return distribution is normal, z = (100–17.3)/33.2 = 2.49 standard deviations above the mean; this corresponds to a probability of 1%, or once every 100 years. Tripling your money would be z = (200–17.3)/33.2 = 5.50 standard deviations above the mean; this corresponds to a probability of (much) less than 0.5%, or once every 200 years. (The actual answer is less than 0.0000019% or about once every 1 million years).
28. It is impossible to lose more than 100 percent of your investment. Therefore, return distributions are truncated on the lower tail at –100 percent.
CHAPTER 11RISK AND RETURNAnswers to Concepts Review and Critical Thinking Questions
1. Some of the risk in holding any asset is unique to the asset in question. By investing in a variety of assets, this unsystematic portion of the total risk can be eliminated at little cost. On the other hand, there are systematic risks that affect all investments. This portion of the total risk of an asset cannot be costlessly eliminated. In other words, systematic risk can be controlled, but only by a costly reduction in expected returns.
2. If the market expected the growth rate in the coming year to be 2 percent, then there would be no change in security prices if this expectation had been fully anticipated and priced. However, if the market had been expecting a growth rate different than 2 percent and the expectation was incorpo-rated into security prices, then the government’s announcement would most likely cause security prices in general to change; prices would typically drop if the anticipated growth rate had been more than 2 percent, and prices would typically rise if the anticipated growth rate had been less than 2 percent.
4. a. a change in systematic risk has occurred; market prices in general will most likely decline.b. no change in unsystematic risk; company price will most likely stay constant.c. no change in systematic risk; market prices in general will most likely stay constant.d. a change in unsystematic risk has occurred; company price will most likely decline.e. no change in systematic risk; market prices in general will most likely stay constant.
5. No to both questions. The portfolio expected return is a weighted average of the asset returns, so it must be less than the largest asset return and greater than the smallest asset return.
6. False. The variance of the individual assets is a measure of the total risk. The variance on a well-diversified portfolio is a function of systematic risk only.
7. Yes, the standard deviation can be less than that of every asset in the portfolio. However, cannot be less than the smallest beta because P is a weighted average of the individual asset betas.
8. Yes. It is possible, in theory, to construct a zero beta portfolio of risky assets whose return would be equal to the risk-free rate. It is also possible to have a negative beta; the return would be less than the risk-free rate. A negative beta asset would carry a negative risk premium because of its value as a diversification instrument.
9. Such layoffs generally occur in the context of corporate restructurings. To the extent that the market views a restructuring as value-creating, stock prices will rise. So, it’s not the layoffs per se that are
B-90 SOLUTIONS
being cheered on but the cost savings associated with the layoffs. Nonetheless, Wall Street does encourage corporations to takes actions to create value, even if such actions involve layoffs.
10. Earnings contain information about recent sales and costs. This information is useful for projecting future growth rates and cash flows. Thus, unexpectedly low earnings often lead market participants to reduce estimates of future growth rates and cash flows; lower prices are the result. The reverse is often true for unexpectedly high earnings.
Solutions to Questions and Problems
Basic
1. total value = 80($42) + 40($68) = $6,080weightA = 80($42)/$6,080 = .5526; weightB = 40($68)/$6,080 = .4474
The portfolio is invested 200% in the stock and –100% in the risk-free asset. This represents borrowing at the risk-free rate to buy more of the stock.
21. For a portfolio that is equally invested in common stocks and long-term bonds:return = (12.70% + 6.10%)/2 = 9.40%For a portfolio that is equally invested in small stocks and Treasury bills:return = (17.30% + 3.90%)/2 = 10.60%
22. E[Rp] = .14 = .19wH + .11(1 – wH); wH = 0.3750investment in H = 0.3750($250,000) = $93,750investment in L = (1 – 0.3750)($250,000) = $156,250
Although stock II has more total risk than I, it has much less systematic risk, since its beta is much smaller than I’s. Thus I has more systematic risk, and II has more unsystematic and more total risk. Since unsystematic risk can be diversified away, I is actually the “riskier” stock despite the lack of volatility in its returns. Stock I will have a higher risk premium and a greater expected return.
CHAPTER 12COST OF CAPITALAnswers to Concepts Review and Critical Thinking Questions
1. It is the minimum rate of return the firm must earn overall on its existing assets. If it earns more than this, value is created.
2. Book values for debt are likely to be much closer to their market values than are book values for equity.
3. No. The cost of capital depends on the risk of the project, not the source of the money.
4. Interest expense is tax-deductible. There is no difference between pretax and aftertax equity costs.
5. The primary advantage of the DCF model is its simplicity. The method is disadvantaged in that (1) the model is applicable only to firms that actually pay dividends; many do not; (2) even if a firm does pay dividends, the DCF model requires a constant dividend growth rate forever; (3) the estimated cost of equity from this method is very sensitive to changes in g, which is a very uncertain parameter; and (4) the model does not explicitly consider risk, although risk is implicitly considered to the extent that the market has impounded the relevant risk of the stock into its market price. While the share price and most recent dividend can be observed in the market, the dividend growth rate must be estimated. Two common methods of estimating g are to use analysts’ earnings and payout forecasts, or determine some appropriate average historical g from the firm’s available data.
6. Two primary advantages of the SML approach are that the model explicitly incorporates the relevant risk of the stock, and the method is more widely applicable than is the DCF model, since the SML doesn’t make any assumptions about the firm’s dividends. The primary disadvantages of the SML method are (1) estimating three parameters: the risk-free rate, the expected return on the market, and beta, and (2) the method essentially uses historical information to estimate these parameters. The risk-free rate is usually estimated to be the yield on very short maturity T-bills and is hence observable; the market risk premium is usually estimated from historical risk premiums and hence is not observable. The stock beta, which is unobservable, is usually estimated either by determining some average historical beta from the firm and the market’s return data, or using beta estimates provided by analysts and investment firms.
7. The appropriate aftertax cost of debt to the company is the interest rate it would have to pay if it were to issue new debt today. Hence, if the YTM on outstanding bonds of the company is observed, the company has an accurate estimate of its cost of debt. If the debt is privately-placed, the firm could still estimate its cost of debt by (1) looking at the cost of debt for similar firms in similar risk classes, (2) looking at the average debt cost for firms with the same credit rating (assuming the firm’s private debt is rated), or (3) consulting analysts and investment bankers. Even if the debt is publicly traded, an additional complication is when the firm has more than one issue outstanding; these issues rarely have the same yield because no two issues are ever completely homogeneous.
B-96 SOLUTIONS
8. a. This only considers the dividend yield component of the required return on equity.b. This is the current yield only, not the promised yield to maturity. In addition, it is based on the
book value of the liability, and it ignores taxes.c. Equity is inherently more risky than debt (except, perhaps, in the unusual case where a firm’s
assets have a negative beta). For this reason, the cost of equity exceeds the cost of debt. If taxes are considered in this case, it can be seen that at reasonable tax rates, the cost of equity does exceed the cost of debt.
9. RSuperior = .12 + .75(.08) = 18%Both should proceed. The appropriate discount rate does not depend on which company is investing; it depends on the risk of the project. Since Superior is in the business, it is closer to a pure play. Therefore, its cost of capital should be used. With an 18% cost of capital, the project has an NPV of $1 million regardless of who takes it.
10. If the different operating divisions were in much different risk classes, then separate cost of capital figures should be used for the different divisions; the use of a single, overall cost of capital would be inappropriate. If the single hurdle rate were used, riskier divisions would tend to receive funds for investment projects, since their return would exceed the hurdle rate despite the fact that they may actually plot below the SML and hence be unprofitable projects on a risk-adjusted basis. The typical problem encountered in estimating the cost of capital for a division is that it rarely has its own securities traded on the market, so it is difficult to observe the market’s valuation of the risk of the division. Two typical ways around this are to use a pure play proxy for the division, or to use subjective adjustments of the overall firm hurdle rate based on the perceived risk of the division.
6. P0 = $1,060 = $42.50(PVIFAR%,14) + $1,000(PVIFR%,14); R = 3.693%pretax cost of debt = YTM = 2 x 3.693 = 7.387%RD = .07387(1 – .38) = 4.580%
CHAPTER 12 B-97
7. a. P0 = $960 = $30(PVIFAR%,44) + $1,000(PVIFR%,54); R = 3.1698%pretax cost of debt = YTM = 2 x 3.1698 = 6.340%b. RD = .063396(1 – .35) = 4.121%c. The aftertax rate is more relevant because that is the actual cost to the company.
9. a. WACC = .65(.15) + .10(.06) + .25(.075)(1 – .35) = 11.57%b. Since interest is tax deductible and dividends are not, we must look at the after-tax cost of debt,
which is .075(1 – .35) = 4.88%. Hence, on an aftertax basis, debt is cheaper than the preferred stock.
b. For projects equally as risky as the firm itself, the WACC should be used as the discount rate.RE = .05 + 1.30(.09) = 16.70%P0 = $930 = $35(PVIFAR%,30) + $1,000(PVIFR%,30); R = 3.8999%, YTM = 7.7998%RD = (1 – .34)(.77998) = 5.15%RP = $4/$67 = 5.97%WACC = .2734(.0515) + .0525(.0597) + .6741(.1670) = 12.98%
17. a. Projects Y and Z.b. Using the firm’s overall cost of capital as a hurdle rate, projects X, Y and Z. However, after
considering risk via the SML:E[W] = .06 + .40(.13 – .06) = .0880 < .09, so accept W.E[X] = .06 + .95(.13 – .06) = .1265 > .11, so reject X.E[Y] = .06 + 1.06(.13 – .06) = .1342 < .15, so accept Y.E[Z] = .06 + 2.20(.13 – .06) = .2140 > .19, so reject Z.
c. Project W would be incorrectly rejected; project Z would be incorrectly accepted.
29. a. RE = [(0.80)(1.05)/$53] + .05 = 6.58%b. RE = .06 + 1.2(.13 – .06) = 14.40%c. When using the dividend growth model or the CAPM, you must remember that both are
estimates for the cost of equity. Additionally, and perhaps more importantly, each method of estimating the cost of equity depends upon different assumptions.
30. The $6 million cost of the land 3 years ago is a sunk cost and irrelevant; the $4.25M appraised value of the land is an opportunity cost and is relevant. The relevant market value capitalization weights are:MVD = 10,000($1,000)(0.94) = $9.4M; MVE = 250,000($65) = $16.25MMVP = 10,000($81) = $810,000; V = $9.4M + 16.25M + .81M = $26.46MRE = .0565 + 1.3(.08) = 16.05%P0 = $940 = $40(PVIFAR%,30) + $1,000(PVIFR%,30); R = 4.362%, YTM = 8.725%RD = (1 – .34)(.08725) = 5.758%RP = $7/$81 = 8.642%
CHAPTER 13LEVERAGE AND CAPITAL STRUCTUREAnswers to Concepts Review and Critical Thinking Questions
1. Business risk is the equity risk arising from the nature of the firm’s operating activity, and is directly related to the systematic risk of the firm’s assets. Financial risk is the equity risk that is due entirely to the firm’s chosen capital structure. As financial leverage, or the use of debt financing, increases, so does financial risk and hence the overall risk of the equity. Thus, Firm B could have a higher cost of equity if it uses greater leverage.
2. No, it doesn’t follow. While it is true that the equity and debt costs are rising, the key thing to remember is that the cost of debt is still less than the cost of equity. Since we are using more and more debt, the WACC does not necessarily rise.
3. Because many relevant factors such as bankruptcy costs, tax asymmetries, and agency costs cannot easily be identified or quantified, it’s practically impossible to determine the precise debt/equity ratio that maximizes the value of the firm. However, if the firm’s cost of new debt suddenly becomes much more expensive, it’s probably true that the firm is too highly leveraged.
4. The more capital intensive industries, such as airlines, cable television, and electric utilities, tend to use greater financial leverage. Also, industries with less predictable future earnings, such computers or drugs, tend to use less. Such industries also have a higher concentration of growth and startup firms. Overall, the general tendency is for firms with identifiable, tangible assets and relatively more predictable future earnings to use more debt financing. These are typically the firms with the greatest need for external financing and the greatest likelihood of benefiting from the interest tax shelter.
5. It’s called leverage (or “gearing” in the UK) because it magnifies gains or losses.
6. Homemade leverage refers to the use of borrowing on the personal level as opposed to the corporate level.
7. One answer is that the right to file for bankruptcy is a valuable asset, and the financial manager acts in shareholders’ best interest by managing this asset in ways that maximize its value. To the extent that a bankruptcy filing prevents “a race to the courthouse steps,” it would seem to be a reasonable alternative to complicated and expensive litigation.
8. As in the previous question, it could be argued that using bankruptcy laws as a sword may simply be the best use of the asset. Creditors are aware at the time a loan is made of the possibility of bankruptcy, and the interest charged incorporates this possibility.
B-102 SOLUTIONS
9. One side is that Continental was going to go bankrupt because its costs made it uncompetitive. The bankruptcy filing enabled Continental to restructure and keep flying. The other side is that Continental abused the bankruptcy code. Rather than renegotiate labor agreements, Continental simply abrogated them to the detriment of its employees. It is important thing to keep in mind that the bankruptcy code is a creation of law, not economics. A strong argument can always be made that making the best use of the bankruptcy code is no different from, for example, minimizing taxes by making best use of the tax code. Indeed, a strong case can be made that it is the financial manager’s duty to do so. As the case of Continental illustrates, the code can be changed if socially undesirable outcomes are a problem.
10. As with any management decision, the goal is to maximize the value of shareholder equity. To accomplish this with respect to the capital structure decision, management attempts to choose the capital structure with the lowest cost of capital.
3. a. market-to-book ratio = 1.0, so TE = MV = $80,000; ROE = NI/$80,000ROE .0875 .125 .15ROE% – 30 ––– + 20
b. now, TE = $80,000 – 40,000 = $40,000; ROE = NI/$40,000ROE .125 .20 .25ROE% – 37.5 ––– + 25
c. No debtROE .05688 .08125 .0975ROE% – 30 ––– + 20With debtROE .08125 .13 .1625ROE% – 37.5 ––– + 25.0
4. a. Plan I: NI = $1.5M: EPS = $1.5M/600K shares = $2.50Plan II: NI = $1.5M – .10($10M) = $500K; EPS = $500K/300K shares = $1.67Plan I has the higher EPS when EBIT is $600,000.
b. Plan I: NI = $11M; EPS = $11M/600K shares = $18.33Plan II: NI = $11M – .10($5M) = $10M; EPS = $10M/300K shares = $33.33Plan II has the higher EPS when EBIT is $2,500,000.
c. EBIT/600K = [EBIT – .10($10M)]/300K; EBIT = $2,000,000
5. P = $10M/300K shares bought with debt = $33.33 per shareV1 = $33.33(600K shares) = $20M; V2 = $33.33(300K shares) + $10M debt = $20M
6. a. I II all-equityEBIT $12,000 $12,000 $12,000Interest 3,000 1,500 0 NI $ 9,000 $10,500 $12,000EPS $9.00 $5.25 $4.00The all-equity plan has the lowest EPS; Plan I has the highest EPS.
b. Plan I vs. all-equity: EBIT/3,000 = [EBIT – .10($30,000)]/1,000; EBIT = $4,500Plan II vs. all-equity: EBIT/3,000 = [EBIT – .10($15,000)]/2,000; EBIT = $4,500The break-even levels of EBIT are the same because of M&M Proposition I.
c. [EBIT – .10($30,000)]/1,000 = [EBIT – .10($15,000)]/2,000 ; EBIT = $4,500This break-even level of EBIT is the same as in part (b) again because of M&M Proposition I.
d. I II all-equityEBIT $12,000 $12,000 $12,000Interest 3,000 1,500 0 EBT 9,000 10,500 12,000Taxes 3,420 3,990 4,560NI $ 5,580 $ 6,510 $ 7,440EPS $5.58 $3.26 $2.48The all-equity plan still has the lowest EPS; Plan I still has the highest EPS.Plan I vs. all-equity: EBIT(.62)/3,000 = [EBIT – .10($30,000)](.62)/1,000; EBIT = $4,500Plan II vs. all-equity: EBIT(.62)/3,000 = [EBIT – .10($15,000)](.62)/2,000; EBIT = $4,500[EBIT – .10($30,000)](.62)/1,000 = [EBIT – .10($15,000)](.62)/2,000 ; EBIT = $4,500The break-even levels of EBIT do not change because the addition of taxes reduces the income of all three plans by the same percentage; therefore, they do not change relative to one another.
B-104 SOLUTIONS
7. I: P = $15,000/1,000 shares bought with debt = $15 per share; II: P = $15,000/1,000 shares = $15This shows that when there are no corporate taxes, the stockholder does not care about the capital structure decision of the firm. This is M&M Proposition I without taxes.
8. a. EPS = $6,000/800 shares = $7.50; Rico’s cash flow = $7.50 (100 shares) = $750b. V = $80(800) = $64,000; D = 0.30($64,000) = $19,200
c. Sell 30 shares of stock and lend the proceeds at 9%: interest cash flow = 30($80)(.09) = $216cash flow from shares held = $7.63(70 shares) = $534; total cash flow = $750.
d. The capital structure is irrelevant because shareholders can create their own leverage or unlever the stock to create the payoff they desire, regardless of the capital structure the firm actually chooses.
9. a. EPS = $38,000/1,000 shares = $38.00; Rebecca’s cash flow = $38.00(100 shares) = $3,800b. V = $120(1,000) = $120,000; D = 0.40($120,000) = $48,000
c. Sell 40 shares of stock and lend the proceeds at 8%: interest cash flow = 40($120)(.08) = $384cash flow from shares held = $56.93 (60 shares) = $3,416; total cash flow = $3,800.
d. The capital structure is irrelevant because shareholders can create their own leverage or unlever the stock to create the payoff they desire, regardless of the capital structure the firm actually chooses.
11. With no debt the value is unchanged at $60M.D/E = 1 implies 50% debt; VL = VU + TCD = $60M + .30($30M) = $69MD/E = 2 implies 67% debt; VL = VU + TCD = $60M + .30($40M) = $72MDebt will increase the value of the firm more when the corporate tax rate is higher.
12. a. WACC = .14 = (1/2.5)RE + (1.5/2.5)(.09); RE = .2150b. .14 = (1/2)RE + (1/2)(.09); RE = .1900
.14 = (1/1.5)RE + (.5/1.5)(.09); RE = .1650 .14 = (1)RE + (0)(.09); RE = WACC = .1400
13. a. all-equity financed: WACC = RE = .13b. RE = RA + (RA – RD)(D/E) = .13 + (.13 – .08)(.25/.75) = .1467c. RE = RA + (RA – RD)(D/E) = .13 + (.13 – .08)(.50/.50) = .1800d. WACCB = (E/V)RE + (D/V)RD = .75(.1467) + .25(.08) = .1300
14. V = VU + TCD = $325,000 + .35($75,000) = $351,250
CHAPTER 13 B-105
15. Interest tax shield = $32M(.38) = $12.16M. The interest tax shield represents the tax savings in current income due to the deductibility of a firm’s qualified debt expenses.
Intermediate
16. No debt VU = VL; value of the firm is $160MWith debt: V = VU + TCD = $160M + .40($50M) = $180M
18. Initially, RE = WACC = RA = .14After issuing debt: RE = .14 + (.14 – .08)(1) = .20WACC = .20(.5) + .08(.5) = .14
19. no debt: V = VU = $21,000(.62)/.18 = $72,333.3350% debt: V = $72,333.33 + .38(V/2) ; V = $89,300.41100% debt: V = $72,333.33 + .38V ; V = $116,666.67
CHAPTER 14DIVIDENDS AND DIVIDEND POLICYAnswers to Concepts Review and Critical Thinking Questions
1. Dividend policy deals with the timing of dividend payments, not the amounts ultimately paid. Dividend policy is irrelevant when the timing of dividend payments doesn’t affect the present value of all future dividends.
2. A stock repurchase reduces equity while leaving debt unchanged. The debt ratio rises. A firm could, if desired, use excess cash to reduce debt instead. This is a capital structure decision.
3. The chief drawback to a strict dividend policy is the variability in dividend payments. This is a problem because investors tend to want a somewhat predictable cash flow. Also, if there is informa-tion content to dividend announcements, then the firm may be inadvertently telling the market that it is expecting a downturn in earnings prospects when it cuts a dividend, when in reality its prospects are very good. In a compromise policy, the firm maintains a relatively constant dividend. It increases dividends only when it expects earnings to remain at a sufficiently high level to pay the larger dividends, and it lowers the dividend only if it absolutely has to.
4. Friday, December 29 is the ex-dividend day. Remember not to count January 1 because it is a holiday, and the exchanges are closed. Anyone who buys the stock before December 29 is entitled to the dividend, assuming they do not sell it again before December 29.
5. No, because the money could be better invested in stocks that pay dividends in cash that will benefit the fundholders directly.
6. The change in price is due to the change in dividends, not to the change in dividend policy. Dividend policy can still be irrelevant without a contradiction.
7. The stock price dropped because of an expected drop in future dividends. Since the stock price is the present value of all future dividend payments, if the expected future dividend payments decrease, then the stock price will decline.
8. The plan will probably have little effect on shareholder wealth. The shareholders can reinvest on their own, and the shareholders must pay the taxes on the dividends either way. However, the shareholders who take the option may benefit at the expense of the ones who don’t (because of the discount). Also as a result of the plan, the firm will be able to raise equity by paying a 10% flotation cost (the discount), which may be a smaller discount than the market flotation costs of a new issue.
9. If these firms just went public, they probably did so because they were growing and needed the additional capital. Growth firms typically pay very small cash dividends, if they pay a dividend at all. This is because they have numerous projects, and therefore reinvest the earnings in the firm instead of paying cash dividends.
CHAPTER 14 B-107
10. It would not be irrational to find low-dividend, high-growth stocks. The trust should be indifferent between receiving dividends or capital gains since it does not pay taxes on either one (ignoring possible restrictions on invasion of principal, etc.). It would be irrational, however, to hold municipal bonds. Since the trust does not pay taxes on the interest income it receives, it does not need the tax break associated with the municipal bonds. Therefore, it should prefer to hold higher yielding, taxable bonds.
Solutions to Questions and Problems
Basic
1. new stock price = $105.00 – 1.50 = $103.50; stock value = 200 $103.50 = $20,700
2. new stock price = $105.00 – 1.50 = $103.50; stock value = 200 $103.50 = $20,700dividend = 200 $1.50 = $300; total wealth = $20,700 + 300 = $21,000
7. P0 = $300,000 equity/15,000 shares = $20; PX = $20 – 1.25 = $18.75$1.25(15,000 shares) = $18,750; the equity and cash accounts will both decline by $18,750.
8. Repurchasing the shares will reduce shareholders’ equity by $3,000.shares bought = $3,000/$20 = 150; new shares outstanding = 14,850.After repurchase, share price = $297,000 equity/14,850 shares = $20. The repurchase is effectively the same as the cash dividend because you either hold a share worth $20, or a share worth $18.75
B-108 SOLUTIONS
and $1.25 in cash. Therefore you participate in the repurchase according to the dividend payout percentage; you are unaffected.
10. new shares outstanding = 450,000(1.08) = 486,000capital surplus for new shares = 36,000($9) = $324,000
Common stock ($1 par value) $ 486,000Capital surplus 1,874,000Retained earnings 2,640,000
$5,000,000
11. The equity accounts are unchanged except the new par value of the stock is $0.20 per share.Dividends this year = $0.50(450,000 shares)(5/1 split) = $1,125,000Last year’s dividends = $1,125,000/1.10 = $1,022,727Dividends per share last year = $1,022,727/450,000 shares = $2.27
12. equity portion of capital outlays = $1,800 – 620 = $1,180; D/E = .60 implies capital structure is .6/1.6 debt and 1/1.6 equity. Therefore, new borrowings = $708; total capital outlays = $1,888
13. a. payout ratio = DPS/EPS = $1.50/$8 = .1875b. equity portion of capital outlays = 7M shares ($8 – 1.50) = $45.5M
D/E ratio = $13M/$45.5M = 0.2857
14. a. maximum capital outlays with no equity financing = $1,600,000 + 2($1,600,000) = $4,800,000.
b. If planned capital spending is $6,000,000>$4,800,000, then no dividend will be paid and new equity will be issued.
c. No, they do not maintain a constant dividend payout because, with the strict residual policy, the dividend will depend on the investment opportunities and earnings. As these two things vary, the dividend payout will also vary.
15. a. maximum investment with no equity financing = $20M + 1.4($30M) = $48M; debt = $28Mb. D/E = 1.4 implies capital structure is 1.4/2.4 debt and 1/2.4 equity.
c. borrowing = $40M – 16.7M = $23.3M; addition to retained earnings = $16,666,667d. dividend per share = $20M/8M shares = $2.50; no new borrowing will take place
Intermediate
16. P0 = $2.00/1.15 + $50/1.152 = $39.55$39.55 = D/1.15 + D/1.152 ; D = $24.32558P1 = $50/1.15 = $43.48 You want 1,000($24.33) = $24,325.58 in one year, but you’ll only get 1,000($2.00) = $2,000.Thus sell ($24,325.58 – 2,000)/$43.48 = 513.49 shares at time 1.time 2 cash flow = $50(1,000 – 513.49) = $24,325.58
CHAPTER 14 B-109
17. you only want $400 in year 1, so buy ($2,000 – 400)/$43.48 = 36.80 shares at time 1.year 2: (1,000 + 36.80)($50) = $51,840PV = $400/1.15 + ($51,840)/1.152 = $39,546.31PV = 1,000($2.00)/1.15 + 1,000($50)/1.152 = $39,546.31
18. a. cash dividend: DPS = $9,600/600 shares = $16.00; PX = $50 – 16.00 = $34.00 per share.wealth of a shareholder = a share worth $34 plus $16 cash = $50.repurchase: $9,600/$50 = 192 shares will be repurchased. If you choose to let your shares
be repurchased, you have $50 in cash; if you keep your shares, they’re still worth $50.
c. A share repurchase would seem to be the preferred course of action. Only those shareholders who wish to sell will do so, giving the shareholder a tax timing option that he or she doesn’t get with a dividend payment.
CHAPTER 15RAISING CAPITALAnswers to Concepts Review and Critical Thinking Questions
1. A company’s internally generated cash flow provides a source of equity financing. For a profitable company, outside equity may never be needed. Debt issues are larger because large companies have the greatest access to public debt markets (small companies tend to borrow more from private lenders). Equity issuers are frequently small companies going public; such issues are often quite small.
2. From the previous question, economies of scale are part of the answer. Beyond this, debt issues are simply easier and less risky to sell from an investment bank’s perspective. The two main reasons are that very large amounts of debt securities can be sold to a relatively small number of buyers, particularly large institutional buyers such as pension funds and insurance companies, and debt securities are much easier to price.
3. They are riskier and harder to market from an investment bank’s perspective.
4. Yields on comparable bonds can usually be readily observed, so pricing a bond issue accurately is much less difficult.
5. It is clear that the stock was sold too cheaply, so Netscape had reason to be unhappy.
6. No, but, in fairness, pricing the stock in such a situation is extremely difficult.
7. It’s an important factor. Only 5 million of the shares were underpriced. The other 38 million were, in effect, priced correctly.
8. He could have done worse since his access to the oversubscribed and, presumably, underpriced issues was restricted while the bulk of his funds were allocated in stocks from the undersubscribed and, quite possibly, overpriced issues.
9. a. The price will probably go up because IPOs are generally underpriced. This is especially true for smaller issues such as this one.
b. It is probably safe to assume that they are having trouble moving the issue, and it is likely that the issue is not substantially underpriced.
CHAPTER 15 B-111
Solutions to Questions and Problems
Basic
1. If you receive 1,000 shares of each, the profit is 1,000($6) – 1,000($3) = $3,000.Expected profit = 500($6) – 1,000($3) = $0. This is an example of the winner’s curse.
2. X(1 – .07) = $60M; X = $64,516,129.03 required total proceeds from sale.number of shares offered = $64,516,129.03/$75 = 860,215
3. X(1 – .08) = $60M + 600K; X = $65,151,290.32 required total proceeds from sale.number of shares offered = $65,151,290.32/$75 = 868,817
CHAPTER 16SHORT-TERM FINANCIAL PLANNINGAnswers to Concepts Review and Critical Thinking Questions
1. These are firms with relatively long inventory periods and/or relatively long receivables periods. Thus, such firms tend to keep inventory on hand, and they allow customers to purchase on credit and take a relatively long time to pay.
2. These are firms that have a relatively long time between the time purchased inventory is paid for and the time that inventory is sold and payment received. Thus, these are firms that have relatively short payables periods and/or relatively long receivable cycles.
3. a. Use: The cash balance declined by $200 to pay the dividend.b. Source: The cash balance increased by $500 assuming the goods bought on payables credit
were sold for cash.c. Use: The cash balance declined by $900 to pay for the fixed assets.d. Use: The cash balance declined by $625 to pay for the higher level of inventory.e. Use: The cash balance declined by $1,200 to pay for the redemption of debt.
4. Carrying costs will decrease because they are not holding goods in inventory. Shortage costs will probably increase depending on how close the suppliers are and how well they can estimate need. The operating cycle will decrease because the inventory period is decreased.
5. Since the cash cycle equals the operating cycle minus the accounts payable period, it is not possible for the cash cycle to be longer than the operating cycle if the accounts payable is positive. Moreover, it is unlikely that the accounts payable period would ever be negative since that implies the firm pays its bills before they are incurred.
6. It lengthened its payables period, thereby shortening its cash cycle.
7. Their receivables period increased, thereby increasing their operating and cash cycles.
8. It is sometimes argued that large firms “take advantage of” smaller firms by threatening to take their business elsewhere. However, considering a move to another supplier to get better terms is the nature of competitive free enterprise.
9. They would like to! The payables period is a subject of much negotiation, and it is one aspect of the price a firm pays its suppliers. A firm will generally negotiate the best possible combination of payables period and price. Typically, suppliers provide strong financial incentives for rapid payment. This issue is discussed in detail in a later chapter on credit policy.
10. Ameritech will need less financing because it is essentially borrowing more from its suppliers. Among other things, Ameritech will likely need less short-term borrowing from other sources, so it will save on interest expense.
CHAPTER 16 B-113
Solutions to Questions and Problems
Basic
1. a. N b. N c. Nd. D e. D f. Ig. N h. D i. Ij. D k. D l. Nm. D n. D o. D
4. first letter is cash cycle, a. D; D b. I; N c. D; Dsecond is operating cycle. d. D; D e. D; N f. I; I
5. a. 45-day collection period implies all receivables outstanding from previous quarter are collected in the current quarter, and (90-45)/90 = 1/2 of current sales are collected.
b. 60-day collection period implies all receivables outstanding from previous quarter are collected in the current quarter, and (90-60)/90 = 1/3 of current sales are collected.
c. 30-day collection period implies all receivables outstanding from previous quarter are collected in the current quarter, and (90-30)/90 = 2/3 of current sales are collected.
6. Inventory turnover = $52,143/{[$9,146 + 11,416]/2} = 5.07178 timesInventory period = 365 days/5.07178 = 71.967 daysReceivables turnover = $70,126/{[$4,819 + 5,627]/2} = 13.42638 timesReceivables period = 365 days/13.42638 = 27.185 daysOperating cycle = 71.967 + 27.185 = 99.15 daysPayables turnover = $52,143/{[$8,126 + 8,526]/2} = 6.26267 timesPayables period = 365 days/6.26267 = 58.282 daysCash cycle = 99.15 – 58.28 = 40.87 daysThe firm is receiving cash on average 40.87 days after it pays its bills.
7. EAR = (1 + 2/98)365/48 – 1 = 16.61%
8. a. The payables period is zero since Toby pays immediately.Payment in each period = 0.30 times next period sales.
Q1 Q2 Q3 Q4
Payment of accounts $222.00 $258.00 $291.00 $276.00
b. Since the payables period is 90 days, payment in each period = 0.3 times current period sales.
Q1 Q2 Q3 Q4
Payment of accounts $240.00 $222.00 $258.00 $291.00
c. Since the payables period is 60 days, payment in each period = 2/3 of last quarter’s orders, and 1/3 of this quarter’s orders, or 2/3(.30) times current sales + 1/3(.30) next period sales.
Q1 Q2 Q3 Q4
Payment of accounts $234.00 $234.00 $269.00 $286.00
9. Since the payables period is 60 days, payables in each period = 2/3 of last quarter’s orders, and 1/3 of this quarter’s orders, or 2/3(.75) times current sales + 1/3(.75) next period sales.
Q1 Q2 Q3 Q4
Payment of accounts $580.00 $600.00 $700.00 $700.00Wages, taxes, other expenses 240.00 216.00 288.00 264.00Long-term financing expenses 40.00 40.00 40.00 40.00(interest and dividends)
Total $860.00 $856.00 $1,028.00 $1,004.00
10. a. November sales = ($50,000 – 28,000)/0.15 = $146,667b. December sales = $28,000/0.35 = $80,000c. January collections = .15($146,667) + .20($80,000) + .65($120,000) = $116,000.00
12. a. 45-day collection period implies all receivables outstanding from previous quarter are collected in the current quarter, and (90-45)/90 = 1/2 of current sales are collected.
b. 60-day collection period implies all receivables outstanding from previous quarter are collected in the current quarter, and (90-60)/90 = 1/3 of current sales are collected.
c. 30-day collection period implies all receivables outstanding from previous quarter are collected in the current quarter, and (90-30)/90 = 2/3 of current sales are collected.
13. Inventory turnover = $108,915/{[$21,430 + 23,865]/2} = 4.80914 timesInventory period = 365 days/4.80914 = 75.897 daysReceivables turnover = $243,612/{[$15,362 + 17,120]/2} = 14.9998 timesReceivables period = 365 days/14.9998 = 24.334 daysOperating cycle = 75.897 + 24.334 = 100.23 daysPayables turnover = $108,915/{[$20,146 + 21,803]/2} = 5.1595 timesPayables period = 365 days/5.1595 = 70.74 daysCash cycle = 100.23 – 70.74 = 29.49 daysThe firm is receiving cash on average 25.29 days after it pays its bills.
14. EAR = (1 + 4/96)365/68 – 1 = 24.50%
15. a. The payables period is zero since Van Morrison pays immediately.Payment in each period = 0.50 times next period sales.
Q1 Q2 Q3 Q4
Payment of accounts $250 $280 $400 $240
b. Since the payables period is 90 days, payment in each period = 0.5 times current period sales.
Q1 Q2 Q3 Q4
Payment of accounts $200 $250 $280 $400
c. Since the payables period is 60 days, payment in each period = 2/3 of last quarter’s orders, and 1/3 of this quarter’s orders, or 2/3(.50) times current sales + 1/3(.50) next period sales.
Q1 Q2 Q3 Q4
Payment of accounts $216.67 $260.00 $320.00 $346.67
16. Since the payables period is 60 days, payables in each period = 2/3 of last quarter’s orders, and 1/3 of this quarter’s orders, or 2/3(.60) times current sales + 1/3(.60) next period sales.
Q1 Q2 Q3 Q4
Payment of accounts $320.00 $272.00 $384.00 $472.00Wages, taxes, other expenses 150.00 100.00 140.00 200.00Long-term financing expenses 10.00 10.00 10.00 10.00(interest and dividends)
Total $480.00 $382.00 $534.00 $682.00
Intermediate
17. a. Borrow $50M for one month, pay $212,500 in interest, but you only get the use of $48M.EAR = [1 + ($212,500/$48M)]12 – 1 = 5.44%
b. to end up with $10M, must borrow $10M/.96 = $10,416,666.67total interest paid = $10,416,666.67(1.00425)6 – $10,416,666.67 = $268,463.31
CHAPTER 17WORKING CAPITAL MANAGEMENTAnswers to Concepts Review and Critical Thinking Questions
1. Yes. Once a firm has more cash than it needs for operations and planned expenditures, the excess cash has an opportunity cost. It could be invested (by shareholders) in potentially more profitable ways. Question 9 discusses another reason.
2. If it has too much cash it can simply pay a dividend, or, more likely in the current financial environment, buy back stock. It can also reduce debt. If it has insufficient cash, then it must either borrow, sell stock, or improve profitability.
3. Probably not. Creditors would probably want substantially more.
4. Auto manufacturers often argue that due to the cyclical nature of their business, cash reserves are a good way to deal with future economic downturns. This is debatable, but it is true that auto manufacturers’ operating cash flows are very sensitive to the business cycle, and enormous losses have occurred during recent downturns.
5. Such instruments go by a variety of names, but the key feature is that the dividend adjusts, keeping the price relatively stable. This price stability, along with the dividend tax exemption, makes so-called adjustable rate preferred stock very attractive relative to interest-bearing instruments.
6. Net disbursement float is more desirable because the bank thinks the firm has more money than it actually does, and the firm is therefore receiving interest on funds it has already spent.
7. The firm has a net disbursement float of $500,000. If this is an ongoing situation, the firm may be tempted to write checks for more than it actually has in its account.
8. a. About the only disadvantage to holding T-bills are the generally lower yields compared to alternative money market investments.
b. Some ordinary preferred stock issues pose both credit and price risks that are not consistent with most short-term cash management plans.
c. The primary disadvantage of NCDs is the normally large transactions sizes, which may not be feasible for the short-term investment plans of many smaller to medium-sized corporations.
d. The primary disadvantages of the commercial paper market are the higher default risk charac-teristics of the security, and the lack of an active secondary market which may excessively restrict the flexibility of corporations to meet their liquidity adjustment needs.
9. The concern is that excess cash on hand can lead to poorly thought-out investments. The thought is that keeping cash levels relatively low forces management to pay careful attention to cash flow and capital spending.
CHAPTER 17 B-119
10. A potential advantage is that the quicker payment often means a better price. The disadvantage is that doing so increases the firm’s cash cycle.
11. This is really a capital structure decision. If the firm has an optimal capital structure, paying off debt moves it to an under-leveraged position. However, a combination of debt reduction and stock buy-backs could be structured to leave capital structure unchanged.
12. It is unethical because you have essentially tricked the grocery store into making you an interest-free loan, and the grocery store is harmed because it could have earned interest on the money instead of loaning it to you.
13. a. A sight draft is a commercial draft that is payable immediately.b. A time draft is a commercial draft that does not require immediate payment.c. A banker’s acceptance is when a bank guarantees the future payment of a commercial draft.d. A promissory note is an IOU that the customer signs.e. A trade acceptance is when the buyer accepts the commercial draft and promises to pay it in the
future.
14. Trade credit is usually granted on open account. The invoice is the credit instrument.
15. Credit costs: cost of debt, probability of default, and the cash discountNo-credit costs: lost salesThe sum of these are the carrying costs.
16. 1. Character: determines if a customer is willing to pay his or her debts.2. Capacity: determines if a customer is able to pay debts out of operating cash flow.3. Capital: determines the customer’s financial reserves in case problems occur with opera-
ting cash flow.4. Collateral: assets that can be liquidated to pay off the loan in case of default.5. Conditions: customer’s ability to weather an economic downturn and whether such a down-
turn is likely.
17. 1. Perishability and collateral value2. Consumer demand3. Cost, profitability, and standardization4. Credit risk5. The size of the account6. Competition7. Customer typeIf the credit period exceeds a customer’s operating cycle, then the firm is financing the receivables and other aspects of the customer’s business that go beyond the purchase of the selling firm’s merchandise.
18. a. B: A is likely to sell for cash only, unless the product really works. If it does, then they might grant longer credit periods to entice buyers.
b. A: Landlords have significantly greater collateral, and that collateral is not mobile.c. A: Since A’s customers turn over inventory less frequently, they have a longer inventory
period and thus will most likely have a longer credit period as well.
B-120 SOLUTIONS
d. B: Since A’s merchandise is perishable and B’s is not, B will probably have a longer credit period.
e. A: Rugs are fairly standardized and they are transportable, while carpets are custom fit and are not particularly transportable.
19. The three main categories of inventory are: raw material (initial inputs to the firm’s production process), work-in-progress (partially completed products), and finished goods (products ready for sale). From the firm’s perspective, the demand for finished goods is independent from the demand for the other types of inventory. The demand for raw material and work-in-progress is derived from, or dependent on, the firm’s needs for these inventory types in order to achieve the desired levels of finished goods.
20. JIT systems reduce inventory amounts. Assuming no adverse effects on sales, inventory turnover will increase. Since assets will decrease, total asset turnover will also increase. Recalling the Du Pont equation, an increase in total asset turnover, all else being equal, has a positive effect on ROE.
21. Carrying costs should be equal to order costs. Since the carrying costs are low relative to the order costs, the firm should increase the inventory level.
Solutions to Questions and Problems
Basic
1. Disbursement float; Available balance = $200,000; Book balance = $82,000
2. Collection float; Available balance = $60,000; Book balance = $170,000
10. Total annual sales = 52($46,000) = $2,392,000Receivables turnover = 365/35 = 10.42857 timesAverage receivables = $2.392 million/10.42857 = $229,369.86As an alternate solution: Average accounts receivable = 5 weeks’ sales = 5($46,000) = $230,000The difference is due to a 364 day (52 week) or 365 day year.
13. Carrying costs = (2,300/2)($10) = $11,500Order costs = (52)($800) = $41,600EOQ = [2(52)(2,300)($800)/$10]1/2 = 4,374.47The firm’s policy is not optimal, since the costs are not equal. The company should increase the order size and decrease the number of orders.
14. Carrying costs = (1,000/2)($38) = $19,000Restocking costs = 12($600) = $7,200EOQ = [2(12)(1,000)($600)/$38]1/2 = 615.59Number of orders per year = 12(1,000)/616 = 19.49 timesThe firm’s policy is not optimal, since the costs are not equal. The company should decrease the order size and increase the number of orders.
15. Carrying costs = (4,300/2)($52) = $111,800Order costs = (52)($4,500) = $234,000EOQ = [2(52)(4,300)($4,500)/$52]1/2 = 6,220.93The firm’s policy is not optimal, since the costs are not equal. The company should increase the order size and decrease the number of orders.
16. Carrying costs = (2,100/2)($6) = $6,300Restocking costs = 12($250) = $3,000EOQ = [2(12)(2,100)($250)/$6]1/2 = 1,449.14Number of orders per year = 12(2,100)/1,449 = 17.39 timesThe firm’s policy is not optimal, since the costs are not equal. The company should increase the order size and decrease the number of orders.
CHAPTER 18INTERNATIONAL ASPECTS OF FINANCIAL MANAGEMENTAnswers to Concepts Review and Critical Thinking Questions
1. a. The dollar is selling at a premium, because it is more expensive in the forward market than in the spot market (SFr 1.53 versus SFr 1.50).
b. The franc is expected to depreciate relative to the dollar, because it will take more francs to buy one dollar in the future than it does today.
c. Inflation in Switzerland is higher than in the United States, as are interest rates.
2. The exchange rate will increase, as it will take progressively more deutsche marks to purchase a dollar as the higher inflation in Russia will devalue the ruble mark. This is the relative PPP relationship.
3. a. The Australian dollar is expected to weaken relative to the dollar, because it will take more A$ in the future to buy one dollar than it does today.
b. The inflation rate in Australia is higher.c. Nominal interest rates in Australia are higher; relative real rates in the two countries are the
same.
4. A Yankee bond is most accurately described by d.
5. Either. For example, if a country’s currency strengthens, imports become cheaper (good), but its exports become more expensive for others to buy (bad). The reverse is true for a currency depreciation.
6. Additional advantages include being closer to the final consumer and thereby saving on transportation, significantly lower wages, and less exposure to exchange rate risk. Disadvantages include political risk and costs of supervising distant operations.
7. One key thing to remember is that dividend payments are made in the home currency. More generally, it may be that the owners of the multinational are primarily domestic who are ultimately concerned about their wealth denominated in their home currency because, unlike a multinational, they are not internationally diversified.
8. a. False. If prices are rising faster in Great Britain, it will take more pounds to buy the same amount of goods that one dollar can buy; the pound will depreciate relative to the dollar.
b. False. The forward market would already reflect the projected deterioration of the euro relative to the dollar. Only if you feel that there might be additional, unanticipated weakening of the euro that isn’t reflected in forward rates today will the forward hedge protect you against additional declines.
c. True. The market would only be correct on average, while you would be correct all the time.
CHAPTER 18 B-123
9. a. American exporters: their situation in general improves because a sale of the exported goods for a fixed number of pesos will be worth more dollars.American importers: their situation in general worsens because the purchase of the imported goods for a fixed number of pesos will cost more in dollars.
b. American exporters: they would generally be better off if the British government’s intentions result in a strengthened pound.American importers: they would generally be worse off if the pound strengthens.
c. American exporters: would generally be much worse off, because an extreme case of fiscal expansion like this one will make American goods prohibitively expensive to buy, or else Brazilian sales, if fixed in cruzeiros, would become worth an unacceptably low number of dollars.American importers: would generally be much better off, because Brazilian goods will become much cheaper to purchase in dollars.
Solutions to Questions and Problems
Basic
1. a. $100(Zloty 4.2190/$1) = 421.90 zlotysb. $0.9945c. € 5M($1.0055/€ 1) = $5,027,500d. Singapore dollare. Mexican pesof. (SFr 1.4816/$1)($0.9945/€1) = SFr 1.47345/€1; this is a cross rate.g. Most valuable: Kuwait Dinar = $3.2637
Least valuable: Turkish Lira = $0.00000163
2. a. £100, since (£100)($1.5489/£1) = $154.89b. £100, since (£100)($1.5489/£1) = $154.89 and (C$ 100)($1/C$ 1.5120) = $66.14c. (C$1.5120/$1)($1.5489/£1) = C$2.3419/£1; 1/2.3419 = £0.426997/FF 1
3. a. F180 = ¥116.750 (per $). The yen is selling at a premium because it is more expensive in the forward market than in the spot market ($0.0084825 versus $0.0085653).
b. F90 = $0.6596/C$. The dollar is selling at a discount because it is less expensive in the forward market than in the spot market (C$1.5119 versus C$1.5161).
c. The value of the dollar will fall relative to the yen, since it takes more dollars to buy one yen in the future than it does today. The value of the dollar will rise relative to the Canadian dollar, because it will take fewer US dollars to buy Canadian dollar in the future than it does today.
B-124 SOLUTIONS
4. a. The U.S. dollar, since (Can$1)/(Can$1.20/$1) = $0.8333b. (Can$3.10)/(Can$1.20/$1) = $2.58. Among the reasons that absolute PPP doesn’t hold are
tariffs and other barriers to trade, transactions costs, taxes, and differential tastes.c. The U.S. dollar is selling at a premium, because it is more expensive in the forward market
than in the spot market (Can$1.23 versus Can$1.20).d. The Canadian dollar is expected to depreciate in value relative to the dollar, because it takes
more Canadian dollars to buy one U.S. dollar in the future than it does today.e. Interest rates in the United States are probably lower than they are in Canada.
5. a. (¥110/$1)($1.65/£1) = ¥181.5/£1b. The yen is quoted too low relative to the pound. Take out a loan for $1 and buy ¥110. Use the
¥110 to purchase pounds at the cross-rate—110/160 = £0.6875. Use the pounds to buy back dollars and repay the loan—£0.6875(1.65) = $1.1344; arbitrage profit is 13.44¢ per dollar used.
7. US: $30M(1.0030)3 = $30,270,810.81Great Britain: ($30M)(£0.59/$1)(1.0045)3/(£0.61/$1) = $29,409,880.14; invest in U.S.
8. Relative PPP: ruble 31.02 = (ruble 29.15)(1 + {hFC – hUS})3 ; (31.02/29.15)1/3 – 1 = .0209Inflation in Russia is expected to exceed that in the U.S. by 2.09% over this period.
10. a. If IRP holds, then F180 = (DM 1110.25)(1 + {.09 – .06})1/2 = won 1126.78Since given F180 = won 1132.10, an arbitrage exists; the forward premium is too high.Borrow won 1000 today at 9% interest. Agree to a 180-day forward contract at won 1132.10. Convert the loan proceeds into won 1000/won 1110.25 = $0.9007 today. Invest these dollars at 6%, ending up with $0.9547. Convert the dollars back into won as $0.9547(won 1132.10/$1) = won 1080.86. Repay the won 1000 loan, ending with a profit of 1080.86 – 1045 = won 35.86.
b. F180 = (DM 1110.25)(1 + {.09 – .06})1/2 = won 1126.78
11. a. The yen is expected to get stronger, since it will take less yen to buy one dollar in the future than it does today.
b. hUS – hJAP (¥106 – ¥108)/¥108 = – .0185; (1 – .0185)4 – 1 = –.0720The approximate inflation differential between the U.S. and Japan is –7.20% annually.
14. Buy $10,000(£/$1.4097) = £7,093.708 in New York. Sell the £7,098.708 in London for £7,098.708($1.4286/£) = $10,134.07. Your profit is $10,134.07 – 10,000 = $134.07 for each $10,000 transaction.
15. krone17.40/$1.99 = krone8.7437/$
16. Relative PPP: ¥ 122 = (¥126)(1 + {hFC – hUS}); (122/126) – 1 = – .0317Inflation in the U.S. is expected to exceed that in the Japan by 3.17% over this period.