Solvation dynamics in coherent and spontaneous Ramanspectroscopy: application to /-carotene
James Sue and Shaul Mukamel
Department of Chemistry, University of Rochester, Rochester, New York 14627
Received December 8, 1987; accepted February 29, 1988
A stochastic theory of the nonliner susceptibility X(3) is used to analyze coherent and spontaneous Raman spectra of
polyatomic molecules in solution. The theory holds for any solvation time scale and interpolates between thehomogeneous limit, in which the Bloch equations are valid, and the static limit of inhomogeneous line broadening, asthe solvent time scale is increased. Application is made to $3-carotene in alkanes and in CS2. The calculatedspontaneous Raman profiles are found to be in good agreement with experiment, and the coherent Ramanexcitation profiles are predicted. The magnitude of the solvent-solute interaction and the solvation time scale forvarious solvents are obtained from our theoretical analysis. The relative contribution of inhomogeneous linebroadening in isopentane is found to increase as the temperature is raised from 118 to 298 K.
1. INTRODUCTION
Coherent Raman spectroscopy is a four-wave mixing tech-nique that provides a sensitive spectroscopic probe for dy-namic processes of polyatomic molecules in condensedphases. Coherent Raman measurements usually involvetwo applied fields with wave vectors kL and kL' (Fig. 1) anddetection of the signal mode with wave vector ks and fre-quency ws, where'- 4
ks = 2 kL - kL', (la)
wS = 2WL - WL. (lb)
If the frequency of one laser is fixed and the other laser isscanned, the coherent Raman spectra show narrow reso-nances (width <10 cm-') superimposed upon a broad back-ground (width -100 cm-1). This is similar to what is ob-served in ordinary spontaneous Raman spectroscopy, inwhich sharp Raman lines and a broad fluorescence are usual-ly observed.4 -9 However, resonances in spontaneous Ramanspectroscopy occur only between vibrational states of theground electronic state, whereas in coherent Raman spec-troscopy resonances may also occur between vibrationalstates of the excited electronic state.3"10 In this paper weanalyze and compare coherent and spontaneous Raman lineshapes of polyatomic molecules in condensed phases (e.g.,solution, solid matrices, and glasses) by using a stochastictheory of the nonlinear susceptibility X(3)-- 5 In Section 2 webriefly present our model and analyze the coherent anti-Stokes Raman spectroscopy (CARS) line shapes in severallimits of physical interest. Expressions are derived for thenonlinear susceptibility X(3) and for the CARS excitationprofiles that are the coherent analog of spontaneous Ramanexcitation profiles. Coherent experiments offer manyworthwhile advantages, such as good signal discriminationand fluorescence rejection through spatial and spectral fil-tering, and this technique is expected to gain further atten-tion in the future with the development of tunable lasers. InSection 3 we make an application to d-carotene in isopen-
tane, in 1:1 pentane-isopentane, and in CS 2 and calculatethe absorption line shape and spontaneous Raman excita-tion profiles. The calculations are compared with experi-ments, with good agreement, and solvent parameters (themagnitude of the solvent-solute interaction and its correla-tion time) are obtained. We then predict the CARS excita-tion profiles for the same systems. In Section 4 we summa-rize our results.
We consider a nonlinear medium consisting of moleculeswith two electronic states interacting with a classical electro-magnetic field. We assume a model consisting of a systemwith a few relevant optically active vibrational modes and abath comprising the remaining weakly active modes of themolecule and the solvent. Hereafter we use the term solventto include also the weakly active modes and use the wordssolvent and bath interchangeably. We also refer to thesystem as the molecule. We assume that the random forceexerted on the molecules by their environment makes theelectronic energy gap Weg a stochastic function of time (Fig.2). The total Hamiltonian assumes the form3-5 7 8
HT = H+Hint- (2)
Here Hint represents the radiation-matter interaction, andH is the Hamiltonian for the material system in the absenceof the radiation field and is given by
H = Ig)Hg(gl + le) [eg + 5Weg(t) + He] (el, (3)
where Hg(He) is the nuclear Hamiltonian corresponding tothe electronic state Ig) (le )), Weg is the mean electronic energygap (0-0 transition), and &weg(t) is assumed to be a stochasticGaussian-Markov process with zero mean,
Fig. 1. CARS four-wave mixing process. The two incident laserfields kL and kL' interact nonlinearly with the medium and generatethe signal field ks.
Equation (6a) represents a ground-state CARS resonanceand Eq. (6b) represents an excited-state CARS resonance.The general expresion for the nonlinear susceptibility X(
3)
that describes any four-wave mixing experiment (and inparticular CARS) for this model has been, given.3-5 TheCARS signal SCARS generated at ks = 2kL - kL' is defined asthe rate of photon emission into mode S and is
SCARS(kS) = ICARS (s; WL XL L' - (7)/ d>
lb>
0Oeg + 6Meg(t)
L %
IC>a>
Fig. 2. Molecular-level scheme and laser frequencies for CARS.Levels la) and Ic) are part of the ground-state vibrational manifold,whereas levels Ib) and Id) belong to an electronically excited mani-fold. The electronic-dipole operator couples vibronic states belong-ing to different electronic states.
(Oweg(t)Weg(O) ) = A2 exp(-At). (4b)
The angle brackets denote averaging over the stochasticvariables. A is the amplitude of the stochastic modulation,and A-' is its time scale (correlation time). The states la),Ic), etc. (Fig. 2) are the vibrational eigenstates of Hg,
(5a)
whereas the states Ib), Id) are the vibronic eigenstates of He,
The third-order nonlinear susceptibility for the CARS pro-cess within the rotating-wave approximation is given by
XCARS ( WS; WL, WL', L) = ZXca + Xbd 3a,c b,d
where
Xca = A n! 2 n Z /ab/bc~cd~da
n=O bd,
X Jn(2
WL - OL Wba + iLYba)
L A-'L - Wca + (Yca + nA)
X [P(a)Jn(WL - Wda + i'Yda)
+ () P(c)Jn((dc - WL + idc)]
Xdb = A, ! 2n E P(a)Aab~bcscd~dan=O a,c,
Jn(2
WL -J)L c Wdc + iYd)X
WL X WL- Wdb + i(Ydb + nA)
X [Jn( L- da + itda)
+ (-l)nJn(zWba - L + iYba)],
with
Jn(s) =-i J d[1 - exp(-AT)ln exp[isT -(T)],JO,
(8)
(9a)
(9b)
(weg + He)Ij) (,j - iy1)j), = b, d. (5b)
Here ej and yj are the energy and the inverse lifetime, respec-tively, of state lI).
In coherent Raman spectroscopy we look for narrow two-photon resonances in the signal, which occur when L - L'equals an energy difference between two vibrational statesbelonging either to the ground electronic state or to an excit-ed electronic state. For our level scheme (Fig. 2) such reso-nances occur for (SL -0L' = +wca and for L - L' = ±uWdb-
CARS and coherent Stokes Raman spectroscopy refer to thecases in which 0OL > L' and L < OL', respectively. Sincethere are no fundamental differences between the theoreti-cal treatments of the two, we shall focus on the CARS reso-nances located at
n=0,1,2,..., (lOa)
g(r) = - [exp(-Ar) - 1 + AT],AA2
K =_A/A,
(lob)
(lOc)
and
Y yv = ,,/2 + y,/2. (lOd)
Xac(3) is the part of the nonlinear susceptibility that contrib-
utes to the ground-state CARS resonances at WL - 0L' = ca,and XdbO
3 ) is the part that contributes to the excited-stateCARS resonances at L - L = WA. The two pathways inLiouville space that contribute to Xac(3) are shown in Figs.3(a) and 3(b). The two pathways that contribute to Xdb(3)
J. Sue and S. Mukamel
WAI, = flu - C, MY V = a, b, c, d.
Hglj) = fj - i-yj)lj), J = a, c,...,
1464 J. Opt. Soc. Am. B/Vol. 5, No. 7/July 1988
(a)
aa
G
da db dc
cc cd caL tL
O)L
ba
(b)
aa ab
-O)L
db dc
the intensity of a particular Raman line while tuning both WL
and L' and keeping WL - XL' fixed (L - L' = w,', for aground-state CARS excitation profile and WL - L' = wdb foran excited-state CARS excitation profile). A close examina-tion of Eqs. (9a) and (9b) shows that the terms contributingto the vi Raman line consist of a series of progressivelybroader line shapes of widths y,, + nA, n = 0, 1, 2, . . , andcentered at WL- L' = Wp. Our procedure to define theRaman excitation profiles is as follows. We introduce acutoff n = n* such that for n • n*", y, + nA is much smallerthan a characteristic line broadening in solution, typically afew hundred inverse centimeters. For n • n*, we make theapproximations
1 2
|L L- WCa + i(Yca + nA)
Yca + nA - - wc) (12a)
and
(c) (d)
Fig. 3. Pictorial representation of the four Liouville pathways3 '5
that contribute to CARS within the rotating-wave approximation.Each line represents a radiative interaction with a laser field withthe indicated frequency.
are shown in Figs. 3(c) and 3(d). These diagrams show theorder in time of the radiative interactions with the radiationfields (L and 0L' and whether these interactions are with thebra or with the ket of the density matrix. Each diagramstarts with the aa or cc state in the upper left-hand corner.A radiative interaction acting from the left (bra) is repre-sented by a vertical line, whereas an interaction from theright (ket) is represented by a horizontal line. Each diagramhas three interactions. Each interaction line is labeled bythe proper field (WL or wL'). For a more-detailed discussionof the diagrams see Ref. 3. P(a) is the equilibrium popula-tion of state la), and Jo(s) are stochastic line-shape func-tions that may be efficiently calculated by using continuedfractions.4 7 8 The nature of the broadening depends pri-marily on the parameter K - A/A. As K increases, the broad-ening varies from homogeneous to inhomogeneous. 3 -5 '7-9 Inthe homogeneous limit (K - c) we can eliminate the summa-tion over n in Eqs. (9a) and (9b) and retain only the n = 0terms. g(T) then assumes the form g(r) = (A2/A)T. In thiscase, Eqs. (8)-(10) reduce to the conventional results of x 3)derived by using the Bloch equations' 2 with a dephasingrate of A2/A. It may be more convenient to parameterize ourbroadening model in terms of the full width at half-maxi-mum ro and K rather than A and A. ro is given approximate-ly by7 ,8
2.355 + 1.76Kro/ =
1 + 0.85K + 0.88K2(11)
In a typical CARS experiment the two observables ofinterest are the coherent Raman spectra and the CARSexcitation profiles. A Raman spectrum is obtained by fixing(L and tuning WL'. The resulting spectrum consists of sharplines at the molecular Raman excitation frequencies, super-imposed upon a much broader background. CARS excita-tion profiles, on the other hand, are obtained by measuring
1 2
-L L- Wdb + i('Ydb + nA)
Ydb + nA (WL - -db).
(12b)
These terms will thus contribute to the sharp Raman reso-nances. The remaining terms with n > n* contribute to thebackground and not to the sharp Raman lines. This separa-tion of terms is similar to that made in our earlier treatmentof spontaneous Raman and fluorescence.7 '8 Accordingly, weshall rearrange the CARS signal Eq. (7) by using relations(12) as follows:
SCARS(°L, °L4) Qac('L)M("L - OL - ca)
a,c
+ Z Qdbe (-L)6(L - OL - Wdb)b,d
+ background terms,
where
Qcag((L) = Kca'(WL)l ,
Qdbe(WL) = IKdbe(WL)12,
a= I 2n (y + nA) > /Iabybc/cd!da
X Jn(WL - °bc + iba)[P(a)Jn(WL - °da +
+ (-1)nP(c)Jn(Wda - WL + i)YdC)],
(13)
(14a)
(14b)
'ida)
(14c)
K e =_ __ 1 ( ) P(a)ab~bcycdydaKdbe= 3 fnKL
2n Ydb + nA )/2 +
X Jfl(WL - 10bc + 'Ydd1)Jnl(WL - 'Oda + i~da)
+ ()nJn((da - WL + iyba)]- (14d)
Here Qcg(Qdbe) is the CARS ground- (excited-) state excita-tion profile for the ca(db) Raman line and Kaeg(Kdbe) is itsamplitude. Equation (13) is based on the assumption that
aa
OIL
* da
ca
ba
J. Sue and S. Mukamel
4
Vol. 5, No. 7/July 1988/J. Opt. Soc. Am. B 1465
the ground-state and excited-state Raman transitions arewell resolved. When several Raman transitions have thesame frequency w,, = (as in the case for harmonic mole-cules), the amplitudes for all the transitions that contributeto the resonance at L - AL' = should be summed beforetaking the square. The Raman excitation profile is thengiven instead by
QO((L) = 3,' Kca(L) + 3' Kdb (L) 2
ac b,d
(14e)
B. Homogeneous LimitIn the homogeneous limit the inverse time scale A of thefluctuations of the electronic energy gap is much larger thantheir magnitude A(K >> 1), and we have [Eq. (lOb)]7 8
g(r) = (A2 /A),. (18)
Substitution of Eq. (18) into Eqs. (9) and (10) results in
Xca 3= AabPbcycdPda - 1-W + ifb,d
The prime on the summation sign in Eq. (14e) denotes arestricted sum over the degenerate transitions.
We now analyze the CARS excitation profiles in variouslimits of physical interest. For simplicity, we hereafter as-sume that all the lifetimes of the vibrational states belongingto the same electronic state are identical, i.e., Yb = Yd y and7a _= -y'. The analysis and the limiting cases presentedhere are analogous to our earlier work on spontaneous Ra-man line shapes.7 8
X1
XL - XL - wca + i U'
[(J)L -P(a) + (dc - t)Lt + k (19a)
and
Xdb abIbcIcdydap(a) -a,c
A. Rapid Fluctuation LimitThe rapid fluctuation limit holds when y, y' << A.7 In thiscase the n > 0 terms in Eqs. (9) will be much broader andnegligible compared with the n = 0 terms. Retaining onlythe terms with n = 0, we have for the Raman susceptibilitiesby using Eqs. (9) and relations (12)
(3) JO(2WL - L- Wba + iY)Xca = A ab~bc~cd~da _ _
b,d XL ( WL c ca +
X [P(a)JO(W - da + i) + P(C)JO(odc - -L + i)]
(15a)
and
Xdb = 3 P(a)abbc1cdfda J _(2wL - L' d +/ )a,b (L °L - db + Y
X JO(WL - da + iy) + J(ba - L + y)], (15b)
where
- = + Y'2
X 1 1L (Ada + ir (A)ba - CL + iF
X L+ _ + L ](XL (ACL, - °db + /Y
z0
0-
0C',
Uo
-JLL0
zrr
a_Z:
(16)
The corresponding excitation amplitudes may then be ob-tained by using Eqs. (14) with n* = 0, resulting in
The rapid fluctuation limit usually holds for polyatomicmolecules in solution.7 8
-2000 0 2000
(19b)
4000 6000
WL - Cg (cm 1)
Fig. 4. Absorption aC(wL) [Eq. (32)] (upper panel) and resonanceRaman profiles Qca(WL) [Eq. (33)] of the indicated transitions (threelower panels) of /3-carotene in isopentane at 118 K. The Ramanfrequency is indicated in each panel. The dashed curve in theupper panel and the circles in the three lower panels are the experi-mental data of Ref. 14. The theoretical curves were calculated byusing the structural parameters of Table 2. weg = 20 180 cm-', andthe solvent parameters are (in cm-") solid lines: a = 0, F = 760, A= 362, and A = 108; dotted lines: a = 75, r = 700, A = 413, A = 330.
J. Sue and S. Mukamel
1466 J. Opt. Soc. Am. B/Vol. 5, No. 7/July 1988
u)C',w-J
U_0cc
z
2:
--2000 0 2000 4000
and
Kdbe(WL) = 2i (-) E abcbccddap(a)
,
WL - wbc +ir1 ('CL - 'da + 2 (2b
Equations (19)-(22) are identical to the results of the opticalBloch equations.1 2
X(3) for CARS in isolated molecules can be obtained fromEqs. (19)-(22) by setting f = 0. An interesting cancellationtakes place for the excited-state resonances in the absence ofpure dephasing.10 The CARS excited-state resonance iscontained in the following term in Eq. (19b):
1 + y'Y (23)
6000
WL -Weg (cm')
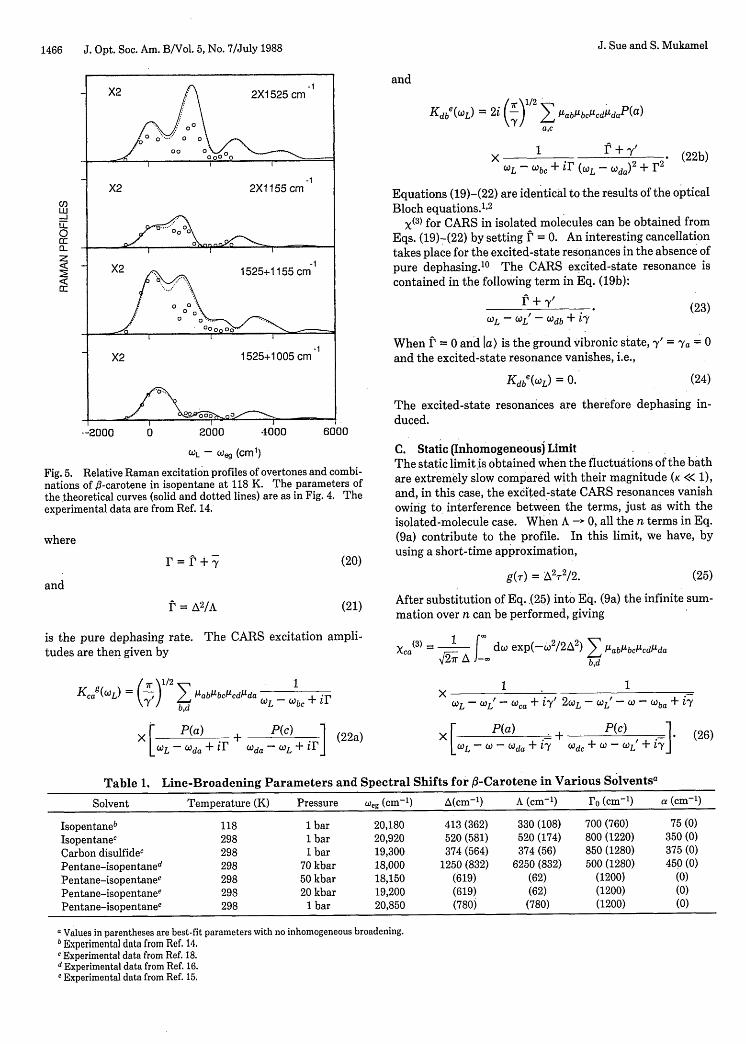
Fig. 5. Relative Raman excitation profiles of overtones and combi-nations of -carotene in isopentane at 118 K. The parameters ofthe theoretical curves (solid and dotted lines) are as in Fig. 4. Theexperimental data are from Ref. 14.
where
r = r +Y a(20)and
= A2/A (21)
is the pure dephasing rate. The CARS excitation ampli-tudes are then given by
L L L- Wdb + (
When t = 0 and Ia) is the ground vibronic state, y' = = 0and the excited-state resonance vanishes, i.e.,
Kdbe(WL) = 0. (24)
The excited-state resonances are therefore dephasing in-duced.
C. Static (Inhomogeneous) LimitThe static limit is obtained when the fluctuations of the bathare extremely slow compared with their magnitude (K << 1),
and, in this case, the excited-state CARS resonances vanishowing to interference between the terms, just as with theisolated-molecule case. When A - 0, all the n terms in Eq.(9a) contribute to the profile. In this limit, we have, byusing a short-time approximation,
g(r) = A;r 2 /2. (25)
After substitution of Eq. (25) into Eq. (9a) the infinite sum-mation over n can be performed, giving
Xca(3) = I dco exp(-W2 /2A2 ) E abIbc1Acd1dab,d
7V v"' 1Kcag(Wd = (, E /bab'bcdcdada a -b +ir
bd + rC b + jP
X P -a:) + C)f PWc + (22a)
x1 1
WL - L- (ca + iy' 2L - ° - G - Wba + '
X P(a) + P 1LWL -W Wda +i'Y Coc+C CL
Table 1. Line-Broadening Parameters and Spectral Shifts for -Carotene in Various Solventsa
Solvent Temperature (K) Pressure Weg (cm-') A(cm'1) A (cm-') ro (cm-') a (cm-')
a Values in parentheses are best-fit parameters with no inhomogeneous broadening.bExperimental data from Ref. 14.c Experimental data from Ref. 18.d Experimental data from Ref. 16.e Experimental data from Ref. 15.
(26)
J. Sue and S. Mukamel
Vol. 5, No. 7/July 1988/J. Opt. Soc. Am. B 1467
Table 2. Ground-State and Excited-StateFrequencies and the Dimensionless Displacements
Used in the Three-Mode Model Calculation of#-Carotene
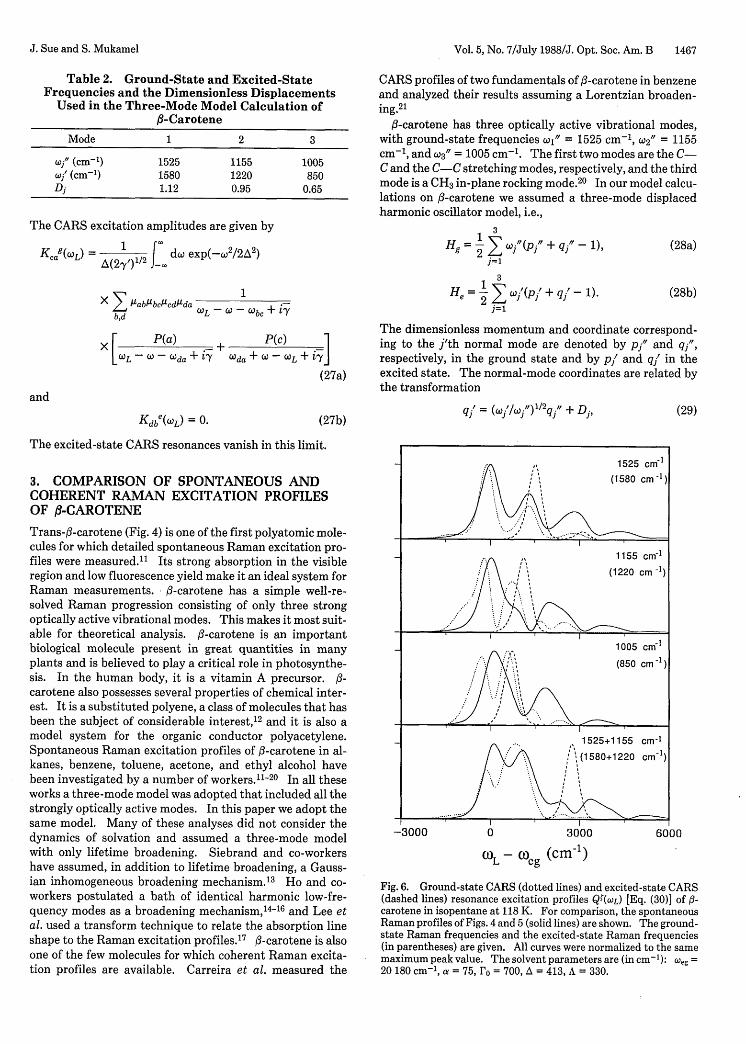
CARS profiles of two fundamentals of 3-carotene in benzeneand analyzed their results assuming a Lorentzian broaden-ing.2'
A-carotene has three optically active vibrational modes,with ground-state frequencies xl' = 1525 cm'1, C02" = 1155cm-l, and '3" = 1005 cm-'. The first two modes are the C-C and the C-C stretching modes, respectively, and the thirdmode is a CH3 in-plane rocking mode.20 In our model calcu-lations on -carotene we assumed a three-mode displacedharmonic oscillator model, i.e.,
3Hg + q-p ' -1),
1 3He = -~ ~~ wj(pj' + q1' - 1).
1=i
The dimensionless momentum and coordinate correspond-ing to the j'th normal mode are denoted by pi" and qj",respectively, in the ground state and by pj' and q in the
7a) excited state. The normal-mode coordinates are related bythe transformation
(27b)
The excited-state CARS resonances vanish in this limit.
3. COMPARISON OF SPONTANEOUS ANDCOHERENT RAMAN EXCITATION PROFILESOF -CAROTENE
Trans-0-carotene (Fig. 4) is one of the first polyatomic mole-cules for which detailed spontaneous Raman excitation pro-files were measured." Its strong absorption in the visibleregion and low fluorescence yield make it an ideal system forRaman measurements. /3-carotene has a simple well-re-solved Raman progression consisting of only three strongoptically active vibrational modes. This makes it most suit-able for theoretical analysis. /3-carotene is an importantbiological molecule present in great quantities in manyplants and is believed to play a critical role in photosynthe-sis. In the human body, it is a vitamin A precursor. /-carotene also possesses several properties of chemical inter-est. It is a substituted polyene, a class of molecules that hasbeen the subject of considerable interest,'2 and it is also amodel system for the organic conductor polyacetylene.Spontaneous Raman excitation profiles of /-carotene in al-kanes, benzene, toluene, acetone, and ethyl alcohol havebeen investigated by a number of workers."1- 2 0 In all theseworks a three-mode model was adopted that included all thestrongly optically active modes. In this paper we adopt thesame model. Many of these analyses did not consider thedynamics of solvation and assumed a three-mode modelwith only lifetime broadening. Siebrand and co-workershave assumed, in addition to lifetime broadening, a Gauss-ian inhomogeneous broadening mechanism." Ho and co-workers postulated a bath of identical harmonic low-fre-quency modes as a broadening mechanism,' 4 -'6 and Lee etal. used a transform technique to relate the absorption lineshape to the Raman excitation profiles.' 7 /-carotene is alsoone of the few molecules for which coherent Raman excita-tion profiles are available. Carreira et al. measured the
qj = (w1'/cj ")1/ 2q/` + Dp
( 0 L- 0 eg (cm')
Fig. 6. Ground-state CARS (dotted lines) and excited-state CARS(dashed lines) resonance excitation profiles Q(WL) [Eq. (30)] of f-carotene in isopentane at 118 K. For comparison, the spontaneousRaman profiles of Figs. 4 and 5 (solid lines) are shown. The ground-state Raman frequencies and the excited-state Raman frequencies(in parentheses) are given. All curves were normalized to the samemaximum peak value. The solvent parameters are (in cm- 1): eg =20 180 cm-', a = 75, ro = 700, A = 413, A = 330.
(28a)
(28b)
(29)
J. Sue and S. Mukamel
1468 J. Opt. Soc. Am. B/Vol. 5, No. 7/July 1988
z0
0
1525 cm1
0
LL 1155 cm
<i 0-
0~~~~~~
-2000 0 2000 4000 6000
CWL - Wg (cm1)
Fig. 7. Absorption U(WL) (upper panel) and relative resonance Ra-man profiles Qa(WL) of the indicated transitions (three lower pan-els) of d-carotene in isopentane at 298 K. The dashed curve in theupper panel and the circles in the three lower panels are the experi-mental data of Ref. 14. eg = 20 920 cm-1, and the solvent parame-ters are (in cm-') solid lines: a = 0, ro = 1220, A = 581, A = 174;dotted lines: a = 350, F0 = 800, A = 520, A = 520.
where Dj is the dimensionless displacement between theequilibrium positions of the potential surfaces of mode j. Insolution, the time scale of the fluctuations of the energy gapdue to solvent-solute collisions is typically fast comparedwith molecule lifetimes (the rapid fluctuation limit), but, inaddition, there may also be an inhomogeneous variation inthe energy gap with energy distribution S(w) because of slowmolecular processes (e.g., conformational broadening). Wefurther note that in harmonic molecules the levels are equal-ly spaced, and there may be several pairs of a, c (or b, d)levels with the same Raman frequency. In this case, theRaman amplitudes have to be summed over all the possibletransitions with the same Raman frequency [Eq. (14e)].The CARS excitation profiles are thus given by
Qr(°L) = f dc S(w) [1 Kcag(COL - O)
axc
+ bd(WL - C)] (30)b,d
where the Raman amplitudes K0cg and Kbd e are given by Eqs.(17). The corresponding spontaneous Raman excitationprofiles Qca(-) and the absorption line shape a(w) for this
model are given by7' 8
Qca(WL) = 2rP(a) f dwS(w)KCa(WL - O)12 (31)
and
a(coL) = -2wL Im J dwS(w) 3 P(a)Kaa(. W)> (32)
where
(33)Kca(WL) = 3 Icb$baJO(WL - Wba + Vy).b
Note that the averaging over the static distribution S(w) is atthe amplitude level in the case of CARS and at the intensity(amplitude square) level for spontaneous Raman spectros-copy. In general, S(w) may take any form, but it is oftentaken to be Gaussian, i.e.,
S(M) = (27raY)-112 exp (-W2 /2a 2). (34)
This may be rationalized by using the central-limit theoremsince the broadening usually results from many small contri-butions. It is possible to recast the excitation-profile ampli-tudes Eqs. (17) and (33) in an eigenstate-free form 4 5 22:
Fig. 8. Absorption a(^L) (upper panel) and relative resonance Ra-man profiles Qca(WL) of the indicated transitions (three lower pan-els) of /3-carotene in CS2 at 298 K. The dashed curve in the upperpanel and the circles in the three lower panels are the experimentaldata in Ref. 18. We estimated the relative intensities from the514.5-nm excitation dispersed emission given in Fig. 2 of Ref. 18.Weg = 19 300 cm-', and the solvent parameters are (in cm-') solidlines: a = 0, ro = 1280, A = 564, A = 56; dotted lines: a = 375, Fo =650, A = 374, and A = 374.
J. Sue and S. Mukamel
Vol. 5, No. 7/July 1988/J. Opt. Soc. Am. B 1469
II I II
-3000 0 3000 6000
CO)L -W)eg (cm')
Fig. 9. Ground-state CARS (dotted lines) and excited-state CARS(dashed lines) resonance excitation profiles Q(WL) of -carotene inCS 2 at 298 K assuming no inhomogeneous broadening. For com-parison, the spontaneous Raman profiles Qa(L) of Fig. 8 (solidlines) are shown. All curves have been normalized to the samemaximum peak value. The ground-state Raman frequencies andthe excited-state Raman frequencies (in parentheses) are given.Solvent parameters used in the calculation are (in cm-') weg =19 300 cm-', a = 0, o = 1280, A = 564, A = 56.
Gdb(w) = -i 10 dr exp[iOT-rg(r)] (dlexp(-iHgr)|b), (36b)
Gdb(M = -i f dr exp[iw-T -g(r)](dlexp[-iHg(iT + 1/kT)]Ib).
(36c)
Simple expressions for Eqs. (36) for general harmonic mole-cules have been derived.5 7 8 22 They eliminate the summa-tions over intermediate states, which is the limiting step inthe calculation of nonlinear susceptibilities in large poly-atomic molecules.
We applied this model to some experimental Raman dataof fl-carotene in various solvents. Our procedure was first tofit the well-resolved low-temperature (118-K) absorptionline shape and the spontaneous Raman profiles of fl-caro-tene in isopentane that were obtained by Ho et al.14 In thecalculations of Eqs. (30)-(36) we utilize a standard fast-Fourier-transform routine on 8192 time points with a stepsize At = 6.4 X 10-'5 sec. The structural parameters (dis-,
placements, excited-state frequencies) thus obtained werethen used to fit other experimental data by changing onlythe solvent-broadening parameters (A, A, a) and the 0-0transition frequency (eg). The results of our 118-K isopen-tane calculations (the absorption and spontaneous Ramanprofile of the three fundamentals and four combinations)are displayed in Figs. 4 and 5. In each figure we show thebest fit obtained without inhomogeneous broadening (a = 0)and with inhomogeneous broadening (a = 75 cm-'). Theresults show that inhomogeneous broadening is relativelyunimportant at this temperature. The solvation parame-ters are given in Table 1. The structural parameters used inthe fit are given in Table 2 and were used in all the followingcalculations. The frequencies of the three optically activemodes all changed appreciably (4-15%) on excitation. Theexcited-state CARS resonances should therefore be distin-guishable from the ground-state resonances. Figure 6 showsthe predicted CARS excitation profiles for the indicatedRaman transitions calculated by using the best-fit parame-ters (a = 75 cm-') of Figs. 4 and 5. The calculations per-formed by using no inhomogeneous broadening (a = 0) arenot significantly different in this case and are not shown.The CARS excitation profiles of fl-carotene in benzene mea-sured by Carreira et al.
21 show similar structure. The limit-
I I I - __ _I -
-3000 0 3000
C0 L-c 0 e2 (cm')
6000
Fig. 10. Ground-state CARS (dotted lines) and excited-stateCARS (dashed lines) resonance excitation profiles QW(WL) of -caro-tene in CS2 at 298 K assuming both homogeneous and inhomogen-eous broadening. For comparison, the spontaneous Raman profilesQca(WL) of Fig. 8 (solid lines) are shown. All curves have beennormalized to the same maximum peak value. The ground-stateRaman frequencies and the excited-state Raman frequencies (inparentheses) are given. Solvent parameters used in the calculationare (in cm-'): eg = 19 300, a = 375, ro = 850, A = 374, and A = 374.
J. Sue and S. Mukamel
1470 J. Opt. Soc. Am. B/Vol. 5, No. 7/July 1988
I - - I --3000 0 3000 6000
comparing the two figures, it is apparent that there is lessvibrational structure in the line shapes when inhomogen-eous broadening is present (Fig. 10). We have also calculat-ed (Fig. 11) the CARS profiles assuming that almost all thebroadening is inhomogeneous (a = 750 cm-'). Figures 12and 13 show some fitted high-pressure data of f-carotene ina 1:1 mixture of pentane-isopentane. Figure 12 shows thecalculated and the experimental absorption line shapes andRaman profiles at 70 kbars. The relative contribution ofinhomogeneous broadening to the total broadening is alsosignificant in this case. Figure 13 shows the absorption lineshapes at four different pressures. The fits are good, whichsuggests that the structural parameters are insensitive to theambient pressure. No inhomogeneous broadening was usedin the calculation in Fig. 13 since absorption line shapes aresensitive only to the total broadening present and not to itsnature. Without supporting Raman data, the solvation pa-rameters (A, A) obtained for the pentane-isopentane mix-tures should be treated with caution.
Our calculations of the 118- and 298-K isopentane spectrashow that both the magnitude A and the inverse time scale Aof the random force exerted by the bath on the three-modesystem increase significantly with temperature. This maybe understood in terms of an increase in the rate and kineticenergy of solvent collisions. It should be emphasized that
z0
0-o
U)co
OL eg (cm-)
Fig. 11. Ground-state CARS (dotted lines) and excited-stateCARS (dashed lines) excitation profiles Q(WL) and spontaneousRaman excitation profiles Qca(WL) (solid lines) of f-carotene in CS 2at 298 K assuming the broadening is almost entirely inhomogen-eous. All curves have been normalized to the same maximum peakvalue. The ground-state Raman frequencies and the excited-stateRaman frequencies (in parentheses) are given. Solvent parametersused in the calculation are (in cm-'): wbg = 19 300, a = 750, ro100, A = 83, A = 83.
ed experimental information does not permit a more quanti-tative analysis in this case. For comparison, we also showthe spontaneous Raman profiles. Note that in each panelthe main peak of the excited-state CARS is shifted to theblue with respect to the 0-0 transition frequency by anamount approximately equal to the Raman frequency. Thiscan be understood as follows: according to Eq. (17b), a peakoccurs when WL is resonant with the da transition, wherelevel a is the ground vibronic state. Since the excited-statevibronic levels b and d are specified by the condition Cdb = XL- WL', level d must be an excited vibronic state, and theresonant peak occurs at AL = Wda and not at XL = eg. Fig-ures 7 and 8 show the absorption line shape and the sponta-neous Raman profiles of the three fundamentals of f-caro-tene at 298 K in isopentane and in CS2, respectively. In eachcase we have calculated the best fit with and without inho-mogeneous broadening. The calculated Raman profileswith inhomogeneous broadening are considerably better.Compared with the 118-K calculation, the room-tempera-ture fits indicate that inhomogeneous broadening plays anincreasingly important role at higher temperatures. Figures9 and 10 show the predicted CARS excitation profiles of 0-carotene in CS2 by using the same parameters of Fig. 8. In
C/
-JU
0CnLz
Or
-2000 0 2000 4000
WL - Wg (cm1)
6000
Fig. 12. High-pressure (70-kbar) absorption a(wL) (upper panel)and relative resonance Raman profiles Qc 0(wL) of the indicatedtransitions (three lower panels) of f-carotene in a 1:1 pentane-isopentane mixture at 298 K. The dashed curve in the upper paneland the circles (two middle panels) are the experimental data of Ref.16, where Weg = 18 000 cm-1 and the solvent parameters are (inCnV'-) solid lines a 0, Fo 0 1280, A 3 832, A 832; dotted lines:a = 450, ro = 500, A = 1250, A = 6250.
1155 cm-1
1525 cm- II . -1)
(1 58 cm
III
.....I I
I
J. Sue and S. Mukamel
Vol. 5, No. 7/July 1988/J. Opt. Soc. Am. B 1471
Z0n
0U,co
-2000 0 2000 4000 6000WL - We, (cm
1)
Fig. 13. Absorption line shapes a(L) of /3-carotene in a 1:1 pen-tane-isopentane. mixture at the four pressures indicated. The ex-perimental curves (dashed lines) are from Ref. 15. The solid linesare the theoretical calculations using the structural parameters ofTable 2, and the solvent parameters are (in cm-') 1 bar: a = 0, Po =1200, A = 780, A = 780, Weg = 20 850; 20 kbars: a = 0, ro = 1200, A =619, A = 62, Weg = 19 200; 50 kbars: a = O, ro = 1200, A = 619, A =62, ueg = 18 150; 70 kbars: a =0, ro = 1280, A = 832, A = 832, oeg =18 000:
the bath in our model includes low-frequency modes as wellas the solvent. Undoubtedly some low-frequency modescontribute to the random force experienced by the system,23but extremely low-frequency modes with periods large com-pared with the lifetime of the excited state will contribute tothe inhomogeneous broadening instead. Thermal excita-tion of the latter modes may explain the increase in theinhomogeneous broadening a from 75 cm-' at 118 K to 350cm-' at 298 K. Schomacker and co-workers2 4 have exam-ined the role of low-frequency modes in the spectra of cyto-chrome c and have found that their effects on the line shapesare negligible. Their model assumed a bath of identical low-frequency harmonic modes in the short-time approximationand temperature-independent inhomogeneous broadening.In this paper the treatment of the bath (low-frequencymodes and the solvent) is more general, and we cannot ruleout a significant contribution from the low-frequency modesto the line shapes. The displacements Dj (Table 2) are ingood agreement with previous results."1-2 ' We found thatthe excited-state frequency was larger than the ground-statefrequency for modes one and two (wl' = 1525, wl'' 1580, w2'= 1155, C02" = 1220 cm-') and smaller for mode three (3' =1005 cm-', W3' = 850 cm-'), whereas in previous analyses theexcited-state and ground-state frequencies were assumed tobe identical. The best-fit parameters for the various sol-
vents are summarized in Table 1. The agreement of theabsorption line shape and Raman excitation profiles is bet-ter, and our theoretical treatment is more complete com-pared with earlier works. Since the effect of pure dephasingis properly incorporated, we did not need to assume ultra-short lifetimes."1 , 8-2' In contrast to previous treatments,our model permits the calculation of the fluorescence inspontaneous light scattering and the calculation of the back-ground signal in coherent Raman spectroscopy. We haveused a similar model to analyze the fluorescence line shapesof tetradesmethyl-f-carotene, resulting in a detailed pictureof its excited-state dynamics. 8
4. CONCLUDING REMARKS
We have analyzed in detail a stochastic theory for coherentRaman line shapes that is valid for an arbitrary time scale ofthe bath. This theory interpolates between the homoge-neous limit, in which the Bloch equations are valid, and thestatic limit of inhomogeneous line broadening. Applicationwas made to the -carotene molecule in several solvents, andthe spontaneous Raman and CARS excitation profiles werecompared. The calculated spontaneous Raman, profileswere found to be in good agreement with experiment, andthe CARS profiles were predicted. Our calculations indi-cate that at room temperature, in addition to homogeneousline broadening, there is also significant inhomogeneousbroadening. Solvent time scales and interaction strengthswere extracted in all cases and are given in Table 1.
ACKNOWLEDGMENT
S. Mukamel is a Camille and Henry Dreyfus Teacher-Schol-ar.
J. Sue is also with the Department of Physics and Astrono-my, University of Rochester.
REFERENCES1. M. D. Levenson, Introduction to Nonlinear Laser Spectrosco-
py (Academic, New York, 1987).2. Y. R. Shen, The Principles of Nonlinear Optics (Wiley, New
York, 1984).3. S. Mukamel and R. F. Loring, J. Opt. Soc. Am. B 3, 595 (1986);
R. F. Loring and S. Mukamel,.J. Chem. Phys. 83,2116 (1985); S.Mukamel, Phys. Rev. A 28, 3480 (1983).
4. Z. Deng and S. Mukamel, J. Chem. Phys. 85, 1738 (1986).5. S. Mukamel, J. Chem. Phys. 82, 5398 (1985); Adv. Chem. Phys.
70, 155 (1988).6. J. Tang and A. C. Albrecht, in Raman Spectroscopy, H. A.
Szymanski, ed. (Plenum, New York, 1970), Vol. 2, p. 33; P. M.Champion and A. C. Albrecht, Annu. Rev. Phys. Chem. 33, 353(1982).
7. J. Sue, Y. J. Yan, and S. Mukamel, J. Chem. Phys. 85, 462(1986).
8. J. Sue and S. Mukamel, J. Chem. Phys. 88, 651 (1986).9. R. Kubo, Adv. Chem. Phys. 15, 101 (1969); A. Kotani and Y.
Toyozawa, J. Phys. Soc. Jpn. 41, 1699 (1976).10. N. Bloembergen, H. Lotem, and R. T. Lynch, Indian J. Pure
Appl. Phys. 16, 151 (1978); J. R. Andrews and R. M. Hoch-strasser, Chem. Phys. Lett. 82, 381 (1981); J. R. Andrews, R. M.Hochstrasser, and H. P. Trommsdorff, Chem. Phys. 62, 87(1981).
11. S. Saito, M. Tasumi, and C. H. Eugster, J. Raman Spectrosc. 14,299 (1983); F. Inagaki, M. Tasumi, and T. Miyazawa, J. Mol.Spectrosc. 50, 286 (1974).
J. Sue and S. Mukamel
I I .- 7-II
1472 J. Opt. Soc. Am. B/Vol. 5, No. 7/July 1988
12. B. S. Hudson, B. E. Kohler, and K. Schulten, in Excited States,E. C. Lim, ed. (Academic, New York, 1984), Vol. 6.
13. W. Siebrand and M. Z. Zgierski, J. Chem. Phys. 71, 3561 (1979);M. Samoc, W. Siebrand, D. F. Williams, E. G. Woolgar, and M.Z. Zgierski, J. Raman Spectrosc. 11, 369 (1981); A. P. Pennerand W. Siebrand, Chem. Phys. Lett. 39, 11 (1976).
14. Z. Z. Ho, T. A. Moore, S. H. Lin, and R. C. Hanson, J. Chem.Phys. 74, 873 (1981).
15. Z. Z. Ho, R. C. Hanson, and S. H. Lin, J. Chem. Phys. 77, 3414(1982).
16. Z. Z. Ho, R. C. Hanson, and S. H. Lin, J. Phys. Chem. 89, 1014(1985).
17. S. A. Lee, C. K. Chan, J. B. Page, and C. T. Walker, J. Chem.Phys. 84, 2497 (1986).
J. Sue and S. Mukamel
18. S. Sufra, G. Dellepiane, G. Masetti, and G. Zerbi, J. RamanSpectrosc. 69, 142 (1972).
19. L. C. Hoskins, J. Chem. Phys. 72, 4487 (1980).20. S. Saito and M. Tasumi, J. Raman Spectrosc. 14, 236, 310
(1983).21. L. A. Carriera, T. C. Maguire, and T. Malloy, Jr., J. Chem.
Phys. 66, 2621 (1977).22. Y. J. Yan and S. Mukamel, J. Chem. Phys. 85, 5908 (1986).23. K. Shan, Y. J. Yan, and S. Mukamel, J. Chem. Phys. 87, 2021
(1987).24. K. T. Schomacker and P. M. Champion, J. Chem. Phys. 84,5314
(1986); K. T. Schomacker, V. Srajer, and P. M. Champion, J.Chem. Phys. 86, 1796 (1987); L. Reinisch, K. T. Schomacker,and P. M. Champion, J. Chem. Phys. 87, 150 (1987).