Page 1
1 BMS Confidential PUBD 13745
Solvent Recovery Strategies for the
Sustainable Design of APIs
Mariano J. Savelski and C. Stewart Slater
Rowan University, Department of Chemical Engineering
USA
The 11th Annual Green Chemistry & Engineering Conference
Chemspec Europe
Green Chemistry & Engineering Workshop
Munich, Germany
June 5, 2013
Page 2
2 BMS Confidential PUBD 13745
Rowan University
• Located in New Jersey
• Formerly Glassboro State
College
(September 4, 1923)
• Summit between
President Lyndon Johnson
& Soviet Premier
Aleksei Kosygin in 1967
Page 3
3 BMS Confidential PUBD 13745
Rowan
Engineering
• Henry Rowan Gift in 1992
of $100 Million
• First Graduating Class in 2000
• Primary focus on undergraduate
education
– Small class sizes
– Student-faculty interaction
– Educational innovation
and novel pedagogy
Page 4
4 BMS Confidential PUBD 13745
Overview
• Introduction to Solvent Use
• Life Cycle Analysis
• Solvent Reduction / Recovery
• Rowan Green Engineering Case Studies
– Bristol-Myers Squibb
– Pfizer
• Selamectin
• Hydrocortisone
• Nelfinavir
– PennAkem
• Software Tool
Page 5
5 BMS Confidential PUBD 13745
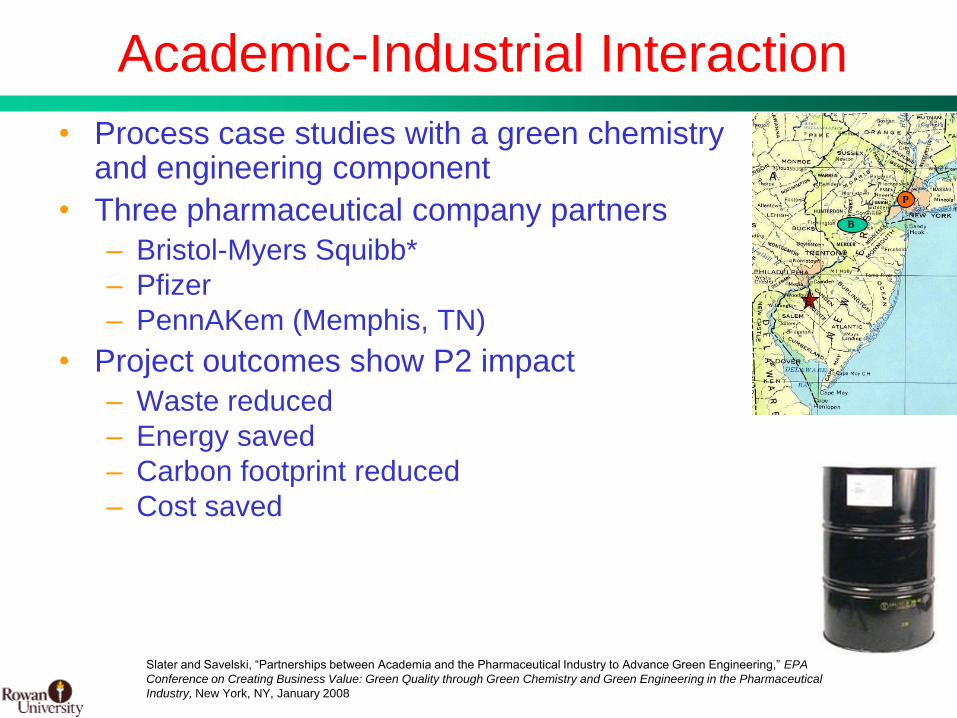
Academic-Industrial Interaction
• Process case studies with a green chemistry and engineering component
• Three pharmaceutical company partners
– Bristol-Myers Squibb*
– Pfizer
– PennAKem (Memphis, TN)
• Project outcomes show P2 impact
– Waste reduced
– Energy saved
– Carbon footprint reduced
– Cost saved
B
R
P
Slater and Savelski, “Partnerships between Academia and the Pharmaceutical Industry to Advance Green Engineering,” EPA
Conference on Creating Business Value: Green Quality through Green Chemistry and Green Engineering in the Pharmaceutical
Industry, New York, NY, January 2008
Page 6
6 BMS Confidential PUBD 13745
Pharmaceutical Industry
• Highly regulated
• Long R&D timeline
• High valued final product (API)
• Batch processes
• Multi-step transformations and isolations
• Solvents used vary in quantity and complexity for each step
• High E-factor
– High solvent use and waste generated per final product
Page 7
7 BMS Confidential PUBD 13745
Typical Drug Synthesis – “Campaigns”
• Multi-step transformations – Intermediate compounds
• Isolations (purification)
ReactionCrystallization/
Recrystallization
Filtration or
Wash StepDIstillation
R-1 API
WasteWaste
I-1 I-1
Crystallization/
Recrystallization
I-5 I-5
S-16 R-5 S-15 S-2 S-1
Filtration
Waste
S-17
I-5
Reaction
I-1 I-5
S = Solvent – vary in number and complexity for each step
R = Reactant – vary in number and complexity for each step
I = Intermediate
API = Active Pharmaceutical Ingredient
Page 8
8 BMS Confidential PUBD 13745
Solvent Issues
• Solvent use can account for up to 80-90% of total mass of an API synthesis
– Majority are organic solvents
• Solvent implications over life cycle
– Purchase cost, energy, waste generated
– Cost to use (energy and associated costs)
– Disposal cost and emissions
• E-Factor 25->100 kg/kg of API
• Not optimal by any standard
Sheldon, Chem . Indus., 1 (1997) 12
Slater and Savelski, J. Environ. Sci. Health, A42 (2007) 1595-1605
Page 9
9 BMS Confidential PUBD 13745
Pharma Industry Profile
• US EPA Toxic
Release Inventory
(TRI) 2010
• 71 MM kg waste
• Top ten solvents
account for 94% of
waste
TRI.NET. Washington (DC): Environmental Protection Agency (US), Office of
Environmental Information. 2010
Methanol
Dichloromethane
Toluene
Acetonitrile
Chloroform
Formic Acid
N,N-Dimethylformiamide
N-methyl-2-pyrrolidone Cyclohexane
Ammonia MTBE
Other Solvents
Page 10
10 BMS Confidential PUBD 13745
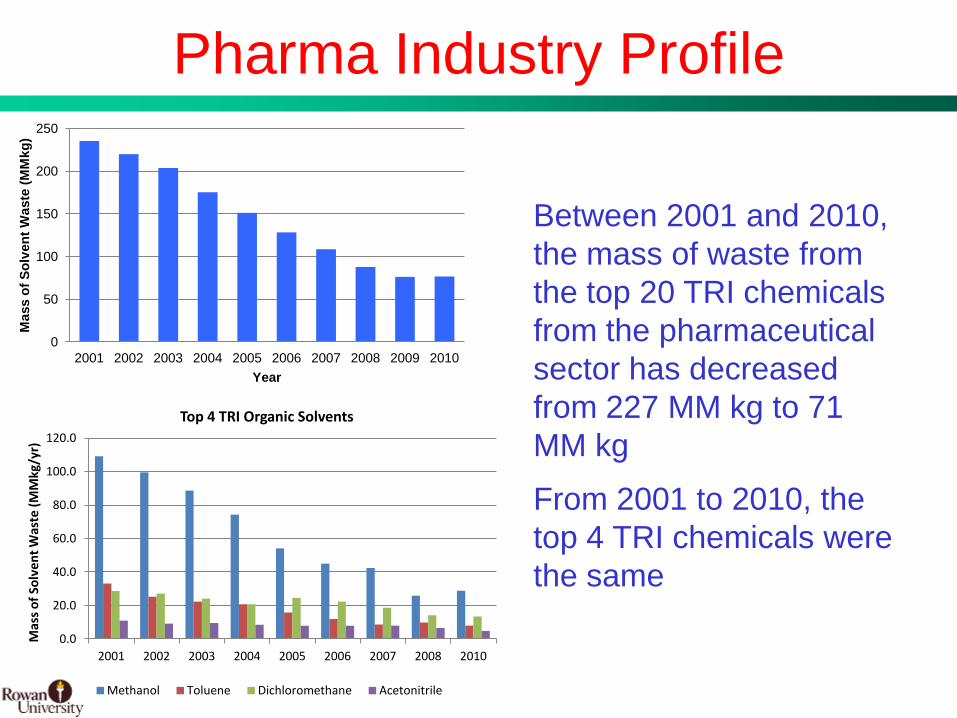
Pharma Industry Profile
Between 2001 and 2010,
the mass of waste from
the top 20 TRI chemicals
from the pharmaceutical
sector has decreased
from 227 MM kg to 71
MM kg
From 2001 to 2010, the
top 4 TRI chemicals were
the same
0
50
100
150
200
250
2001 2002 2003 2004 2005 2006 2007 2008 2009 2010
Mass o
f S
olv
en
t W
aste
(M
Mkg
)
Year
0.0
20.0
40.0
60.0
80.0
100.0
120.0
2001 2002 2003 2004 2005 2006 2007 2008 2010
Mas
s o
f So
lven
t W
aste
(M
Mkg
/yr)
Top 4 TRI Organic Solvents
Methanol Toluene Dichloromethane Acetonitrile
Page 11
11 BMS Confidential PUBD 13745
Life Cycle System Boundaries
Raw Materials
Solvent
Manufacturing
Utilities
API
Manufacture
Waste
Incineration
Emissions
Emissions
Emissions
Emissions
Slater and Savelski, Innov. Pharma. Tech., 29 (2009) 78-83.
CRADLE GRAVE
Page 12
12 BMS Confidential PUBD 13745
Life Cycle Emissions
• Based on values for a single
pharmaceutical production
facility (from average of reported
historic TRI data)
• Life cycle emissions equal
3.4 MM kg/year
– 75% of emissions result from
manufacture and incineration
of solvents
– Solvent use may account for
80-90% of the total mass in an
API synthesis
• High potential for “green”
process improvements
0
0.2
0.4
0.6
0.8
1
1.2
1.4
1.6
Manufacture Incineration In Process Use
Emis
sio
ns
(MM
kg)
36%
39%
25%
Manufacture
Incineration
In Process Use
Emissions = 3.4 MM kg
Jimenez-Gonzalez, Curzons, Constable, and Cunningham, Int J LCA, 9 (2) (2004) 114-121
Page 13
13 BMS Confidential PUBD 13745
Water6%
Air94%
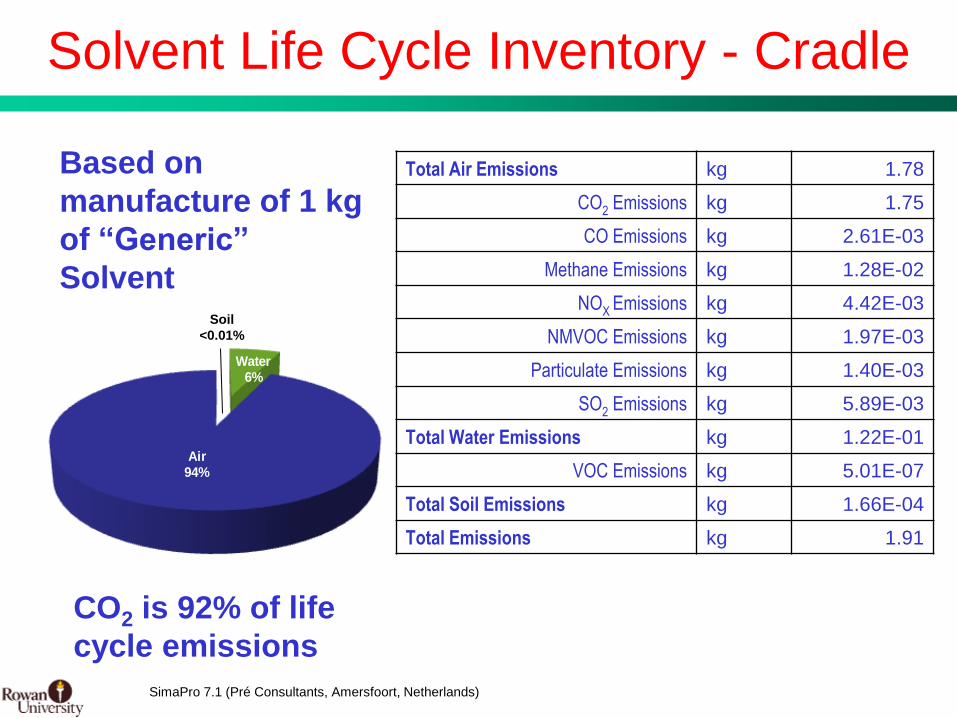
Solvent Life Cycle Inventory - Cradle
Total Air Emissions kg 1.78
CO2 Emissions kg 1.75
CO Emissions kg 2.61E-03
Methane Emissions kg 1.28E-02
NOX Emissions kg 4.42E-03
NMVOC Emissions kg 1.97E-03
Particulate Emissions kg 1.40E-03
SO2 Emissions kg 5.89E-03
Total Water Emissions kg 1.22E-01
VOC Emissions kg 5.01E-07
Total Soil Emissions kg 1.66E-04
Total Emissions kg 1.91
Based on
manufacture of 1 kg
of “Generic”
Solvent Soil
<0.01%
CO2 is 92% of life
cycle emissions
SimaPro 7.1 (Pré Consultants, Amersfoort, Netherlands)
Page 14
14 BMS Confidential PUBD 13745
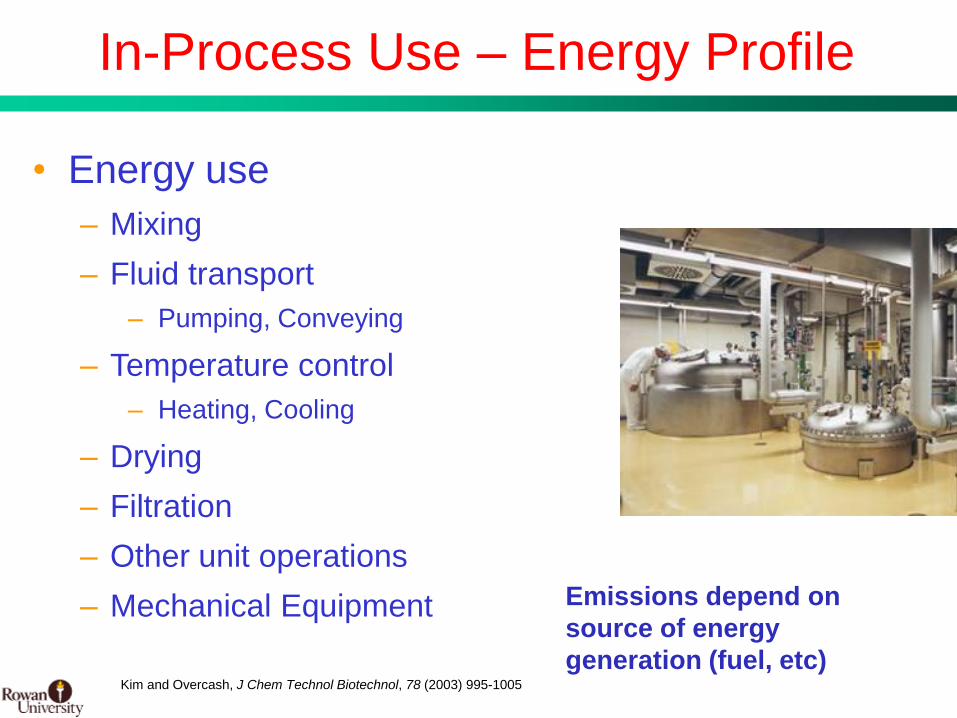
In-Process Use – Energy Profile
• Energy use
– Mixing
– Fluid transport
– Pumping, Conveying
– Temperature control
– Heating, Cooling
– Drying
– Filtration
– Other unit operations
– Mechanical Equipment
Kim and Overcash, J Chem Technol Biotechnol, 78 (2003) 995-1005
Emissions depend on
source of energy
generation (fuel, etc)
Page 15
15 BMS Confidential PUBD 13745
Solvent Life Cycle Inventory - Grave
Total Air Emissions kg 2.24
CO2 Emissions kg 1.49
CO Emissions kg 2.29E-05
Methane Emissions kg 0.00
NOX Emissions kg 2.73E-03
NMVOC Emissions kg 3.13E-06
Particulate Emissions kg 3.81E-05
SO2 Emissions kg 0.00
Total Water Emissions kg 3.44E-04
VOC Emissions kg 0.00
Total Soil Emissions kg 0.00
Total Emissions kg 2.24
Based on
Incineration of 1 kg
of “Generic”
Solvent
Water and Soil
<0.01%
Page 16
16 BMS Confidential PUBD 13745
Optimization of Solvent Use
• Greener solvent selection / solvent
substitution – Reduce solvent’s carbon footprint
– Elimination of highly hazardous solvents
• Solvent reduction – Recovery techniques
– Novel approaches to separations
– Telescoping
– Novel reaction media (ionic liquids)
– Biocatalytic routes
– Solid-state chemistry
Slater, Savelski, Carole, Constable, Chapter 3, in Green Chemistry in the Pharmaceutical
Industry, Dunn, Wells, Williams, Eds., Wiley-VCH Verlag Publishers, (2010) 49-82.
Page 17
17 BMS Confidential PUBD 13745
Green Eng the “Avg” Pharma Facility
• Solvent Recovery Scenario – 80% of solvent waste is recovered and
recycled back into the process
• “Greener” Solvent Scenario – Solvents that release fewer emissions during
manufacture and incineration are employed in the process, replacing the original solvents
• Telescoping Scenario – A process employing multiple steps is
reduced to a process employing 2/3 the number of steps
0
0.2
0.4
0.6
0.8
1
1.2
1.4
1.6
Manufacture Incineration In Process Use
MM
kg
of
Em
issi
on
s
BASE BA SE
GREENGREEN
UNCHANGED
0
0.2
0.4
0.6
0.8
1
1.2
1.4
1.6
Manufacture Incineration In Process Use
MM
kg
of
Em
issi
on
s
BASE
BASE
UNCHANGED
GREENGREEN
0
0.2
0.4
0.6
0.8
1
1.2
1.4
1.6
Manufacture Incineration In Process Use
MM
kg
of
Em
issi
on
s
BASE BASE
GREENGREEN
BASE
GREEN
Solvent Recovery Scenario “Greener” Solvent Scenario
Telescoping Scenario
Page 18
18 BMS Confidential PUBD 13745
Green Eng the “Avg” Pharma Facility
• Total Life Cycle
Emissions: 78%
reduction
– Base Case Scenario:
3.4 MM kg
– Best Scenario: 0.76
MM kg
– Total Reduction:
2.65 MM kg
Best Scenario
0
0.2
0.4
0.6
0.8
1
1.2
1.4
1.6
Manufacture Incineration In Process Use
MM
kg o
f E
mis
sion
s
GREENGREENGREEN
BASE BASE BASE
• Manufacture Emissions: 96% reduction
• Incineration Emissions: 90% reduction
• In Process Use Emissions: 34% reduction
Best case: Implementation of all three green scenarios
Page 19
19 BMS Confidential PUBD 13745
Solvent Waste Management Trends
• ~70% of waste is treated or recycled*
• ~30% of waste is used for energy recovery*
• Only a small percent is directly released into
the environment
• Incineration remains the disposal method of
choice
– CO2 emissions
– Heat recovery
• Increasing trend towards solvent recovery
Lopez, Toxic Release Inventory, US EPA, 2006
Page 20
20 BMS Confidential PUBD 13745
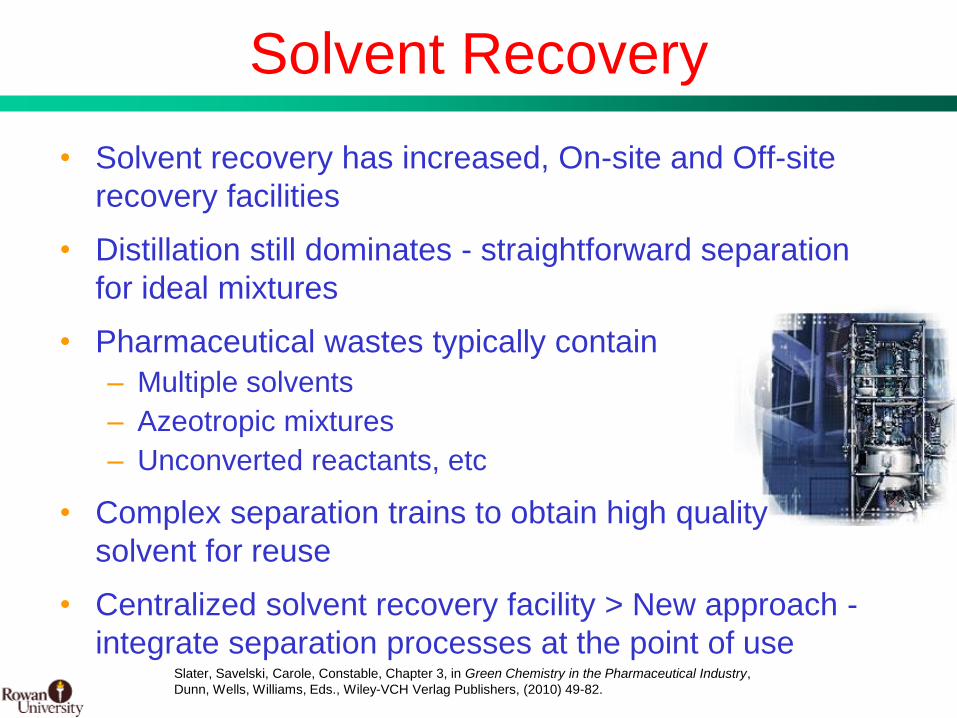
Solvent Recovery
• Solvent recovery has increased, On-site and Off-site
recovery facilities
• Distillation still dominates - straightforward separation
for ideal mixtures
• Pharmaceutical wastes typically contain
– Multiple solvents
– Azeotropic mixtures
– Unconverted reactants, etc
• Complex separation trains to obtain high quality
solvent for reuse
• Centralized solvent recovery facility > New approach -
integrate separation processes at the point of use
Slater, Savelski, Carole, Constable, Chapter 3, in Green Chemistry in the Pharmaceutical Industry,
Dunn, Wells, Williams, Eds., Wiley-VCH Verlag Publishers, (2010) 49-82.
Page 21
21 BMS Confidential PUBD 13745
Solvent Recovery
• Azeotropic separations pose the most
challenge in processing
• Entrainer-based distillation
– More energy intensive
– Entrainers pose additional source of
pollution
• Membrane pervaporation is a “greener”
alternative for azeotropic separations
Wilson Pressure Analysis
0
0.1
0.2
0.3
0.4
0.5
0.6
0.7
0.8
0.9
1
0 0.1 0.2 0.3 0.4 0.5 0.6 0.7 0.8 0.9 1
Mass Fraction IPA in Liquid
Mass F
racti
on
IP
A in
Vap
or
760 torr
150 torr
3 bar
10 bar
25 bar
45 deg
Page 22
22 BMS Confidential PUBD 13745
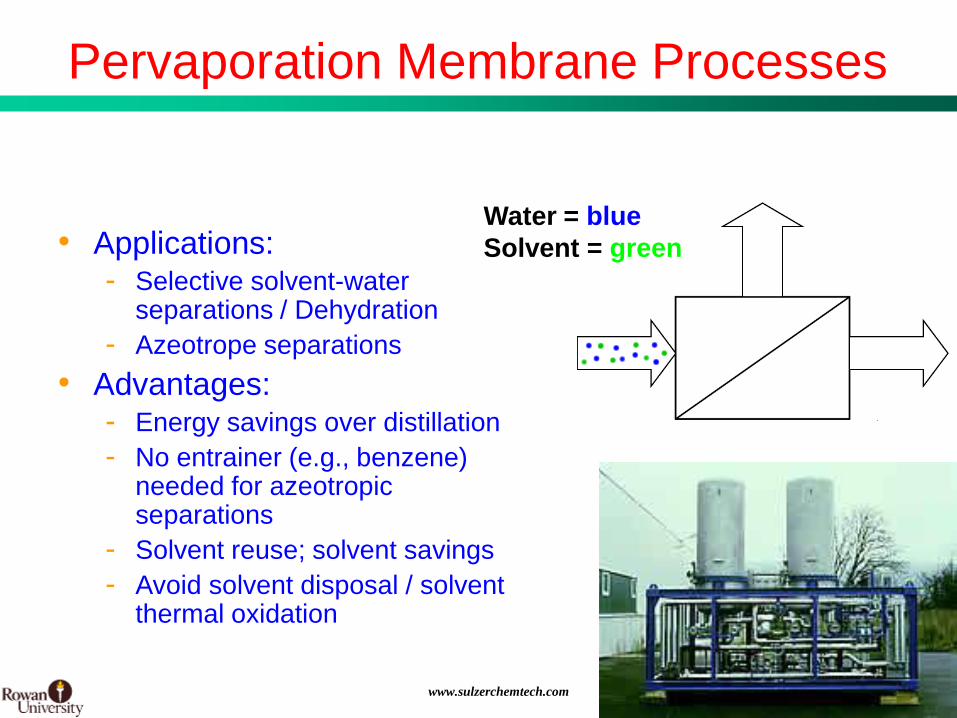
Pervaporation Membrane Processes
Water = blue
Solvent = green
www.sulzerchemtech.com
• Applications: - Selective solvent-water
separations / Dehydration
- Azeotrope separations
• Advantages: - Energy savings over distillation
- No entrainer (e.g., benzene) needed for azeotropic separations
- Solvent reuse; solvent savings
- Avoid solvent disposal / solvent thermal oxidation
Page 23
23 BMS Confidential PUBD 13745
PV Process Integration
Solvent-water
waste stream
Pervaporation
Dehydrated
solvent for reuse
Solvent-water
azeotropic mixture
Low flow rate
stream: water with
some solvent
Typical Solvents
• Isopropanol (az)
• Ethanol (az)
• Methanol
• Ethyl acetate
• Butyl acetate
• Acetone
• Acetronitrile (az)
• Tetrahydrofuran (az)
• n-Butanol
• Methylethylketone (az)
Slater and Savelski, Innov. Pharma. Tech., 29 (2009) 78-83.
Page 24
24 BMS Confidential PUBD 13745
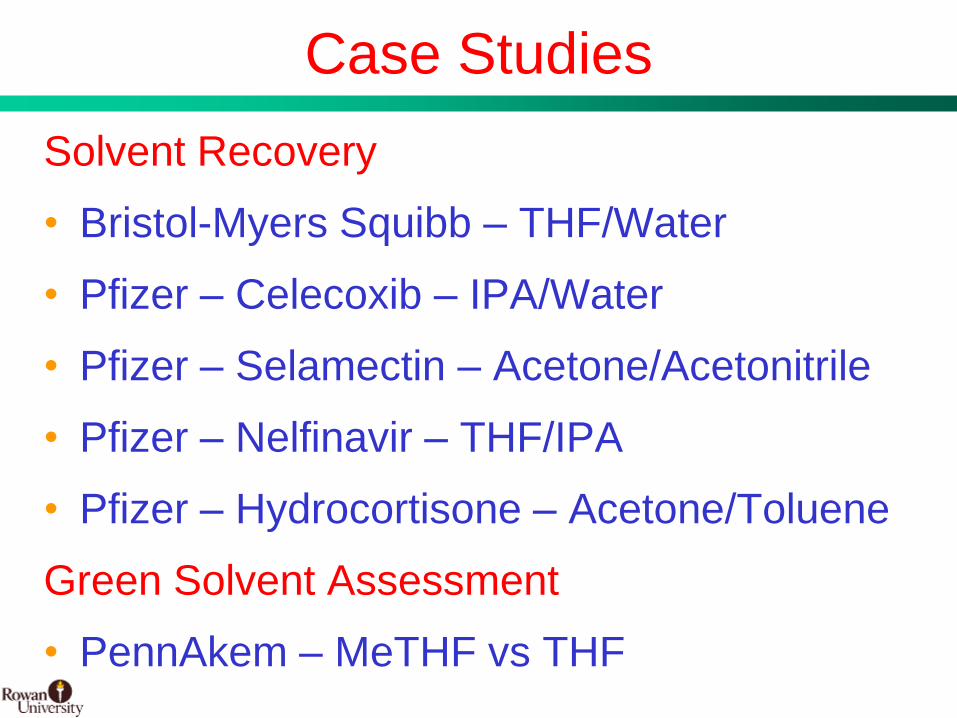
Case Studies
Solvent Recovery
• Bristol-Myers Squibb – THF/Water
• Pfizer – Celecoxib – IPA/Water
• Pfizer – Selamectin – Acetone/Acetonitrile
• Pfizer – Nelfinavir – THF/IPA
• Pfizer – Hydrocortisone – Acetone/Toluene
Green Solvent Assessment
• PennAkem – MeTHF vs THF
Page 25
25 BMS Confidential PUBD 13745
Bristol-Myers Squibb
• Integration of PV technology with a Constant
Volume Distillation (CVD) operation
• One step in synthesis of new oncology drug
• Current process: Decrease water content in
THF solvent phase to 0.5%
– Requires 13.9 kg THF/kg API
7.85 kg THF entrainer/kg API
– Generates 9.2 kg Waste/kg API
• LCI / LCA analysis indicates emissions are
significant based on solvent life cycle
Slater, Savelski, Moroz, Raymond, Green Chem. Lett. Reviews 5 (2012), 55-64
Page 26
26 BMS Confidential PUBD 13745
Bristol-Myers Squibb cont.
Basis: 68 kg API / batch
6.1 kg THF/kg API; 56% reduction
0.65 kg Waste/kg API; 93% reduction
0 kg THF Entrainer/kg API; 100% reduction
Slater, Savelski, Moroz, Raymond, Green Chem. Lett. Reviews 5 (2012), 55-64
CVD PV
Proposed CVD-PV Hybrid Process
Page 27
27 BMS Confidential PUBD 13745
Bristol-Myers Squibb cont.
Slater, Savelski, Moroz, Raymond, Green Chem. Lett. Reviews 5 (2012), 55-64
Page 28
28 BMS Confidential PUBD 13745
1615
19
267
3697
0
500
1000
1500
2000
2500
3000
3500
4000
THF Waste Disposal
Co
st (
$)
With Pervaporation Current
Bristol-Myers Squibb cont.
• Reductions in THF
used and waste
produced
• Environmental
savings
• Cost savings
• But this is only one
part of story
414
44
626
948
0
100
200
300
400
500
600
700
800
900
1000
THF Purchased Wastekilo
gra
ms
With Pervaporation Current
Slater, Savelski, Moroz, Raymond, Green Chem. Lett. Reviews 5 (2012), 55-64
.
Page 29
29 BMS Confidential PUBD 13745
Life Cycle Inventory Comparison
Total CVD Life Cycle Emissions:
4,390 kg, 64.6 kg waste/kg API
Total CVD-PV Life Cycle Emissions:
272 kg, 4.0 kg waste/kg API
Slater, Savelski, Moroz, Raymond, Green Chem. Lett. Reviews 5 (2012), 55-64
Waste = 5.5%
THF = 68.5%
Steam 26%
Total Emissions Due to Waste Treatment
Total Emissions Due to THF
Total Emissions Due to Steam
Waste < 1%
Electricity = 9.2%
Steam = 82%
THF = 8.3%
Total Emissions Due to Waste Treatment
Total Emissions Due to THF
Total Emissions Due to Electricity
Total Emissions Due to Steam
Page 30
30 BMS Confidential PUBD 13745
Pfizer – Celecoxib
• Investigate solvent recovery
alternatives to minimize waste from
the Celecoxib manufacturing
process
• Compare current process route
with green engineering options
– Recovery of isopropanol from water, other alcohols and dissolved solids
– Multiple waste streams with varying compositions
– Azeotropic mixtures add complexity
Wilson Pressure Analysis
0
0.1
0.2
0.3
0.4
0.5
0.6
0.7
0.8
0.9
1
0 0.1 0.2 0.3 0.4 0.5 0.6 0.7 0.8 0.9 1
Mass Fraction IPA in Liquid
Mas
s F
racti
on
IP
A i
n V
ap
or
760 torr
150 torr
3 bar
10 bar
25 bar
45 deg
Page 31
31 BMS Confidential PUBD 13745
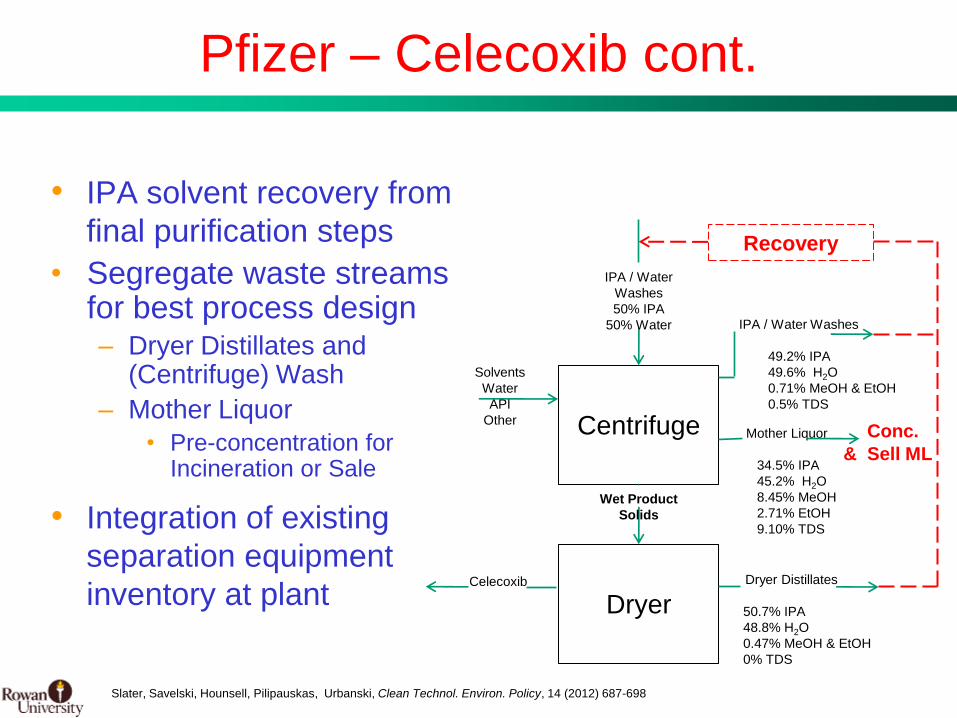
Pfizer – Celecoxib cont.
• IPA solvent recovery from
final purification steps
• Segregate waste streams for best process design – Dryer Distillates and
(Centrifuge) Wash
– Mother Liquor
• Pre-concentration for Incineration or Sale
• Integration of existing
separation equipment
inventory at plant
Slater, Savelski, Hounsell, Pilipauskas, Urbanski, Clean Technol. Environ. Policy, 14 (2012) 687-698
Centrifuge
IPA / Water
Washes
50% IPA
50% Water IPA / Water Washes
49.2% IPA
49.6% H2O
0.71% MeOH & EtOH
0.5% TDS
Mother Liquor
34.5% IPA
45.2% H2O
8.45% MeOH
2.71% EtOH
9.10% TDS
Dryer
Wet Product
Solids
Dryer Distillates
50.7% IPA
48.8% H2O
0.47% MeOH & EtOH
0% TDS
Celecoxib
Conc.
& Sell ML
Recovery
Solvents
Water
API
Other
Page 32
32 BMS Confidential PUBD 13745
Pfizer – Celecoxib cont.
• Base case
• Various design alternatives simulated with ASPEN
– Distillation (Distill)-Pervaporation (PV) and Distill-PV-Distill
– Distill-Molecular Sieve Adsorption
• Sale of Mother Liquor or incineration options
• Detailed analysis shown for
– Distill–PV–Distill with Mother Liquor (ML) Sold
Slater, Savelski, Hounsell, Pilipauskas, Urbanski, Clean Technol. Environ. Policy, 14 (2012) 687-698
Page 33
33 BMS Confidential PUBD 13745
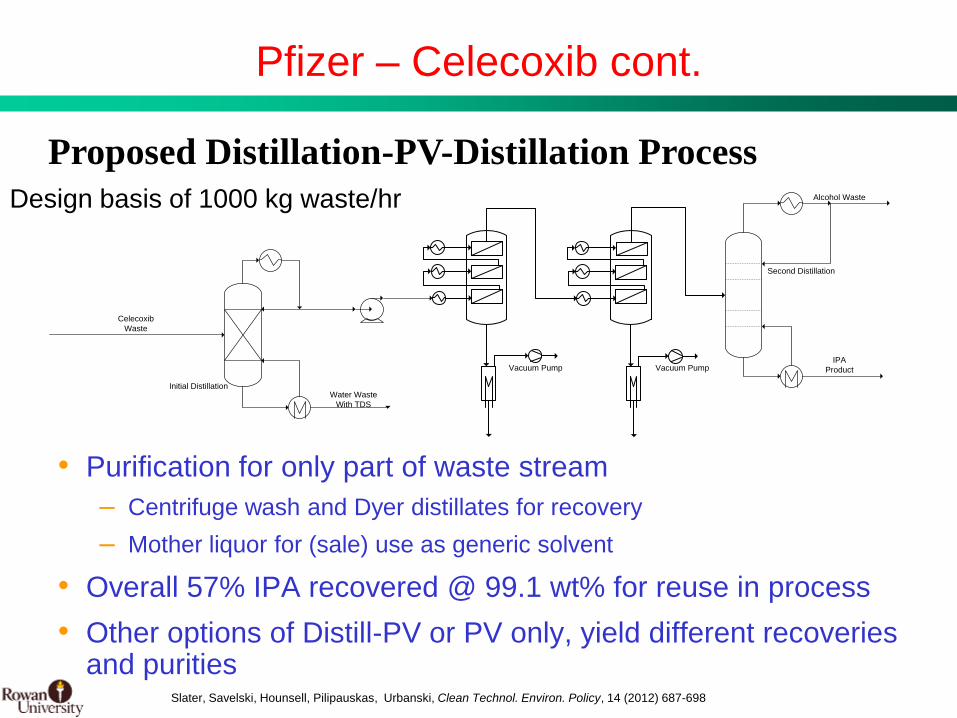
Pfizer – Celecoxib cont.
• Purification for only part of waste stream
– Centrifuge wash and Dyer distillates for recovery
– Mother liquor for (sale) use as generic solvent
• Overall 57% IPA recovered @ 99.1 wt% for reuse in process
• Other options of Distill-PV or PV only, yield different recoveries and purities
Water Waste
With TDS
Celecoxib
Waste
IPA
Product
Initial Distillation
Alcohol Waste
Second Distillation
Vacuum Pump Vacuum Pump
Design basis of 1000 kg waste/hr
Slater, Savelski, Hounsell, Pilipauskas, Urbanski, Clean Technol. Environ. Policy, 14 (2012) 687-698
Proposed Distillation-PV-Distillation Process
Page 34
34 BMS Confidential PUBD 13745
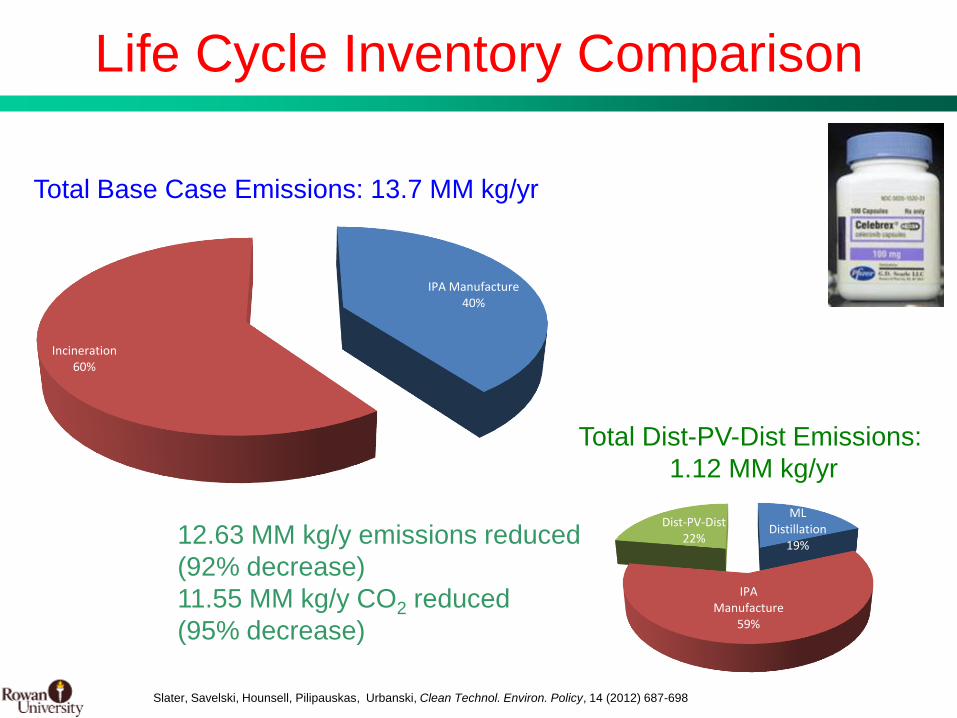
Life Cycle Inventory Comparison
IPA Manufacture 40%
Incineration 60%
ML Distillation
19%
IPA Manufacture
59%
Dist-PV-Dist 22%
Total Base Case Emissions: 13.7 MM kg/yr
Total Dist-PV-Dist Emissions:
1.12 MM kg/yr
Slater, Savelski, Hounsell, Pilipauskas, Urbanski, Clean Technol. Environ. Policy, 14 (2012) 687-698
12.63 MM kg/y emissions reduced
(92% decrease)
11.55 MM kg/y CO2 reduced
(95% decrease)
Page 35
35 BMS Confidential PUBD 13745
Economic Analysis
-1,000,000
0
1,000,000
2,000,000
3,000,000
4,000,000
5,000,000
6,000,000
Base Case Distil-PV-Distil-Sell ML
Design Case
An
nu
al
Co
st
ML Concentrate sale
Membrane Modules
Operating Labor
Maintenance
Cooling Water
Electricity
Steam
Waste Disposal
Fresh IPA
72% Annual Cost
Savings
Slater, Savelski, Hounsell, Pilipauskas, Urbanski, Clean Technol. Environ. Policy, 14 (2012) 687-698
$3.82 MM/yr operating cost saving
Page 36
36 BMS Confidential PUBD 13745
Case Study - Pfizer’s LVWS
Case Selamectin Nelfinavir Hydrocortisone
Waste Composition
Acetone-
Acetonitrile
(28-72 wt.%)
THF-IPA
(14-86 wt.%)
Acetone-Toluene
(9-91 wt.%)
Waste Mass (kg/yr) 84,500 78,700 257,600
Desired Recovery Acetonitrile at
99 wt.% IPA at 98 wt.%
Toluene at
99 wt.%
Life Cycle Carbon
Footprint Savings
(MMkg CO2eq./yr)
235.8 220.2 1,161
Cumulative Energy
Savings (TJ/yr) 3.9 3.5 16.3
Cost Savings (k$/yr) 215.5 98.7 271.1
Recovery Method: Simple Distillation
Page 37
37 BMS Confidential PUBD 13745
Pfizer’s LVWS
0
2,00,000
4,00,000
6,00,000
8,00,000
10,00,000
12,00,000
14,00,000
Base Case Recovery Case Base Case Recovery Case Base Case Recovery Case
Selamectin Nelfinavir Hydrocortisone
To
tal L
ife
Cyc
le E
mis
sio
ns
(k
g/y
r)
Utilities
Incineration
Raw Materials
Page 38
38 BMS Confidential PUBD 13745
PennAKem Case – Green Solvent
Solvent Chemical
THF ecoTHFTM ecoMeTHFTM
Total Raw Materials Used, kg 4.01E+00 5.33E+02 1.21E+02
Total CED, MJ-Eq 1.32E+02 6.15E+00 -2.00E+01
Total Air Emissions, kg 5.52E+00 1.45E+00 1.62E-01
CO2, kg 5.46E+00 1.39E+00 1.50E-01
Total Water Emissions, kg 1.26E-01 3.41E-02 2.73E-02
Total Soil Emissions, kg 2.31E-03 2.08E-03 1.94E-03
Total Emissions, kg 5.65E+00 1.49E+00 1.91E-01
Production Routes
• Chemical THF: 1,4 butanediol => THF
• ecoTHFTM : Corn Cobs Waste => Furfural => Furan => THF
• ecoMeTHFTM : Corn Cobs Waste => Furfural => Methyl Furan => 2-MeTHF
ecoMeTHFTM is 30 times more environmentally friendly than chemical THF
ecoMeTHFTM as a green solvent – Manufacture LCA
Page 39
39 BMS Confidential PUBD 13745
Pennakem Case – Green Solvent
0.00E+00
2.00E-01
4.00E-01
6.00E-01
8.00E-01
1.00E+00
1.20E+00
1.40E+00
ecoTHF (Extractive Distillation) ecoTHF (Dist+PV) ecoMeTHF
kg
to
tal
life
cyc
le e
mis
sio
ns
/ k
g
so
lve
nt
Recovery
Raw Materials and Incineration
ecoMeTHFTM as a green solvent – Recovery from water
• 2-MeTHF is more easily recovered than THF due to
heterogeneous system
• Pervaporation shows an environmental advantage over
extractive distillation (in THF recovery)
Page 40
40 BMS Confidential PUBD 13745
Case Studies Conclusions
• Solvent recovery / reduction systems can be designed to
target the most common and/or environmentally unfriendly
solvents
• Solvent manufacture and incineration play a significant
role in the life cycle emissions of an API
• These emissions can be reduced by implementing a
solvent recovery / reduction system
• The environmental potential of implementing the solvent
recovery system is significantly increased by examining all
possible applications
• By looking at the entire life cycle these emission
reductions become apparent
Page 41
41 BMS Confidential PUBD 13745
R.SWEED Software tool
• Modular software to be implemented in industry
– Combine design software (ASPEN®) and LCA software
(SimaPro®)
– User friendly interface (Excel®)
• Aid design of solvent recovery systems
– Determines recovery process based on thermodynamics
• Predict resulting emissions reductions
• Predict economic benefits
• Environmental and economic optimization
Page 42
42 BMS Confidential PUBD 13745
R.SWEED Software tool
ASPEN Plus®
ASW/Excel
Simple Distillation
Page 43
43 BMS Confidential PUBD 13745
R.SWEED Software tool
y = 2,13,154x5 - 9,70,290x4 + 17,64,345x3 - 16,01,961x2 + 7,26,280x - 1,31,529 R² = 1
0
0.2
0.4
0.6
0.8
1
1.2
1.4
1.6
1.8
0.8 0.825 0.85 0.875 0.9 0.925 0.95 0.975 1
Wa
ter
Flu
x (
kg
/m2h
)
XIPA
Pervaporation Modeling – Transport through membrane
Data Fitting – Pervaporation membrane Sulzer’s PERVAP 2201
T = 90 °C
Page 44
44 BMS Confidential PUBD 13745
R.SWEED Software tool
A1 A2 A3 A4 A5
P1 P2 P3 P4 P5
F,T1R1,T2 R2,T3 R3,T4 R4,T5 R5,T6
Pervaporation Modeling – Unit Design
Mass Balance
Energy Balance
Page 45
45 BMS Confidential PUBD 13745
R.SWEED Software tool
Pervaporation Modeling – Tool Screenshot
Page 46
46 BMS Confidential PUBD 13745
R.SWEED Software tool
Maximum Life Cycle Emissions Avoided RR = 9
LC E
mis
sio
ns
Avo
ide
d (
kg/h
r) &
Op
erat
ing
Co
st S
avin
gs (
$/h
r)
Process Optimization – Optimum Reflux Ratio
Page 47
47 BMS Confidential PUBD 13745
0.0
0.1
0.2
0.3
0.4
0.5
0.6
0.7
0.8
0.9
1.0
0
20
40
60
80
100
120
2 3 4 5 6 7 8
LC
Em
iss
ion
s A
vo
ide
d (
kg
/hr)
& O
pera
tin
g C
ost
Sa
vin
gs
(U
SD
/yr)
Feed Stage
Operating Cost Savings
LCA Avoided Emissions
Recovery
Re
cove
ry
R.SWEED Software tool
Process Optimization – Optimum Feed Stage
Maximum Life Cycle Emissions Avoided and Cost Savings Feed Stage = 4
Page 48
48 BMS Confidential PUBD 13745
“Plant of the Future”
• Green concepts integrated in drug
development → more sustainable
manufacturing platform
• Limited number of ‘universal’ green solvents
utilized
– Properties allow for easy recovery
– Used with other campaigns
• Integrated solvent recovery systems
• Continuous processing simplifies recovery
design strategies
• Energy exchange networks
Slater and Savelski, Innov Pharma Tech, 29 (2009) 78
Page 49
49 BMS Confidential PUBD 13745
Acknowledgements
Bristol-Myers Squibb
San Kiang, Thomas LaPorte, Lori Spangler, Stephan Taylor
Pfizer
Peter Dunn, Greg Hounsell, Daniel Pilipauskas, Frank Urbanski
PennAKem
Steve Prescott, Dave Aycock, Bogdan Comanita, Jeff Shifflette
U.S. EPA Region 2
Grants NP97257006-0 and NP97212311-0 Rowan University
Students
UPDATE Scott Barnes, William Carole,
Anthony Furiato, Kyle Lynch, Colleen McGinness, Timothy Moroz, Michael Raymond, David Walsh
Page 50
50 BMS Confidential PUBD 13745
Further Reading
Page 51
51 BMS Confidential PUBD 13745
How the Tool Works Solvent Recovery Processes
Mixture
Classifier
Solvents in
Waste
Solvent Recovery
Process Selection
Page 52
52 BMS Confidential PUBD 13745
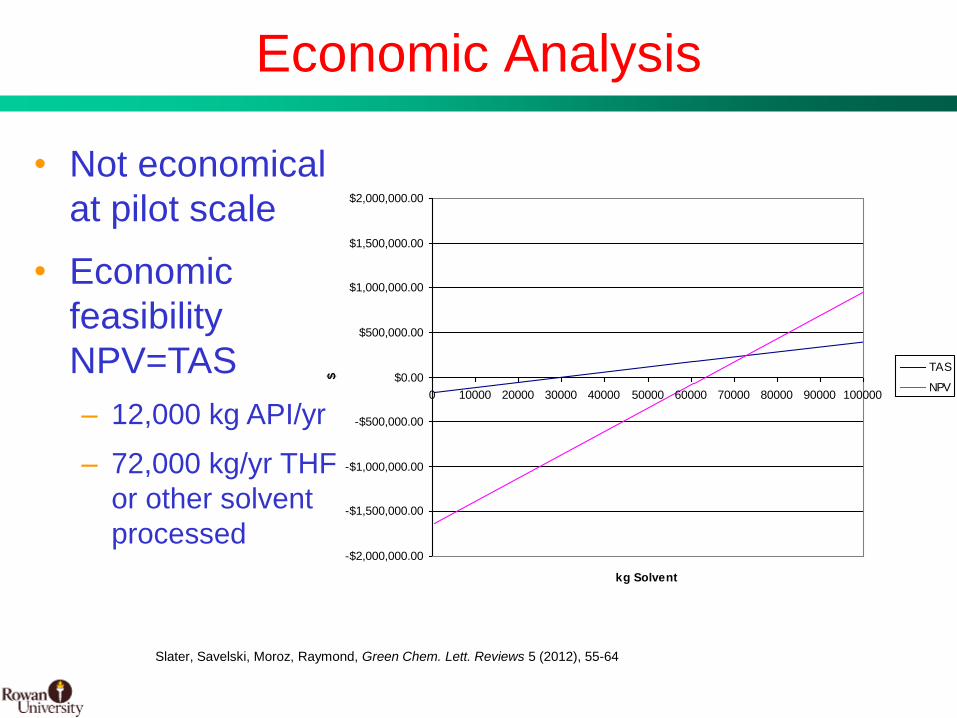
Economic Analysis
-$2,000,000.00
-$1,500,000.00
-$1,000,000.00
-$500,000.00
$0.00
$500,000.00
$1,000,000.00
$1,500,000.00
$2,000,000.00
0 10000 20000 30000 40000 50000 60000 70000 80000 90000 100000
kg Solvent
$
TAS
NPV
• Not economical
at pilot scale
• Economic
feasibility
NPV=TAS
– 12,000 kg API/yr
– 72,000 kg/yr THF
or other solvent
processed
Slater, Savelski, Moroz, Raymond, Green Chem. Lett. Reviews 5 (2012), 55-64
Page 53
THF
Water THF
Trace water
1,2-
Propanediol
WASTE
Extractive
Distillation
Pervaporation
THF
Water
THF
Trace Water
Water
THF
No
Recovery
THF
Water
THF
Water
WASTE RECOVER
Y
RECOVER
Y
RECOVER
Y
Green Integration Illustrative Example Process optimization
Emissions reduction
Cost savings
Energy savings